


方案详情
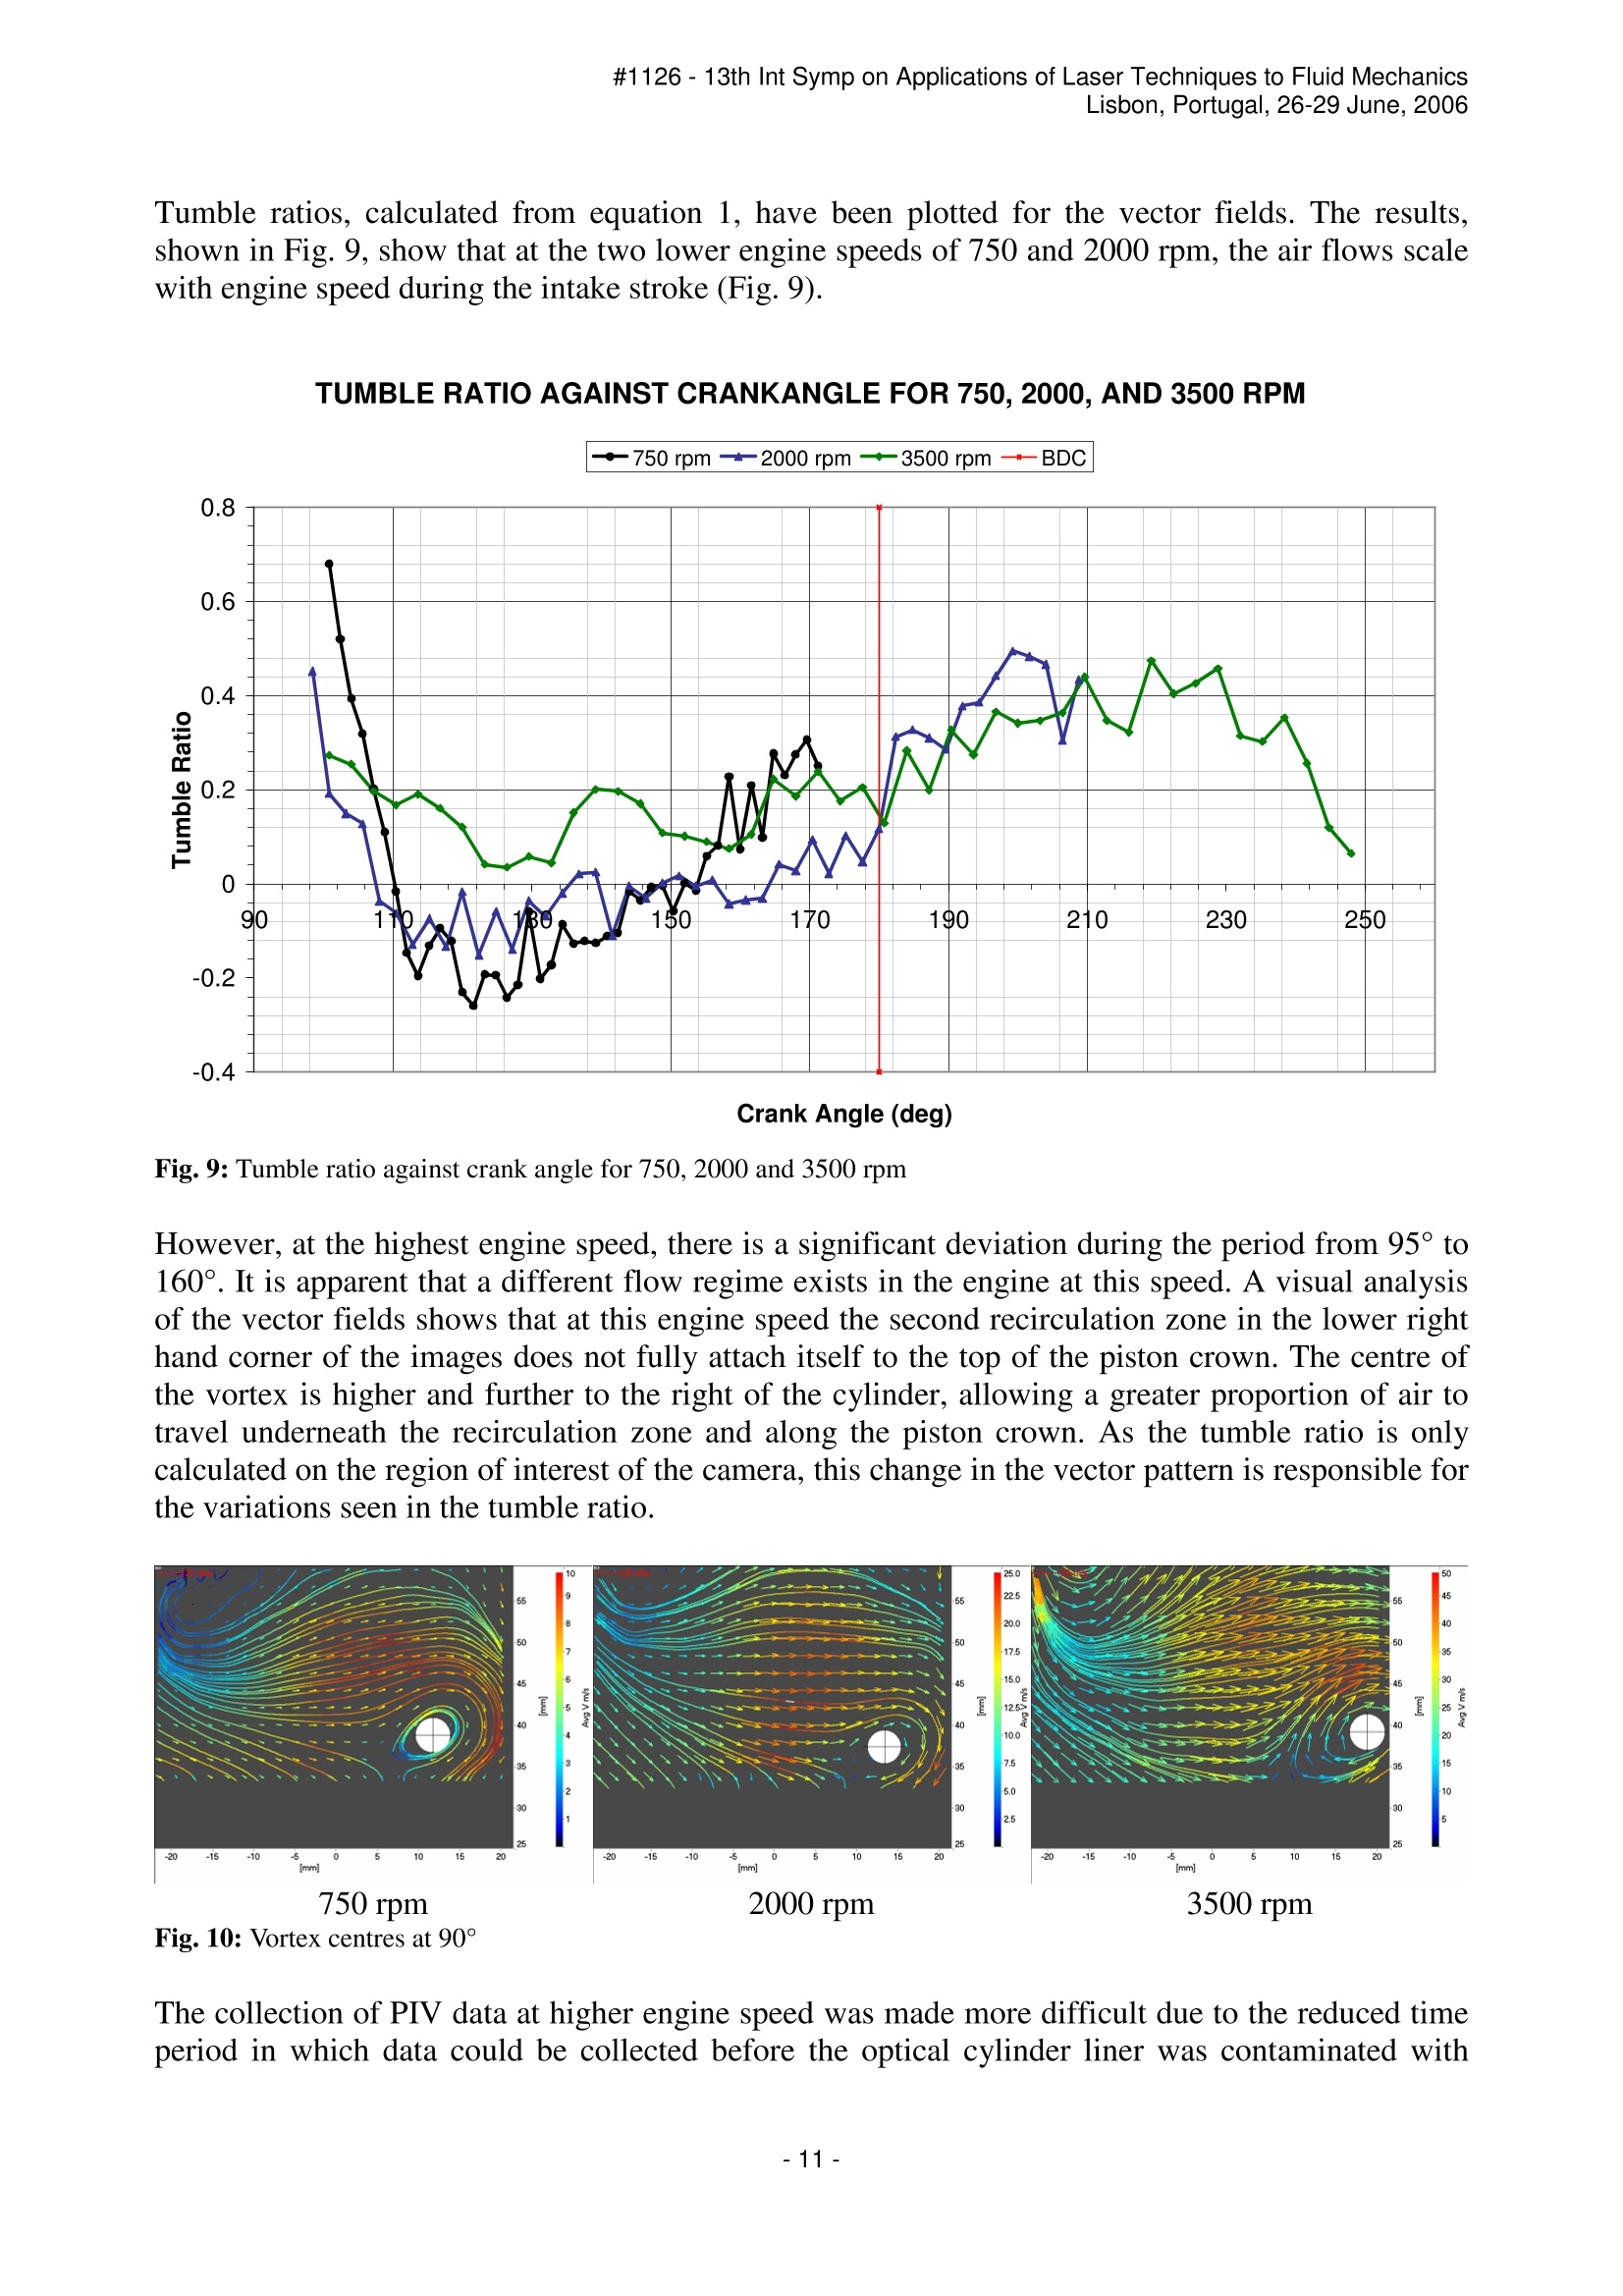
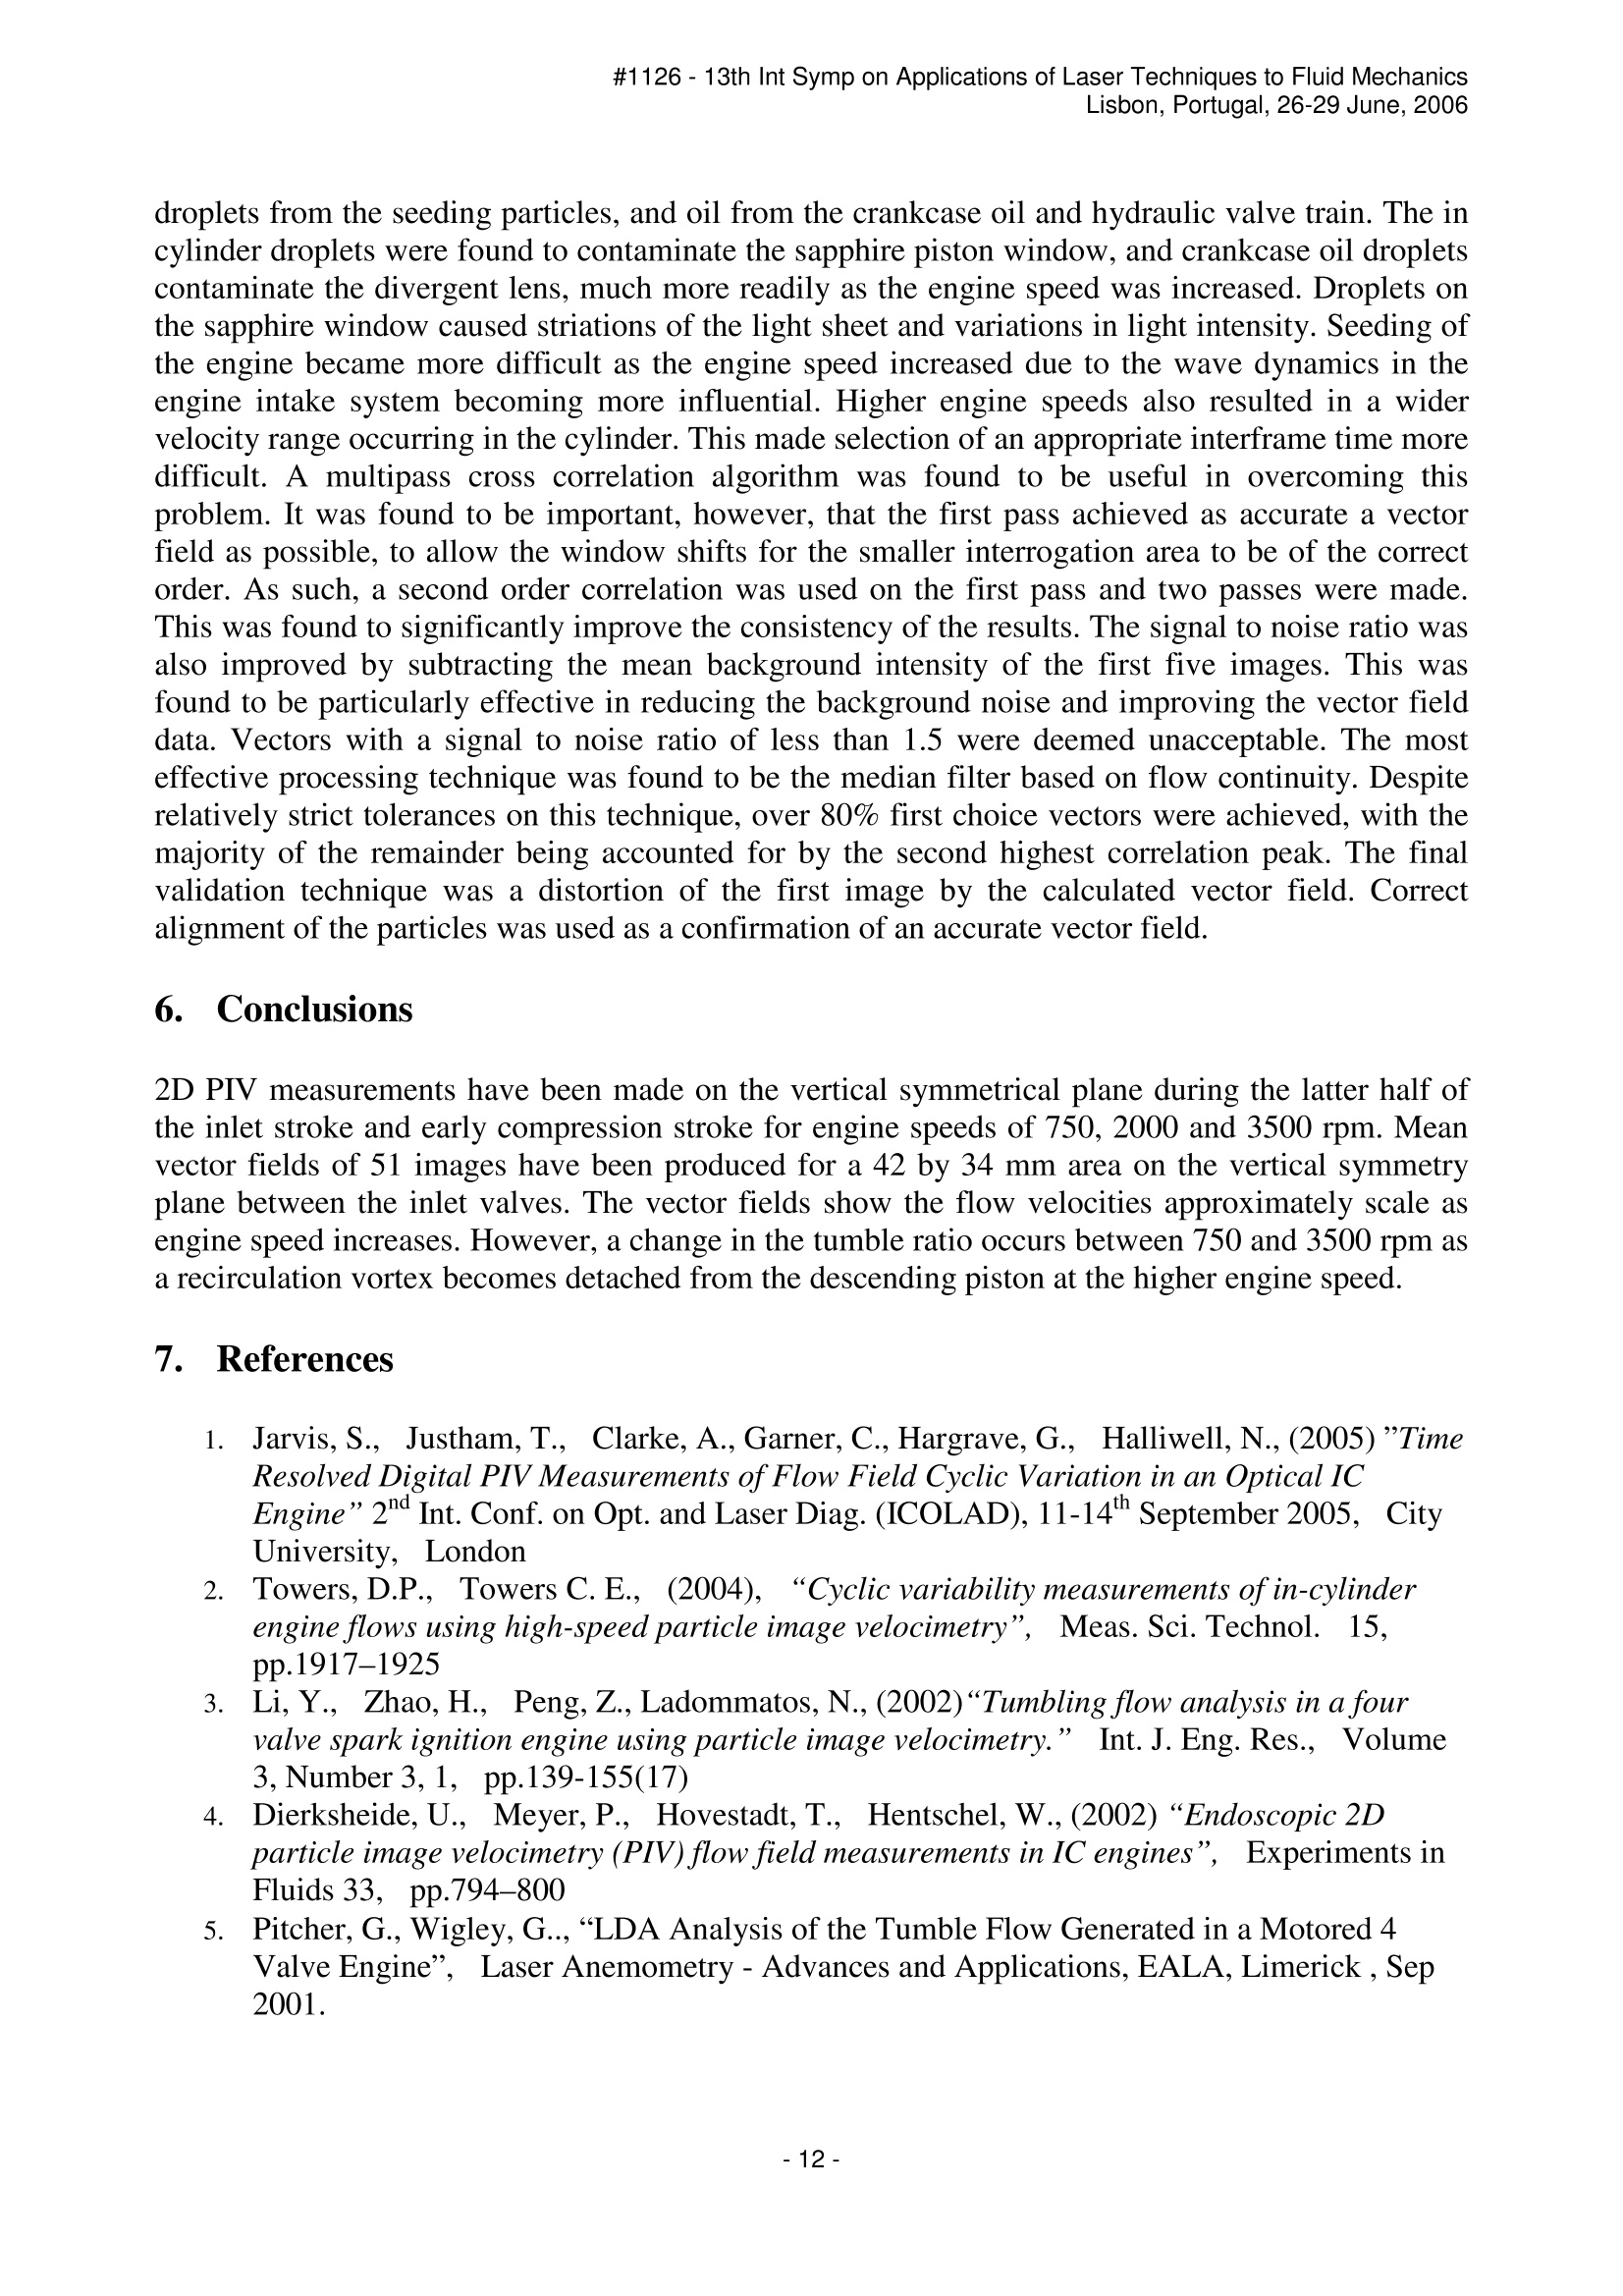
文
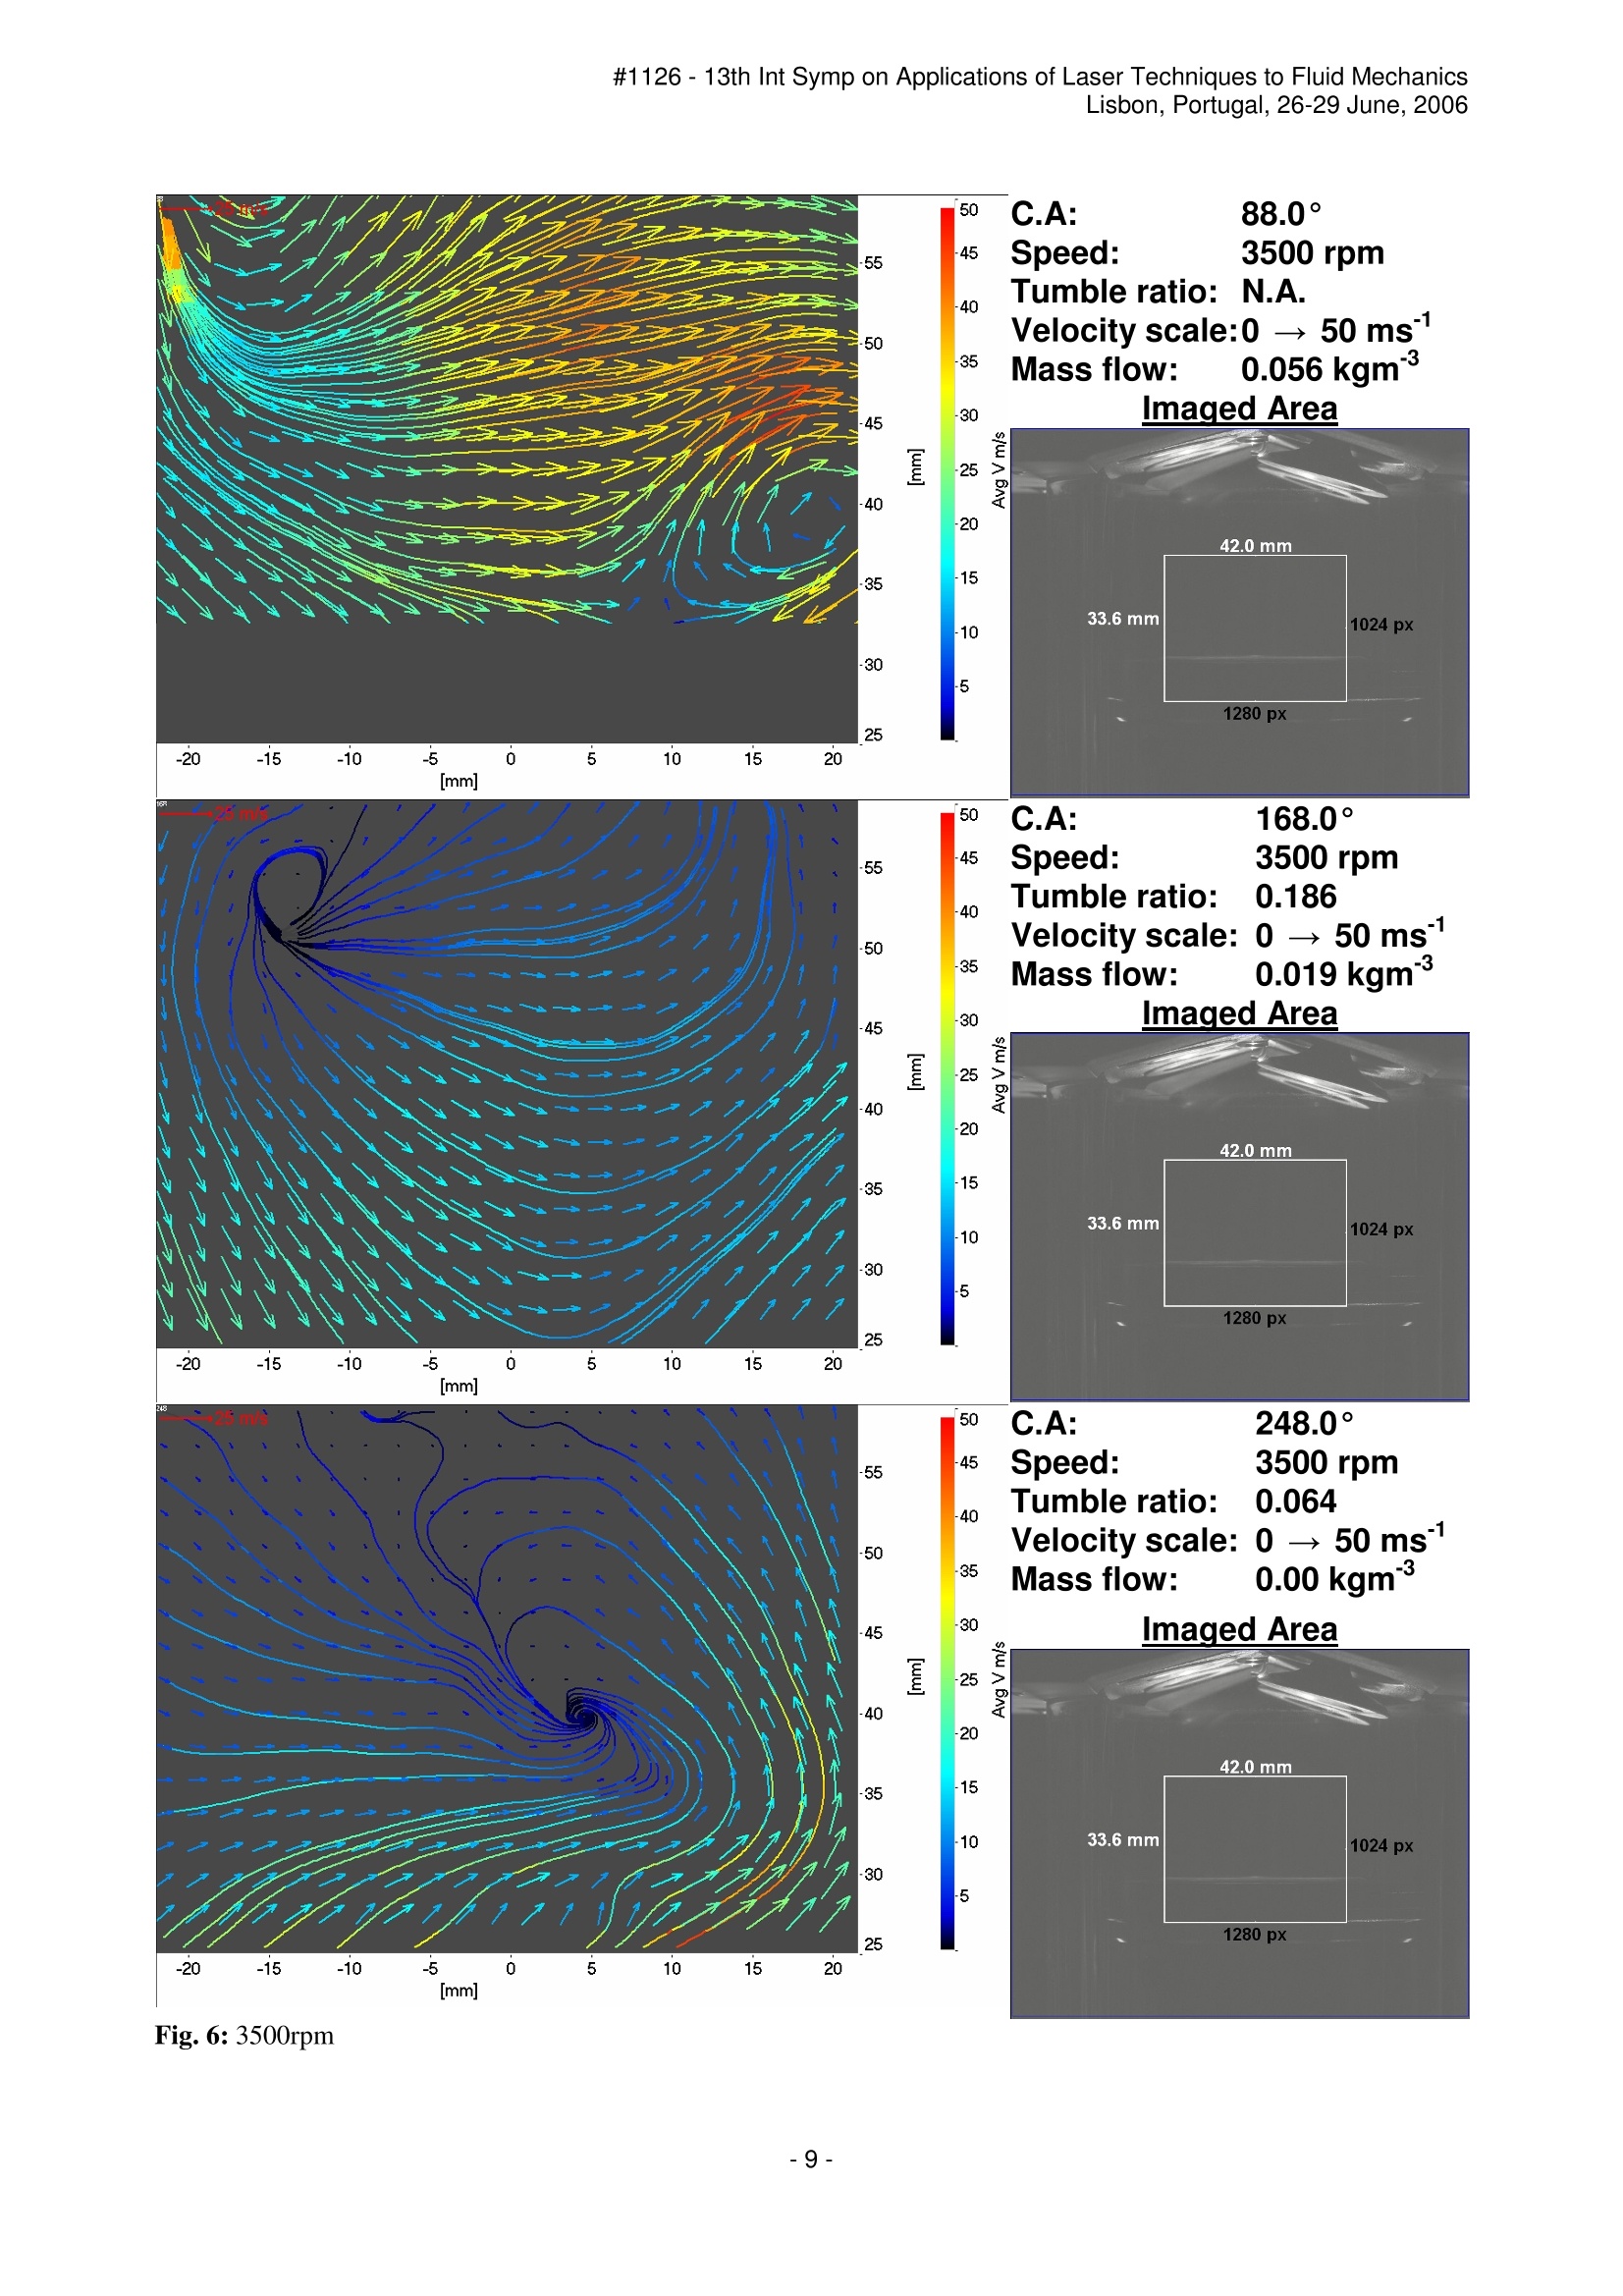
In-cylinder PIV measurements have been made during the latter half of the intake stroke on a
plane between the inlet valves for a single cylinder optical engine operating at engine speeds of 750, 2000
and 3500 rpm. Mean vector fields for an area of 42 mm by 34 mm have been produced with vectors at
approximately 1 mm resolution. The vector fields show the development of the flow field in 1.6°, 2.4° and
3.2° steps for the three respective engine speeds.
Tumble ratios have been calculated from these vector fields which show that a change in the flow regime
occurs between 2000 and 3500 rpm. This is caused by one of rotating vortices becoming detached from the
descending piston at the highest engine speed.
方案详情

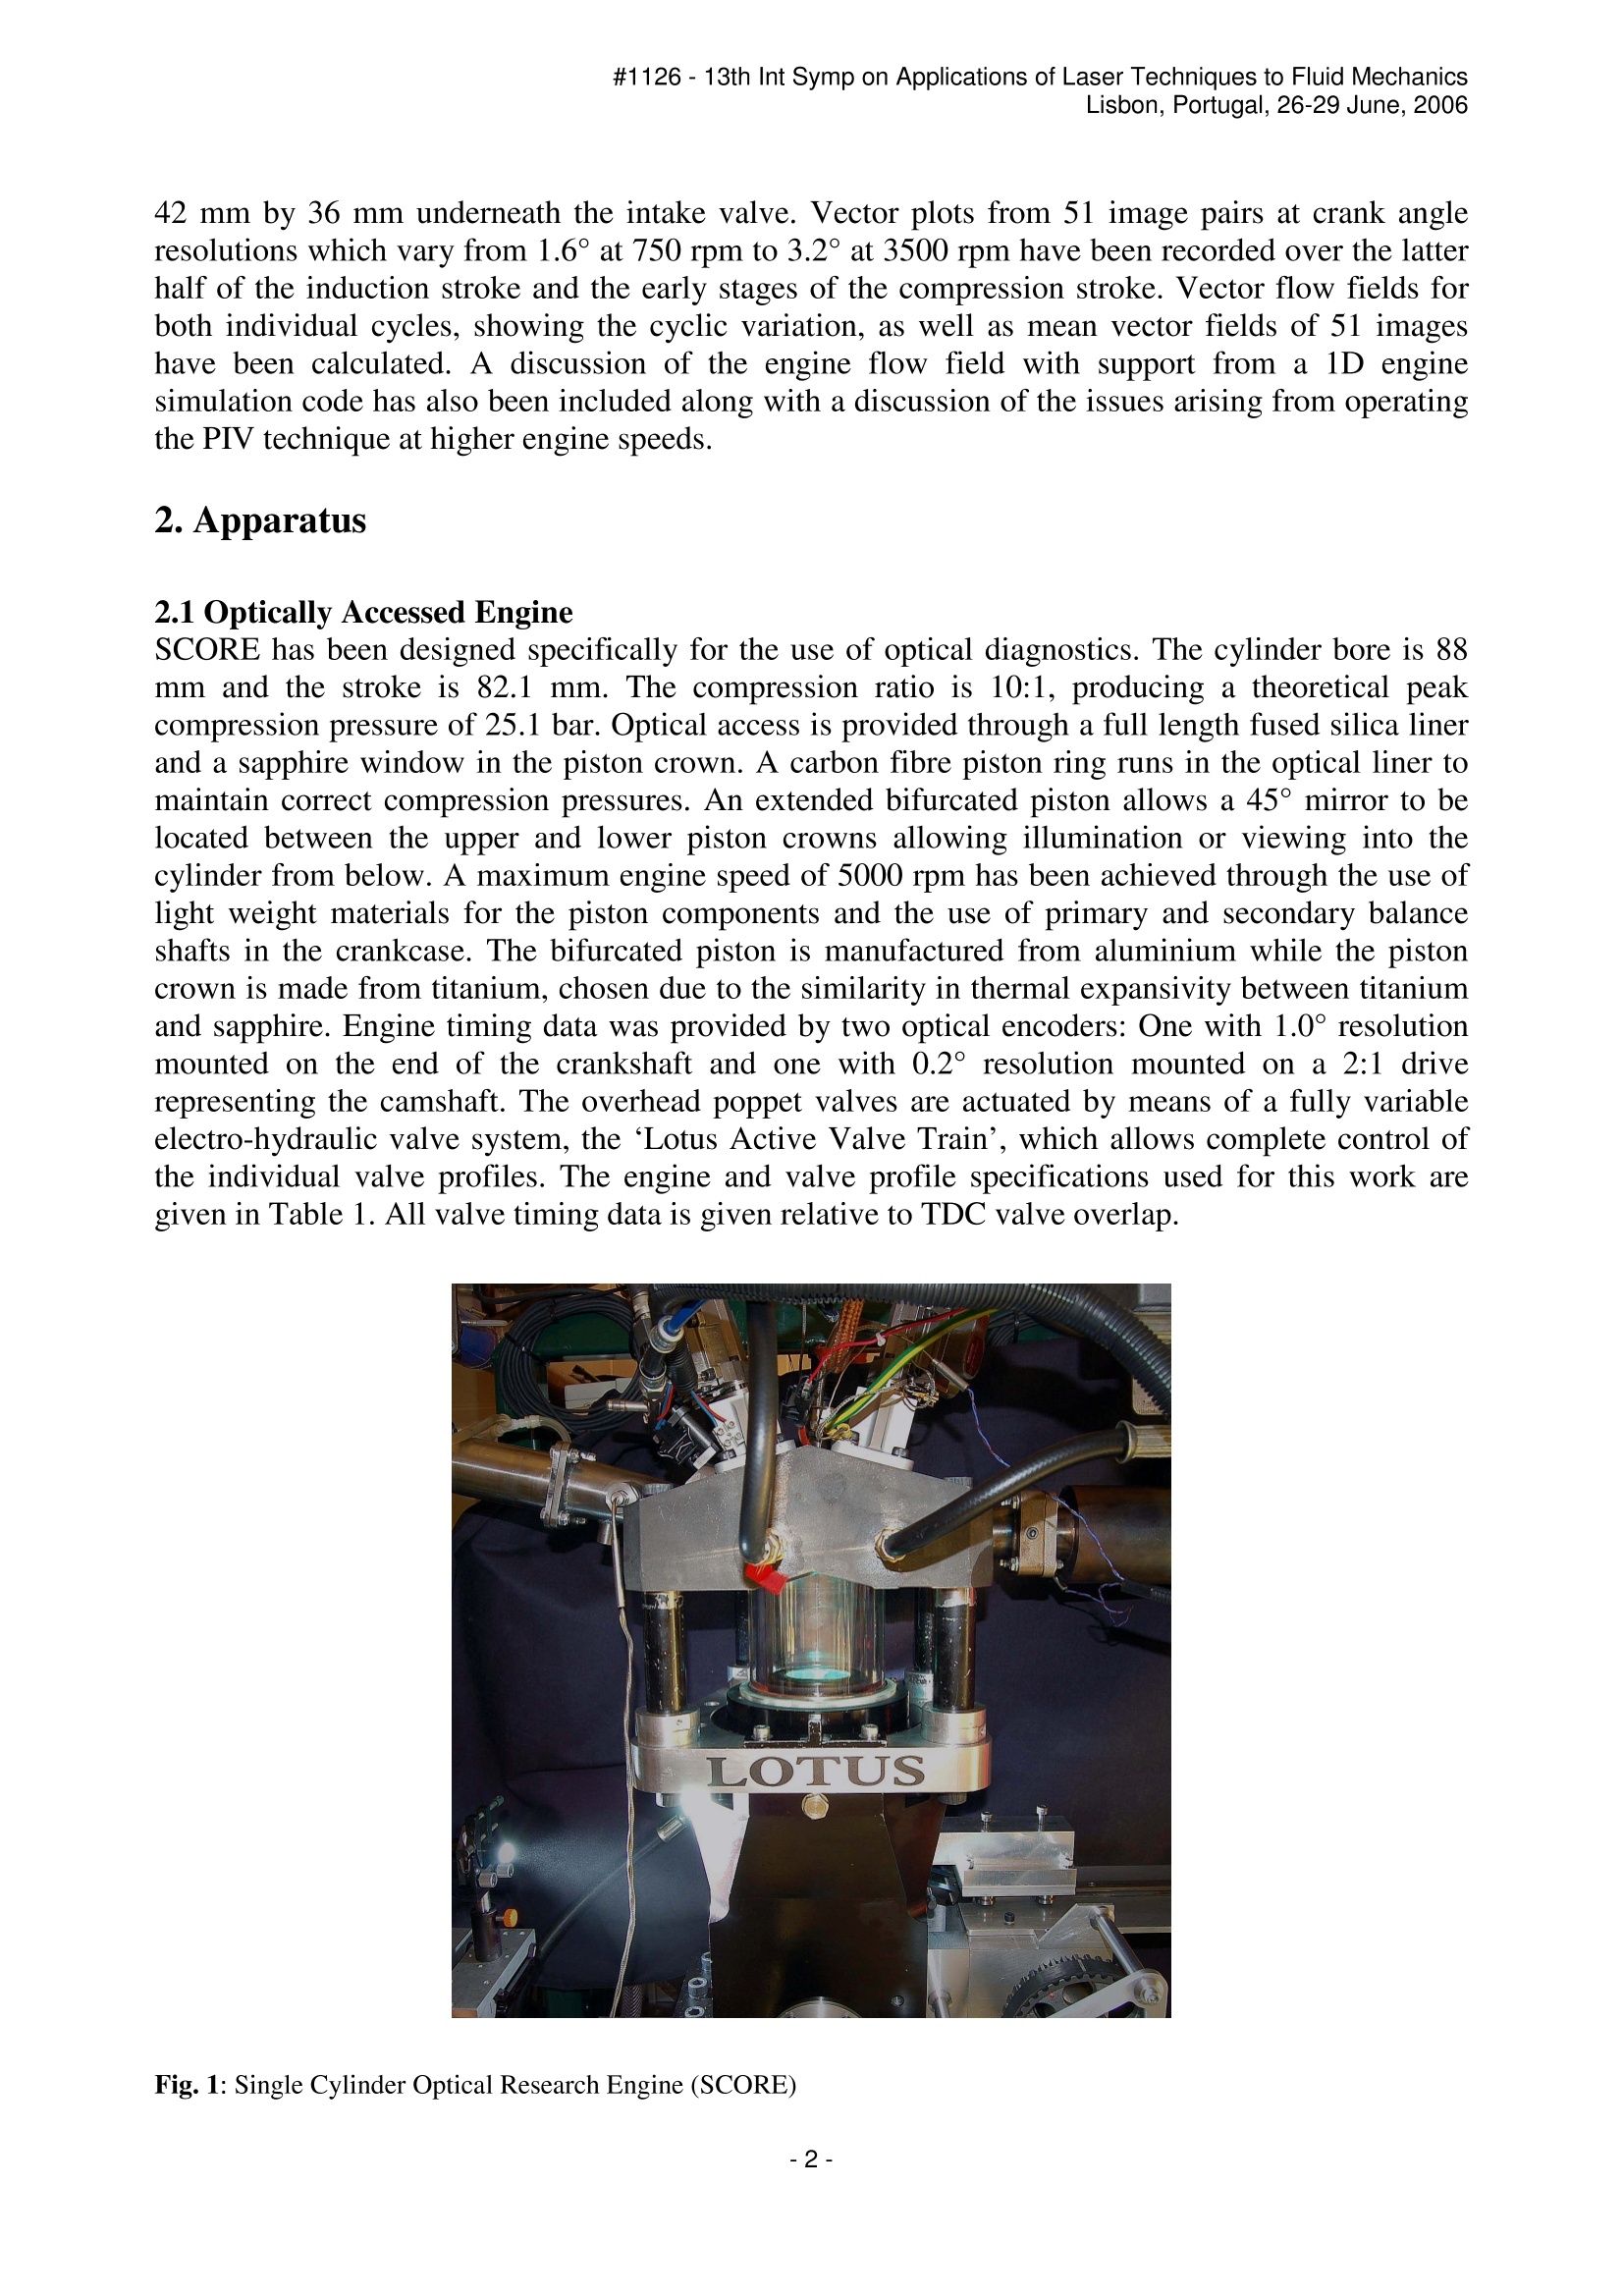
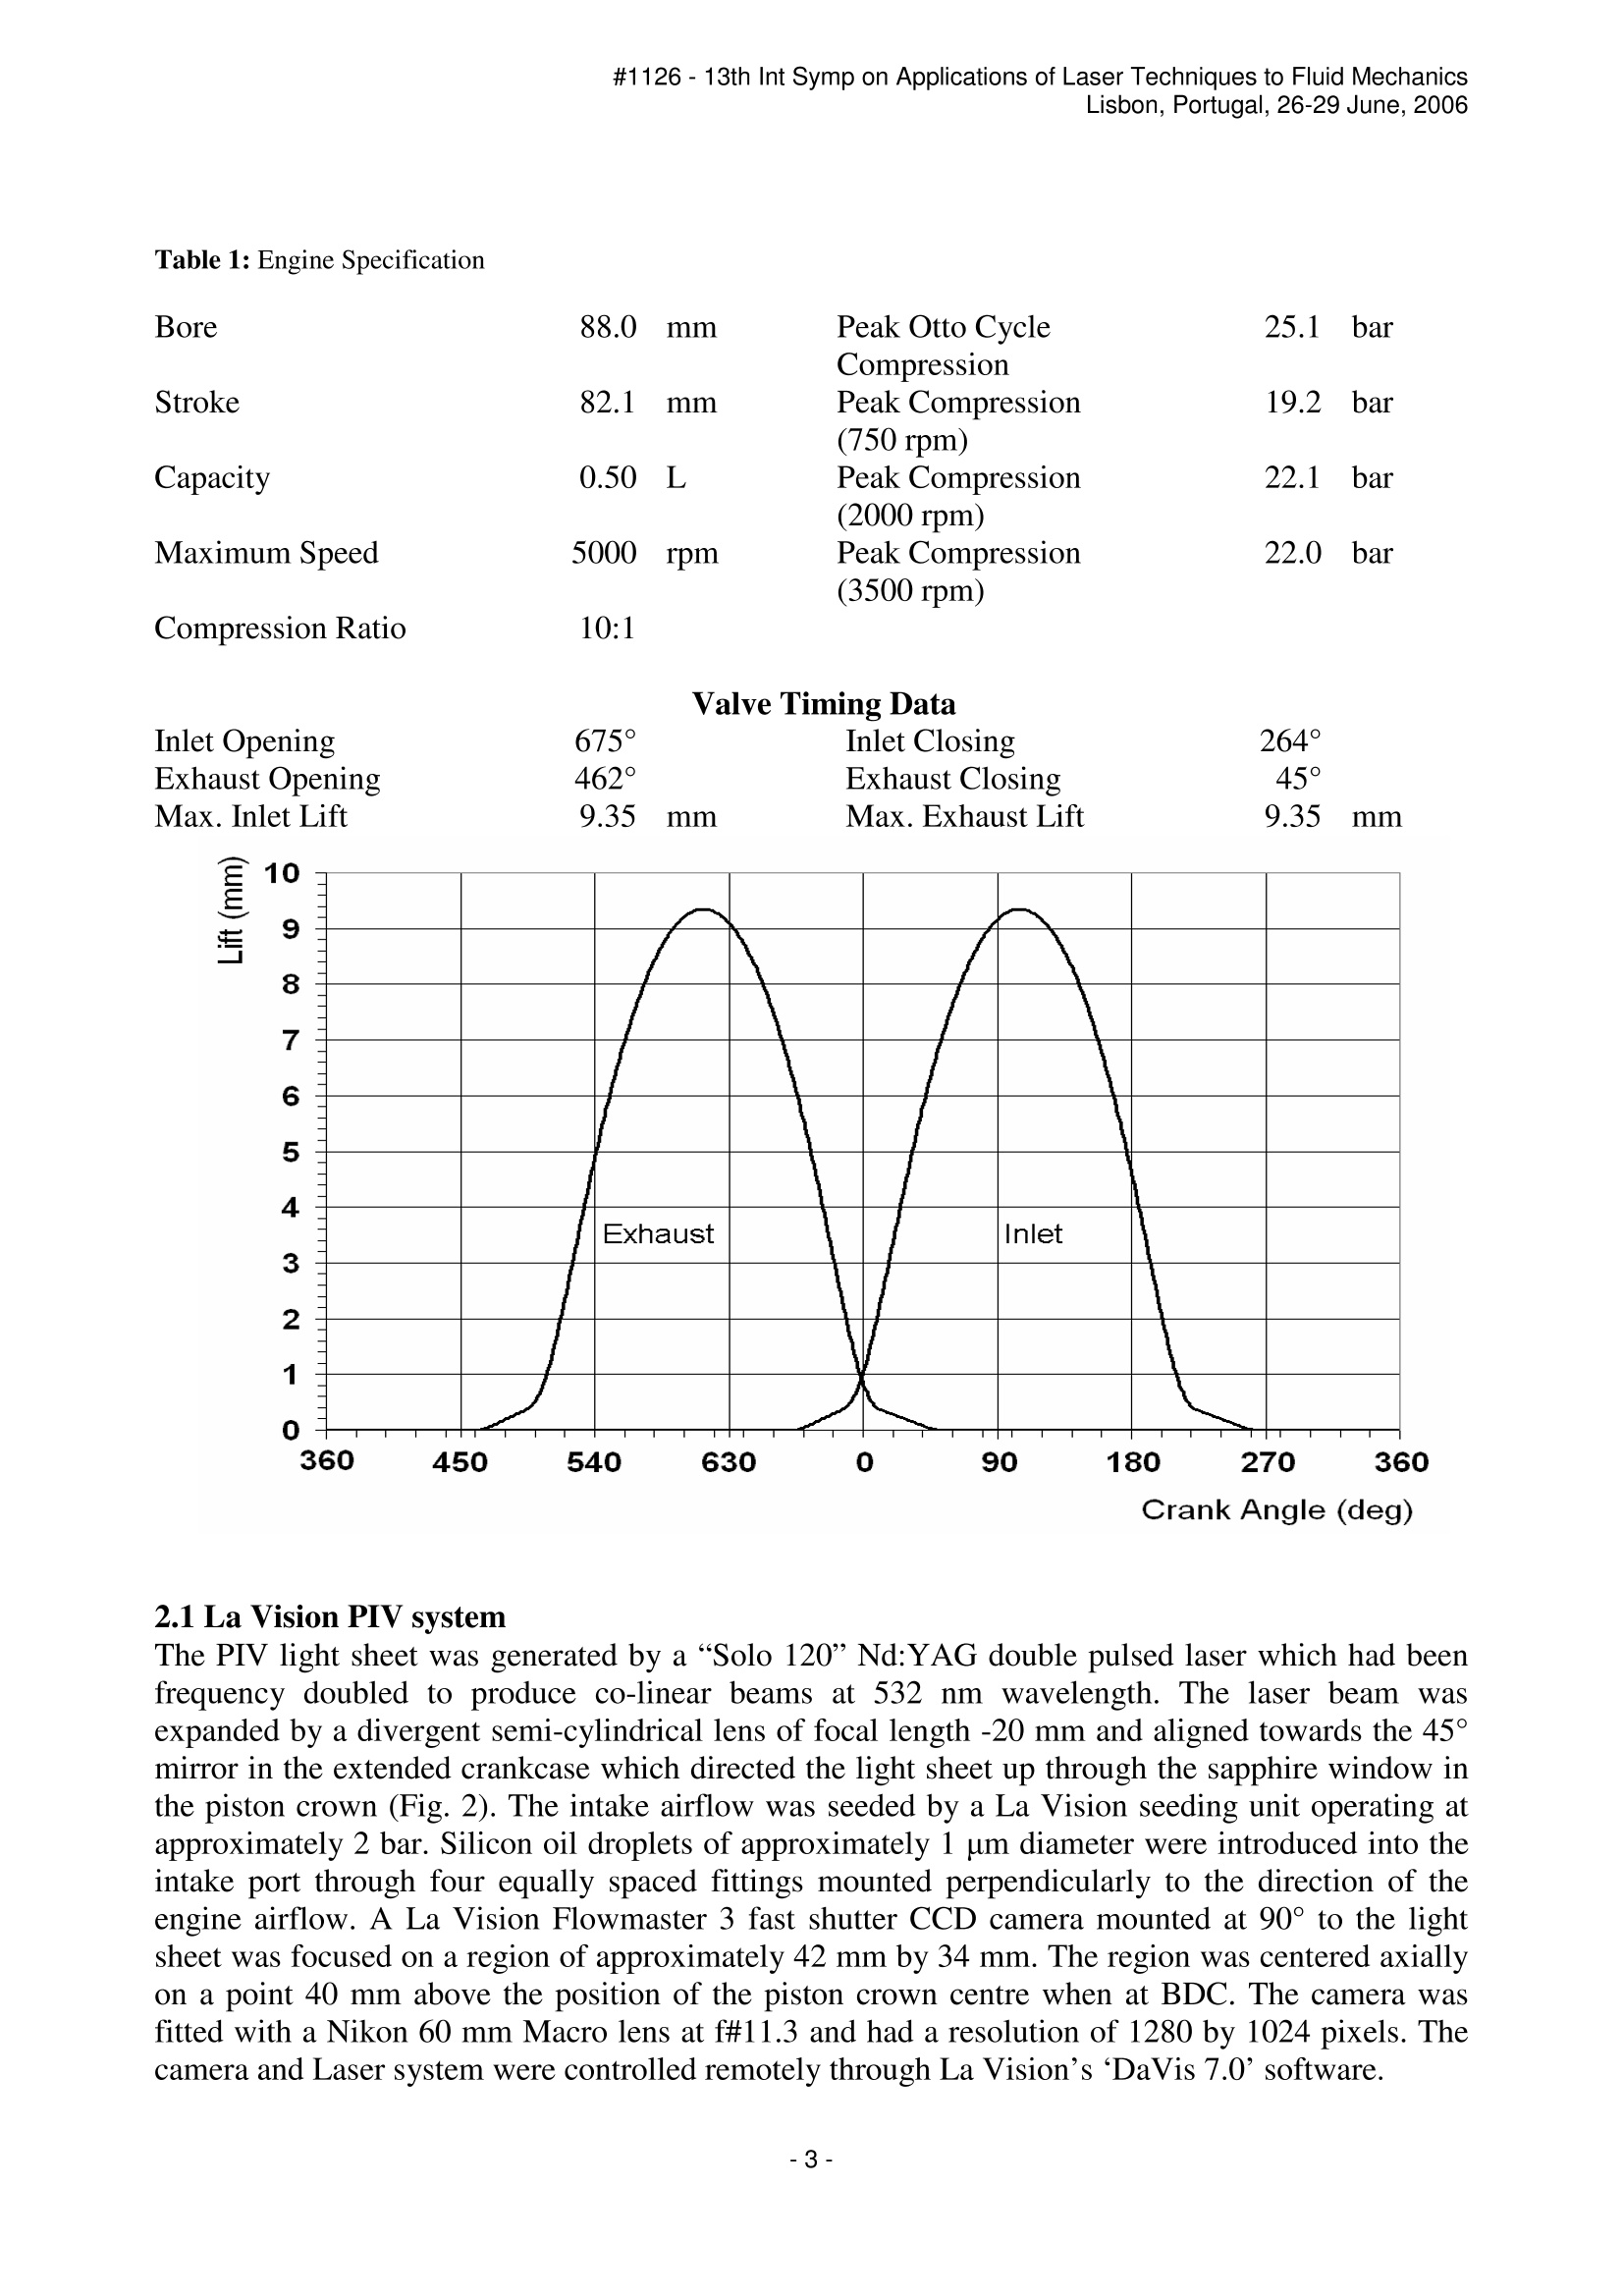
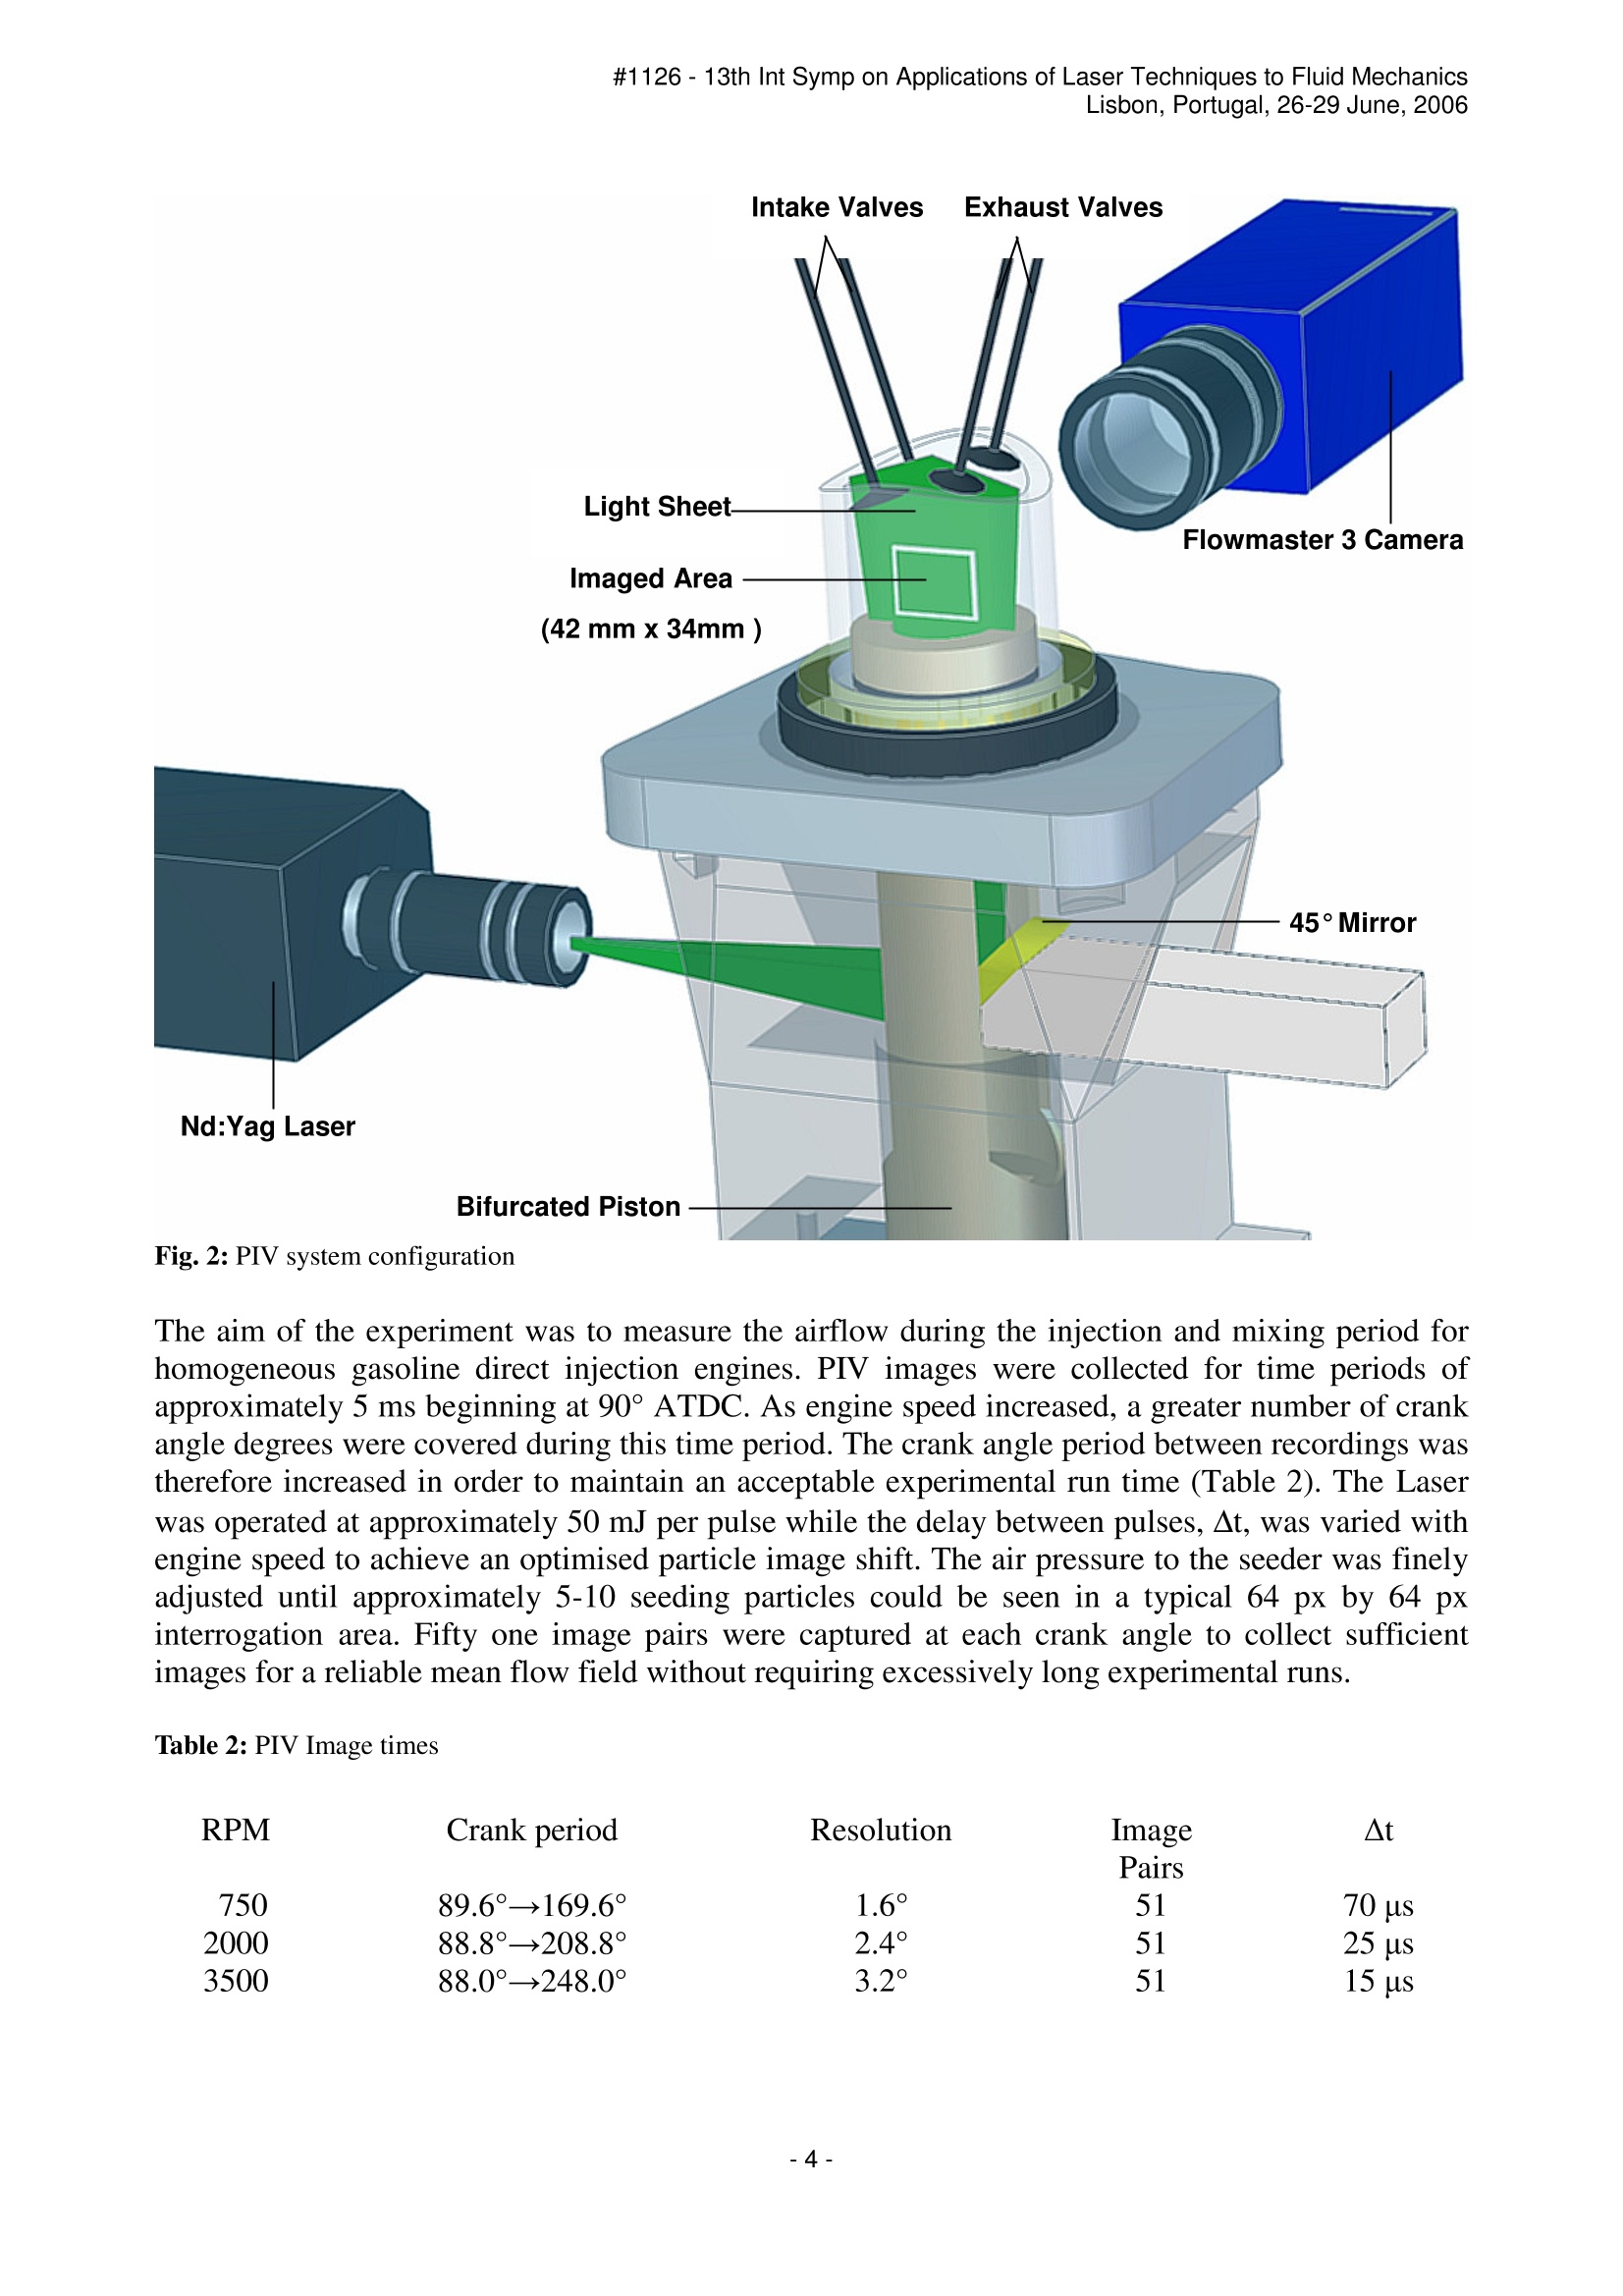
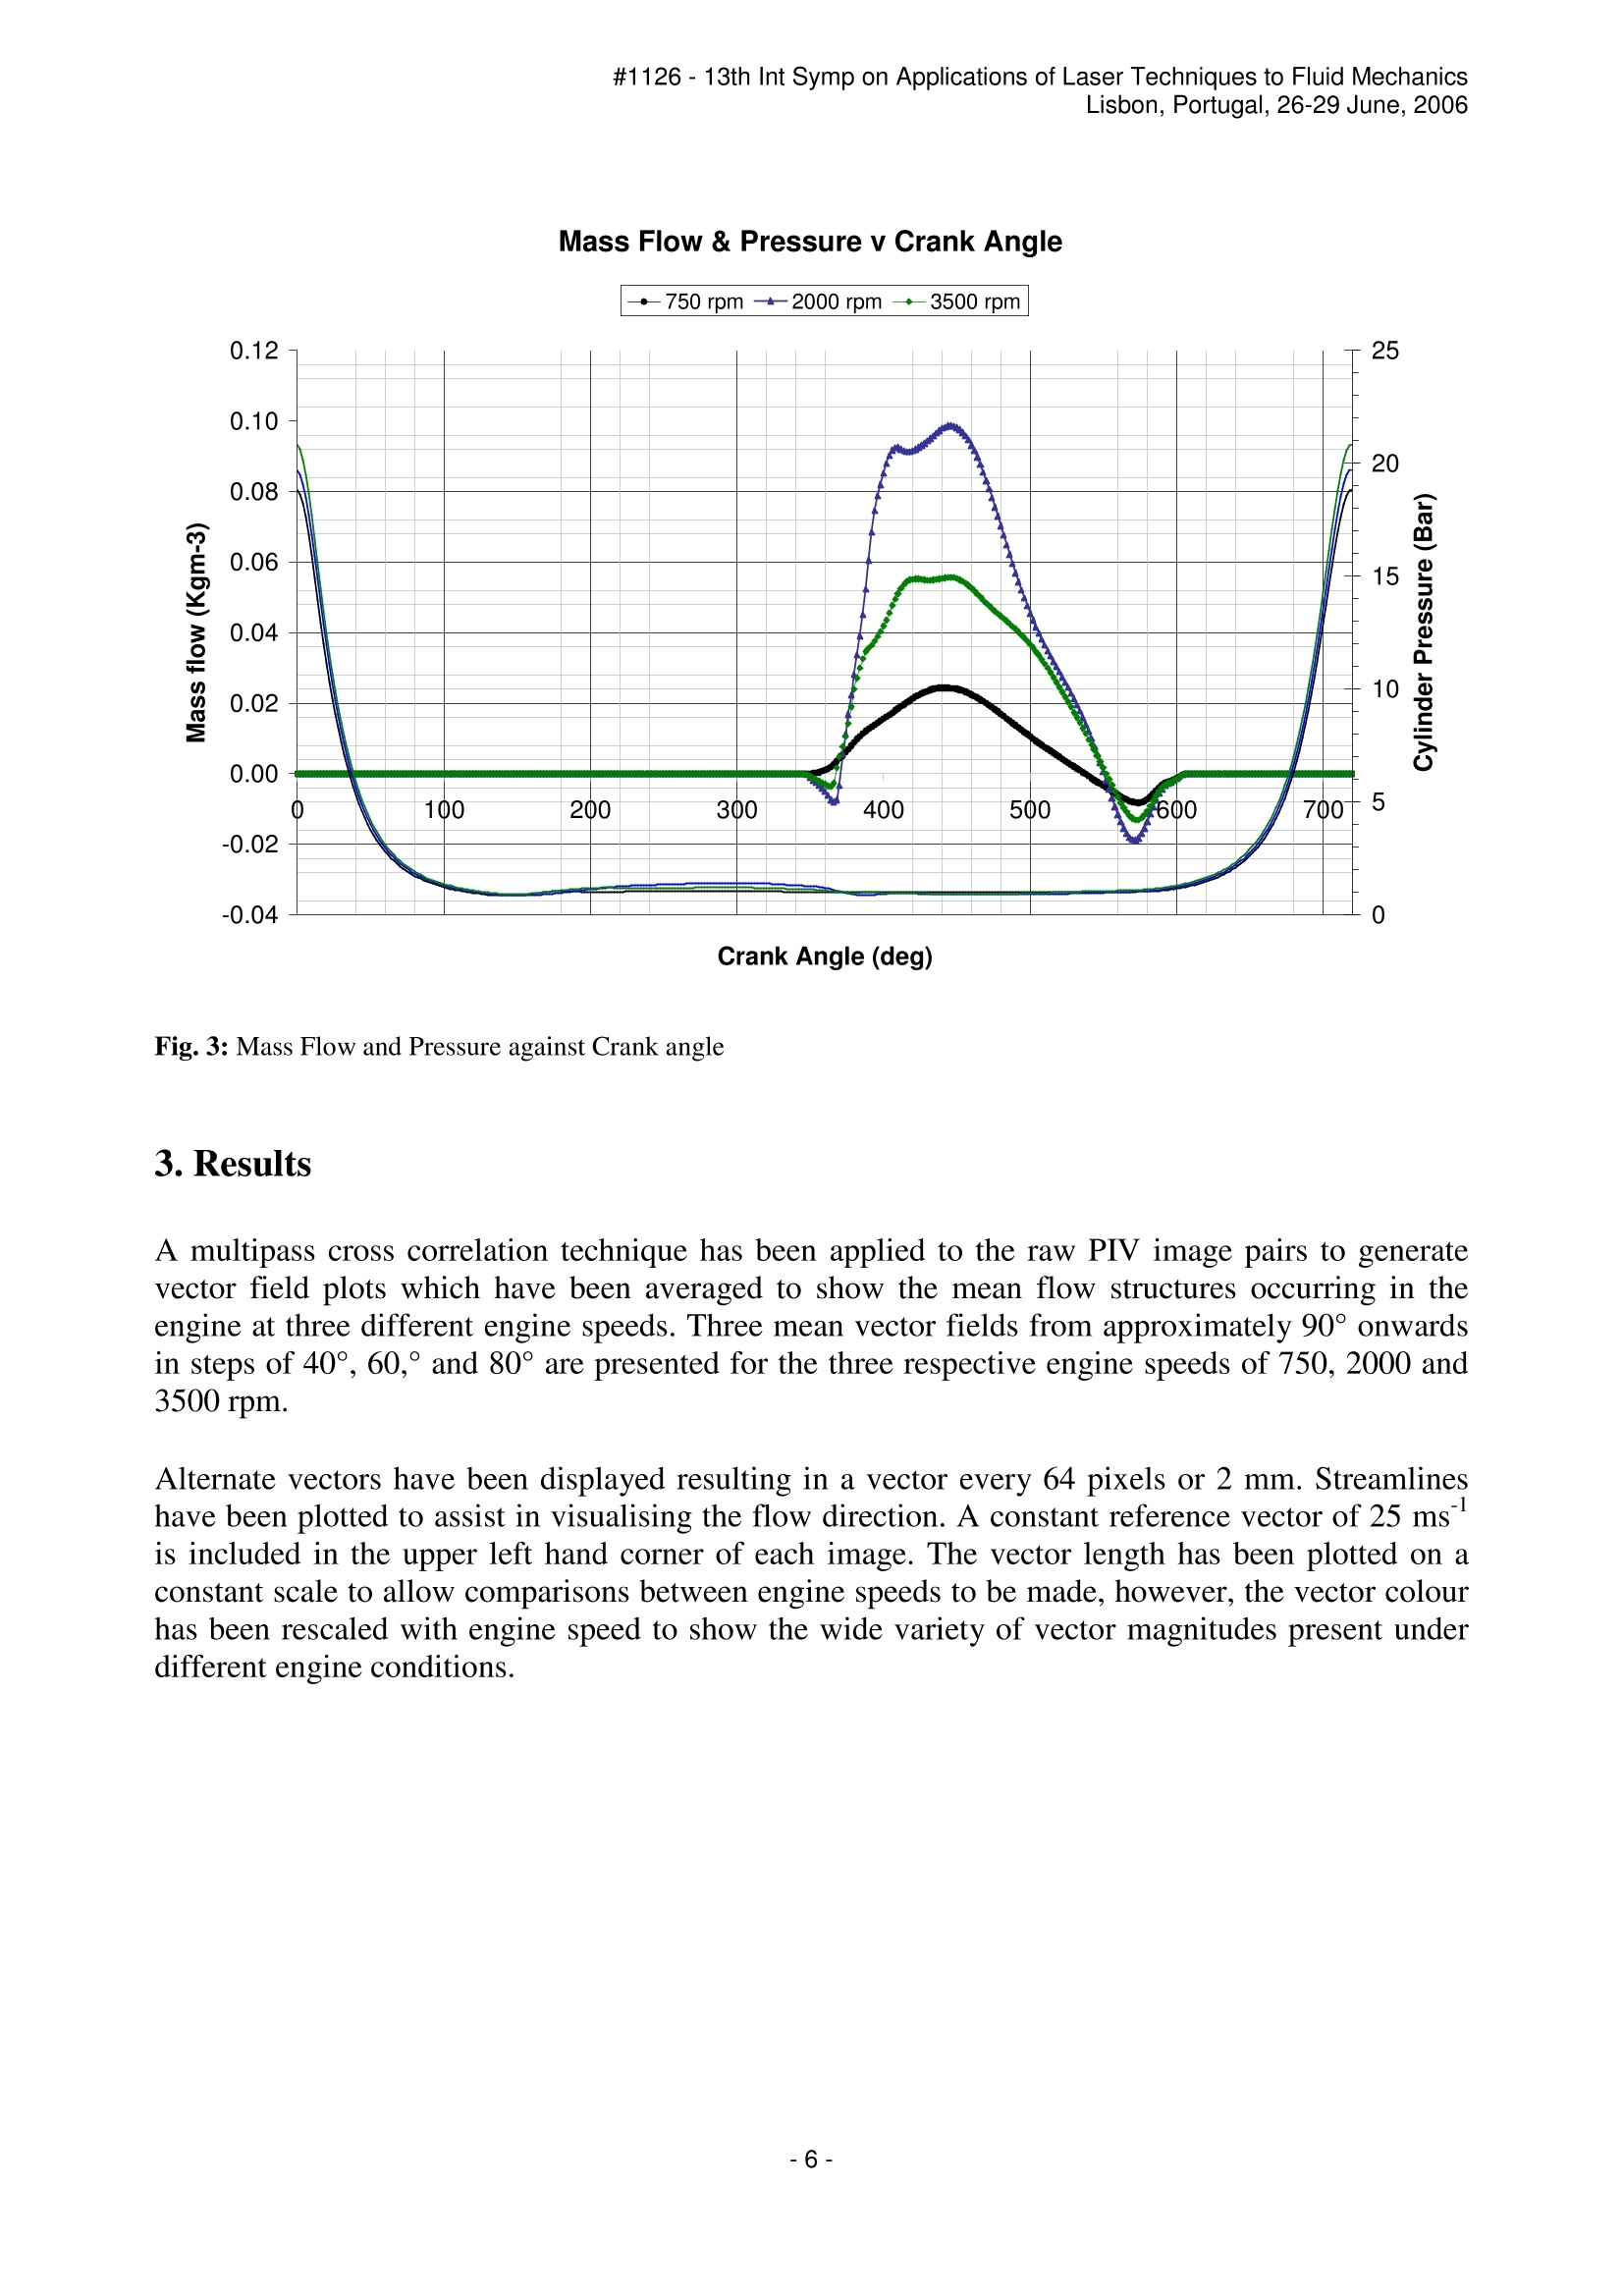
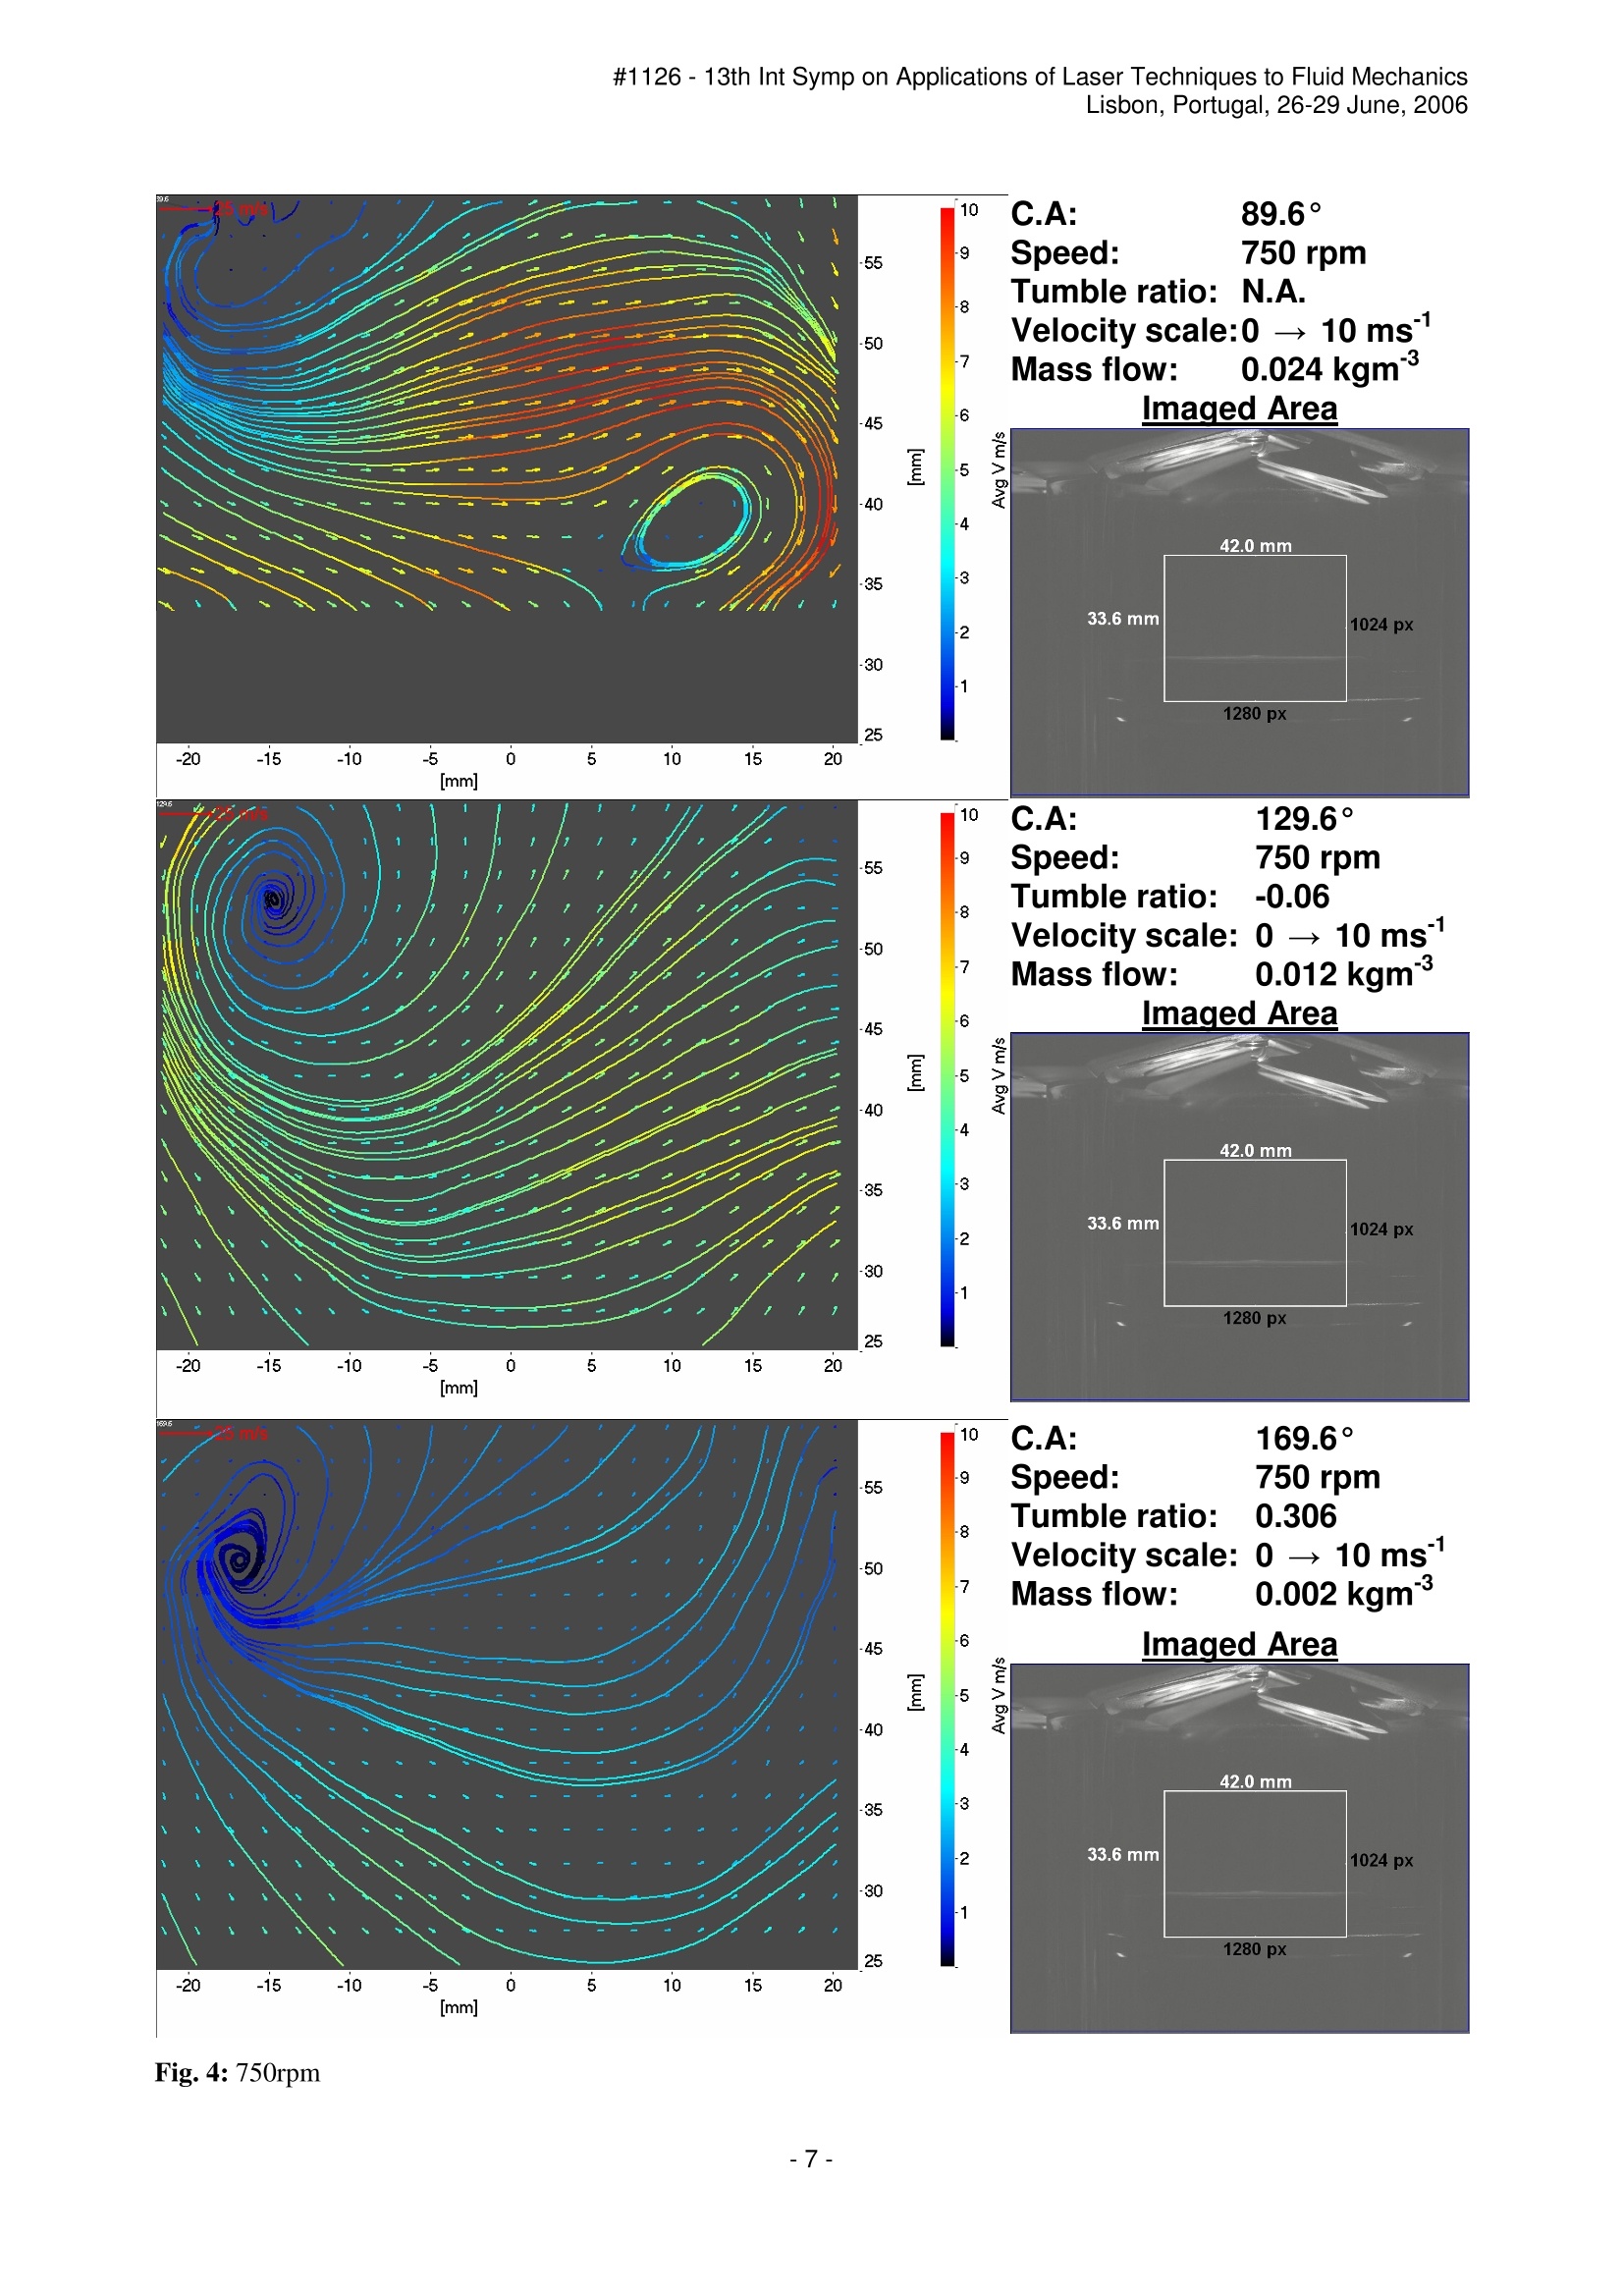
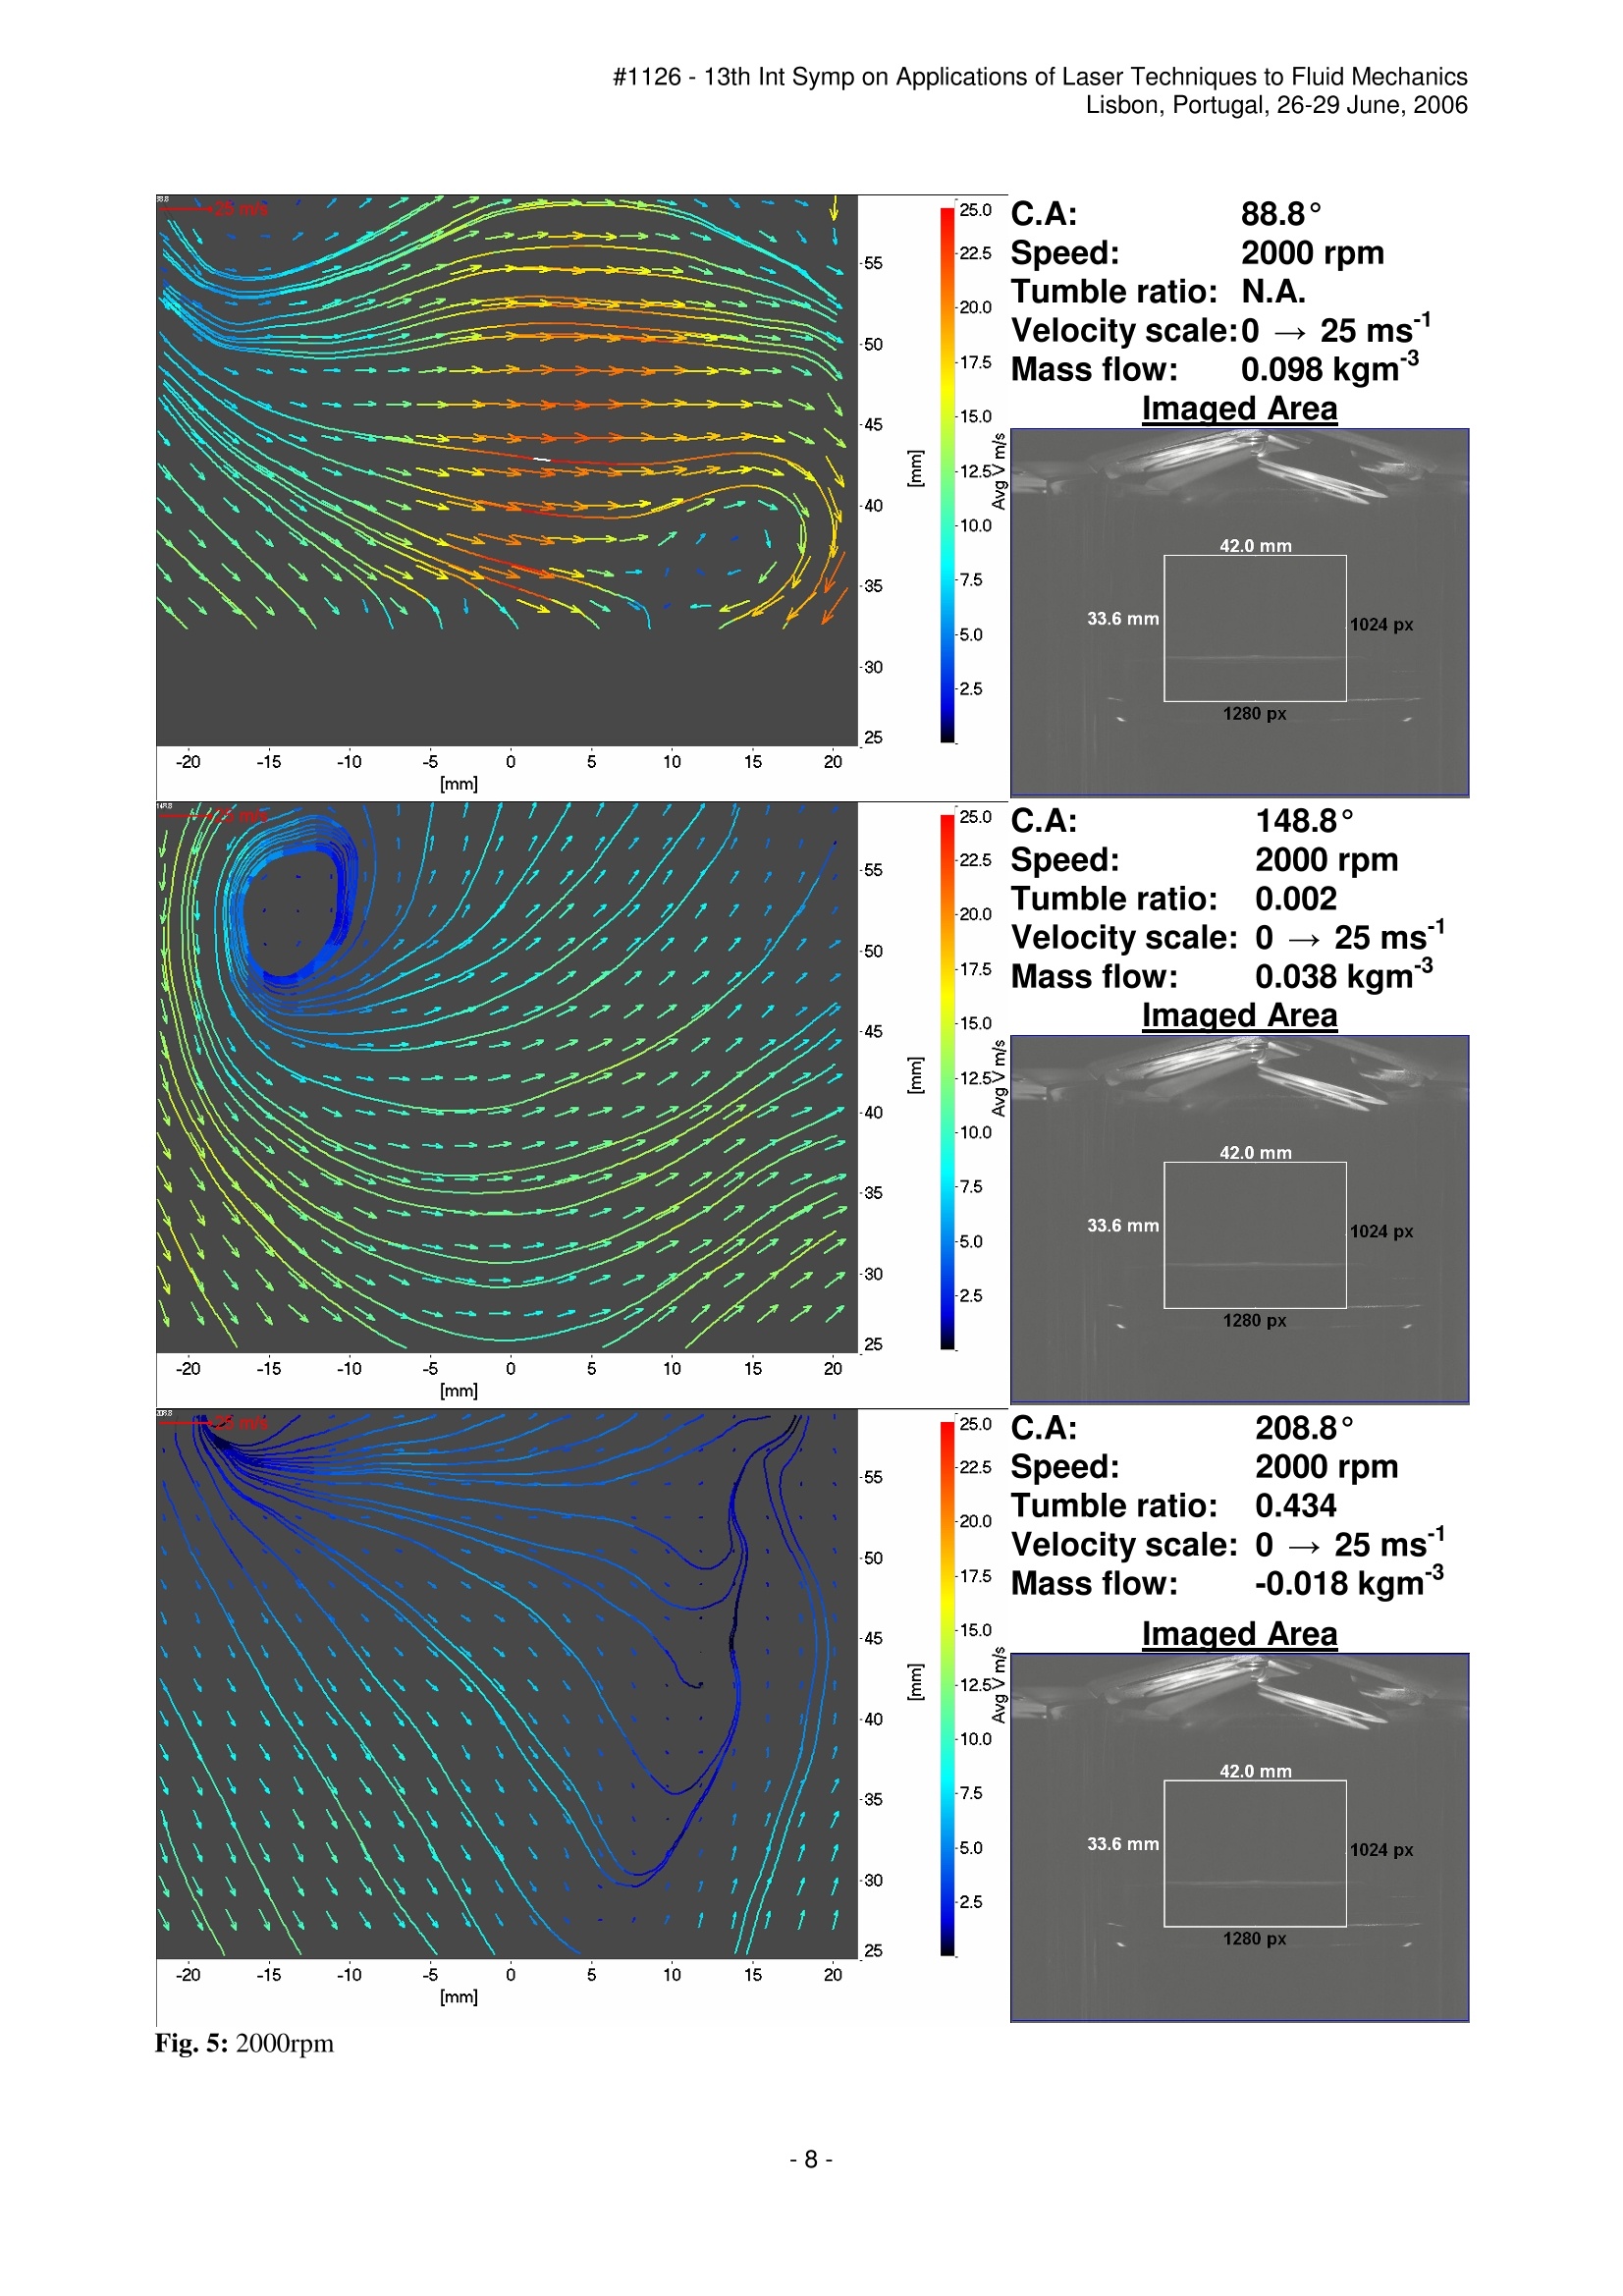
#1126- 13th Int Symp on Applications of Laser Techniques to Fluid MechanicsLisbon, Portugal,26-29 June,2006 PIV Analysis of In-Cylinder Flow Structures over a Range ofRealistic Engine Speeds Phil Stansfield, Graham Wigley , Julian Catto, Graham Pitcher 1: Aeronautical and Automotive Engineering, Loughborough University, Loughborough, Leicestershire, UK,P.A.Stansfield@Lboro.ac.uk,G.Wigley@Lboro.ac.uk 2: Powertrain Research, Lotus Engineering Ltd, Hethel,Norwich, UK, GPitcher @Lotuscars.co.uk AbstractIn-cylinder PIV measurements have been made during the latter half of the intake stroke on aplane between the inlet valves for a single cylinder optical engine operating at engine speeds of 750, 2000and 3500 rpm. Mean vector fields for an area of 42 mm by 34 mm have been produced with vectors atapproximately 1 mm resolution. The vector fields show the development of the flow field in 1.6°,2.4° and3.2° steps for the three respective engine speeds. Tumble ratios have been calculated from these vector fields which show that a change in the flow regimeoccurs between 2000 and 3500 rpm. This is caused by one of rotating vortices becoming detached from thedescending piston at the highest engine speed. 1.Introduction The airflow structures generated inside the cylinder of an internal combustion engine are known tosignificantly influence the air-fuel mixing and mixture transport during induction, and the turbulentflame speed during combustion. Accurate measurement of these structures is necessary to optimizethe engine in terms of power output, fuel economy and emissions control. The non perturbing andabsolute nature of optical diagnostic techniques have been extremely useful for quantification of theairflow structures generated in IC engines. Particle Image Velocimetry (PIV) is an optical diagnostic technique capable of measuring flow fieldvelocities on a 2D plane inside the engine cylinder with extremely high temporal and spatialresolution. PIV is also suited to the measurement of cyclic variation which is known to besignificant in highly turbulent flows, such as those generally found within SI engine cylinders. Traditionally, optical research engines have been prevented from running at high engine speed dueto heat accumulation, vibration problems and accumulation of unwanted material on the opticalsurfaces. Experiments have often been limited to engine speeds below 2000rpm. 1], [2][3]&[4]. Asignificant proportion of the normal engine speed range has therefore not been investigated. TheSingle Cylinder Optical Research Engine (SCORE) designed by Lotus Engineering is specificallyfor the application of optical diagnostic techniques at higher engine speeds. SCORE is fitted withboth primary and secondary balance shafts to allow for operation at speeds up to 5000 rpm. Theengine also incorporates a full length fused silica liner and a sapphire window in the piston crown toprovide extensive optical access to the combustion chamber. A 2-Dimensional Particle Image Velocimetry (PIV) technique has been applied to determine the in-cylinder flow field of this engine under motored conditions. Velocity maps have been producedshowing the fluid motion for a range of realistic engine speeds. Engine speeds of 750 rpm (idle),2000 rpm and 3500 rpm are presented. A consistent processing algorithm has been applied to theraw images producing vectors at 32 by 32 pixel resolution for an in-cylinder area of approximately 42 mm by 36 mm underneath the intake valve. Vector plots from 51 image pairs at crank angleresolutions which vary from 1.6° at 750 rpm to 3.2° at 3500 rpm have been recorded over the latterhalf of the induction stroke and the early stages of the compression stroke. Vector flow fields forboth individual cycles, showing the cyclic variation, as well as mean vector fields of 51 imageshave been calculated. A discussion of the engine flow field with support from a 1D enginesimulation code has also been included along with a discussion of the issues arising from operatingthe PIV technique at higher engine speeds. 2. Apparatus 2.1 Optically Accessed Engine SCORE has been designed specifically for the use of optical diagnostics. The cylinder bore is 88mm and the stroke is 82.1 mm. The compression ratio is 10:1, producing a theoretical peakcompression pressure of 25.1 bar. Optical access is provided through a full length fused silica linerand a sapphire window in the piston crown. A carbon fibre piston ring runs in the optical liner tomaintain correct compression pressures. An extended bifurcated piston allows a 45°mirror to belocated between the upper and lower piston crowns allowing illumination or viewing into thecylinder from below. A maximum engine speed of 5000 rpm has been achieved through the use oflight weight materials for the piston components and the use of primary and secondary balanceshafts in the crankcase. The bifurcated piston is manufactured from aluminium while the pistoncrown is made from titanium, chosen due to the similarity in thermal expansivity between titaniumand sapphire. Engine timing data was provided by two optical encoders: One with 1.0° resolutionmounted on the end of the crankshaft and one with 0.2°resolution mounted on a2:1 driverepresenting the camshaft. The overhead poppet valves are actuated by means of a fully variableelectro-hydraulic valve system, the ‘Lotus Active Valve Train’, which allows complete control ofthe individual valve profiles. The engine and valve profile specifications used for this work aregiven in Table 1. All valve timing data is given relative to TDC valve overlap. Fig. 1: Single Cylinder Optical Research Engine (SCORE) Table 1: Engine Specification Bore 88.0 mm Peak Otto Cycle 25.1 barCompressionStroke 82.1 mm Peak Compression 19.2 bar(750 rpm)Capacity 0.50 L Peak Compression 22.1 bar(2000 rpm)Maximum Speed 5000 rpm Peak Compression 22.0bar(3500 rpm) Compression Ratio io:1 Valve Timing Data Inlet Opening 675° Inlet Closing 264°Exhaust Opening 462° Exhaust Closing 45°Max. Inlet Lift 9.35 mm Max. Exhaust Lift 9.35 mm Crank Angle (deg) 2.1 La Vision PIV system The PIV light sheet was generated by a“Solo 120”Nd:YAG double pulsed laser which had beenfrequency doubled to produce co-linear beams at 532 nm wavelength. The laser beam wasexpanded by a divergent semi-cylindrical lens of focal length -20 mm and aligned towards the 45°mirror in the extended crankcase which directed the light sheet up through the sapphire window inthe piston crown (Fig. 2). The intake airflow was seeded by a La Vision seeding unit operating atapproximately 2 bar. Silicon oil droplets of approximately 1 um diameter were introduced into theintake port through four equally spaced fittings mounted perpendicularly to the direction of theengine airflow. A La Vision Flowmaster 3 fast shutter CCD camera mounted at 90°to the lightsheet was focused on a region of approximately 42 mm by 34 mm. The region was centered axiallyon a point 40 mm above the position of the piston crown centre when at BDC. The camera wasfitted with a Nikon 60 mm Macro lens at f#11.3 and had a resolution of 1280 by 1024 pixels. Thecamera and Laser system were controlled remotely through La Vision’s ‘DaVis 7.0’software. Intake Valves Exhaust Valves Fig. 2: PIV system configuration The aim of the experiment was to measure the airflow during the injection and mixing period forhomogeneous gasoline direct injection engines. PIV images were collected for time periods ofapproximately 5 ms beginning at 90°ATDC. As engine speed increased, a greater number of crankangle degrees were covered during this time period. The crank angle period between recordings wastherefore increased in order to maintain an acceptable experimental run time (Table 2). The Laserwas operated at approximately 50 mJ per pulse while the delay between pulses, At, was varied withengine speed to achieve an optimised particle image shift. The air pressure to the seeder was finelyadjusted until approximately 5-10 seeding particles could be seen in a typical 64 px by 64 pxinterrogation area. Fifty one image pairs were captured at each crank angle to collect sufficientimages for a reliable mean flow field without requiring excessively long experimental runs. Table 2: PIV Image times RPM Crank period Resolution Image ▲t Pairs 750 89.6°→169.6° 1.6° 70 ps 2000 88.8°→208.8° 2.4° 25 us 3500 88.0°→248.0° 3.2° 15 us La Vision’s“DaVis 7.0”PIV software was used to cross-correlate the image pairs. An imagecalibration was first performed to reduce lens effects caused by imaging through the cylindricalliner of 16 mm thickness. Background noise was then minimized by subtracting a mean backgroundintensity from the raw images. A multipass cross-correlation algorithm was used to compute thevector fields from the images recorded on each cycle. The first correlation employed a 128 px by128 px interrogation area size with 50% overlap. A second, higher resolution, correlation thenutilized a 64 px by 64 px interrogation area size also with 50% overlap. Two passes of the particleimage were made for each interrogation area size. Validation of the calculated vectors wasundertaken by use of a variety of post processing techniques. A minimum signal to noise ratio of1.5 was necessary to accept the vector and the flow continuity principle was applied to removevectors which varied by more than 2 times the RMS value of their 8 surrounding neighbours.Finally, interrogation regions with fewer than four particle images were also rejected. Thistechnique yielded vector fields with 32 by 32 px resolution, or approximately one vector everymillimeter. A mean vector field was then calculated from the results of all 51 cyclic resultsproduced at each crank angle position. Vector fields are presented with a constant reference vectorof 25 ms, with streamlines plotted to assist in visualizing the flow structures. Tumble ratios for the field of view of the PIV experiment have been calculated according toEquation 1. This method of calculating the tumble ratio uses the instantaneous angular velocitycalculated from the vector field and assumes that the centre of rotation is about the centre of thecylinder. Tumble ratios were not calculated for vector fields where the piston was visible as therandom vectors produced in these regions introduced large errors in the results. (1) Equation 1: Tumble ratio Tumble RatioUAxial Velocity (ms)iEngine crank angle sector numberYRadial Displacement (m)NNumber of VectorsBImaged Area Width (m)VRadial Velocity (ms")Engine speed (Rad s )XAxial Displacement(m) 2.3 Lotus Engine Simulation “Lotus Engine Simulation”(LES) is a 1D simulation code used for predicting engine performance.The geometry of the SCORE cylinder, along with the engine’s intake and exhaust systems, wasentered into the code to calculate the mass of air flowing into the cylinder and the instantaneouscylinder pressure every two degrees crank angle. Simulations were performed at engine speeds of750, 2000 and 3500 rpm to correlate with the experimental data. A plot of mass flow into thecylinder and instantaneous cylinder pressure against crank angle is shown in Fig. 3. The mass flowinto the cylinder for the corresponding PIV vector fields is been presented in Section 3. The greatestcyclic mass flow occurs in the 2000 rpm case. At 750 rpm, the volumetric efficiency is reduced dueto blow-by past the piston ring, while at 3500 rpm there is insufficient time to fill the cylinder. Thesimulated peak in-cylinder pressures vary between 18.8 bar at 750 rpm and 20.8 bar at 3500 rpm,which correlate well with the measured peak in-cylinder pressures from the engine. Mass Flow & Pressure v Crank Angle Fig. 3: Mass Flow and Pressure against Crank angle 3. Results A multipass cross correlation technique has been applied to the raw PIV image pairs to generatevector field plots which have been averaged to show the mean flow structures occurring in theengine at three different engine speeds. Three mean vector fields from approximately 90°onwardsin steps of 40°, 60,° and 80°are presented for the three respective engine speeds of 750, 2000 and3500 rpm. Alternate vectors have been displayed resulting in a vector every 64 pixels or 2 mm. Streamlineshave been plotted to assist in visualising the flow direction. A constant reference vector of 25 ms-1is included in the upper left hand corner of each image. The vector length has been plotted on aconstant scale to allow comparisons between engine speeds to be made, however, the vector colourhas been rescaled with engine speed to show the wide variety of vector magnitudes present underdifferent engine conditions. 10C.A: 89.6° -9 Speed: 750 rpm Tumble ratio: N.A.-8 Velocity scale:0→10 ms' -7 Mass flow: 0.024 kgm~ -6 Imaged Area 10 C.A: 129.6° -9 Speed: 750 rpm Tumble ratio:--0.06 -8 Velocity scale: 0→10 ms -7 Mass flow: 0.012 kgm 10 C.A: 169.6° -9 Speed: 750 rpm 0.306-8Tumble ratio: Velocity scale: 0→ 10 ms -7 Mass flow: 0.002 kgm° -6 maged Area 25.0(C.A: 88.8° 22.5Speed: 2000 rpm Tumble ratio: N.A.20.0 Velocity scale:0 → 25 ms -17.5Mass flow: 0.098 kgm~-3 Imaged Area 25.0C.A: 148.8° -22.5Speed: 2000 rpm Tumble ratio:(0.002 -20.0 Velocity scale: 0 → 25 ms -17.5Mass flow: 0.038 kgm~ 25.00(C.A: 208.8° 50 C.A: 88.0° -45 Speed: 3500 rpm Tumble ratio:N.A.-40 Velocity scale:0 → 50 ms' -35 Mass flow: 0.056kgm° -30 lmaged Area 50 C.A: 168.0° -45 Speed: 3500 rpm (0.186 - Tumble ratio: Velocity scale: 0→50 ms° -35 Mass flow: 0.019 kgm 50 C.A: 248.0°-45 Speed: 3500 rpmTumble r-40atio: 0.064Velocity scale: 0→50 ms-35 Mass flow: 0.00 kgm Fig. 6:3500rpm 4. Discussion Two dimensional vector fields have been producedfor the latter half of the intake stroke and early stagesof the compression stroke which show a mean bulktumble motion occurring in the cylinder. The majorfeatures of the flow are similar for all three enginespeeds tested. The majority of the intake air isinducted over the top of the intake valves thentravels from right to left across the top of thecylinder head before the interaction with the cylinderliner forces the flow to turn downwards towards thepiston crown. This change in direction causes arecirculation zone to occur in the upper left handcorner of the imaged plane, centered on image co-ordinates of approximately 52 mm by -15 mm. Fig. 7: Mean bulk flow direction during intake. This recirculation zone persists throughout the intake stroke finally degenerating around 50°ABDC. Underneath this recirculation zone, the air travels from left to right, guided by the pistoncrown. When the air which has entered from above the valve interacts with the air that has enteredto the right of the valves in the direction of the cylinder liner, a second recirculation zone can beseen in the lower right region of images near the piston crown. This recirculation zone attaches tothe piston crown and follows the piston as it descends down the liner (Fig. 7). As expected, the maximum airflow velocities are significantly influenced by engine speed, with amaximum velocity of 50 ms occurring at 3500 rpm at 90°ATDC. Air velocities were also foundto reduce substantially during the period of the intake stroke, with maximum velocities reducing toapproximately 15 ms at 180° for the 3500 rpm case. Plots of the radial velocities along the centralcylinder axis at crank angle positions of 90°, 135° and 180°are shown in Fig. 8. The flowmagnitudes can be seen to approximately scale with engine speed, although slight variations can beseen. These disturbances are probably due to wave effects in the inlet and exhaust system design. Fig. 8: Radia velocities (Vx) along cylinder axis at 750 rpm (black), 2000 rpm (blue) and 3500rpm (green) Tumble ratios, calculated from equation 1, have been plotted for the vector fields. The results,shown in Fig. 9, show that at the two lower engine speeds of 750 and 2000 rpm, the air flows scalewith engine speed during the intake stroke (Fig. 9). TUMBLE RATIO AGAINST CRANKANGLE FOR 750,2000, AND 3500 RPM Crank Angle(deg) Fig. 9: Tumble ratio against crank angle for 750, 2000 and 3500 rpm However, at the highest engine speed, there is a significant deviation during the period from 95°to160°. It is apparent that a different flow regime exists in the engine at this speed. A visual analysisof the vector fields shows that at this engine speed the second recirculation zone in the lower righthand corner of the images does not fully attach itself to the top of the piston crown. The centre ofthe vortex is higher and further to the right of the cylinder, allowing a greater proportion of air totravel underneath the recirculation zone and along the piston crown. As the tumble ratio is onlycalculated on the region of interest of the camera, this change in the vector pattern is responsible forthe variations seen in the tumble ratio. Fig. 10: Vortex centres at 90° The collection of PIV data at higher engine speed was made more difficult due to the reduced timeperiod in which data could be collected before the optical cylinder liner was contaminated with droplets from the seeding particles, and oil from the crankcase oil and hydraulic valve train. The incylinder droplets were found to contaminate the sapphire piston window, and crankcase oil dropletscontaminate the divergent lens, much more readily as the engine speed was increased. Droplets onthe sapphire window caused striations of the light sheet and variations in light intensity. Seeding ofthe engine became more difficult as the engine speed increased due to the wave dynamics in theengine intake system becoming more influential. Higher engine speeds also resulted in a widervelocity range occurring in the cylinder. This made selection ofan appropriate interframe time moredifficult. A multipass cross correlation algorithm was found to be useful in overcoming thisproblem. It was found to be important, however, that the first pass achieved as accurate a vectorfield as possible, to allow the window shifts for the smaller interrogation area to be of the correctorder. As such, a second order correlation was used on the first pass and two passes were made.This was found to significantly improve the consistency of the results. The signal to noise ratio wasalso improved by subtracting the mean background intensity of the first five images. This wasfound to be particularly effective in reducing the background noise and improving the vector fielddata. Vectors with a signal to noise ratio of less than 1.5 were deemed unacceptable. The mosteffective processing technique was found to be the median filter based on flow continuity. Despiterelatively strict tolerances on this technique, over 80% first choice vectors were achieved, with themajority of the remainder being accounted for by the second highest correlation peak. The finalvalidation technique was a distortion of the first image by the calculated vector field. Correctalignment of the particles was used as a confirmation of an accurate vector field. 6.Conclusions 2D PIV measurements have been made on the vertical symmetrical plane during the latter half ofthe inlet stroke and early compression stroke for engine speeds of 750, 2000 and 3500 rpm. Meanvector fields of 51 images have been produced for a 42 by 34 mm area on the vertical symmetryplane between the inlet valves. The vector fields show the flow velocities approximately scale asengine speed increases. However, a change in the tumble ratio occurs between 750 and 3500 rpm asa recirculation vortex becomes detached from the descending piston at the higher engine speed. 7.. IReferences L.Jarvis, S., Justham, T., Clarke, A., Garner, C., Hargrave,G., Halliwell, N., (2005) "TimeResolved Digital PIV Measurements of Flow Field Cyclic Variation in an Optical ICEngine”2d Int. Conf. on Opt. and Laser Diag. (ICOLAD), 11-14 September 2005,,CityUniversity, London 2. Towers, D.P., Towers C. E.,(2004), “Cyclic variability measurements ofin-cylinderengine flows using high-speed particle image velocimetry”, Meas. Sci. Technol. 15,pp.1917-1925 3. Li, Y., Zhao,H., Peng, Z., Ladommatos, N., (2002)“Tumbling flow analysis in a fourvalve spark ignition engine using particle image velocimetry." Int. J. Eng. Res.,Volume3,Number 3, 1, pp.139-155(17) 4. Dierksheide, U., Meyer,P., Hovestadt,T., Hentschel, W., (2002)“Endoscopic 2Dparticle image velocimetry (PIV) flow field measurements in IC engines”, Experiments inFluidsls 3 333, pp.794-800 5. Pitcher, G., Wigley,G..,“LDA Analysis of the Tumble Flow Generated in a Motored 4Valve Engine”, Laser Anemometry-Advances and Applications,EALA, Limerick , Sep2001. - - --
确定
还剩10页未读,是否继续阅读?

产品配置单


北京欧兰科技发展有限公司为您提供《真实发动机,缸内流动结构,发动机中流场,速度场检测方案(粒子图像测速)》,该方案主要用于汽车电子电器中其他检测,参考标准--,《真实发动机,缸内流动结构,发动机中流场,速度场检测方案(粒子图像测速)》用到的仪器有德国LaVision PIV/PLIF粒子成像测速场仪、汽车发动机多参量测试系统、LaVision HighSpeedStar 高帧频相机
推荐专场


相关方案
更多
该厂商其他方案
更多