


LaVision公司特色的以图像增强器为核心部件构成的平面激光诱导荧光(PLIF)测试系统结合计算流体力学(CFD)方法用于新一代汽油直喷发动机的设计和优化。
方案详情

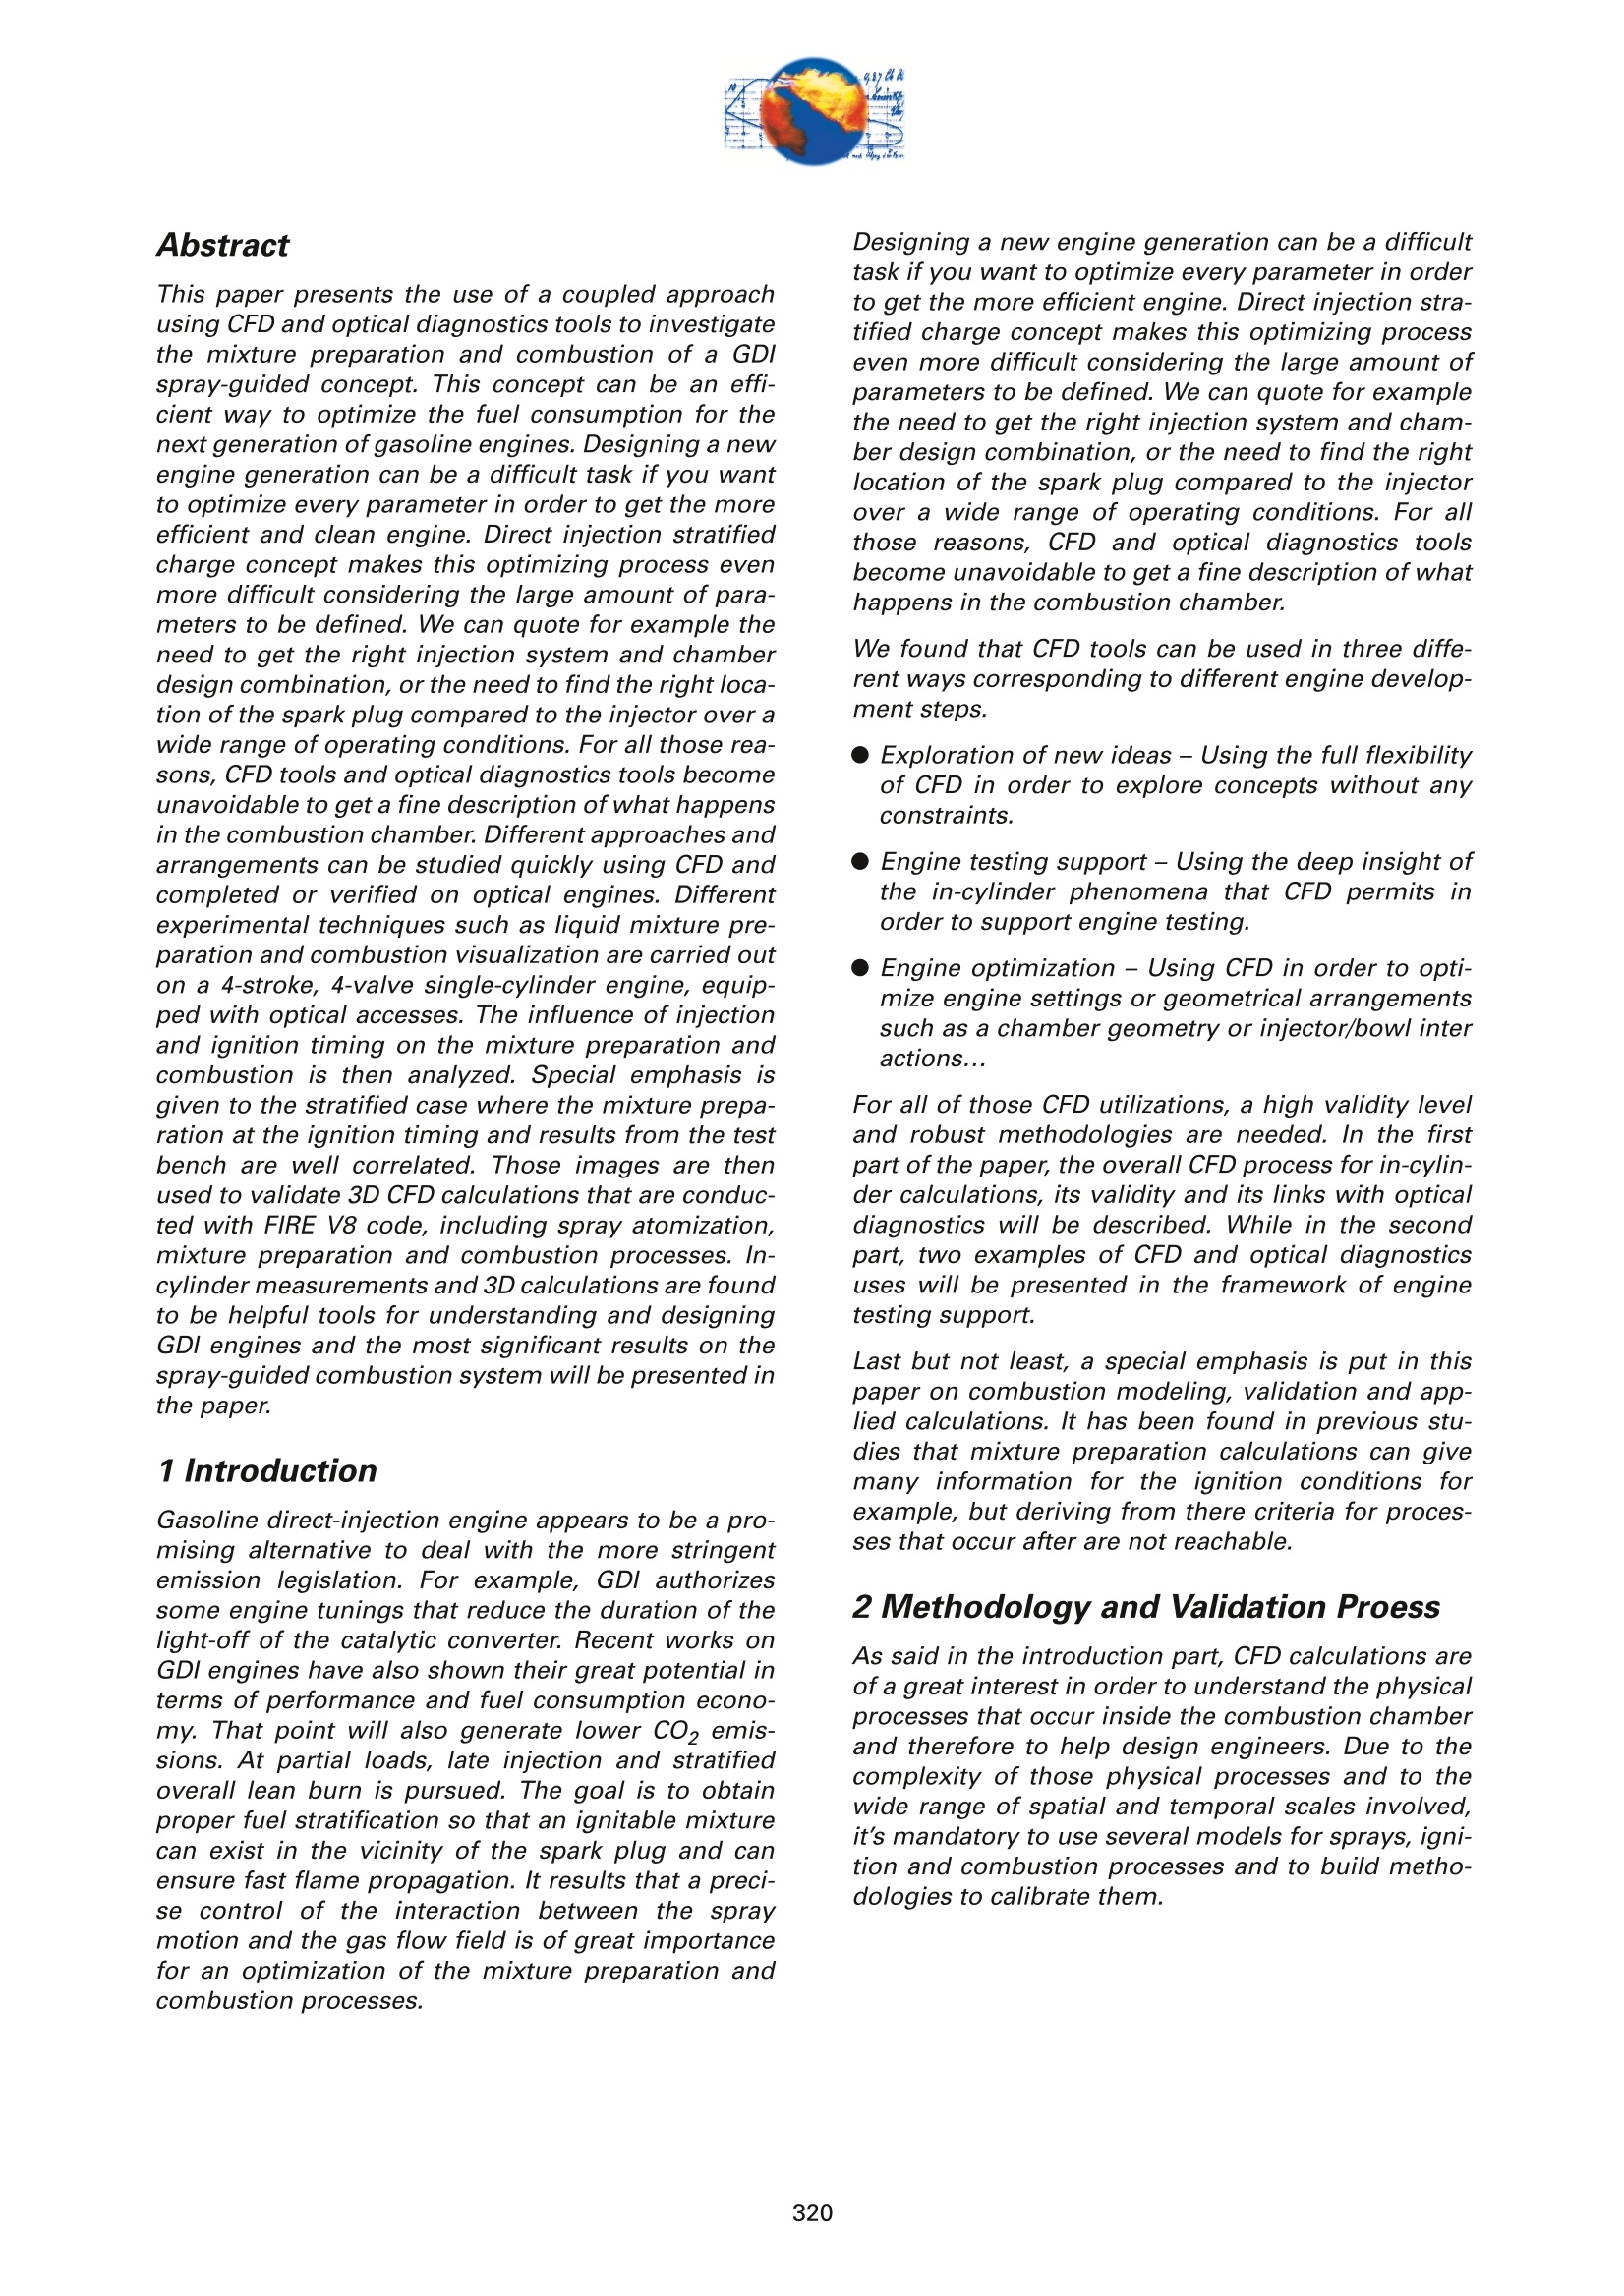
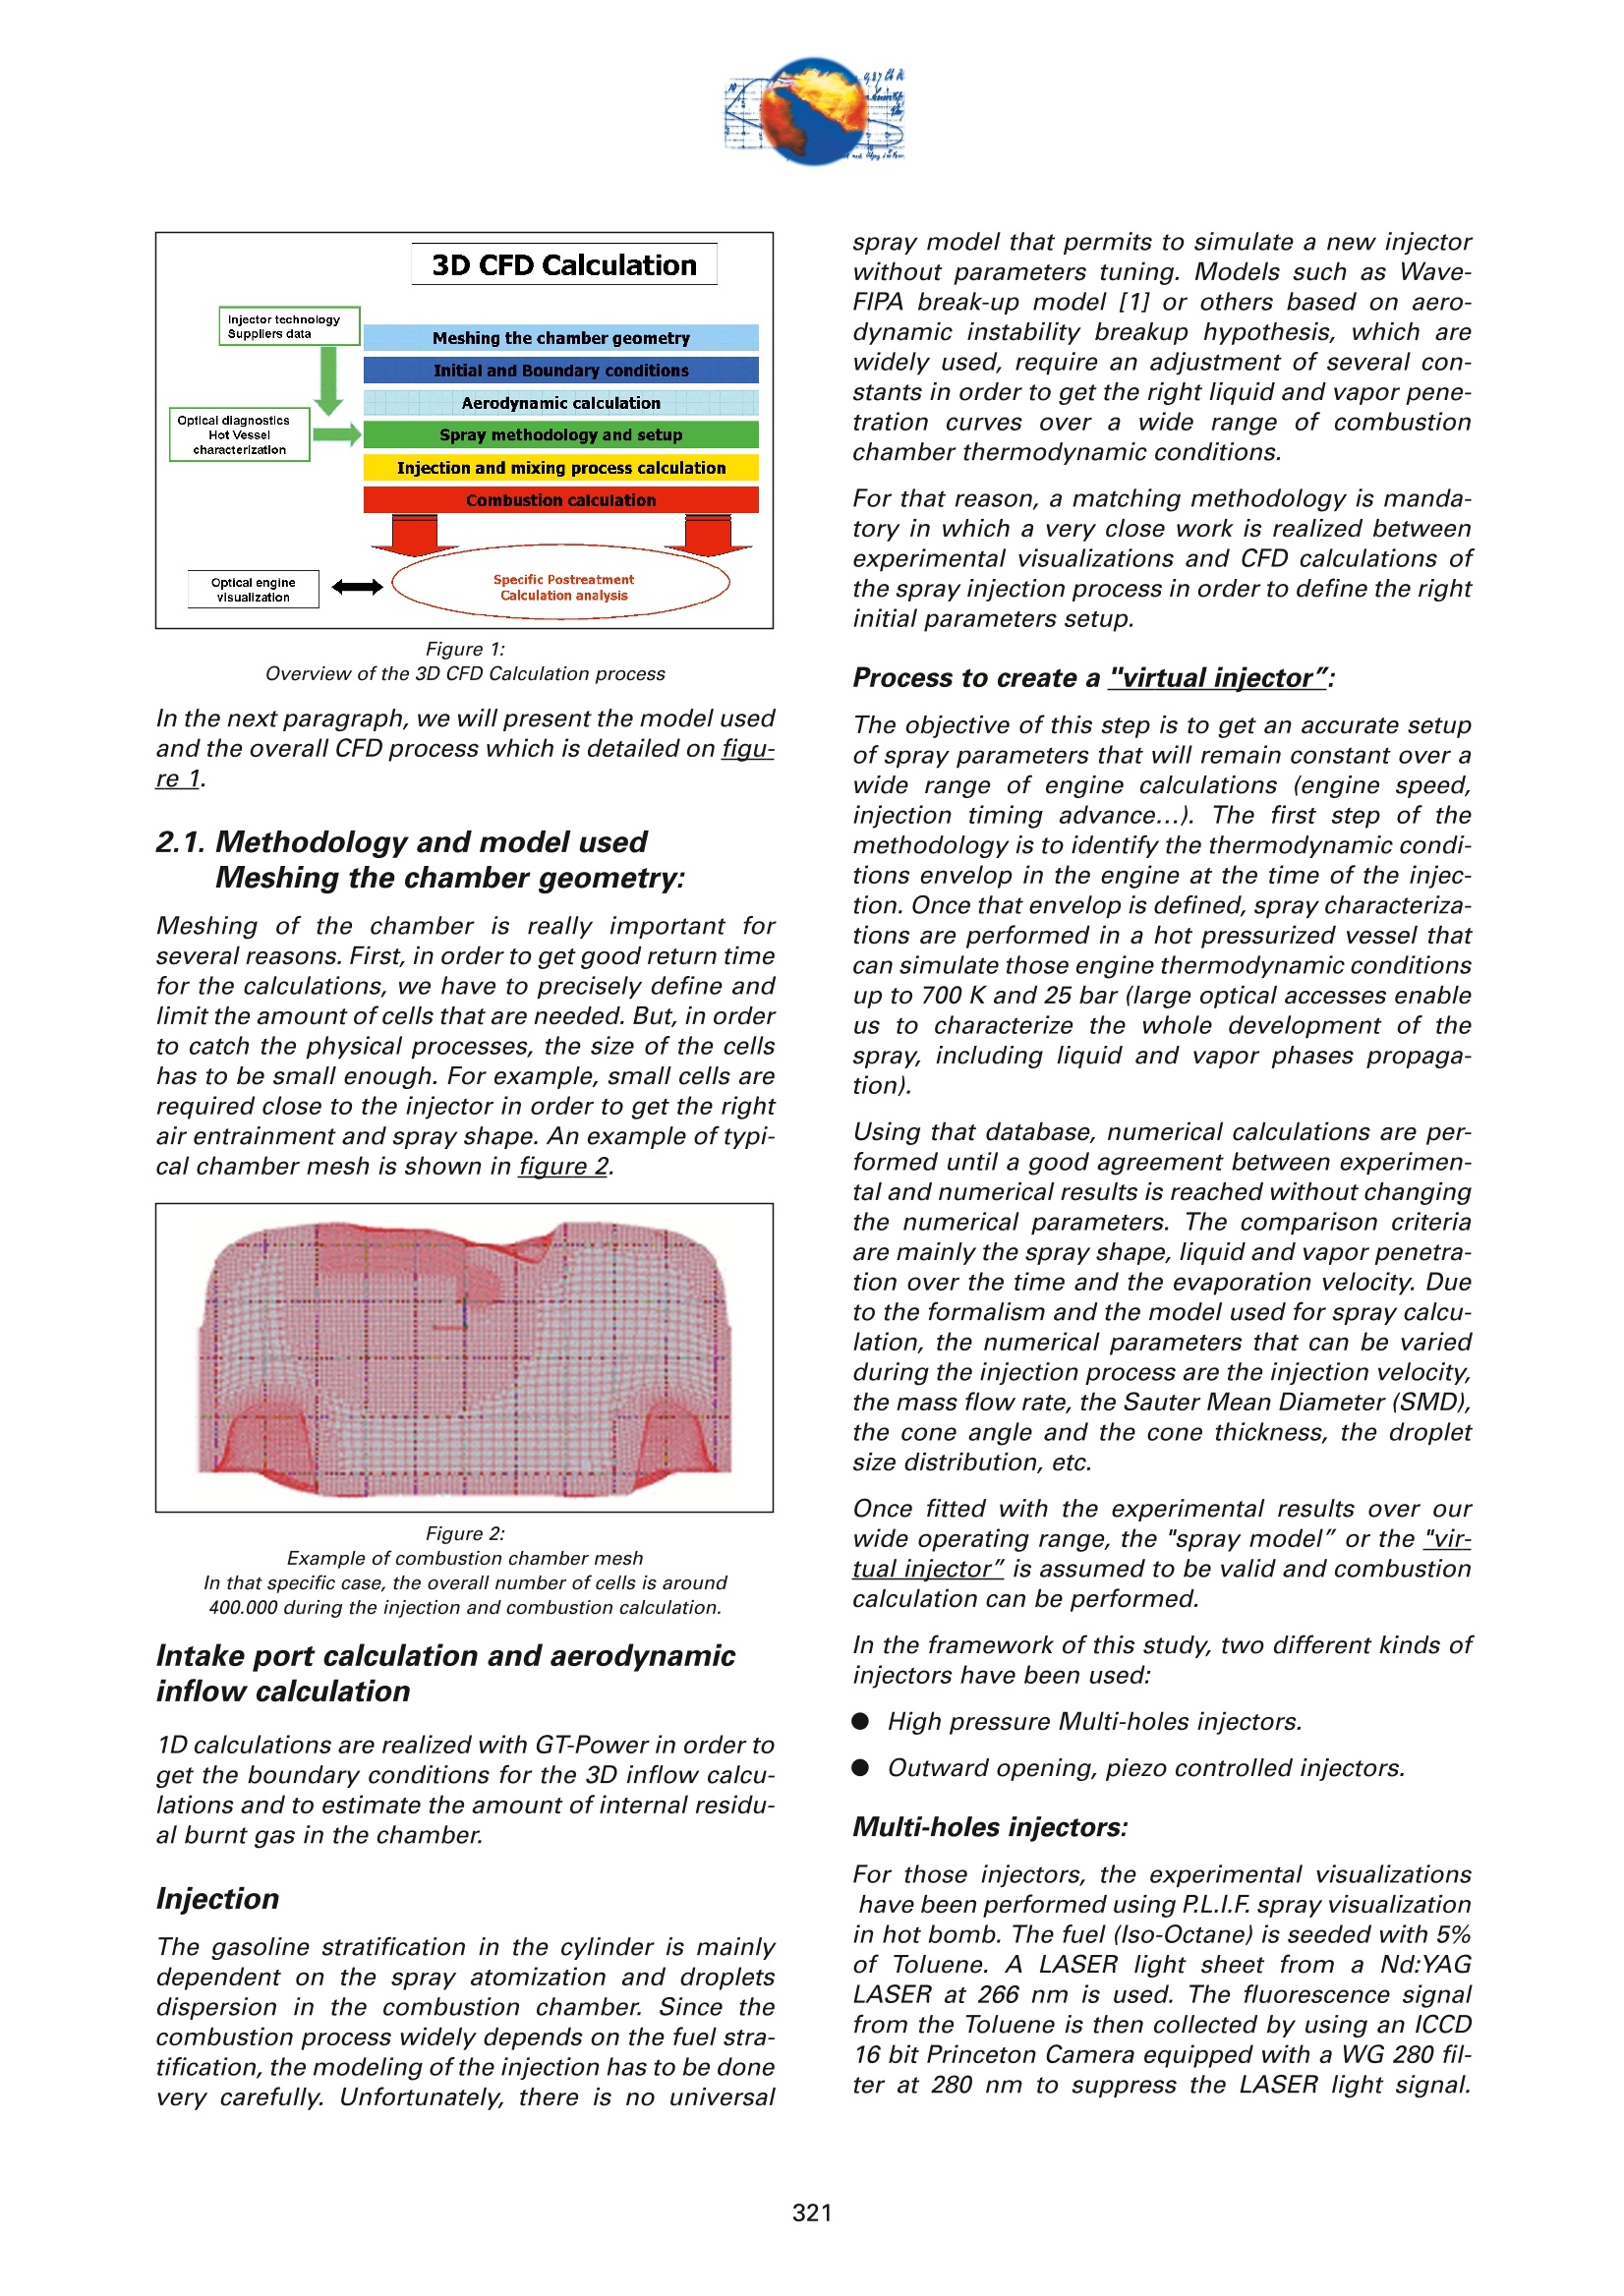
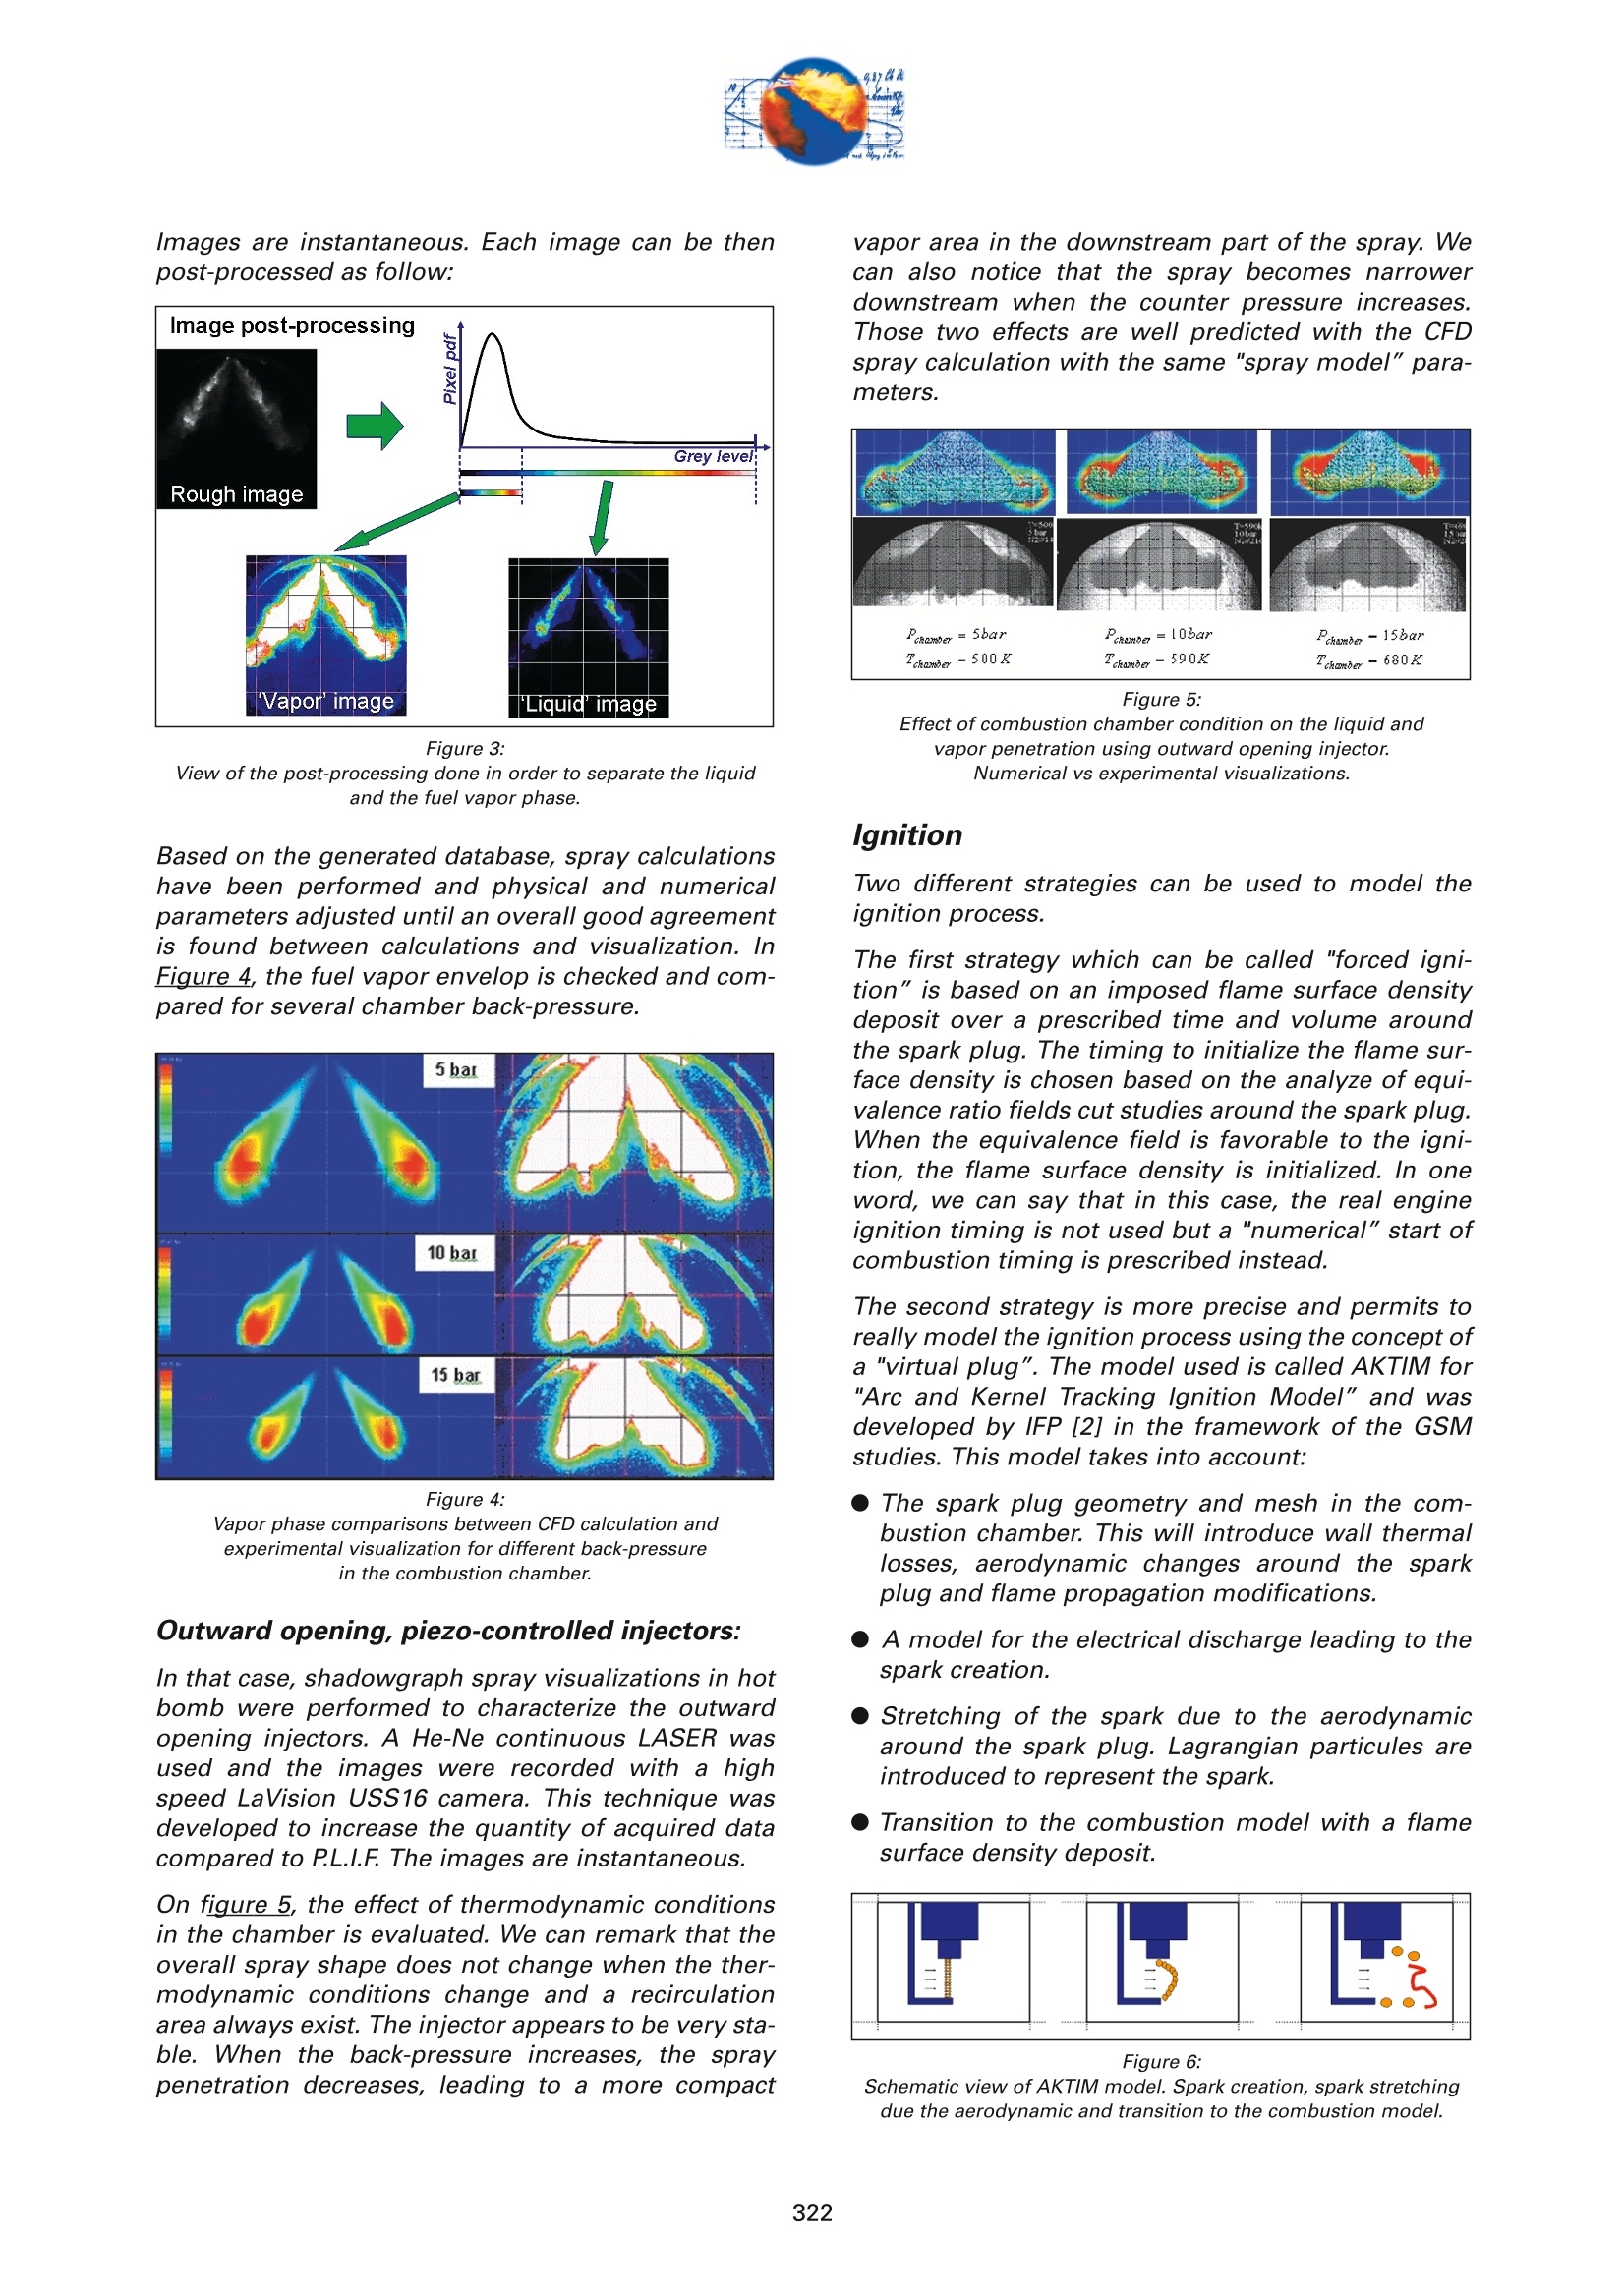
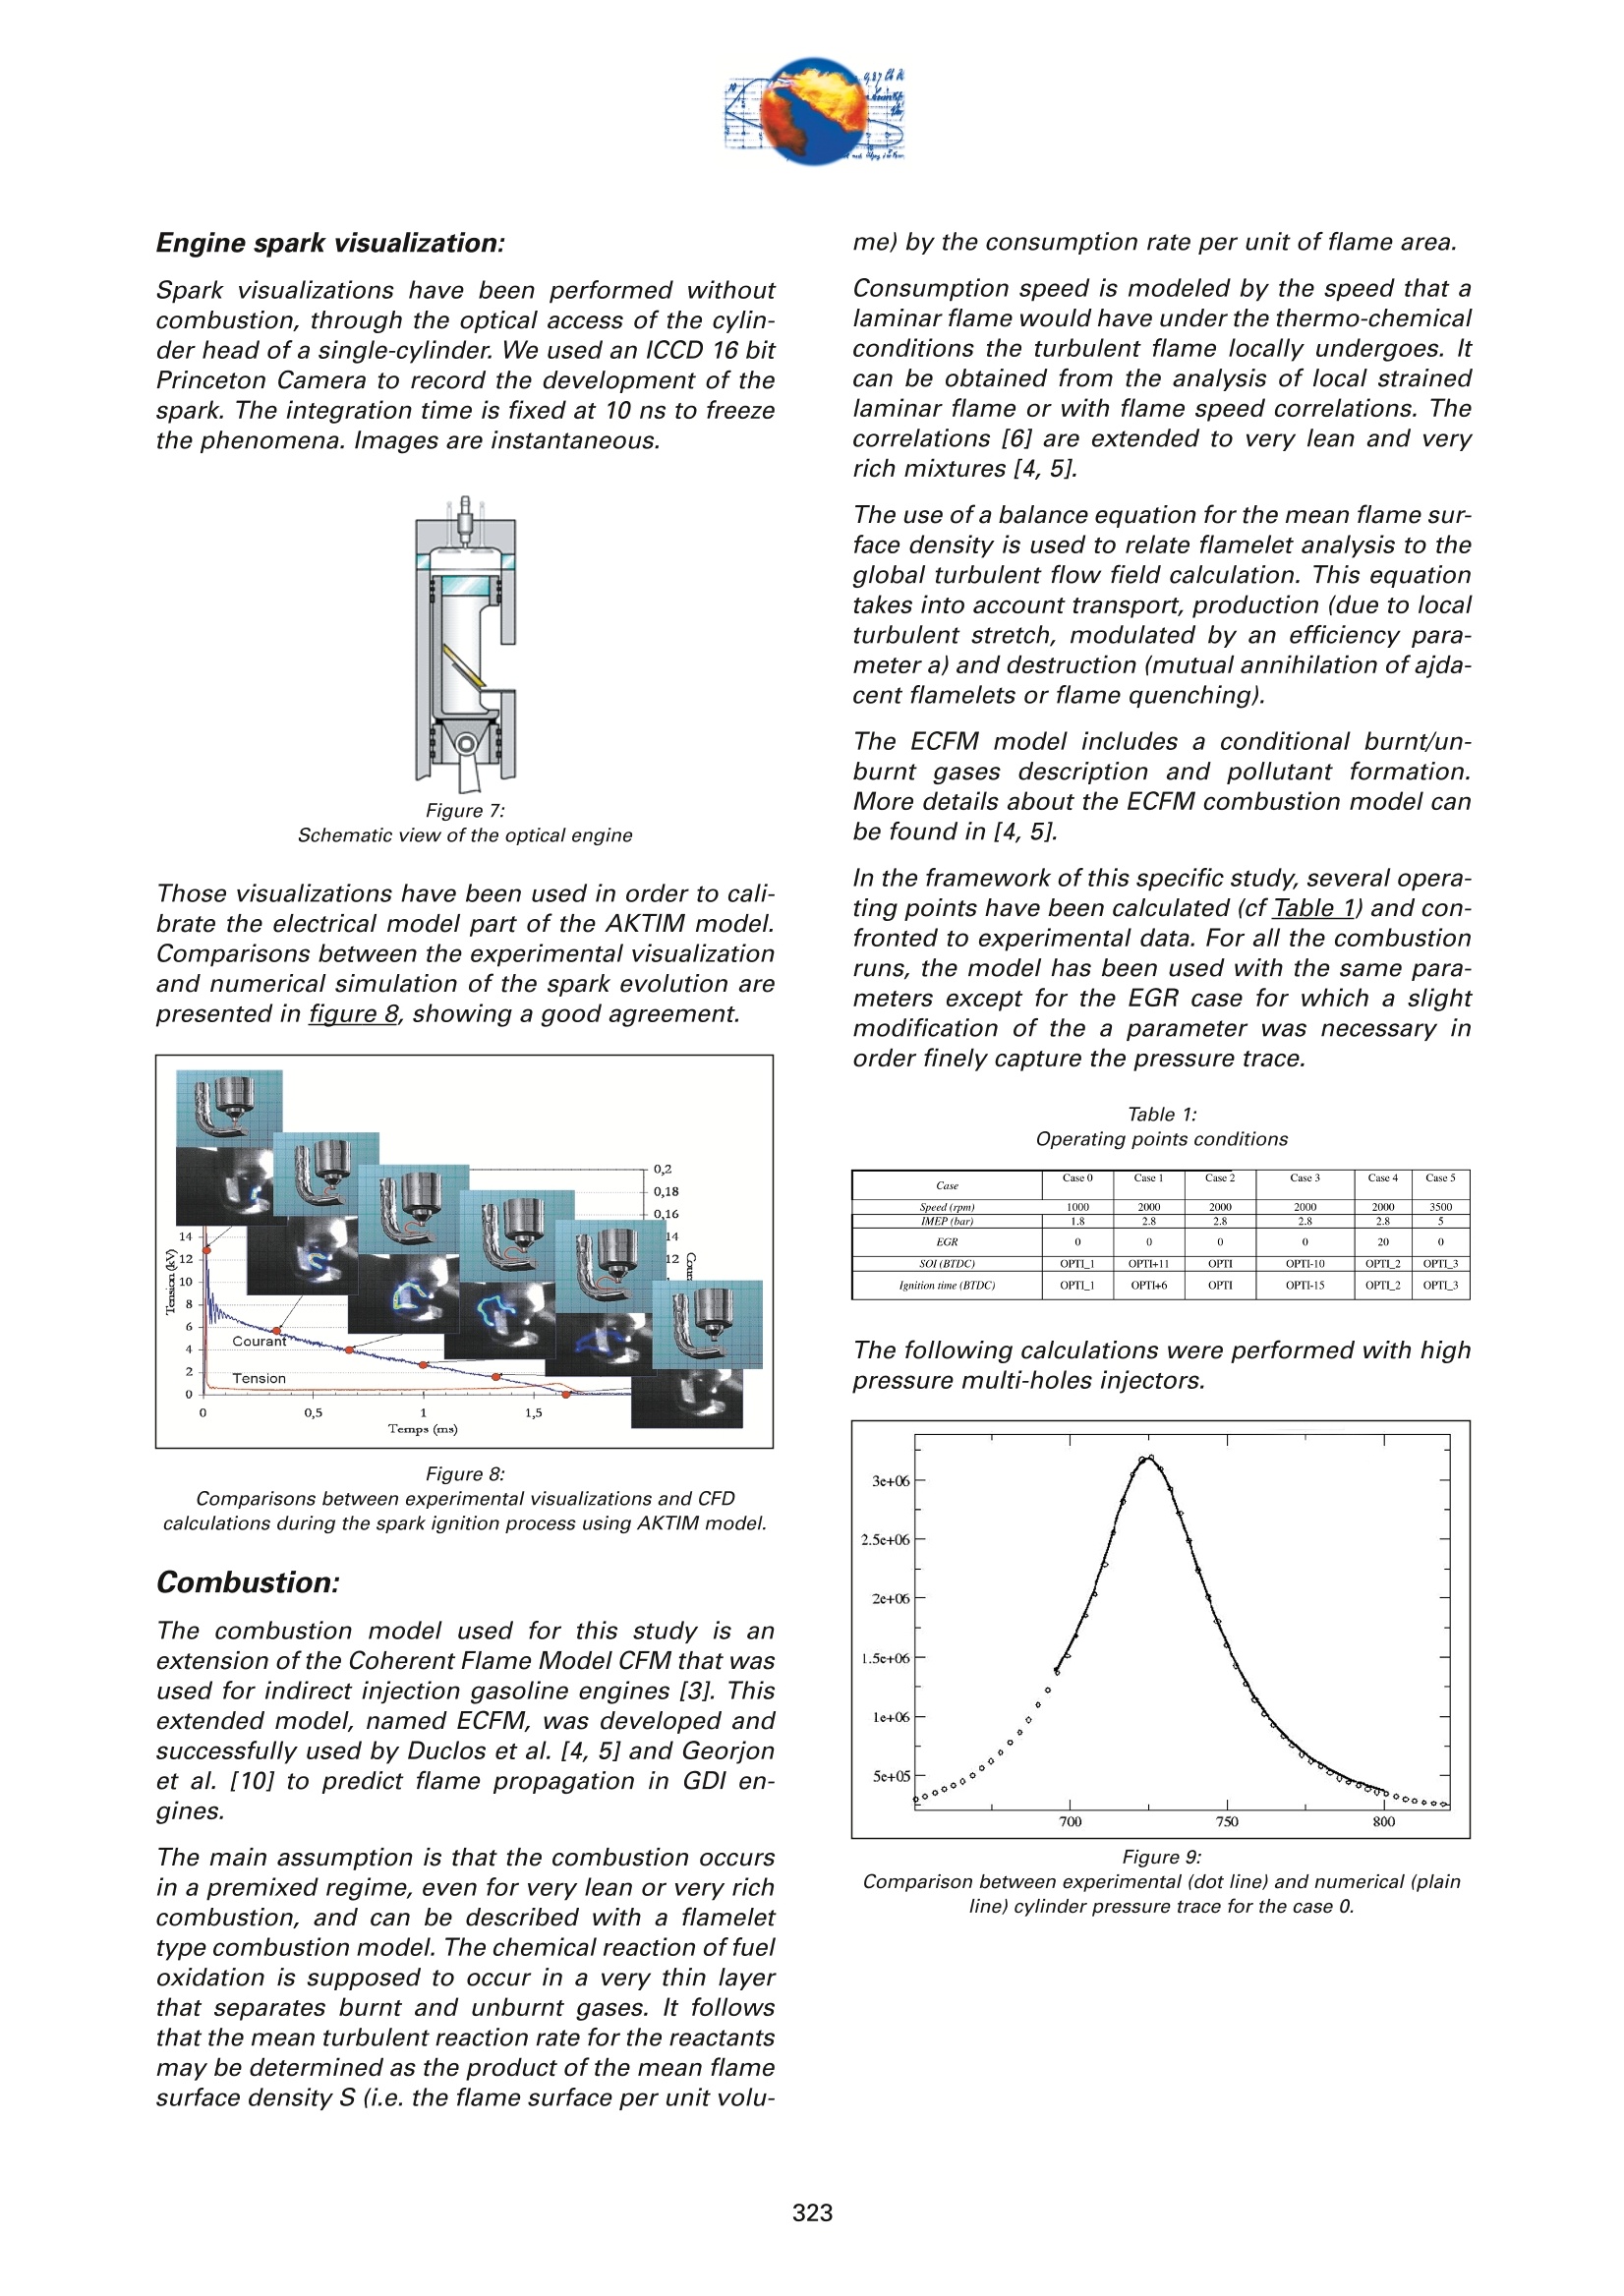
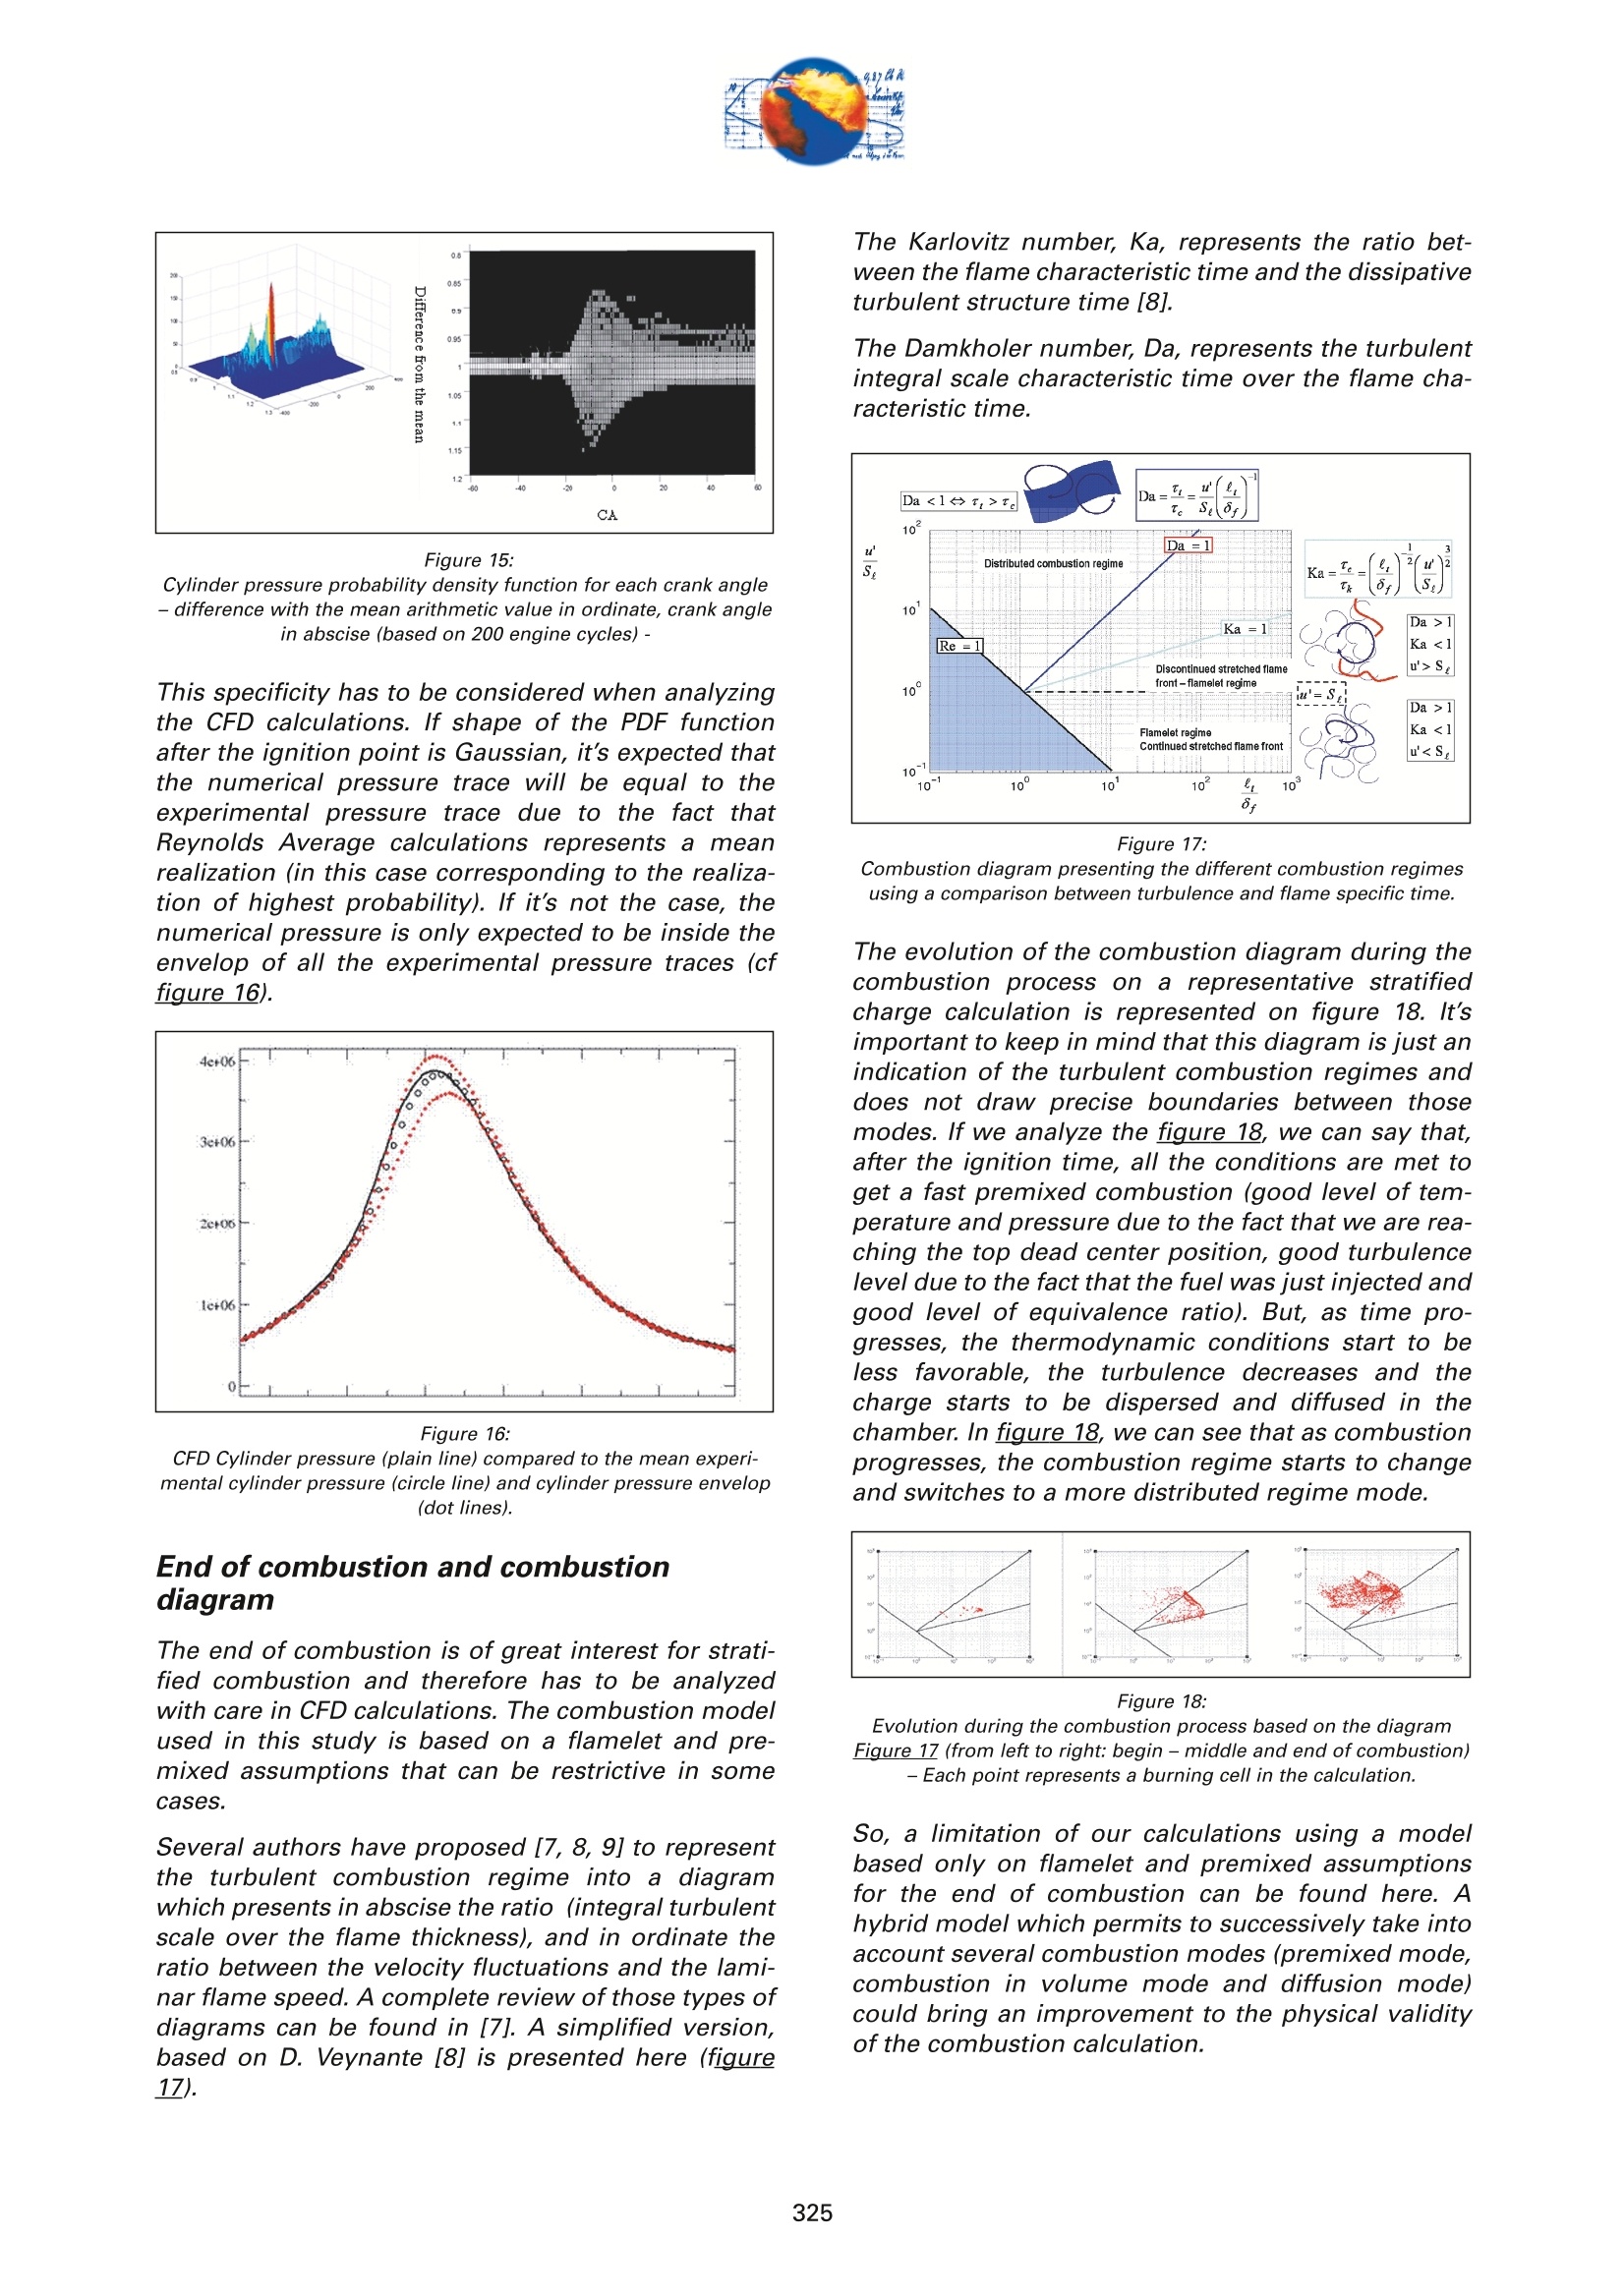
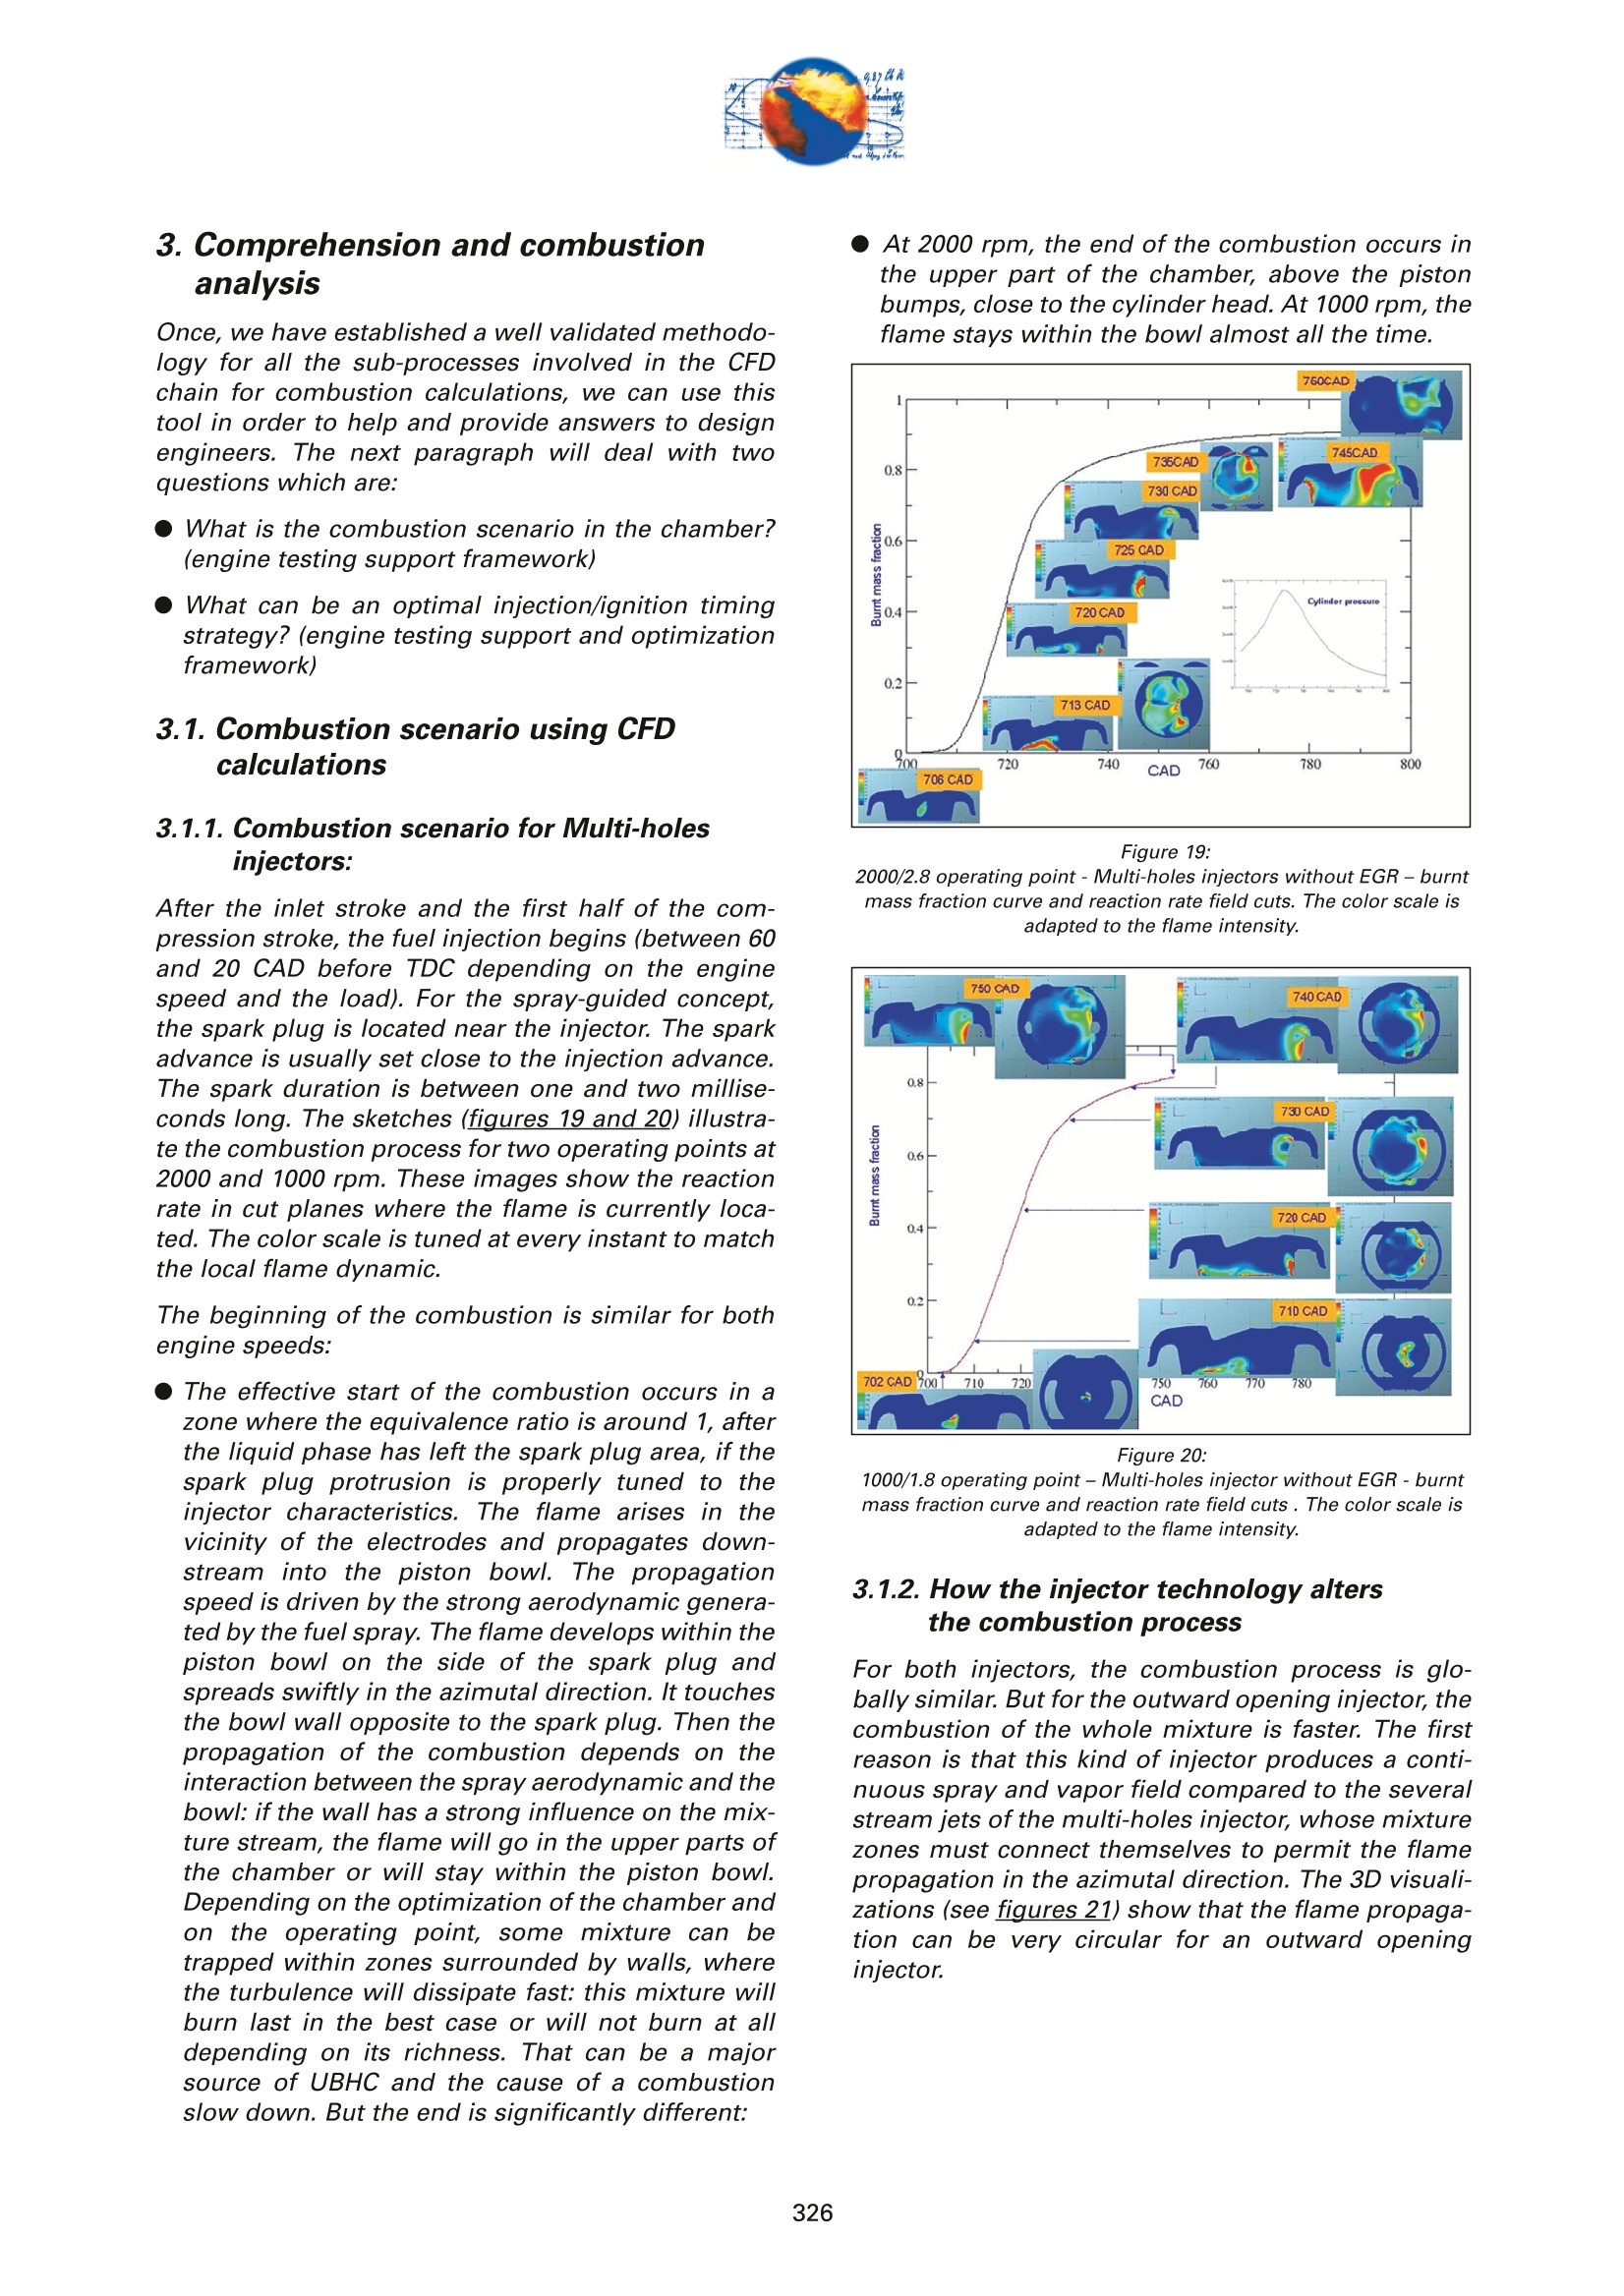
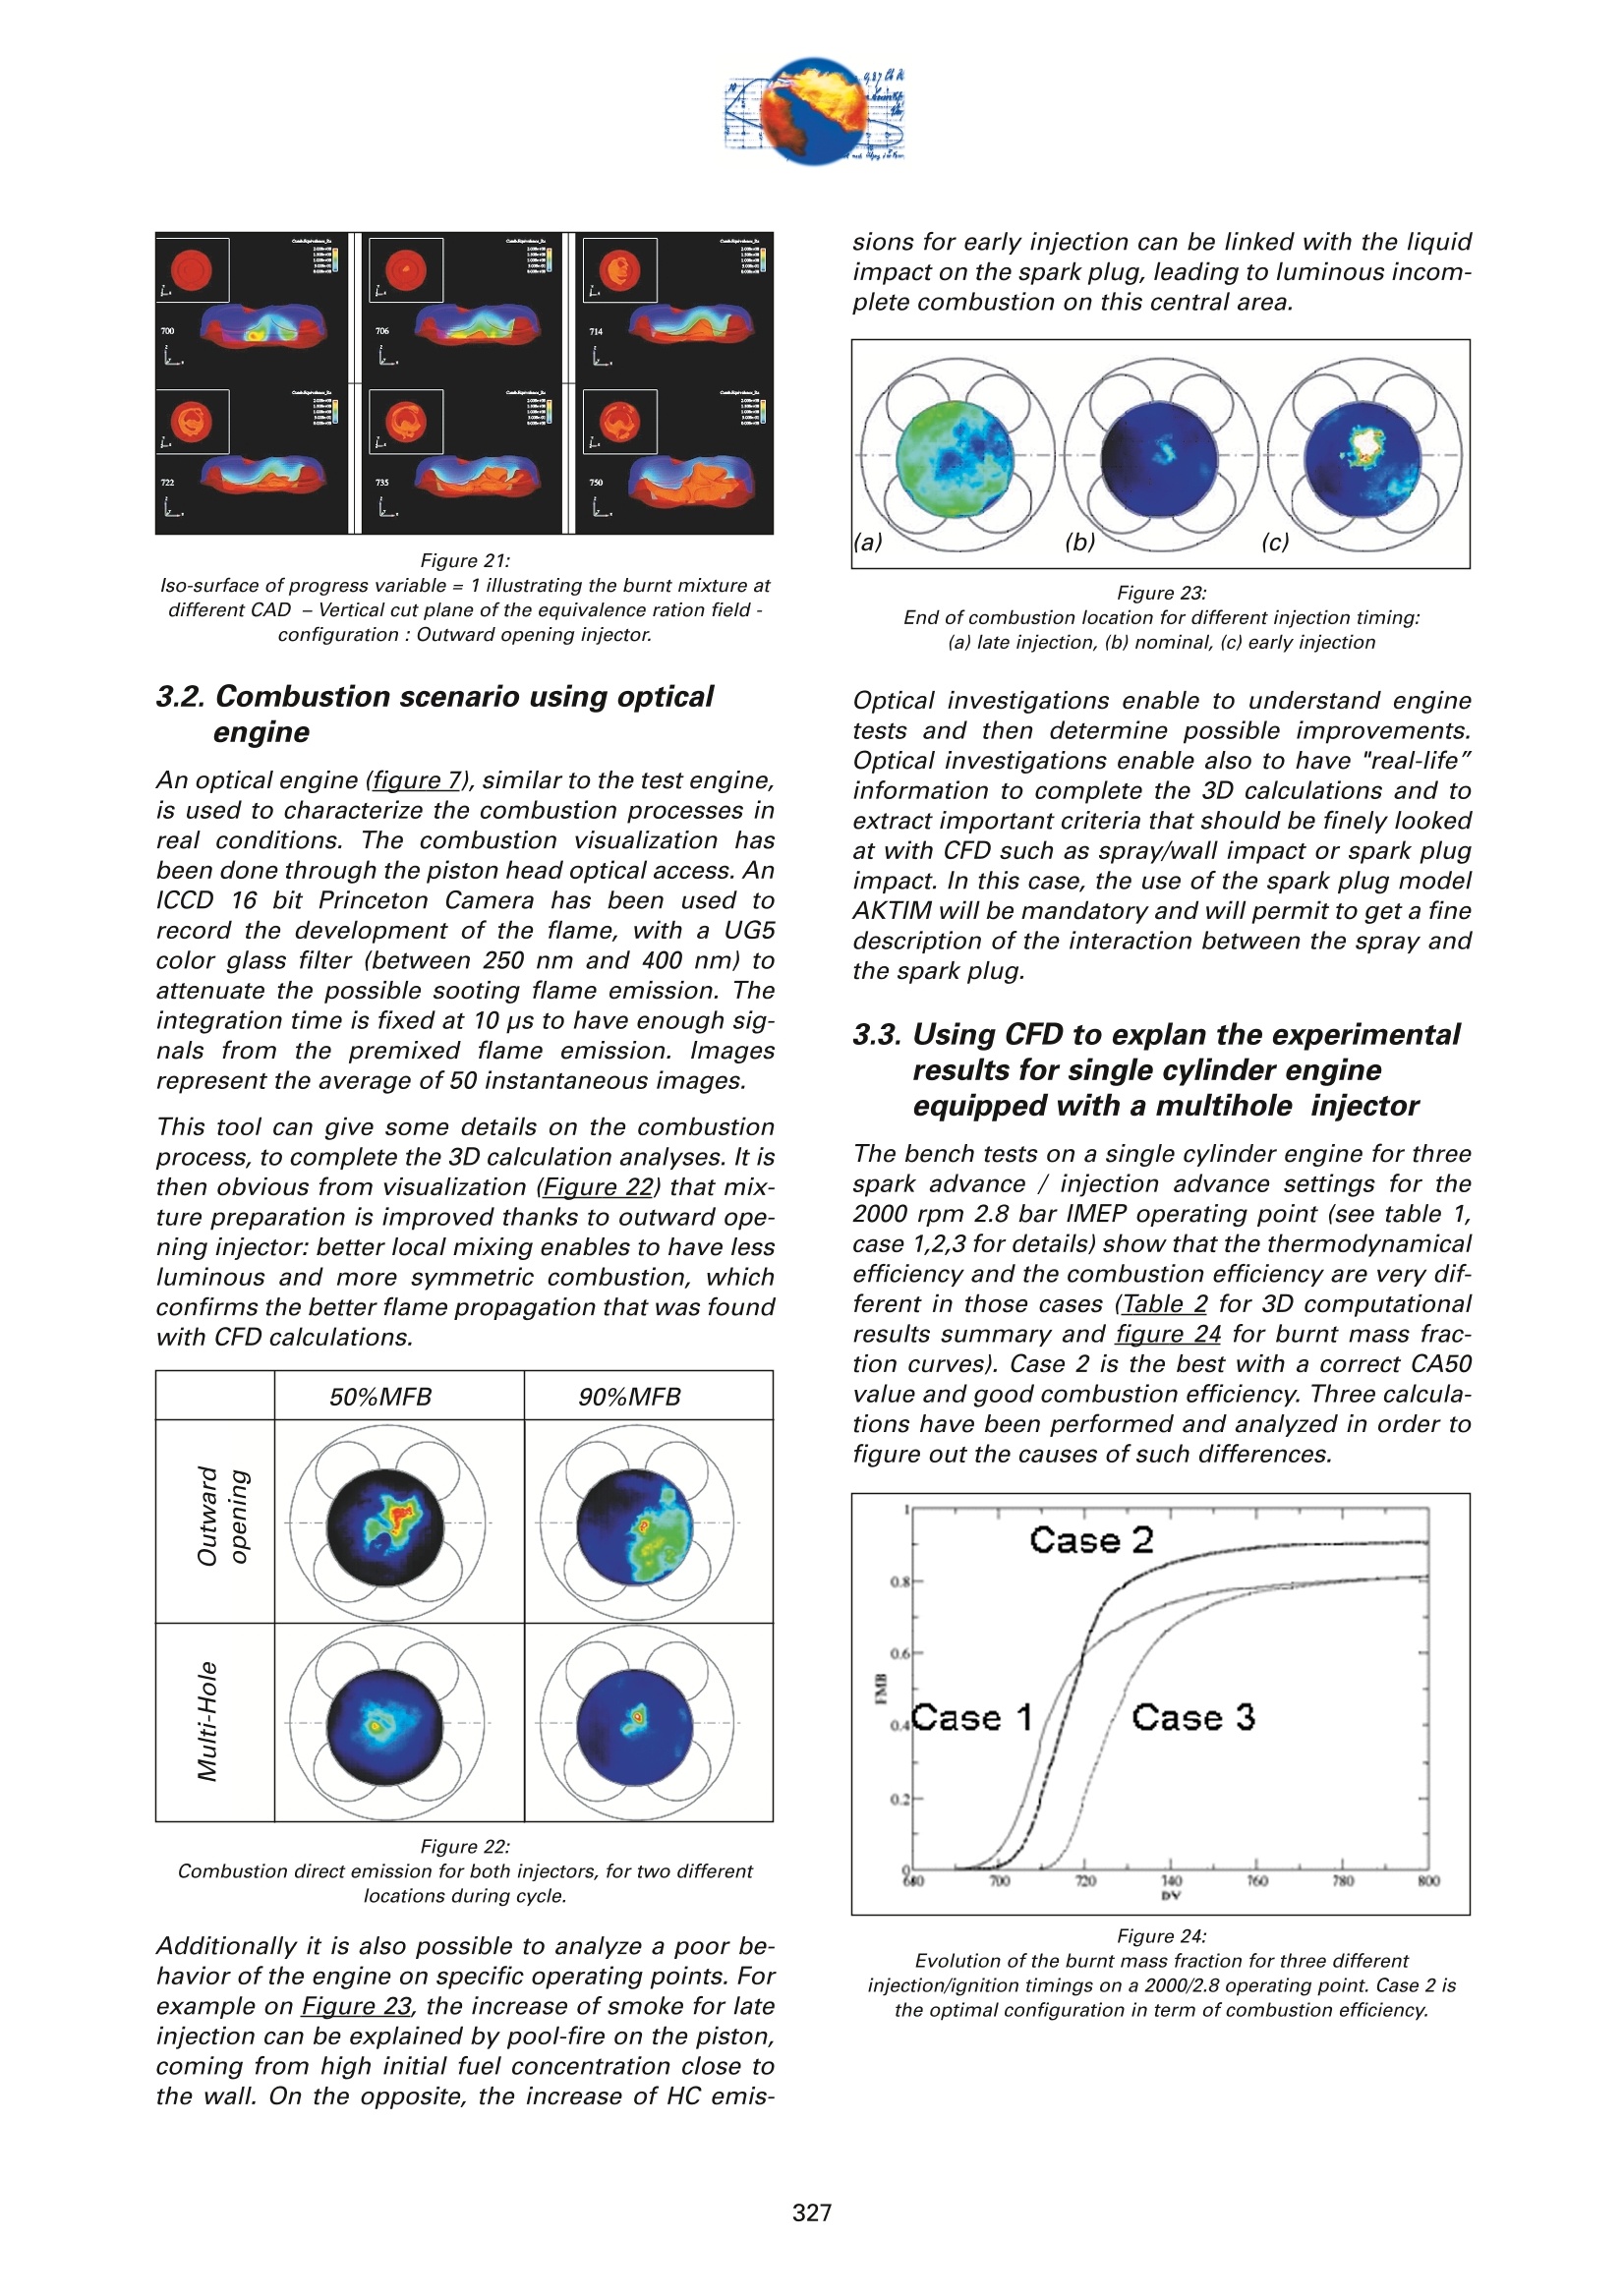
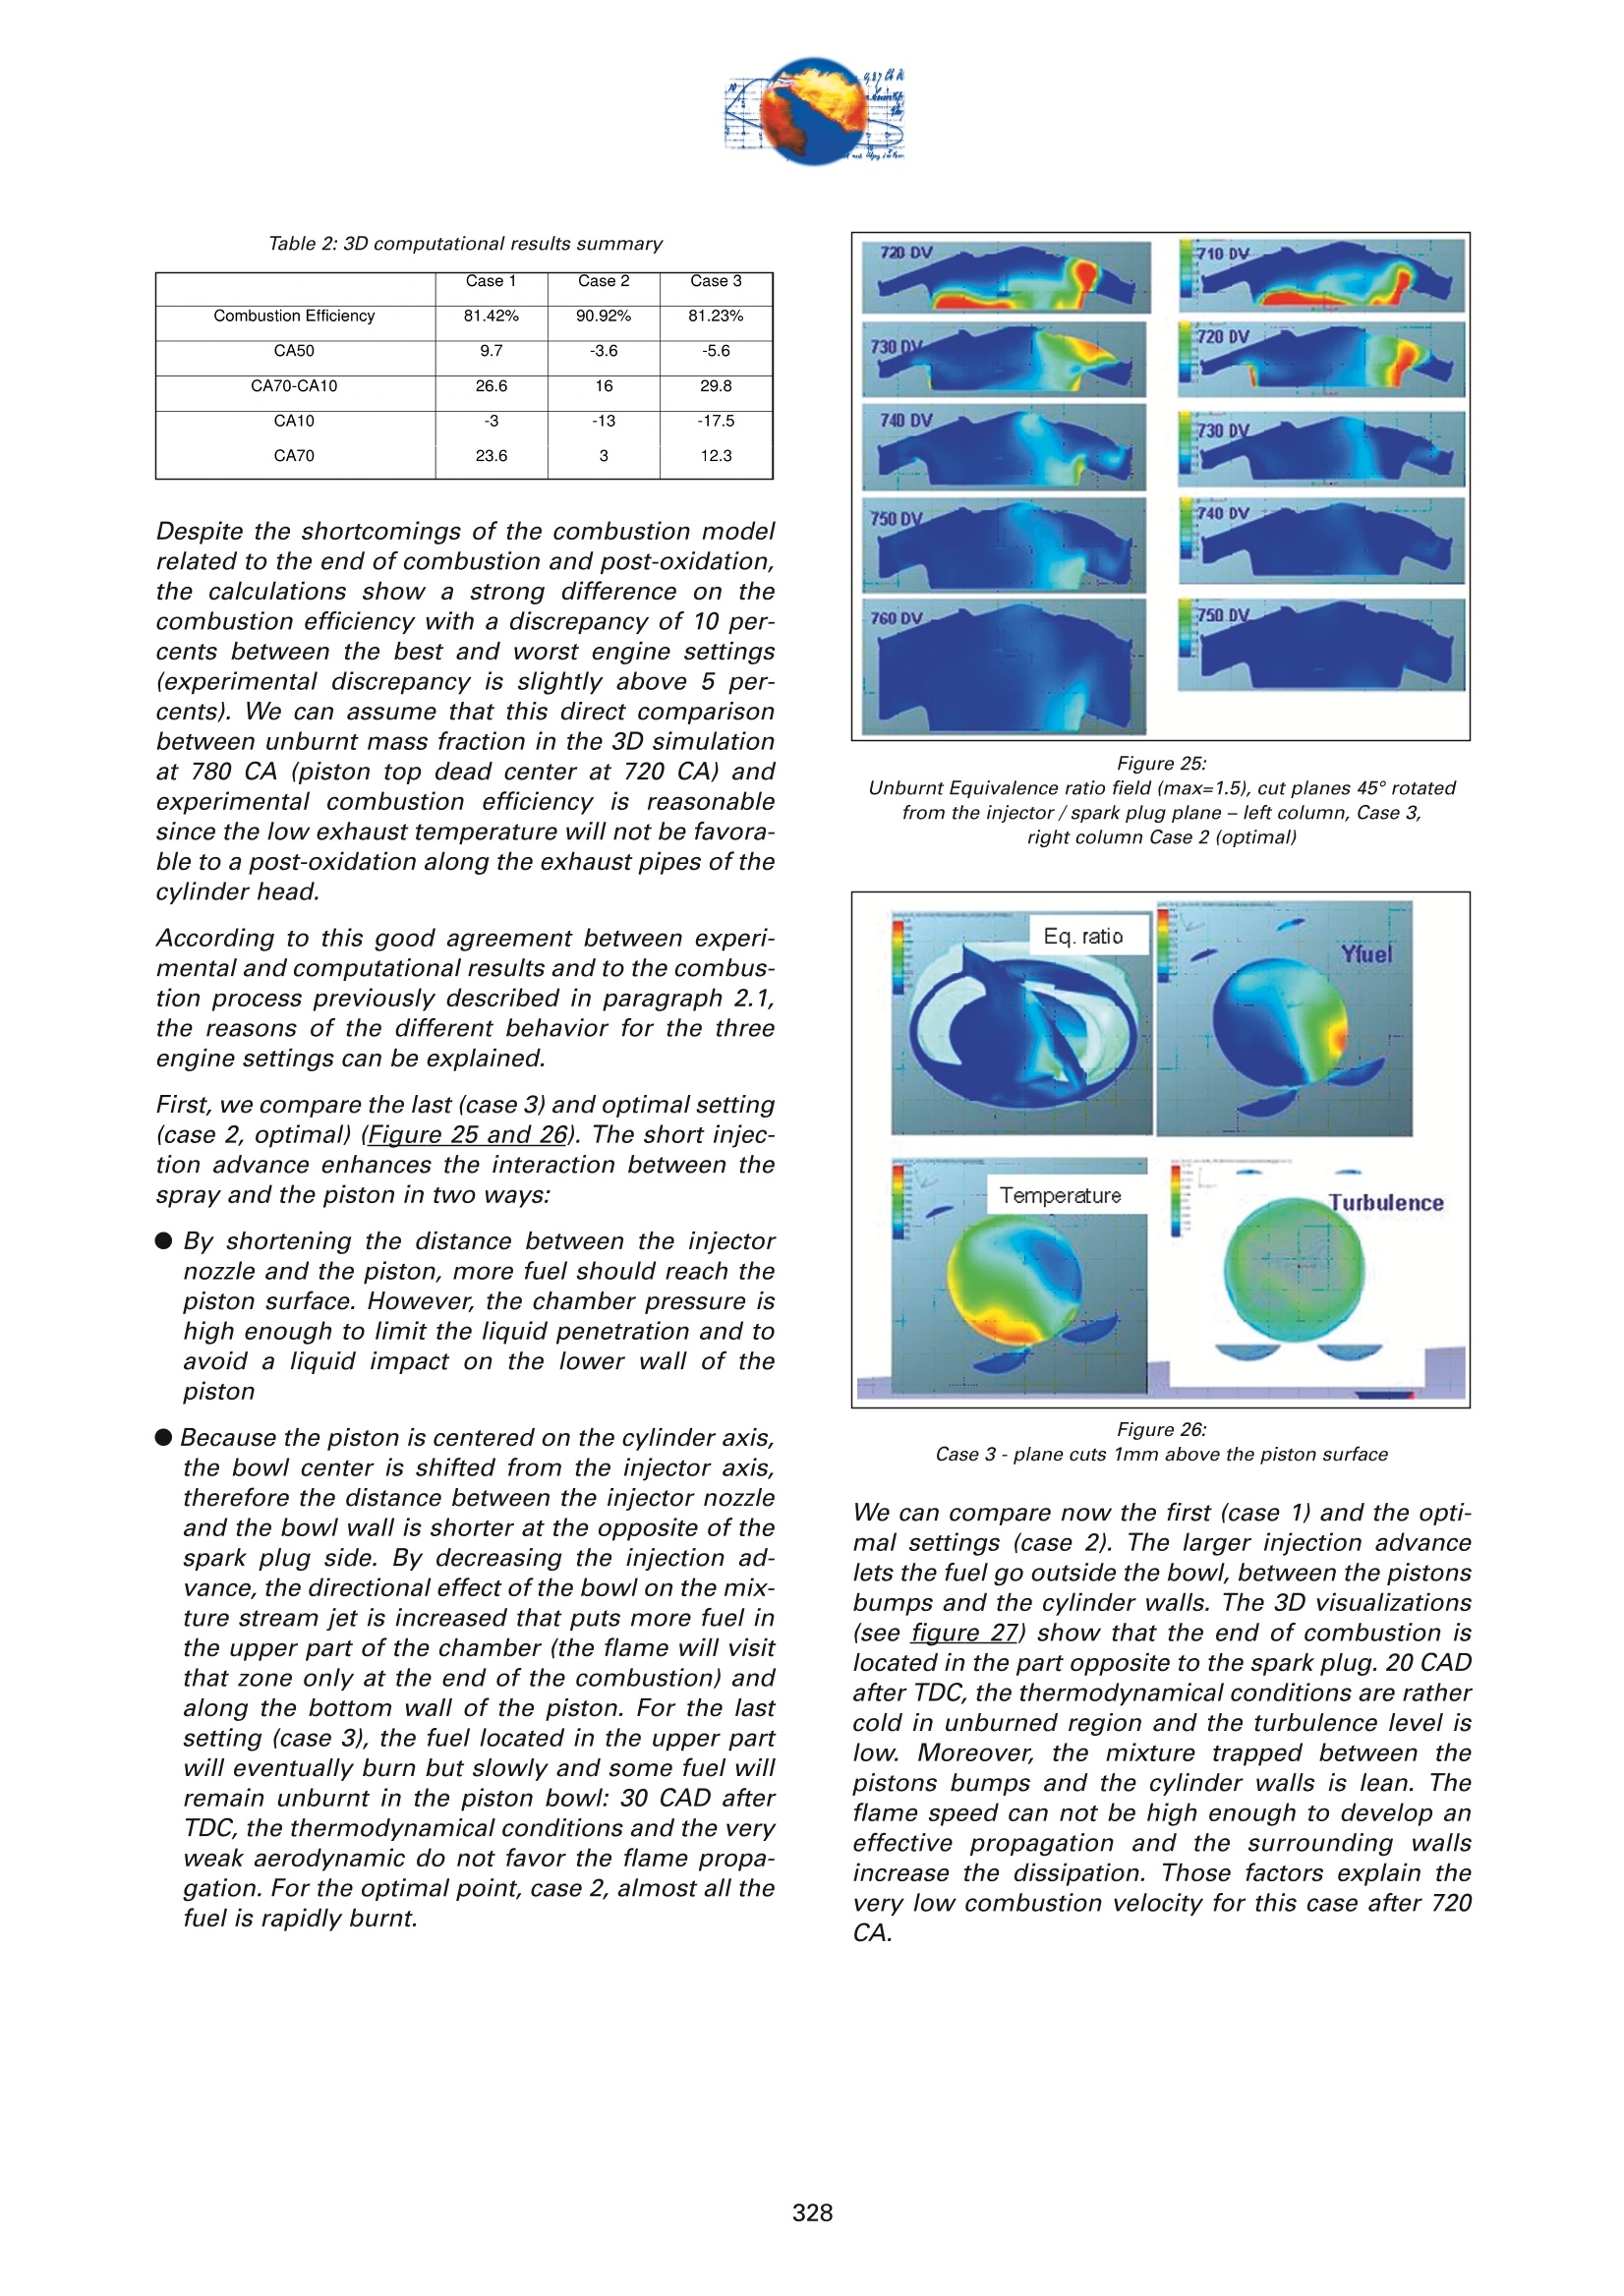
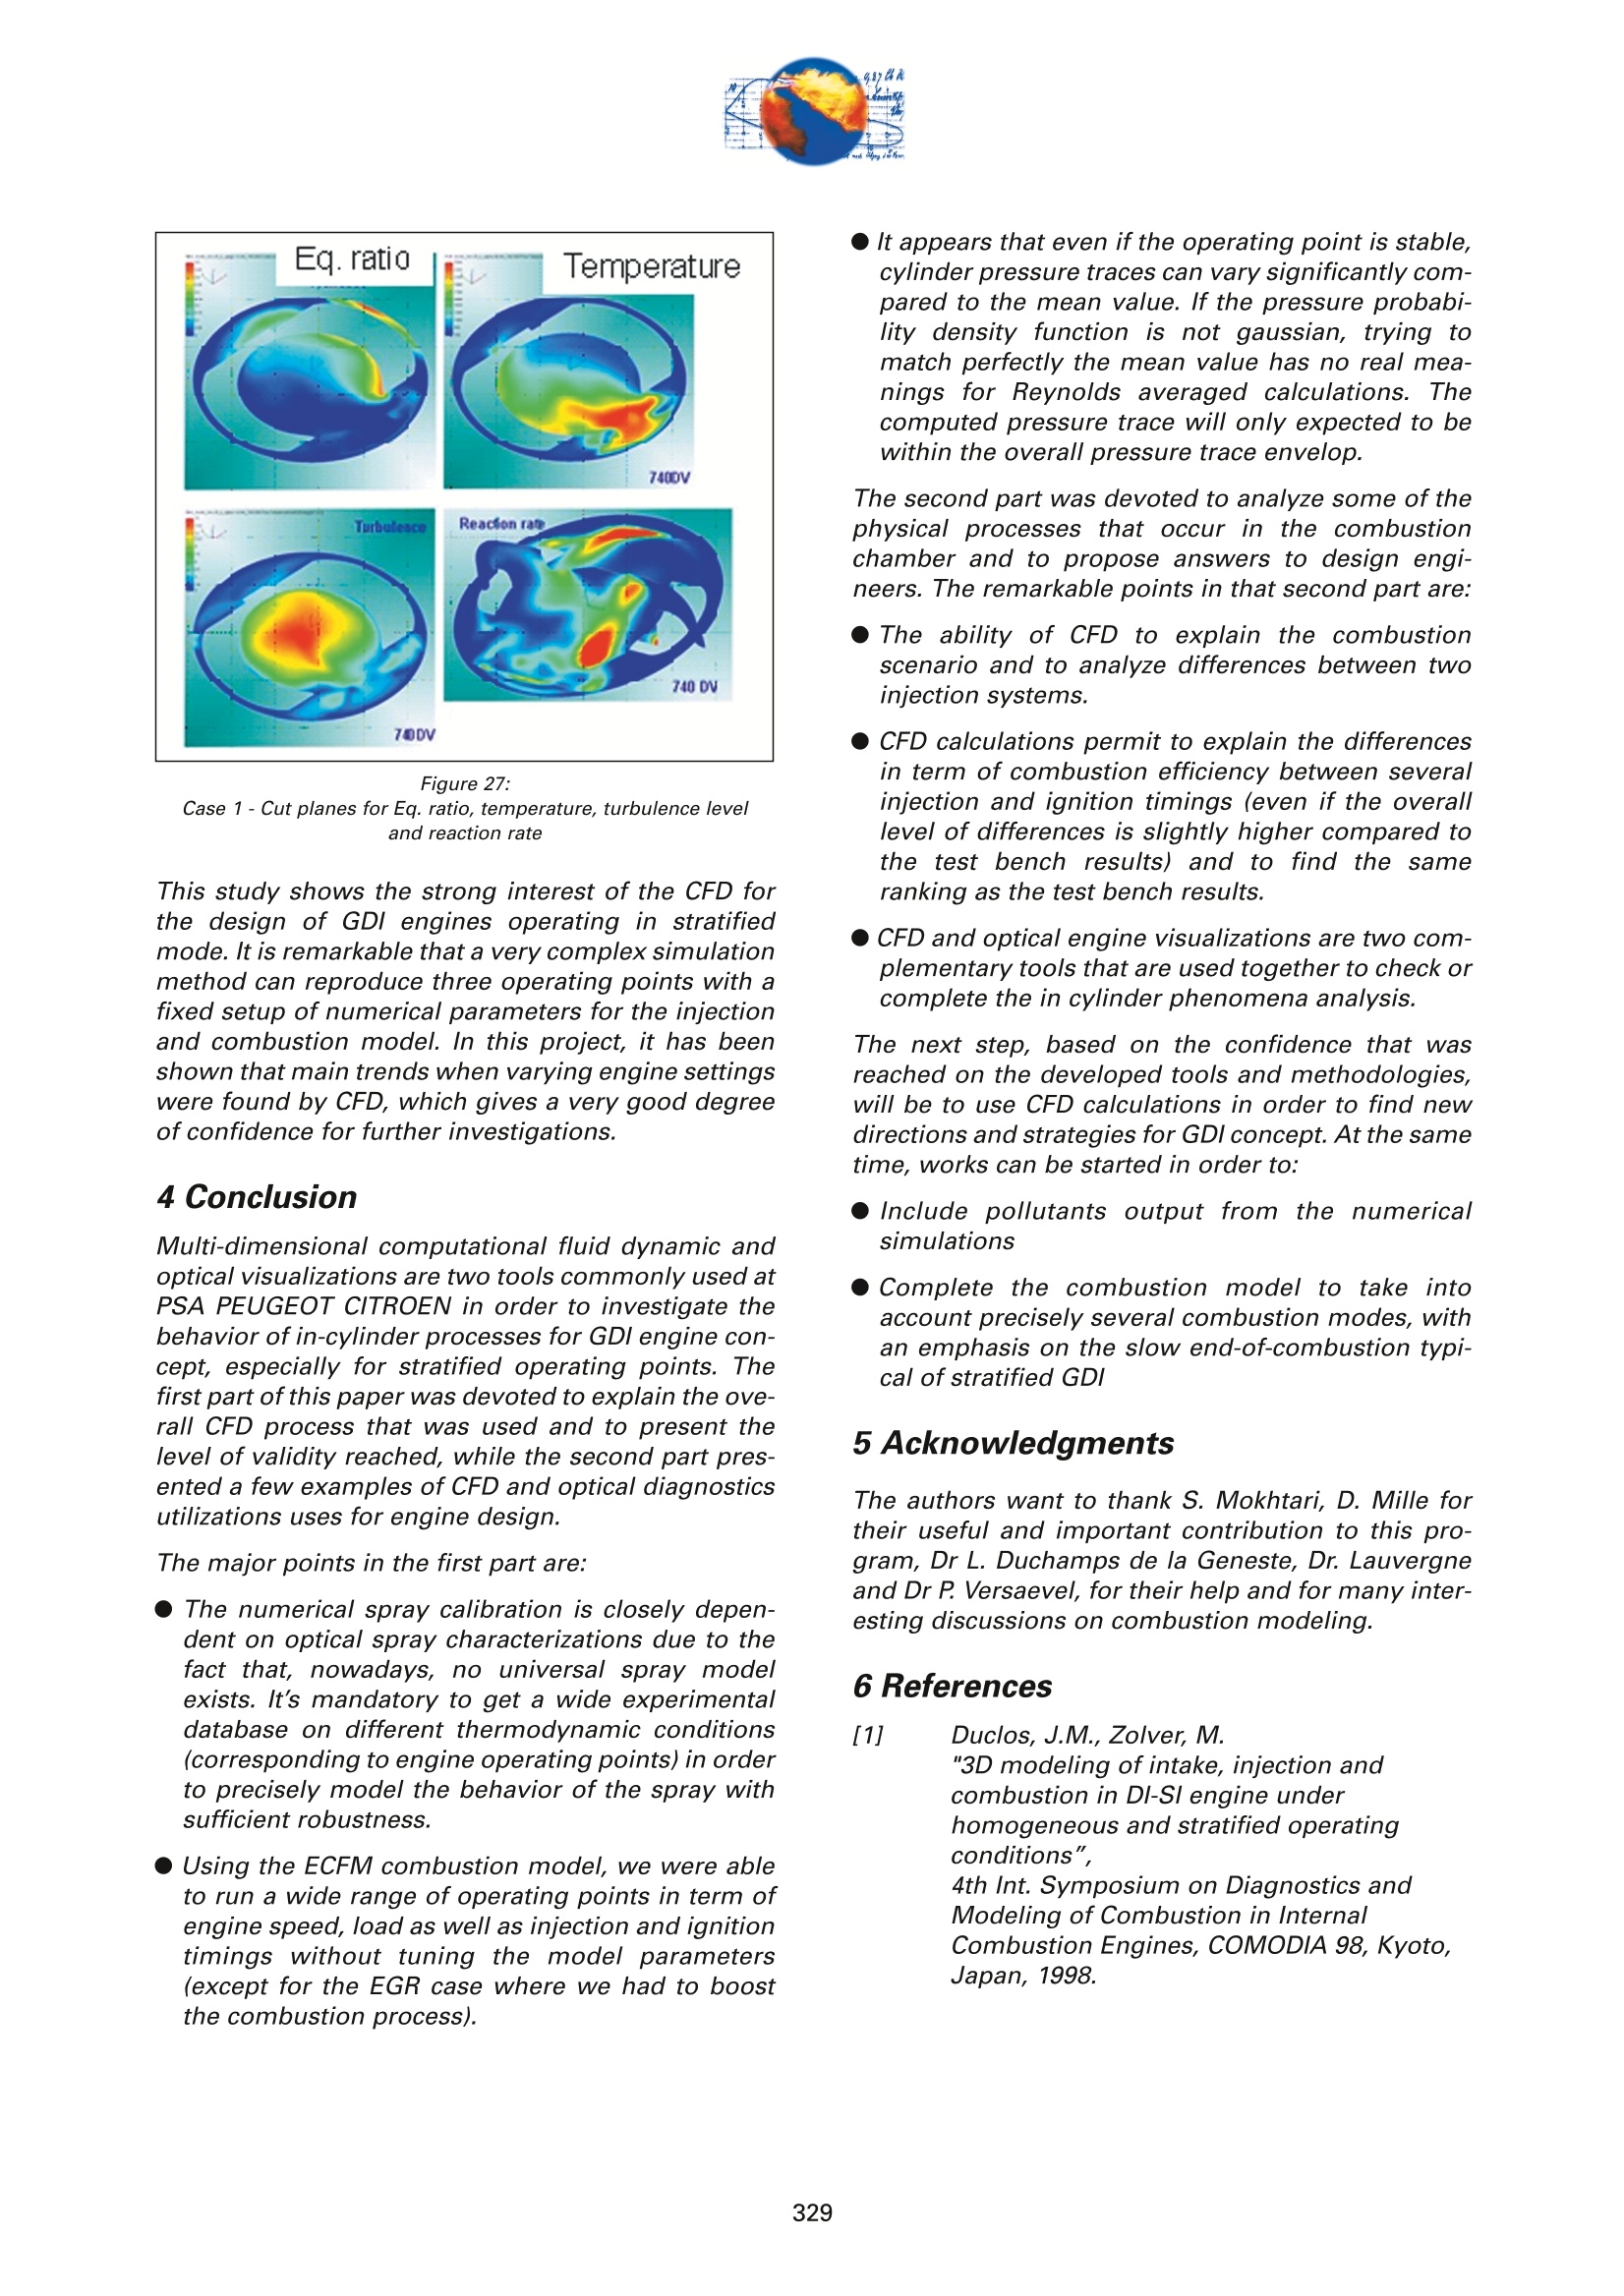
Coupled approach using CFDand optical diagnostics toolsfor next generation GDI engine design la Dr. Gregory Blokkeel, Dr. Erwann SamsonPSA Peugeot Citroen, Velizy/France Dr. Thierry SouleresPSA Peugeot Citroen, La Garenne-Colombes/France e 0A This paper presents the use of a coupled approachusing CFD and optical diagnostics tools to investigatethe mixture preparation and combustion of a GDIspray-guided concept. This concept can be an effi-cient way to optimize the fuel consumption for thenext generation of gasoline engines. Designing a newengine generation can be a difficult task if you wantto optimize every parameter in order to get the moreefficient and clean engine. Direct injection stratifiedcharge concept makes this optimizing process evenmore difficult considering the large amount of para-meters to be defined. We can quote for example theneed to get the right injection system and chamberdesign combination, or the need to find the right loca-tion of the spark plug compared to the injector over awide range of operating conditions. For all those rea-sons, CFD tools and optical diagnostics tools becomeunavoidable to get a fine description of what happensin the combustion chamber. Different approaches andarrangements can be studied quickly using CFD andcompleted or verified on optical engines. Differentexperimental techniques such as liquid mixture pre-paration and combustion visualization are carried outon a 4-stroke, 4-valve single-cylinder engine, equip-ped with optical accesses. The influence of injectionand ignition timing on the mixture preparation andcombustion is then analyzed. Special emphasis isgiven to the stratified case where the mixture prepa-ration at the ignition timing and results from the testbench are well correlated. Those images are thenused to validate 3D CFD calculations that are conduc-ted with FIRE V8 code, including spray atomization,mixture preparation and combustion processes. In-cylinder measurements and 3D calculations are foundto be helpful tools for understanding and designingGDI engines and the most significant results on thespray-guided combustion system will be presented inthe paper. 1 Introduction Gasoline direct-injection engine appears to be a pro-mising alternative to deal with the more stringentemission legislation. For example, GDI authorizessome engine tunings that reduce the duration of thelight-off of the catalytic converter. Recent works onGDI engines have also shown their great potential interms of performance and fuel consumption econo-my. That point will also generate lower CO emis-sions. At partial loads, late injection and stratifiedoverall lean burn is pursued. The goal is to obtainproper fuel stratification so that an ignitable mixturecan exist in the vicinity of the spark plug and canensure fast flame propagation. It results that a preci-se control of the interaction between the spraymotion and the gas flow field is of great importancefor an optimization of the mixture preparation andcombustion processes. Designing a new engine generation can be a difficulttask if you want to optimize every parameter in orderto get the more efficient engine. Direct injection stra-tified charge concept makes this optimizing processeven more difficult considering the large amount ofparameters to be defined. We can quote for examplethe need to get the right injection system and cham-ber design combination, or the need to find the rightlocation of the spark plug compared to the injectorover a wide range of operating conditions. For allthose reasons, CFD and optical diagnostics toolsbecome unavoidable to get a fine description of whathappens in the combustion chamber. We found that CFD tools can be used in three diffe-rent ways corresponding to different engine develop-ment steps. ●Exploration of new ideas -Using the full flexibilityof CFD in order to explore concepts without anyconstraints. ●Engine testing support -Using the deep insight ofthe in-cylinder phenomena that CFD permits inorder to support engine testing. Engine optimization -Using CFD in order to opti-mize engine settings or geometrical arrangementssuch as a chamber geometry or injector/bowl interactions... For all of those CFD utilizations, a high validity leveland robust methodologies are needed. In the firstpart of the paper, the overall CFD process for in-cylin-der calculations, its validity and its links with opticaldiagnostics will be described. While in the secondpart, two examples of CFD and optical diagnosticsuses will be presented in the framework of enginetesting support. Last but not least, a special emphasis is put in thispaper on combustion modeling, validation and app-lied calculations. It has been found in previous stu-dies that mixture preparation calculations can givemany information for the ignition conditions forexample, but deriving from there criteria for proces-ses that occur after are not reachable. 2 Methodology and Validation Proess As said in the introduction part, CFD calculations areof a great interest in order to understand the physicalprocesses that occur inside the combustion chamberand therefore to help design engineers. Due to thecomplexity of those physical processes and to thewide range of spatial and temporal scales involved,it's mandatory to use several models for sprays, igni-tion and combustion processes and to build metho-dologies to calibrate them. Figure 1:Overview of the 3D CFD Calculation process In the next paragraph, we will present the model usedand the overall CFD process which is detailed on figu-re 1. 2.1. Methodology and model usedMeshing the chamber geometry: Meshing of the chamber is really important forseveral reasons. First, in order to get good return timefor the calculations, we have to precisely define andlimit the amount of cells that are needed. But, in orderto catch the physical processes, the size of the cellshas to be small enough. For example, small cells arerequired close to the injector in order to get the rightair entrainment and spray shape. An example of typi-cal chamber mesh is shown in figure 2. Figure 2: Example of combustion chamber mesh In that specific case, the overall number of cells is around400.000 during the injection and combustion calculation. Intake port calculation and aerodynamicinflow calculation 1D calculations are realized with GT-Power in order toget the boundary conditions for the 3D inflow calcu-lations and to estimate the amount of internal residu-al burnt gas in the chamber. Injection The gasoline stratification in the cylinder is mainlydependent on the spray atomization and dropletsdispersion in the combustion chamber. Since thecombustion process widely depends on the fuel stra-tification, the modeling of the injection has to be donevery carefully. Unfortunately, there is no universal spray model that permits to simulate a new injectorwithout parameters tuning. Models such as Wave-FIPA break-up model [1] or others based on aero-dynamic instability breakup hypothesis, which arewidely used, require an adjustment of several con-stants in order to get the right liquid and vapor pene-tration curves over a wide range of combustionchamber thermodynamic conditions. For that reason, a matching methodology is manda-tory in which a very close work is realized betweenexperimental visualizations and CFD calculations ofthe spray injection process in order to define the rightinitial parameters setup. Process to create a "virtual injector": The objective of this step is to get an accurate setupof spray parameters that will remain constant over awide range of engine calculations (engine speed,injection timing advance...). The first step of themethodology is to identify the thermodynamic condi-tions envelop in the engine at the time of the injec-tion. Once that envelop is defined, spray characteriza-tions are performed in a hot pressurized vessel thatcan simulate those engine thermodynamic conditionsup to 700 K and 25 bar (large optical accesses enableus to characterize the whole development of thespray, including liquid and vapor phases propaga-tion). Using that database, numerical calculations are per-formed until a good agreement between experimen-tal and numerical results is reached without changingthe numerical parameters. The comparison criteriaare mainly the spray shape, liquid and vapor penetra-tion over the time and the evaporation velocity. Dueto the formalism and the model used for spray calcu-lation, the numerical parameters that can be variedduring the injection process are the injection velocity,the mass flow rate, the Sauter Mean Diameter (SMD),the cone angle and the cone thickness, the dropletsize distribution, etc. Once fitted with the experimental results over ourwide operating range, the "spray model"or the "vir-tual injector"is assumed to be valid and combustioncalculation can be performed. In the framework of this study, two different kinds ofinjectors have been used: ●High pressure Multi-holes injectors. Outward opening, piezo controlled injectors. Multi-holes injectors: For those injectors, the experimental visualizationshave been performed using P.L.I.F. spray visualizationin hot bomb. The fuel (Iso-Octane) is seeded with 5%of Toluene. A LASER light sheet from a Nd:YAGLASER at 266 nm is used. The fluorescence signalfrom the Toluene is then collected by using an ICCD16 bit Princeton Camera equipped with a WG 280 fil-ter at 280 nm to suppress the LASER light signal. Images are instantaneous. Each image can be thenpost-processed as follow: Figure 3: View of the post-processing done in order to separate the liquidand the fuel vapor phase. Based on the generated database, spray calculationshave been performed and physical and numericalparameters adjusted until an overall good agreementis found between calculations and visualization. InFigure 4, the fuel vapor envelop is checked and com-pared for several chamber back-pressure. Figure 4: Vapor phase comparisons between CFD calculation andexperimental visualization for different back-pressurein the combustion chamber. Outward opening, piezo-controlled injectors: In that case, shadowgraph spray visualizations in hotbomb were performed to characterize the outwardopening injectors. A He-Ne continuous LASER wasused and the images were recorded with a highspeed LaVision USS16 camera. This technique wasdeveloped to increase the quantity of acquired datacompared to P.L.I.F. The images are instantaneous. On figure 5, the effect of thermodynamic conditionsin the chamber is evaluated. We can remark that theoverall spray shape does not change when the ther-modynamic conditions change and a recirculationarea always exist. The injector appears to be very sta-ble. When the back-pressure increases, the spraypenetration decreases, leading to a more compact vapor area in the downstream part of the spray. Wecan also notice that the spray becomes narrowerdownstream when the counter pressure increases.Those two effects are well predicted with the CFDspray calculation with the same "spray model" para-meters. Effect of combustion chamber condition on the liquid andvapor penetration using outward opening injector.Numerical vs experimental visualizations. Ignition Two different strategies can be used to model theignition process. The first strategy which can be called "forced igni-tion" is based on an imposed flame surface densitydeposit over a prescribed time and volume aroundthe spark plug. The timing to initialize the flame sur-face density is chosen based on the analyze of equi-valence ratio fields cut studies around the spark plug.When the equivalence field is favorable to the igni-tion, the flame surface density is initialized. In oneword, we can say that in this case, the real engineignition timing is not used but a "numerical" start ofcombustion timing is prescribed instead. The second strategy is more precise and permits toreally model the ignition process using the concept ofa "virtual plug".The model used is called AKTIM for"Arc and Kernel Tracking Ignition Model" and wasdeveloped by IFP [2] in the framework of the GSMstudies. This model takes into account: ● The spark plug geometry and mesh in the com-bustion chamber. This will introduce wall thermallosses, aerodynamic changes around the sparkplug and flame propagation modifications. A model for the electrical discharge leading to thespark creation. Stretching of the spark due to the aerodynamicaround the spark plug. Lagrangian particules areintroduced to represent the spark. ●1Transition to the combustion model with a flamesurface density deposit. Figure 6: Schematic view of AKTIM model. Spark creation, spark stretching Engine spark visualization: Spark visualizations have been performed withoutcombustion, through the optical access of the cylin-der head of a single-cylinder. We used an ICCD 16 bitPrinceton Camera to record the development of thespark. The integration time is fixed at 10 ns to freezethe phenomena. Images are instantaneous. Figure 7: Schematic view of the optical engine Those visualizations have been used in order to cali-brate the electrical model part of the AKTIM model.Comparisons between the experimental visualizationand numerical simulation of the spark evolution arepresented in figure 8, showing a good agreement. Figure 8: Comparisons between experimental visualizations and CFDcalculations during the spark ignition process using AKTIM model. Combustion: The combustion model used for this study is anextension of the Coherent Flame Model CFM that wasused for indirect injection gasoline engines [3]. Thisextended model, named ECFM, was developed andsuccessfully used by Duclos et al.[4, 5] and Georjonet al.[10] to predict flame propagation in GDI en-gines. The main assumption is that the combustion occursin a premixed regime, even for very lean or very richcombustion, and can be described with a flamelettype combustion model. The chemical reaction of fueloxidation is supposed to occur in a very thin layerthat separates burnt and unburnt gases. It followsthat the mean turbulent reaction rate for the reactantsmay be determined as the product of the mean flamesurface density S (i.e. the flame surface per unit volu- me) by the consumption rate per unit of flame area. Consumption speed is modeled by the speed that alaminar flame would have under the thermo-chemicalconditions the turbulent flame locally undergoes. Itcan be obtained from the analysis of local strainedlaminar flame or with flame speed correlations. Thecorrelations [6] are extended to very lean and veryrich mixtures [4, 5]. The use of a balance equation for the mean flame sur-face density is used to relate flamelet analysis to theglobal turbulent flow field calculation. This equationtakes into account transport, production (due to localturbulent stretch, modulated by an efficiency para-meter a) and destruction (mutual annihilation of ajda-cent flamelets or flame quenching). The ECFM model includes a conditional burnt/un-burnt gases description and pollutant formation.More details about the ECFM combustion model canbe found in [4, 5]. In the framework of this specific study, several opera-ting points have been calculated (cf Table 1) and con-fronted to experimental data. For all the combustionruns, the model has been used with the same para-meters except for the EGR case for which a slightmodification of the a parameter was necessary inorder finely capture the pressure trace. Table 1:Operating points conditions Case Case 0 Case l Case 2 Case 3 Case 4 Case 5 Speed(rpmn)IMEP (bar) n) 1000 2000 2000 2000 200010 3500 1.8 2.8 2.8 2.8 2.8 5 EGR 0 0 0 0 20 0 SOI(BTDC) OPTI1 OPTI+11 OPTI OPTI-10 OPTI_2 OPTI3 lgnition time (BTDC) OPTI_I OPTI+6 OPTI OPTI-15 OPTI_2 OPTI3 The following calculations were performed with highpressure multi-holes injectors. Figure 9: Comparison between experimental (dot line) and numerical (plainline) cylinder pressure trace for the case 0. Figure 10: Figure 13: Comparison between experimental (dot line) and numerical (plainline) cylinder pressure trace for the case 1. Comparison between experimental (dot line) and numerical (plainline) cylinder pressure trace for the case 4. Figure 11: Figure 14: Comparison between experimental (dot line) and numerical (plainline) cylinder pressure trace for the case 2. Comparison between experimental (dot line) and numerical (plainline) cylinder pressure trace for the case 5. The agreement between computational results andexperimental values on those points is remarkable:the global shape of the cylinder pressure curve is wellpredicted without tuning the combustion model con-stants over a wide range of operating points. Theglobal accuracy is fully satisfactory and permits torealize calculations in order to analyze phenomena(engine testing support) 2.2. Stratified tratified charge specificities Figure 12: Comparison between experimental (dot line) and numerical (plainline) cylinder pressure trace for the case 3. In the context of GDI, stratified charge mode, even ifthe operating point is stable, we can see that cycle tocycle combustion fluctuations appear. Figure 15shows a probability density function for the cylinderpressure traces. We can see that, after the ignition, alot of pressure traces are iso-probable. This comesfrom the fact that due to the combustion conceptwhich is closely linked to the injection process, asmall difference in the spray development will gene-rated a different fuel stratification in the chamber andwill, therefore, slightly change the ignition conditionand the flame evolution. Figure 15: Cylinder pressure probability density function for each crank angle- difference with the mean arithmetic value in ordinate, crank anglein abscise (based on 200 engine cycles)- This specificity has to be considered when analyzingthe CFD calculations. If shape of the PDF functionafter the ignition point is Gaussian, it's expected thatthe numerical pressure trace will be equal to theexperimental pressure trace due to the fact thatReynolds Average calculations represents a meanrealization (in this case corresponding to the realiza-tion of highest probability). If it's not the case, thenumerical pressure is only expected to be inside theenvelop of all the experimental pressure traces (cffigure 16). Figure 16: CFD Cylinder pressure (plain line) compared to the mean experi-mental cylinder pressure (circle line) and cylinder pressure envelop(dot lines). End of combustion and combustiondiagram The end of combustion is of great interest for strati-fied combustion and therefore has to be analyzedwith care in CFD calculations. The combustion modelused in this study is based on a flamelet and pre-mixed assumptions that can be restrictive in somecases. Several authors have proposed [7, 8, 9] to representthe turbulent combustion regime into a diagramwhich presents in abscise the ratio (integral turbulentscale over the flame thickness), and in ordinate theratio between the velocity fluctuations and the lami-nar flame speed. A complete review of those types ofdiagrams can be found in [7]. A simplified version,based on D. Veynante [8] is presented here (figure17). The Karlovitz number, Ka, represents the ratio bet-ween the flame characteristic time and the dissipativeturbulent structure time [8]. The Damkholer number, Da, represents the turbulentintegral scale characteristic time over the flame cha-racteristic time. Figure 17: Combustion diagram presenting the different combustion regimesusing a comparison between turbulence and flame specific time. The evolution of the combustion diagram during thecombustion process on a representative stratifiedcharge calculation is represented on figure 18. It’simportant to keep in mind that this diagram is just anindication of the turbulent combustion regimes anddoes not draw precise boundaries between thosemodes. If we analyze the figure 18, we can say that,after the ignition time, all the conditions are met toget a fast premixed combustion (good level of tem-perature and pressure due to the fact that we are rea-ching the top dead center position, good turbulencelevel due to the fact that the fuel was just injected andgood level of equivalence ratio). But, as time pro-gresses, the thermodynamic conditions start to beless favorable, the turbulence decreases and thecharge starts to be dispersed and diffused in thechamber. In figure 18, we can see that as combustionprogresses, the combustion regime starts to changeand switches to a more distributed regime mode. Figure 18: Evolution during the combustion process based on the diagramFigure 1Z (from left to right: begin-middle and end of combustion)-Each point represents a burning cell in the calculation. So, a limitation of our calculations using a modelbased only on flamelet and premixed assumptionsfor the end of combustion can be found here. Ahybrid model which permits to successively take intoaccount several combustion modes (premixed mode,combustion in volume mode and diffusion mode)could bring an improvement to the physical validityof the combustion calculation. 3. Comprehension and combustionanalysis Once,we have established a well validated methodo-logy for all the sub-processes involved in the CFDchain for combustion calculations, we can use thistool in order to help and provide answers to designengineers. The next paragraph will deal with twoquestions which are: ●What is the combustion scenario in the chamber?(engine testing support framework) What can be an optimal injection/ignition timingstrategy? (engine testing support and optimizationframework) 3.1. Combustion scenario using CFDcalculations 3.1.1. Combustion scenario for Multi-holesinjectors: After the inlet stroke and the first half of the com-pression stroke, the fuel injection begins (between 60and 20 CAD before TDC depending on the enginespeed and the load). For the spray-guided concept,the spark plug is located near the injector. The sparkadvance is usually set close to the injection advance.The spark duration is between one and two millise-conds long. The sketches (figures 19 and 20) illustra-te the combustion process for two operating points at2000 and 1000 rpm. These images show the reactionrate in cut planes where the flame is currently loca-ted. The color scale is tuned at every instant to matchthe local flame dynamic. The beginning of the combustion is similar for bothengine speeds: The effective start of the combustion occurs in azone where the equivalence ratio is around 1, afterthe liquid phase has left the spark plug area, if thespark plug protrusion is properly tuned to theinjector characteristics. The flame arises in thevicinity of the electrodes and propagates down-stream into the piston bowl. The propagationspeed is driven by the strong aerodynamic genera-ted by the fuel spray. The flame develops within thepiston bowl on the side of the spark plug andspreads swiftly in the azimutal direction. It touchesthe bow/ wall opposite to the spark plug. Then thepropagation of the combustion depends on theinteraction between the spray aerodynamic and thebowl: if the wall has a strong influence on the mix-ture stream, the flame will go in the upper parts ofthe chamber or will stay within the piston bowl.Depending on the optimization of the chamber andon the operating point, some mixture can betrapped within zones surrounded by walls, wherethe turbulence will dissipate fast: this mixture willburn last in the best case or will not burn at alldepending on its richness. That can be a majorsource of UBHC and the cause of a combustionslow down. But the end is significantly different: ●At 2000 rpm, the end of the combustion occurs inthe upper part of the chamber, above the pistonbumps, close to the cylinder head. At 1000 rpm, theflame stays within the bowl almost all the time. Figure 19: 2000/2.8 operating point-Multi-holes injectors without EGR - burntmass fraction curve andreaction rate field cuts. The color scale isadapted to the flame intensity. Figure 20: 1000/1.8 operating point -Multi-holes injector without EGR -burntmass fraction curve and reaction rate field cuts . The color scale isadapted to the flame intensity. 3.1.2. How the injector technology altersthe combustion process For both injectors, the combustion process is glo-bally similar. But for the outward opening injector, thecombustion of the whole mixture is faster. The firstreason is that this kind of injector produces a conti-nuous spray and vapor field compared to the severalstream jets of the multi-holes injector, whose mixturezones must connect themselves to permit the flamepropagation in the azimutal direction. The 3D visuali-zations (see figures 21) show that the flame propaga-tion can be very circular for an outward openinginjector. Figure 21: Iso-surface of progress variable=1 illustrating the burnt mixture atdifferent CAD - Vertical cut plane of the equivalence ration field-configuration : Outward opening injector. 3.2. Combustion scenario using opticalengine An optical engine (figure Z), similar to the test engine,is used to characterize the combustion processes inreal conditions. The combustion visualization hasbeen done through the piston head optical access. AnICCD 16 bit Princeton Camera has been used torecord the development of the flame, with a UG5color glass filter (between 250 nm and 400 nm) toattenuate the possible sooting flame emission. Theintegration time is fixed at 10 ps to have enough sig-nals from the premixed flame emission. Imagesrepresent the average of 50 instantaneous images. This tool can give some details on the combustionprocess, to complete the 3D calculation analyses.It isthen obvious from visualization (Figure 22) that mix-ture preparation is improved thanks to outward ope-ning injector: better local mixing enables to have lessluminous and more symmetric combustion, whichconfirms the better flame propagation that was foundwith CFD calculations. Figure 22: Combustion direct emission for both injectors, for two differentlocations during cycle. Additionally it is also possible to analyze a poor be-havior of the engine on specific operating points.Forexample on Figure 23, the increase of smoke for lateinjection can be explained bypool-fire on the piston,coming from high initial fuel concentration close tothe wall. On the opposite, the increase of HC emis- sions for early injection can be linked with the liquidimpact on the spark plug, leading to luminous incom-plete combustion on this central area. Figure 23: End of combustion location for different injection timing: (a) late injection, (b) nominal,(c) early injection Optical investigations enable to understand enginetests and then determine possible improvements.Optical investigations enable also to have "real-life"information to complete the 3D calculations and toextract important criteria that should be finely lookedat with CFD such as spray/wall impact or spark plugimpact. In this case, the use of the spark plug modelAKTIM will be mandatory and will permit to get a finedescription of the interaction between the spray andthe spark plug. 3.3.Using CFD to explan the experimentalresults for single cylinder engineequipped with a multihole injector The bench tests on a single cylinder engine for threespark advance / injection advance settings for the2000 rpm 2.8 bar IMEP operating point (see table 1,case 1,2,3 for details) show that the thermodynamicalefficiency and the combustion efficiency are very dif-ferent in those cases (Table 2 for 3D computationalresults summary and figure 24 for burnt mass frac-tion curves). Case 2 is the best with a correct CA50value and good combustion efficiency. Three calcula-tions have been performed and analyzed in order tofigure out the causes of such differences. Figure 24: Evolution of the burnt mass fraction for three differentinjection/ignition timings on a 2000/2.8 operating point. Case 2 isthe optimal configuration in term of combustion efficiency. Table 2: 3D computational results summary Case 1 Case 2 Case 3 Combustion Efficiency 81.42% 90.92% 81.23% CA50 9.7 -3.6 -5.6 CA70-CA10 26.6 16 29.8 CA10CA70 -323.6 -133 -17.512.3 Despite the shortcomings of the combustion modelrelated to the end of combustion and post-oxidation,the calculations show a strong difference on thecombustion efficiency with a discrepancy of 10 per-cents between the best and worst engine settings(experimental discrepancy is slightly above 5 per-cents). We can assume that this direct comparisonbetween unburnt mass fraction in the 3D simulationat 780 CA (piston top dead center at 720 CA) andexperimental combustion efficiency is reasonablesince the low exhaust temperature will not be favora-ble to a post-oxidation along the exhaust pipes of thecylinder head. According to this good agreement between experi-mental and computational results and to the combus-tion process previously described in paragraph 2.1,the reasons of the different behavior for the threeengine settings can be explained. First, we compare the last (case 3) and optimal setting(case 2, optimal) (Figure 25 and 26). The short injec-tion advance enhances the interaction between thespray and the piston in two ways: ● By shortening the distance between the injectornozzle and the piston, more fuel should reach thepiston surface. However, the chamber pressure ishigh enough to limit the liquid penetration and toavoid a liquid impact on the lower wall of thepiston Because the piston is centered on the cylinder axis,the bowl center is shifted from the injector axis,therefore the distance between the injector nozzleand the bow/ wall is shorter at the opposite of thespark plug side. By decreasing the injection ad-vance, the directional effect of the bow/ on the mix-ture stream jet is increased that puts more fuel inthe upper part of the chamber (the flame will visitthat zone only at the end of the combustion) andalong the bottom wall of the piston. For the lastsetting (case 3), the fuel located in the upper partwill eventually burn but slowly and some fuel willremain unburnt in the piston bowl: 30 CAD afterTDC, the thermodynamical conditions and the veryweak aerodynamic do not favor the flame propa-gation. For the optimal point, case 2, almost all thefuel is rapidly burnt. Figure 25: Unburnt Equivalence ratio field (max=1.5), cut planes 45°rotatedfrom theinjector/spark plug plane- left column, Case 3, right column Case 2 (optimal) Figure 26: Case 3-plane cuts 1mm above the piston surface We can compare now the first (case 1) and the opti-mal settings (case 2). The larger injection advancelets the fuel go outside the bowl, between the pistonsbumps and the cylinder walls. The 3D visualizations(see figure 2Z) show that the end of combustion islocated in the part opposite to the spark plug. 20 CADafter TDC, the thermodynamical conditions are rathercold in unburned region and the turbulence level islow. Moreover, the mixture trapped between thepistons bumps and the cylinder walls is lean. Theflame speed can not be high enough to develop aneffective propagation and the surrounding wallsincrease the dissipation. Those factors explain thevery low combustion velocity for this case after 720CA. Figure 27: Case 1 - Cut planes for Eq. ratio, temperature, turbulence leveland reaction rate This study shows the strong interest of the CFD forthe design of GDI engines operating in stratifiedmode. It is remarkable that a very complex simulationmethod can reproduce three operating points with afixed setup of numerical parameters for the injectionand combustion model. In this project, it has beenshown that main trends when varying engine settingswere found by CFD, which gives a very good degreeof confidence for further investigations. 4 Conclusion Multi-dimensional computational fluid dynamic andoptical visualizations are two tools commonly used atPSA PEUGEOT CITROEN in order to investigate thebehavior of in-cylinder processes for GDI engine con-cept, especially for stratified operating points. Thefirst part of this paper was devoted to explain the ove-rall CFD process that was used and to present thelevel of validity reached, while the second part pres-ented a few examples of CFD and optical diagnosticsutilizations uses for engine design. The major points in the first part are: ● The numerical spray calibration is closely depen-dent on optical spray characterizations due to thefact that, nowadays, no universal spray modelexists. It’s mandatory to get a wide experimentaldatabase on different thermodynamic conditions(corresponding to engine operating points) in orderto precisely model the behavior of the spray withsufficient robustness. ● lUsing the ECFM combustion model, we were ableto run a wide range of operating points in term ofengine speed, load as well as injection and ignitiontimings without tuning the model parameters(except for the EGR case where we had to boostthe combustion process). ● It appears that even if the operating point is stable,cylinder pressure traces can vary significantly com-pared to the mean value. If the pressure probabi-lity density function is not gaussian, trying tomatch perfectly the mean value has no real mea-nings for Reynolds averaged calculations. Thecomputed pressure trace will only expected to bewithin the overall pressure trace envelop. The second part was devoted to analyze some of thephysical processes that occur in the combustionchamber and to propose answers to design engi-neers. The remarkable points in that second part are: ● The ability of CFD to explain the combustionscenario and to analyze differences between twoinjection systems. CFD calculations permit to explain the differencesin term of combustion efficiency between severalinjection and ignition timings (even if the overalllevel of differences is slightly higher compared tothe test bench results) and to find the sameranking as the test bench results. ● CFD and optical engine visualizations are two com-plementary tools that are used together to check orcomplete the in cylinder phenomena analysis. The next step, based on the confidence that wasreached on the developed tools and methodologies,will be to use CFD calculations in order to find newdirections and strategies for GDI concept. At the sametime, works can be started in order to: ●1Include pollutants output from the numericalsimulations ● Complete the combustion model to take intoaccount precisely several combustion modes, withan emphasis on the slow end-of-combustion typi-cal of stratified GDI 5 Acknowledgments The authors want to thank S. Mokhtari, D. Mille fortheir useful and important contribution to this pro-gram, Dr L. Duchamps de la Geneste, Dr. Lauvergneand Dr P. Versaevel, for their help and for many inter-esting discussions on combustion modeling. 6 References [1] Duclos, J.M., Zolver, M."3D modeling of intake, injection andcombustion in DI-SI engine underhomogeneous and stratified operatingconditions",4th Int. Symposium on Diagnostics andModeling of Combustion in InternalCombustion Engines, COMODIA 98, Kyoto,Japan, 1998. ( [2] Duclos, J .M., Zolver, M., B aritaud, T. "3D Modeling of combustion for DI-S/ engines"Oil and Gas Science and Technology, Rev. I FP, vol. 54, No.2, p p. 259-264, 19 9 9. ) [3] Delhaye, B., Cousyn, B."Computation of flow and combustion inspark ignition engine and comparison withexperiment”SAE 961960, 1996. [4] Metghalchi,M., Keck, J."Burning velocities of mixtures of air withmethanol, isooctane, and indolene at highpressure and temperature"Combustion and Flame, 48, pp. 191-210, 1982 [5] J. M Duclos, O. Colin"Modelisation de la combustion en injectiondirecte essence"GSM Report 55 886,Mars 2001 [6] Dai W., Russ, S. G., Trigui N. & Tallio T.V."Regimes of Premixed Turbulent Combustionand Misfire Modeling in SI Engines"SAE paper 982611 (1998) [7] Veynante D. & Vervisch L."Turbulent Combustion Modeling"Lecture Series du Von Karman Institute(2003) [8] Poinsot T. & Veynante D."Theoretical and Numerical Combustion"R.T. Edwards Ed.(2001) [9] Habchi,C., Verhoeven, D., Huynh Huu, C.,Lambert,L."Modeling atomization and breakup inhigh-pressure diesel sprays"SAE 970881, 1997. [10] T. Georjon, E. Bourguignon, T. Duverger, B. Delhaye and P. Voisard"Characteristics of Mixture Formation andCombustion in a Spray-Guided ConceptGasoline Direct Injection Engine:An Experimental and Numerical Approach"SAE 2000-01-0534,2000 Designing a new engine generation can be a difficulttask if you want to optimize every parameter in orderto get the more efficient engine. Direct injection stratifiedcharge concept makes this optimizing processeven more difficult considering the large amount ofparameters to be defined. We can quote for examplethe need to get the right injection system and chamberdesign combination, or the need to find the rightlocation of the spark plug compared to the injectorover a wide range of operating conditions. For allthose reasons, CFD and optical diagnostics toolsbecome unavoidable to get a fine description of whathappens in the combustion chamber.
确定


还剩10页未读,是否继续阅读?

产品配置单


北京欧兰科技发展有限公司为您提供《汽油直喷发动机中优化设计检测方案(尾气检测)》,该方案主要用于汽车电子电器中其他检测,参考标准--,《汽油直喷发动机中优化设计检测方案(尾气检测)》用到的仪器有汽车发动机多参量测试系统、德国LaVision PIV/PLIF粒子成像测速场仪、PLIF平面激光诱导荧光火焰燃烧检测系统、LaVision SprayMaster 喷雾成像测量系统
推荐专场
汽车尾气分析仪
更多


相关方案
更多
该厂商其他方案
更多