


采用LaVision公司以增强型CCD相机为核心构建的平面激光诱导荧光(PLIF)测试系统,对直喷汽油发动机工作在废气再循环模式下缸内NO激光诱导荧光的定量成像进行了测量和分析。
方案详情

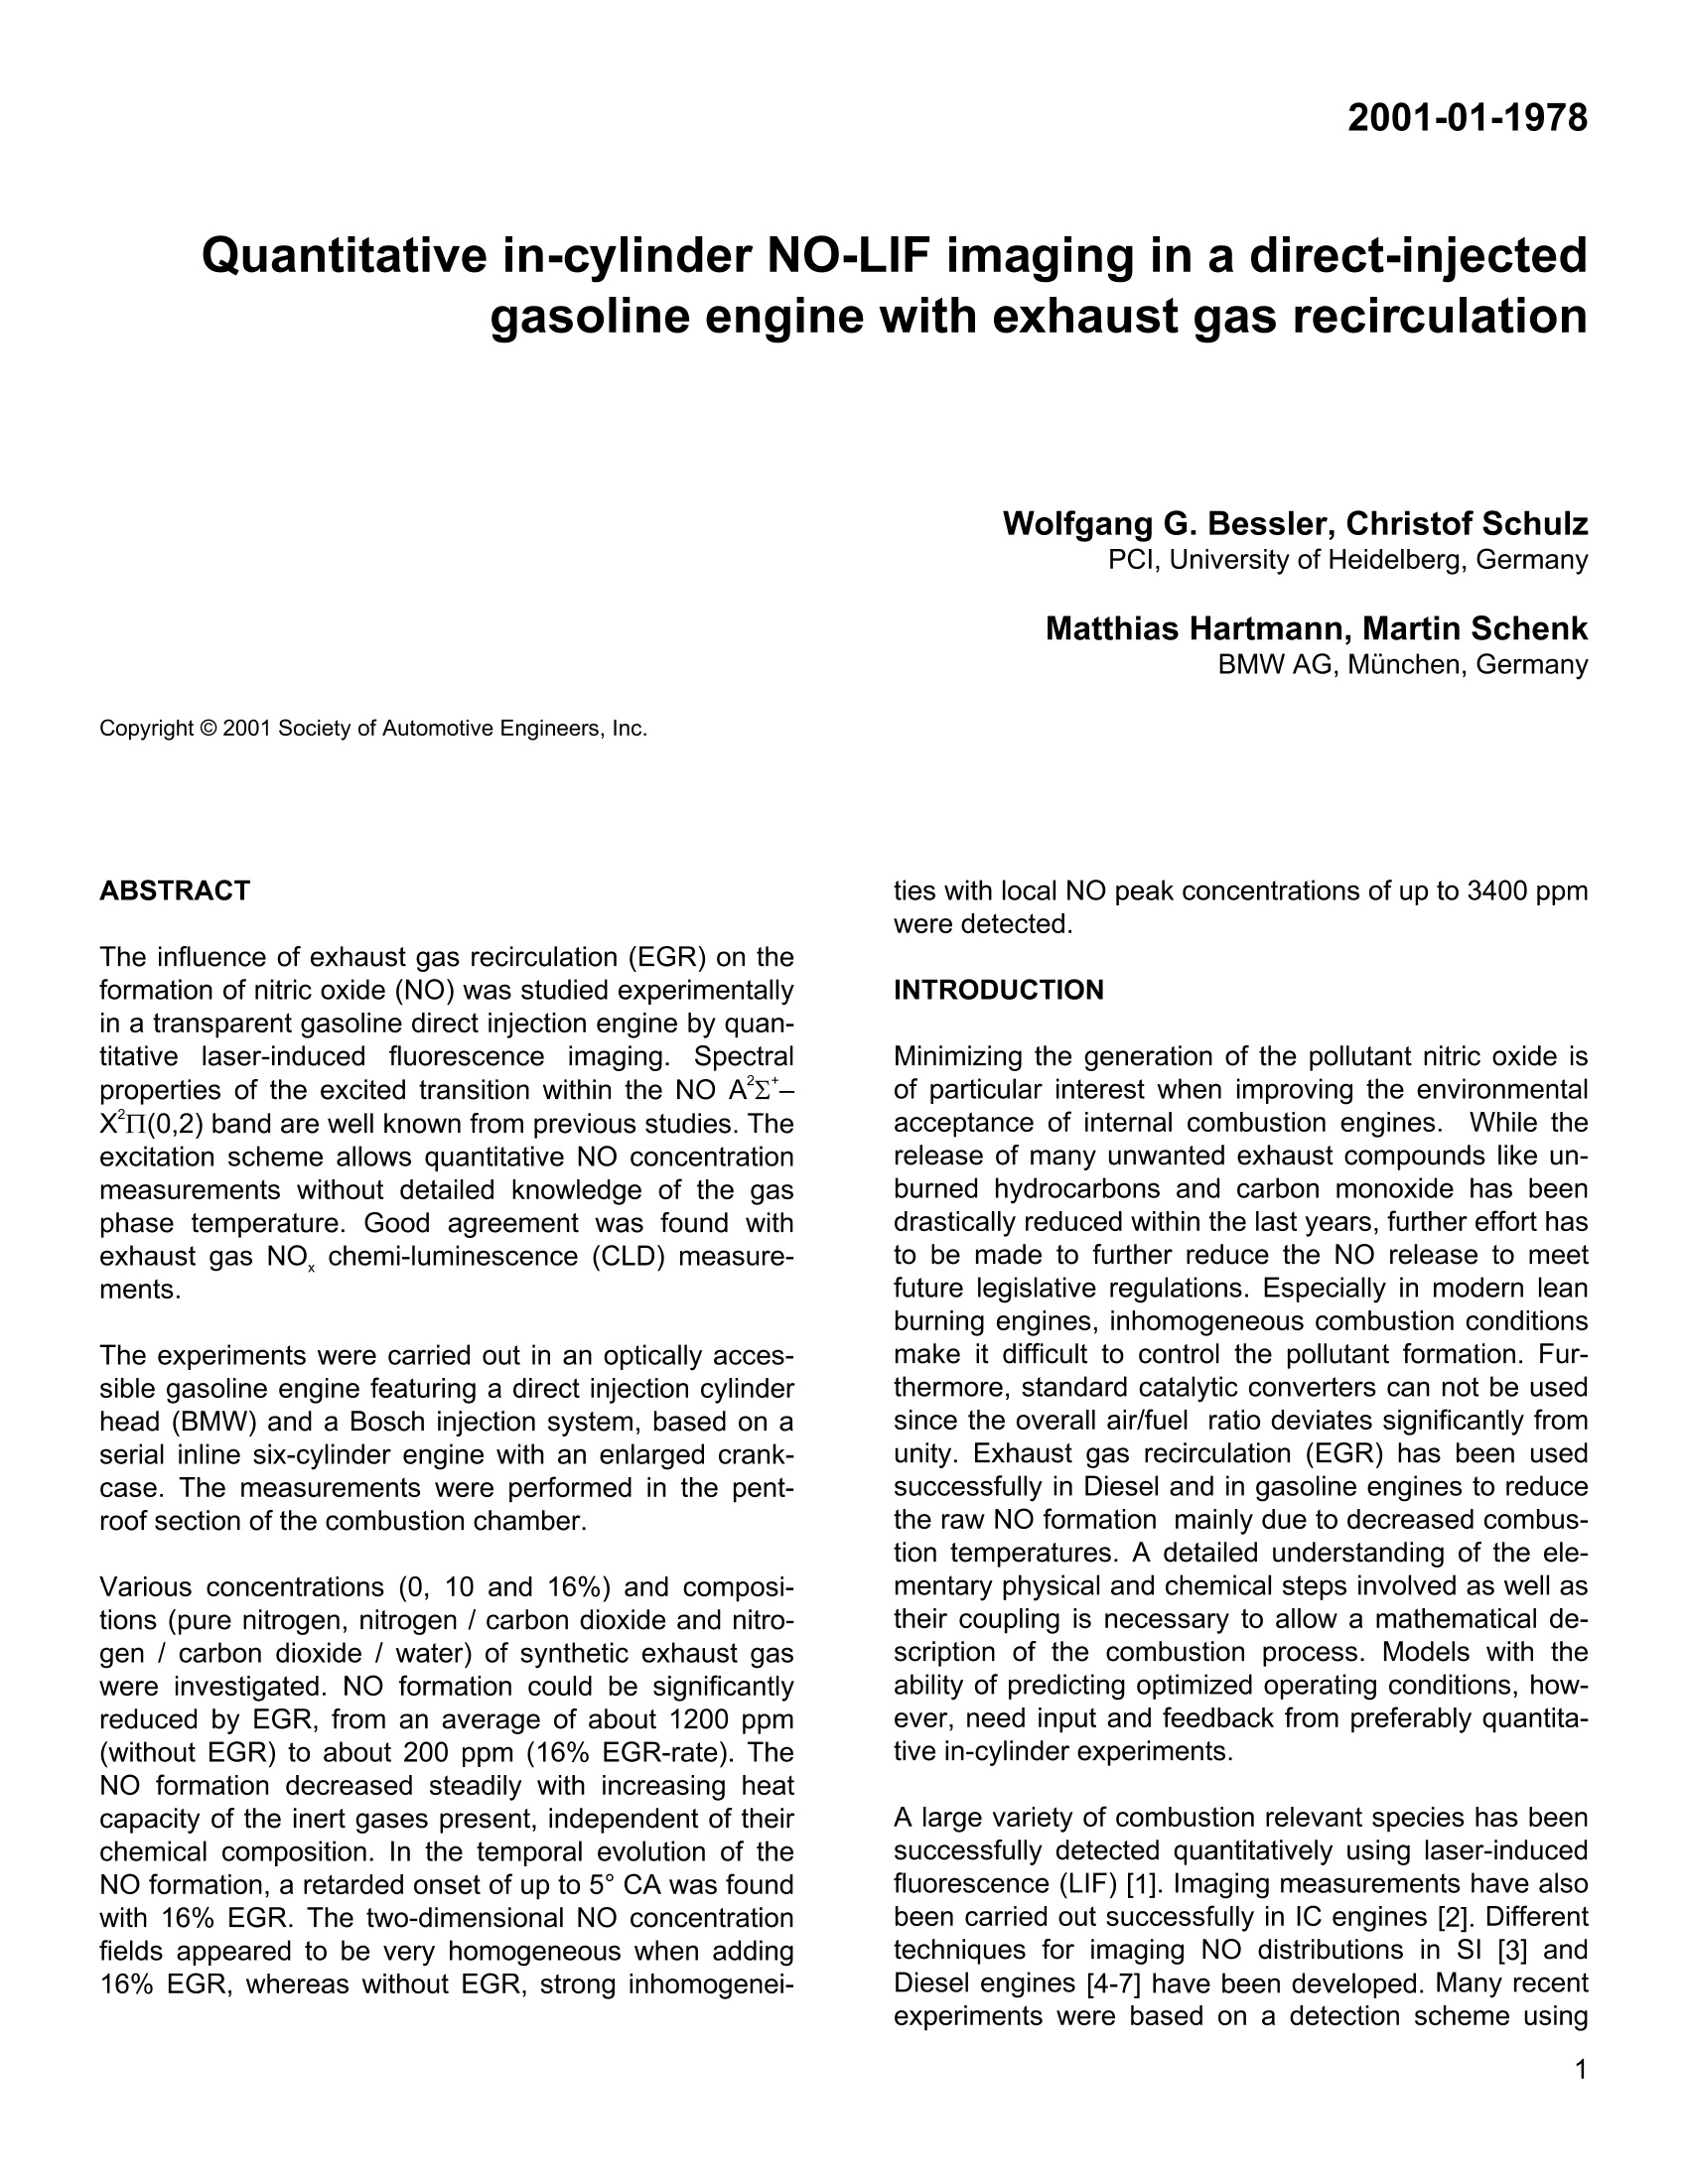
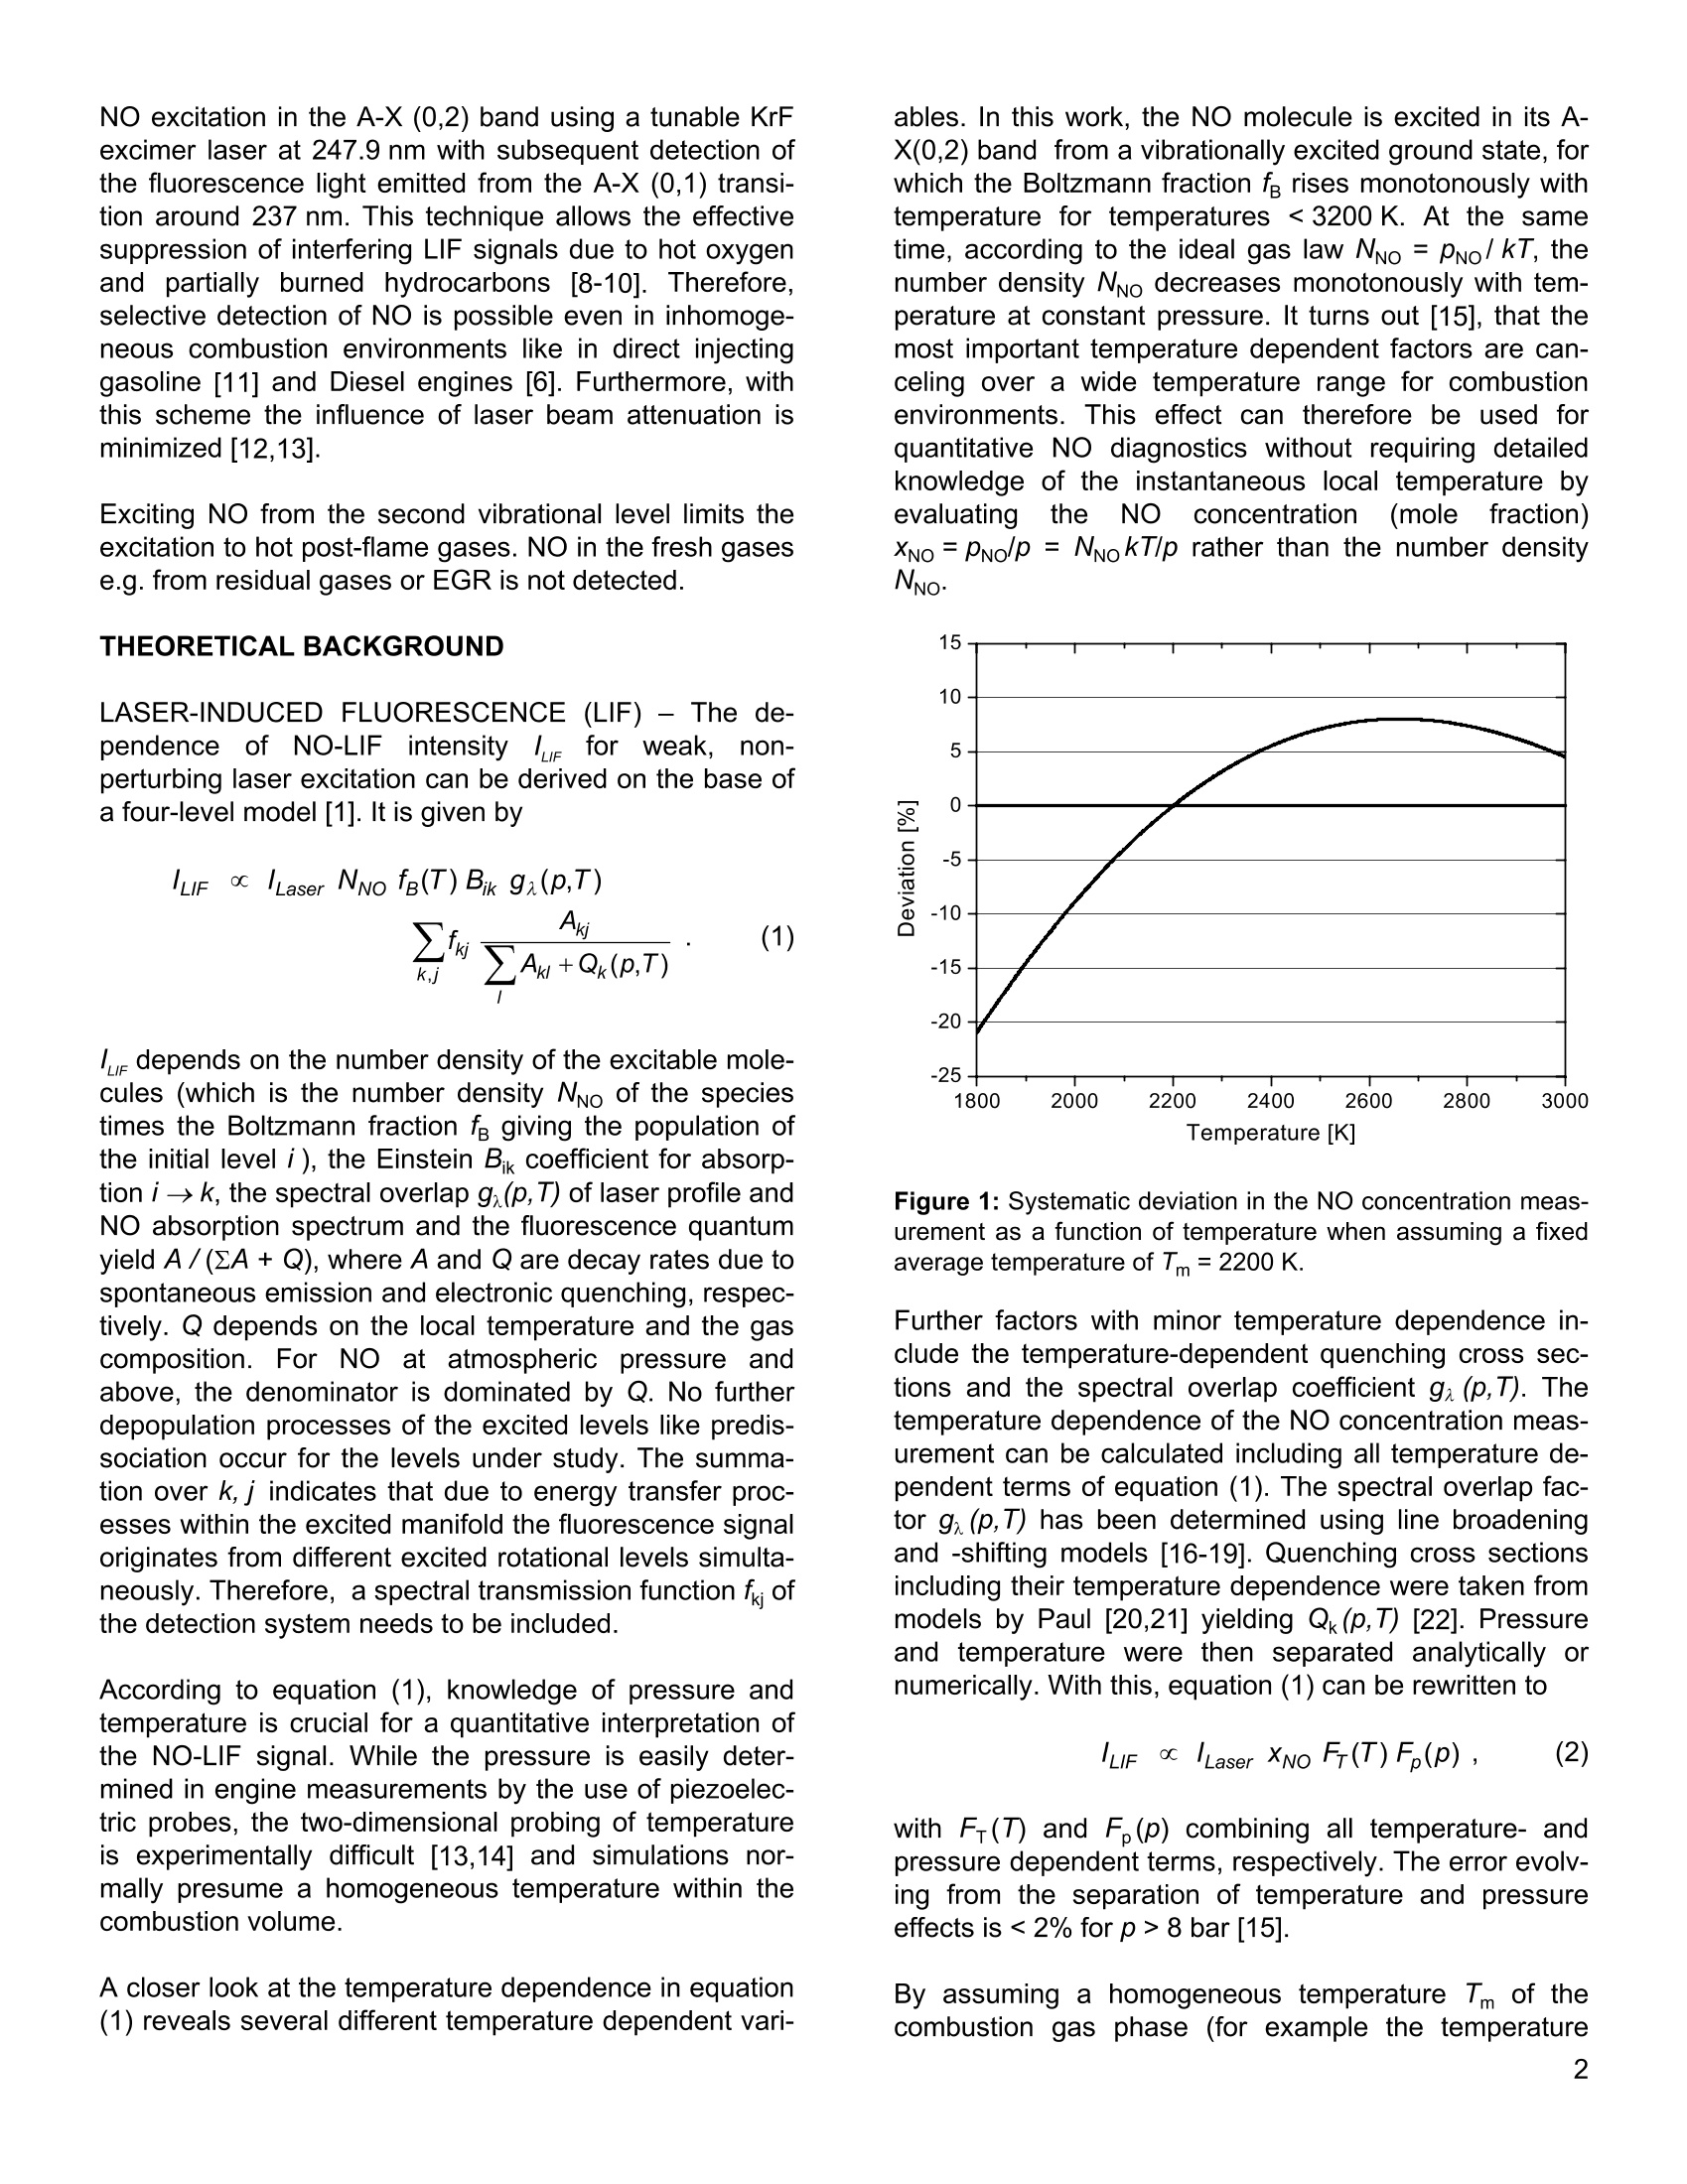
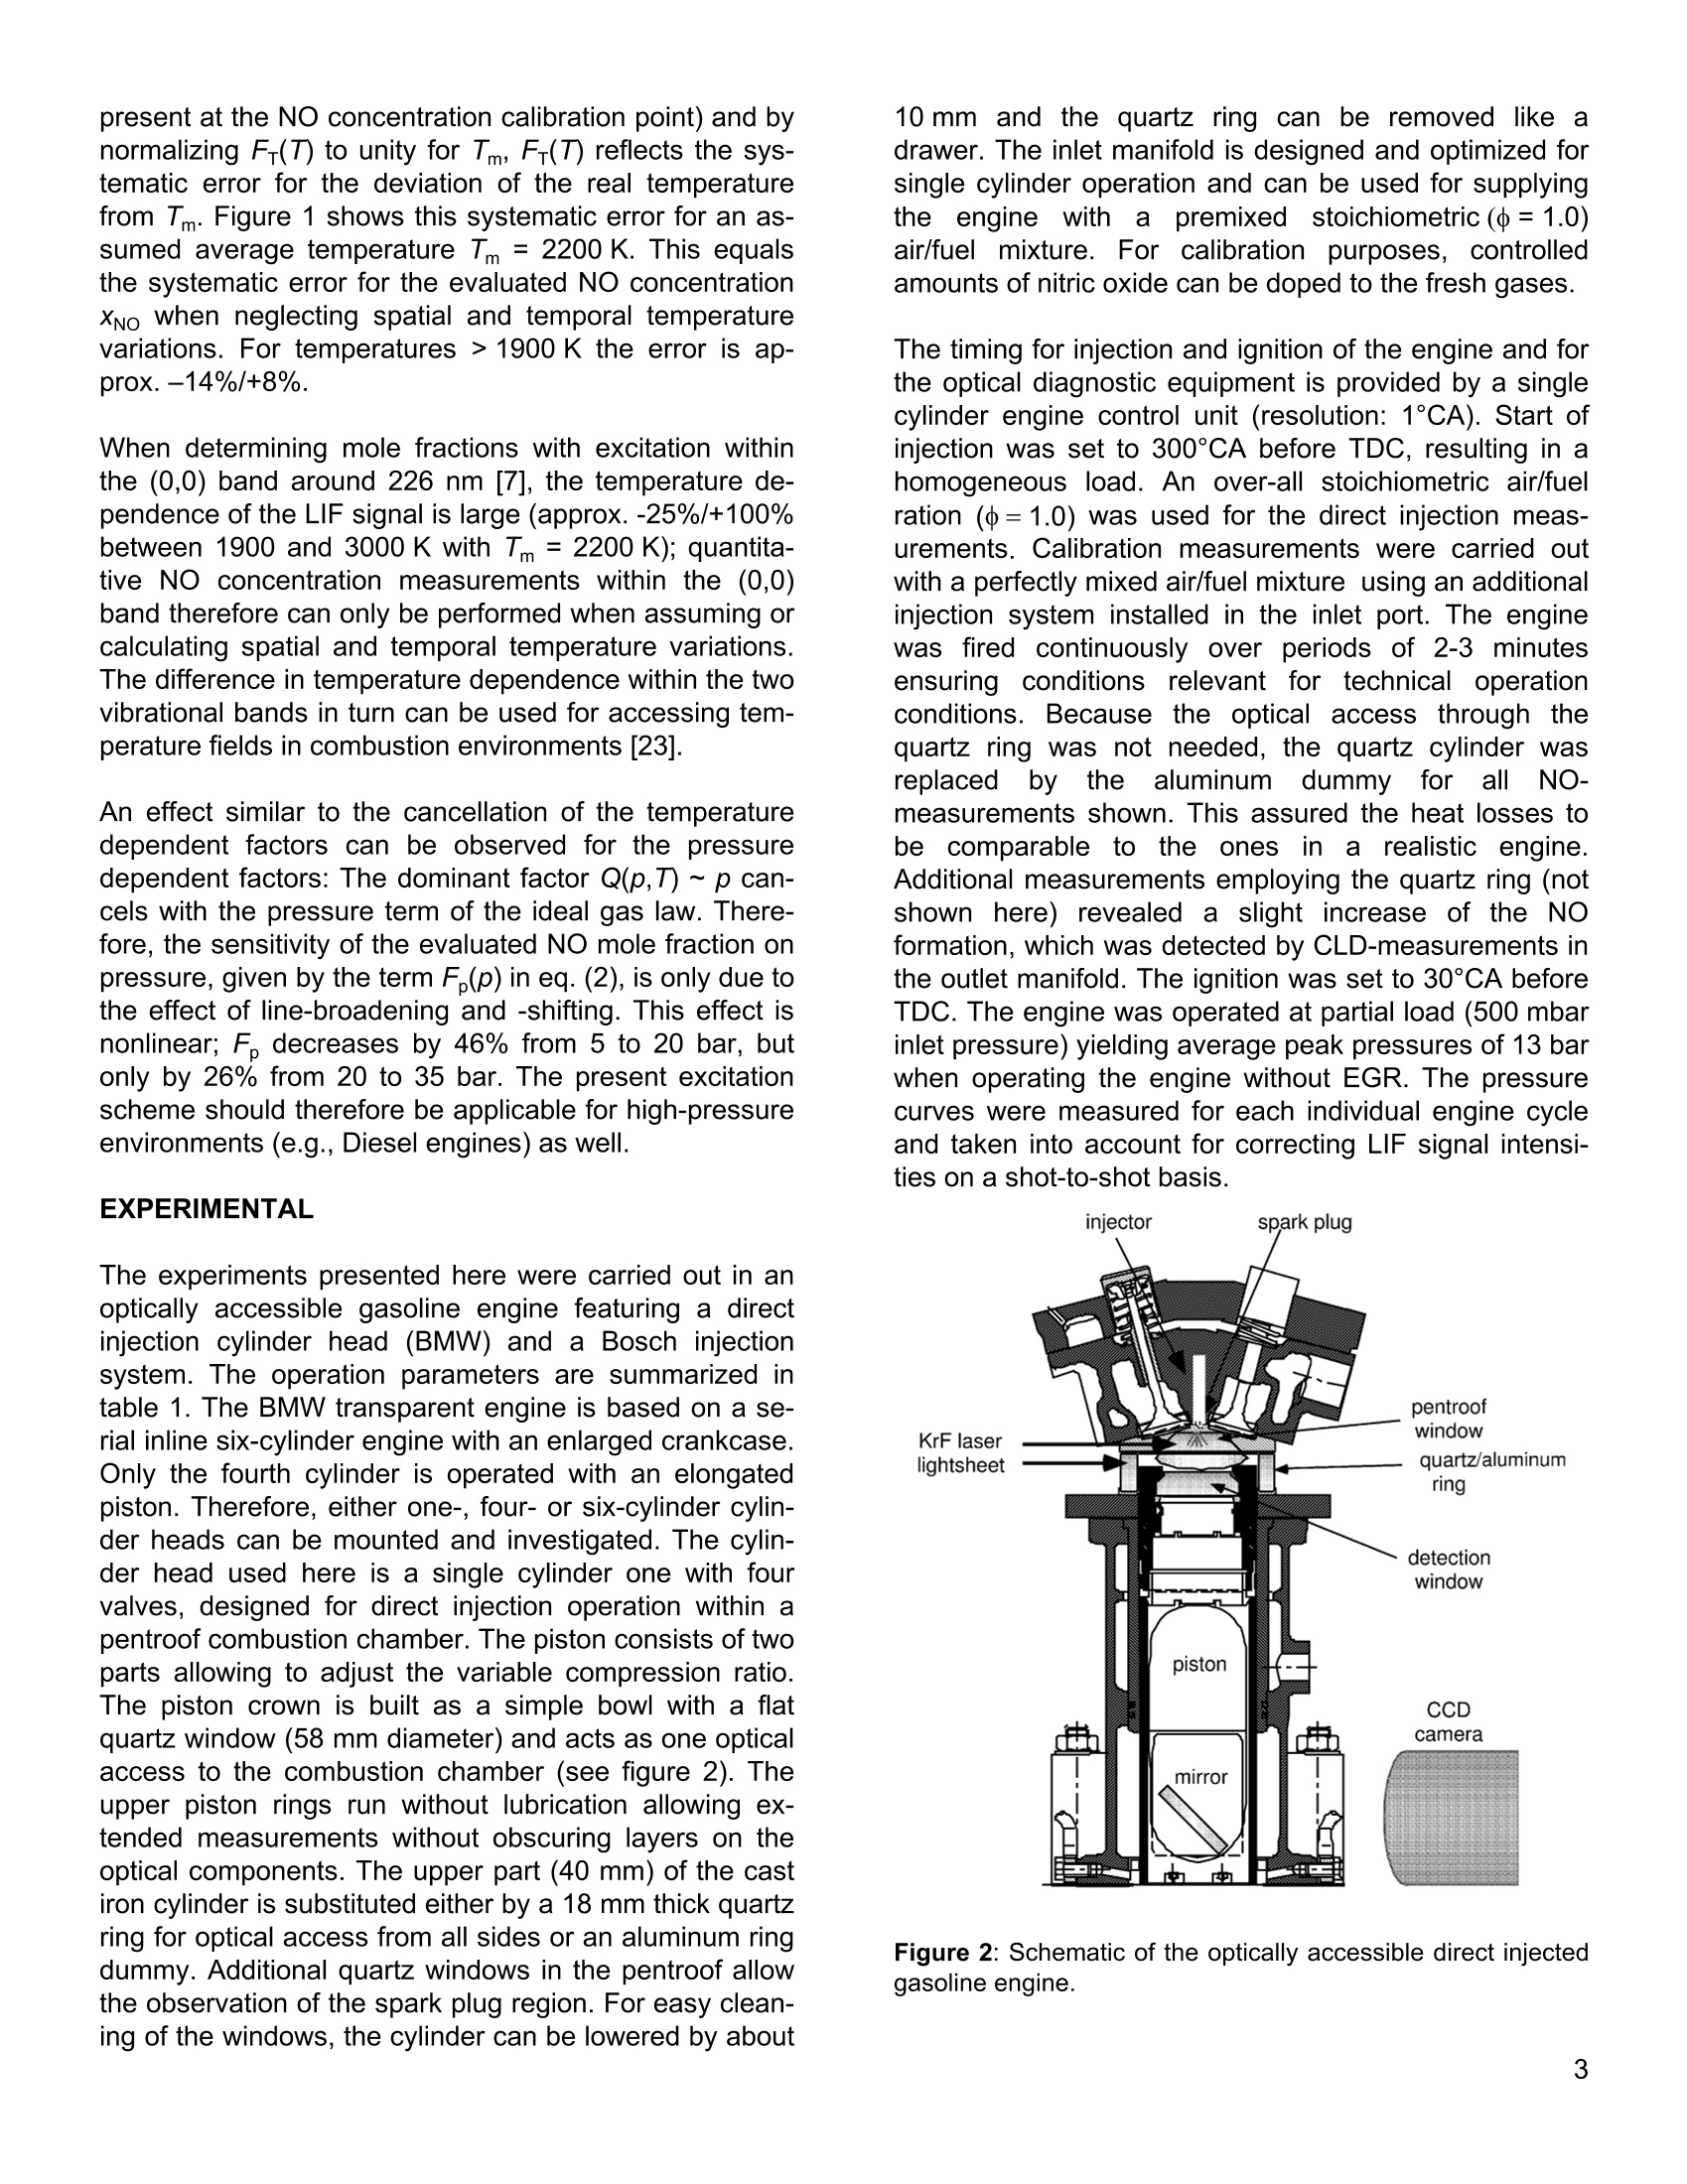
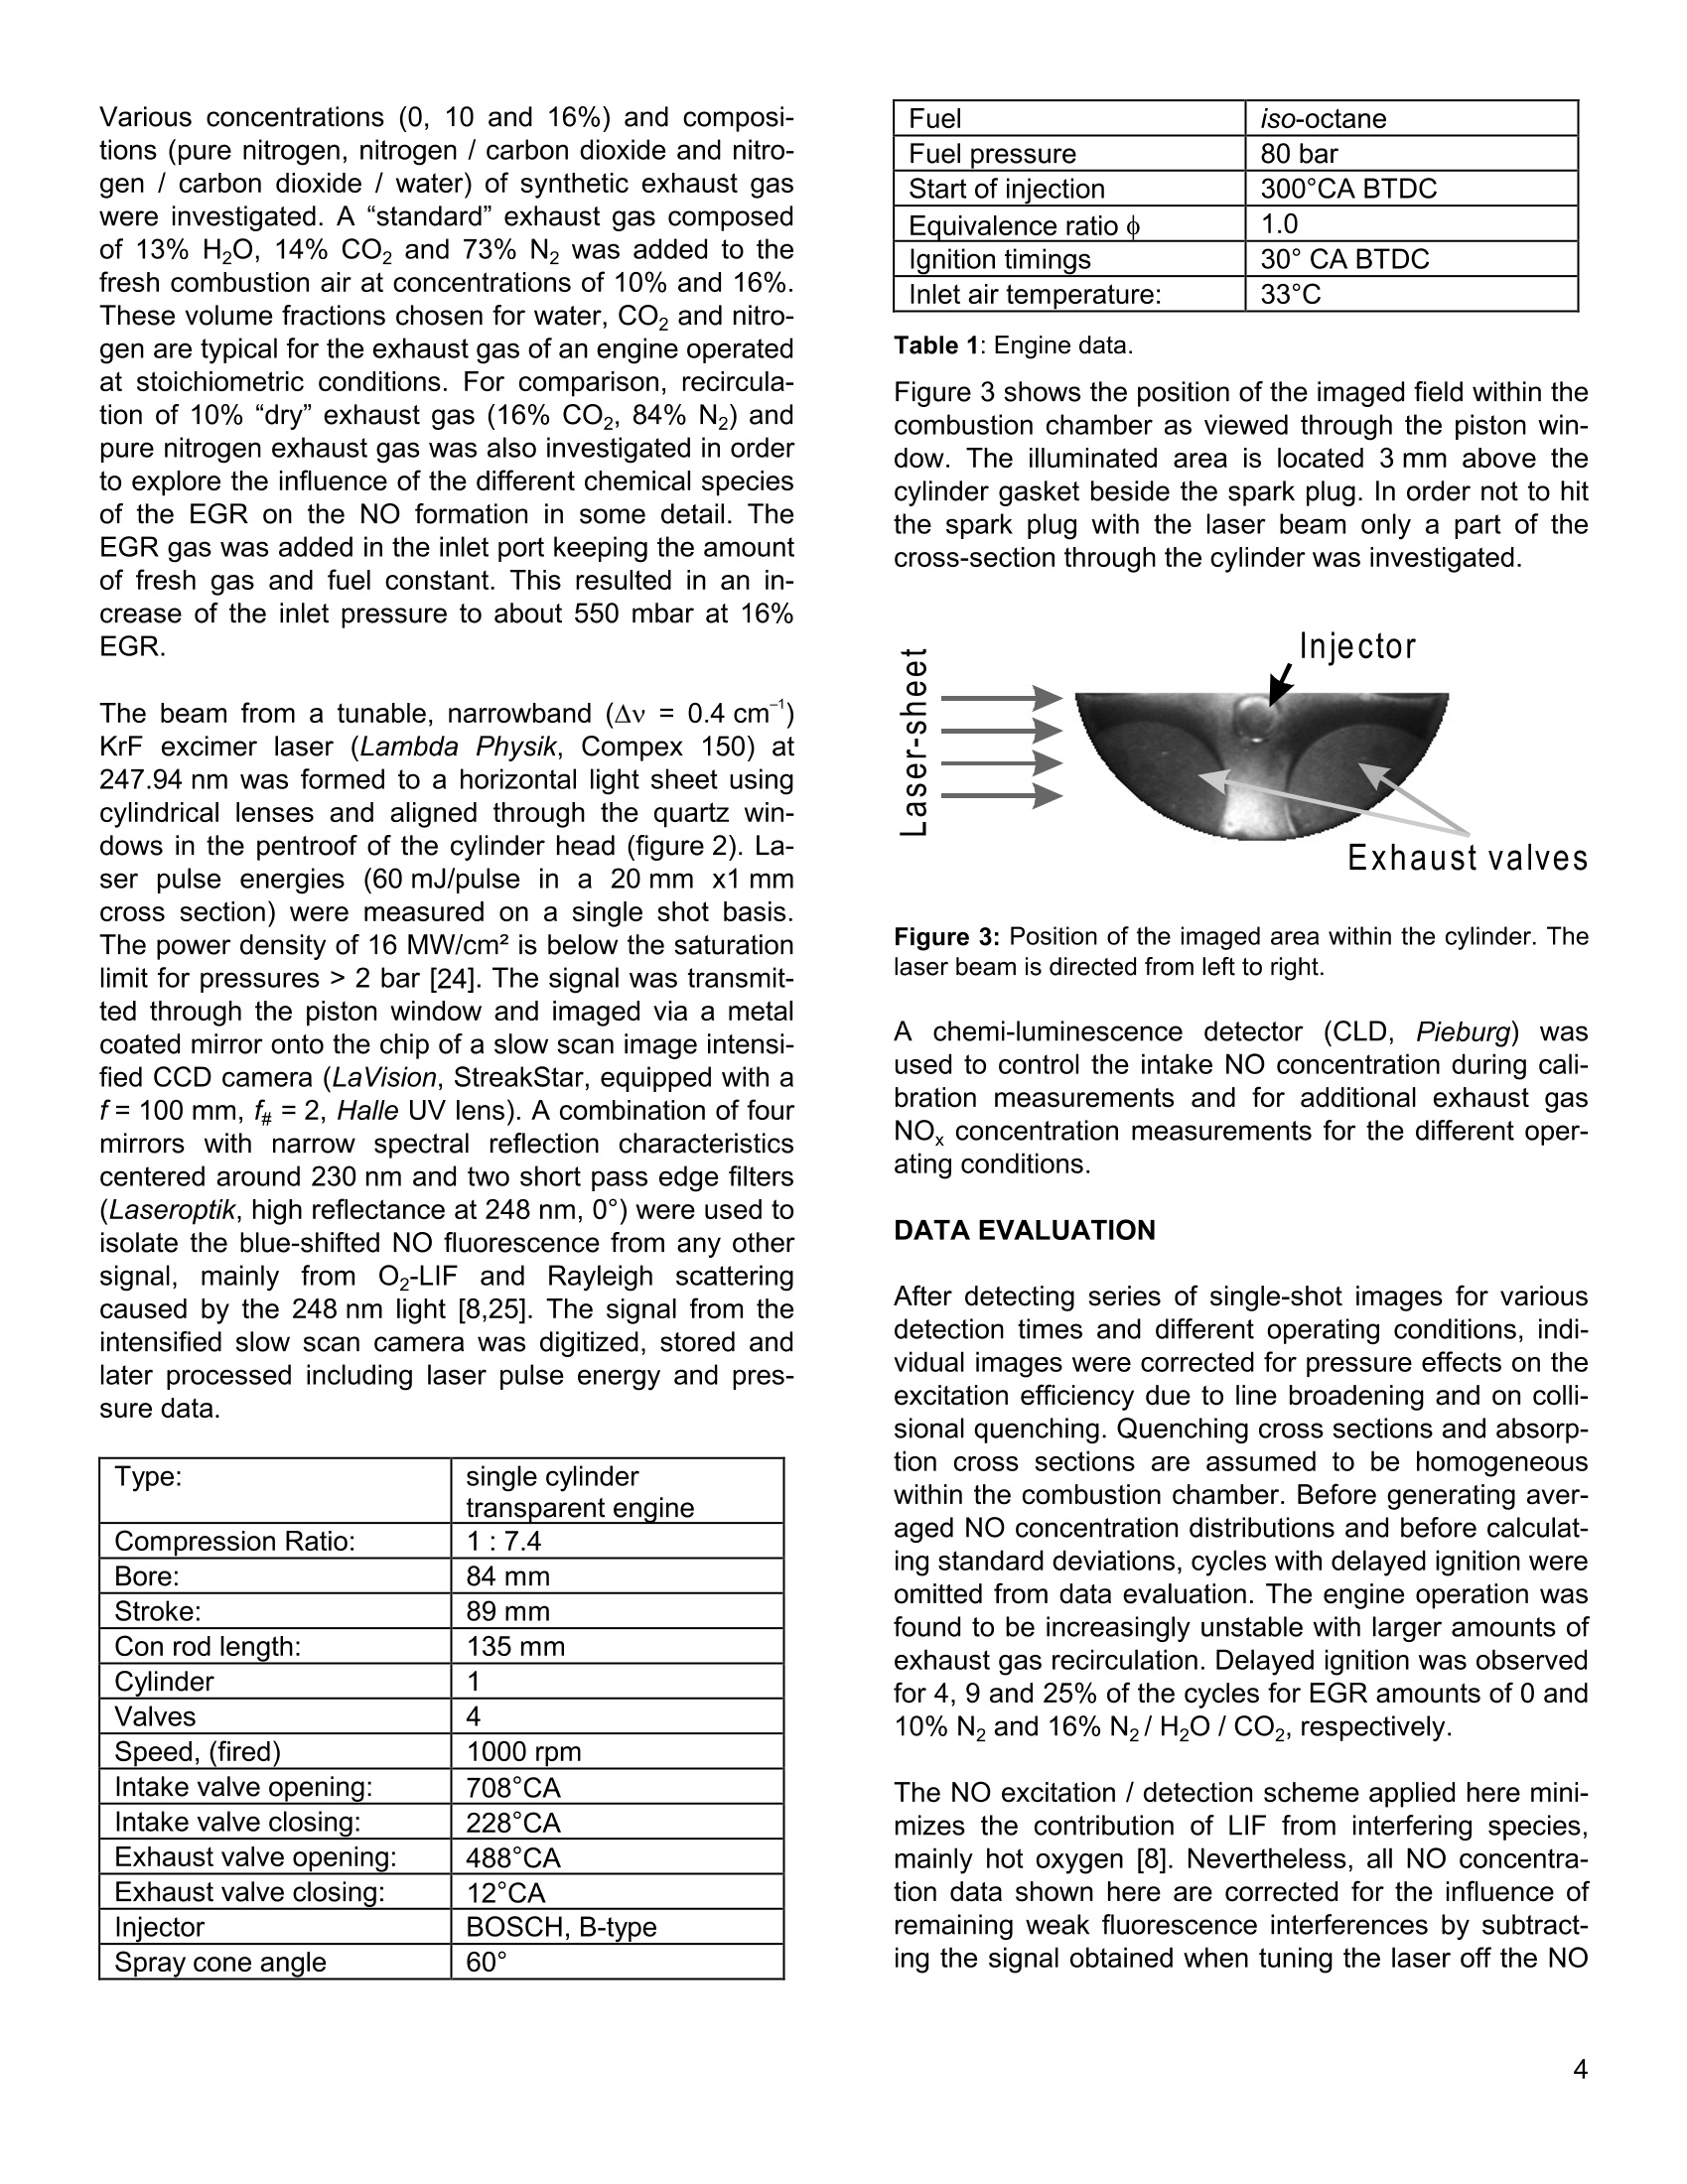
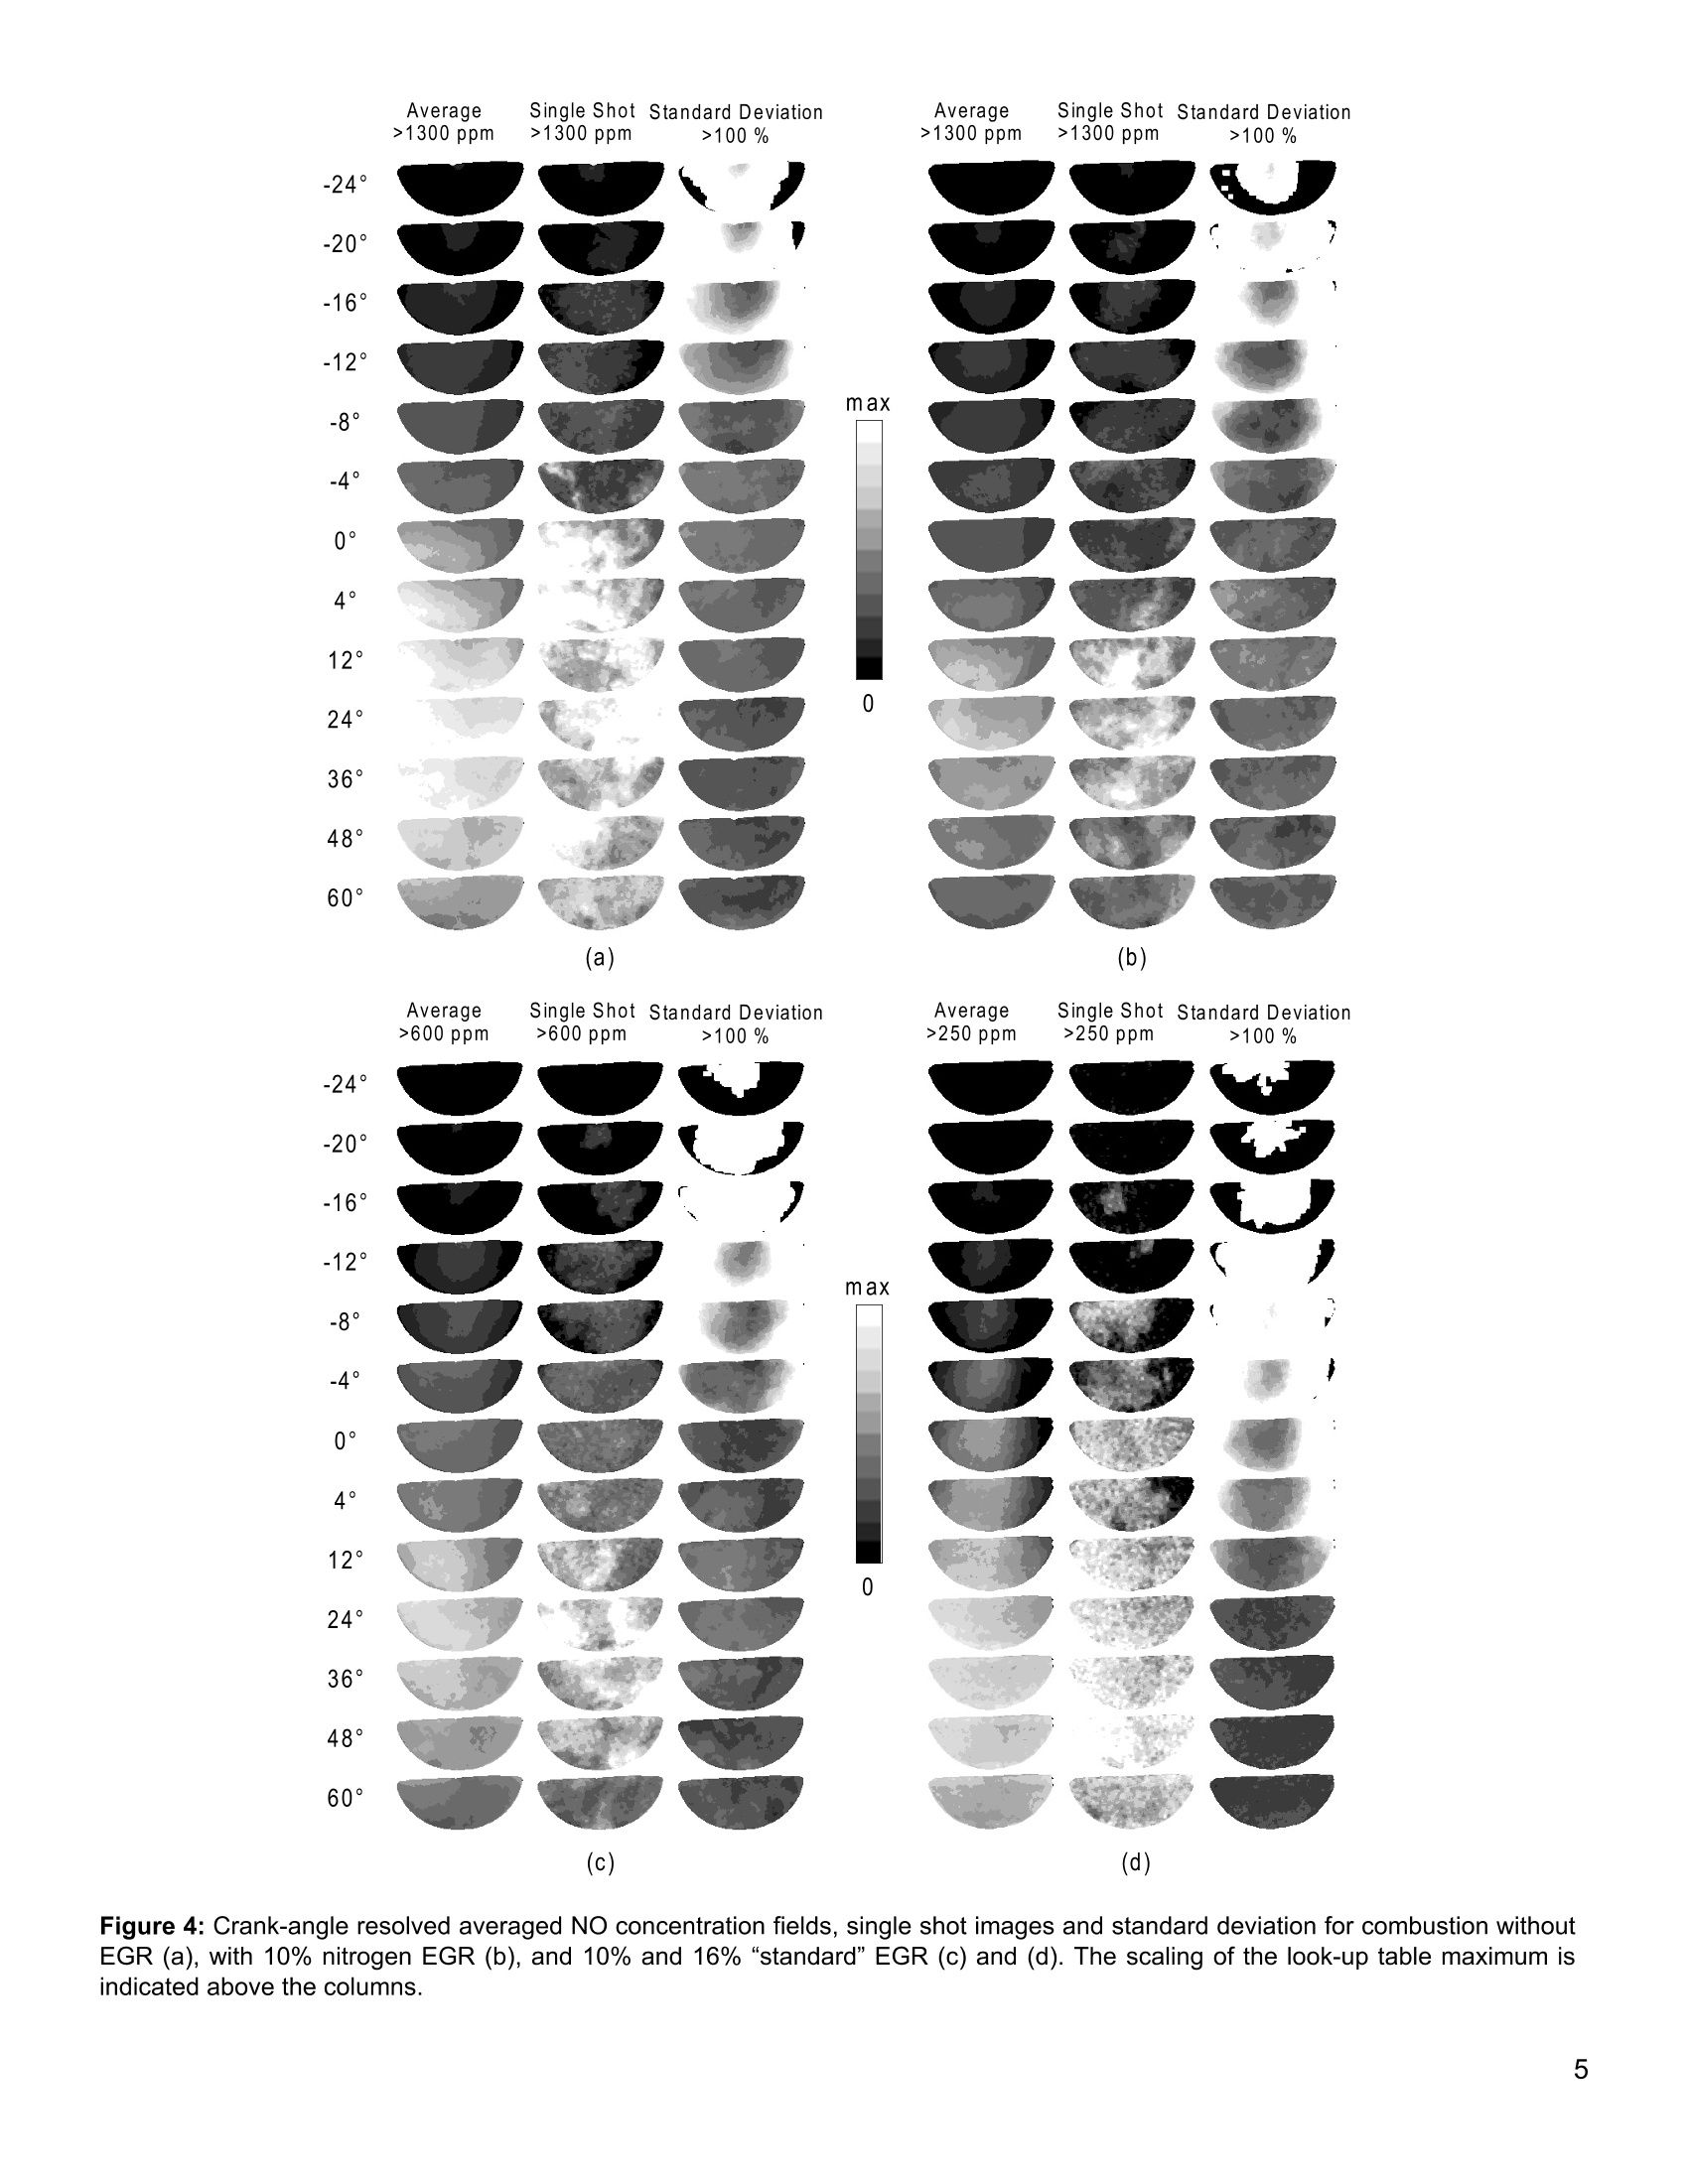
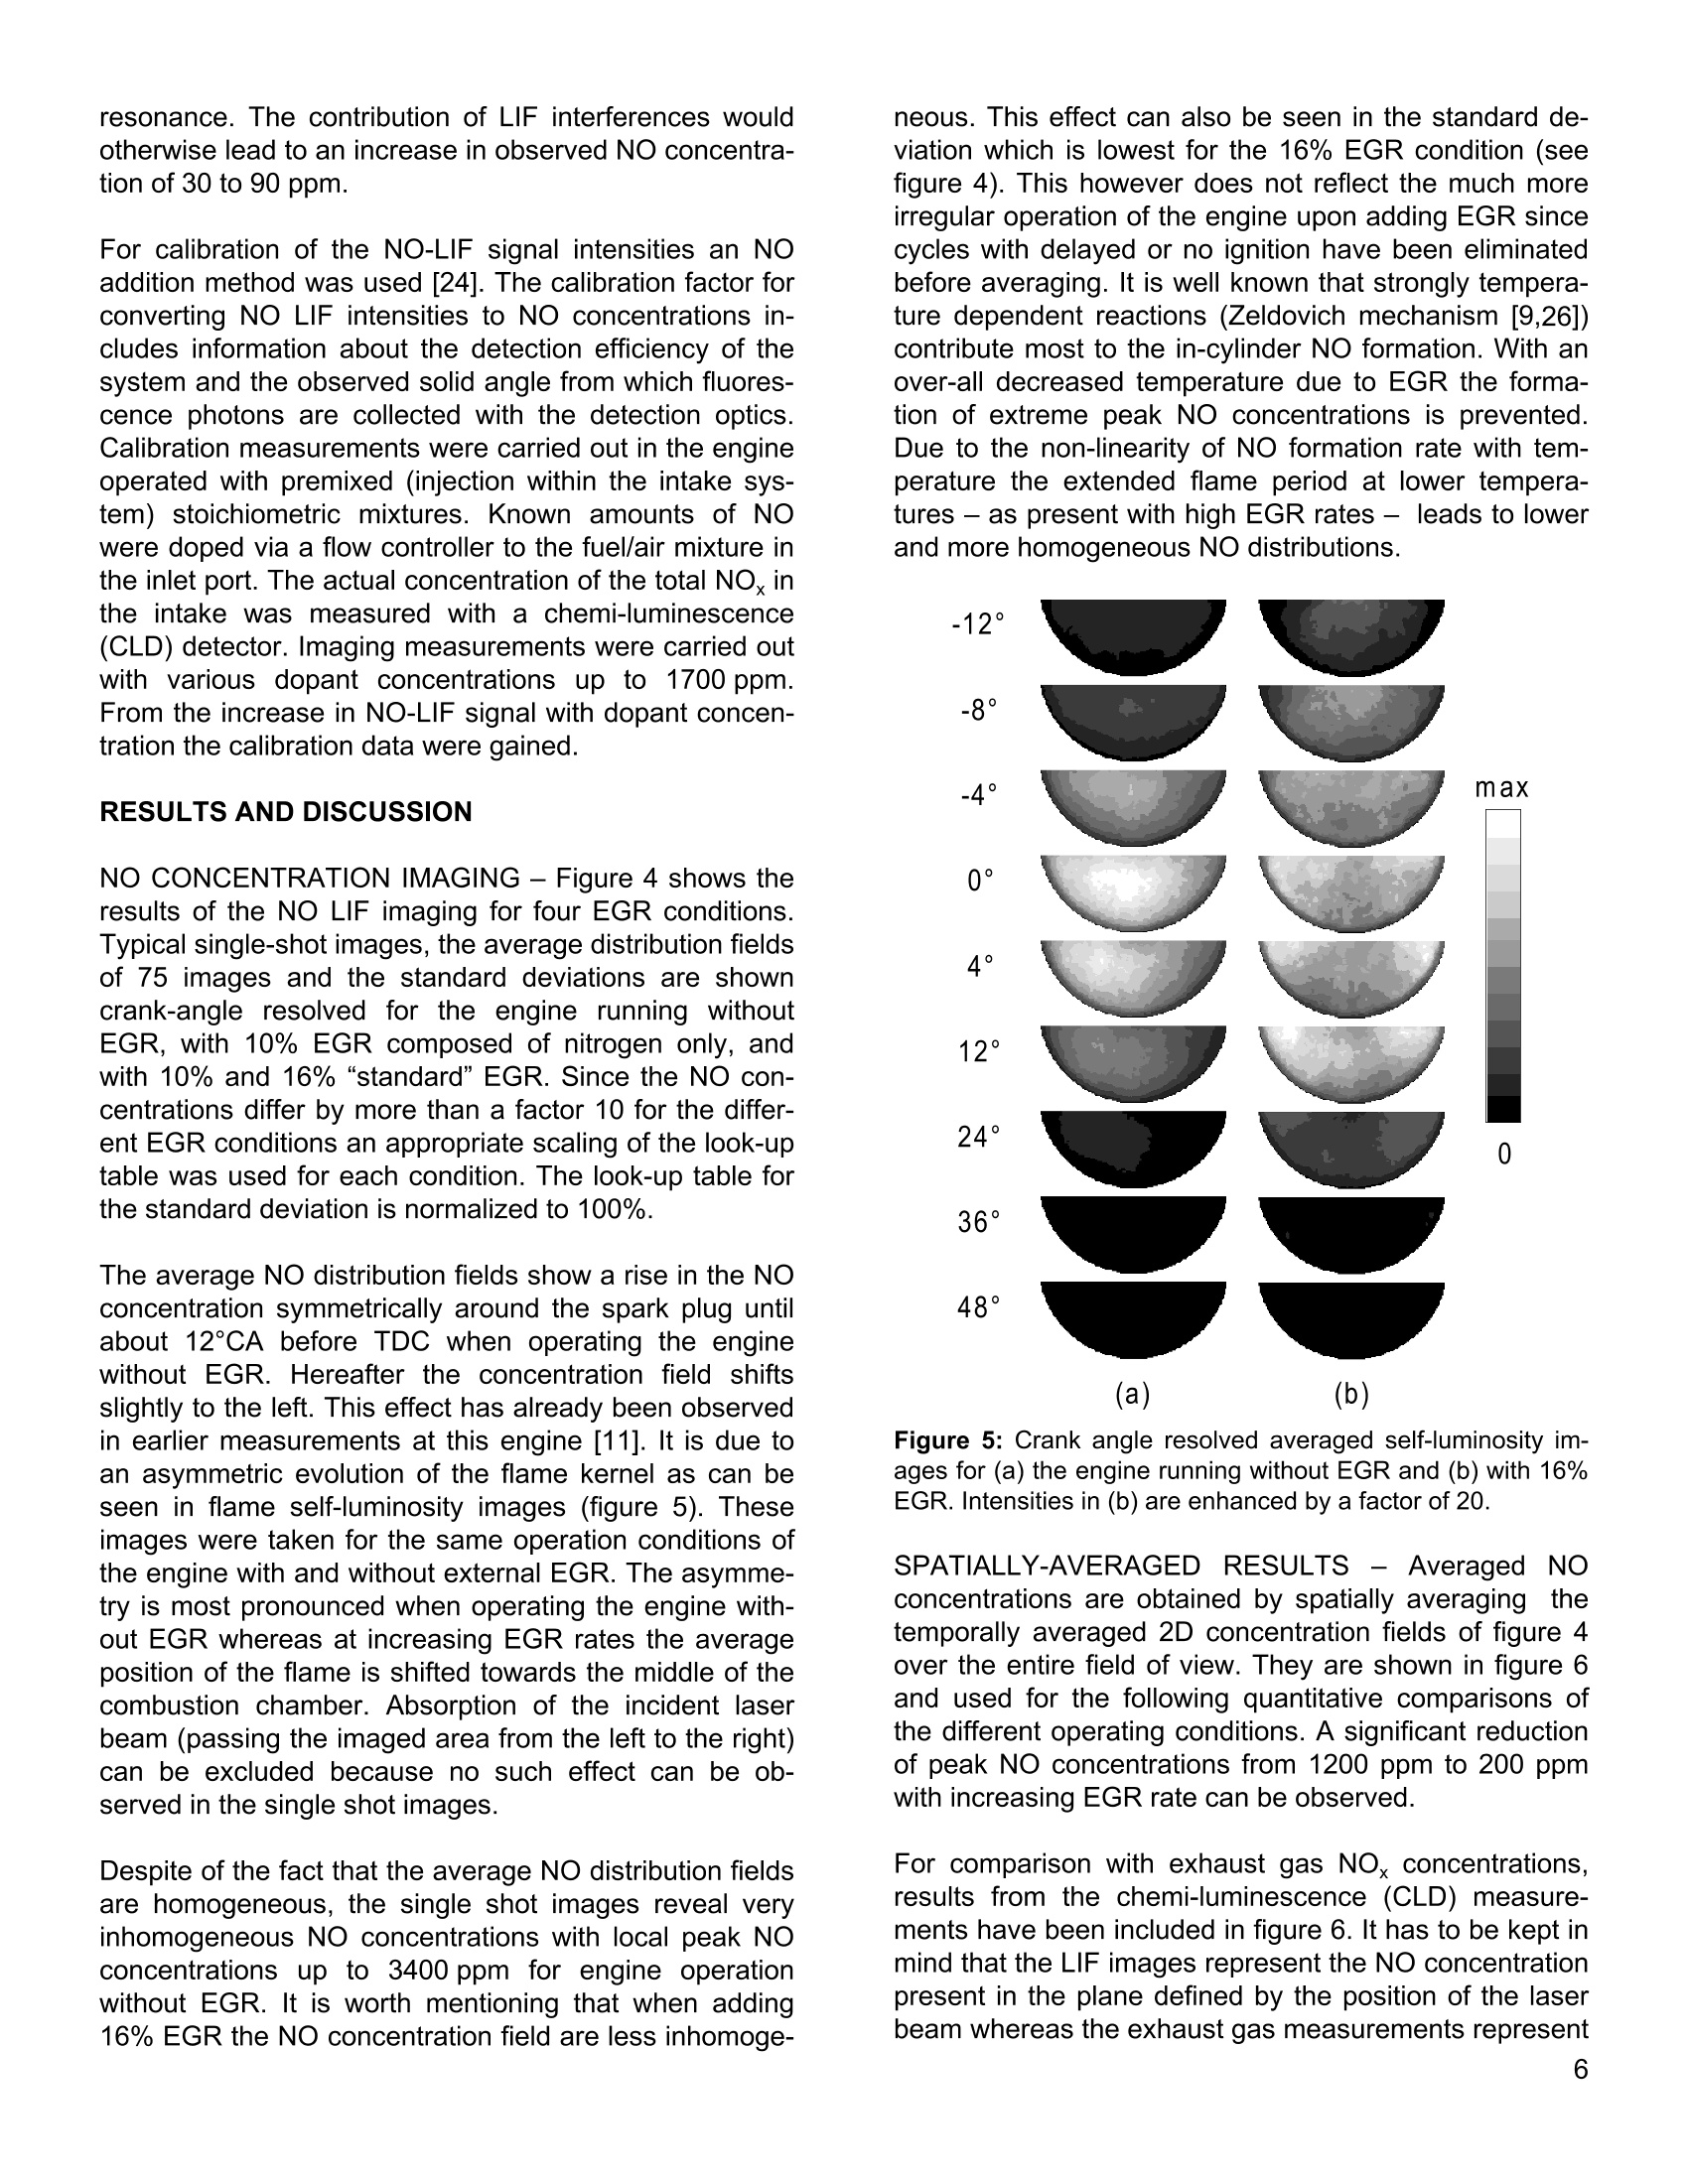
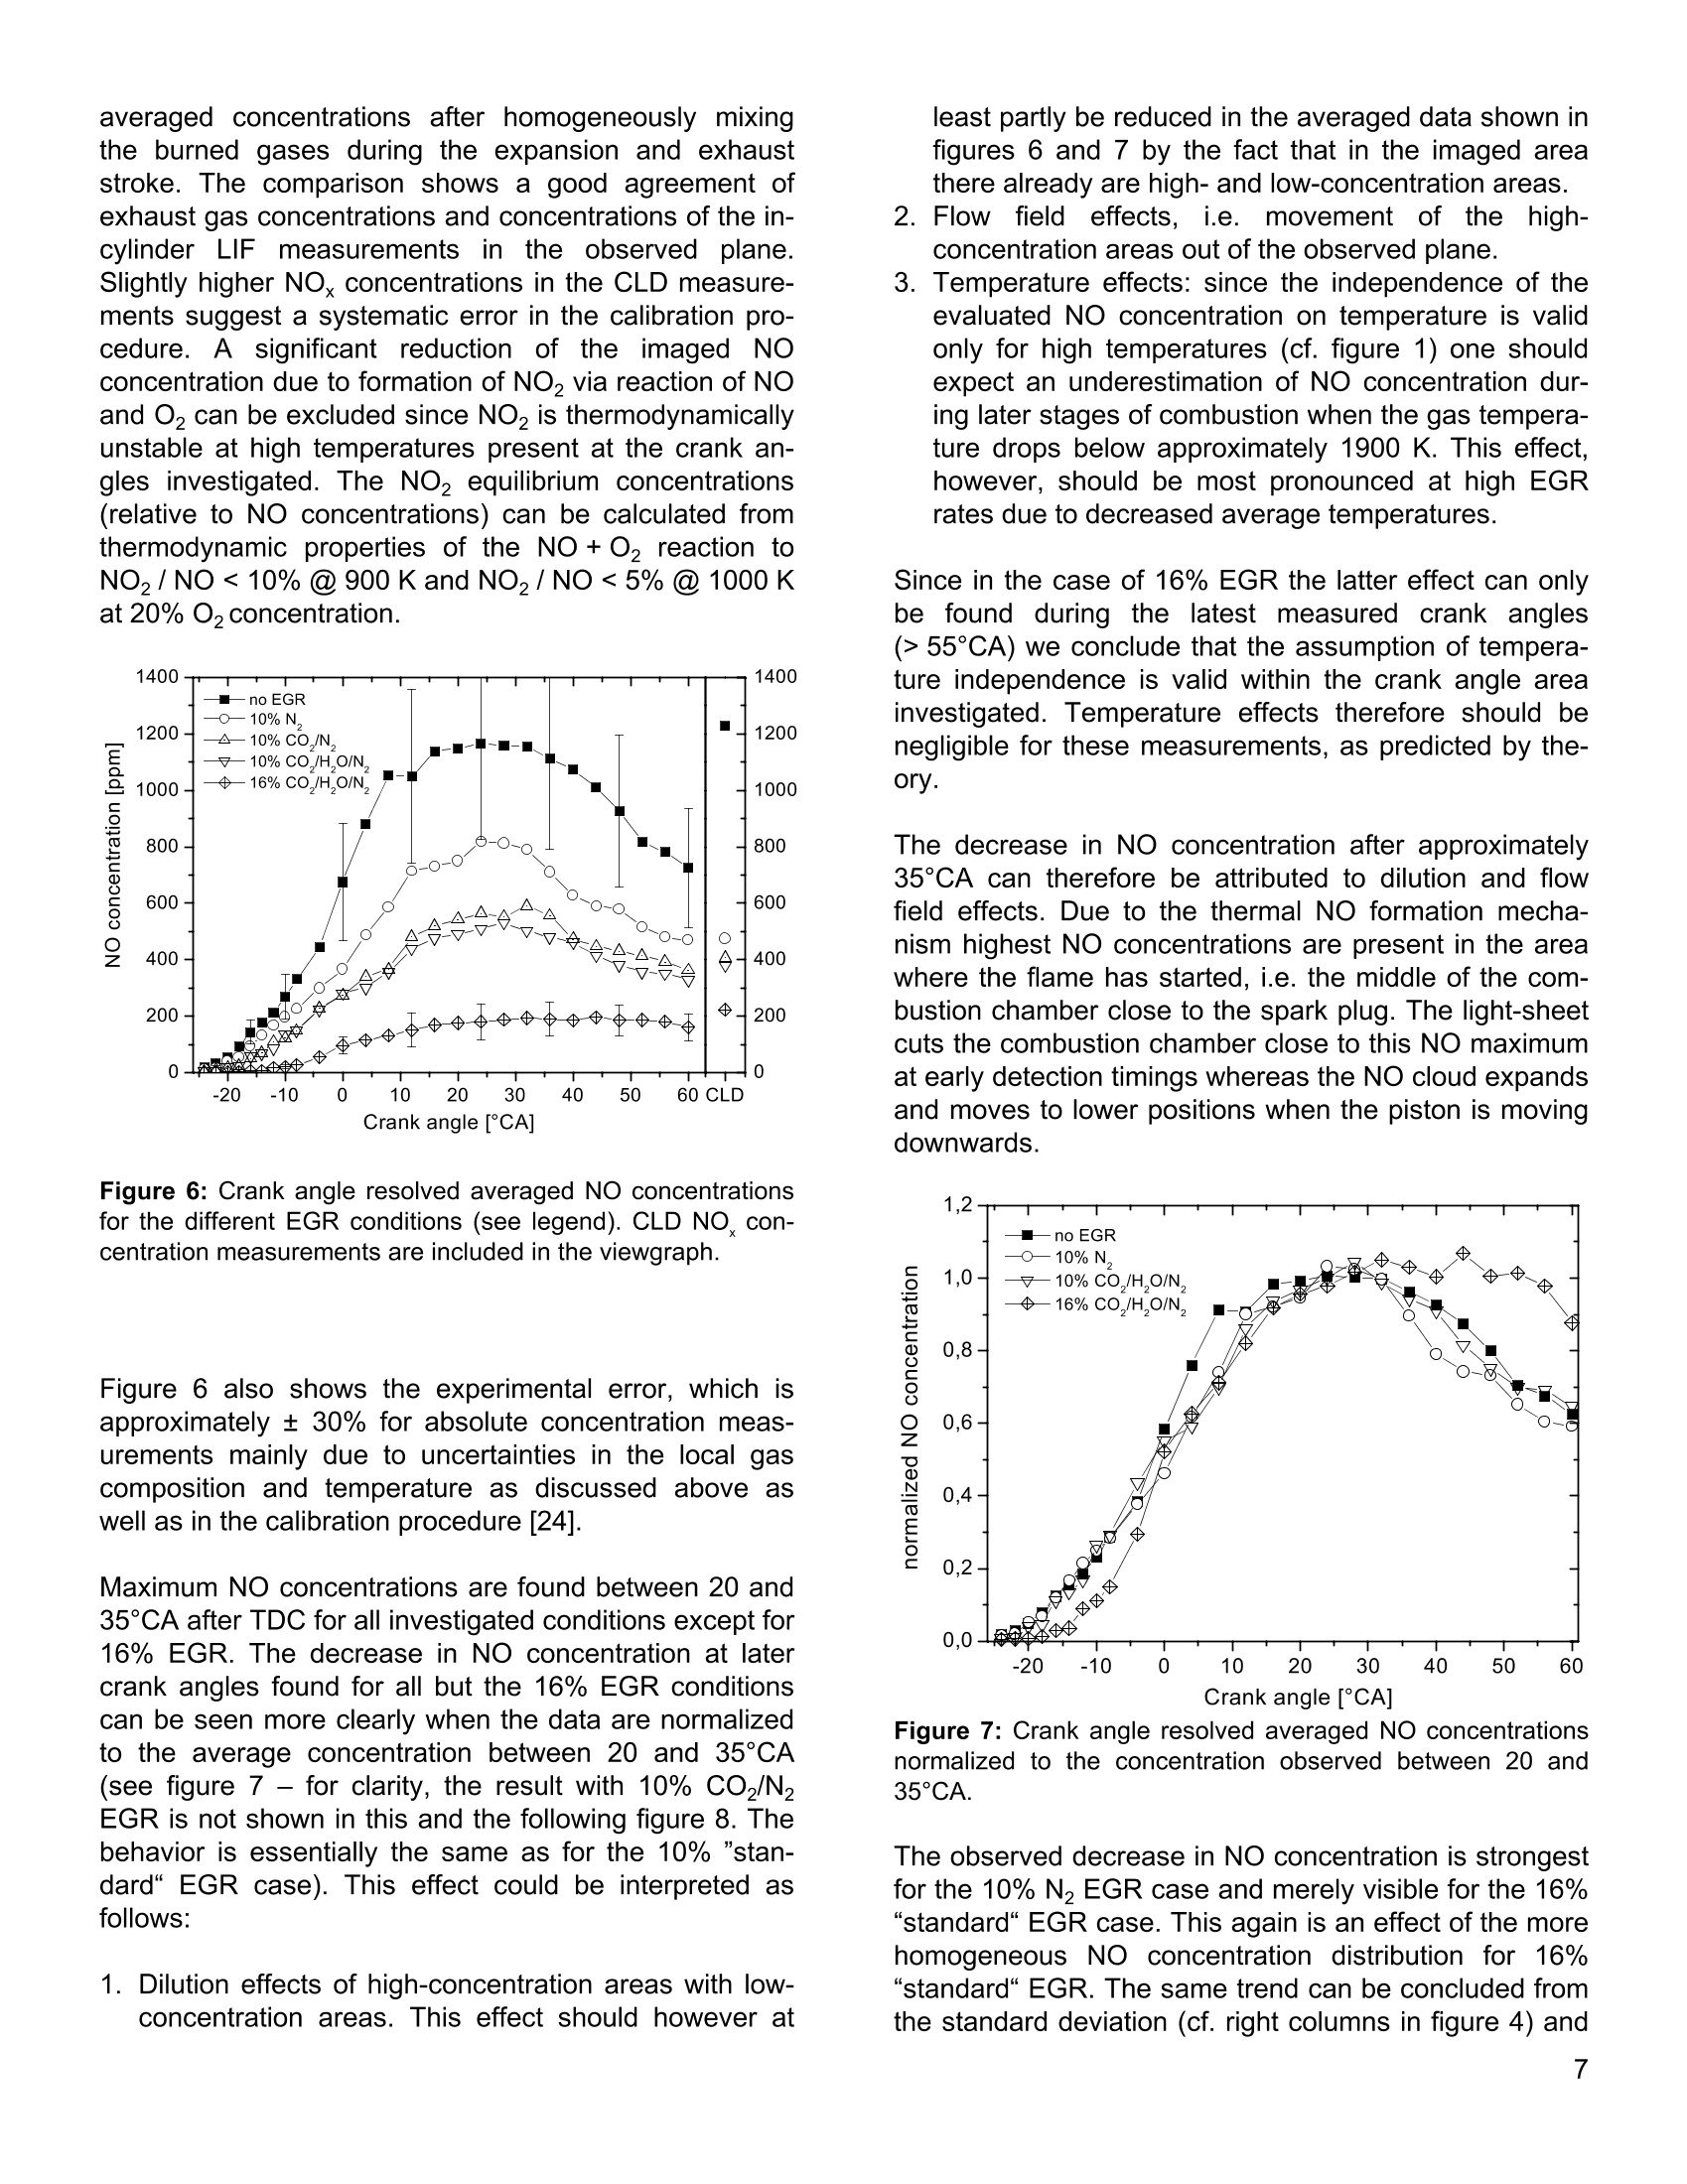
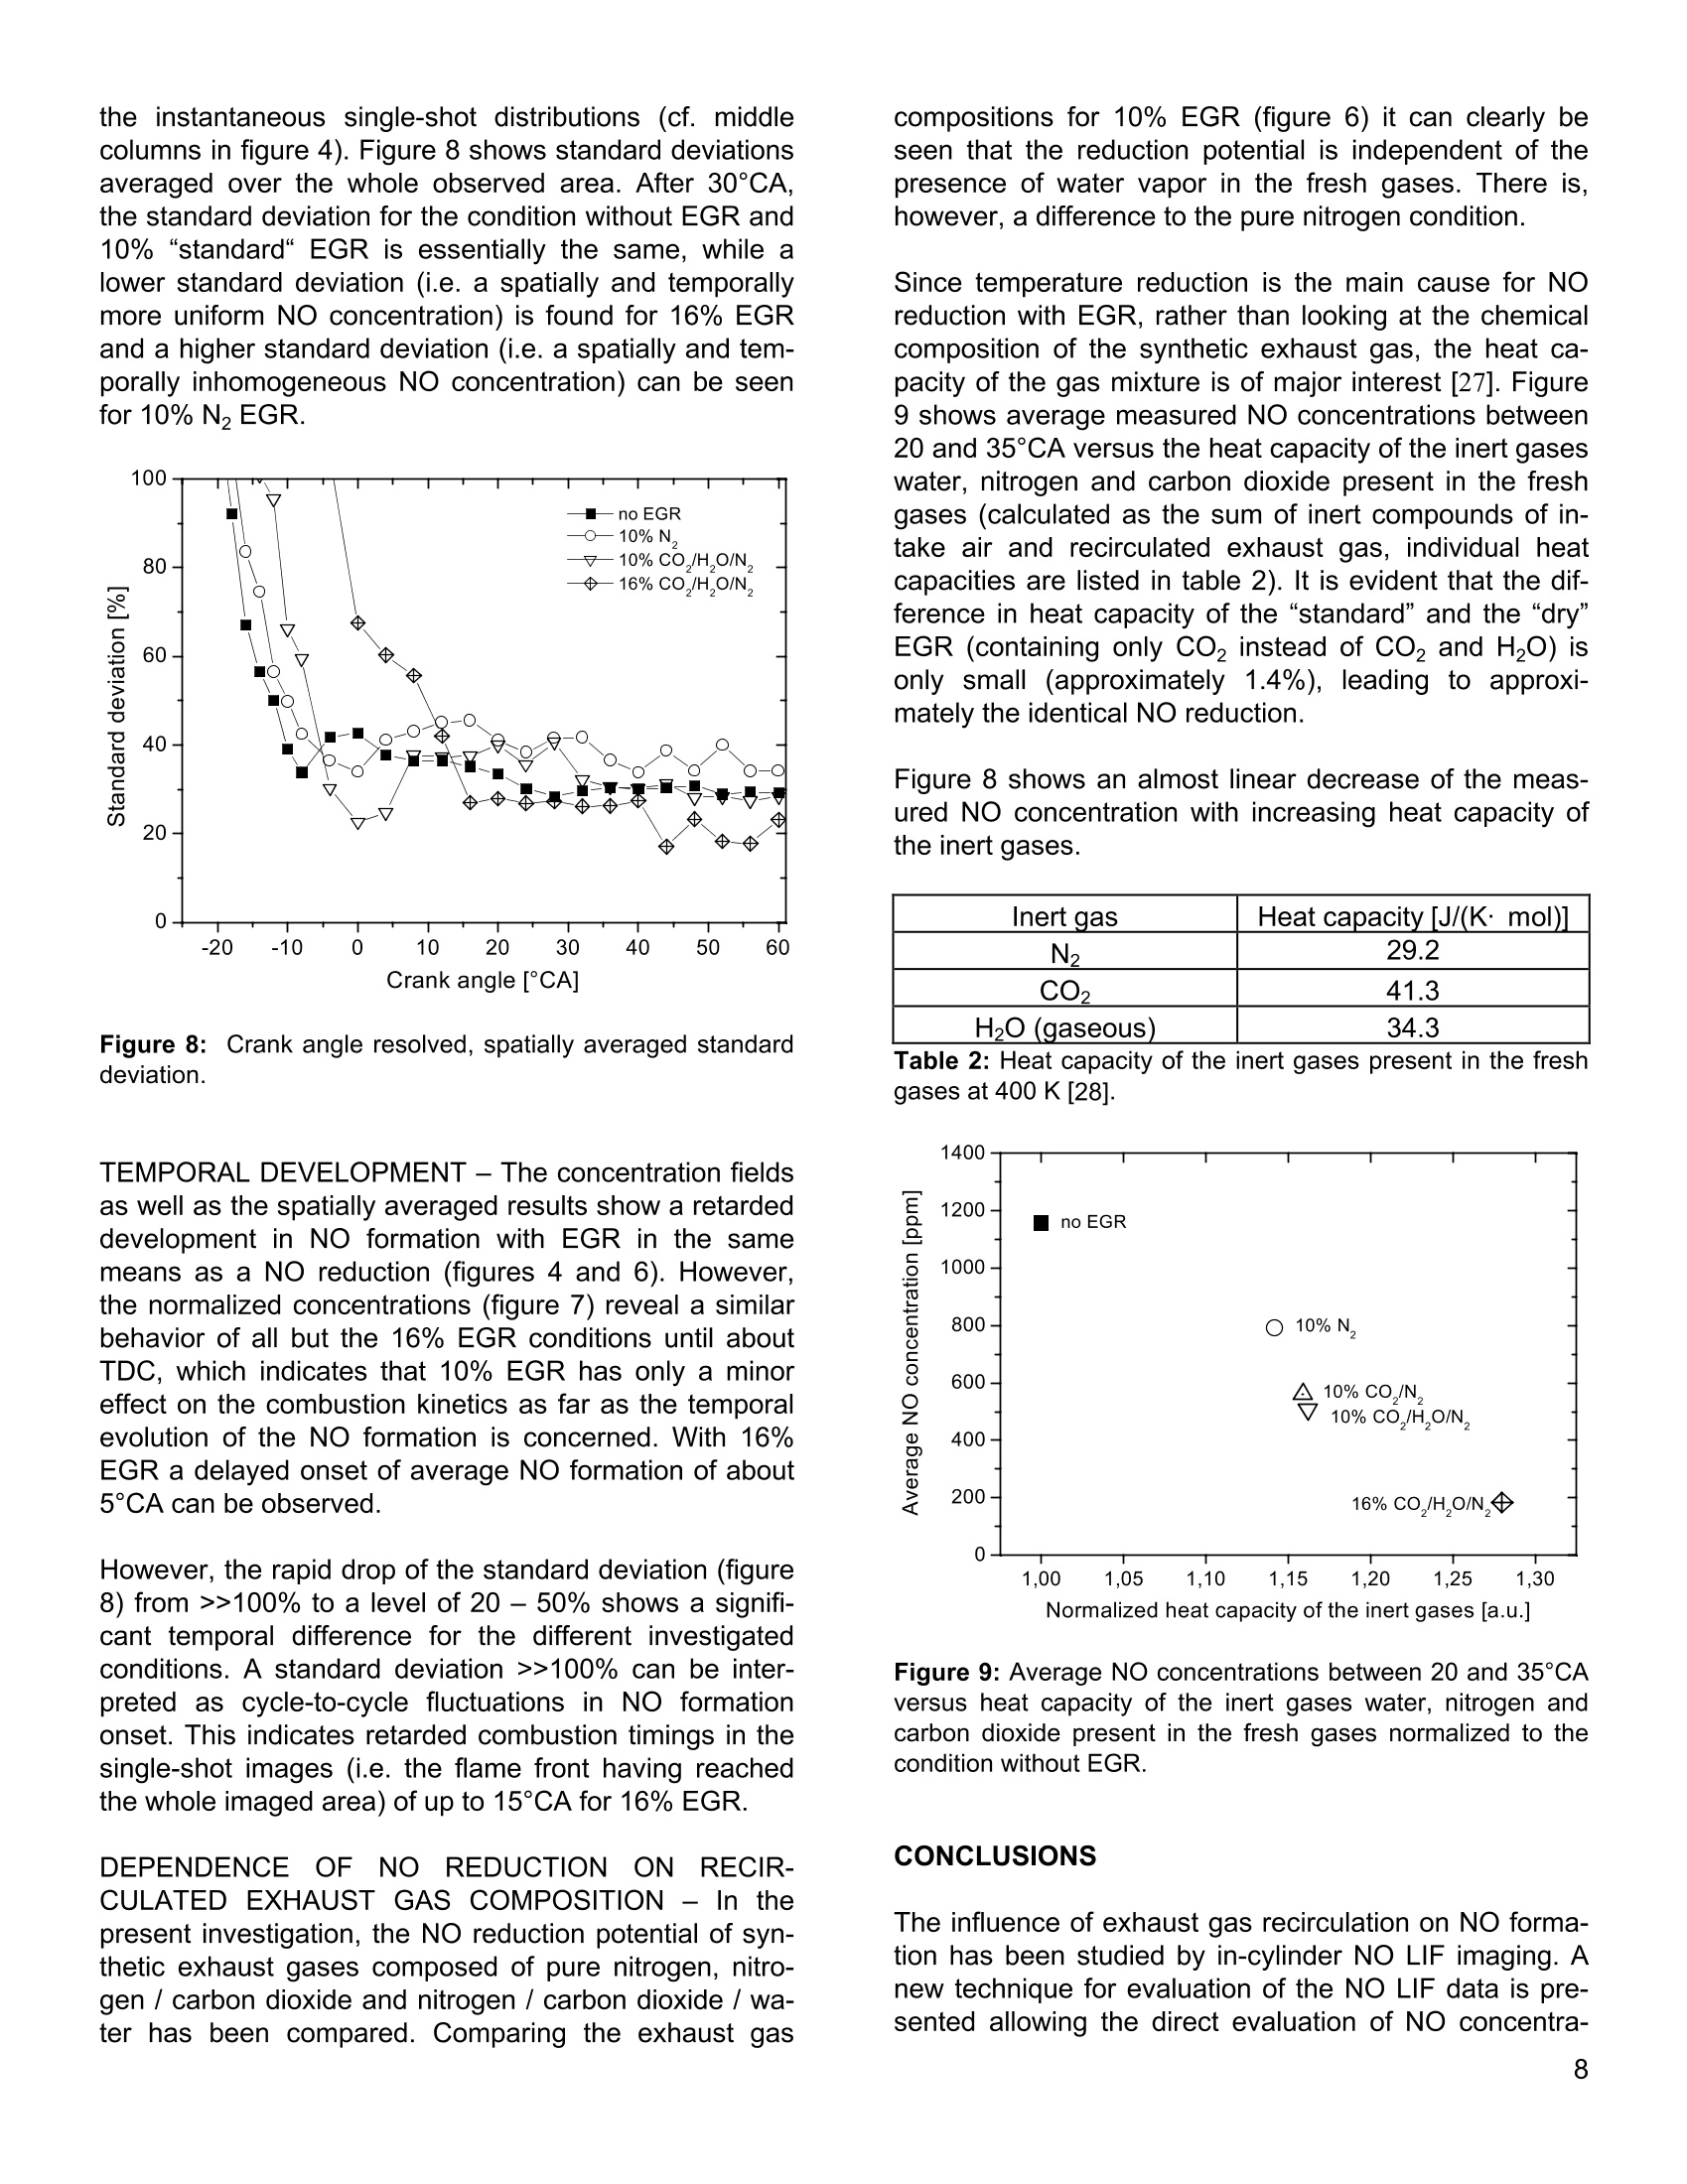
2001-01-1978 Quantitative in-cylinder NO-LIF imaging in a direct-injectedgasoline engine with exhaust gas recirculation PCI, University of Heidelberg, Germany ABSTRACT The influence of exhaust gas recirculation (EGR) on theformation of nitric oxide (NO) was studied experimentallyin a transparent gasoline direct injection engine by quan-titative laser-induced fluorescence imaging. Spectralproperties of the excited transition within the NO Az*-XTI(0,2) band are well known from previous studies. Theexcitation scheme allows quantitative NO concentrationmeasurements without detailed knowledge of the gasphase temperature. Good agreement was found withexhaust gas NO, chemi-luminescence (CLD) measure-ments. The experiments were carried out in an optically acces-sible gasoline engine featuring a direct injection cylinderhead (BMW) and a Bosch injection system, based on aserial inline six-cylinder engine with an enlarged crank-case. The measurements were performed in the pent-roof section of the combustion chamber. Various concentrations (0, 10 and 16%) and composi-tions (pure nitrogen, nitrogen / carbon dioxide and nitro-gen / carbon dioxide / water) of synthetic exhaust gaswere investigated. NO formation could be significantlyreduced by EGR, from an average of about 1200 ppm(without EGR) to about 200 ppm (16% EGR-rate). TheNO formation decreased steadily with increasing heatcapacity of the inert gases present, independent of theirchemical composition. In the temporal evolution of theNO formation, a retarded onset of up to 5° CA was foundwith 16% EGR. The two-dimensional NO concentrationfields appeared to be very homogeneous when adding16% EGR, whereas without EGR, strong inhomogenei- Wolfgang G. Bessler, Christof Schulz Matthias Hartmann, Martin Schenk BMW AG, Munchen, Germany ties with local NO peak concentrations of up to 3400 ppmwere detected. INTRODUCTION Minimizing the generation of the pollutant nitric oxide isof particular interest when improving the environmentalacceptance of internal combustion engines. While therelease of many unwanted exhaust compounds like un-burned hydrocarbons and carbon monoxide has beendrastically reduced within the last years, further effort hasto be made to further reduce the NO release to meetfuture legislative regulations. Especially in modern leanburning engines, inhomogeneous combustion conditionsmake it difficult to control the pollutant formation. Fur-thermore, standard catalytic converters can not be usedsince the overall air/fuel ratio deviates significantly fromunity. Exhaust gas recirculation (EGR) has been usedsuccessfully in Diesel and in gasoline engines to reducethe raw NO formation mainly due to decreased combus-tion temperatures. A detailed understanding of the ele-mentary physical and chemical steps involved as well astheir coupling is necessary to allow a mathematical de-scription of the combustion process. Models with theability of predicting optimized operating conditions, how-ever, need input and feedback from preferably quantita-tive in-cylinder experiments. A large variety of combustion relevant species has beensuccessfully detected quantitatively using laser-inducedfluorescence (LIF) [1]. Imaging measurements have alsobeen carried out successfully in IC engines [2]. Differenttechniques for imaging NO distributions in Sl [3] andDiesel engines [4-7] have been developed. Many recentexperiments were based on a detection scheme using NO excitation in the A-X(0,2) band using a tunable KrFexcimer laser at 247.9 nm with subsequent detection ofthe fluorescence light emitted from the A-X (0,1) transi-tion around 237 nm. This technique allows the effectivesuppression of interfering LIF signals due to hot oxygenand partially burned hydrocarbonsS[8-10]. Therefore,selective detection of NO is possible even in inhomoge-neous combustion environments like in direct injectinggasoline [11] and Diesel engines [6]. Furthermore, withthis scheme the influence of laser beam attenuation isminimized [12,13]. Exciting NO from the second vibrational level limits theexcitation to hot post-flame gases. NO in the fresh gasese.g. from residual gases or EGR is not detected. THEORETICAL BACKGROUND LASER-INDUCED FLUORESCENCE (LIF)-The de-pendence of NO-LIF intetnesnistiyt yi ur for weak,, non-perturbing laser excitation can be derived on the base ofa four-level model [1]. It is given by luF c lLaser NNo fe(T) Bik 9a(p,T) lur depends on the number density of the excitable mole-cules (which is the number density Nno of the speciestimes the Boltzmann fraction fe giving the. p.opulation ofthe initial leveli), the Einstein Bik coefficient for absorp-tioni→k, the spectral overlap g(p,T) of laser profile andNO absorption spectrum and the fluorescence quantumyield A/(ZA+Q), where A and Q are decay rates due tospontaneous emission and electronic quenching, respec-tively. Q depends on the local temperature and the gascomposition. For NO at atmospheric pressure andabove, the denominator is dominated by Q. No furtherdepopulation processes of the excited levels like predis-sociation occur for the levels under study. The summa-tion over k, j indicates that due to energy transfer proc-esses within the excited manifold the fluorescence signaloriginates from different excited rotational levels simulta-neously. Therefore, a spectral transmission function f ofthe detection system needs to be included. According to equation (1), knowledge of pressure andtemperature is crucial for a quantitative interpretation ofthe NO-LIF signal. While the pressure is easily deter-mined in engine measurements by the use of piezoelec-tric probes, the two-dimensional probing of temperatureis experimentally difficult [13,14] and simulations nor-mally presume a homogeneous temperature within thecombustion volume. A closer look at the temperature dependence in equation(1) reveals several different temperature dependent vari- ables. In this work, the NO molecule is excited in its A-X(0,2)band from a vibrationally excited ground state, forwhich the Boltzmann fraction fe rises monotonously withtemperature for temperatures <3200 K. At the sametime, according to the ideal gas law NNo = PNo/kT, thenumber density Nno decreases monotonously with tem-perature at constant pressure. It turns out [15], that themost important temperature dependent factors are can-celing over a wide temperature range for combustionenvironments. This effect can therefore be used forquantitative NO diagnostics without requiring detailedknowledge of the instantaneous local temperature byevaluating the No concentration(mole1 fraction)XNo=PNo/p = NNokT/p rather than the number density'NNo. Figure 1: Systematic deviation in the NO concentration meas-urement as a function of temperature when assuming a fixedaverage temperature of Tm =2200 K. Further factors with minor temperature dependence in-clude the temperature-dependent quenching cross sec-tions and the spectral overlap coefficient ga (p,T). Thetemperature dependence of the NO concentration meas-urement can be calculated including all temperature de-pendent terms of equation (1). The spectral overlap fac-tor g.(p,T) has been determined using line broadeningand -shifting models [16-19]. Quenching cross sectionsincluding their temperature dependence were taken frommodels by Paul [20,21] yielding Qk(p,T) [22]. Pressureand temperature were then separated analytically ornumerically. With this, equation (1) can be rewritten to with F-(7)and F (p) combining all temperature- andpressure dependent terms, respectively. The error evolv-ing from the separation of temperature and pressureeffects is<2% for p> 8 bar [15]. By assuming a homogeneous temperature Tm of thecombustion gas phase (for example the temperature present at the NO concentration calibration point) and bynormalizing F-(T) to unity for Tm,F-(7)reflects the sys-tematic error for the deviation of the real temperaturefrom Tm.Figure 1 shows this systematic error for an as-sumed average temperature Tm = 2200 K. This equalsthe systematic error for the evaluated NO concentrationXno when neglecting spatial and temporal temperaturevariations. For temperatures >1900 K the error is ap-prox.-14%/+8%. When determining mole fractions with excitation withinthe (0,0) band around 226 nm [7], the temperature de-pendence of the LIF signal is large (approx.-25%/+100%between 1900 and 3000 K with Tm=2200 K); quantita-tive NO concentration measurements within the (0,0)band therefore can only be performed when assuming orcalculating spatial and temporal temperature variations.The difference in temperature dependence within the twovibrational bands in turn can be used for accessing tem-perature fields in combustion environments [23]. An effect similar to the cancellation of the temperaturedependent factors can be observed for the pressuredependent factors: The dominant factor Q(p,T) ~ p can-cels with the pressure term of the ideal gas law. There-fore, the sensitivity of the evaluated NO mole fraction onpressure, given by the term F,(p) in eq. (2), is only due tothe effect of line-broadening and -shifting. This effect isnonlinear; F, decreases by 46% from 5 to 20 bar, butonly by 26% from 20 to 35 bar. The present excitationscheme should therefore be applicable for high-pressureenvironments (e.g.,Diesel engines)as well. EXPERIMENTAL The experiments presented here were carried out in anoptically accessible gasoline engine featuring a directinjection cylinder head (BMW) and a Bosch injectionsystem. The operation parameters are summarized intable 1. The BMW transparent engine is based on a se-rial inline six-cylinder engine with an enlarged crankcase.Only the fourth cylinder is operated with an elongatedpiston. Therefore, either one-, four- or six-cylinder cylin-der heads can be mounted and investigated. The cylin-der head used here is a single cylinder one with fourvalves, designed for direct injection operation within apentroof combustion chamber. The piston consists of twoparts allowing to adjust the variable compression ratio.The piston crown is built as a simple bowl with a flatquartz window (58 mm diameter) and acts as one opticalaccess to the combustion chamber (see figure 2). Theupper piston rings run without lubrication allowing ex-tended measurements without obscuring layers on theoptical components. The upper part (40 mm) of the castiron cylinder is substituted either by a 18 mm thick quartzring for optical access from all sides or an aluminum ringdummy. Additional quartz windows in the pentroof allowthe observation of the spark plug region. For easy clean-ing of the windows, the cylinder can be lowered by about 10 mm and the quartz ring can be removed like adrawer. The inlet manifold is designed and optimized forsingle cylinder operation and can be used for supplyingthe enginewithha premixed stoichiometric ()=1.0)air/fuel mixture. For calibration purposes, controlledamounts of nitric oxide can be doped to the fresh gases. The timing for injection and ignition of the engine and forthe optical diagnostic equipment is provided by a singlecylinder engine control unit (resolution: 1°CA). Start ofinjection was set to 300°CA before TDC, resulting in ahomogeneous load. An over-all stoichiometric air/fuelration (0=1.0) was used for the direct injection meas-urements. Calibration measurements were carried outwith a perfectly mixed air/fuel mixture using an additionalinjection system installed in the inlet port. The enginewas fired continuously over periods of 2-3 minutesensuring conditions relevant for technical operationconditions. Because the optical access through thequartz ring was not needed, the quartz cylinder wasreplacedby/ the aluminumdummy for all NO-measurements shown. This assured the heat losses tobe comparableto the onesin arealistic engine.Additional measurements employing the quartz ring (notshown here) revealed a slight increase of the NOformation, which was detected by CLD-measurements inthe outlet manifold. The ignition was set to 30°CA beforeTDC. The engine was operated at partial load (500 mbarinlet pressure) yielding average peak pressures of 13 barwhen operating the engine without EGR. The pressurecurves were measured for each individual engine cycleand taken into account for correcting LIF signal intensi-ties on a shot-to-shot basis. Figure 2: Schematic of the optically accessible direct injectedgasoline engine. Various concentrations (0, 10 and 16%) and composi-tions (pure nitrogen, nitrogen / carbon dioxide and nitro-gen / carbon dioxide / water) of synthetic exhaust gaswere investigated. A"standard” exhaust gas composedof 13% H20, 14% CO2 and 73% N2 was added to thefresh combustion air at concentrations of 10% and 16%.These volume fractions chosen for water, CO2 and nitro-gen are typical for the exhaust gas of an engine operatedat stoichiometric conditions. For comparison, recircula-tion of 10%“dry”exhaust gas (16% CO2, 84% N2) andpure nitrogen exhaust gas was also investigated in orderto explore the influence of the different chemical speciesof the EGR on the NO formation in some detail. TheEGR gas was added in the inlet port keeping the amountof fresh gas and fuel constant. This resulted in an in-crease of the inlet pressure to about 550 mbar at 16%EGR. The beam from a tunable, narrowband (Av =0.4 cm")KrF excimer laser (Lambda Physik, Compex 150) at247.94 nm was formed to a horizontal light sheet usingcylindrical lenses and aligned through the quartz win-dows in the pentroof of the cylinder head (figure 2). La-ser pulse energies (60 mJ/pulse in a 20 mm x1 mmcross section) were measured on a single shot basis.The power density of 16 MW/cm² is below the saturationlimit for pressures > 2 bar [24]. The signal was transmit-ted through the piston window and imaged via a metalcoated mirror onto the chip of a slow scan image intensi-fied CCD camera (LaVision, StreakStar, equipped with af= 100 mm, f#=2, Halle UV lens). A combination of fourmirrors with narrow spectral reflection characteristicscentered around 230 nm and two short pass edge filters(Laseroptik, high reflectance at 248 nm, 0°) were used toisolate the blue-shifted NO fluorescence from any othersignal, mainly from O2-LIF and Rayleigh scatteringcaused by the 248 nm light [8,25]. The signal from theintensified slow scan camera was digitized, stored andlater processed including laser pulse energy and pres-sure data. Type: single cylinder transparent engine Compression Ratio: 1 : 7.4 Bore: 84 mm Stroke: 89 mm Con rod length: 135 mm Cylinder 1 Valves 4 Speed, (fired) 1000 rpm Intake valve opening: 708°CA Intake valve closing: 228°CA Exhaust valveopening: 488°CA Exhaust valve closing: 12°CA Injector BOSCH, B-type Spray cone angle 60° Fuel iso-octane Fuel pressure 80 bar Start of injection 300°CA BTDC Equivalence ratio o 1.0 Ignition timings 30°CA BTDC Inlet air temperature: 33°C Table 1: Engine data. Figure 3 shows the position of the imaged field within thecombustion chamber as viewed through the piston win-dow. The illuminated area is located 3 mm above thecylinder gasket beside the spark plug. In order not to hitthe spark plug with the laser beam only a part of thecross-section through the cylinder was investigated. Figure 3: Position of the imaged area within the cylinder. Thelaser beam is directed from left to right. A chemi-luminescence detector (CLD, Pieburg)wasused to control the intake NO concentration during cali-bration measurements and for additional exhaust gasNOx concentration measurements for the different oper-ating conditions. DATA EVALUATION After detecting series of single-shot images for variousdetection times and different operating conditions, indi-vidual images were corrected for pressure effects on theexcitation efficiency due to line broadening and on colli-sional quenching. Quenching cross sections and absorp-tion cross sections are assumed to be homogeneouswithin the combustion chamber. Before generating aver-aged NO concentration distributions and before calculat-ing standard deviations, cycles with delayed ignition wereomitted from data evaluation. The engine operation wasfound to be increasingly unstable with larger amounts ofexhaust gas recirculation. Delayed ignition was observedfor 4, 9 and 25% of the cycles for EGR amounts of 0 and10% N2 and 16%N2/H2O/CO2,respectively. The NO excitation / detection scheme applied here mini-mizes the contribution of LIF from interfering species,mainly hot oxygen [8]. Nevertheless, all NO concentra-tion data shown here are corrected for the influence ofremaining weak fluorescence interferences by subtract-ing the signal obtained when tuning the laser off the NO Average Single Shot Standard Deviation>1300 ppm >1300 ppm >100% Average Single Shot Standard Deviation >1300 ppm >1300 ppm >100% (c) (d) Figure 4: Crank-angle resolved averaged NO concentration fields, single shot images and standard deviation for combustion withoutEGR (a), with 10% nitrogen EGR (b), and 10% and 16%"standard”EGR (c) and (d). The scaling of the look-up table maximum isindicated above the columns. resonance. The contribution of LIF interferences wouldotherwise lead to an increase in observed NO concentra-tion of 30 to 90 ppm. For calibration of the NO-LIF signal intensities an NOaddition method was used [24]. The calibration factor forconverting NO LIF intensities to NO concentrations in-cludes information about the detection efficiency of thesystem and the observed solid angle from which fluores-cence photons are collected with the detection optics.Calibration measurements were carried out in the engineoperated with premixed (injection within the intake sys-tem) stoichiometric mixtures. Known amounts of NOwere doped via a flow controller to the fuel/air mixture inthe inlet port. The actual concentration of the total NO, inthe intake was measured with a chemi-luminescence(CLD) detector. Imaging measurements were carried outwith various dopant concentrations up to 1700 ppm.From the increase in NO-LIF signal with dopant concen-tration the calibration data were gained. RESULTS AND DISCUSSION NO CONCENTRATION IMAGING- Figure 4 shows theresults of the NO LIF imaging for four EGR conditions.Typical single-shot images, the average distribution fieldsof 75 images and the standard deviations are showncrank-angle resolved for the engine running withoutEGR, with 10% EGR composed of nitrogen only, andwith 10% and 16%“standard”EGR. Since the NO con-centrations differ by more than a factor 10 for the differ-ent EGR conditions an appropriate scaling of the look-uptable was used for each condition. The look-up table forthe standard deviation is normalized to 100%. The average NO distribution fields show a rise in the NOconcentration symmetrically around the spark plug untilabout 12CA before TDC when operating the enginewithout EGR. Hereafter the concentration field shiftsslightly to the left. This effect has already been observedin earlier measurements at this engine [11]. It is due toan asymmetric evolution of the flame kernel as can beseen in flame self-luminosity images (figure 5). Theseimages were taken for the same operation conditions ofthe engine with and without external EGR. The asymme-try is most pronounced when operating the engine with-out EGR whereas at increasing EGR rates the averageposition of the flame is shifted towards the middle of thecombustion chamber. Absorption of the incident laserbeam (passing the imaged area from the left to the right)can be excluded because no such effect can be ob-served in the single shot images. Despite of the fact that the average NO distribution fieldsare homogeneous, the single shot images reveal veryinhomogeneous NO concentrations with local peak NOconcentrations up to 3400 ppm for engine operationwithout EGR. It is worth mentioning that when adding16% EGR the NO concentration field are less inhomoge- neous. This effect can also be seen in the standard de-viation which is lowest for the 16% EGR condition (seefigure 4). This however does not reflect the much moreirregular operation of the engine upon adding EGR sincecycles with delayed or no ignition have been eliminatedbefore averaging. It is well known that strongly tempera-ture dependent reactions (Zeldovich mechanism [9,26])contribute most to the in-cylinder NO formation. With anover-all decreased temperature due to EGR the forma-tion of extreme peak NO concentrations is prevented.Due to the non-linearity of NO formation rate with tem-perature the extended flame period at lower tempera-tures - as present with high EGR rates - leads to lowerand more homogeneous NO distributions. Figure 5: Crank angle resolved averaged self-luminosity im-ages for (a) the engine running without EGR and (b) with 16%EGR. Intensities in (b) are enhanced by a factor of 20. SPATIALLY-AVERAGED RESULTS -Averaged NOconcentrations are obtained by spatially averaging thetemporally averaged 2D concentration fields of figure 4over the entire field of view. They are shown in figure 6and used for the following quantitative comparisons ofthe different operating conditions. A significant reductionof peak NO concentrations from 1200 ppm to 200 ppmwith increasing EGR rate can be observed. For comparison with exhaust gas NOx concentrations,results from the chemi-luminescence (CLD) measure-ments have been included in figure 6. It has to be kept inmind that the LIF images represent the NO concentrationpresent in the plane defined by the position of the laserbeam whereas the exhaust gas measurements represent averaged concentrations after homogeneously mixingthe burned gases during the expansion and exhauststroke. The comparison shows a good agreement ofexhaust gas concentrations and concentrations of the in-cylinder LIF measurements61in the observedplane.Slightly higher NOx concentrations in the CLD measure-ments suggest a systematic error in the calibration pro-cedure. A significant reduction of the imaged NOconcentration due to formation of NO2 via reaction of NOand O2 can be excluded since NO, is thermodynamicallyunstable at high temperatures present at the crank an-gles investigated. The NO2 equilibrium concentrations(relative to NO concentrations) can be calculated fromthermodynamic properties of the NO+02 reaction toNO2/NO<10% @ 900 K and NO2/NO<5%@ 1000 Kat 20% O2 concentration. Figure 6: Crank angle resolved averaged NO concentrationsfor the different EGR conditions (see legend). CLD NO, con-centration measurements are included in the viewgraph. Figure 6 also shows the experimental error, which isapproximately± 30% for absolute concentration meas-urements mainly due to uncertainties in the local gascomposition and temperature as discussed above aswell as in the calibration procedure [24]. Maximum NO concentrations are found between 20 and35°CA after TDC for all investigated conditions except for16% EGR. The decrease in NO concentration at latercrank angles found for all but the 16% EGR conditionscan be seen more clearly when the data are normalizedto the average concentration between 20 and 35°CA(see figure 7 - for clarity, the result with 10% CO2/N2EGR is not shown in this and the following figure 8. Thebehavior is essentially the same as for the 10% "stan-dard" EGR case). This effect could be interpreted asfollows: 1. Dilution effects of high-concentration areas with low-concentration areas. This effect should however at least partly be reduced in the averaged data shown infigures 6 and 7 by the fact that in the imaged areathere already are high-and low-concentration areas. 2. Flowfield effects.,i.e. movement of thee high-concentration areas out of the observed plane. 3. Temperature effects: since the independence of theevaluated NO concentration on temperature is validonly for high temperatures (cf. figure 1) one shouldexpect an underestimation of NO concentration dur-ing later stages of combustion when the gas tempera-ture drops below approximately 1900 K. This effect,however, should be most pronounced at high EGRrates due to decreased average temperatures. Since in the case of 16% EGR the latter effect can onlybe found during the latest measured crank angles(>55℃A) we conclude that the assumption of tempera-ture independence is valid within the crank angle areainvestigated. Temperature effects therefore should benegligible for these measurements, as predicted by the-ory. The decrease in NO concentration after approximately35°CA can therefore be attributed to dilution and flowfield effects. Due to the thermal NO formation mecha-nism highest NO concentrations are present in the areawhere the flame has started, i.e. the middle of the com-bustion chamber close to the spark plug.The light-sheetcuts the combustion chamber close to this NO maximumat early detection timings whereas the NO cloud expandsand moves to lower positions when the piston is movingdownwards. Figure 7: Crank angle resolved averaged NO concentrationsnormalized to the concentration observed between 20 and35°CA. The observed decrease in NO concentration is strongestfor the 10% N2 EGR case and merely visible for the 16%“standard" EGR case. This again is an effect of the morehomogeneous NO concentration distribution for 16%“standard" EGR. The same trend can be concluded fromthe standard deviation (cf. right columns in figure 4) and the instantaneous single-shot distributions (cf. middlecolumns in figure 4). Figure 8 shows standard deviationsaveraged over the whole observed area. After 30CA,the standard deviation for the condition without EGR and10%““standard" EGR is essentially the same, while alower standard deviation (i.e. a spatially and temporallymore uniform NO concentration) is found for 16% EGRand a higher standard deviation (i.e. a spatially and tem-porally inhomogeneous NO concentration) can be seenfor 10% N2EGR. Figure 8: Crank angle resolved, spatially averaged standarddeviation. TEMPORAL DEVELOPMENT- The concentration fieldsas well as the spatially averaged results show a retardeddevelopment in NO formation with EGR in the samemeans as a NO reduction (figures 4 and 6). However,the normalized concentrations (figure 7) reveal a similarbehavior of all but the 16% EGR conditions until aboutTDC, which indicates that 10% EGR has only a minoreffect on the combustion kinetics as far as the temporalevolution of the NO formation is concerned. With 16%EGR a delayed onset of average NO formation of about5°CA can be observed. However, the rapid drop of the standard deviation (figure8) from >>100% to a level of 20 - 50% shows a signifi-cant temporal difference for the different investigatedconditions. A standard deviation >>100% can be inter-preted as cycle-to-cycle fluctuations in NO formationonset. This indicates retarded combustion timings in thesingle-shot images (i.e. the flame front having reachedthe whole imaged area) of up to 15°CA for 16% EGR. DEPENDENCE OF NO REDUCTION ON RECIR-CULATED EXHAUST GAS COMPOSITION - In thepresent investigation, the NO reduction potential of syn-thetic exhaust gases composed of pure nitrogen, nitro-gen / carbon dioxide and nitrogen / carbon dioxide / wa-ter has been compared. Comparing the exhaust gas compositions for 10% EGR (figure 6) it can clearly beseen that the reduction potential is independent of thepresence of water vapor in the fresh gases. There is,however, a difference to the pure nitrogen condition. Since temperature reduction is the main cause for NOreduction with EGR, rather than looking at the chemicalcomposition of the synthetic exhaust gas, the heat ca-pacity of the gas mixture is of major interest [27]. Figure9 shows average measured NO concentrations between20 and 35°CA versus the heat capacity of the inert gaseswater, nitrogen and carbon dioxide present in the freshgases (calculated as the sum of inert compounds of in-take air and recirculated exhaust gas, individual heatcapacities are listed in table 2). It is evident that the dif-ference in heat capacity of the“standard" and the “dry"EGR (containing only CO instead of CO2 and H2O) isonly small (approximately 1.4%), leading to approxi-mately the identical NO reduction. Figure 8 shows an almost linear decrease of the meas-ured NO concentration with increasing heat capacity ofthe inert gases. Inert gas Heat capacity [J/(K. mol)] N2 29.2 CO2 41.3 H2o (gaseous) 34.3 Table 2: Heat capacity of the inert gases present in the freshgases at 400 K [28]. Normalized heat capacity of the inert gases [a.u.] Figure 9: Average NO concentrations between 20 and 35CAversus heat capacity of the inert gases water, nitrogen andcarbon dioxide present in the fresh gases normalized to thecondition without EGR. CONCLUSIONS The influence of exhaust gas recirculation on NO forma-tion has been studied by in-cylinder NO LIF imaging. Anew technique for evaluation of the NO LIF data is pre-sented allowing the direct evaluation of NO concentra- tions rather than number densities from LIF signals excit-ing the A-X(0,2) band without requiring detailed knowl-edge of gas phase temperature for hot (>1900 K) com-bustion environments such as burned in-cylinder gasesin IC engines. A strong dependence of the NO formation on the EGRrate could be observed. The reduction potential is ratherindependent of the chemical composition of the syntheticexhaust gas, but depends on the heat capacity of theinert gases (CO, N2, H20) of the EGR present in theengine. The formation of thermal NO is therefore effec-tively suppressed by lowering the in-cylinder combustiontemperature. A similar behavior of the normalized NOconcentration rise without EGR and with 10% EGR ofvarious composition suggest only a minor influence ofsmall EGR amounts on the overall combustion process,while already effectively suppressing the NO formation.With 16% EGR, however, a delayed onset of NO forma-tion (in average approx. 5CA with retarded cycles of upto approx. 15°CA) and more homogeneous NO concen-tration fields after 35°CA show a clear difference in com-bustion behavior. A good agreement of quantitative in-cylinder LIF meas-urements and exhaust gas CLD measurements wasfound. While averaged in-cylinder measurements exhib-ited a decrease of the NO concentration after 35°CAwithin the measured field due to flow effects the exhaustgas measurements are well correlated with averagedpeak concentrations as present within the observedplane between 20 and 35°CA. ACKNOWLEDGMENTS Continuous technical support of Gerhard Noske, BerndRahlert and Georg Gmeineder during the measurementswith the transparent engine at BMW and helpful discus-sions with Frank Hildenbrand (PCI, University of Heidel-berg) are gratefully acknowledged.A. CONTACT Corresponding author: Wolfgang Bessler, Physikalisch-Chemisches Institut, Universitat Heidelberg, Im Neuen-heimer Feld 253, D -69120 Heidelberg, Germany,phone:+496221545011, fax: +49 62211 545050.e-mail: wolfgang.bessler@urz.uni-heidelberg.de REFRENCES 1. Eckbreth, A.C., “Laser diagnostics for combustion tem-perature and species,” Gordon and Breach (1996) 2. Kohse-Hoinghaus, K., “Laser techniques for the qua4nutita-tive detection of reactive intermediates in combustion sys-tems," Prog. Energy Combust. Sci. 20, 203-247 (1994);Wolfrum, J., “Lasers in combustion: from basic theory topractical devices,“ Proc. Combust. Symp. 27, 1-41 (1998) 3.Andresen, P., Meijer, G., Schluter, H., Voges, H., Koch,A., Hentschel, W.,Oppermann, W., Rothe, E.W., “Fluores-cence imaging inside an internal combustion engine usingtunable excimer lasers,”Appl. Optics 29, 2392-2404(1990))) 4. Arnold, A., Dinkelacker, F., Heitzmann, T., Monkhouse,P., Schafer, M., Sick, V., Wolfrum, J., Hentschel, W.,Schindler, K.P.,“DI-Diesel engine combustion visualizedby combined laser techniques," Proc. Combust. Symp.24,1605-1612(1992) 5. Brugman, Th.M., Klein-Douwel, R., Huigen, G., van Wal-wijk, E., ter Meulen,J.J., “Laser-induced fluorescence im-aging of NO in an n-heptane and Diesel fuel driven Dieselengine,”Appl. Phys. B57, 405-410 (1993) 6.Hildenbrand, F., Schulz, C., Wolfrum, J., Keller, F., Wag-ner, E., “Laser diagnostic analysis of NO formation in a DIDiesel engine,” Proc. Combust. Inst. 28,1137-1144(2000) 7. Dec, J.E.,Canaan, R.E.,,,PLIF imaging of NO Formationin a DI Diesel engine", SAE paper 980147 (1998) 8.Schulz, C., Sick. V., Heinze, J., Stricker, W., “Laser-induced-fluorescence detection of nitric oxide in high-pressure flames with A-X(0,2) excitation,” Appl. Opt. 36,3227-3232 (1997) 9.Schulz C., Wolfrum, J., Sick V., "Comparative study ofexperimental and numerical NO profiles in SI combustion,”Proc. Combust. Symp.27,2077-2084(1998) 10. Hildenbrand, F., Schulz, C., Sick, V., Jander, H., Wagner,H. Gg., “Applicability of KrF excimer laser induced fluo-rescence in sooting high-pressure flames,”VDI Flammen-tag Dresden, VDI Berichte 1492 (ISBN 3-18-091492-0),269-274(1999) 11. Hildenbrand F., Schulz C., Hartmann M., Puchner F.,Wawrschin G., “In-cylinder NO-LIF imaging in a realisticGDI engine using KrF excimer laser excitation," SAE1999-01-3545(1999) 12. Hildenbrand, F. Schulz, C. Sick, V. Wagner, E.,“Spatiallyresolved investigation of light absorption in an SI enginefueled with propane/air,” Appl. Opt., 38, 1452-1458 (1998) 13. Schulz, C., Sick, V., Wolfrum, J., Drewes, V., Zahn, M.,Maly, R.R.,“Quantitative 2D single-shot imaging andmathematical modeling of NO concentrations and temper-atures in a transparent SI engine," Proc. Combust. Symp.26, 2597-2604(1996) 14. Einecke, S., Schulz, C., Sick, V.,“Measurement of tem-perature and equivalence ratio distribution using tracerLIF in IC engine combustion,”Appl. Phys. B 71, 717-723(2000) 15.Hildenbrand, F., Schulz, C., Appl. Opt. in preparation(2001) 16. Chang A.Y., DiRosa, M.D., Hanson, R.K.,“Temperaturedependence of collision broadening and shift in the NO A-K(0,,0) band in the presence of argon and nitrogen,”J.Quant. Spectrosc. Radiat. Transfer 47, 375-390 (1992) 17. DiRosa, M.D., Hanson, R.K., “Collision-broadening and -shift of NOy(0,0) absorption lines by H20, 02 and NO at295 K,"J. Mol. Spectrosc. 164, 97-117(1994) 18. DiRosa, M.D., Hanson, R.K., “Collision broadening andshift of NO y(0,0) absorption lines by O2 and H2O at hightemperatures,” J. Quant. Spectrosc. Radiat. Transfer 52,515-529(1994) 19. Vyrodov, A.O., Heinze, J., Meier, U.E., “Collisional broad-ening of spectral lines in the A-X(0,0) system of NO byN2, Ar, and He at elevated pressures measured by laser-induced fluorescence,” J. Quant..Spectrosc. Radiat.Transfer 53, 277-287 (1995) 20. Paul, P.H., Gray, J.A., Durant Jr., J.L., Thoman Jr., J.W.,“A model for temperature-dependent collisional quenching of NO A2,“Appl. Phys. B 57, 249-259 (1993) 21. Paul, P.H., Gray, J.A., Durant Jr., J.L., Thoman Jr., J.W.,"Collisional quenching corrections for laser induced fluo-rescence measurements of A2Z+,”,AIAA Journal 32,1670-1675(1994) 22. Hildenbrand, F., Schulz, C., Sick, V., Josefsson, G., Mag-nusson, I., Andersson O., Alden, M.,“Laserspectroscopicinvestigation of flow fields and NO-formation in a realisticSl engine,” SAE paper 980148 (1998) 23. Bessler, W.G., Hildenbrand, F., Schulz, C., “Two-linelaser-induced fluorescence imaging of vibrational tem-peratures in an NO-seeded flame," Appl. Opt. 40, 748-756(2001) 24. Schulz, C., Sick, V., Meier, U., Heinze, J., Stricker, W.,"Quantification of NO A-X(0,2) LIF: Investigation of cali-bration and collisional influences in high-pressure flames,"Appl. Opt. 38, 1434-1443 (1998) 25. Schulz, C., Yip, B., Sick, V., Wolfrum, J.,“A laser-inducedfluorescence scheme for measuring nitric oxide in en-gines," Chem. Phys. Letters 242, 259-264(1995) 26. Zeldovich, Y.,“The oxidation of nitrogen in combustionand explosions,” Acta Physicochimica USSR 21, 577-628(1947) 27. Quader, A.A., ,,Why intake charge temperature decrasesnitric oxide emission from spark-ignition engines", SAEpaper 710009(1971) 28..LLide D.R. (Ed.), “CRC handbook of chemistry and phys-ics," 80th Edition, CRC Press (1999) The influence of exhaust gas recirculation (EGR) on theformation of nitric oxide (NO) was studied experimentallyin a transparent gasoline direct injection engine by quantitativelaser-induced fluorescence imaging. Spectralproperties of the excited transition within the NO A2Σ+–X2Π(0,2) band are well known from previous studies. Theexcitation scheme allows quantitative NO concentrationmeasurements without detailed knowledge of the gasphase temperature. Good agreement was found withexhaust gas NOx chemi-luminescence (CLD) measurements.The experiments were carried out in an optically accessiblegasoline engine featuring a direct injection cylinderhead (BMW) and a Bosch injection system, based on aserial inline six-cylinder engine with an enlarged crankcase.The measurements were performed in the pentroofsection of the combustion chamber.Various concentrations (0, 10 and 16%) and compositions(pure nitrogen, nitrogen / carbon dioxide and nitrogen/ carbon dioxide / water) of synthetic exhaust gaswere investigated. NO formation could be significantlyreduced by EGR, from an average of about 1200 ppm(without EGR) to about 200 ppm (16% EGR-rate). TheNO formation decreased steadily with increasing heatcapacity of the inert gases present, independent of theirchemical composition. In the temporal evolution of theNO formation, a retarded onset of up to 5° CA was foundwith 16% EGR. The two-dimensional NO concentrationfields appeared to be very homogeneous when adding16% EGR, whereas without EGR, strong inhomogeneitieswith local NO peak concentrations of up to 3400 ppmwere detected.
确定
还剩8页未读,是否继续阅读?

产品配置单


北京欧兰科技发展有限公司为您提供《直喷汽油发动机中在废气再循环模式下缸内NO激光诱导荧光的定量成像检测方案(流量计)》,该方案主要用于汽车电子电器中其他检测,参考标准--,《直喷汽油发动机中在废气再循环模式下缸内NO激光诱导荧光的定量成像检测方案(流量计)》用到的仪器有PLIF平面激光诱导荧光火焰燃烧检测系统、德国LaVision PIV/PLIF粒子成像测速场仪、激光诱导白炽光烟雾粒子成像分析仪(LII)、LaVision SprayMaster 喷雾成像测量系统、汽车发动机多参量测试系统
推荐专场


烟气监测(CEMS)/烟气分析仪
更多


相关方案
更多
该厂商其他方案
更多