


方案详情
文
用LaVision公司以增强型CCD相机为核心部件构成的PLIF激光诱导荧光成像系统定量地测量了柴油发动机中NO自由基的激光诱导荧光成像并进行了数据后处理。
方案详情

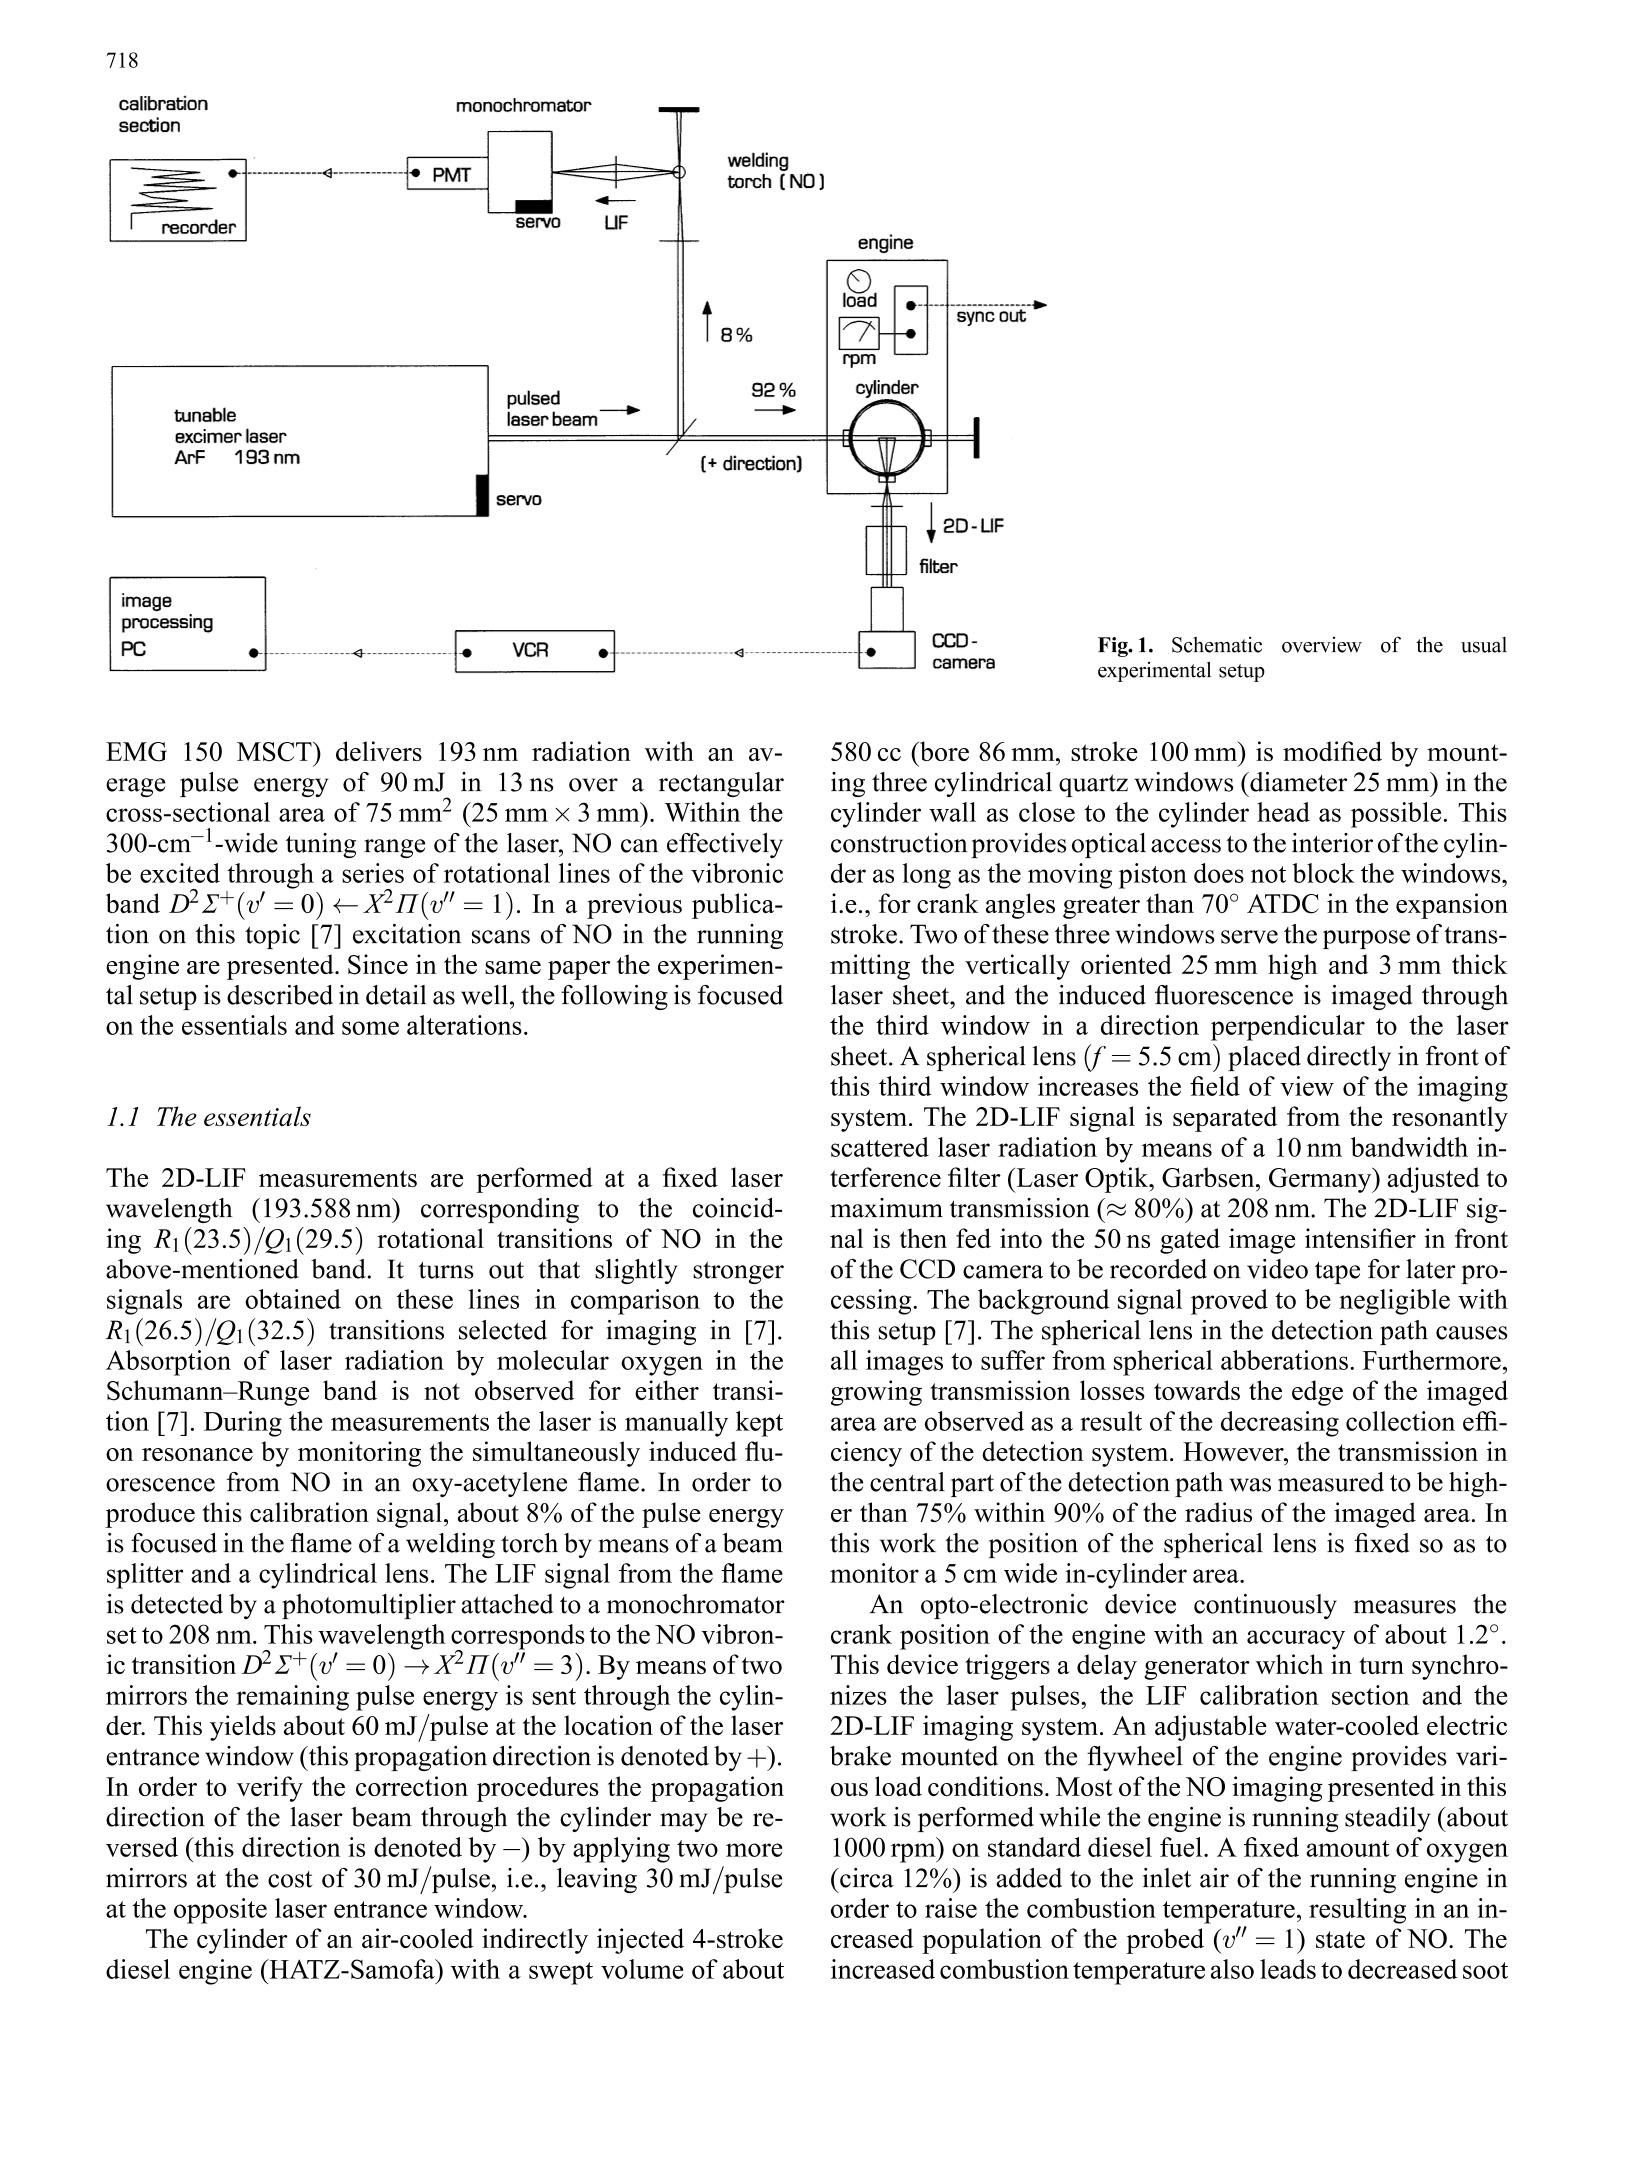
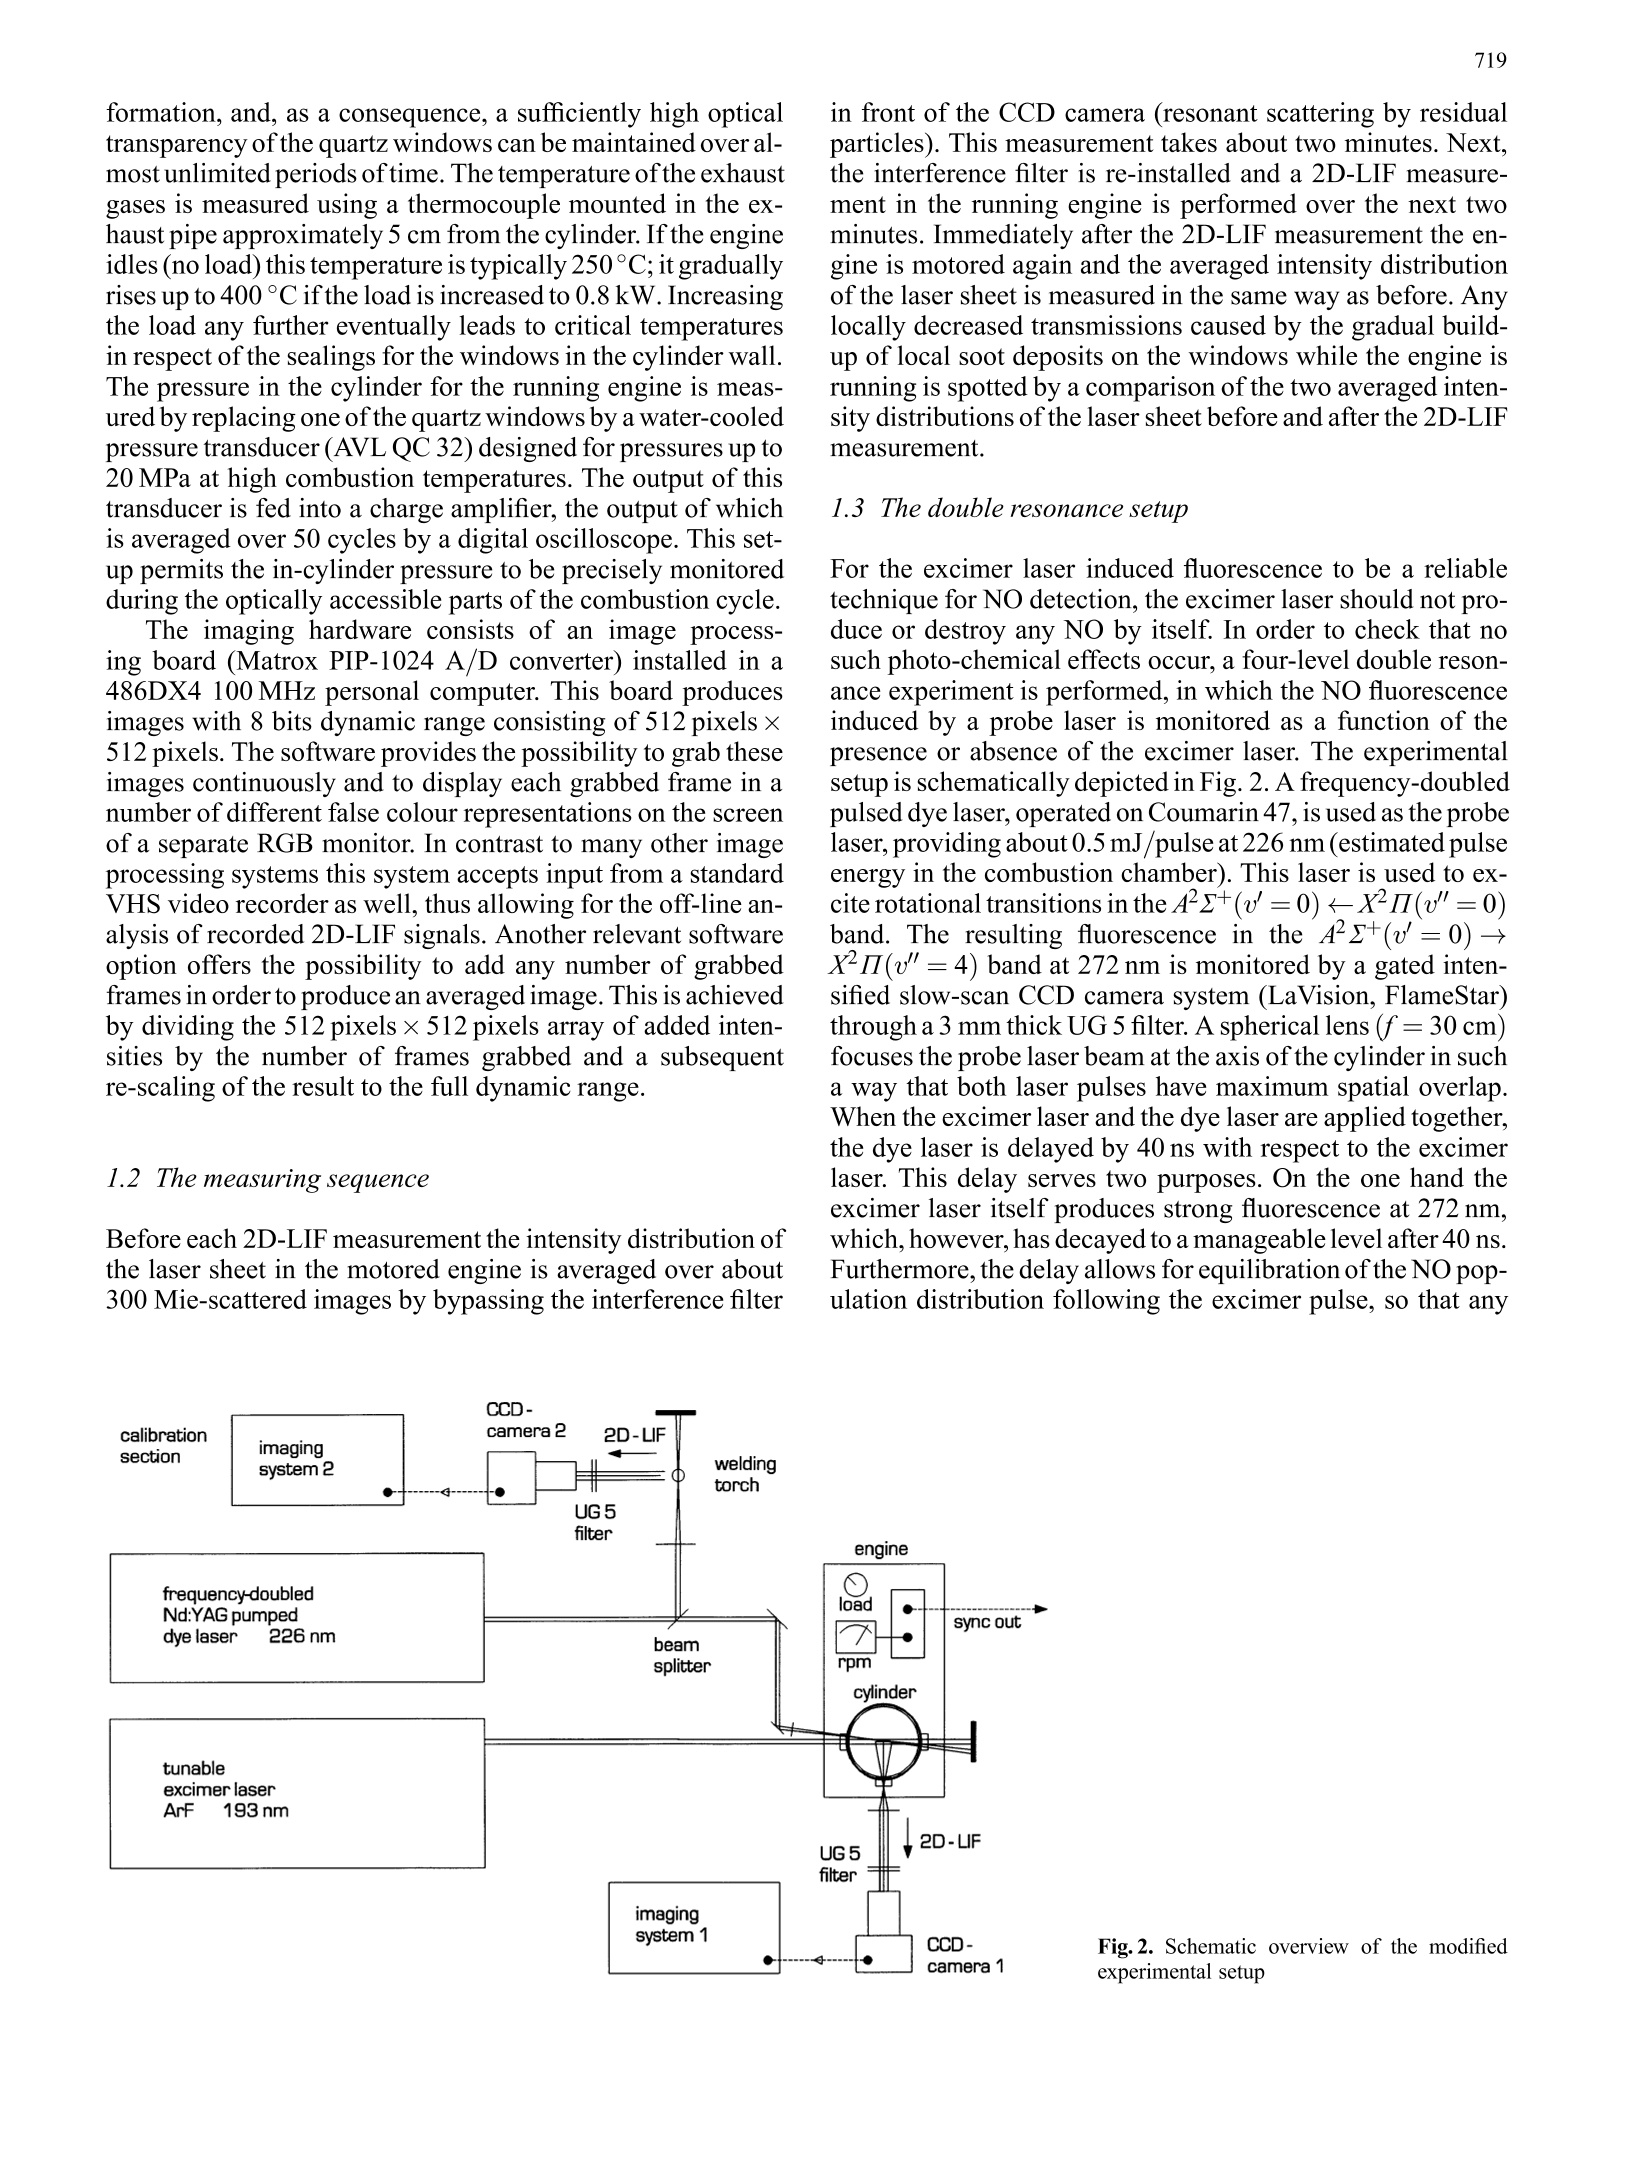
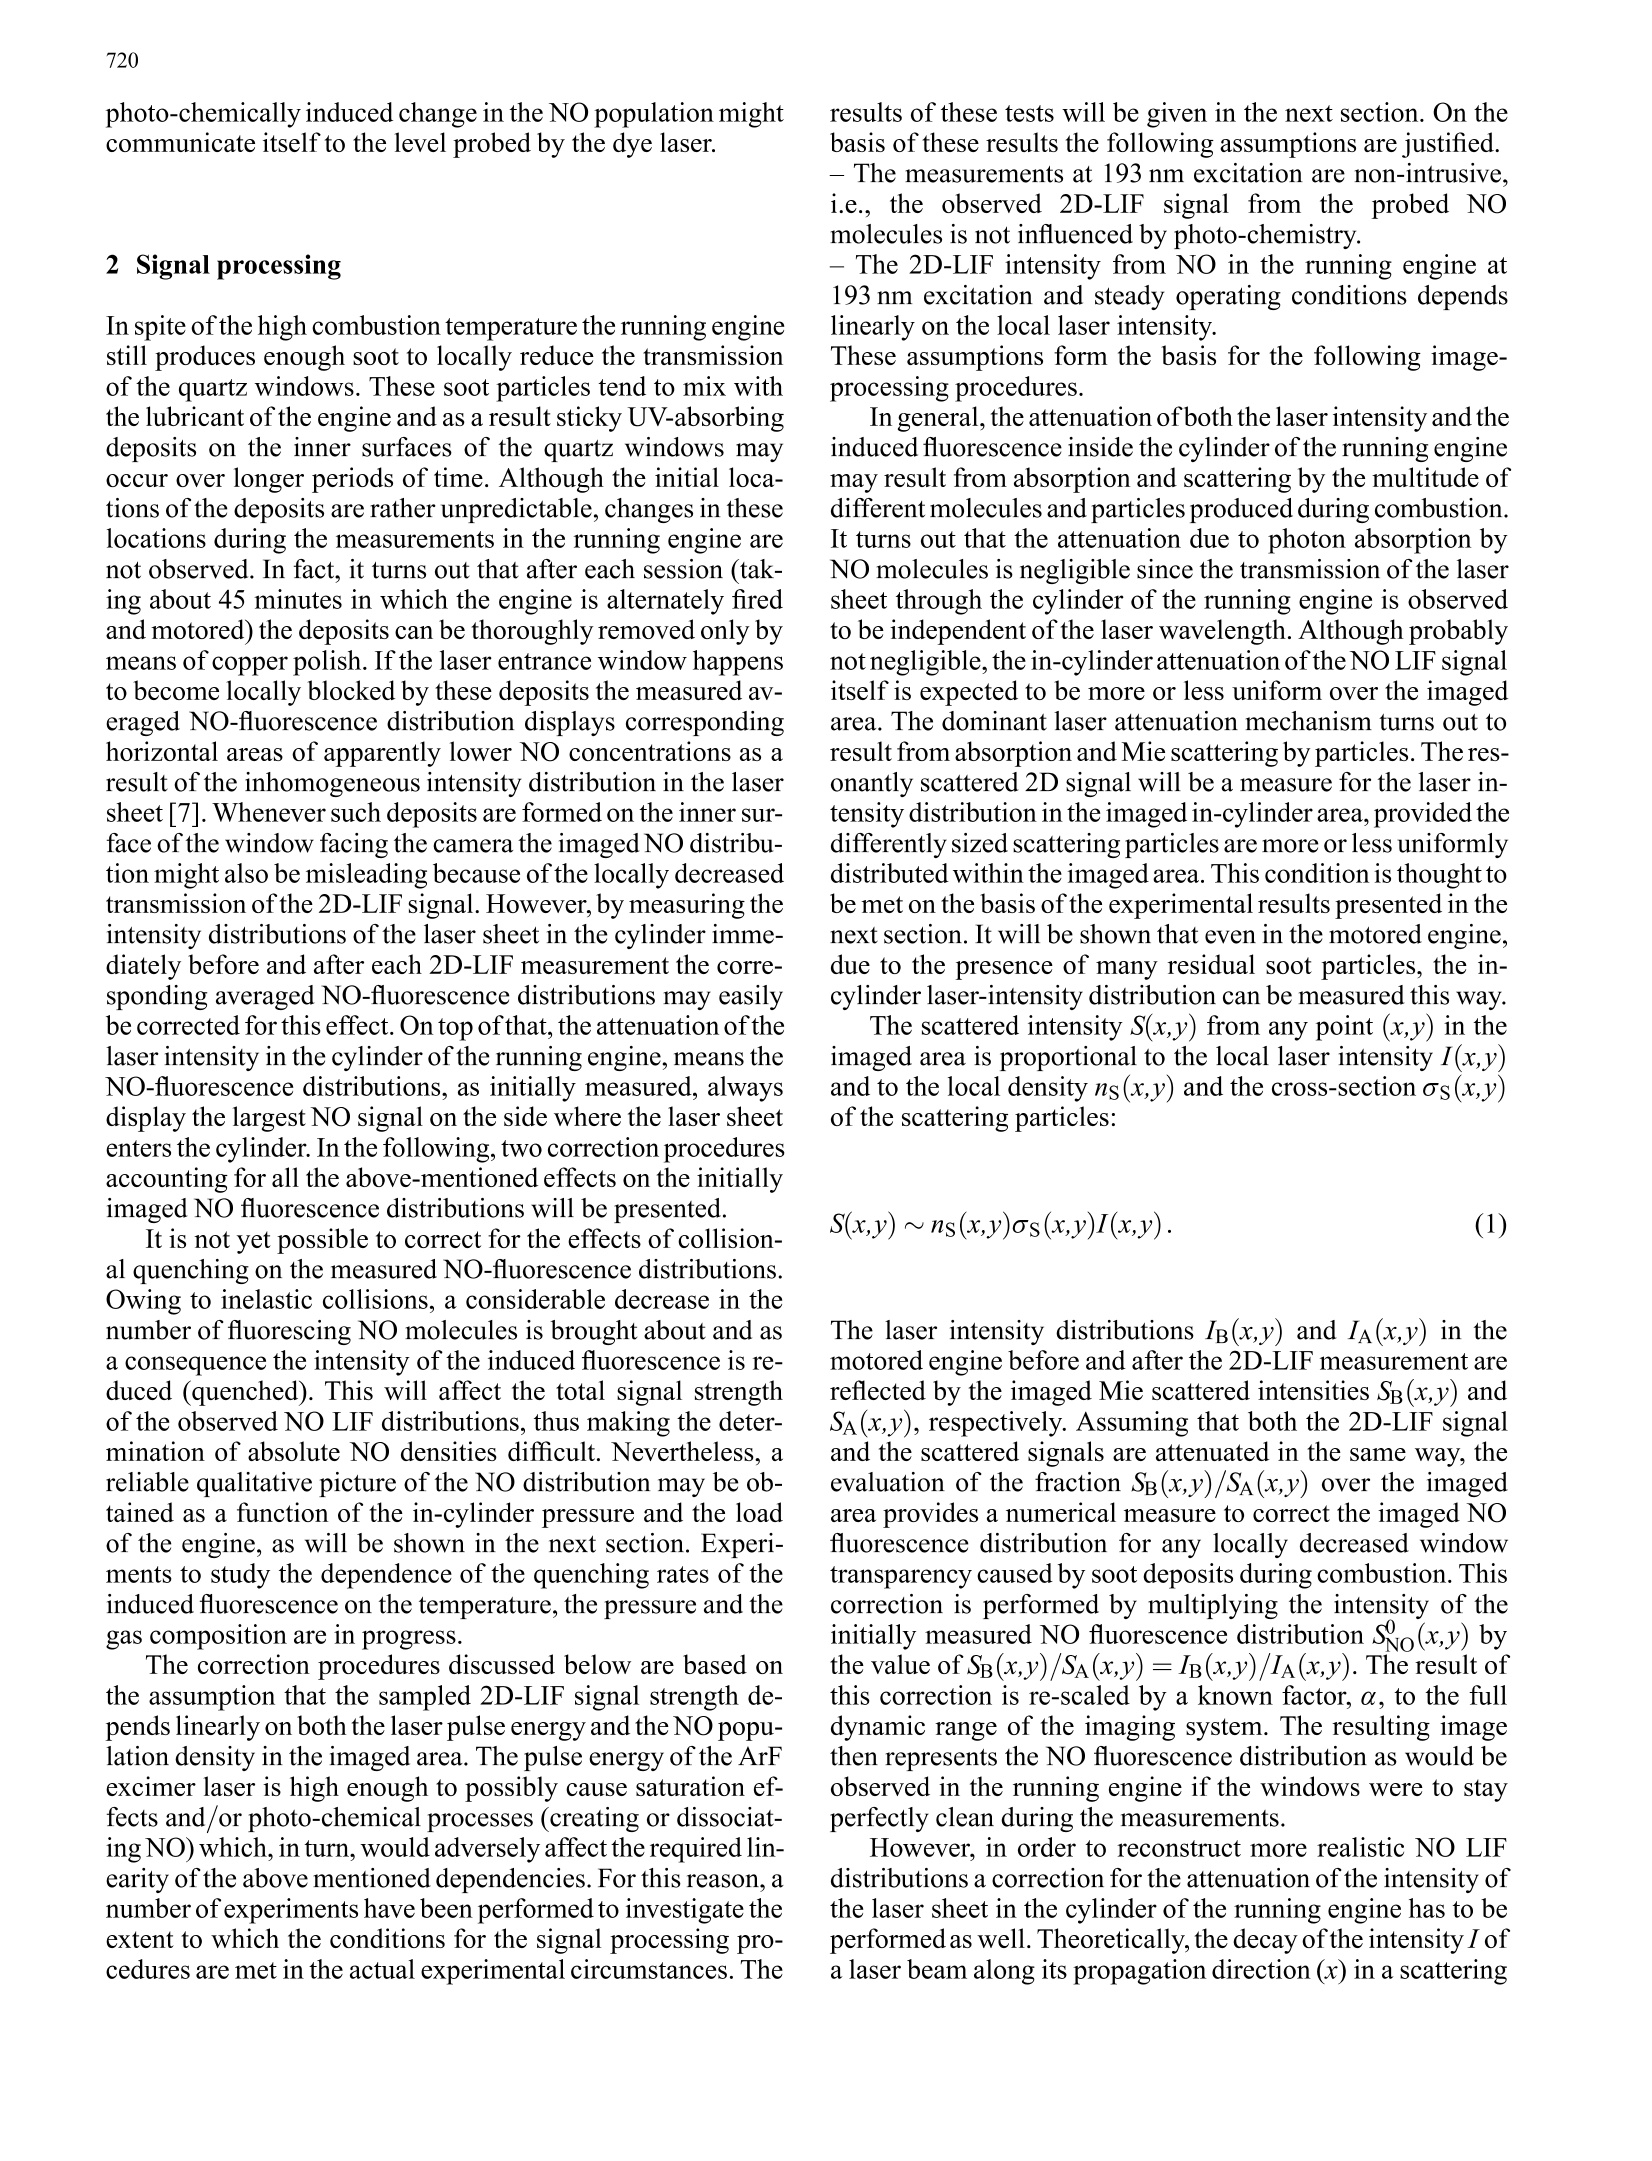
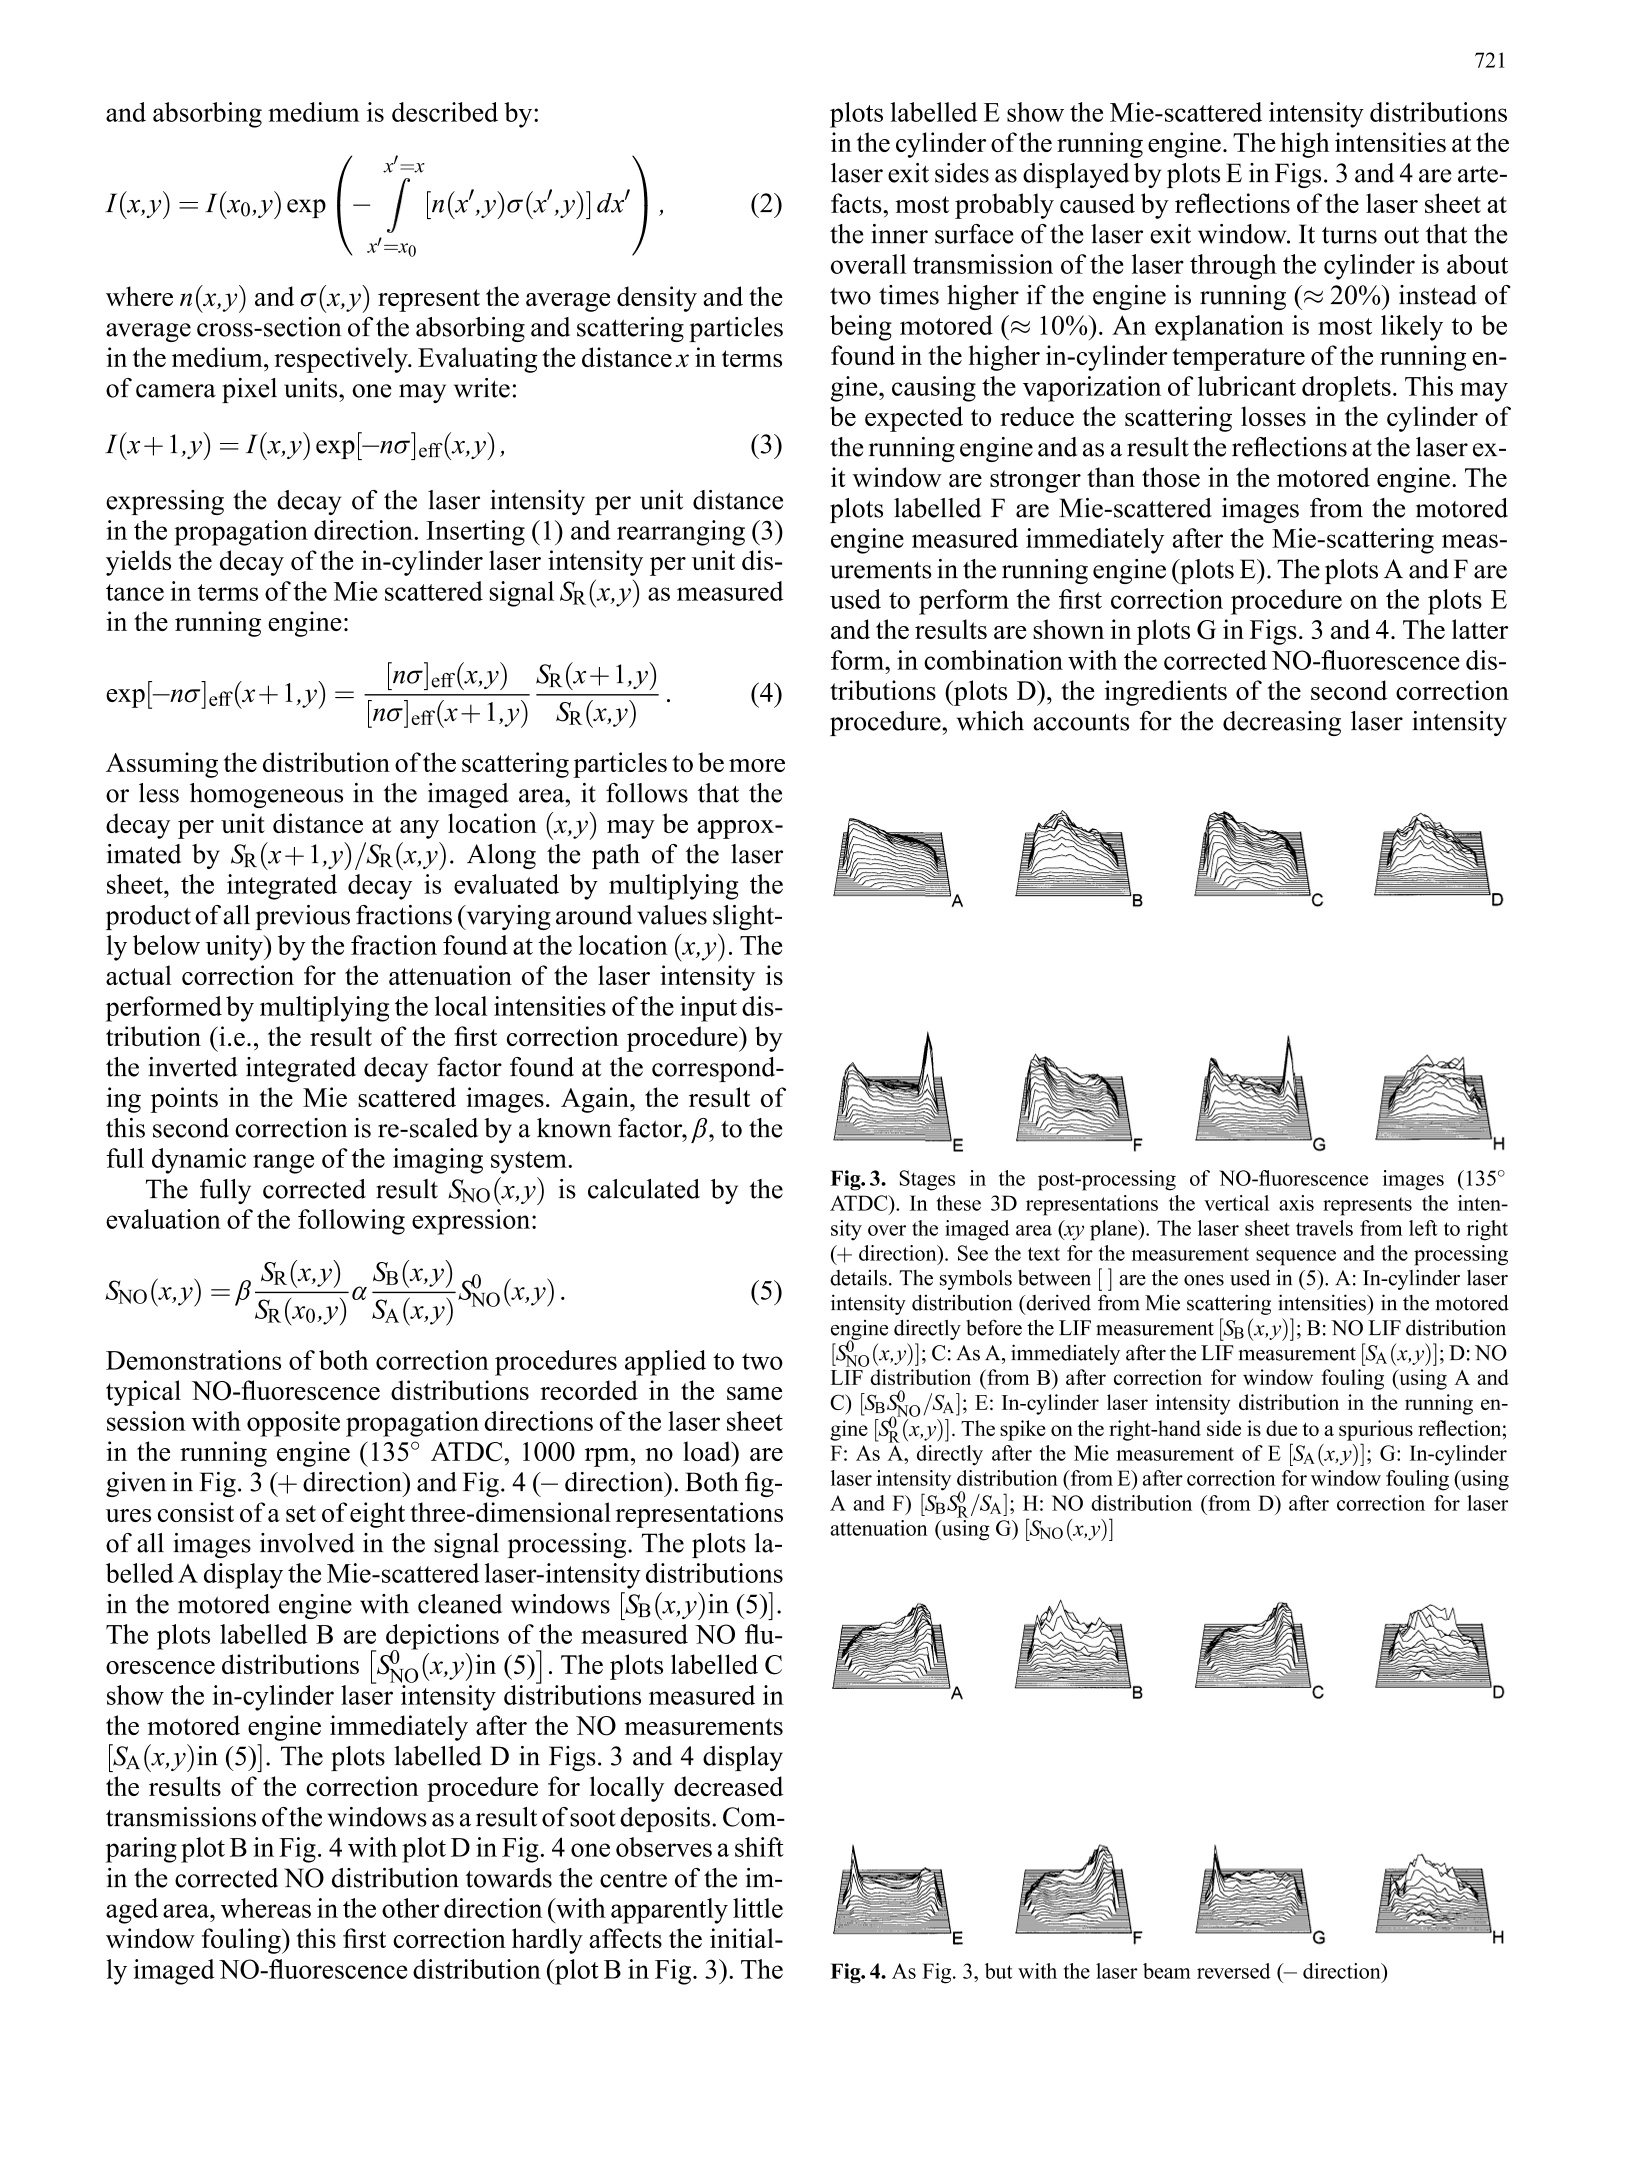
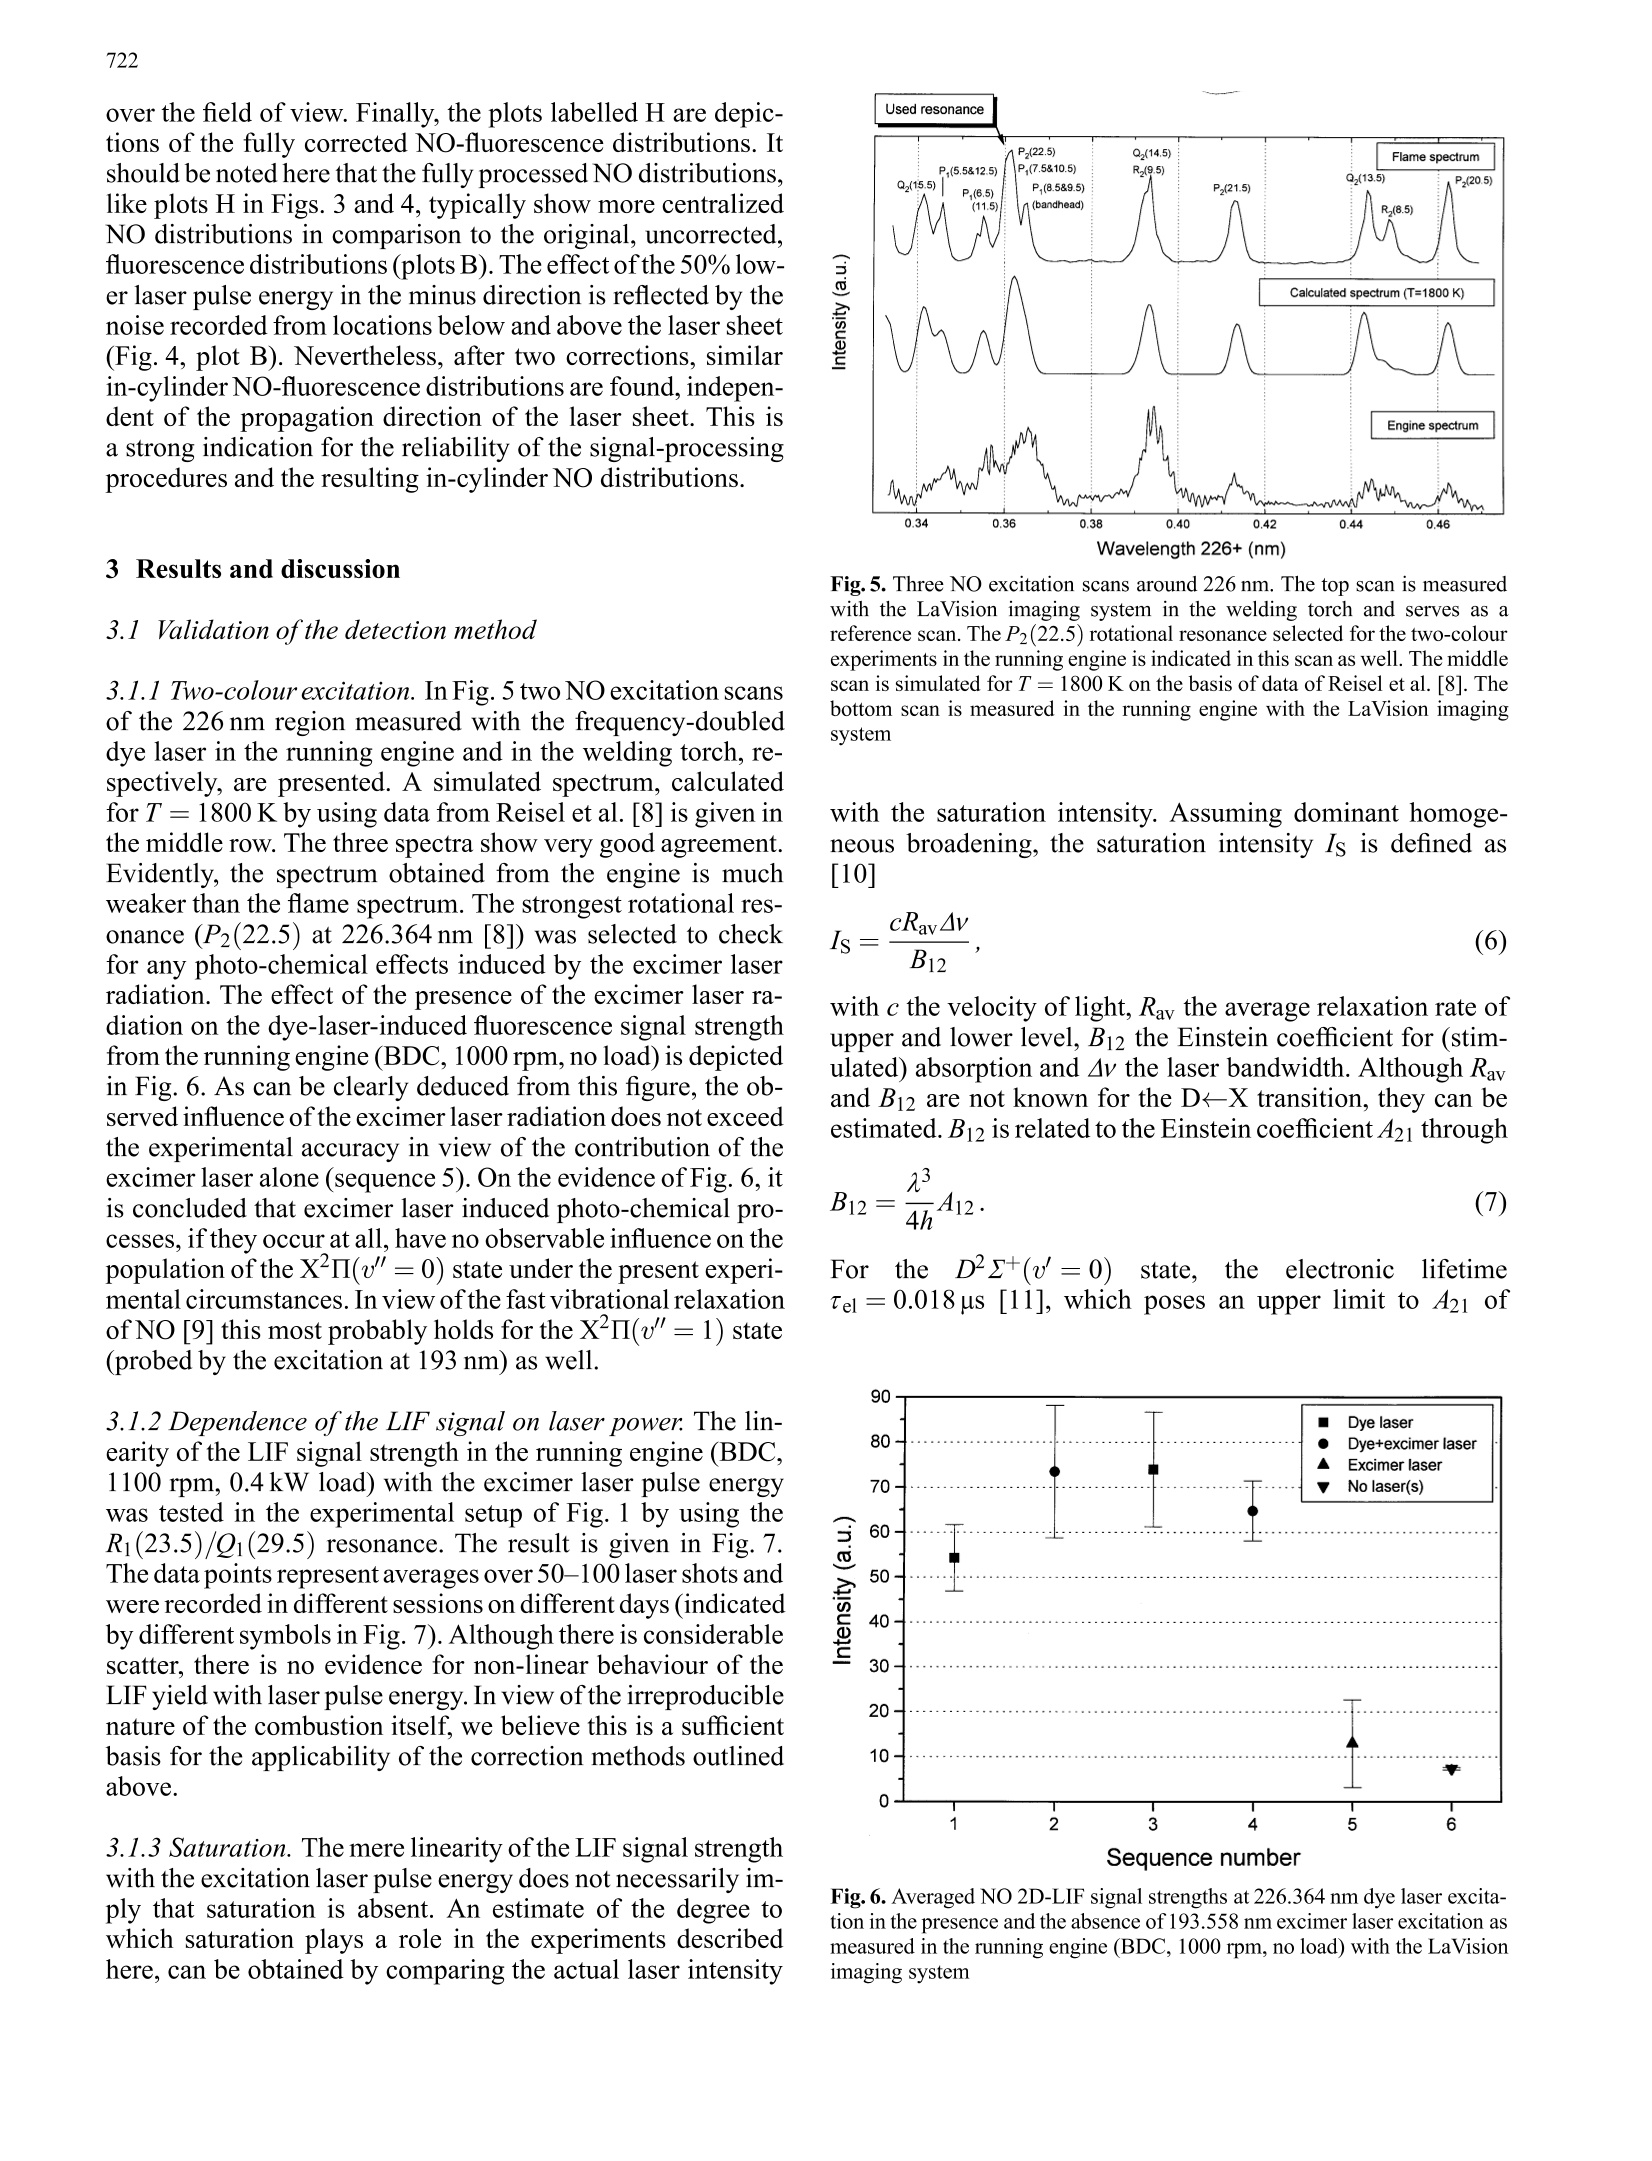
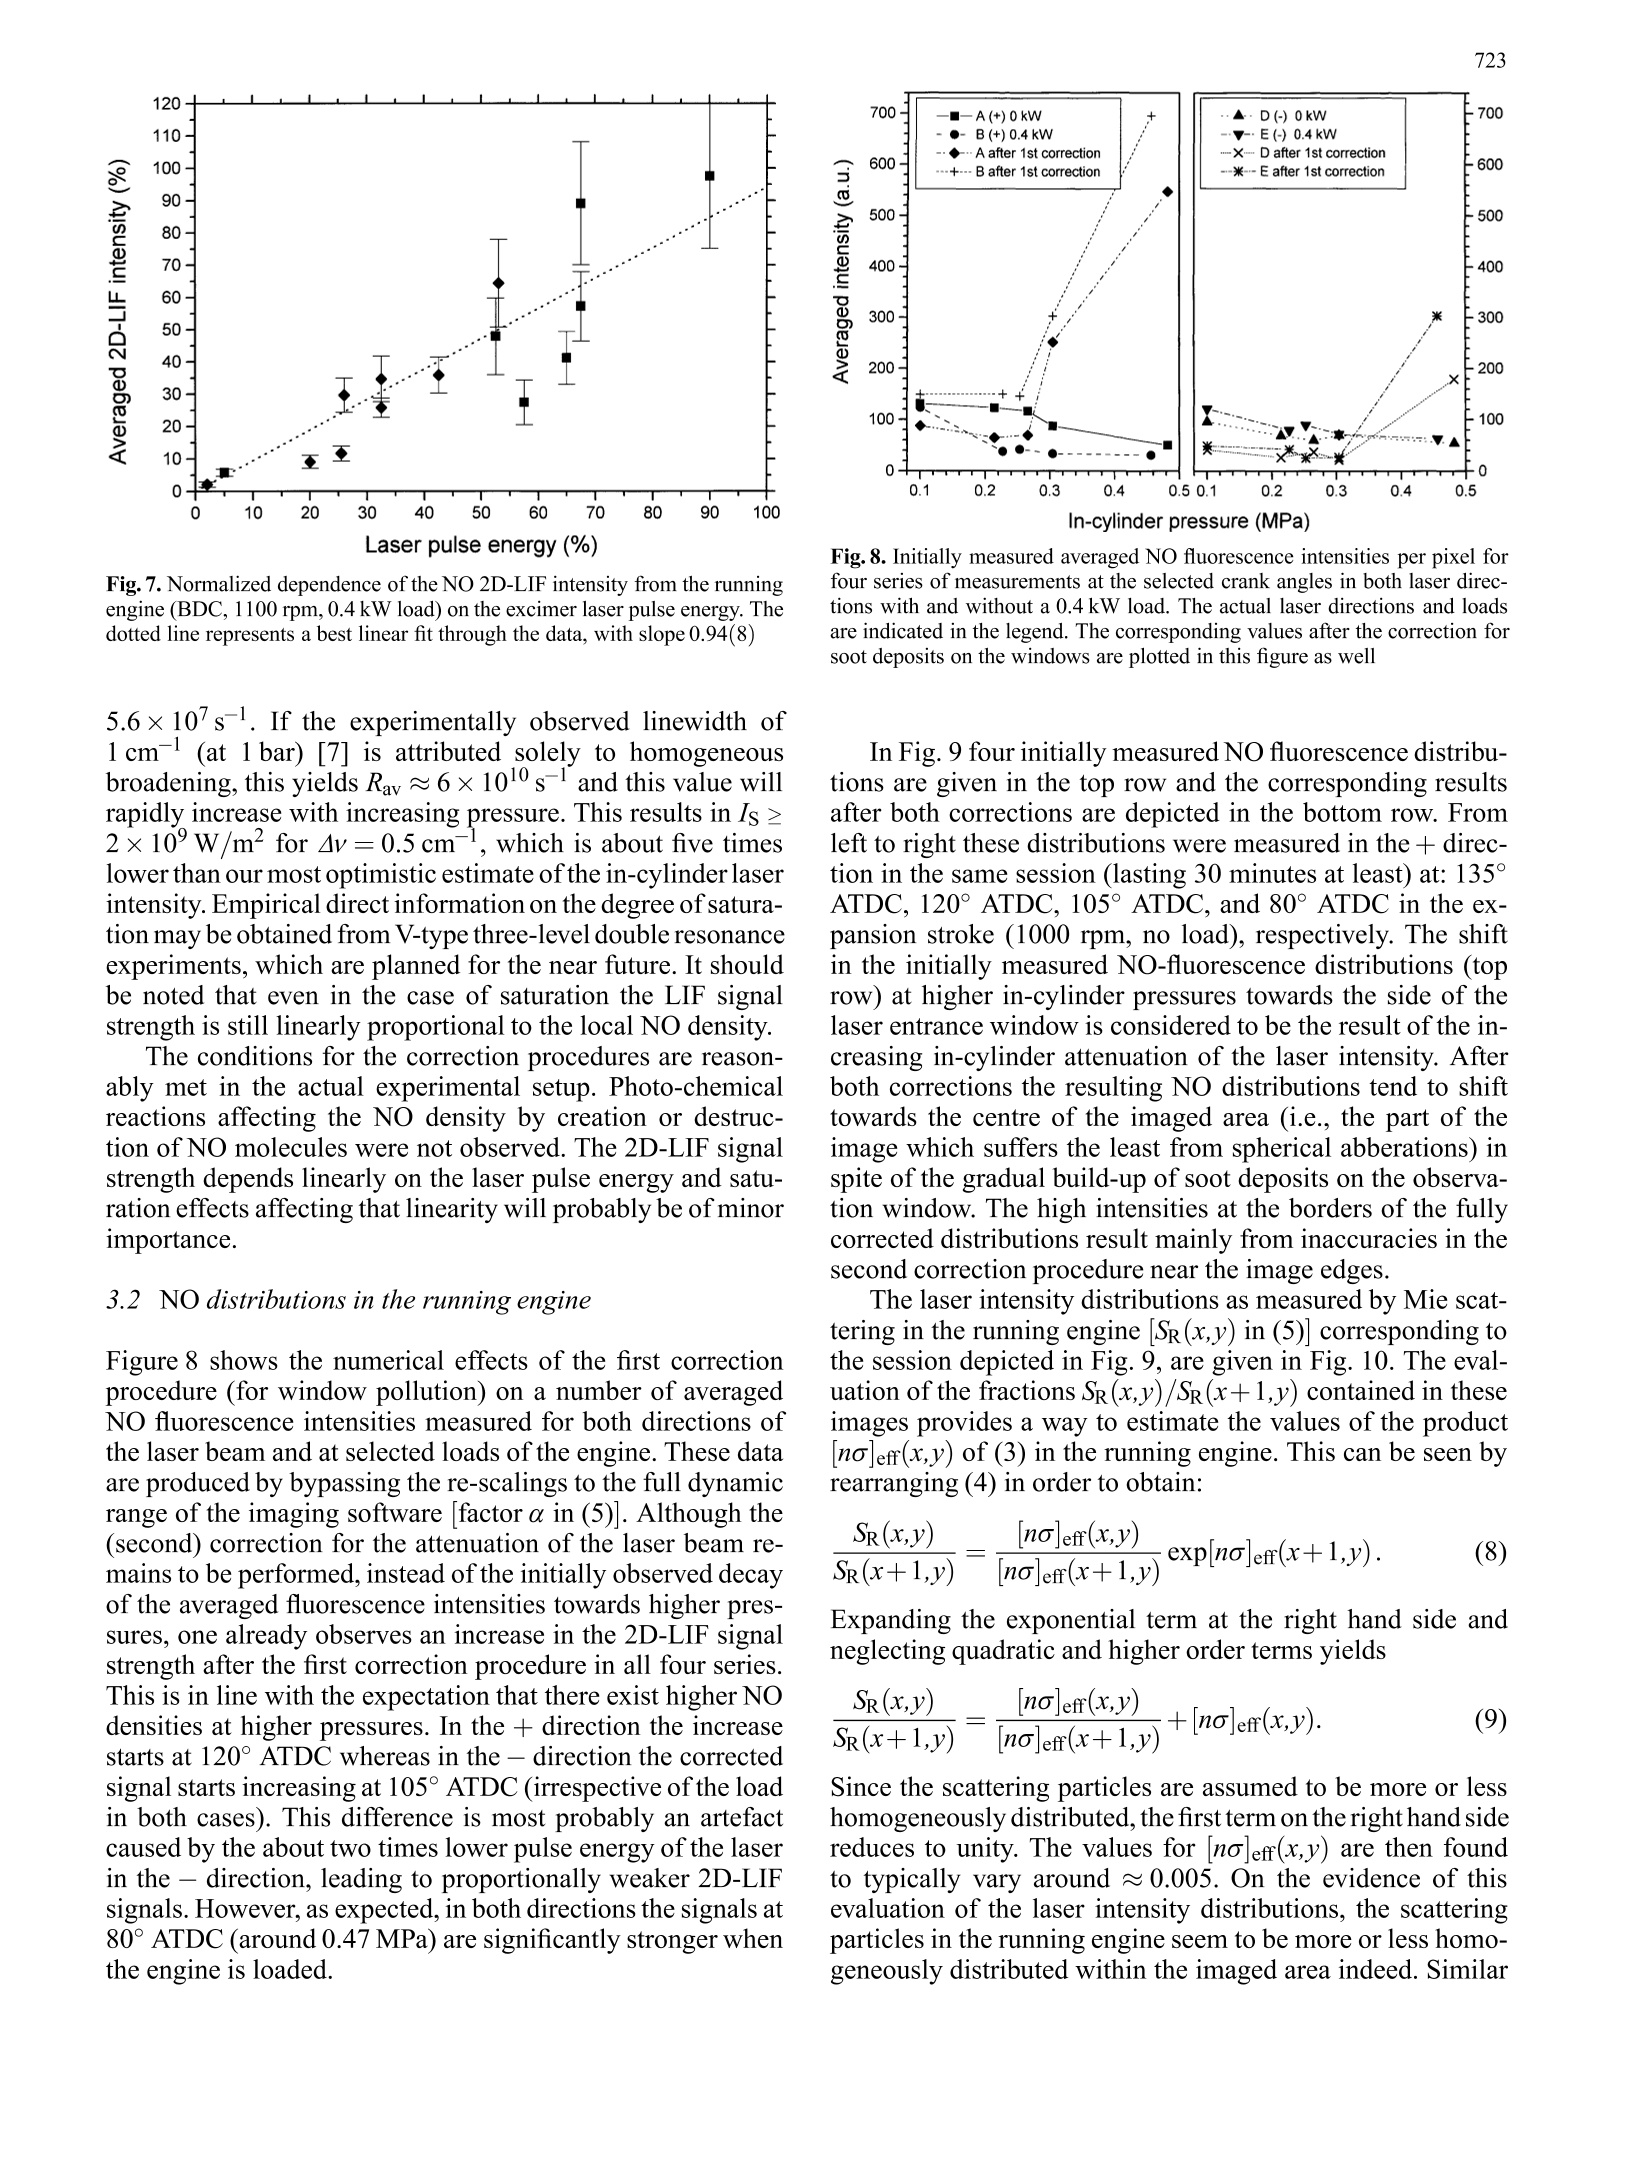
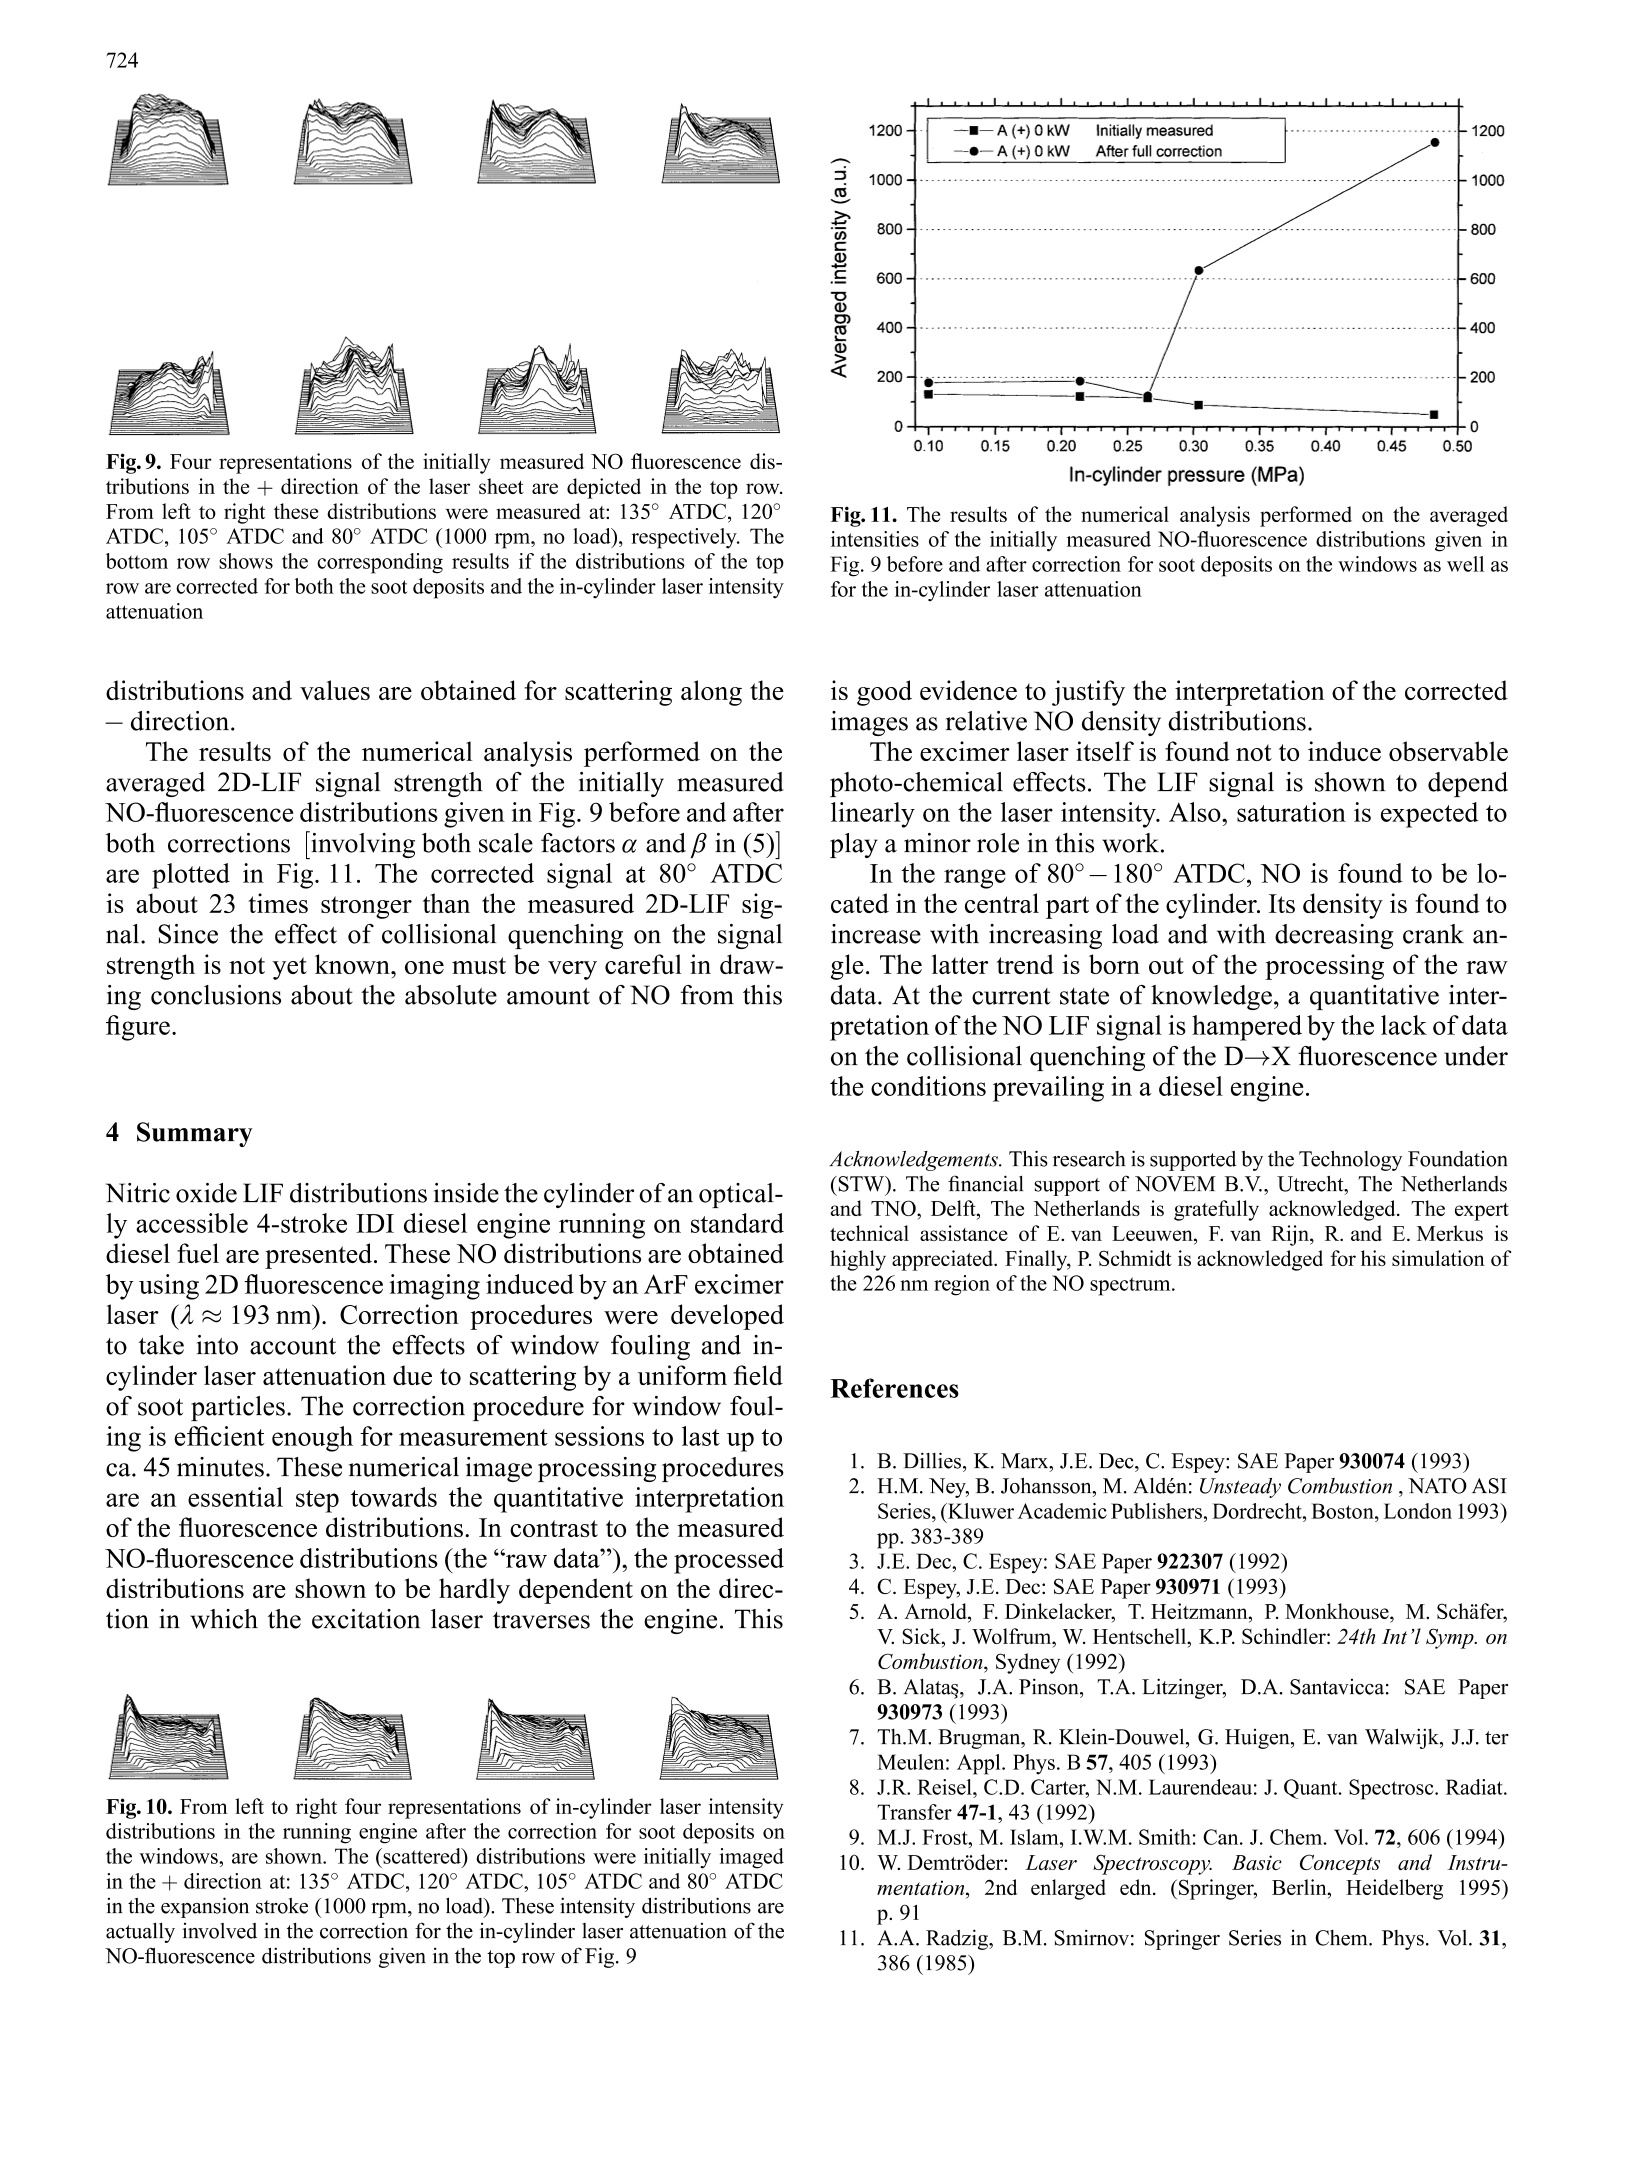
Appl. Phys. B 64, 717-724 (1997)PhysicsBLasersand OpticsC Springer-Verlag 1997 719 Imaging and post-processing of laser-induced fluorescencefrom NO in a diesel engine Th.M. Brugman, G.G.M.Stoffels,N. Dam, W.L. Meerts, J.J. ter Meulen Department of Molecular and Laser Physics, University of Nijmegen, Toernooiveld, 6525 ED Nijmegen, The Netherlands(Fax: +31-24/365-3311) Received: 11 July 1996/Revised version: 12 November 1996 Abstract. The imaging of in-cylinder NO distributions in asteadily running optically accessible diesel engine operatedon standard diesel fuel is performed by means of the 2D-LIF technique and a tunable ArF excimer laser at 193 nm.Simultaneous excitation at 226nm showed that no sizablephoto-chemical effects are induced by the excimer laser. Inorder to account for the gradually decreasing transparency ofthe windows due to soot deposits and for the in-cylinder atten-uation of the laser intensity, signal processing procedures forthe imaged distributions are presented. In addition to the morerealistic depictions of NO distributions at selected crank an-gles and loads resulting from these procedures, the latter arean essential step towards a quantitative interpretation of thecorresponding in-cylinder NO concentrations. PACS: 42.30.Va; 82.20.Wt Diesel engines are becoming increasingly popular because oftheir highly efficient combustion in comparison to spark ig-nited engines. This high efficiency generally leads to a loweremission of CO2 and as a consequence diesel-fuel-driven en-gines tend to contribute less to the greenhouse effect. The hightemperature that results from the high pressure in the combus-tion chamber of a diesel engine causes the auto-ignition of thefuel/air mixture but also gives rise to the subsequent forma-tion of NO and NO2. Furthermore, the largest of the organicmolecules making up the complex chemical composition ofdiesel fuel are easily transformed into carcinogenic coatingson the soot particles that are produced during the combustionas well. For environmental reasons the emissions of NOx andsoot must be reduced drastically in order to meet the ever morestringent emission standards. However, in spite of the progressmade in the modelling of the physics and the chemistry in thecombustion chamber [1] the diesel combustion process is stilltoo complex to be fully understood. In recent years the applica-bility of several non-intrusive laser diagnostic techniques suchas LIF (laser induced fluorescence) and Mie scattering to thestudy of the combustion processes inside diesel engines hasbeen widely recognized. When the fuel is doped with fluoresc-ing tracers,2D-LIF can be successfully applied in the study ofthe fuel distribution in a spark-ignition engine [2] and in thecombustion chamber of a directly injected diesel engine [3].In-cylinder soot distributions may be studied by a combination ofthe 2D-LII (laser induced incandescence) technique and res-onant (Mie) scattering [4]. In-cylinder NO distributions havebeen visualized by means of2D-LIF by Arnold et al.[5],Ala-tas et al. [6] and Brugman et al. [7]. Alatas et al., using a 50/50mixture of iso-octane and tetradecane in a square combustionchamber, found evidence that the NO formation ceases at 30°to 40°ATDC (after top dead centre). In these experiments itwas assumed that the LIF detection method is non-intrusive.The high excimer laser intensities used, however, may giverise to photo-chemical processes by which NO is producedor destroyed. This might result in erroneously measured NOdistributions. In this work a two-colour experiment was per-formed on NO in a running diesel engine in order to check forthe occurrence of these photo-chemical effects. In most of the above mentioned studies the test engineswere driven by low-sooting substitute fuels and operated inskip-fired mode (i.e., the combustion in the motored enginetakes place only every selectable number of cycles) in orderto prolong the optical transparency of the windows of thecombustion chamber. However, if the measurements are to beperformed in a standard diesel-fuel-driven engine under steadyoperating conditions, the decreasing window transparency asa result of soot deposition should be taken into account. Also,the in-cylinder attenuation of the laser sheet intensity needs tobe accounted for. The objective ofthis study was to investigatethe extent to which the applied 2D-LIF in-cylinder imagingtechnique in itself is capable of producing reliable and accurateresults. Therefore, methods are explored by which the imagedNO-fluorescence distributions can be adjusted for the gradual-ly decreasing transparency of the windows and the in-cylinderattenuation of the laser intensity, in order to obtain more realis-tic NO distributions. In addition, as a check of the reliability ofthe obtained NO LIF images, measurements were performedin which the laser-beam direction was reversed. When correct-ed for window transmission losses and laser-beam extinction,the obtained NO images should be independent of the laserbeam direction. 1 Experimental The laser, the engine and the intensified CCD camera arethe principal elements of the experimental setup as depictedin Fig. 1. The tunable ArF excimer laser (Lambda Physik EMG 150 MSCT) delivers 193nm radiation with an av-erage pulse energy of 90 mJ in 13 ns over a rectangularcross-sectional area of 75 mm² (25 mm×3mm). Within the300-cm--wide tuning range of the laser, NO can effectivelybe excited through a series of rotational lines of the vibronicband D2+(v=0)←xII(u"=1). In a previous publica-tion on this topic [7] excitation scans of NO in the runningengine are presented. Since in the same paper the experimen-tal setup is described in detail as well, the following is focusedon the essentials and some alterations. 1.1 The essentials The 2D-LIF measurements are performed at a fixed laserwavelength (193.588nm) corresponding to the coincid-ing R1(23.5)/Qi(29.5) rotational transitions of NO in theabove-mentioned band. It turns out that slightly strongersignals are obtained on these lines in comparison to theR1(26.5)/Qi(32.5) transitions selected for imaging in [7].Absorption of laser radiation by molecular oxygen in theSchumann-Runge band is not observed for either transi-tion [7]. During the measurements the laser is manually kepton resonance by monitoring the simultaneously induced flu-orescence from NO in an oxy-acetylene flame. In order toproduce this calibration signal, about 8% of the pulse energyis focused in the flame of a welding torch by means of a beamsplitter and a cylindrical lens. The LIF signal from the flameis detected by a photomultiplier attached to a monochromatorset to 208 nm. This wavelength corresponds to the NO vibron-ic transition D22+(u’=0)→X2II(u=3). By means oftwomirrors the remaining pulse energy is sent through the cylin-der. This yields about 60 mJ/pulse at the location of the laserentrance window (this propagation direction is denotedby+).In order to verify the correction procedures the propagationdirection of the laser beam through the cylinder may be re-versed (this direction is denoted by-) by applying two moremirrors at the cost of30 mJ/pulse, i.e., leaving 30 mJ/pulseat the opposite laser entrance window. The cylinder of an air-cooled indirectly injected 4-strokediesel engine (HATZ-Samofa) with a swept volume of about 580 cc (bore 86 mm, stroke 100 mm) is modified by mount-ing three cylindrical quartz windows (diameter 25 mm) in thecylinder wall as close to the cylinder head as possible. Thisconstruction provides optical access to the interior of the cylin-der as long as the moving piston does not block the windows,i.e., for crank angles greater than 70° ATDC in the expansionstroke. Two of these three windows serve the purpose of trans-mitting the vertically oriented 25 mm high and 3 mm thicklaser sheet, and the induced fluorescence is imaged throughthe third window in a direction perpendicular to the lasersheet. A spherical lens (f= 5.5 cm) placed directly in front ofthis third window increases the field of view of the imagingsystem. The 2D-LIF signal is separated from the resonantlyscattered laser radiation by means of a 10 nm bandwidth in-terference filter (Laser Optik, Garbsen, Germany) adjusted tomaximum transmission (≈80%) at 208 nm. The 2D-LIF sig-nal is then fed into the 50 ns gated image intensifier in frontof the CCD camera to be recorded on video tape for later pro-cessing. The background signal proved to be negligible withthis setup [7]. The spherical lens in the detection path causesall images to suffer from spherical abberations. Furthermore,growing transmission losses towards the edge of the imagedarea are observed as a result of the decreasing collection effi-ciency of the detection system. However, the transmission inthe central part of the detection path was measured to be high-er than 75% within 90% of the radius of the imaged area. Inthis work the position of the spherical lens is fixed so as tomonitor a 5 cm wide in-cylinder area. An opto-electronic device continuously measures thecrank position of the engine with an accuracy of about 1.2°.This device triggers a delay generator which in turn synchro-nizes the laser pulses, the LIF calibration section and the2D-LIF imaging system. An adjustable water-cooled electricbrake mounted on the flywheel of the engine provides vari-ous load conditions. Most of the NO imaging presented in thiswork is performed while the engine is running steadily (about1000 rpm) on standard diesel fuel. A fixed amount of oxygen(circa 12%) is added to the inlet air of the running engine inorder to raise the combustion temperature, resulting in an in-creased population of the probed (v"=1) state of NO. Theincreased combustion temperature also leads to decreased soot formation, and, as a consequence, a sufficiently high opticaltransparency ofthe quartz windows can be maintained over al-mostunlimited periods oftime. The temperature ofthe exhaustgases is measured using a thermocouple mounted in the ex-haust pipe approximately 5 cm from the cylinder. If the engineidles (no load) this temperature is typically 250°C; it graduallyrises up to 400°C if the load is increased to 0.8 kW. Increasingthe load any further eventually leads to critical temperaturesin respect of the sealings for the windows in the cylinder wall.The pressure in the cylinder for the running engine is meas-ured by replacing one ofthe quartz windows by a water-cooledpressure transducer (AVL QC 32) designed for pressures up to20 MPa at high combustion temperatures. The output of thistransducer is fed into a charge amplifier, the output of whichis averaged over 50 cycles by a digital oscilloscope. This set-up permits the in-cylinder pressure to be precisely monitoredduring the optically accessible parts of the combustion cycle. The imaging hardware consists of an image process-ing board (Matrox PIP-1024 A/D converter) installed in a486DX4 100MHz personal computer. This board producesimages with 8 bits dynamic range consisting of 512 pixelsx512 pixels. The software provides the possibility to grab theseimages continuously and to display each grabbed frame in anumber of different false colour representations on the screenof a separate RGB monitor. In contrast to many other imageprocessing systems this system accepts input from a standardVHS video recorder as well, thus allowing for the off-line an-alysis of recorded 2D-LIF signals. Another relevant softwareoption offers the possibility to add any number of grabbedframes in order to produce an averaged image. This is achievedby dividing the 512 pixels x 512 pixels array of added inten-sities by the number of frames grabbed and a subsequentre-scaling of the result to the full dynamic range. 1.2 The measuring sequence Before each 2D-LIF measurement the intensity distribution ofthe laser sheet in the motored engine is averaged over about300 Mie-scattered images by bypassing the interference filter in front of the CCD camera (resonant scattering by residualparticles). This measurement takes about two minutes. Next,the interference filter is re-installed and a 2D-LIF measure-ment in the running engine is performed over the next twominutes. Immediately after the 2D-LIF measurement the en-gine is motored again and the averaged intensity distributionof the laser sheet is measured in the same way as before. Anylocally decreased transmissions caused by the gradual build-up of local soot deposits on the windows while the engine isrunning is spotted by a comparison of the two averaged inten-sity distributions of the laser sheet before and after the 2D-LIFmeasurement. 1.3 The double resonance setup For the excimer laser induced fluorescence to be a reliabletechnique for NO detection, the excimer laser should not pro-duce or destroy any NO by itself. In order to check that nosuch photo-chemical effects occur, a four-level double reson-ance experiment is performed, in which the NO fluorescenceinduced by a probe laser is monitored as a function of thepresence or absence of the excimer laser. The experimentalsetup is schematically depicted in Fig. 2. A frequency-doubledpulsed dye laser, operated on Coumarin 47, is used as the probelaser, providing about0.5 mJ/pulse at226 nm (estimated pulseenergy in the combustion chamber). This laser is used to ex-cite rotational transitions in the A2+(v=0)X²II(=0)band. The resulting fluorescence in the A+(u’=0)→XII(v=4) band at 272 nm is monitored by a gated inten-sified slow-scan CCD camera system (LaVision, FlameStar)througha 3 mm thick UG 5 filter. A spherical lens (f=30cm)focuses the probe laser beam at the axis ofthe cylinder in sucha way that both laser pulses have maximum spatial overlap.When the excimer laser and the dye laser are applied together,the dye laser is delayed by 40 ns with respect to the excimerlaser. This delay serves two purposes. On the one hand theexcimer laser itself produces strong fluorescence at 272 nm,which,however, has decayed to a manageable level after 40 ns.Furthermore, the delay allows for equilibration ofthe NO pop-ulation distribution following the excimer pulse, so that any Fig.2. Schematic overview of the modifiedexperimental setup photo-chemically induced change in the NO population mightcommunicate itself to the level probed by the dye laser. 2 Signal processing In spite ofthe high combustion temperature the running enginestill produces enough soot to locally reduce the transmissionof the quartz windows. These soot particles tend to mix withthe lubricant of the engine and as a result sticky UV-absorbingdeposits on the inner surfaces of the quartz windows mayoccur over longer periods of time. Although the initial loca-tions of the deposits are rather unpredictable,changes in theselocations during the measurements in the running engine arenot observed. In fact, it turns out that after each session (tak-ing about 45 minutes in which the engine is alternately firedand motored) the deposits can be thoroughly removed only bymeans of copper polish. If the laser entrance window happensto become locally blocked by these deposits the measured av-eraged NO-fluorescence distribution displays correspondinghorizontal areas of apparently lower NO concentrations as aresult of the inhomogeneous intensity distribution in the lasersheet [7]. Whenever such deposits are formed on the inner sur-face of the window facing the camera the imaged NO distribu-tion might also be misleading because of the locally decreasedtransmission of the 2D-LIF signal. However, by measuring theintensity distributions of the laser sheet in the cylinder imme-diately before and after each 2D-LIF measurement the corre-sponding averaged NO-fluorescence distributions may easilybe corrected for this effect. On top ofthat, the attenuation ofthelaser intensity in the cylinder of the running engine, means theNO-fluorescence distributions, as initially measured, alwaysdisplay the largest NO signal on the side where the laser sheetenters the cylinder. In the following, two correction proceduresaccounting for all the above-mentioned effects on the initiallyimaged NO fluorescence distributions will be presented. It is not yet possible to correct for the effects of collision-al quenching on the measured NO-fluorescence distributions.Owing to inelastic collisions, a considerable decrease in thenumber of fluorescing NO molecules is brought about and asa consequence the intensity of the induced fluorescence is re-duced (quenched). This will affect the total signal strengthof the observed NO LIF distributions, thus making the deter-mination of absolute NO densities difficult. Nevertheless, areliable qualitative picture of the NO distribution may be ob-tained as a function of the in-cylinder pressure and the loadof the engine, as will be shown in the next section. Experi-ments to study the dependence of the quenching rates of theinduced fluorescence on the temperature, the pressure and thegas composition are in progress. The correction procedures discussed below are based onthe assumption that the sampled 2D-LIF signal strength de-pends linearly on both the laser pulse energy and the NO popu-lation density in the imaged area. The pulse energy of the ArFexcimer laser is high enough to possibly cause saturation ef-fects and/or photo-chemical processes (creating or dissociat-ing NO) which, in turn, would adversely affect the required lin-earity of the above mentioned dependencies. For this reason, anumber of experiments have been performed to investigate theextent to which the conditions for the signal processing pro-cedures are met in the actual experimental circumstances. The results of these tests will be given in the next section. On thebasis of these results the following assumptions are justified.-The measurements at 193 nm excitation are non-intrusive,i.e., the observed 2D-LIF signal from the probed NOmolecules is not influenced by photo-chemistry. - The 2D-LIF intensity from NO in the running engine at193 nm excitation and steady operating conditions dependslinearly on the local laser intensity. These assumptions form the basis for the following image-processing procedures. In general, the attenuation of both the laser intensity and theinduced fluorescence inside the cylinder ofthe running enginemay result from absorption and scattering by the multitude ofdifferent molecules and particles produced during combustion.It turns out that the attenuation due to photon absorption byNO molecules is negligible since the transmission of the lasersheet through the cylinder of the running engine is observedto be independent of the laser wavelength. Although probablynot negligible,the in-cylinder attenuation of the NO LIF signalitself is expected to be more or less uniform over the imagedarea. The dominant laser attenuation mechanism turns out toresult from absorption and Mie scattering by particles. The res-onantly scattered 2D signal will be a measure for the laser in-tensity distribution in the imaged in-cylinder area, provided thedifferently sized scattering particles are more or less uniformlydistributed within the imaged area. This condition is thought tobe met on the basis of the experimental results presented in thenext section. It will be shown that even in the motored engine,due to the presence of many residual soot particles, the in-cylinder laser-intensity distribution can be measured this way. The scattered intensity S(x,y) from any point (x,y) in theimaged area is proportional to the local laser intensity I(x,y)and to the local density ns (x,y) and the cross-section os (x,y)of the scattering particles: The laser intensity distributions IB(x,y) and IA(x,y) in themotored engine before and after the 2D-LIF measurement arereflected by the imaged Mie scattered intensities SB(x,y) andSA(x,y), respectively. Assuming that both the 2D-LIF signaland the scattered signals are attenuated in the same way, theevaluation of the fraction SB(x,y)/SA(x,y) over the imagedarea provides a numerical measure to correct the imaged NOfluorescence distribution for any locally decreased windowtransparency caused by soot deposits during combustion. Thiscorrection is performed by multiplying the intensity of theinitially measured NO fluorescence distribution So(x,y) bythe value ofSB(x,y)/SA(x,y)=IB(x,y)/IA(x,y). The result ofthis correction is re-scaled by a known factor, a, to the fulldynamic range of the imaging system. The resulting imagethen represents the NO fluorescence distribution as would beobserved in the running engine if the windows were to stayperfectly clean during the measurements. However, in order to reconstruct more realistic NO LIFdistributions a correction for the attenuation ofthe intensity ofthe laser sheet in the cylinder of the running engine has to beperformed as well. Theoretically, the decay ofthe intensity I ofa laser beam along its propagation direction (x) in a scattering and absorbing medium is described by: where n(x,y) and o(x,y) represent the average density and theaverage cross-section of the absorbing and scattering particlesin the medium, respectively. Evaluating the distancex in termsof camera pixel units, one may write: expressing the decay of the laser intensity per unit distancein the propagation direction. Inserting (1) and rearranging (3)yields the decay of the in-cylinder laser intensity per unit dis-tance in terms of the Mie scattered signal SR(x,y) as measuredin the running engine: Assuming the distribution ofthe scattering particles to be moreor less homogeneous in the imaged area, it follows that thedecay per unit distance at any location (x,y) may be approx-imated bySR(x+1,y)/SR(x,y). Along the path of the lasersheet, the integrated decay is evaluated by multiplying theproduct of all previous fractions (varying around values slight-ly below unity) by the fraction found at the location (x,y). Theactual correction for the attenuation of the laser intensity isperformed by multiplying the local intensities of the input dis-tribution (i.e., the result of the first correction procedure) bythe inverted integrated decay factor found at the correspond-ing points in the Mie scattered images. Again, the result ofthis second correction is re-scaled by a known factor, , to thefull dynamic range of the imaging system. The fully corrected result SNo(x,y) is calculated by theevaluation of the following expression: Demonstrations of both correction procedures applied to twotypical NO-fluorescence distributions recorded in the samesession with opposite propagation directions ofthe laser sheetin the running engine (135°ATDC, 1000 rpm, no load) aregiven in Fig. 3 (+direction) and Fig. 4 (-direction). Both fig-ures consist of a set ofeight three-dimensional representationsof all images involved in the signal processing. The plots la-belled A display the Mie-scattered laser-intensity distributionsin the motored engine with cleaned windows SB (x,y)in (5)].The plots labelled B are depictions of the measured NO flu-orescence distributions [S&o(x,y)in (5)]. The plots labelled Cshow the in-cylinder laser intensity distributions measured inthe motored engine immediately after the NO measurements[SA(x,y)in (5)]. The plots labelled D in Figs. 3 and 4 displaythe results of the correction procedure for locally decreasedtransmissions ofthe windows as a result of soot deposits. Com-paring plot B in Fig. 4 with plotD in Fig. 4 one observes a shiftin the corrected NO distribution towards the centre of the im-aged area, whereas in the other direction (with apparently littlewindow fouling) this first correction hardly affects the initial-ly imagedNO-fluorescence distribution (plot B in Fig. 3). The plots labelled E show the Mie-scattered intensity distributionsin the cylinder of the running engine. The high intensities at thelaser exit sides as displayed by plots E in Figs. 3 and 4 are arte-facts, most probably caused by reflections of the laser sheet atthe inner surface of the laser exit window. It turns out that theoverall transmission of the laser through the cylinder is abouttwo times higher if the engine is running (≈20%) instead ofbeing motored (~10%). An explanation is most likely to befound in the higher in-cylinder temperature of the running en-gine, causing the vaporization of lubricant droplets. This maybe expected to reduce the scattering losses in the cylinder ofthe running engine and as a result the reflections at the laser ex-it window are stronger than those in the motored engine. Theplots labelled F are Mie-scattered images from the motoredengine measured immediately after the Mie-scattering meas-urements in the running engine (plots E). The plots A and F areused to perform the first correction procedure on the plots Eand the results are shown in plots G in Figs. 3and 4. The latterform, in combination with the corrected NO-fluorescence dis-tributions (plots D), the ingredients of the second correctionprocedure, which accounts for the decreasing laser intensity Fig.3. Stages in the post-processing of NO-fluorescence images (135°ATDC). In these 3D representations the vertical axis represents the inten-sity over the imaged area (xy plane). The laser sheet travels from left to right(+ direction). See the text for the measurement sequence and the processingdetails. The symbols betweenare the ones used in (5). A: In-cylinder laserintensity distribution (derived from Mie scattering intensities) in the motoredengine directly before the LIF measurement [SB (x,y)]; B: NO LIF distribution[sho (x,y)]; C: As A, immediately after the LIF measurement [SA(x,y)]; D:NOLIF distribution (from B) after correction for window fouling (using A andC) [SBS/SA]; E: In-cylinder laser intensity distribution in the running en-gine [sg(x,y)]. The spike on the right-hand side is due to a spurious reflection;F: As A, directly after the Mie measurement of E [SA(x,y)]; G: In-cylinderlaser intensity distribution (from E) after correction for window fouling (usingA and F) [SBSg/SA]; H: NO distribution (from D) after correction for laserattenuation (using G) [SNo (x,y)] Fig. 4. As Fig. 3, but with the laser beam reversed (- direction) over the field of view. Finally, the plots labelled H are depic-tions of the fully corrected NO-fluorescence distributions. Itshould be noted here that the fully processed NO distributions,like plots H in Figs. 3 and 4, typically show more centralizedNO distributions in comparison to the original, uncorrected,fluorescence distributions (plots B). The effect of the 50% low-er laser pulse energy in the minus direction is reflected by thenoise recorded from locations below and above the laser sheet(Fig. 4,plot B). Nevertheless, after two corrections, similarin-cylinder NO-fluorescence distributions are found, indepen-dent of the propagation direction of the laser sheet. This isa strong indication for the reliability of the signal-processingprocedures and the resulting in-cylinder NO distributions. 3 Results and discussion 3.1 Validation of the detection method 3.1.1 Two-colour excitation. In Fig. 5 two NO excitation scansof the 226 nm region measured with the frequency-doubleddye laser in the running engine and in the welding torch, re-spectively, are presented. A simulated spectrum, calculatedfor T =1800 K by using data from Reisel et al. [8] is given inthe middle row. The three spectra show very good agreement.Evidently, the spectrum obtained from the engine is muchweaker than the flame spectrum. The strongest rotational res-onance (P2(22.5) at 226.364 nm [8]) was selected to checkfor any photo-chemical effects induced by the excimer laserradiation. The effect of the presence of the excimer laser ra-diation on the dye-laser-induced fluorescence signal strengthfrom the running engine (BDC, 1000 rpm, no load) is depictedin Fig. 6. As can be clearly deduced from this figure, the ob-served influence of the excimer laser radiation does not exceedthe experimental accuracy in view of the contribution of theexcimer laser alone (sequence 5). On the evidence of Fig. 6, itis concluded that excimer laser induced photo-chemical pro-cesses, if they occur at all, have no observable influence on thepopulation of the X²II(u"=0) state under the present experi-mental circumstances. In view ofthe fast vibrational relaxationof NO [9] this most probably holds for the X²II(u"=1) state(probed by the excitation at 193 nm) as well. 3.1.2 Dependence ofthe LIF signal on laser power: The lin-earity of the LIF signal strength in the running engine (BDC,1100 rpm, 0.4 kW load) with the excimer laser pulse energywas tested in the experimental setup of Fig. 1 by using theRi(23.5)/Qi(29.5) resonance. The result is given in Fig. 7.The data points represent averages over 50-100laser shots andwere recorded in different sessions on different days (indicatedby different symbols in Fig. 7). Although there is considerablescatter, there is no evidence for non-linear behaviour of theLIF yield with laser pulse energy. In view of the irreproduciblenature of the combustion itself, we believe this is a sufficientbasis for the applicability of the correction methods outlinedabove. 3.1.3 Saturation. The mere linearity of the LIF signal strengthwith the excitation laser pulse energy does not necessarily im-ply that saturation is absent. An estimate of the degree towhich saturation plays a role in the experiments describedhere, can be obtained by comparing the actual laser intensity Fig.5.Three NO excitation scans around 226 nm. The top scan is measuredwith the LaVision imaging system in the welding torch and serves as areference scan. The P2(22.5) rotational resonance selected for the two-colourexperiments in the running engine is indicated in this scan as well. The middlescan is simulated for T=1800 K on the basis of data of Reisel et al. [8]. Thebottom scan is measured in the running engine with the LaVision imagingsystem with the saturation intensity. Assuming dominant homoge-neous broadening, the saturation intensity Is is defined as[10 with c the velocity of light, Ray the average relaxation rate ofupper and lower level, B12 the Einstein coefficient for (stim-ulated) absorption and Av the laser bandwidth. Although Rayand B12 are not known for the D←X transition, they can beestimated. B12 is related to the Einstein coefficient A21 through For t D²2+(u'=0)state. theie(electroniclifetimetel=0.018 us [11], which poses an upper limit to A21 of Fig. 6. Averaged NO 2D-LIF signal strengths at 226.364 nm dye laser excita-tion in the presence and the absence of193.558 nm excimer laser excitation asmeasured in the running engine (BDC, 1000 rpm,no load) with the LaVisionimaging system Fig.7.Normalized dependence of the NO 2D-LIF intensity from the runningengine (BDC, 1100 rpm, 0.4 kW load) on the excimer laser pulse energy. Thedotted line represents a best linear fit through the data, with slope 0.94(8) 5.6×10⁷s-1. If the experimentally observed linewidth of1 cm(at 1 bar) [7] is attributed solely to homogeneousbroadening, this yields Rav ~6×10¹⁰s-l and this value willrapidly increase with increasing pressure. This results in Is >2×10°W/m² for 4v=0.5 cm-, which is about five timeslower than our most optimistic estimate ofthe in-cylinder laserintensity. Empirical direct information on the degree of satura-tion may be obtained from V-type three-level double resonanceexperiments, which are planned for the near future. It shouldbe noted that even in the case of saturation the LIF signalstrength is still linearly proportional to the local NO density. The conditions for the correction procedures are reason-ably met in the actual experimental setup. Photo-chemicalreactions affecting the NO density by creation or destruc-tion of NO molecules were not observed. The 2D-LIF signalstrength depends linearly on the laser pulse energy and satu-ration effects affecting that linearity will probably be of minorimportance. 3.2 NO distributions in the running engine Figure 8 shows the numerical effects of the first correctionprocedure (for window pollution) on a number of averagedNO fluorescence intensities measured for both directions ofthe laser beam and at selected loads of the engine. These dataare produced by bypassing the re-scalings to the full dynamicrange of the imaging software factor a in (5). Although the(second) correction for the attenuation of the laser beam re-mains to be performed, instead of the initially observed decayof the averaged fluorescence intensities towards higher pres-sures, one already observes an increase in the 2D-LIF signalstrength after the first correction procedure in all four series.This is in line with the expectation that there exist higher NOdensities at higher pressures. In the + direction the increasestarts at 120°ATDC whereas in the -direction the correctedsignal starts increasing at 105° ATDC (irrespective of the loadin both cases). This difference is most probably an artefactcaused by the about two times lower pulse energy of the laserin the - direction, leading to proportionally weaker 2D-LIFsignals. However, as expected, in both directions the signals at80° ATDC (around 0.47 MPa) are significantly stronger whenthe engine is loaded. Fig. 8. Initially measured averaged NO fluorescence intensities per pixel forfour series of measurements at the selected crank angles in both laser direc-tions with and without a 0.4kW load. The actual laser directions and loadsare indicated in the legend. The corresponding values after the correction forsoot deposits on the windows are plotted in this figure as well In Fig. 9 four initially measured NO fluorescence distribu-tions are given in the top row and the corresponding resultsafter both corrections are depicted in the bottom row. Fromleft to right these distributions were measured in the+direc-tion in the same session (lasting 30 minutes at least) at: 135°ATDC, 120°ATDC,105°ATDC, and 80°ATDC in the ex-pansion stroke (1000 rpm, no load), respectively. The shiftin the initially measured NO-fluorescence distributions (toprow) at higher in-cylinder pressures towards the side of thelaser entrance window is considered to be the result of the in-creasing in-cylinder attenuation of the laser intensity. Afterboth corrections the resulting NO distributions tend to shifttowards the centre of the imaged area (i.e., the part of theimage which suffers the least from spherical abberations) inspite of the gradual build-up of soot deposits on the observa-tion window. The high intensities at the borders of the fullycorrected distributions result mainly from inaccuracies in thesecond correction procedure near the image edges. The laser intensity distributions as measured by Mie scat-tering in the running engine [SR(x,y) in (5)] corresponding tothe session depicted in Fig. 9, are given in Fig. 10. The eval-uation of the fractions SR(x,y)/SR(x+1,y) contained in theseimages provides a way to estimate the values of the product[no]efr(x,y) of (3) in the running engine. This can be seen byrearranging(4) in order to obtain: Expanding the exponential term at the right hand side andneglecting quadratic and higher order terms yields Since the scattering particles are assumed to be more or lesshomogeneously distributed, the first term on the right hand sidereduces to unity. The values for no]efr(x,y) are then foundto typically vary around ≈0.005. On the evidence of thisevaluation of the laser intensity distributions, the scatteringparticles in the running engine seem to be more or less homo-geneously distributed within the imaged area indeed. Similar Fig. 9. Four representations of the initially measured NO fluorescence dis-tributions in the + direction of the laser sheet are depicted in the top row.From left to right these distributions were measured at: 135°ATDC, 120°ATDC, 105° ATDC and 80°ATDC (1000 rpm, no load), respectively. Thebottom row shows the corresponding results if the distributions of the toprow are corrected for both the soot deposits and the in-cylinder laser intensityattenuation distributions and values are obtained for scattering along the- direction. The results of the numerical analysis performed on theaveraged 2D-LIF signal strength of the initially measuredNO-fluorescence distributions given in Fig. 9 before and afterboth corrections involving both scale factors a and B in (5)are plotted in Fig. 11. The corrected signal at 80°ATDCis about 23 times stronger than the measured 2D-LIF sig-nal. Since the effect of collisional quenching on the signalstrength is not yet known, one must be very careful in draw-ing conclusions about the absolute amount of NO from thisfigure. 4 Summary Nitric oxide LIF distributions inside the cylinder of an optical-ly accessible 4-stroke IDI diesel engine running on standarddiesel fuel are presented. These NO distributions are obtainedby using 2D fluorescence imaging induced by an ArF excimerlaser (a~193 nm). Correction procedures were developedto take into account the effects of window fouling and in-cylinder laser attenuation due to scattering by a uniform fieldof soot particles. The correction procedure for window foul-ing is efficient enough for measurement sessions to last up toca. 45 minutes. These numerical image processing proceduresare an essential step towards the quantitative interpretationof the fluorescence distributions. In contrast to the measuredNO-fluorescence distributions (the"raw data”), the processeddistributions are shown to be hardly dependent on the direc-tion in which the excitation laser traverses the engine. This Fig. 10. From left to right four representations of in-cylinder laser intensitydistributions in the running engine after the correction for soot deposits onthe windows, are shown. The (scattered) distributions were initially imagedin the + direction at: 135°ATDC,120°ATDC,105°ATDC and 80°ATDCin the expansion stroke (1000 rpm, no load). These intensity distributions areactually involved in the correction for the in-cylinder laser attenuation of theNO-fluorescence distributions given in the top row of Fig. 9 Fig.11. The results of the numerical analysis performed on the averagedintensities of the initially measured NO-fluorescence distributions given inFig. 9 before and after correction for soot deposits on the windows as well asfor the in-cylinder laser attenuation is good evidence to justify the interpretation of the correctedimages as relative NO density distributions. The excimer laser itself is found not to induce observablephoto-chemical effects. The LIF signal is shown to dependlinearly on the laser intensity. Also,saturation is expected toplay a minor role in this work. In the range of 80°-180°ATDC,NO is found to be lo-cated in the central part of the cylinder. Its density is found toincrease with increasing load and with decreasing crank an-gle. The latter trend is born out of the processing of the rawdata. At the current state of knowledge, a quantitative inter-pretation of the NO LIF signal is hampered by the lack of dataon the collisional quenching of the D→X fluorescence underthe conditions prevailing in a diesel engine Acknowledgements. This research is supported by the Technology Foundation(STW). The financial support of NOVEM B.V., Utrecht, The Netherlandsand TNO, Delft, The Netherlands is gratefully acknowledged. The experttechnical assistance of E. van Leeuwen, F. van Rijn, R. and E. Merkus ishighly appreciated. Finally, P. Schmidt is acknowledged for his simulation ofthe 226 nm region of the NO spectrum. References 1. B. Dillies, K. Marx, J.E. Dec, C. Espey: SAE Paper 930074 (1993) 2. H.M. Ney, B. Johansson, M. Alden: Unsteady Combustion, NATO ASISeries,(Kluwer Academic Publishers,Dordrecht, Boston, London 1993)pp. 383-389 3. J.E. Dec, C. Espey: SAE Paper 922307 (1992) . 4. C. Espey, J.E. Dec: SAE Paper930971(1993) 5. A. Arnold, F. Dinkelacker, T. Heitzmann, P. Monkhouse, M. Schafer,V. Sick, J. Wolfrum, W. Hentschell, K.P. Schindler: 24th Int’l Symp. onCombustion, Sydney (1992) 6. B. Alatas, J.A. Pinson, T.A. Litzinger, D.A. Santavicca: SAE Paper930973 (1993) 7. Th.M. Brugman, R. Klein-Douwel, G. Huigen, E. van Walwijk, J.J. terMeulen: Appl. Phys. B 57, 405 (1993) 8. J.R. Reisel, C.D. Carter, N.M. Laurendeau: J. Quant. Spectrosc. Radiat.Transfer 47-1, 43(1992) 9. M.J. Frost, M. Islam, I.W.M. Smith: Can. J. Chem. Vol. 72, 606 (1994) 10. W.Demtroder: Laser Spectroscopy.Basic Concepts and Instru-mentation, 2nd enlarged edn. (Springer, Berlin, Heidelberg 1995)p.91 11. A.A.Radzig, B.M. Smirnov: Springer Series in Chem. Phys. Vol. 31,386(1985) The imaging of in-cylinder NO distributions in asteadily running optically accessible diesel engine operatedon standard diesel fuel is performed by means of the 2DLIFtechnique and a tunable ArF excimer laser at 193 nm.Simultaneous excitation at 226 nm showed that no sizablephoto-chemical effects are induced by the excimer laser. Inorder to account for the gradually decreasing transparency ofthe windows due to soot deposits and for the in-cylinder attenuationof the laser intensity, signal processing procedures forthe imaged distributions are presented. In addition to the morerealistic depictions of NO distributions at selected crank anglesand loads resulting from these procedures, the latter arean essential step towards a quantitative interpretation of thecorresponding in-cylinder NO concentrations.
确定
还剩6页未读,是否继续阅读?

产品配置单


北京欧兰科技发展有限公司为您提供《柴油发动机中NO自由基的激光诱导荧光检测方案(CCD相机)》,该方案主要用于汽车电子电器中其他检测,参考标准--,《柴油发动机中NO自由基的激光诱导荧光检测方案(CCD相机)》用到的仪器有德国LaVision PIV/PLIF粒子成像测速场仪、PLIF平面激光诱导荧光火焰燃烧检测系统、激光诱导白炽光烟雾粒子成像分析仪(LII)、汽车发动机多参量测试系统
推荐专场


烟气监测(CEMS)/烟气分析仪
更多


相关方案
更多
该厂商其他方案
更多