


方案详情
文
采用LaVision公司的增强型CCD相机对燃烧过程中的重要中间产物甲醛的浓度分布进行了定量测量。采用了LaVision公司独特的激光诱导荧光燃烧火焰分析测试系统Flame-Master
方案详情

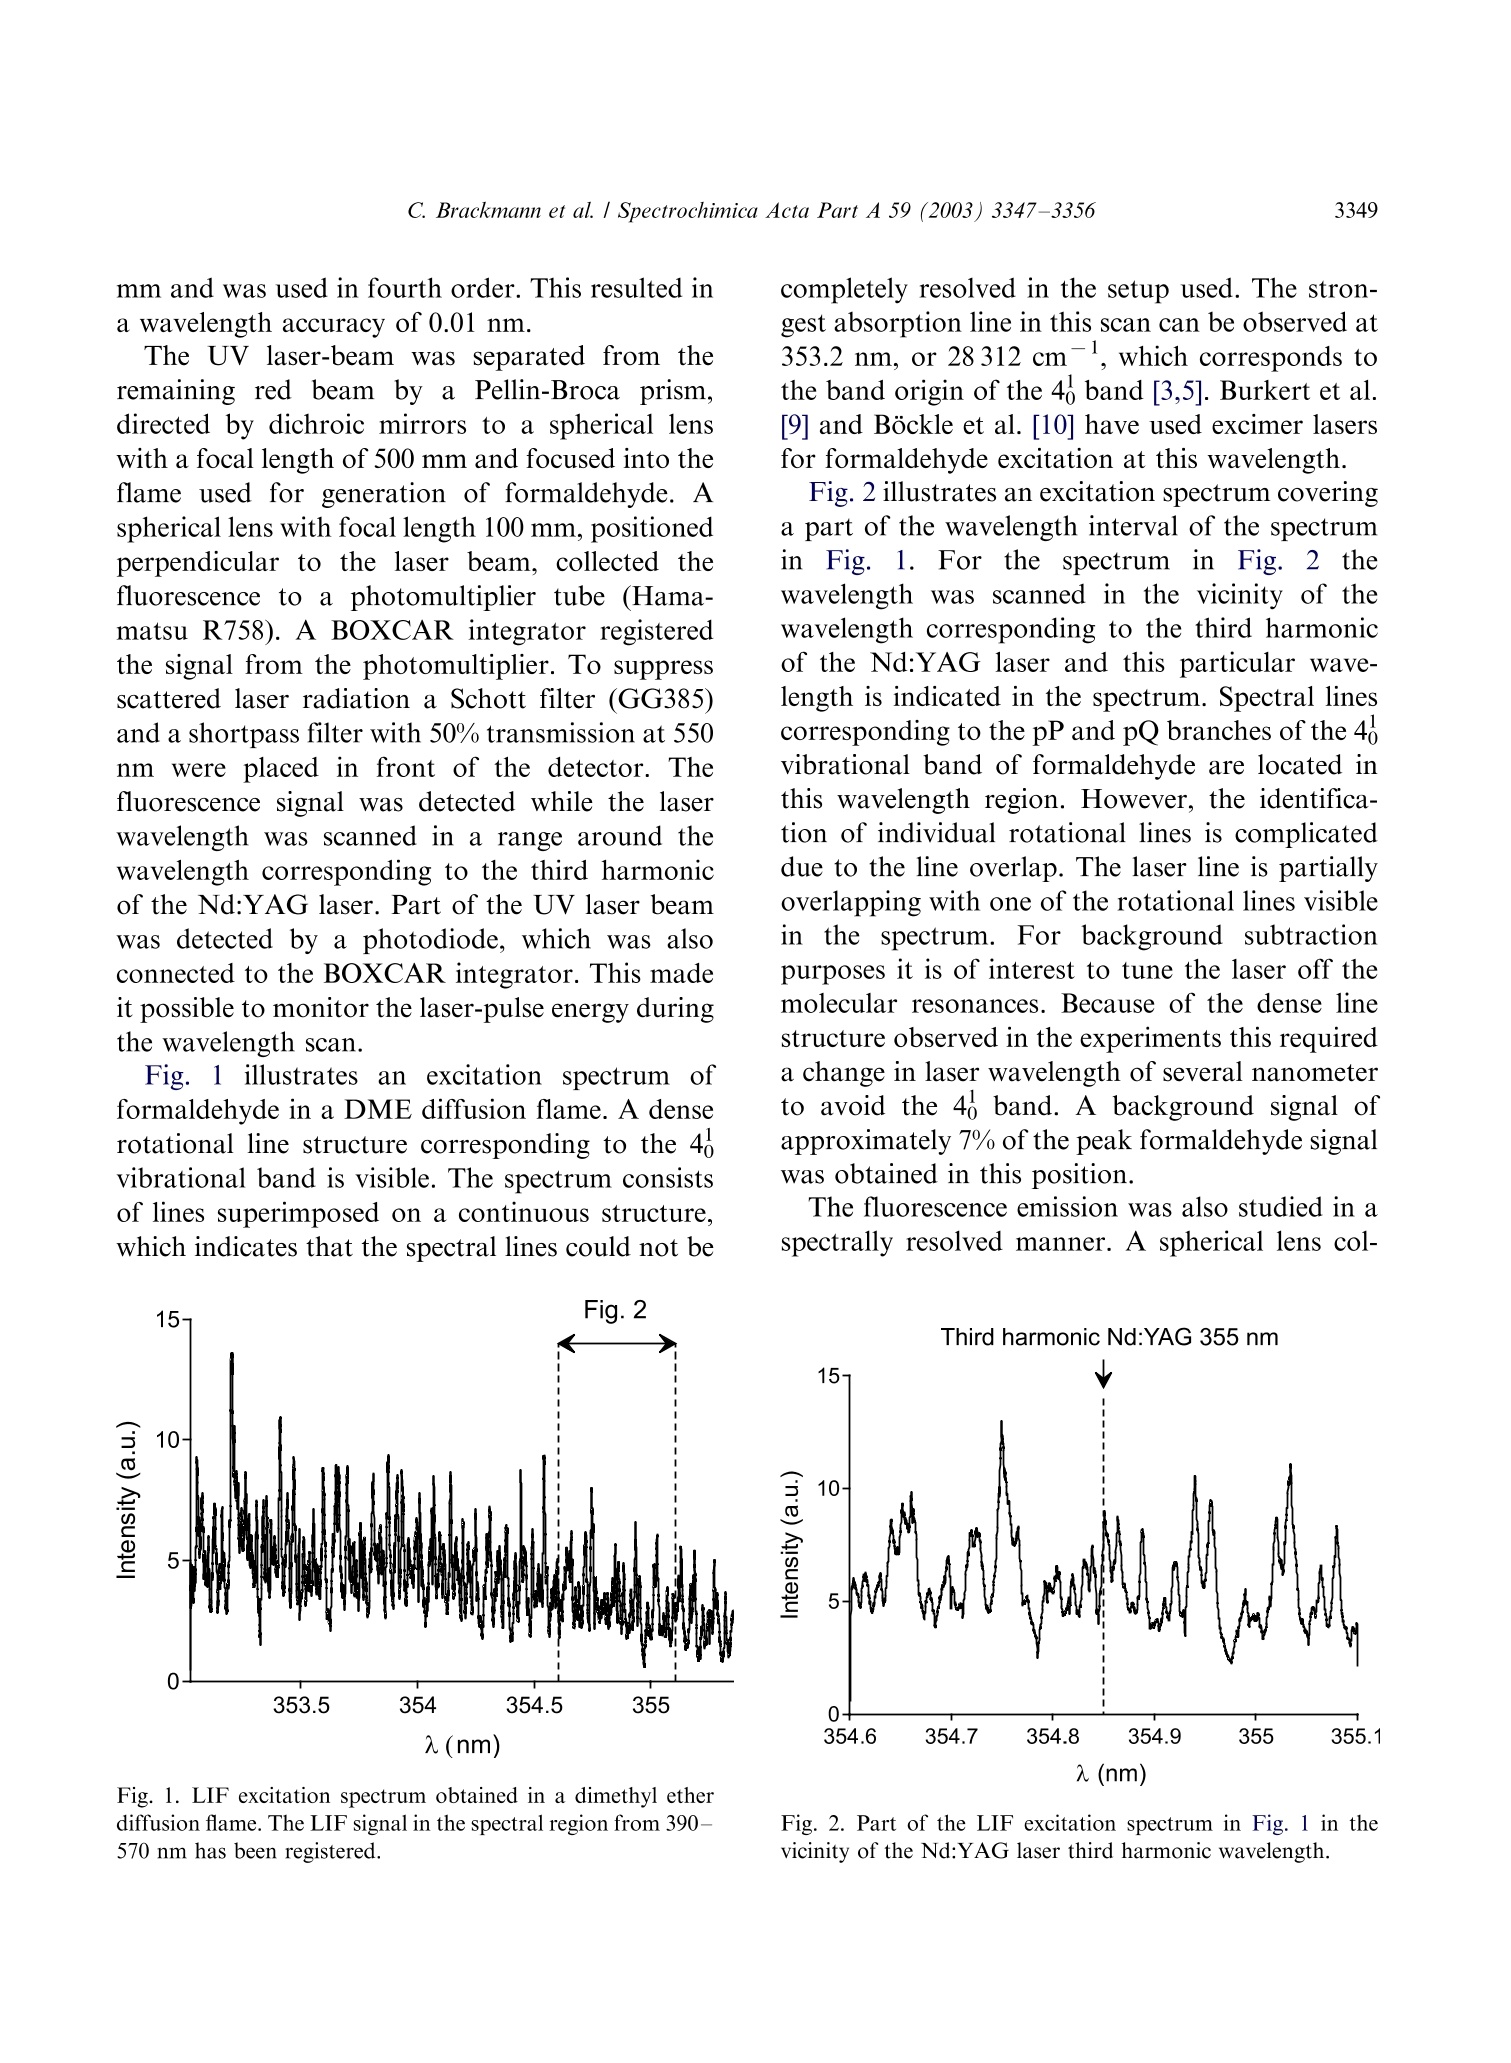
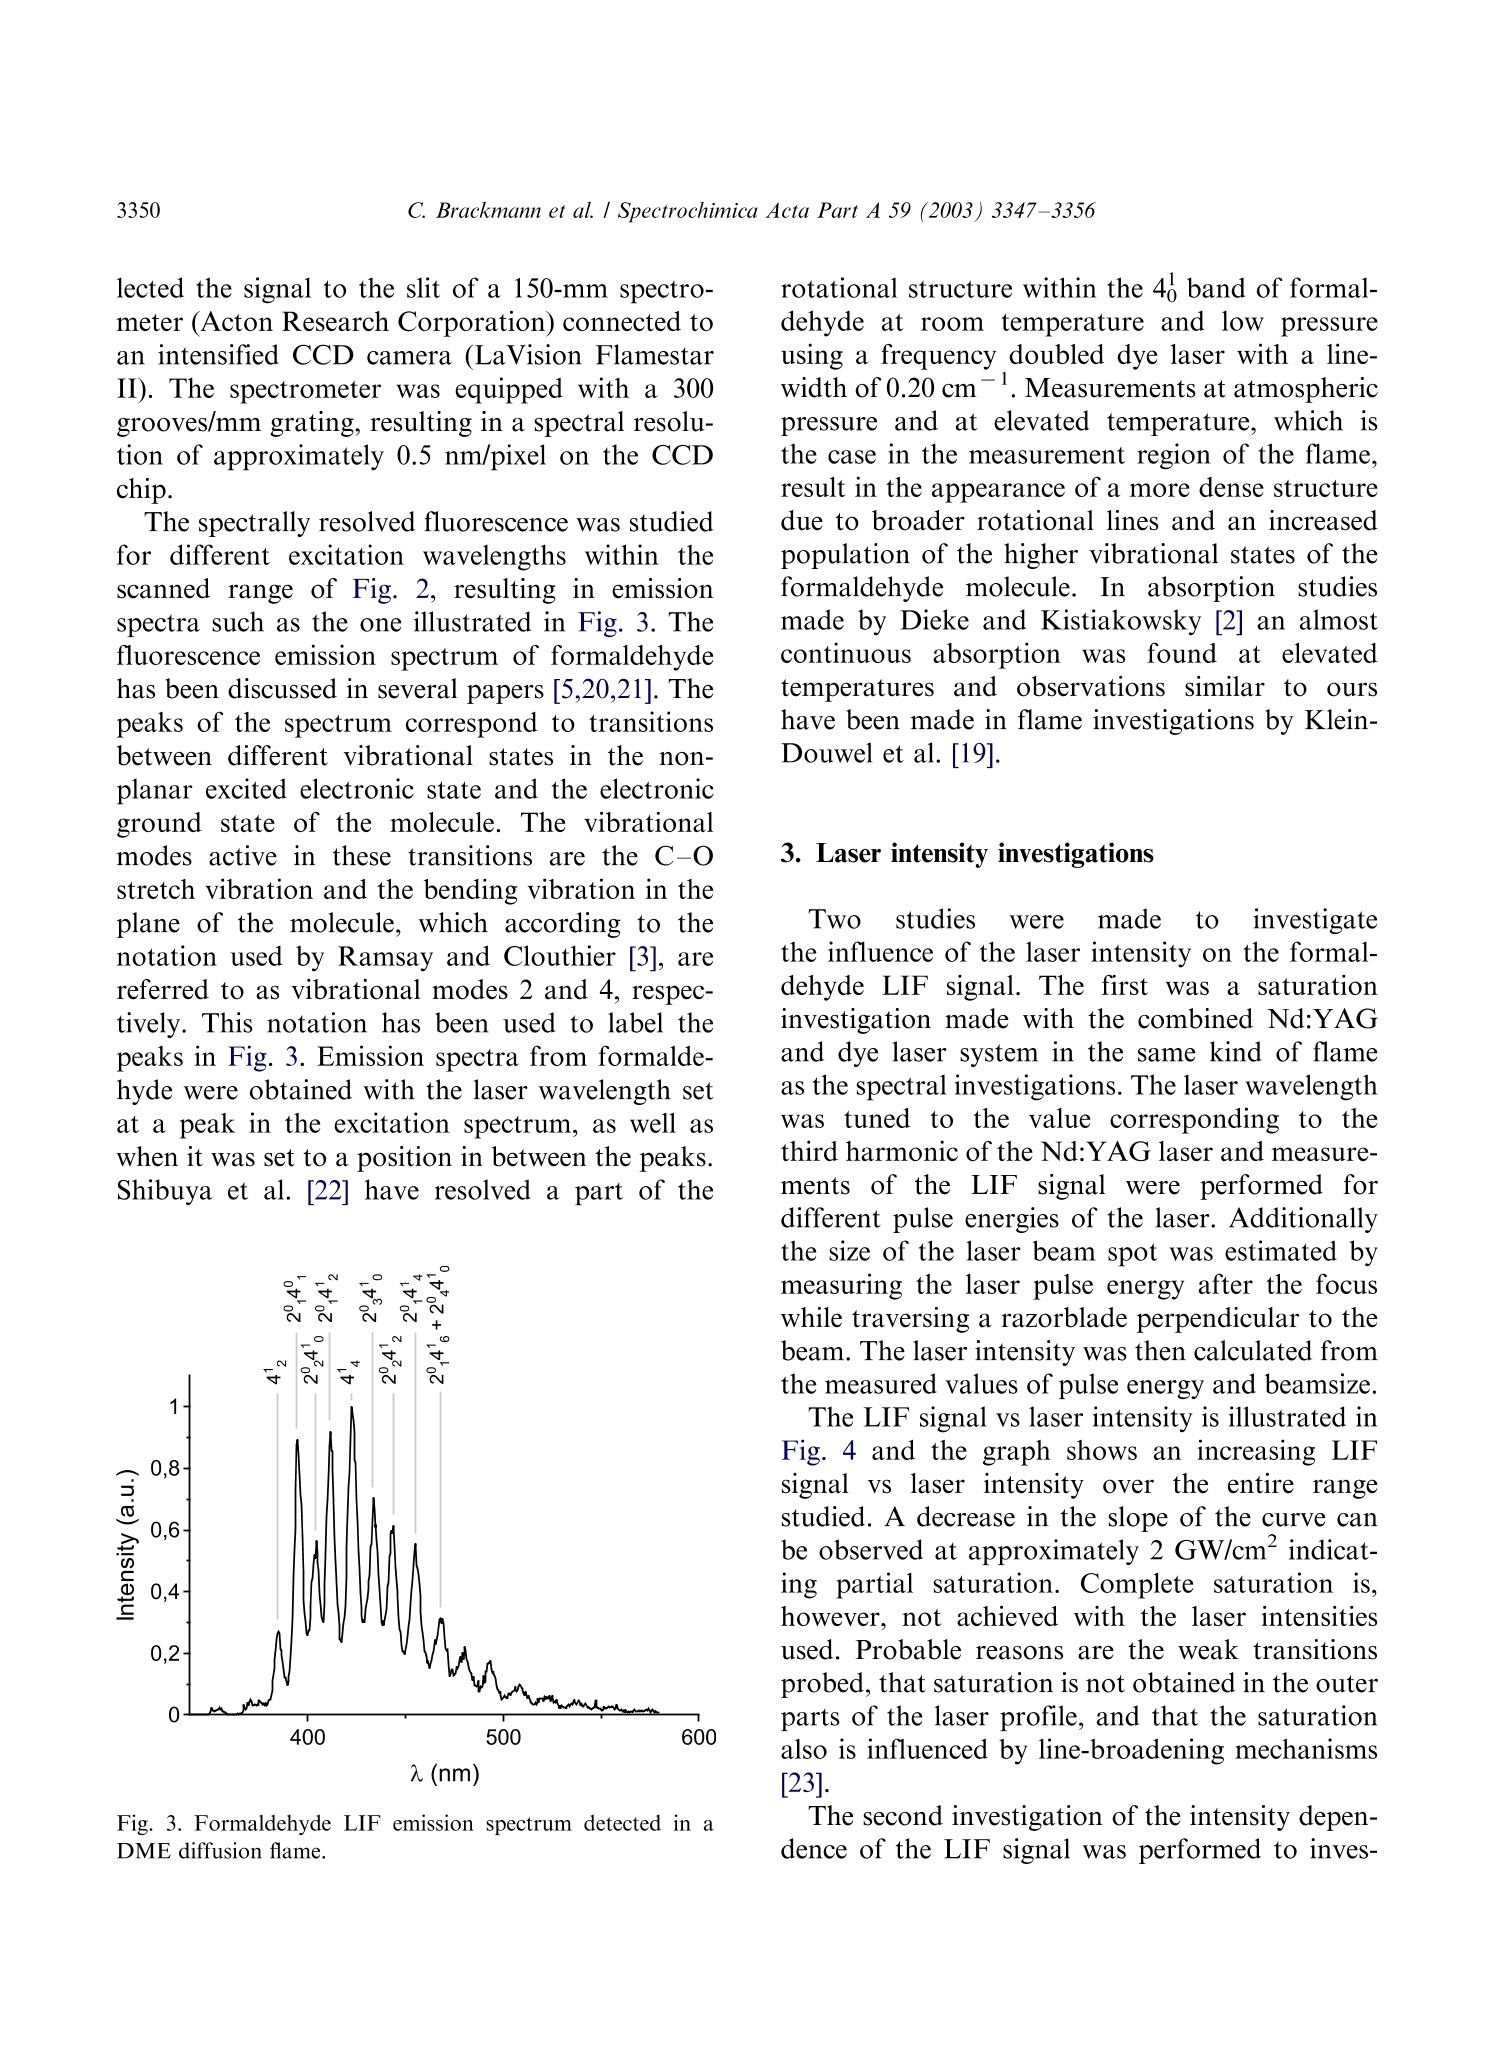
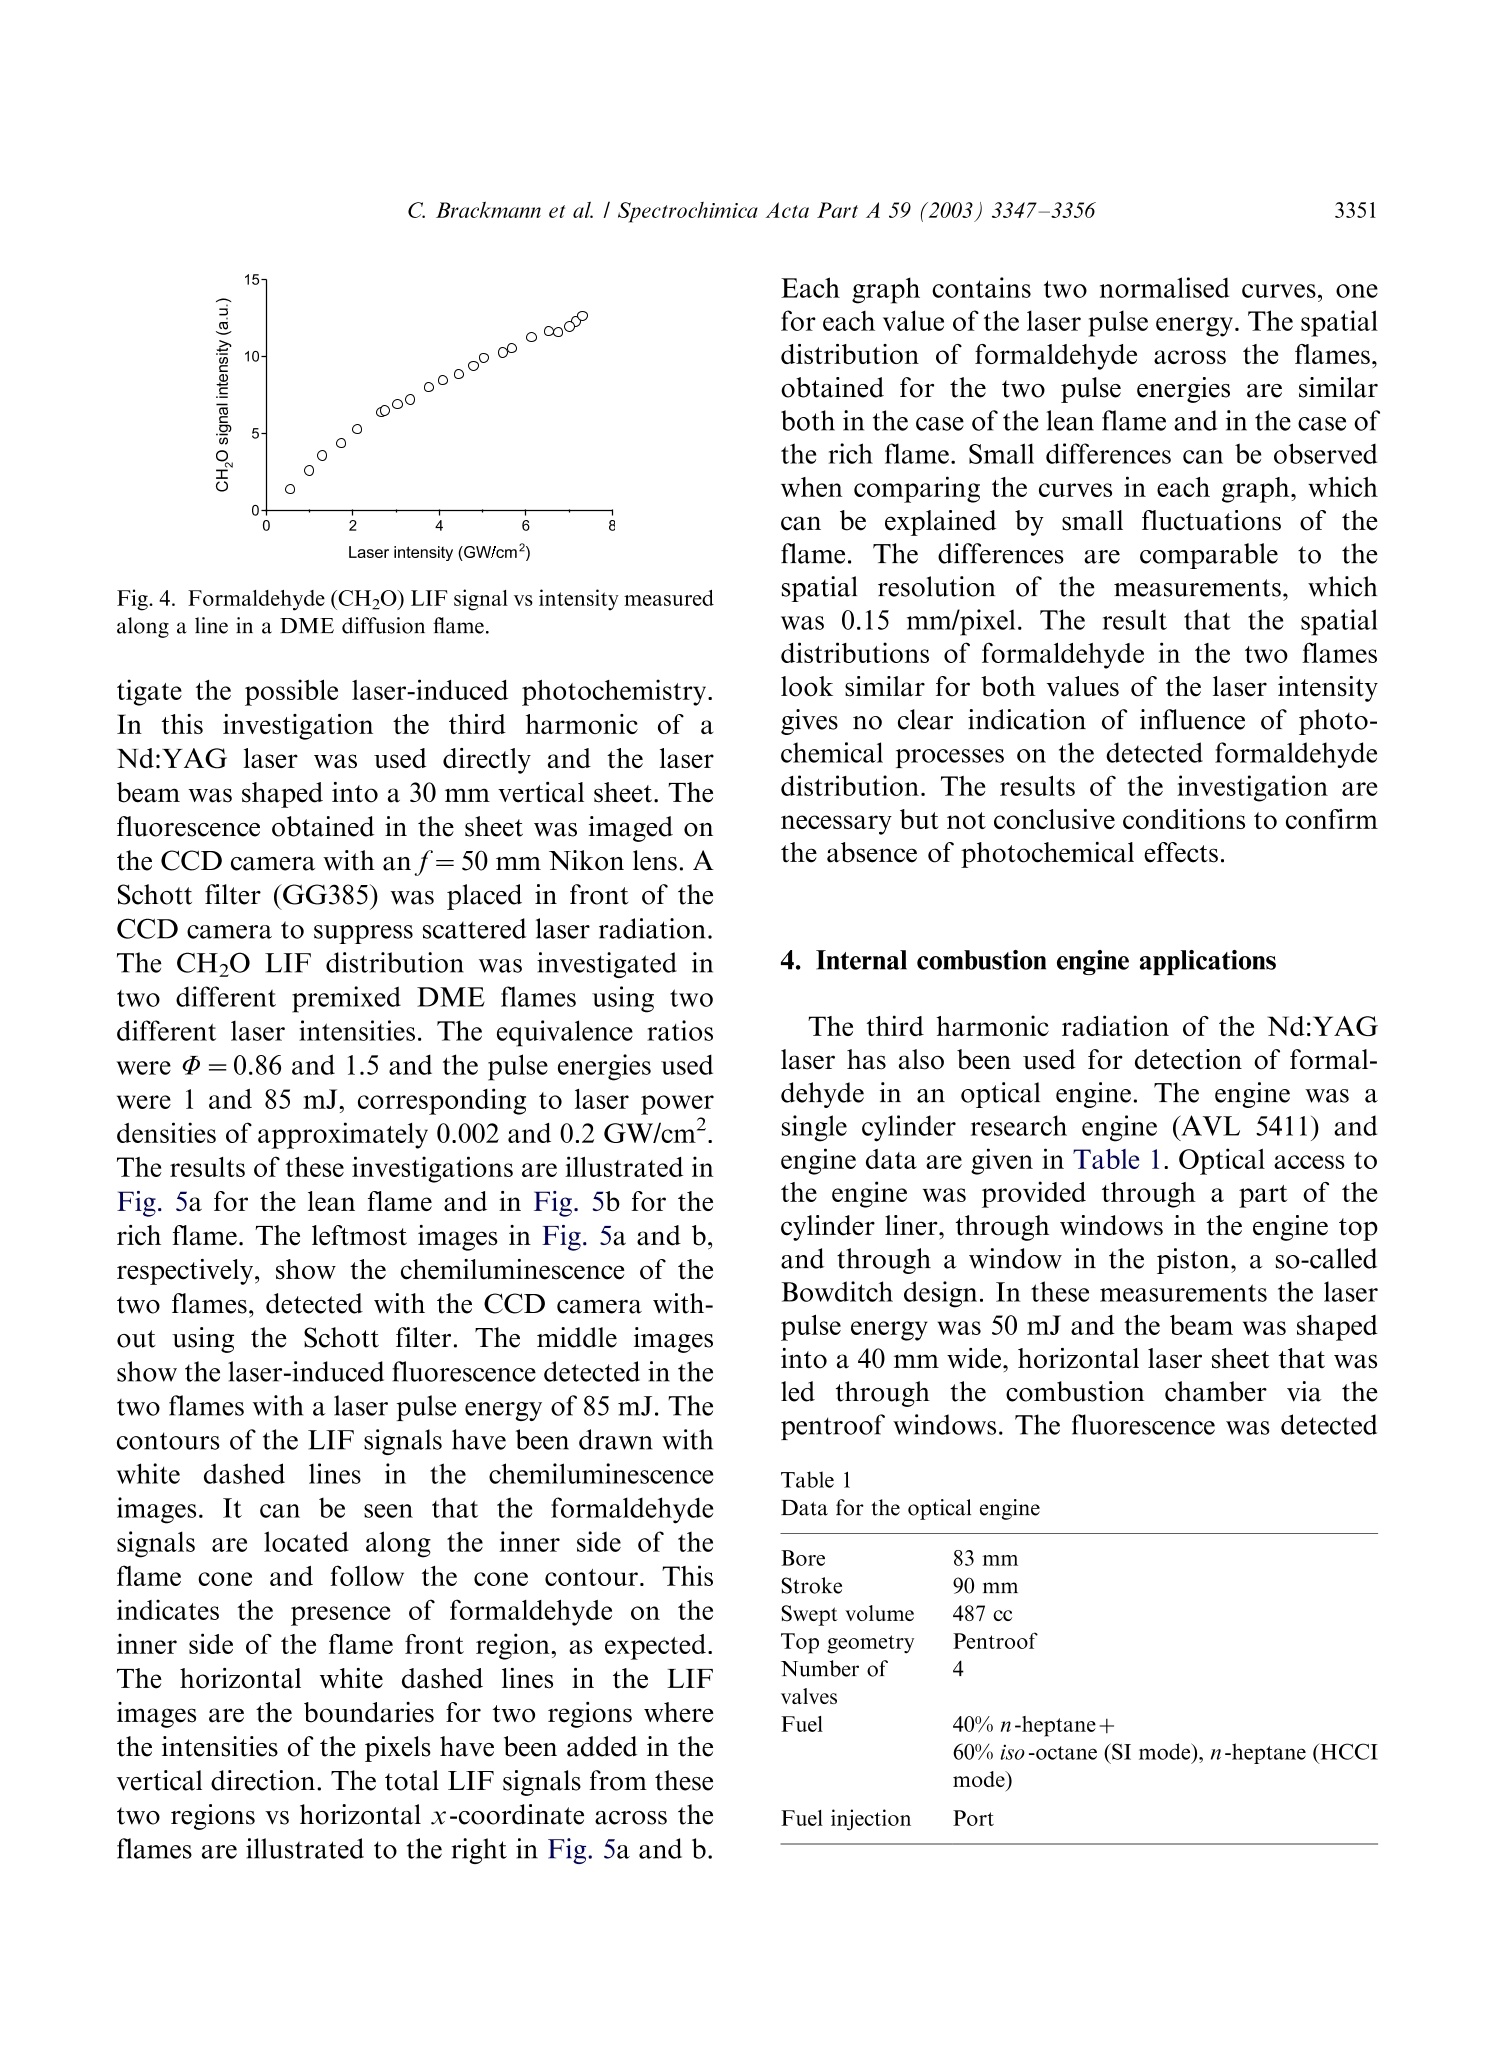
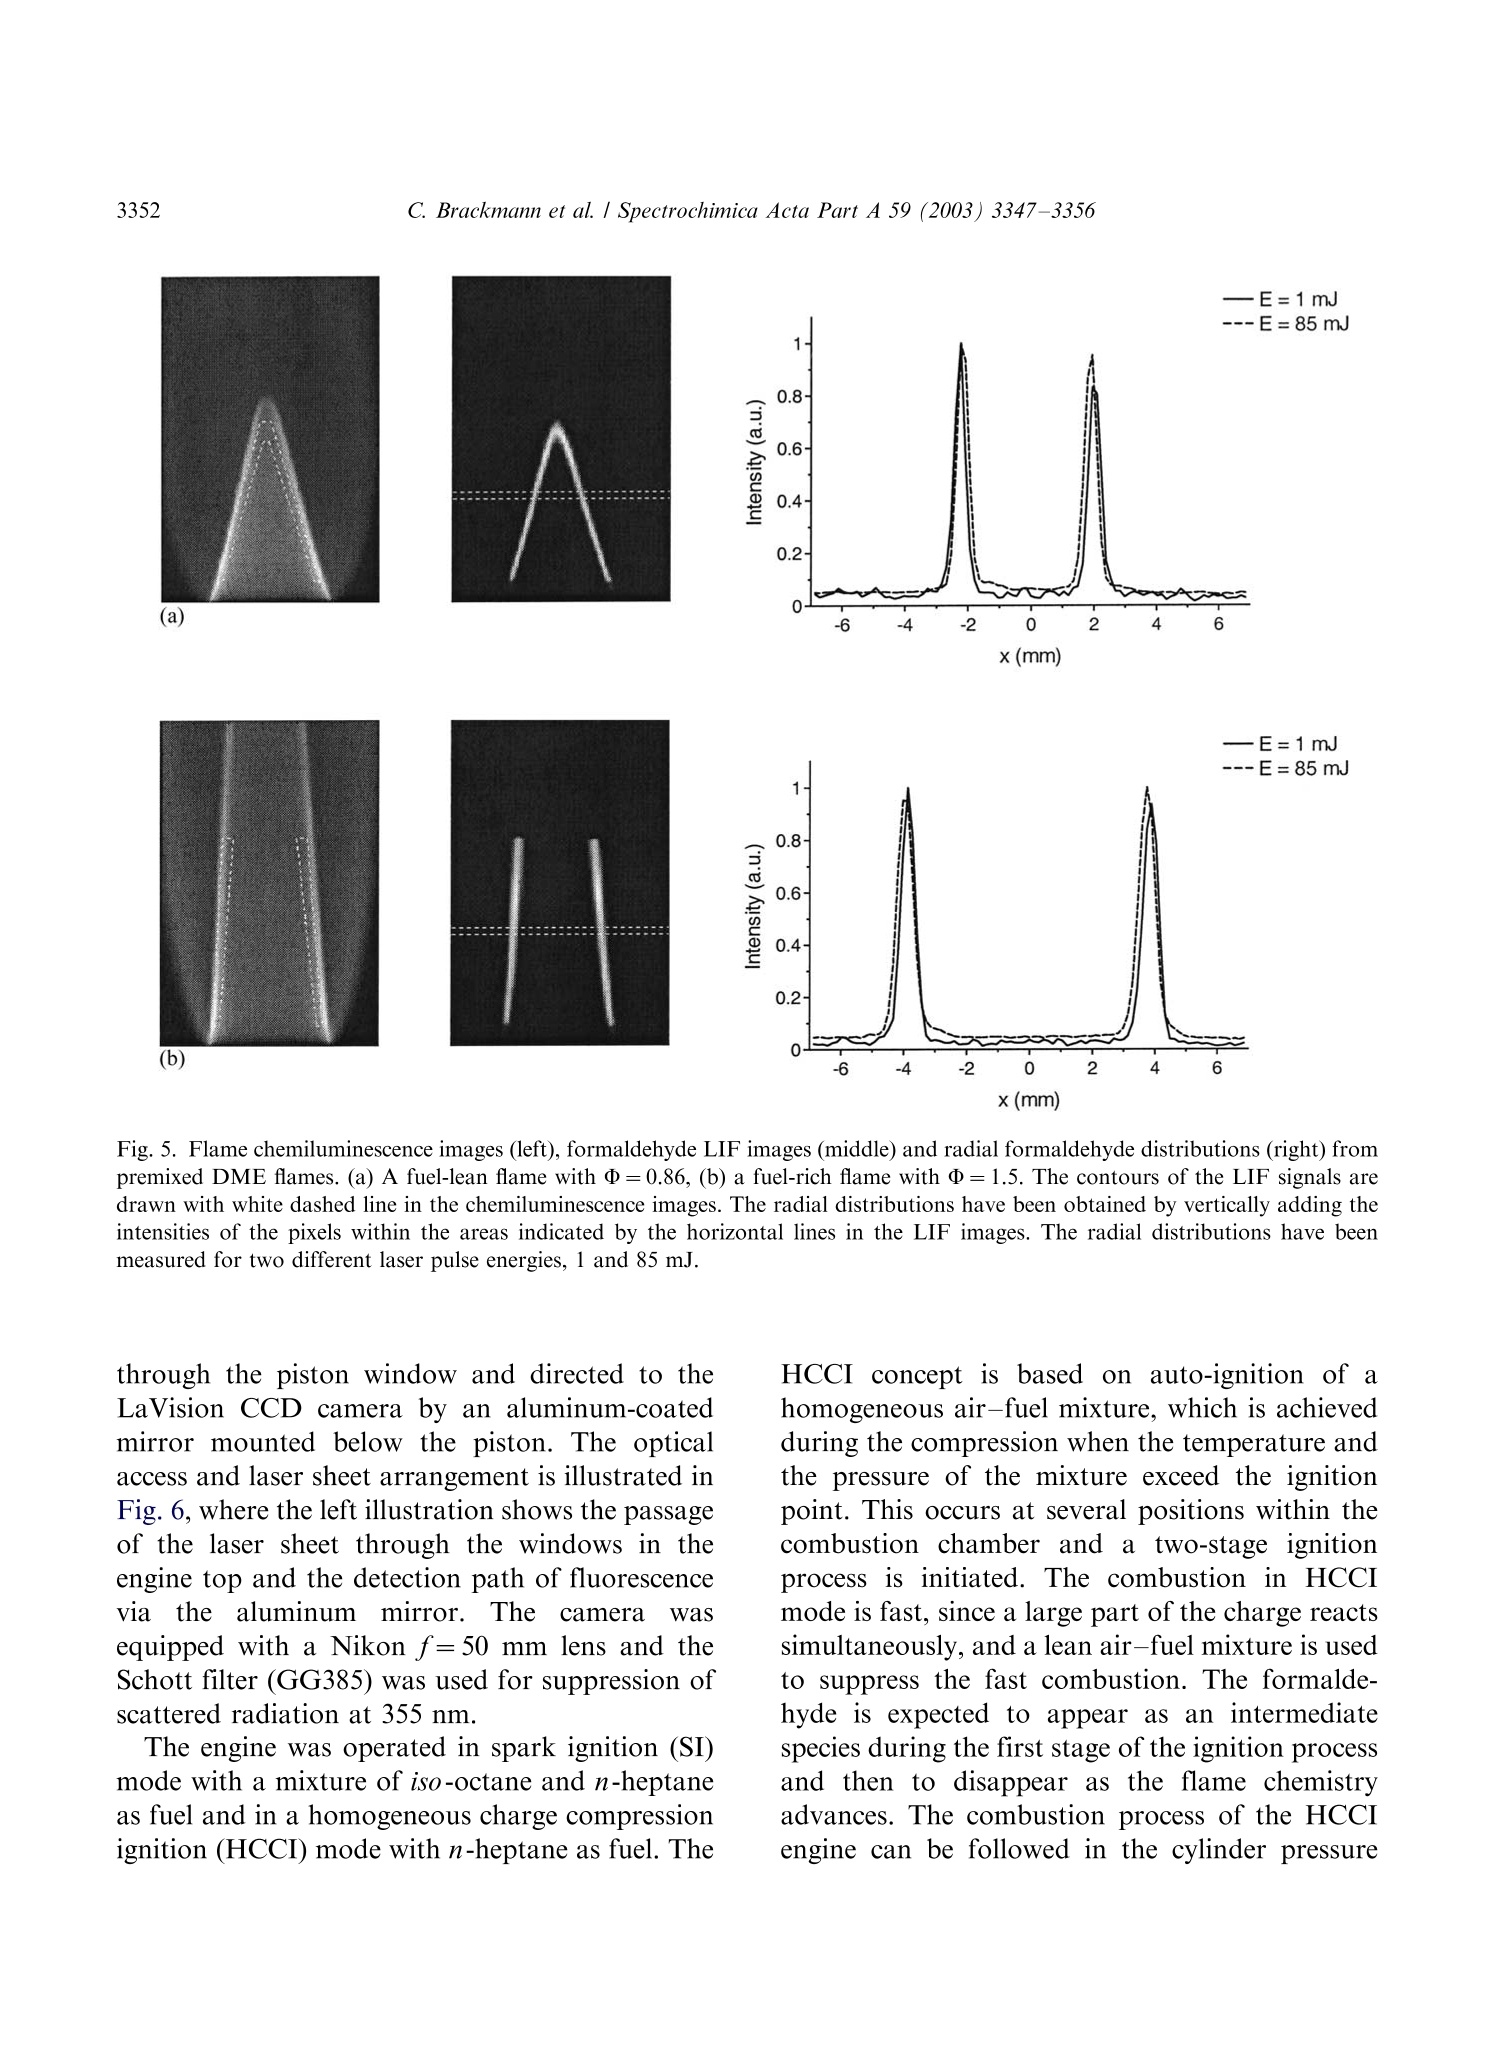
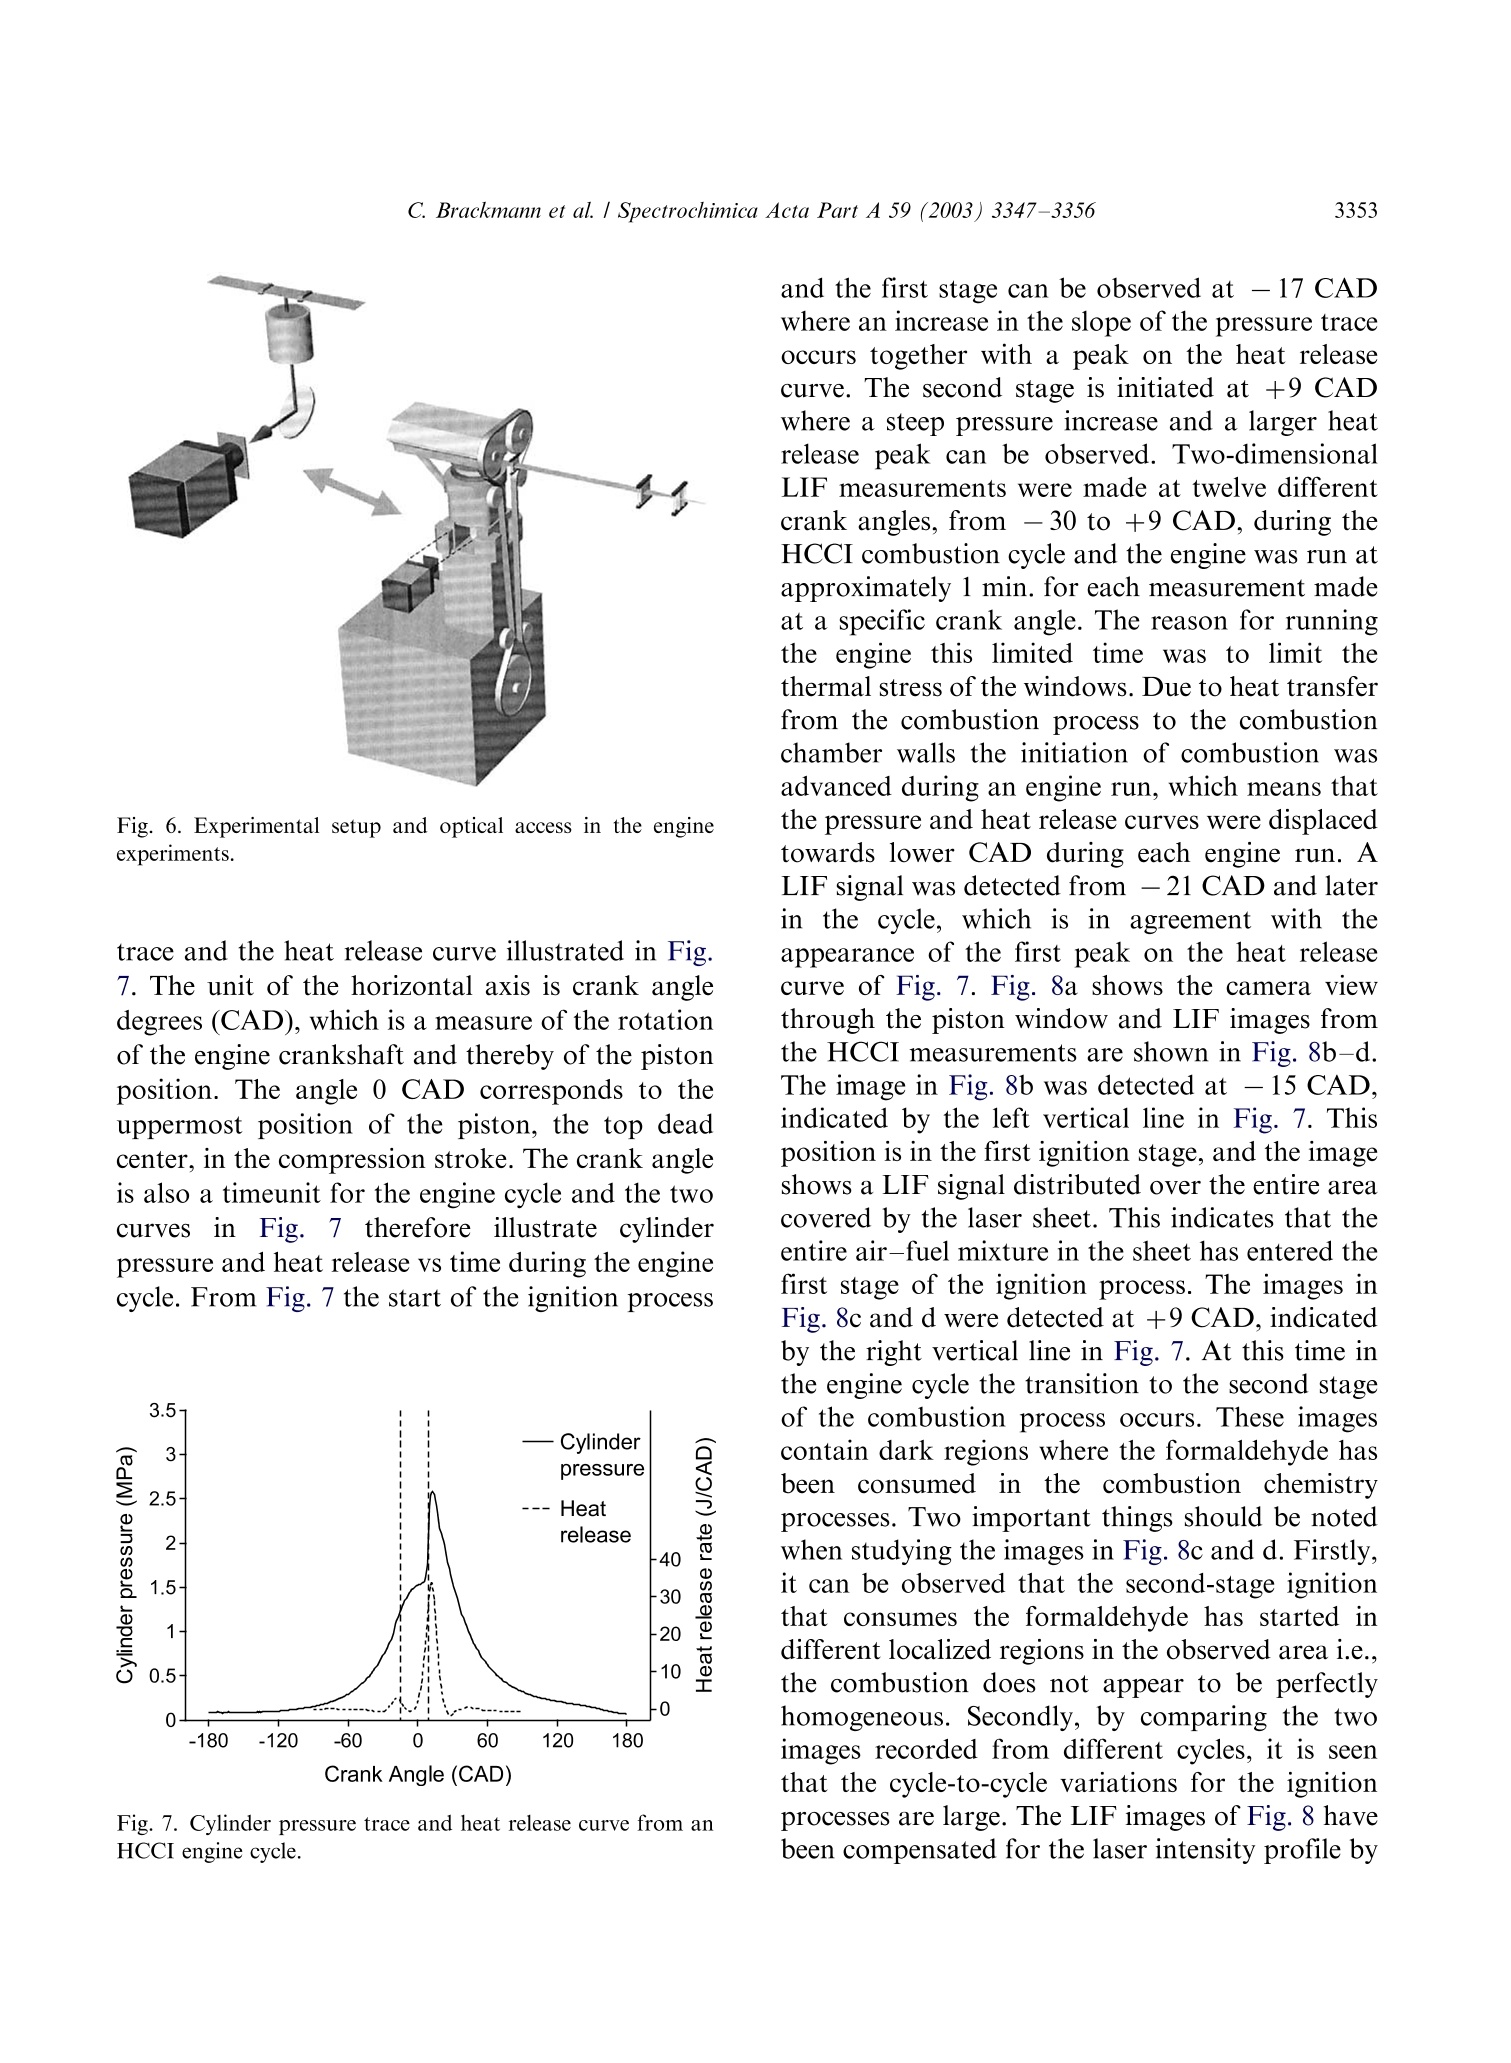
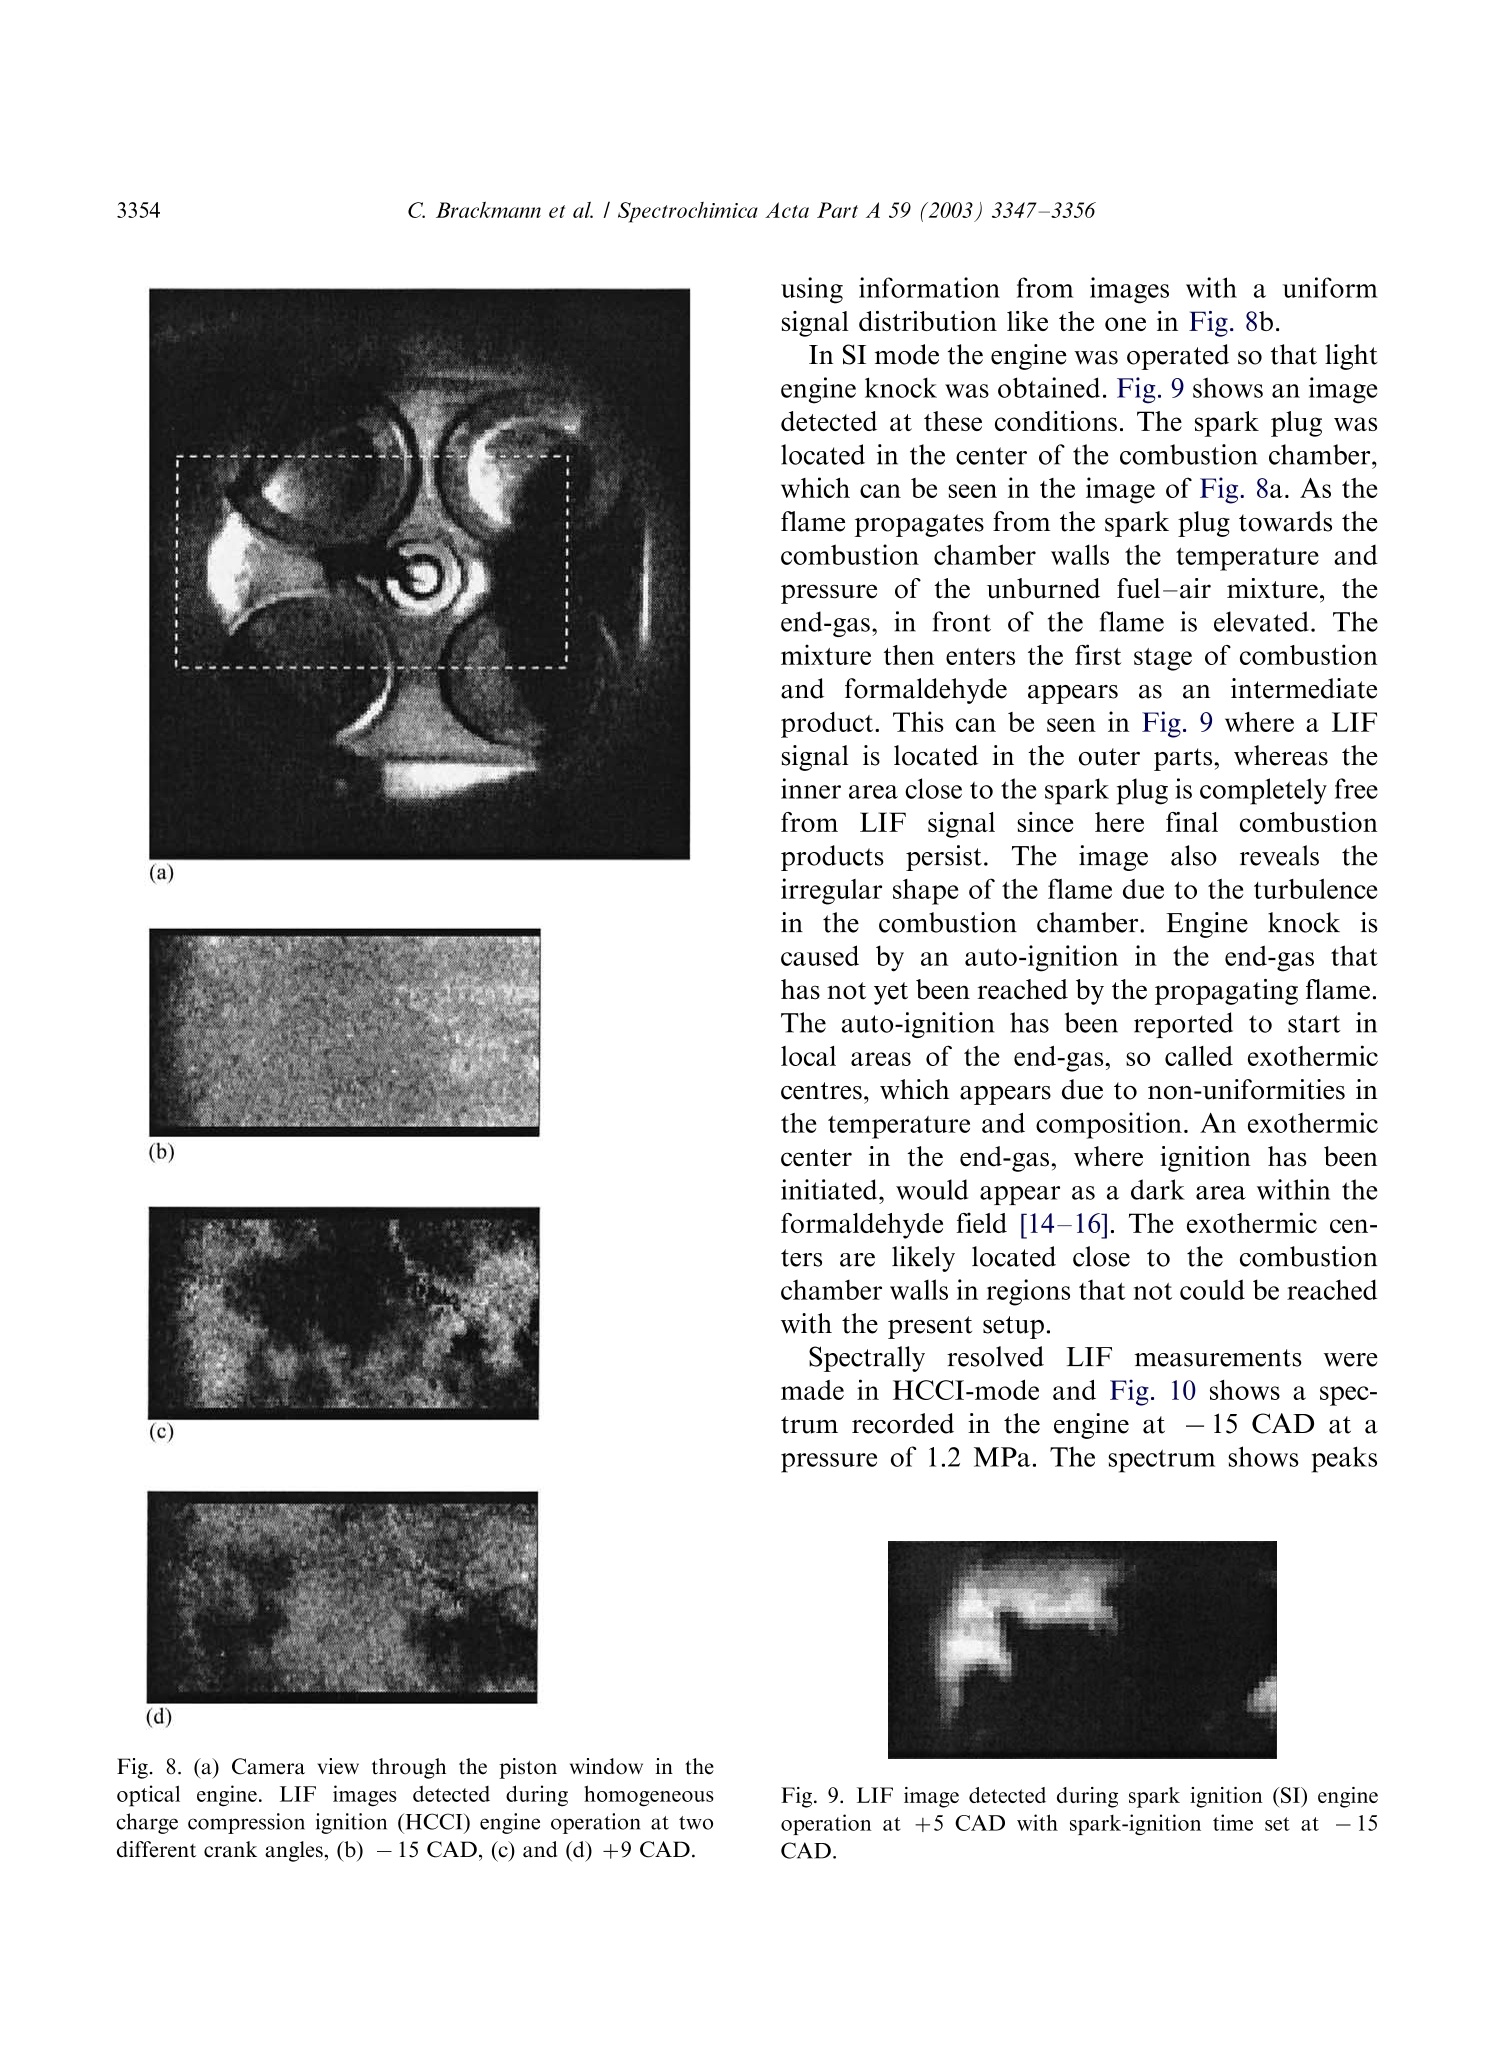
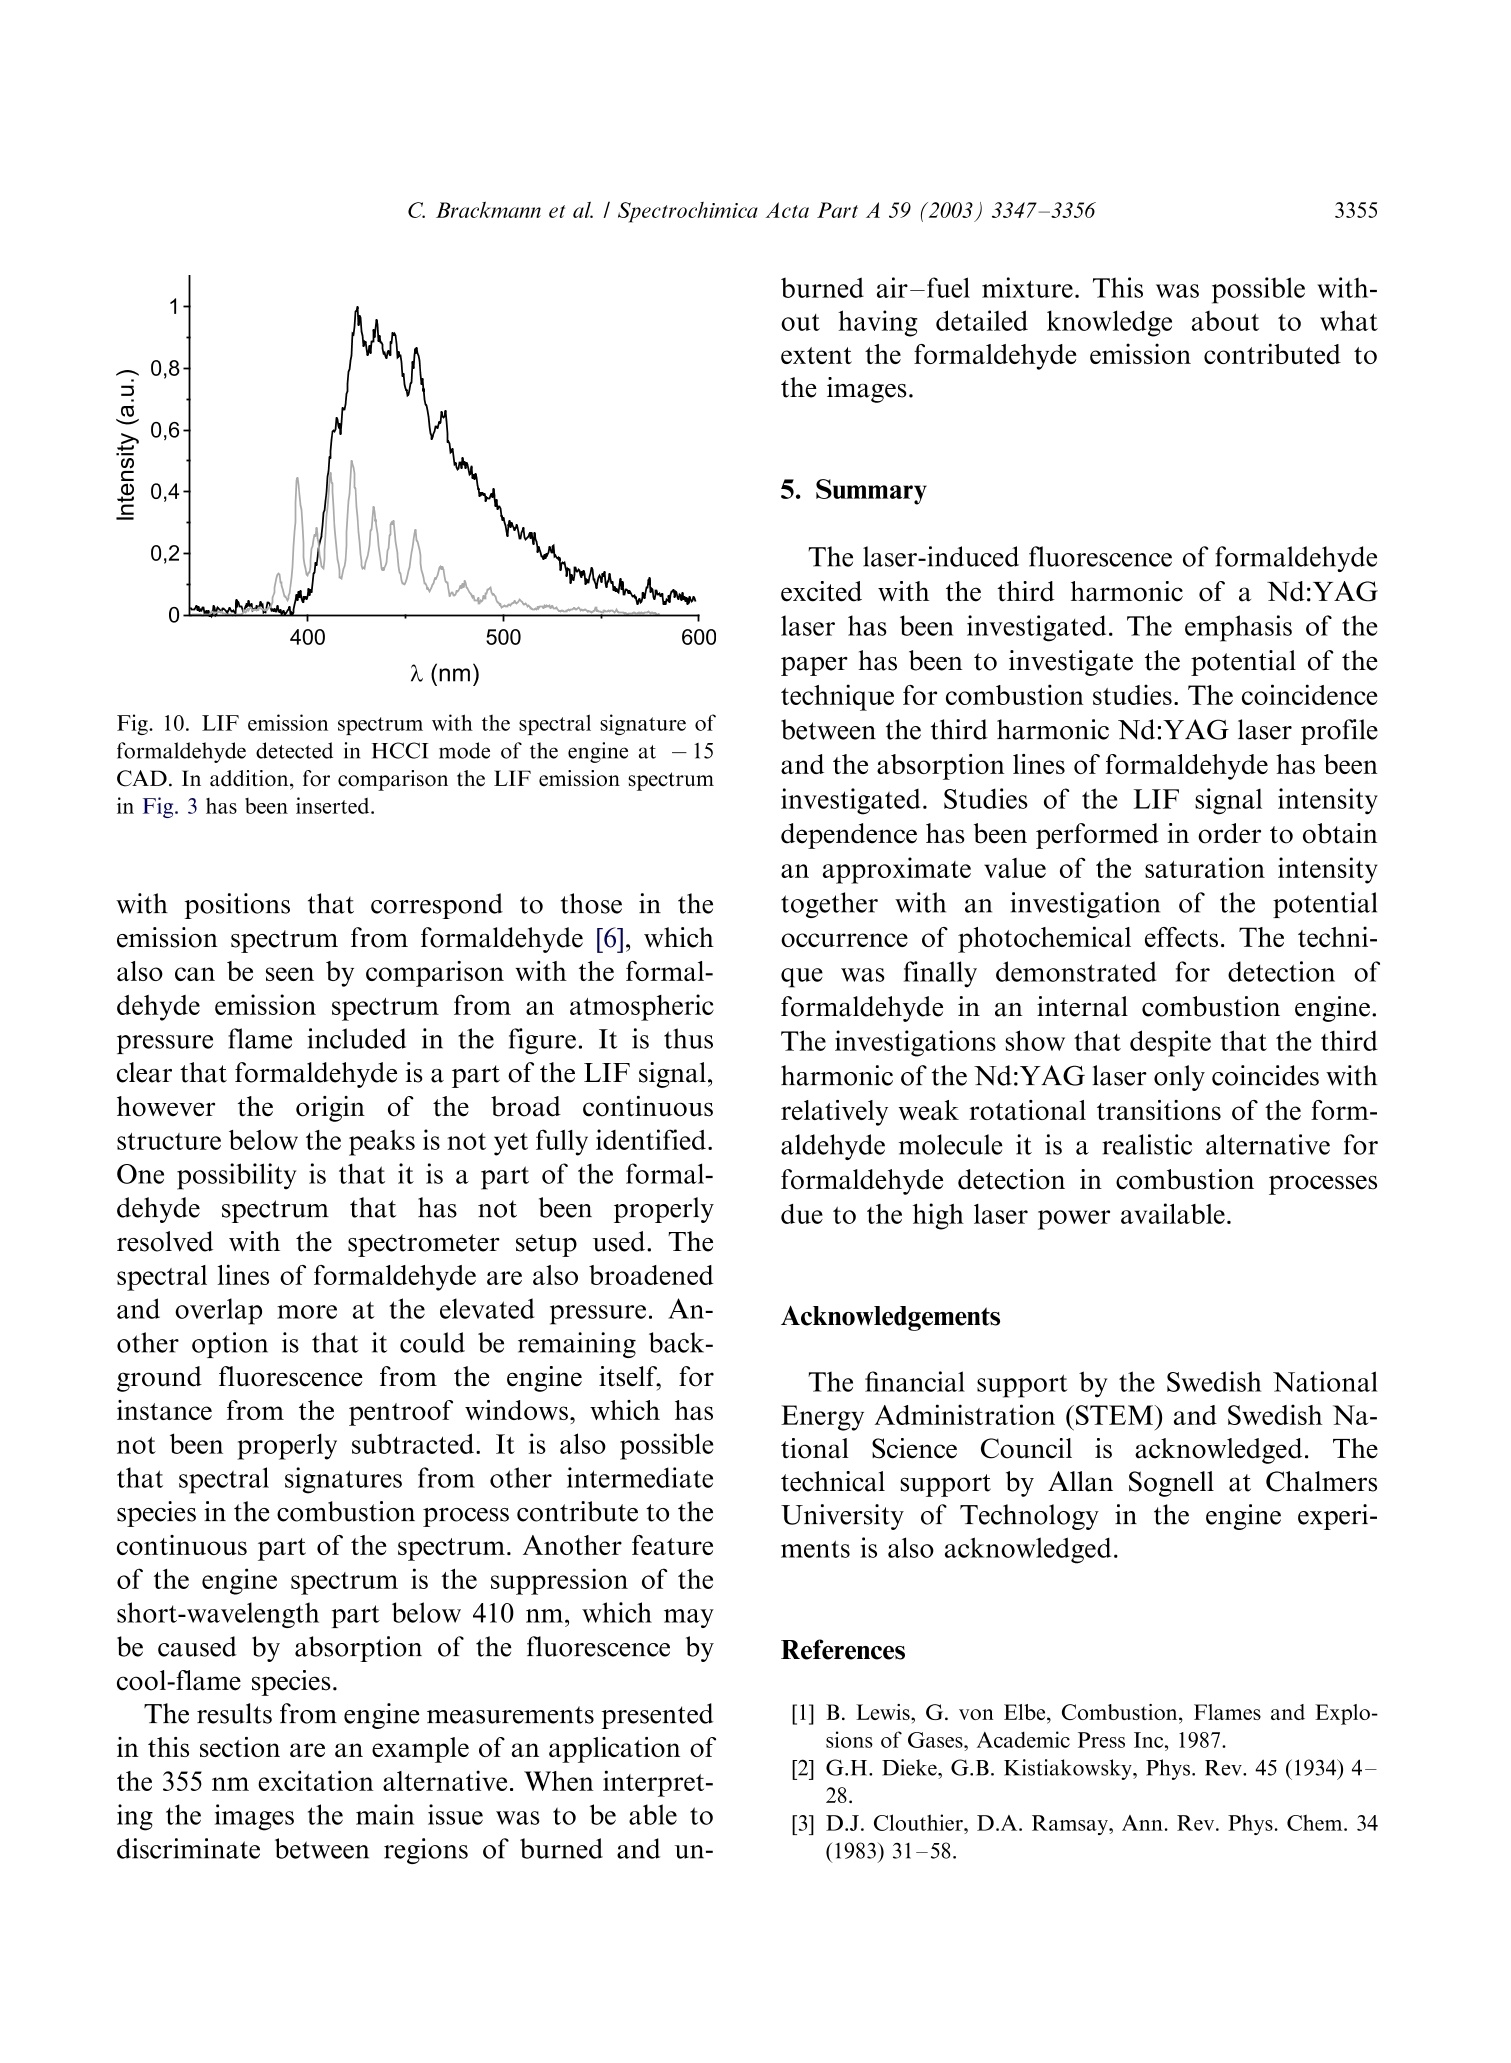
Available online at www.sciencedirect.comSPECTROCHIMICAACTAPART ASpectrochimica Acta Part A 59 (2003)3347-3356 C. Brackmann et al./ Spectrochimica Acta Part A 59 (2003) 3347-33563348 www.elsevier.com/locate/saa Laser-induced fluorescence of formaldehyde in combustionusing third harmonic Nd:YAG laser excitation Christian Brackmann a*, Jenny Nygren, Xiao Bai, Zhongshan Li,Henrik Bladh, Boman Axelsson, Ingemar Denbratt , Lucien Koopmans ,Per-Erik Bengtsson, Marcus Alden Division of Combustion Physics, Lund Institute of Technology, P.O. Box 118, SE-221 00 Lund, Sweden Department of Thermo and Fluid dynamics, Chalmers University of Technology, SE-412 96 Gothenburg, Sweden Received 9 August 2002; received in revised form 27 March 2003; accepted 27 March 2003 Abstract Formaldehyde (CH20) is an important intermediate species in combustion processes and it can through laser-induced fluorescence measurements be used for instantaneous flame front detection. The present study has focussed onthe use of the third harmonic of a Nd:YAG laser at 355 nm as excitation wavelength for formaldehyde, and differentdimethyl ether (C2H,O) flames were used as sources of formaldehyde in the experiments. The investigations includedstudies of the overlap between the laser profile and the absorption lines of formaldehyde, saturation effects and thepotential occurrence of laser-induced photochemistry. The technique was applied for detection of formaldehyde in aninternal combustion engine operated both as a spark ignition engine and as a homogenous charge compression ignitionengine. C 2003 Elsevier B.V. All rights reserved. 1. Introduction Formaldehyde (CH20) is formed as an inter-mediate species in the combustion of hydrocar-bons[1]. It is produced in the low temperatureoxidation processes of hydrocarbon fuels and thenconsumedin the continuing flame chemistry ( * Corresponding author. Tel.: +46-46-222-3150; fax: +46- 46-222-4542. ) processes. Formaldehyde is also associated withthecoolflame’phenomenon, which appears whenmany hydrocarbon fuel-air mixtures approach theexplosion limit. Excited formaldehyde is the originof the blue chemiluminescence that can be ob-served from a cool flame. Hence formaldehyde isan indicator of cool-flame regions and the firststage ofcombustion processes, and the detectionof this molecule is a method to study the initiationand progression of combustion. A theoretical description of the spectroscopy offormaldehyde is rather complex due to the six ( 1386-1425/03/$-se e front matter C 2 003 Else v ier B.V. All r igh t s reserved. ) ( doi:10.1016/S1386-1425(03)00163-X ) different possible vibrational modes, the denserotational line structure and geometrical changesof the molecule in excited electronic states. Never-theless the spectroscopy has been studied for manyyears and extensive data on the absorption bandsof the molecule has been presented [2-5]. Theabsorption spectrum consists of vibronic bandscovering a wavelength range from 270 to 360 nmand is dominated by two progressions of bandsstarting with the 4o and 4 bands, respectively.Both progressions correspond to an increase in thevibrational quantum number related to the C-Ostretch vibration. The dense absorption spectrumgets further complicated as the temperature iselevated and higher vibrational states are popu-lated. The temperature dependence of the formal-dehyde absorption spectrum therefore becomescomplicated. The detection of formaldehyde by use of laser-induced fluorescence has been presented in severalpapers, including studies of formaldehyde in a cell[6], in different flames [7-13] and in combustionengine applications [14-18]. The formaldehydemolecule has several absorption bands suitablefor laser excitation in the wavelength regime from270 to 360 nm [4]. Formaldehyde excitation hasbeen performed using the bands at 339 nm [12,16]and 353 nm [8-11,14,15]. An excitation schemeusing so-called hot bands at 370 nm has also beenpresented [19]. The third harmonic of a conventional Nd:YAGlaser can also be used for excitation of formalde-hyde. This fact has been confirmed in severalpapers [6-8,13,17] as well as in our own experi-ments. The main drawback of this alternative isthat the laser line is overlapping with relativelyweak rotational transitions of the molecule [8].The mainadvantage, however, being thattiastandard Nd:YAG laser system can be used withhigh pulse energy available at355nm.Thesimplification of the experimental setup with thisalternative is valuable when performing measure-ments in applied combustion devices. An investi-gation of the benefits and the drawbacks of thisalternative are presented in this paper. The degreeof overlap between the laser line and the absorp-tion lines of the molecule has been studied byperforming excitation scan measurements in the spectral region around 355 nm. In addition, thespectrally resolved fluorescence emission was in-vestigated. The use of the high laser poweravailable at 355 nm has been studied both in thecontext of saturation effects as well as the potentialoccurrence of photochemical effects, of which thelatter is especially important to consider. Photo-chemical processes may interfere with the formal-dehyde productionor result innsspeciesthatinterfere with the formaldehyde fluorescence spec-trally. This paper finally presents an application ofthe 355 nm excitation scheme for the detection offormaldehyde in an internal combustion engineoperated both as a spark ignition (SI) engine andas5ca homogenous charge compression ignition(HCCI) engine. 2. Spectral investigations Laminar dimethyl ether, DME (C2H,O) flamesburning on a conical water-cooled burner of steelserved as convenient sources of formaldehyde inthe experiments. These flames were used both inthe measurements presented in this section and inthe laser intensity investigations presented in thenext section. Both premixed flames and a diffusionflame were used in the investigations. A4 combinedlasersystemnconsistinge of aNd:YAG laser (Continuum NY82-S) and a dyelaser (Continuum ND60) was used in these experi-ments. The dye laser was pumped by radiation at532 nm from the Nd:YAG laser and operated withExciton LDS 698 dye solved in methanol. Thisgenerated a red laser beam tuneable around 710nm from the dye laser. The beam was frequencydoubled by a KDP crystal, resulting in a laserbeam that was tuneable in the spectral regionaround 355 nm. The energy was about 2 mJ perpulse and the pulse length about 12 ns. The laserlinewidth of the dye laser was specified to 0.1cm-according to the manufacturer. The wavelength of the laser was measured by awavemeter based on a 1 m Czerny-Turner spectro-meter. This instrument was used to calibrate thewavelength of the frequency-doubled dye laser tothe third harmonic of the Nd:YAG laser. Thegrating used in the spectrometer had 500 grooves/ mm and was used in fourth order.This resulted ina wavelength accuracy of 0.01 nm. The UV laser-beam was :separated from theremaining red beam by aPellin-Broca prism,directed by dichroic mirrors to a spherical lenswith a focal length of 500 mm and focused into theflame used for generation of formaldehyde. Aspherical lens with focal length 100 mm, positionedperpendicular to the laser beam, collected thefluorescence to a photomultiplier tube (Hama-matsu R758).A BOXCAR integrator registeredthe signal from the photomultiplier. To suppressscattered laser radiation a Schott filter (GG385)and a shortpass filter with 50% transmission at 550nm were placed in front of the detector. Thefluorescence signal was detected while the laserwavelength was scanned in a range around thewavelength corresponding to the third harmonicof the Nd:YAG laser. Part of the UV laser beamwas detected by a photodiode, which was alsoconnected to the BOXCAR integrator. This madeit possible to monitor the laser-pulse energy duringthe wavelength scan. Fig. 1illustratesan excitation spectrum offormaldehyde in a DME diffusion flame. A denserotational line structure corresponding to the 4vibrational band is visible. The spectrum consistsof lines superimposed on a continuous structure,which indicates that the spectral lines could not be completely resolved in the setup used. The stron-gest absorption line in this scan can be observed at353.2 nm, or 28 312 cm-, which corresponds tothe band origin of the 4 band [3,5]. Burkert et al.[9] and Bockle et al. [10] have used excimer lasersfor formaldehyde excitation at this wavelength. Fig. 2 illustrates an excitation spectrum coveringa part of the wavelength interval of the spectrumin Fig. 1. For thtehe sspectrum in Fig. 2 thewavelength was scanned in the vicinity of thewavelength corresponding to the third harmonicof the Nd:YAG laser and this particular wave-length is indicated in the spectrum. Spectral linescorresponding to the pP and pQ branches of the 4ovibrational band of formaldehyde are located inthis wavelength region. However, the identifica-tion of individual rotational lines is complicateddue to the line overlap. The laser line is partiallyoverlappi0Veng with one of the rotational lines visiblein the spectrum. For background subtractionpurposes it is of interest to tune the laser off themolecular resonances. Because of the dense linestructure observed in the experiments this requireda change in laser wavelength of several nanometerto avoid the 4 band. A background signal ofapproximately 7% of the peak formaldehyde signalwas obtained in this position. The fluorescence emission was also studied in aspectrally resolved manner. A spherical lens col- (nm) Fig. 1. LIF excitation spectrum obtained in a dimethyl etherdiffusion flame. The LIF signal in the spectral region from 390-570 nm has been registered. Fig. 2. Part of the LIF excitation spectrum in Fig. 1 in thevicinity of the Nd:YAG laser third harmonic wavelength. lected the signal to the slit of a 150-mm spectro-meter (Acton Research Corporation) connected toan intensified CCD camera (LaVision FlamestarII). The spectrometer was equipped with a 300grooves/mm grating, resulting in a spectral resolu-tion of approximately 0.5 nm/pixel on the CCDchip. The spectrally resolved fluorescence was studiedfor different excitation wavelengths vs within thescanned range of Fig. 2, resulting in emissionspectra such as the one illustrated in Fig. 3. Thefluorescence emission spectrum of formaldehydehas been discussed in several papers [5,20,21]. Thepeaks of the spectrum correspond to transitionsbetween different vibrational states in the non-planar excited electronic state and the electronicground state of the molecule. The vibrationalmodes active in these transitions are the C-Ostretch vibration and the bending vibration in theplane of the molecule, which according to thenotation used by Ramsay and Clouthier [3], arereferred to as vibrational modes 2 and 4, respec-tively. This notation has been used to label thepeaks in Fig. 3. Emission spectra from formalde-hyde were obtained with the laser wavelength setat a peak in the excitation spectrum, as well aswhen it was set to a position in between the peaks.Shibuya et al. [22] have resolved a part of the Fig. 3. Formaldehyde LIF emission spectrum detected in aDME diffusion flame. rotational structure within the 4 band of formal-dehyde at room temperature and low pressureusing a frequency doubled dye laser with a line-width of 0.20 cm-. Measurements at atmosphericpressure and at elevated temperature, which isthe case in the measurement region of the flame,result in the appearance of a more dense structuredue to broader rotational lines and an increasedpopulation of the higher vibrational states of theformaldehyde molecule. In absorption studiesmade by Dieke and Kistiakowsky[2] an almostcontinuouslSabsorption was found at tedtemperatures and observations similar to ourshave been made in flame investigations by Klein-Douwel et al. [19]. 3. Laser intensity investigations Two studies were made to investigatethe influence of the laser intensity on the formal-dehyde LIF signal. The first was a saturationinvestigation made with the combined Nd:YAGand dye laser system in the same kind of flameas the spectral investigations. The laser wavelengthWasSituned to the value corresponding to thethird harmonic of the Nd:YAG laser and measure-ments of the LIF signal were performed fordifferent pulse energies of the laser. Additionallythe size of the laser beam spot was estimated bymeasuring the laser pulse energy after the focuswhile traversing a razorblade perpendicular to thebeam. The laser intensity was then calculated fromthe measured values of pulse energy and beamsize. The LIF signal vs laser intensity is illustrated inFig. 4 and the graph shows an increasing LIFsignal vs laser intensity over the entire rangestudied. A decrease in the slope of the curve canbe observed at approximately 2 GW/cm’indicat-ing partial saturation. Complete saturation is,however, not achieved with the laser intensitiesused. Probable reasons are the weak transitionsprobed, that saturation is not obtained in the outerparts of the laser profile, and that the saturationalso is influenced by line-broadening mechanisms[23]. The second investigation of the intensity depen-dence of the LIF signal was performed to inves- Fig. 4. Formaldehyde (CH2O) LIF signal vs intensity measuredalong a line in a DME diffusion flame. tigate the possible laser-induced photochemistry.Inthis investigation the third harmonic of aNd:YAG laser was used directly and the laserbeam was shaped into a 30 mm vertical sheet. Thefluorescence obtained in the sheet was imaged onthe CCD camera with an f=50 mm Nikon lens. ASchott filter (GG385) was placed in front of theCCD camera to suppress scattered laser radiation.The CH2O LIF distribution was investigated intwo different premixed DME flames using twodifferent laser intensities. The equivalence ratioswere @=0.86 and 1.5 and the pulse energies usedwere 1 and 85 mJ, corresponding to laser powerdensities of approximately 0.002 and 0.2 GW/cm.The results of these investigations are illustrated inFig. 5a for the lean flame and in Fig. 5b for therich flame. The leftmost images in Fig. 5a and b,respectively, show the chemiluminescence of thetwo flames, detected with the CCD camera with-out using the Schott filter. The middle imagesshow the laser-induced fluorescence detected in thetwo flames with a laser pulse energy of 85 mJ. Thecontours of the LIF signals have been drawn withwhite dashed lines innthe chemiluminescenceimages. It can be seen that the formaldehydesignals are located along the inner side of theflame cone and follow the cone contour. Thisindicates the presence of formaldehyde on theinner side of the flame front region, as expected.The horizontal white dashed lines in the LIFimages are the boundaries for two regions wherethe intensities of the pixels have been added in thevertical direction. The total LIF signals from thesetwo regions vs horizontal x-coordinate across theflames are illustrated to the right in Fig. 5a and b. Each graph contains two normalised curves, onefor each value of the laser pulse energy. The spatialdistribution of formaldehyde across the flames,obtained for the two pulse energies are similarboth in the case of the lean flame and in the case ofthe rich flame. Small differences can be observedwhen comparing the curves in each graph, whichcan be explained by small fluctuations of theflame. .The differencesare comparablee to thespatial resolution of the measurements,,whichwas 0.15 mm/pixel. The result that the spatialdistributions of formaldehyde in the two flameslook similar for both values of the laser intensitygives no clear indication of influence of photo-chemical processes on the detected formaldehydedistribution. The results of the investigation arenecessary but not conclusive conditions to confirmthe absence of photochemical effects. 4. Internal combustion engine applications The third harmonic radiation of the Nd:YAGlaser has also been used for detection of formal-dehyde in an optical engine. The engine was asingle cylinder research engine (AVL 5411) andengine data are given in Table 1. Optical access tothe engine was provided through a part of thecylinder liner, through windows in the engine topand through a window in the piston, a so-calledBowditch design. In these measurements the laserpulse energy was 50 mJ and the beam was shapedinto a 40 mm wide, horizontal laser sheet that wasled through the combustion chamber via thepentroof windows. The fluorescence was detected Table 1Data for the optical engine Bore 83 mm Stroke 90 mm Swept volume 487 cc Top geometry Pentroof Number of 4 valves Fuel 40% n-heptane+ 60% iso-octane (SI mode), n-heptane (HCCI mode) Fuel injection Port Fig.5. Flame chemiluminescence images (left), formaldehyde LIF images (middle) and radial formaldehyde distributions (right) frompremixed DME flames. (a) A fuel-lean flame with D=0.86, (b) a fuel-rich flame with D=1.5. The contours of the LIF signals aredrawn with white dashed line in the chemiluminescence images. The radial distributions have been obtained by vertically adding theintensities of the pixels within the areas indicated by the horizontal lines in the LIF images. The radial distributions have beenmeasured for two different laser pulse energies, 1 and 85 mJ. through the piston window and directed to theLaVision CCD camera by an aluminum-coatedmirror mounted below the piston. The opticalaccess and laser sheet arrangement is illustrated inFig. 6, where the left illustration shows the passageof the laser sheet through the windows in theengine top and the detection path of fluorescenceviaatthe aluminum mirror.. The camera wasequipped with a Nikon f=50 mm lens and theSchott filter (GG385) was used for suppression ofscattered radiation at 355 nm. The engine was operated in spark ignition (SI)mode with a mixture of iso-octane and n-heptaneas fuel and in a homogeneous charge compressionignition (HCCI) mode with n-heptane as fuel. The HCCI concept is based on auto-ignition of ahomogeneous air-fuel mixture, which is achievedduring the compression when the temperature andthe pressure of the mixture exceed the ignitionpoint. This occurs at several positions within thecombustion chamber and a two-stage ignitionprocess is initiated. The combustion in HCCImode is fast, since a large part of the charge reactssimultaneously, and a lean air-fuel mixture is usedto suppress the fast combustion. The formalde-hyde is expected to appear as an intermediatespecies during the first stage of the ignition processand then to disappear as the flame chemistryadvances. The combustion process of the HCCIengine can be followed in the cylinder pressure Fig. 6. Experimental setup and optical access in the engineexperiments. trace and the heat release curve illustrated in Fig.7. The unit of the horizontal axis is crank angledegrees (CAD), which is a measure of the rotationof the engine crankshaft and thereby of the pistonposition. The angle 0 CAD corresponds to theuppermost position of the piston, the top deadcenter, in the compression stroke. The crank angleis also a timeunit for the engine cycle and the twocurvesin Fig.7 therefore illustrate cylinderpressure and heat release vs time during the enginecycle. From Fig. 7 the start of the ignition process Fig. 7. Cylinder pressure trace and heat release curve from anHCCI engine cycle. and the first stage can be observed at-17 CADwhere an increase in the slope of the pressure traceoccurs together with a peak on the heat releasecurve. The second stage is initiated at +9 CADwhere a steep pressure increase and a larger heatrelease peak can be observed. Two-dimensionalLIF measurements were made at twelve differentcrank angles, from -30 to +9 CAD, during theHCCI combustion cycle and the engine was run atapproximately 1 min. for each measurement madeat a specific crank angle. The reason for runningthe engine this limited time was to limit thethermal stress of the windows. Due to heat transferfrom the combustion process to the combustionchamber walls the initiation of combustion wasadvanced during an engine run, which means thatthe pressure and heat release curves were displacedtowards lower CAD during each engine run. ALIF signal was detected from -21 CAD and laterin the cycle, which is in agreement with theappearance of the first peak on the heat releasecurve of Fig. 7. Fig. 8a shows the camera viewthrough the piston window and LIF images fromthe HCCI measurements are shown in Fig. 8b-d.The image in Fig. 8b was detected at -15 CAD,indicated by the left vertical line in Fig. 7. Thisposition is in the first ignition stage, and the imageshows a LIF signal distributed over the entire areacovered by the laser sheet. This indicates that theentire air-fuel mixture in the sheet has entered thefirst stage of the ignition process. The images inFig. 8c and d were detected at +9 CAD, indicatedby the right vertical line in Fig. 7. At this time inthe engine cycle the transition to the second stageof the combustion process occurs. These imagescontain dark regions where the formaldehyde hasbeen consumed in the combustion chemistryprocesses. Two important things should be notedwhen studying the images in Fig. 8c and d. Firstly,it can be observed that the second-stage ignitionthat consumes the formaldehyde has started indifferent localized regions in the observed area i.e.,the combustion does not appear to be perfectlyhomogeneous. Secondly, by comparing the twoimages recorded from different cycles, it is seenthat the cycle-to-cycle variations for the ignitionprocesses are large. The LIF images of Fig. 8 havebeen compensated for the laser intensity profile by (a) (b) (c) (d) Fig. 8. (a) Camera view through the piston window in theoptical engine. LIF images detected during homogeneouscharge compression ignition (HCCI) engine operation at twodifferent crank angles, (b) - 15 CAD, (c) and (d) +9 CAD. using information from images with a uniformsignal distribution like the one in Fig.8b. In SI mode the engine was operated so that lightengine knock was obtained. Fig.9 shows an imagedetected at these conditions. The spark plug waslocated in the center of the combustion chamber.which can be seen in the image of Fig. 8a. As theflame propagates from the spark plug towards thecombustion chamber walls the temperature andpressure of the unburned fuel-air mixture, theend-gas, in front of the flame is elevated. Themixture then enters the first stage of combustionand formaldehyde appears as an intermediateproduct. This can be seen in Fig.9 where a LIFsignal is located in the outer parts, whereas theinner area close to the spark plug is completely freefrom LIF signal since here final combustionproducts persist.t. The image also reveals; theirregular shape of the flame due to the turbulencein the combustion chamber. Engine knockiscaused by an auto-ignition in the end-gas thathas not yet been reached by the propagating flame.The auto-ignition has been reported to start inlocal areas of the end-gas, so called exothermiccentres, which appears due to non-uniformities inthe temperature and composition. An exothermiccenter in the end-gas, where ignition has beeninitiated, would appear as a dark area within theformaldehyde field [14-16]. Th..e exothermic cen-ters are likely located close to the combustionchamber walls in regions that not could be reachedwith the present setup. Spectrally resolved LIFmeasurements Weremade in HCCI-mode and Fig. 10 shows a spec-trum recorded in the engine at -15 CAD at apressure of 1.2 MPa. The spectrum shows peaks Fig. 9. LIF image detected during spark ignition (SI) engineoperation at +5 CAD with spark-ignition time set at -15CAD. Fig. 10. LIF emission spectrum with the spectral signature offormaldehyde detected in HCCI mode of the engine at - 15CAD. In addition, for comparison the LIF emission spectrumin Fig. 3 has been inserted. with positions that correspond to those in theemission spectrum from formaldehyde [6], whichalso can be seen by comparison with the formal-dehyde emission spectrum from an atmosphericpressure flame included in the figure. It is thusclear that formaldehyde is a part of the LIF signal,however the origin of the broad continuousstructure below the peaks is not yet fully identified.One possibility is that it is a part of the formal-dehyde spectrum tlthathhas nott been properlyresolved with the spectrometer setup used. Thespectral lines of formaldehyde are also broadenedand overlap more at the elevated pressure. An-other option is that it could be remaining back-ground fluorescence from the engine itself, forinstance from the pentroof windows, which hasnot been properly subtracted. It is also possiblethat spectral signatures from other intermediatespecies in the combustion process contribute to thecontinuous part of the spectrum. Another featureof the engine spectrum is the suppression of theshort-wavelength part below 410 nm, which maybe caused by absorption of the fluorescence bycool-flame species. The results from engine measurements presentedin this section are an example of an application ofthe 355 nm excitation alternative. When interpret-ing the images the main issue was to be able todiscriminate between regions of burned and un- burned air-fuel mixture. This was possible with-out having detailed knowledge about to whatextent the formaldehyde emission contributed tothe images. 5. Summary The laser-induced fluorescence of formaldehydeexcited with the third harmonic of a Nd:YAGlaser has been investigated. The emphasis of thepaper has been to investigate the potential of thetechnique for combustion studies. The coincidencebetween the third harmonic Nd:YAG laser profileand the absorption lines of formaldehyde has beeninvestigated. Studies of the LIF signal intensitydependence has been performed in order to obtainan approximate value of the saturation intensitytogether with an investigation of the potentialoccurrence of photochemical effects. The techni-juewas finally demonstrated for detection offormaldehyde in an internal combustion engine.The investigations show that despite that the thirdharmonic of the Nd:YAG laser only coincides withrelatively weak rotational transitions of the form-aldehyde molecule it is a realistic alternative forformaldehyde detection in combustion processesdue to the high laser power available. Acknowledgements The financial support by the Swedish NationalEnergy Administration (STEM) and Swedish Na-tionalScience Council isacknowledged. Thetechnical support by Allanf SognellT.b1 at ChalmersUniversity of Technology in the engine experi-ments is also acknowledged. References [1] B. Lewis, G. von Elbe, Combustion, Flames and Explo-sions of Gases, Academic Press Inc, 1987. [2] G.H. Dieke, G.B. Kistiakowsky, Phys. Rev. 45 (1934) 428. [3] D.J. Clouthier, D.A. Ramsay, Ann. Rev. Phys. Chem. 34(1983)31-58. ( [4] S.J. Stricker, R.J. Barnhart, J. Phys. Chem. 86 (1982) 448-455. ) ( [5] J.C.D. Brand, J. Chem. Soc. (1956)858-872. ) ( [6] G.R. Mohlmann, Appl. Spectrosc. 3 9 ( 1 985) 98-101. ) ( [7] S. Yamagishi, M. Tsuchiya, Comodia ( 1 994) 511. ) ( [8] J.E . Harrington , K.C. Smyth, Chem. P h ys. L e tt. 2 02(1993) 196-202. ) ( [9] A. Burkert, D. Grebner, D. M uller, W . Tribel, J K onig,Proc. Combust. Inst. 28 (2000)1655-1661. ) ( [10] S. Bockle, J . Kazenwadel, T. Kunzelmann, D .-I. Shin, C. Schulz, Appl. Phys. B 70 (2000) 733-735. ) ( [11] R. Bombach, B. K appeli, A ppl. P hys. B 6 8 ( 1999) 2 51-255. ) ( [12] D.I. Shin, T. Dreier, J. Wolfrum, Appl. Phys. B 7 2 (2001) 257-261. ) ( [13] C.S. M cEnally, L.D. Pfefferle, Combust. Flame 1 21 (2000) 575- 5 92. ) ( [14] B . Bauerle, F. Hoffmann, F. Behrendt, J. Warnatz, Proc. Combust. Inst. 25 (1994) 135- 1 41. ) ( [15] B. Bauerle, F. Behrendt, J. Warnatz, Proc. Combust. Inst. 26(1996)2619-2626. ) ( [ 1 6] R . SchieBl, P . Pixner, A. Dreizler, U. Maas, Combust. Sci. Tech. 149(1999) 339-360. ) ( [17] H. Kosaka, V.H. D r ewes, L. Catalfamo, A. A . Aradi, N. Iida, T.Kamimoto,SA E Tec h nical Pap e r Series 20 0 0-01- 0236 (2000). ) ( [ 1 8] N. G raf, J . G ronki, C. Schulz, T Baritaud, J. C h erel, P . Duret, J. Lavy, SAE Technical Paper Series 2001-01-1924 (2001). ) [19] R.J.H. Klein-Douwel, J. Luque, J.B. Jeffries, G.P. Smith,D.R. Crosley, Appl. Opt. 39 (2000)3712-3715. ( [20] K. Shibuya, R.A. H arger, E .K.C. Lee, J . Chem. Phys. 69 (1978)751- 7 57. ) ( [21] D.C. Moule, A.D. Walsh, C hem. Rev.75 (1975) 67-8 4 . ) ( [22] K. Shibuya,P.W. Fairchild, E.K.C. Lee, J. Chem. Phys. 7 5(1981)3397-3406. ) ( [23] E.H. Piepmeier, Spectrochim. Acta B 2 7 ( 1972) 431 443. ) Formaldehyde (CH2O) is an important intermediate species in combustion processes and it can through laserinducedfluorescence measurements be used for instantaneous flame front detection. The present study has focussed onthe use of the third harmonic of a Nd:YAG laser at 355 nm as excitation wavelength for formaldehyde, and differentdimethyl ether (C2H6O) flames were used as sources of formaldehyde in the experiments. The investigations includedstudies of the overlap between the laser profile and the absorption lines of formaldehyde, saturation effects and thepotential occurrence of laser-induced photochemistry. The technique was applied for detection of formaldehyde in aninternal combustion engine operated both as a spark ignition engine and as a homogenous charge compression ignitionengine.
确定
还剩8页未读,是否继续阅读?

产品配置单


北京欧兰科技发展有限公司为您提供《燃烧过程产生的甲醛中激光诱导荧光检测方案(流量计)》,该方案主要用于汽车排放与节能中理化分析检测,参考标准--,《燃烧过程产生的甲醛中激光诱导荧光检测方案(流量计)》用到的仪器有PLIF平面激光诱导荧光火焰燃烧检测系统、德国LaVision PIV/PLIF粒子成像测速场仪、Imager sCMOS PIV相机、汽车发动机多参量测试系统、LaVision SprayMaster 喷雾成像测量系统
推荐专场


CCD相机/影像CCD
更多


相关方案
更多
该厂商其他方案
更多