


方案详情
文
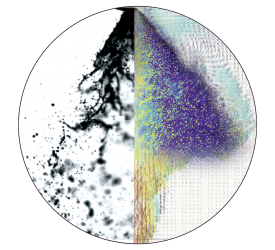
采用LaVision公司的高速相机和多参量数据采集和分析处理软件平台DaVis,对柴油JP-8喷雾的性能进行了测量分析。获得了喷雾的米氏散射和纹影成像数据。
方案详情

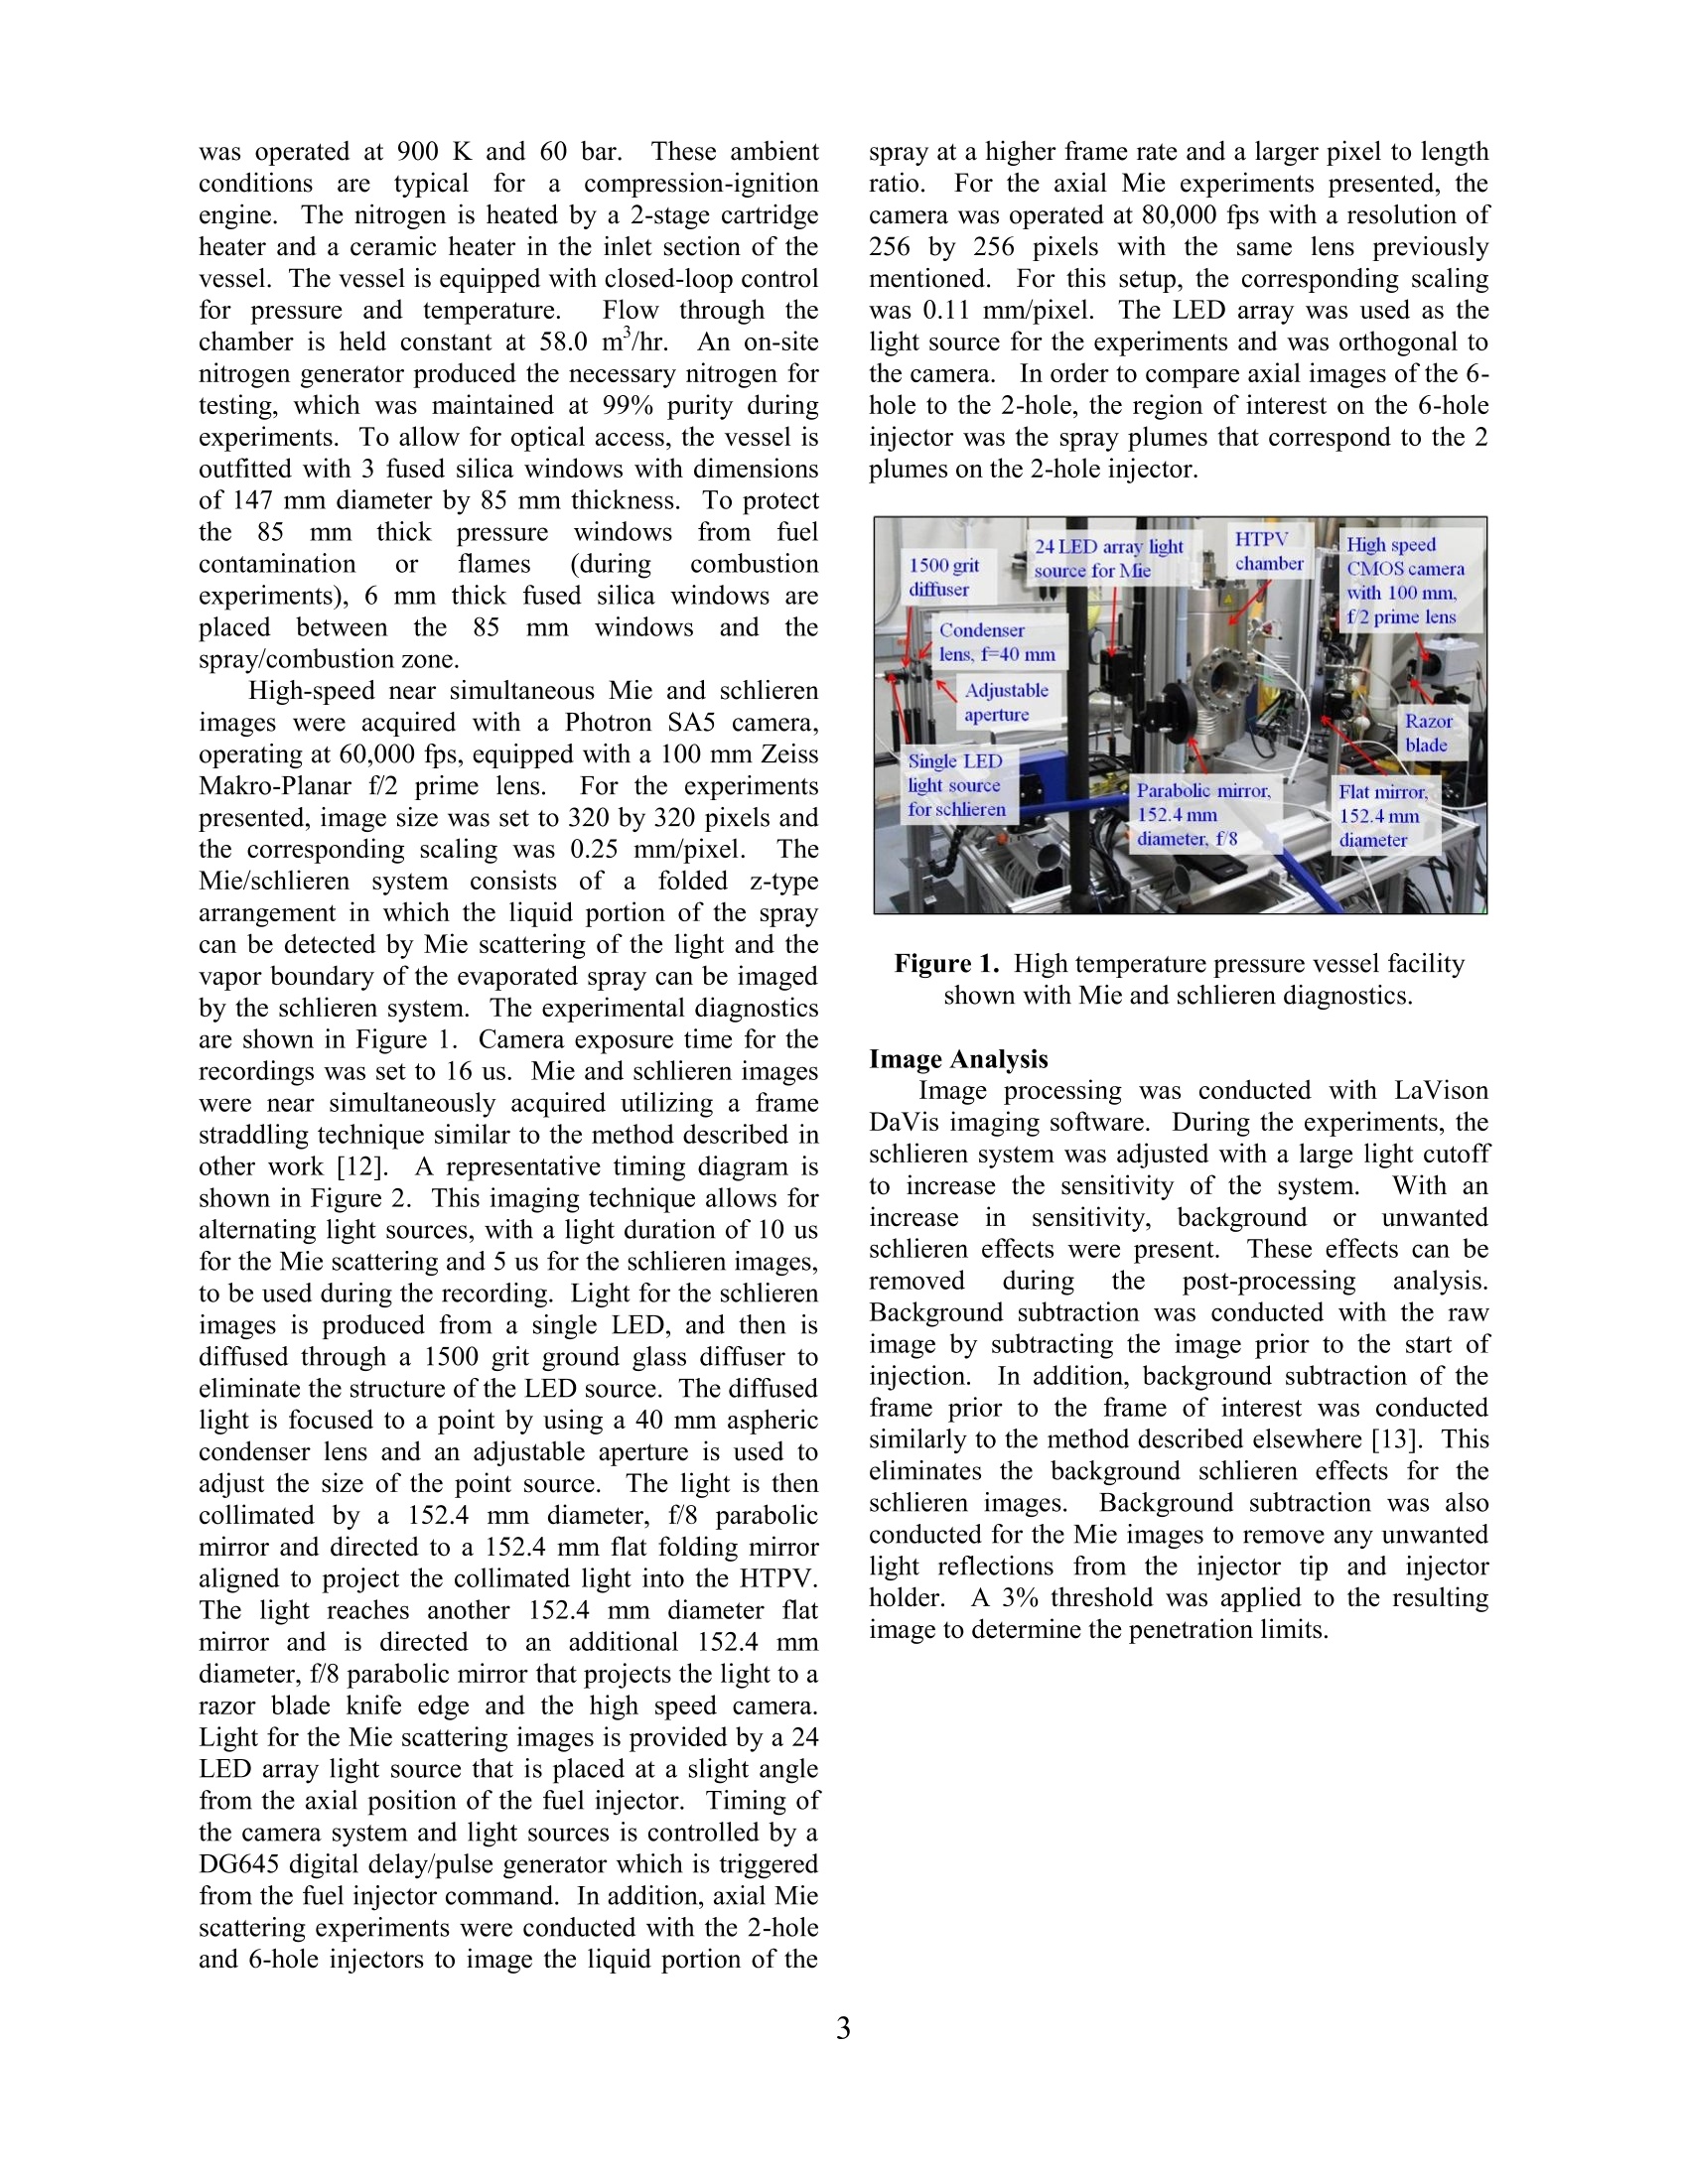
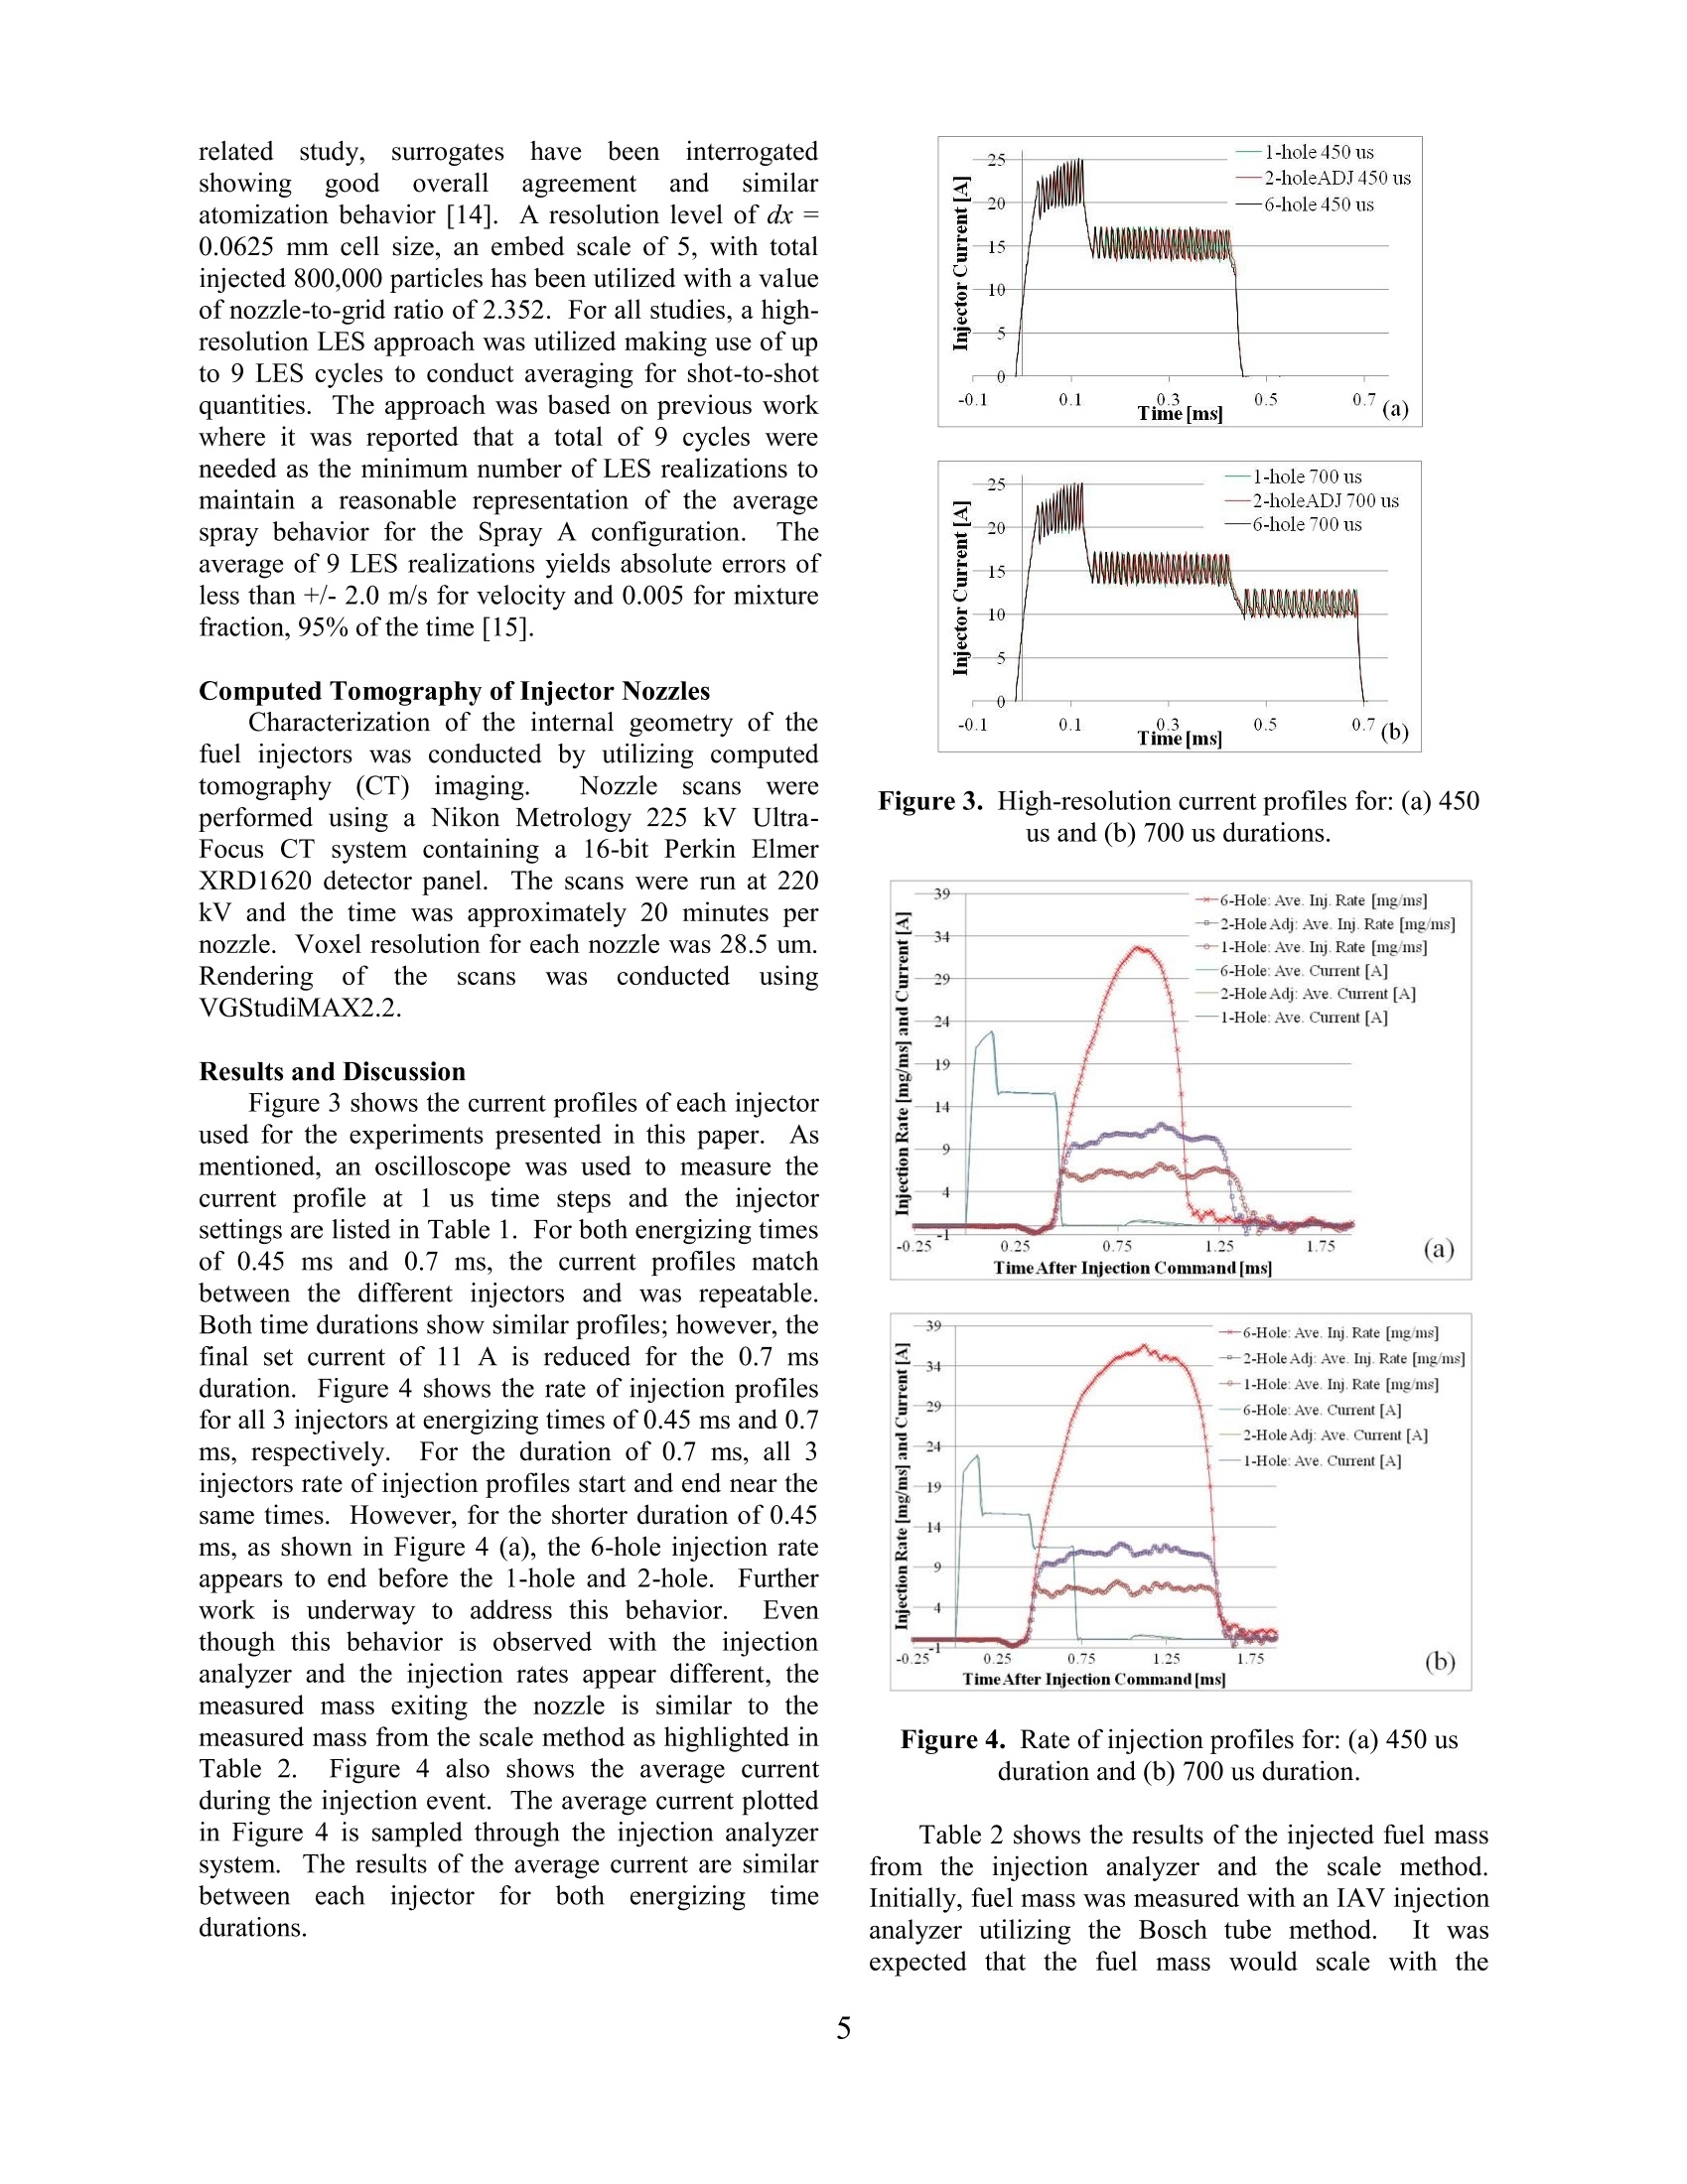
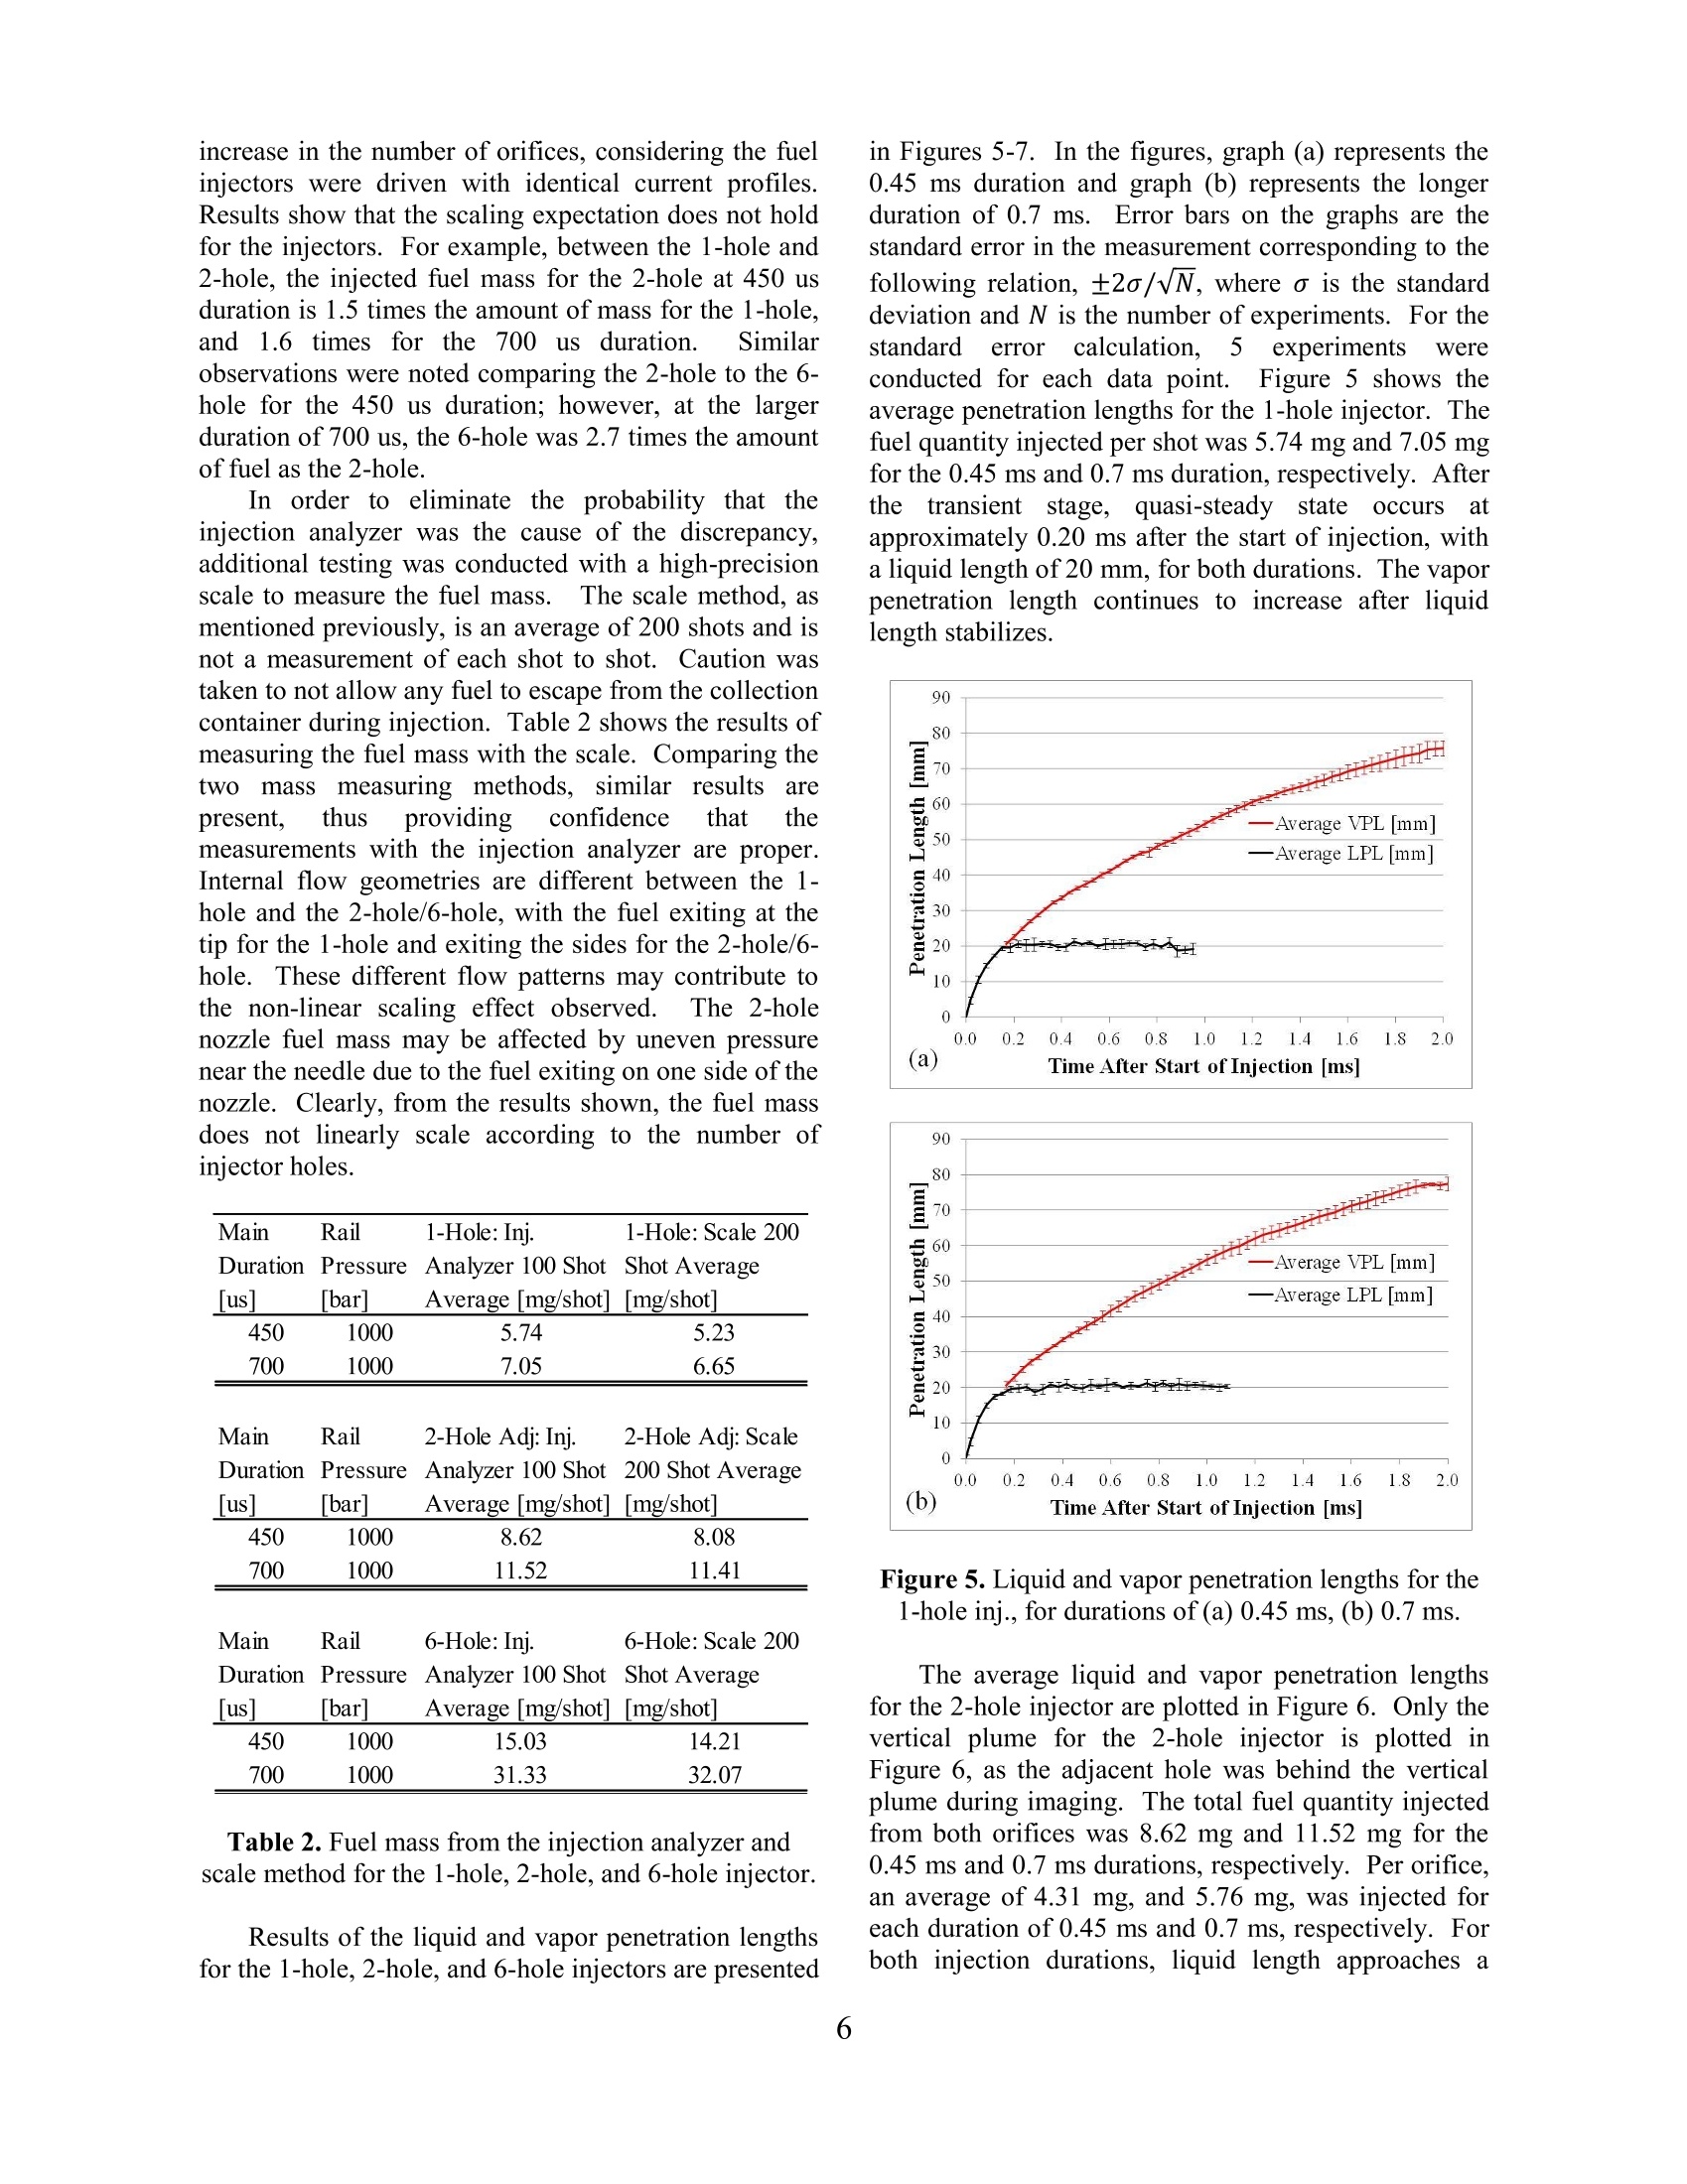
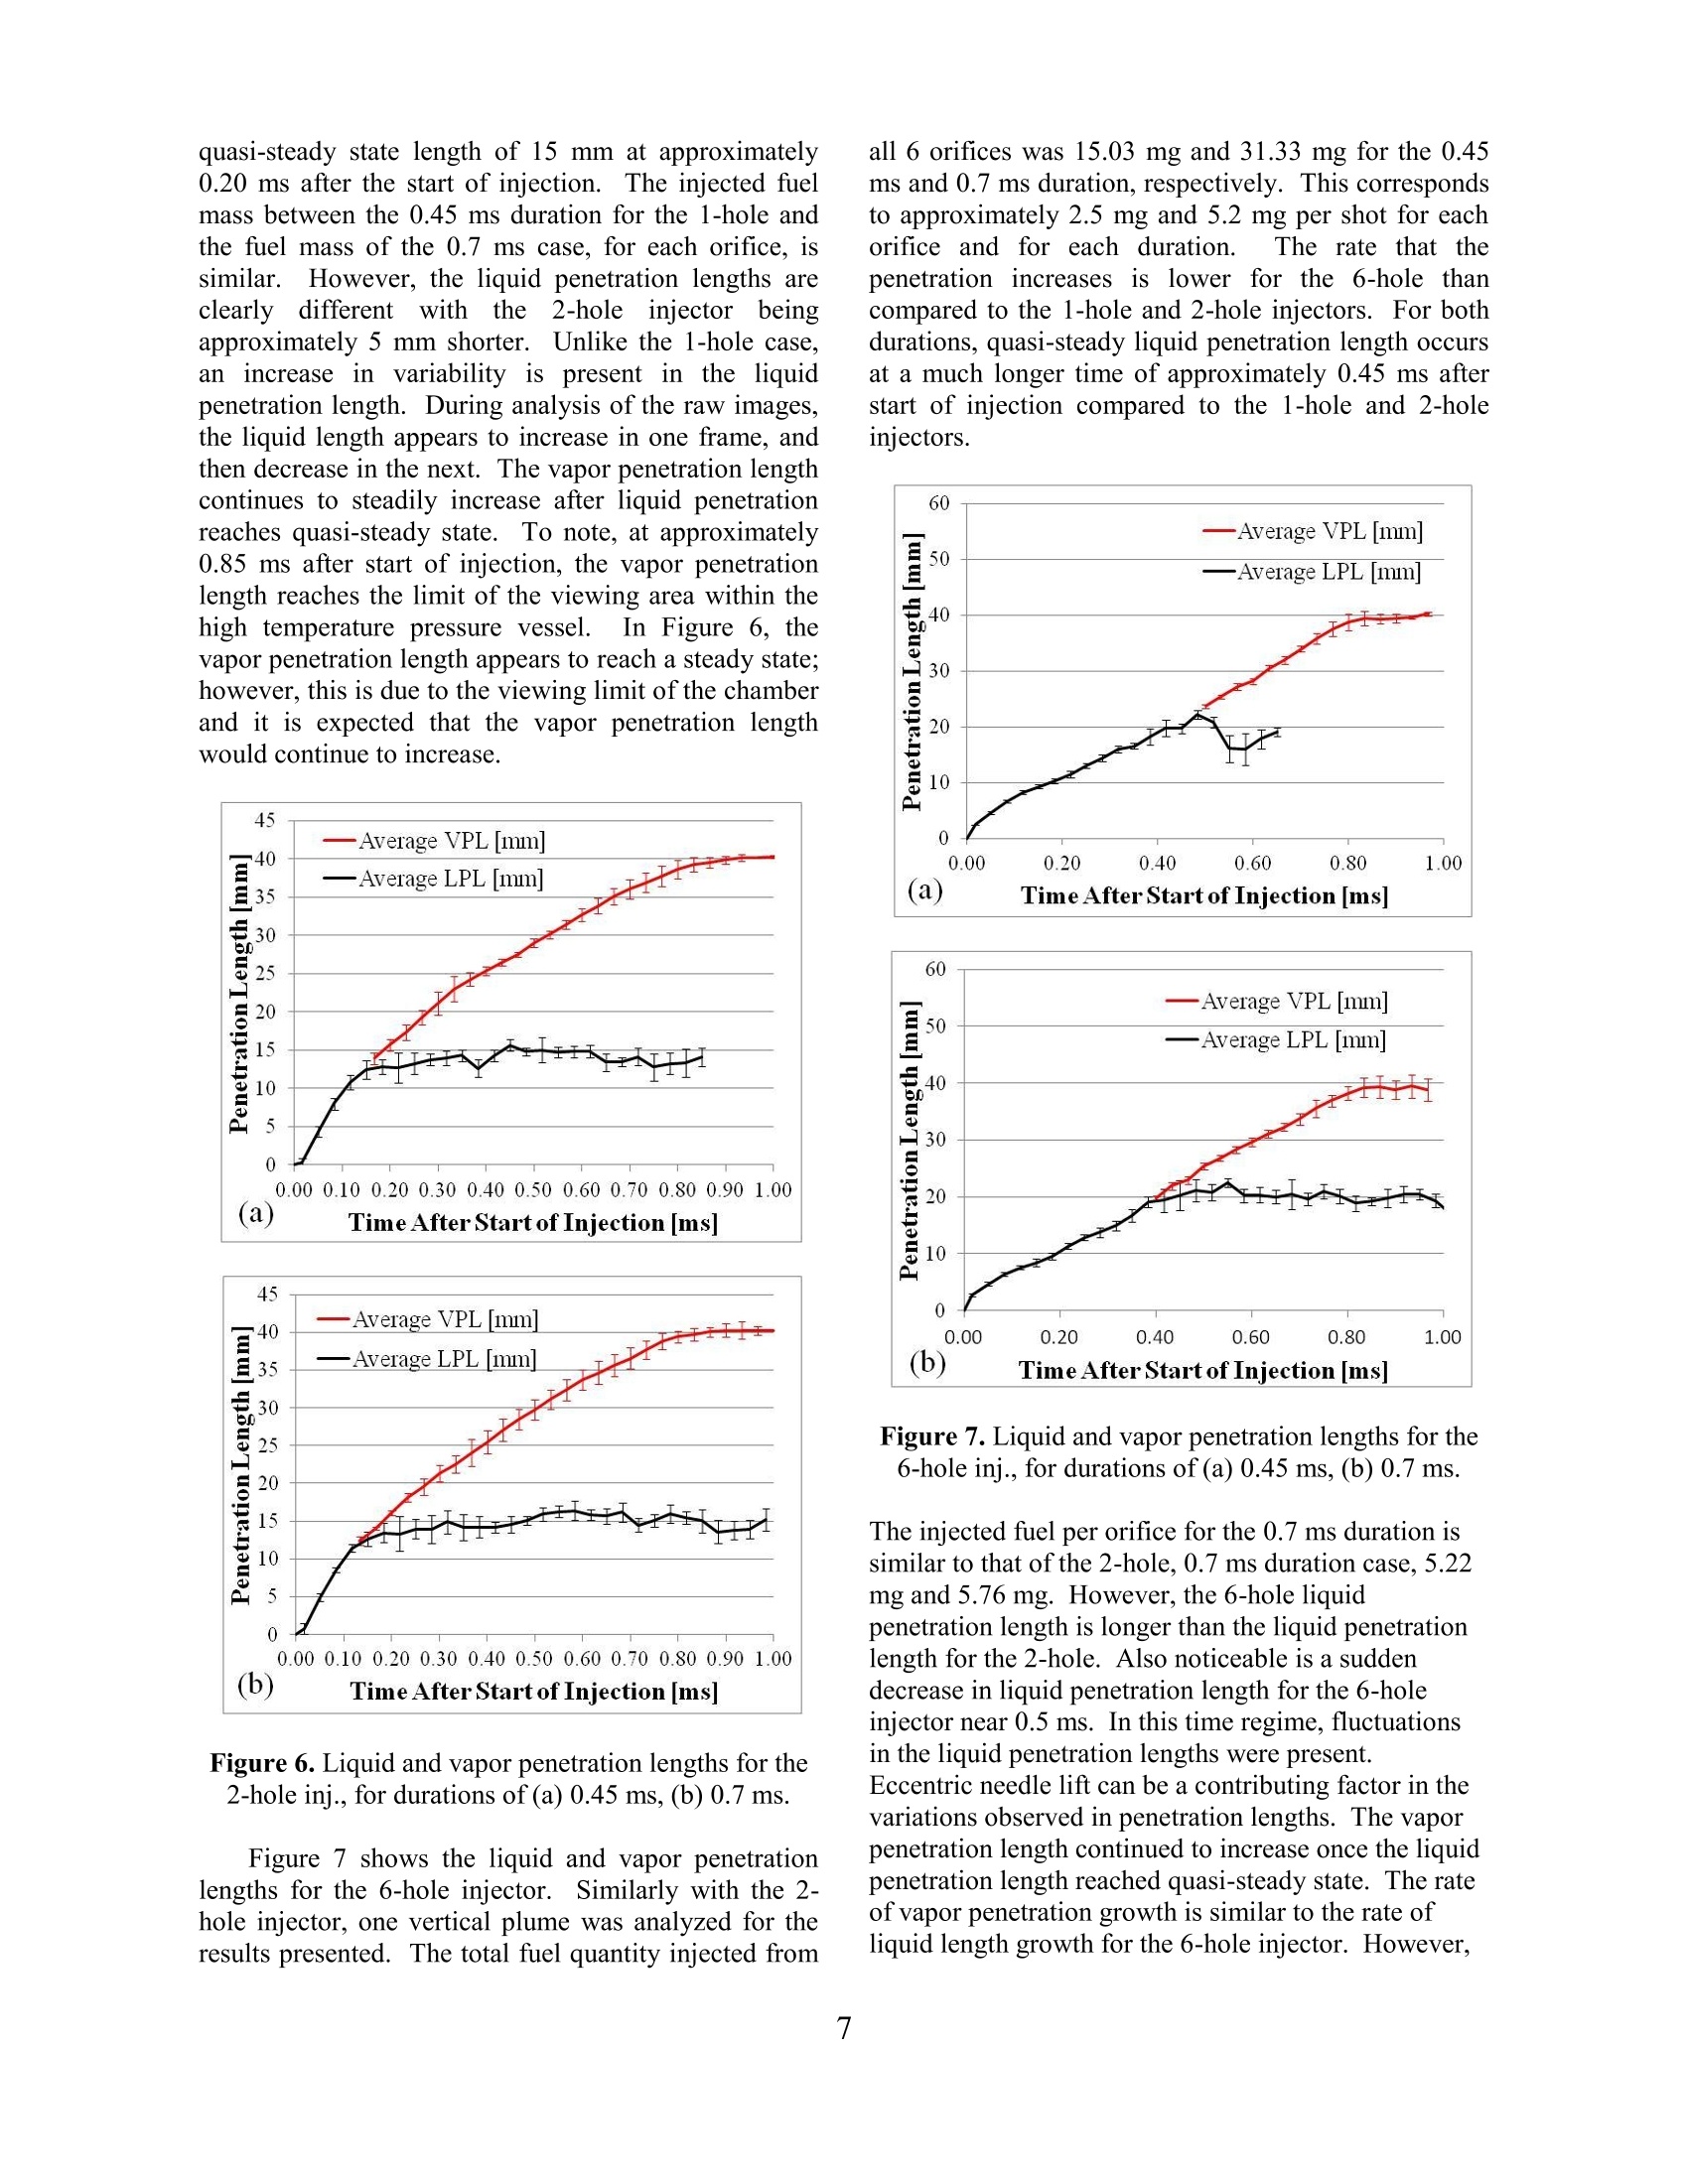
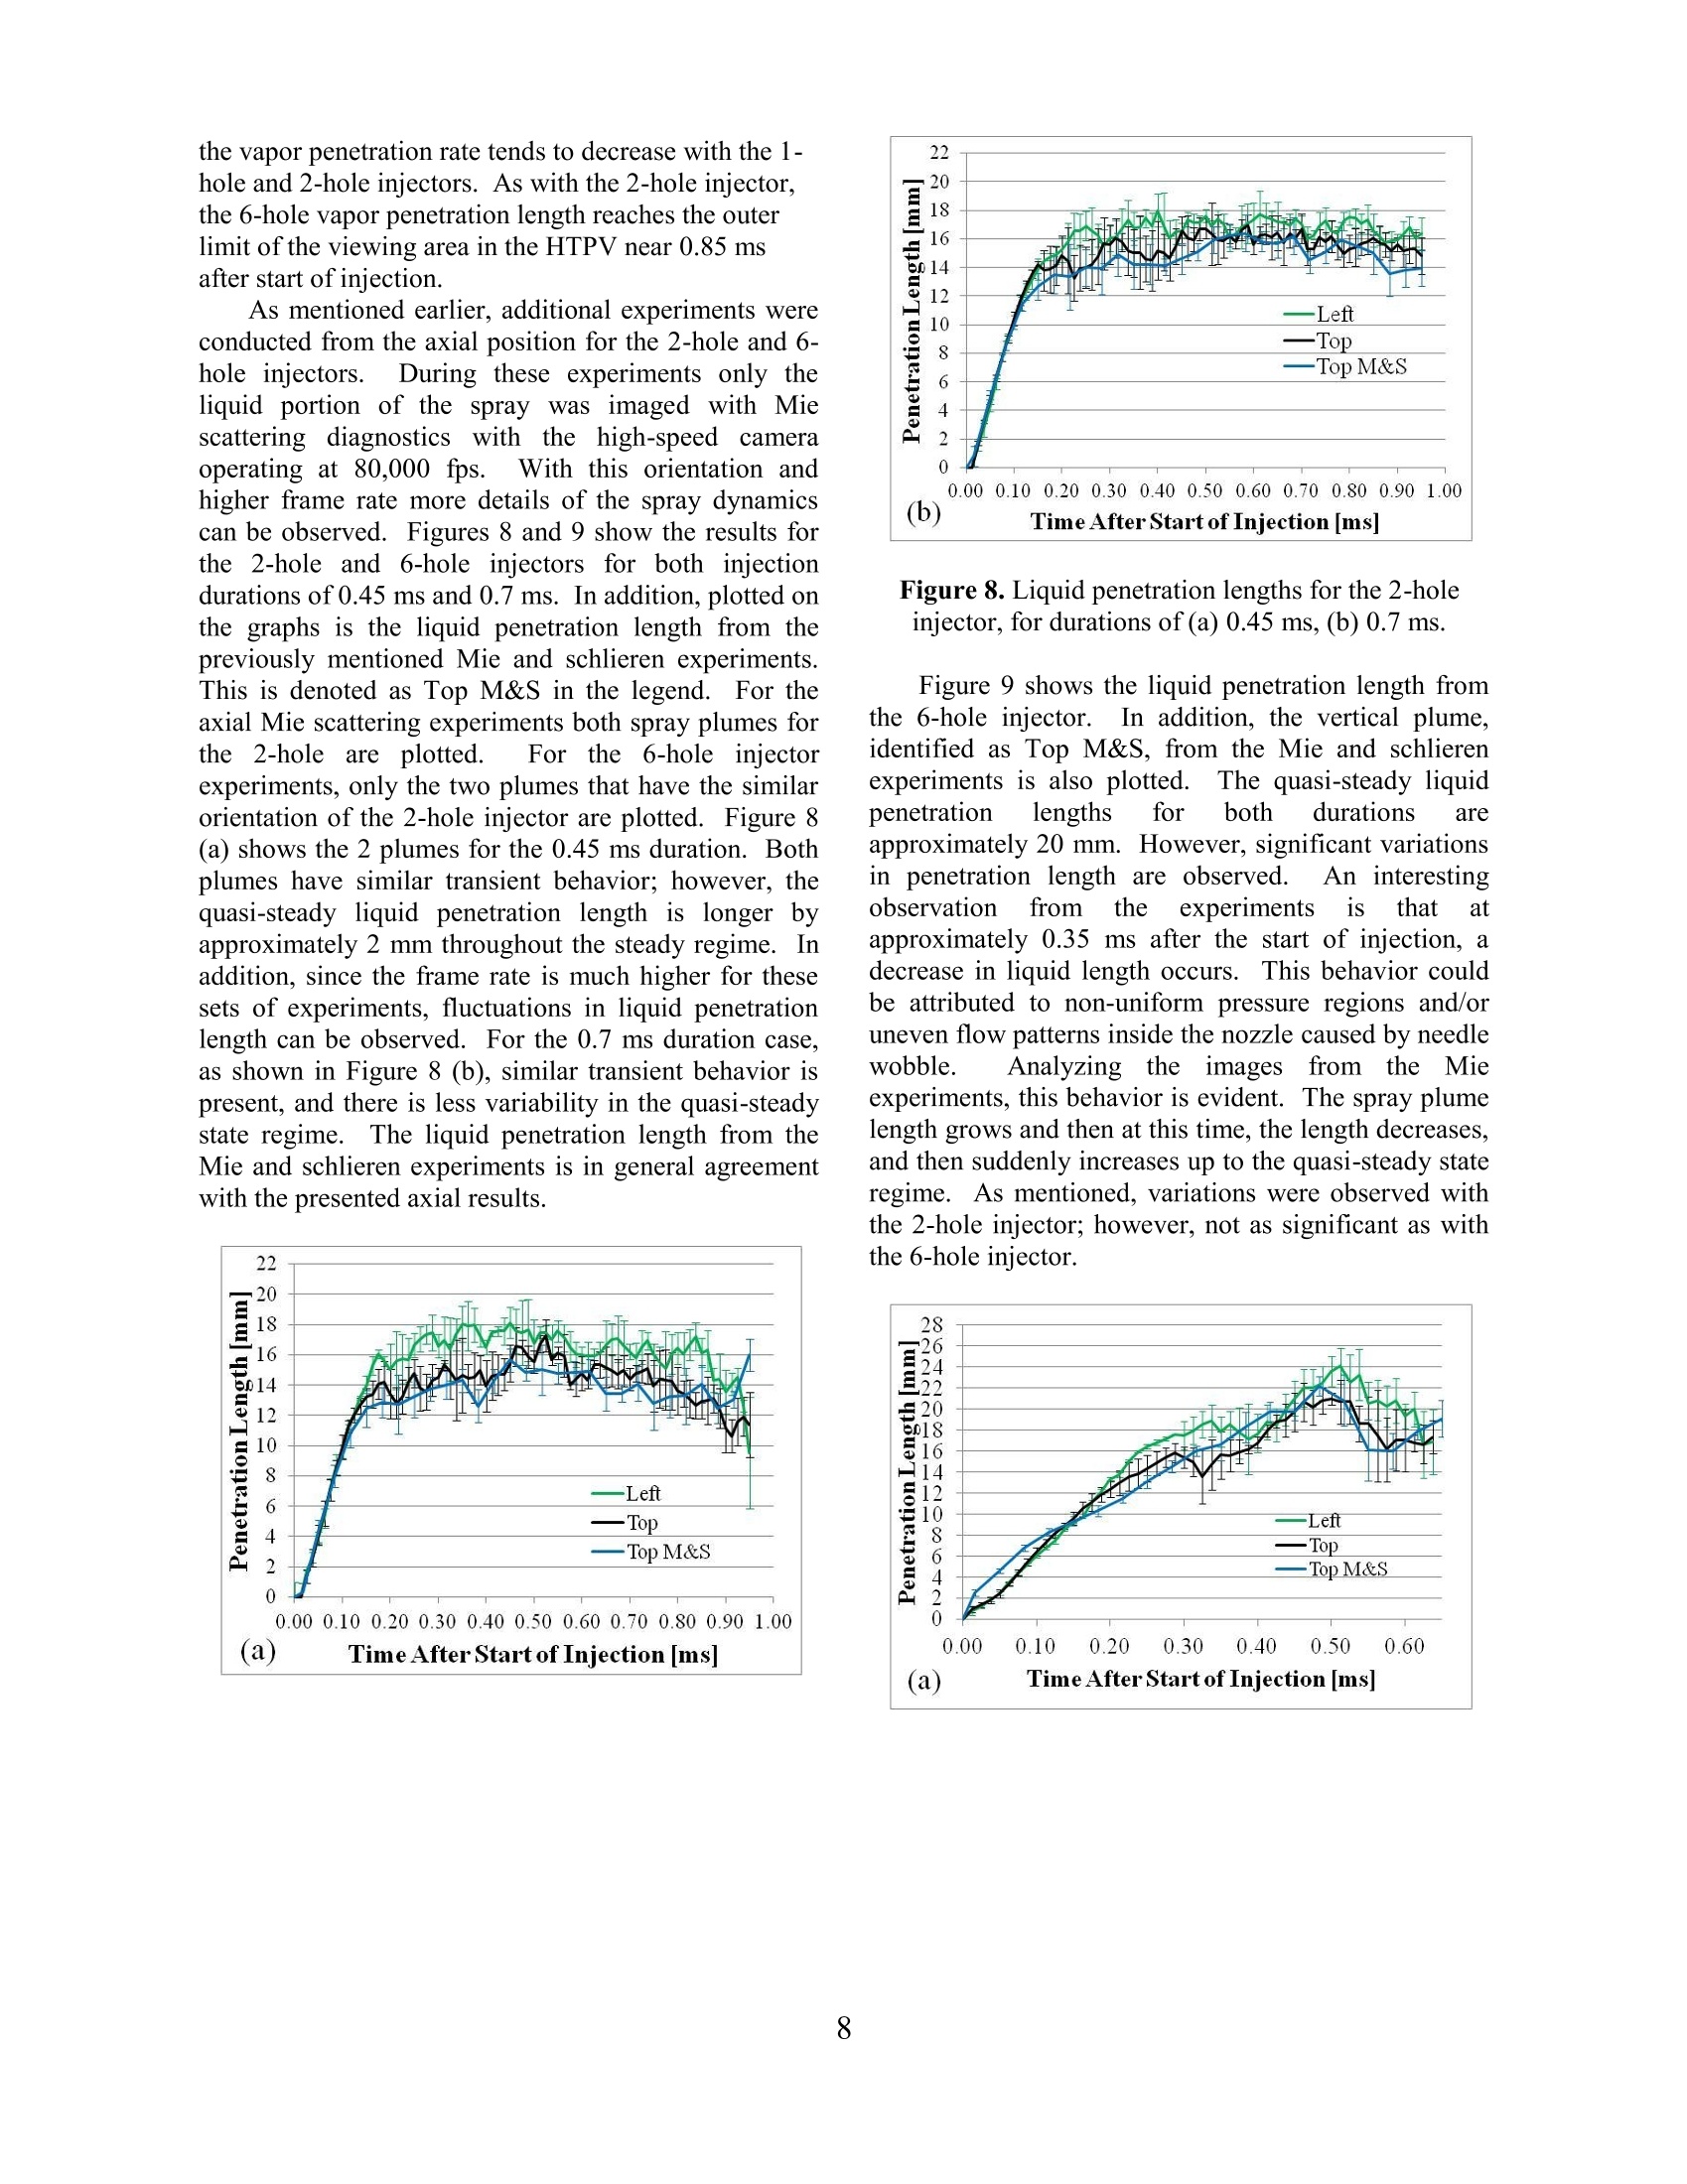
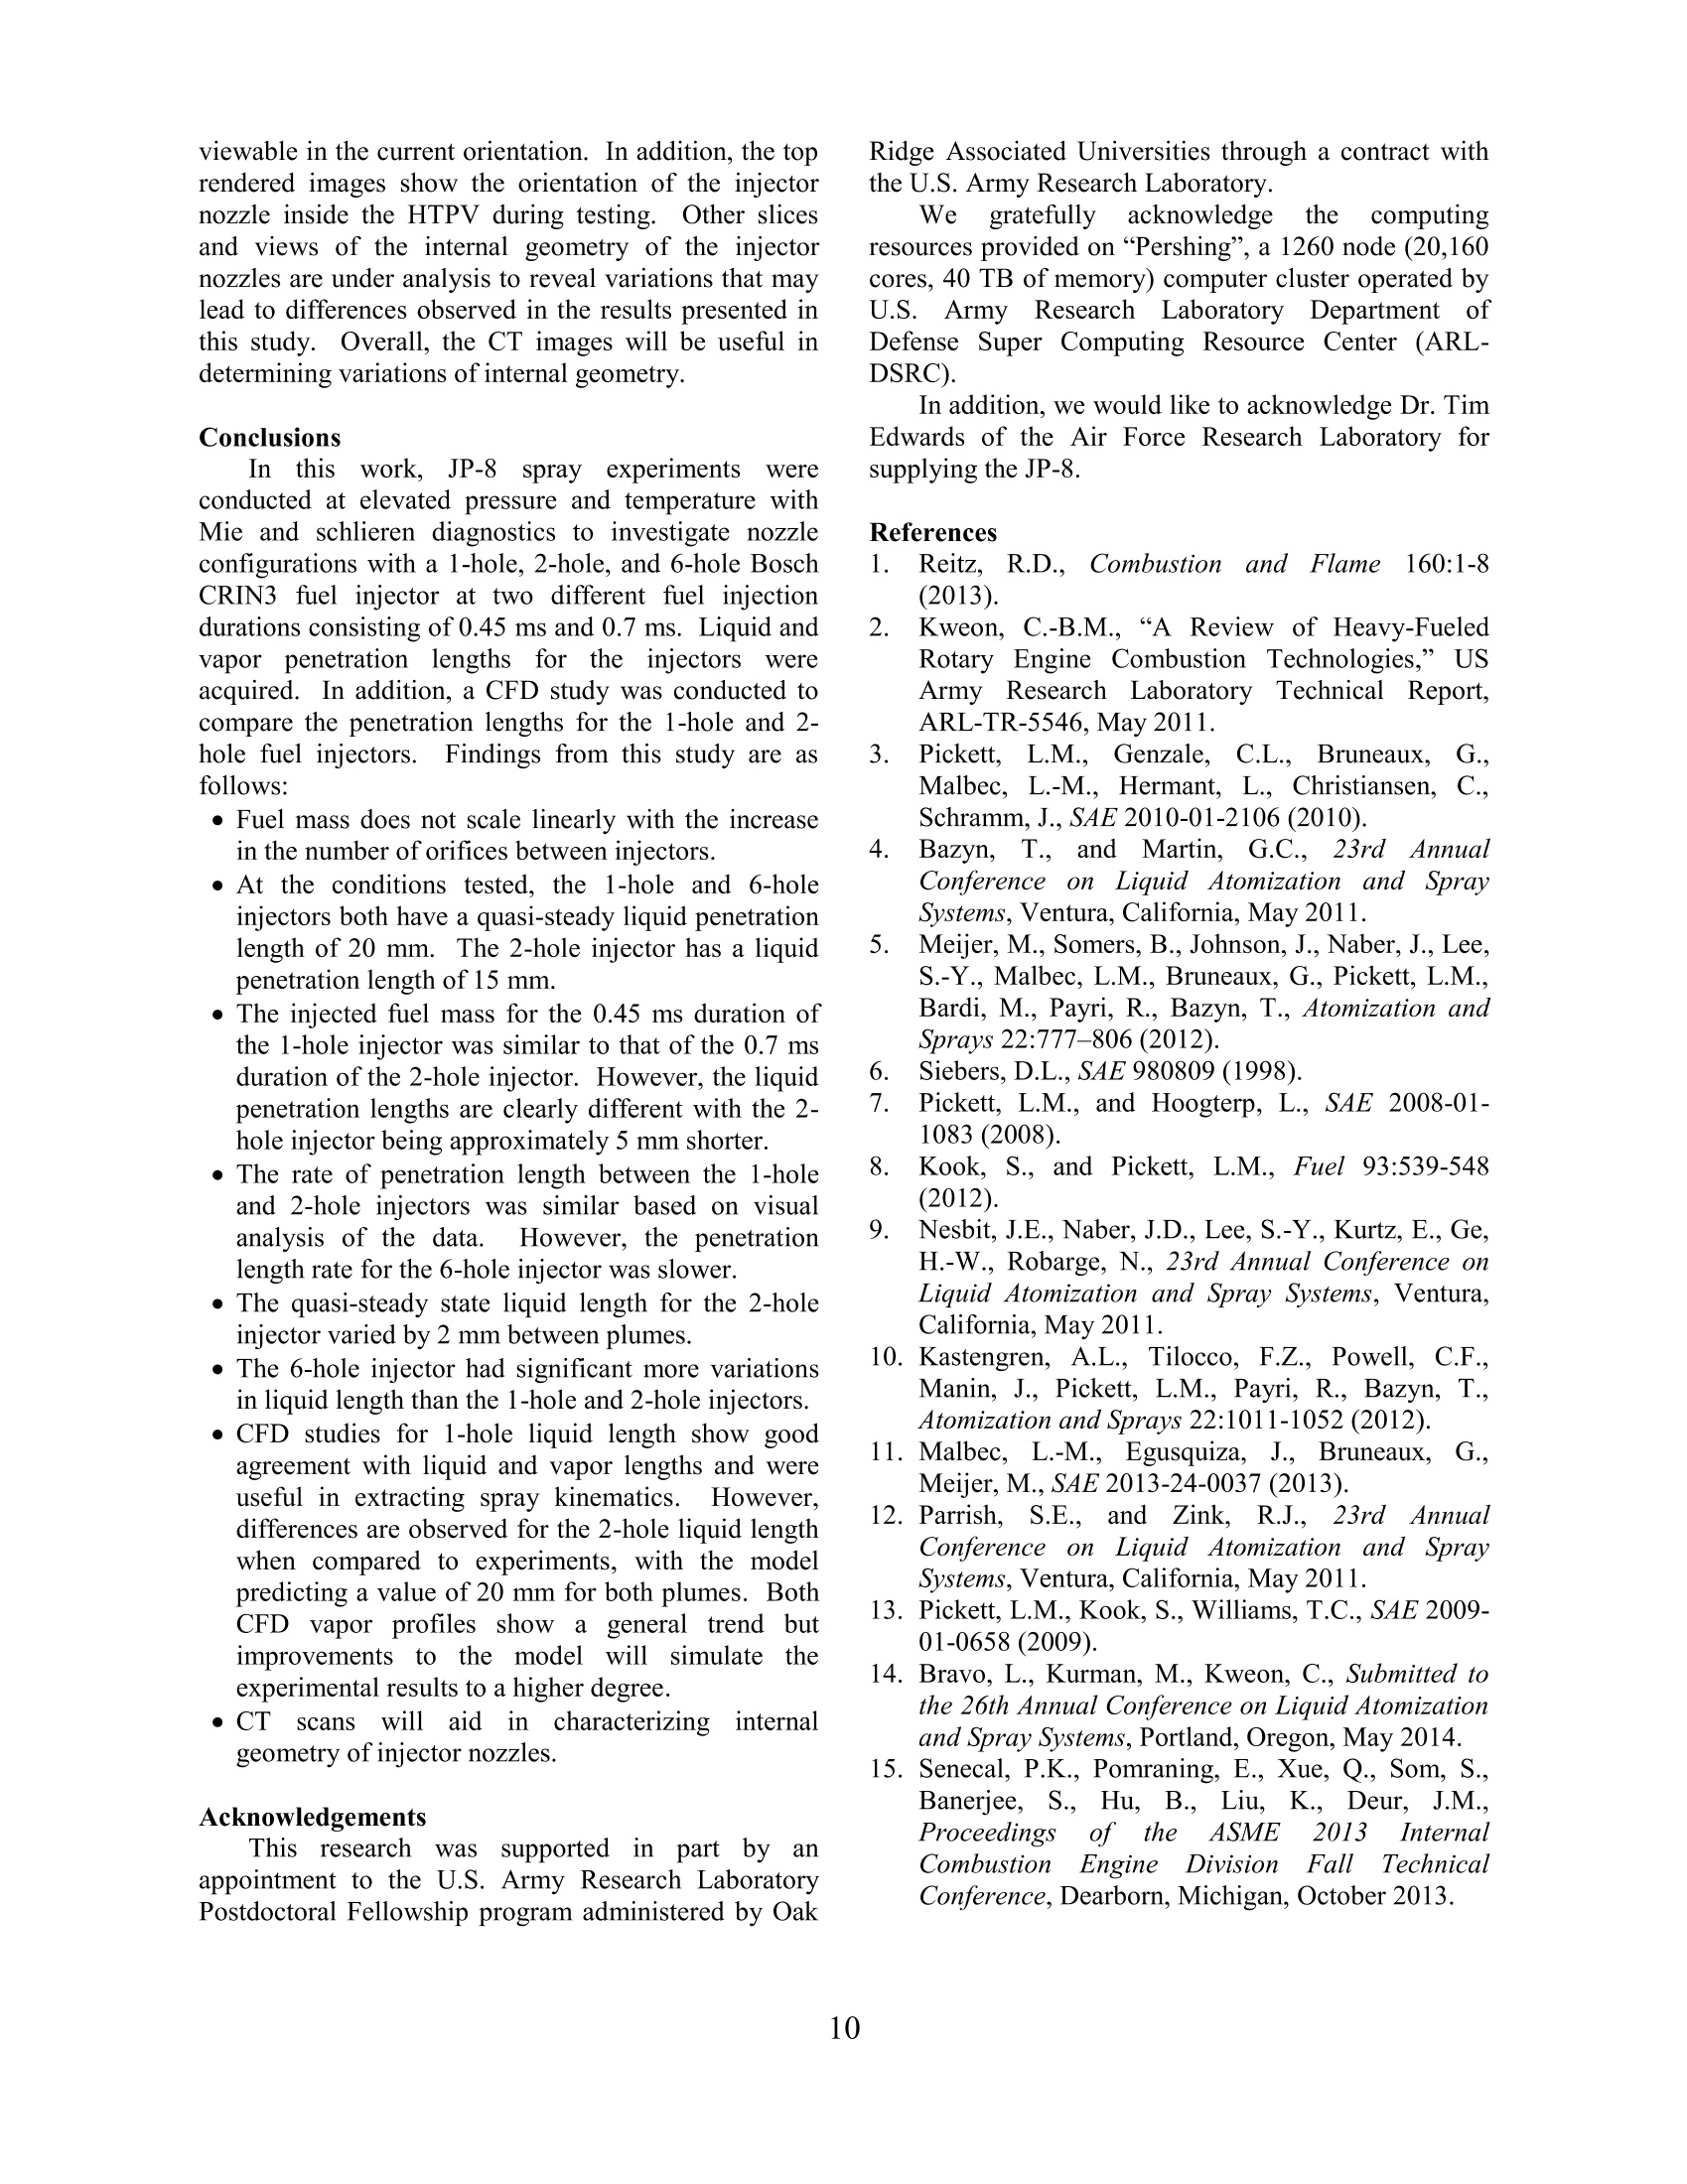
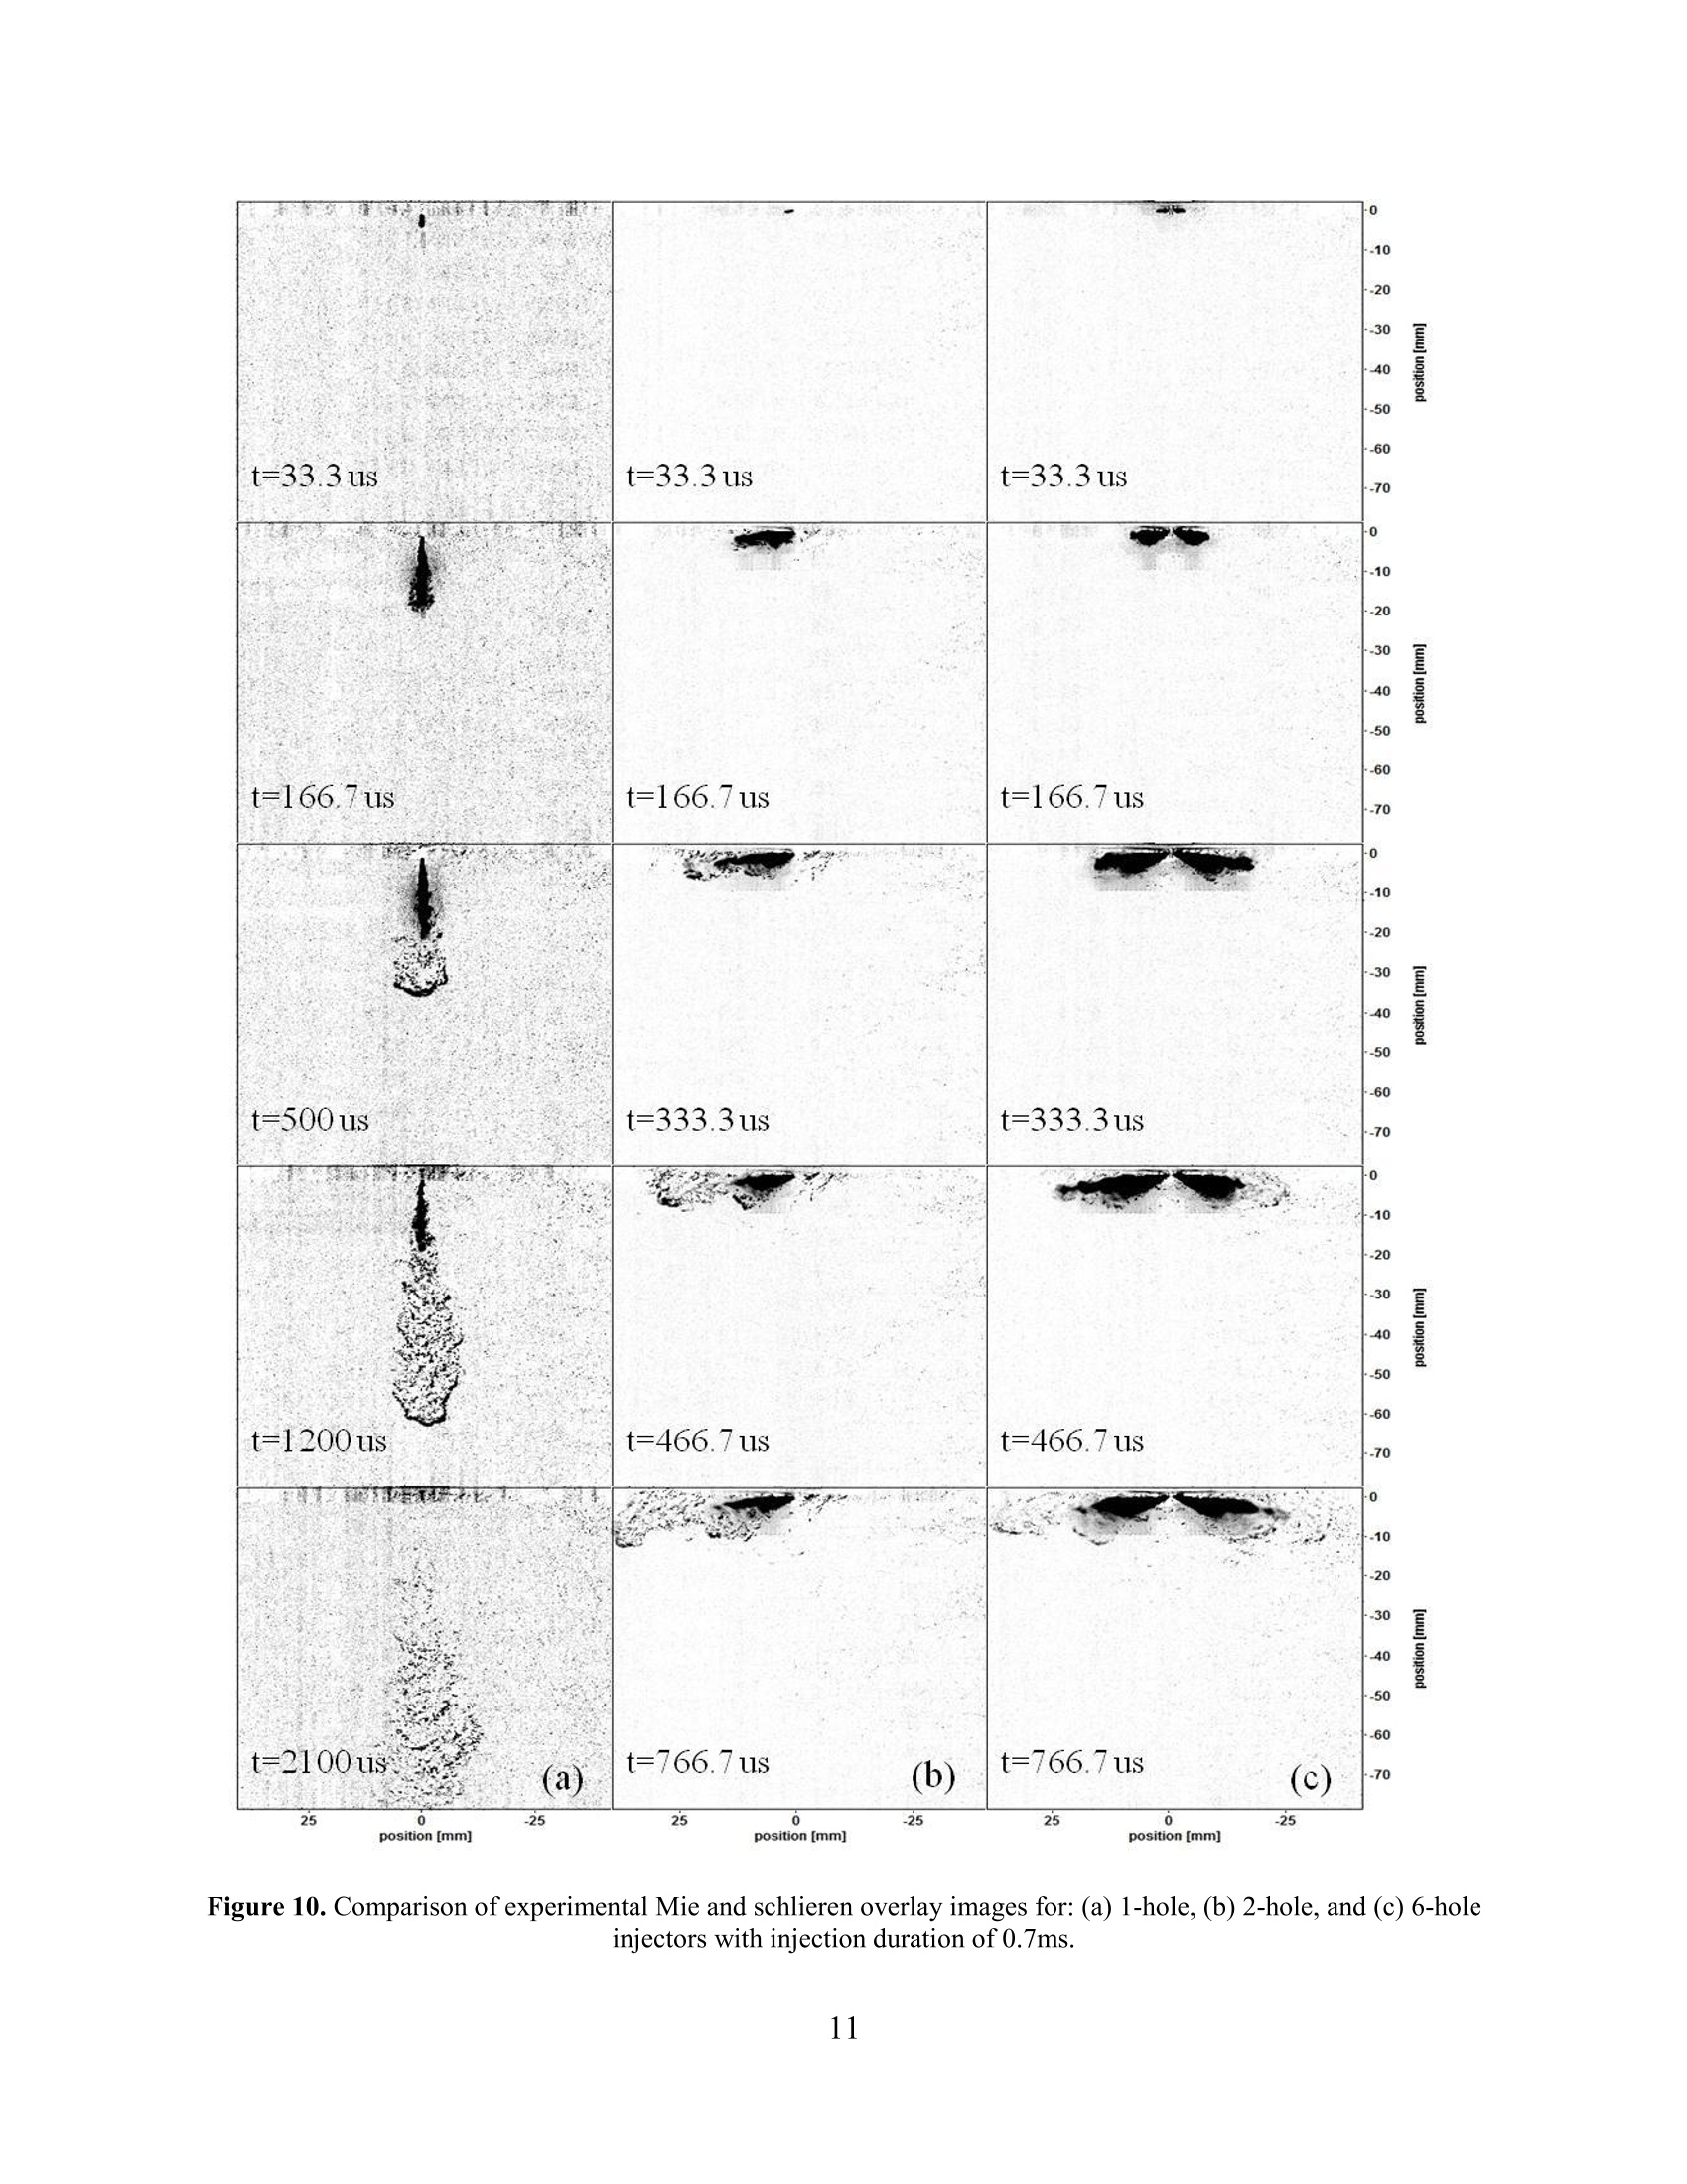
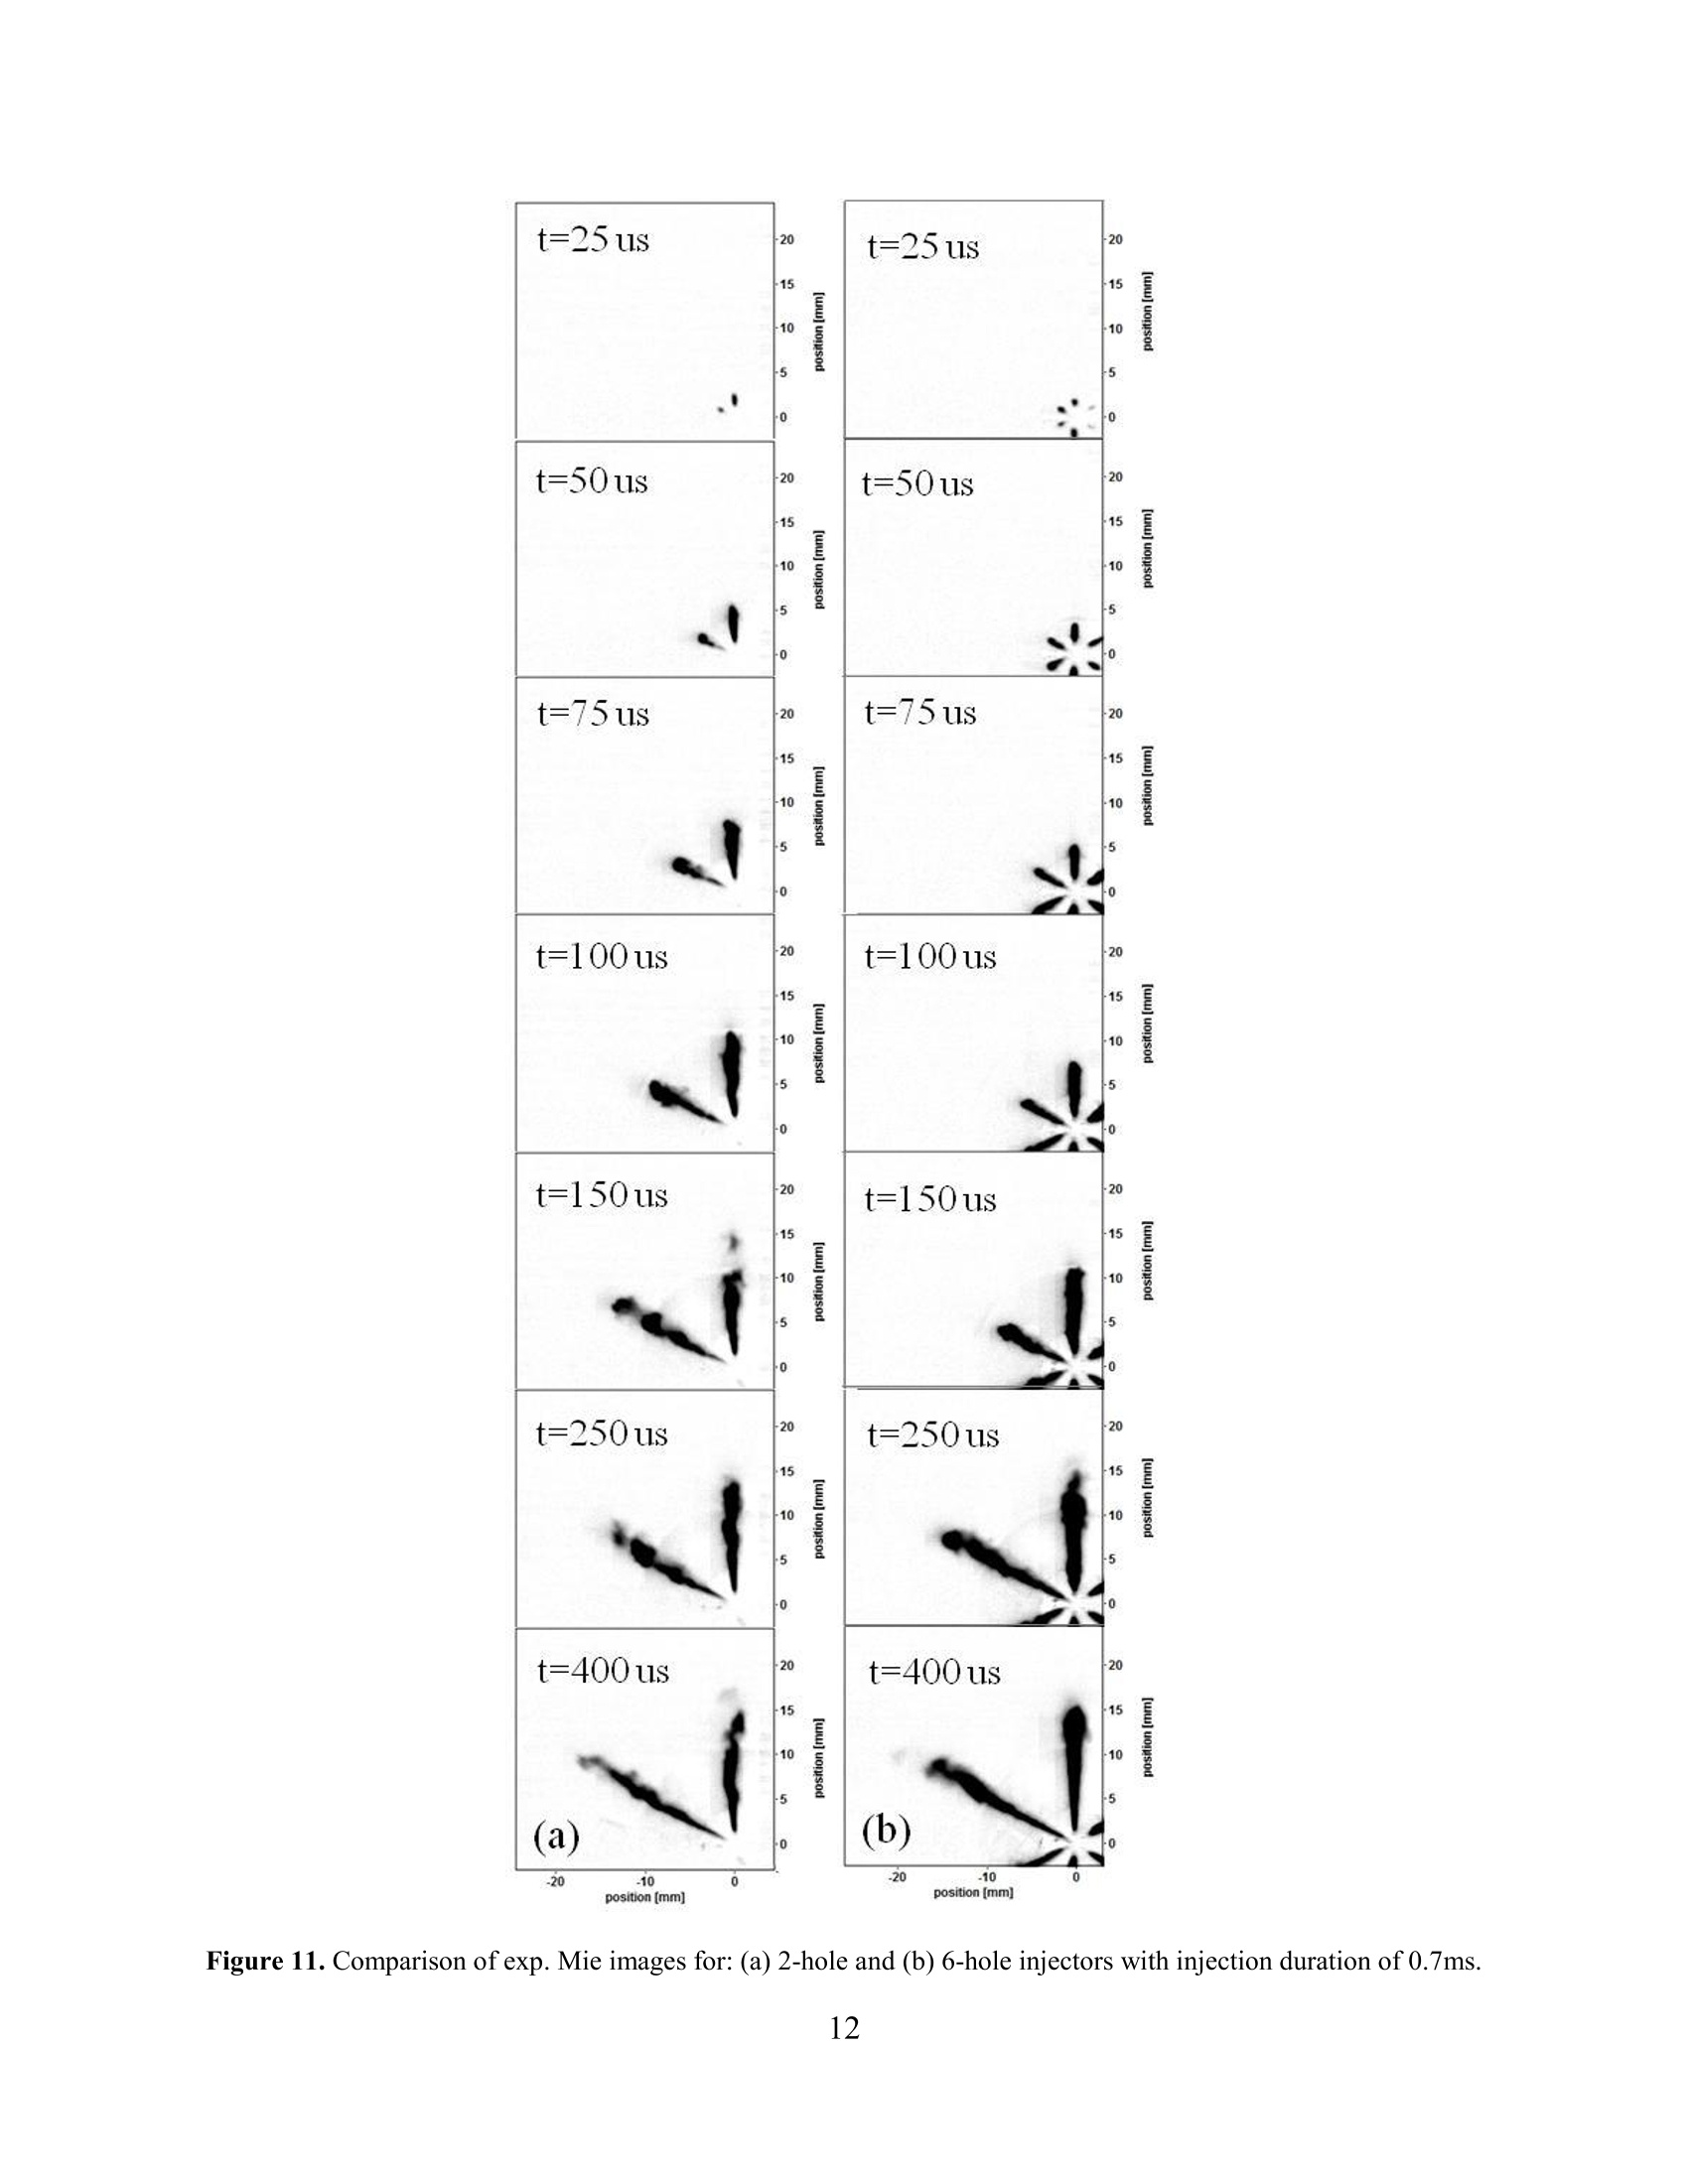
ILASS Americas 26th Annual Conference on Liquid Atomization and Spray Systems, Portland, OR May 2014 The Effect of Fuel Injector Nozzle Configuration on JP-8 Sprays at Diesel EngineConditions Matthew Kurman , Luis Bravo,and Chol-Bum Kweon U.S. Army Research Laboratory, Aberdeen Proving Ground, MD 21005 & Michael Tess University of Wisconsin-Madison, Madison, WI 53706 Abstract The effect of injector nozzle configuration on liquid and vapor penetration lengths of JP-8 sprays was investigated.Non-reacting spray experiments were conducted in a high temperature (900 K), high pressure (60 bar) flow-throughchamber which simulates realistic conditions found in compression-ignition engines. Three different Bosch CRIN3fuel injectors consisting of a 1-hole axial, a 2-hole adjacent (spaced 60°), and a 6-hole (spaced 60°) nozzleconfiguration were used for the study. Prior to conducting the spray studies, each fuel injector was mapped with aninjection analyzer to ensure consistent fuel delivery between injectors. For the experiments, fuel rail pressure wasmaintained at 1000 bar at two different fuel injection durations consisting of 0.45 ms and 0.7 ms, representing lowand high loads. High-speed Mie and schlieren images were acquired and processed using LaVision software for thethree different nozzle configurations. Furthermore, high-speed axial Mie scattering images were acquired for the 2and 6-hole injectors. Results show that the 1-hole and 6-hole injectors have a quasi-steady liquid penetration lengthof 20 mm and for the 2-hole injector the liquid length was 15 mm. Results from the injector mapping revealed thatfuel mass does not scale linearly with the increase in the number of orifices. The liquid penetration rate was similarfor the 1 and 2-hole injectors, however, slower for the 6-hole injector. Plume to plume liquid length variations werepresent for both the 2 and 6-hole injectors. However, the 6-hole presented more variations than the other injectorstested. In addition, a 3D CFD study was conducted to compare modeling to experimental results. Fuel spray studiesinvestigating liquid and vapor penetrations lengths can be useful to increase atomization and vaporization, thusultimately improving combustion and fuel efficiency. Fundammeennttaall physical understanding of sprayatomization process is critical in improving engineperformance and efficiency as well as complying withstrict emissions standardsfor optimum power andreduction of exhaust gases and particulates.Spraytechnology has a wide range of applications in militarytechnologies such as combustion devices found inunmanned aerial systems (rotary and piston engines),aerospace propulsion systems (gas turbine engines), andground vehicle engines (piston engines)[1, 2]. Hence,a detailed characterization of the spray and combustionprocesses is important in driving the understanding anddevelopment of new technologies for single fuelconcept JP-8optimized engines for Army battlefieldoperations. Several detailed studies of the spray process existin the combustion literature focusing on the atomizationand breakup characteristics of engine sprays throughthe use of combustion vessels [3-5]. The EngineCombustion Network (ECN), established through theefforts at Sandia National Laboratories (SNL), hashistoricallytdrivenithe experimentallefforts inquantifying spray parameters with the aim of providinginsights2anddgrowingahigh-fidelity consolidateddatabase atdiesellandgasoline engineerrelevantconditions.An excellent review has been publishedfocusing on the comparison between the operations andcontrol of boundary conditions in Constant-VolumePreburn (CVP) and Constant-Pressure Flow (CPF)chambers while studying a well reported case denotedas Spray A [5]. The Spray A condition was developedin an effort to standardize testing among the ECN groupparticipants and to leverage expertise, while enablingdirect comparison between experiments. Ambientconditions were selected to represent a typical dieselengine combustion event at 900 K, 60 bar (injectionpressure of 1500 bar) at 0%O2 and 15% O2 conditionsfor non-reacting and reacting sprays. Using a CVP chamber and diesel fuel, the effect ofinjector parameters and conditions on liquid and vaporpenetration lengths was reported [6]. It was establishedthat liquid length decreases with a decrease in orificediameter, aniincrease inl2ambient temperature orambient density, and an increase in fuel volatility orfuel temperature. In addition, the liquid length isweakly dependent on fuel injection pressure suggestingthat the change in fuel mass flow rate with the changein injection pressure causes fuel vaporization to changeata similar rate. Empirical modelss (zero order)validatedacross ieveral conditions mainlyyforengineering calculations were proposed...Also at theSpray A condition, work was presented for reacting andnon-reacting CVP chamber spray measurements withJP-8 and diesel fuel to study the effects of the fuel’sphysical/chemical variations on spray parameters [7]. Shorter liquid penetration lengths, when comparedto diesel fuel, were observed due to higher fuel volatility of JP-8 with no apparent effect on vaporlengthaand spreading angle. Ignitiondelaymeasurementswere25%-50%hhigher thandieselindicating strong chemical differences between fuelsand possibly faster mixing of JP-8.In a more recentstudy, experiments were conducted at the Spray Acondition with six fuels including conventional (No. 2Diesel, JP-8, Jet-A), alternative fuels, and a surrogatewith the objective of assessing the performance ofalternative fuelssin diesell engines [81 Severaldifferences in liquid penetration lengths arising fromvariations in fuel volatility and density were reportedwith peak liquid penetration lengths reported with No. 2Diesel (max) and FFischer-Tropsch/surrogate (min).Variations in vapor penetration and spreading angleswere not significant in the observations suggesting themixing and entrainment process among all fuels wasnot significantly affected.儿. In addition to single-hole nozzle studies, multi-holenozzle spray measurements are gaining recent attentionin part due to their direct link with production injectors.An eight-hole injector was used to provide diesel spraysand vaporization was reported [9].The researchshowed significant plume to plume variations in liquidpenetration during the transient and steady phases underrepeated test conditions including a charge temperaturesweep. The asymmetriesffrom peak-to-peakwerereported as 18% for repeat test conditions, and 15% fortemperature sweep tests. The variations were thought toarise from eccentric needle motion (wobble) in thenozzle affecting the distribution of the fuel flow.Although orifice-hole variations in this study were notconsidered a factor in resolving the penetration lengthdifferences, more recent studies have emphasized theimportance of characterizing the injectors in detail. Themethodology for characterization, including high-resolution CT-scan imaging is presented in detail [10,11]. The studies report asymmetric orifice, eccentricbilateral needle: motionand itseffect onliquidpenetration profiles. In this study, 3 different Bosch CRIN3fifuelinjectors consisting of 1-hole axial, 2-hole adjacent, and6-hole fuel injectors are used to provide JP-8 sprays in a900 K temperature, 60 bar pressure environment.Liquid and vapor penetration lengths are analyzed andsprayplume variationsbetween injectornozzleconfigurations are examined. addition.acomputational fluid dynamicss ((CFD)analysisconductedto provideinsightsinto JP-8 sprayinteraction. Experimental Setup JP-8spray experiments wereconducted(1inastainless-steel high temperature pressure vessel (HTPV)flow-through chamber as shown in Figure 1.. TheHTPV is designed to reach a maximum pressure of 150bar and a maximum temperature of 1000 K. However,for the experiments discussed in this study the HTPV was operated at 900 K and 60 bar. These ambientconditionsis arettypical ffor a compression-ignitionengine. The nitrogen is heated by a 2-stage cartridgeheater and a ceramic heater in the inlet section of thevessel. The vessel is equipped with closed-loop controlfor pressure and temperature. Flow through thechamber is held constant at 58.0 m/hr. An on-sitenitrogen generator produced the necessary nitrogen fortesting, which was maintained at 99% purity duringexperiments. To allow for optical access, the vessel isoutfitted with 3 fused silica windows with dimensionsof 147 mm diameter by 85 mm thickness.To protectthe 85mmthick pressure windows ffrom fuelcontamination or flames (during combustionexperiments), 6 mm thick fused silica windows areplaced betweenthe 85 mm windowsandtthespray/combustion zone. High-speed near simultaneous Mie and schlierenimages were acquired with a Photron SA5 camera,operating at 60,000 fps, equipped with a 100 mm ZeissMakro-Planar f/2 prime lens. For the experimentspresented, image size was set to 320 by 320 pixels andthe corresponding scaling was 0.25 mm/pixel.TheMie/schlieren system consists of a folded z-typearrangement in which the liquid portion of the spraycan be detected by Mie scattering of the light and thevapor boundary of the evaporated spray can be imagedby the schlieren system. The experimental diagnosticsare shown in Figure 1. Camera exposure time for therecordings was set to 16 us. Mie and schlieren imageswere near simultaneously acquired utilizing a framestraddling technique similar to the method described inother work [12]. A representative timing diagram isshown in Figure 2. This imaging technique allows foralternating light sources, with a light duration of 10 usfor the Mie scattering and 5 us for the schlieren images,to be used during the recording. Light for the schlierenimages is produced from a single LED, and then isdiffused through a 1500 grit ground glass diffuser toeliminate the structure of the LED source. The diffusedlight is focused to a point by using a 40 mm asphericcondenser lens and an adjustable aperture is used toadjust the size of the point source..The light is thencollimated by a 152.4 mm diameter, f/8 parabolicmirror and directed to a 152.4 mm flat folding mirroraligned to project the collimated light into the HTPV.The light reaches another 152.4 mm diameter flatmirror and is directed to an additional152.4 mmdiameter, f/8 parabolic mirror that projects the light to arazor blade knife edge and the high speed camera.Light for the Mie scattering images is provided by a 24LED array light source that is placed at a slight anglefrom the axial position of the fuel injector. ’Timing ofthe camera system and light sources is controlled by aDG645 digital delay/pulse generator which is triggeredfrom the fuel injector command. In addition, axial Miescattering experiments were conducted with the 2-holeand 6-hole injectors to image the liquid portion of the spray at a higher frame rate and a larger pixel to lengthratio).. FFor the axial Mie experiments presented, thecamera was operated at 80,000 fps with a resolution of256 by 256 pixelIsSwith the same lens previouslymentioned. For this setup, the corresponding scalingwas 0.11 mm/pixel. The LED array was used as thelight source for the experiments and was orthogonal tothe camera. In order to compare axial images of the 6-hole to the 2-hole, the region of interest on the 6-holeinjector was the spray plumes that correspond to the 2plumes on the 2-hole injector. Figure 1. High temperature pressure vessel facilityshown with Mie and schlieren diagnostics. Image Analysis Image processing was conducted with LaVisonDaVis imaging software. During the experiments, theschlieren system was adjusted with a large light cutoffto increase the sensitivity of the system. With anincrease insensitivity,y,background(or unwantedschlieren effects were present.t.These effects can beremoved during the post-processing analysis.Background subtraction was conducted with the rawimage by subtracting the image prior to the start ofinjection..In addition, background subtraction of theframe prior to the frame of interest was conductedsimilarly to the method described elsewhere [13]. Thiseliminates the background schlieren effects for theschlieren images.Background subtraction was alsoconducted for the Mie images to remove any unwantedlight reflections from the injector tip and injectorholder. A 3% threshold was applied to the resultingimage to determine the penetration limits. Figure 2. Timing diagram showing the camera syncsignal and Mie and schlieren light source durations. Fuel Injection System and Injector Characterization The fuel injection system consists of a high-pressure fuel bench connected to a common rail. Thehigh-pressure fuel bench contains an OEM fuel pumpwhich is operated by an electric motor. Maximum fuelrail pressure for this fuel bench system is set at 1800bar and is maintained constant by closed-loop control.For the experiments presented, fuel rail pressure washeld constant att1000 bar. The motor speedl ismaintained by a variable frequency drive. Fuelinjection events were controlled by a Drivven directinjector (DI) driver system. Total energizing times forthe presented experiments were 450 us and 700 us.Current profiles of the injectors were measured with acurrent probe connected to an oscilloscope with arecording time step of 1 us. Table 1 shows the injectorsettings used for this study. Stage 2 3 Set Current [A] 23 15 11 Upper Current [A] 23.5 15.5 11.5 Lower Current [A] 22.5 14.5 10.5 Duration [ms] 0.13 0.3 balance Table 1. Injector current and time settings. The Bosch CRIN3 fuel injectors tested in this studyconsisted of 3 different injectors each having a differentnozzle configuration. The nozzles were OEM and weremodified for different configurations.S. Each orificediameter was 147 um. The nozzle configurationsinclude a 1-hole, 2-hole adjacent with 60°separation,and a 6-hole spaced 60° separation. For the 1-holenozzle all stock 6-holes were welded and an axialorifice was created by electrical discharge machining(EDM). For the 2-hole adjacent nozzle, 4 holes werewelded and the other 2 remained unchanged. Nomodifications to the 6-hole injector were performed.Before conducting the experiments with the 2-hole and 6-hole injectors, the injector was oriented so that anorifice was in the vertical direction inside the HTPV. Prior to testing in the HTPV, each fuel injector wastested and mapped in an IAV fuel injection analyzer todetermine the injected ffuel mass. The injectionanalyzer operates on the principle that the mass of fuelis related to the speed of sound in the fluid by thefollowing relationship, where At is the cross-sectional area of the tube, a is thefluid sound speed, and p(t) is the dynamic pressure asa function of time in the tube. 100 shot averages of theinjected fuel mass and rate of injection profiles wereacquired with the injection analyzer.In addition, tosupplement the injected fuel mass results from theinjection analyzer, a precision scalewasusedtomeasure the injected fuel mass from each injector. Thescale method does not provide a shot to shot analysisand only provides an average of the total injections.For this study, 200 shots were used to determine theaverage. Numerical Simulations The numerical simulation solver, CONVERGEdeveloped by Convergent Science, Inc., has beenadopted andl utilized here for themodeling ofevaporating sprays. CONVERGE is a compressibleNavier Stokes solver based on a first-order predictor-corrector time integration scheme, featuring a choice ofsecond or higher order finite volume schemes forspatial discretization. An efficient geometric multi-gridtreatment is used to solve the pressure equation in anon-staggered, collocated, computational gridframework. Domain parallelizationis based oonimplementations of OpenMPI or Message PassingInterface (MPI) protocols.It provides the option ofincreasing resolution locally and dynamically by way ofAdaptive MeshRefinement((AMR))activated andcontrolled throughuser specified criteria. Spraymodeling in this work, is achieved by making use ofEularian Lagrangian formulations based on KelvinHelmholtz - Raleigh Taylor (KH-RT) model.Thesolver also provides several modeling options for thetreatment of tturbulence, iincluding largee6eddysimulation (LES), and Reynolds Average Navier Stokes(RANS) models. In this study, numerical simulations have beencarried out in an effort to present additional informationof the underlying dynamics found in evaporatingsprays.5.Both cases, 1-hole and 2-hole nozzles, havebeen considered to report on the spray formationprocess in terms of global diagnostics, liquid and vaporlength, for the injection duration of 0.7 ms. A liquidfuel surrogate, denoted Modified Aachen, has beenadopted in this study to model JP-8 properties.In a related1 study,, surrogateshavebeeninterrogatedshowing good (overall agreementtandsimilaratomization behavior [14]. A resolution level of dx =0.0625 mm cell size, an embed scale of 5, with totalinjected 800,000 particles has been utilized with a valueof nozzle-to-grid ratio of 2.352. For all studies,a high-resolution LES approach was utilized making use of upto 9 LES cycles to conduct averaging for shot-to-shotquantities. The approach was based on previous workwhere it was reported that a total of 9 cycles wereneeded as the minimum number ofLES realizations tomaintain a reasonable representation of the averagespray behavior for the Spray A configuration.Theaverage of 9 LES realizations yields absolute errors ofless than +/- 2.0 m/s for velocity and 0.005 for mixturefraction, 95% of the time [15]. Computed Tomography of Injector Nozzles Characterization of the internal geometry of thefuel injectors was conducted by utilizing computedtomography (CT))imaging. Nozzlescans wereperformed using a Nikon Metrology 225 kV Ultra-Focus CT system containing a 16-bit Perkin ElmerXRD1620 detector panel. The scans were run at 220kV and the time was approximately 20 minutes pernozzle. Voxel resolution for each nozzle was 28.5 um.Rendering of tthe scans Was conducted usingVGStudiMAX2.2. Results and Discussion Figure 3 shows the current profiles of each injectorused for the experiments presented in this paper..Asmentioned, an oscilloscope was used to measure thecurrent profile at 1 us time steps and the injectorsettings are listed in Table 1. For both energizing timesof 0.45 ms and 0.7 ms, the current profiles matchbetween the different injectors and was repeatable.Both time durations show similar profiles; however, thefinal set current of 11 A is reduced for the 0.7 msduration. Figure 4 shows the rate of injection profilesfor all 3 injectors at energizing times of 0.45 ms and 0.7ms, respectively. For the duration of 0.7 ms, all 3injectors rate of injection profiles start and end near thesame times. However, for the shorter duration of 0.45ms, as shown in Figure 4 (a), the 6-hole injection rateappears to end before the 1-hole and 2-hole. Furtherwork is underway to address this behavior.Eventhough this behavior is observed with the injectionanalyzer and the injection rates appear different, themeasured mass exiting the nozzle is similar to themeasured mass from the scale method as highlighted inTable 2..Figure 4 also shows the average currentduring the injection event. The average current plottedin Figure 4 is sampled through the injection analyzersystem. The results of the average current are similarbetweeneach injector forbothh energizing timedurations. Figure 3. High-resolution current profiles for: (a) 450us and (b) 700 us durations. TimeAfter Injection Command[ms] Figure 4. Rate of injection profiles for: (a) 450 usduration and (b) 700 us duration. Table 2 shows the results of the injected fuel massfrom the injection analyzer and the scale method.Initially, fuel mass was measured with an IAV injectionanalyzer utilizing the Bosch tube method. It wasexpected that the fuel masss would scale with the increase in the number of orifices, considering the fuelinjectors were driven with identical current profiles.Results show that the scaling expectation does not holdfor the injectors. For example, between the 1-hole and2-hole, the injected fuel mass for the 2-hole at 450 usduration is 1.5 times the amount of mass for the 1-hole.and 1.6 times for the 700 us duration. Similarobservations were noted comparing the 2-hole to the 6-hole for the 450 us duration; however, at the largerduration of 700 us, the 6-hole was 2.7 times the amountof fuel as the 2-hole. In order to eliminate the probability that theinjection analyzer was the cause of the discrepancy,additional testing was conducted with a high-precisionscale to measure the fuel mass. The scale method, asmentioned previously, is an average of 200 shots and isnot a measurement of each shot to shot. Caution wastaken to not allow any fuel to escape from the collectioncontainer during injection. Table 2 shows the results ofmeasuring the fuel mass with the scale. Comparing thetwo mass measuring methods, similar results arepresent,tlthus providingconfidence that themeasurements with the injection analyzer are proper.Internal flow geometries are different between the 1-hole and the 2-hole/6-hole, with the fuel exiting at thetip for the 1-hole and exiting the sides for the 2-hole/6-hole. These different flow patterns may contribute tothe non-linear scaling effect observed.The 2-holenozzle fuel mass may be affected by uneven pressurenear the needle due to the fuel exiting on one side of thenozzle. Clearly, from the results shown, the fuel massdoes not linearly scale according to the number ofinjector holes. Main Rail 1-Hole: Inj. 1-Hole: Scale 200 Duration Pressure Analyzer 100 Shot Shot Average us| [barl Average [mg/shot] [mg/shot] 450 1000 5.74 5.23 700 1000 7.05 6.65 us| [barl Average [mg/shot] [mg/shot] 450 1000 8.62 8.08 700 1000 11.52 11.41 us| barl Average [mg/shot][mg/shot] 450 1000 15.03 14.21 700 1000 31.33 32.07 Table 2. Fuel mass from the injection analyzer andscale method for the 1-hole, 2-hole, and 6-hole injector. Results of the liquid and vapor penetration lengthsfor the 1-hole, 2-hole, and 6-hole injectors are presented in Figures 5-7. In the figures, graph (a) represents the0.45 ms duration and graph (b) represents the longerduration of 0.7 ms. Error bars on the graphs are thestandard error in the measurement corresponding to thefollowing relation, ±2o/√N, where is the standarddeviation and N is the number of experiments. For thestandarderrorrcalculation, 5 experiments wereconducted for each data point.. FFigure 5 shows theaverage penetration lengths for the 1-hole injector. Thefuel quantity injected per shot was 5.74 mg and 7.05 mgfor the 0.45 ms and 0.7 ms duration, respectively. Afterthetransientstage,,quasi-steady state occursatapproximately 0.20 ms after the start of injection, witha liquid length of 20 mm, for both durations. The vaporpenetration length continues to increase after liquidlength stabilizes. Figure 5. Liquid and vapor penetration lengths for the1-hole inj., for durations of (a) 0.45 ms, (b) 0.7 ms. The average liquid and vapor penetration lengthsfor the 2-hole injector are plotted in Figure 6. Only thevertical plume for the 2-hole injector is plotted inFigure 6, as the adjacent hole was behind the verticalplume during imaging. The total fuel quantity injectedfrom both orifices was 8.62 mg and 11.52 mg for the0.45 ms and 0.7 ms durations, respectively. Per orifice,an average of 4.31 mg, and 5.76 mg, was injected foreach duration of 0.45 ms and 0.7 ms, respectively. Forboth injection durations, liquid length approaches a quasi-steady state length of 15 mm at approximately0.20 ms after the start of injection. The injected fuelmass between the 0.45 ms duration for the 1-hole andthe fuel mass of the 0.7 ms case, for each orifice, issimilar. JHowever, the liquid penetration lengths areclearly differenttwithh the2-hole injector beingapproximately 5 mm shorter.Unlike the 1-hole case.anincrease in variability is present in the liquidpenetration length. During analysis of the raw images,the liquid length appears to increase in one frame, andthen decrease in the next. The vapor penetration lengthcontinues to steadily increase after liquid penetrationreaches quasi-steady state. To note, at approximately0.85 ms after start ofinjection, the vapor penetrationlength reaches the limit of the viewing area within thehigh temperature pressure vessel.In Figure 6, thevapor penetration length appears to reach a steady state;however, this is due to the viewing limit of the chamberand it is expected that the vapor penetration lengthwould continue to increase. Figure 6. Liquid and vapor penetration lengths for the2-hole inj., for durations of (a) 0.45 ms, (b) 0.7 ms. Figure 7 shows the liquid and vapor penetrationlengths for the 6-hole injector. Similarly with the 2-hole injector, one vertical plume was analyzed for theresults presented. The total fuel quantity injected from all 6 orifices was 15.03 mg and 31.33 mg for the 0.45ms and 0.7 ms duration, respectively. This correspondsto approximately 2.5 mg and 5.2 mg per shot for eachorifice and for each duration.1. The rate that thepenetration increases islower for the 6-hole thancompared to the 1-hole and 2-hole injectors. For bothdurations, quasi-steady liquid penetration length occursat a much longer time of approximately 0.45 ms afterstart of injection compared to the 1-hole and 2-holeinjectors. Figure 7. Liquid and vapor penetration lengths for the6-hole inj., for durations of (a) 0.45 ms,(b) 0.7 ms. The injected fuel per orifice for the 0.7 ms duration issimilar to that of the 2-hole, 0.7 ms duration case, 5.22mg and 5.76 mg. However, the 6-hole liquidpenetration length is longer than the liquid penetrationlength for the 2-hole. Also noticeable is a suddendecrease in liquid penetration length for the 6-holeinjector near 0.5 ms. In this time regime, fluctuationsin the liquid penetration lengths were present.Eccentric needle lift can be a contributing factor in thevariations observed in penetration lengths. The vaporpenetration length continued to increase once the liquidpenetration length reached quasi-steady state. The rateof vapor penetration growth is similar to the rate ofliquid length growth for the 6-hole injector. However, the vapor penetration rate tends to decrease with the 1-hole and 2-hole injectors. As with the 2-hole injector,the 6-hole vapor penetration length reaches the outerlimit of the viewing area in the HTPV near 0.85 msafter start of injection. As mentioned earlier, additional experiments wereconducted from the axial position for the 2-hole and 6-hole injectors.During these experiments only theliquid portion of the spray was imaged with Miescattering diagnosticswithh the high-speed cameraoperating at 80,000 fps.5.With this orientation andhigher frame rate more details of the spray dynamicscan be observed. Figures 8 and 9 show the results forthe 2-hole and 6-hole injectors for both injectiondurations of 0.45 ms and 0.7 ms. In addition, plotted onthe graphs is the liquid penetration length from thepreviously mentioned Mie and schlieren experiments.This is denoted as Top M&S in the legend. For theaxial Mie scattering experiments both spray plumes forthiee 2-holeare plotted. For the 6-hole injectorexperiments, only the two plumes that have the similarorientation of the 2-hole injector are plotted. Figure 8(a) shows the 2 plumes for the 0.45 ms duration. Bothplumes have similar transient behavior; however, thequasi-steady liquid penetration length is longer byapproximately 2 mm throughout the steady regime. Inaddition, since the frame rate is much higher for thesesets of experiments, fluctuations in liquid penetrationlength can be observed. For the 0.7 ms duration case,as shown in Figure 8 (b), similar transient behavior ispresent, and there is less variability in the quasi-steadystate regime..The liquid penetration length from theMie and schlieren experiments is in general agreementwith the presented axial results. 22 Figure 8. Liquid penetration lengths for the 2-holeinjector, for durations of (a) 0.45 ms, (b) 0.7 ms. Figure 9 shows the liquid penetration length fromthe 6-hole injector. In addition, the vertical plume,identified as Top M&S, from the Mie and schlierenexperiments is also plotted.The quasi-steady liquidpenetration lengths for both durations areapproximately 20 mm. However, significant variationsin penetration length are observed...An interestingobservation from the experimentsis that atapproximately 0.35 ms after the start of injection, adecrease in liquid length occurs. This behavior couldbe attributed to non-uniform pressure regions and/oruneven flow patterns inside the nozzle caused by needlewobble. Analyzing the images from the Mieexperiments, this behavior is evident. The spray plumelength grows and then at this time, the length decreases,and then suddenly increases up to the quasi-steady stateregime. As mentioned, variations were observed withthe 2-hole injector; however, not as significant as withthe 6-hole injector. Figure 9. Liquid penetration lengths for the 6-holeinjector, for durations of (a) 0.45 ms, (b) 0.7 ms. Figures 10 and 11 show the processed images forthe Mie and schlieren experiments with all injectors andthe axial Mie experiments for the 2-hole and 6-holeinjectors. The images presented are for the 0.7 msinjection duration case. The vertical plume is the plumeoriented to the left in the images for Figure 10 and forFigure 11 the vertical plume is oriented vertically. Forboth figures, the liquid regime appears dark on theimages, whereas the vapor regime in Figure 10 appearslighter. Visual analysis of the image sets to investigateplume to plume interaction reveal that the plumes tendto not interact with one another. CFD Results For the 1-hole nozzle study, the numerical resultsshow very good agreement with the liquid phasepenetration profiles as shown in Figure 12.. Thediscrepancies observed in vapor phase profiles are dueto the vapor length calculation model that presentlyonly accounts for the prevalent single component fuel(and not the mixture). Because the surrogate iscomposed of 80% n-dodecane and 20% tri-methyl-benzene, we can expect variations with the measureddata. Figure 12. Comparison of exp. and CFD penetrationlengths for the 1-hole injector for 0.7 ms duration. Th dataispresented in Figure 13 for the vertical spray plume andis compared to experimental results.. The modelingresults show variations in liquid penetration lengthwhen compared to experiments. When comparing to 1-hole peak liquid penetration magnitude (20 mm), the 2-hole model shows no apparent effect maintaining theapproximately same value of 20 mm. Physically thiswould indicate that the nozzle orifice distance (1 mm)and spacing of 60°prevents them from interacting inthis configuration.CCurrent work is underway toinvestigate this effect further and determine whetherthis issue is numerical or is a realistic representation ofthe physics. However, the physical behavior, spraystructure and propagation is captured accurately by themodel. Similar observations are made with vapor phaseprofiles, where the model’s ability to calculate vaporline based on fuel mass fraction of the mixture will beaddressed. Figure 14 shows the comparison of CFDimages with the experimental images for both the 1-hole and 2-hole, 0.7 ms injection duration. In addition,modeling work with the 6-hole injector is underway. Figure 13. Comparison of exp. and CFD penetrationlengths for the 2-hole injector for 0.7 ms duration. Results of the CT imaging are shown in Figure 15.The top row highlights the rendering of the CT scanswhile the bottom row shows a CT scan bisectingthrough the orifices. Figure 15 (a) shows the slice ofthe 1-hole nozzle. In the image, it is clear that theneedle is not fully engaged inside the nozzle. All threenozzles were disassembled from the injector body fortesting, and the 1-hole needle was not fully inserted intothe nozzle during the CT scan. Furthermore, theorientation of the axial hole drilled into the end of the1-hole nozzle is not in the center. In both Figure 15 (a)and (b), the welds on the outside of the nozzle areprotrudes more than halfway into an orifice. Therendered image for the 6-hole, top of Figure 15 (c),shows 3 visible orifices. The other 3 orifices are not viewable in the current orientation. In addition, the toprendered images show the orientation of the injectornozzle inside the HTPV during testing. Other slicesand views of the internal geometry of the injectornozzles are under analysis to reveal variations that maylead to differences observed in the results presented inthis study. Overall, the CT images will be useful indetermining variations of internal geometry. Conclusions inthiswork,JP-8 sprayy experiments wereconducted at elevated pressure and temperature withMie and schlieren diagnostics to investigate nozzleconfigurations with a 1-hole, 2-hole, and 6-hole BoschCRIN3 fuel injector at two different fuel injectiondurations consisting of 0.45 ms and 0.7 ms. Liquid andvapor penetrationi lengthsfor the injectorswereacquired. In addition, a CFD study was conducted tocompare the penetration lengths for the 1-hole and 2-hole fuel injectors.Findings from this study are asfollows: ·Fuel mass does not scale linearly with the increasein the number of orifices between injectors. At the conditions tested, the 1-hole and 6-holeinjectors both have a quasi-steady liquid penetrationlength of 20 mm. The 2-hole injector has a liquidpenetration length of 15 mm. ●The injected fuel mass for the 0.45 ms duration ofthe 1-hole injector was similar to that of the 0.7 msduration of the 2-hole injector. However, the liquidpenetration lengths are clearly different with the 2-hole injector being approximately 5 mm shorter. · The rate of penetration length between the 1-holeand 2-hole injectors was similar based on visualanalysis of the data. However, the penetrationlength rate for the 6-hole injector was slower. ●The quasi-steady state liquid length for the 2-holeinjector varied by 2 mm between plumes. ●The 6-hole injector had significant more variationsin liquid length than the 1-hole and 2-hole injectors. CFD studies for 1-hole liquid length show goodagreement with liquid and vapor lengths and wereuseful in extracting spray kinematics. However,differences are observed for the 2-hole liquid lengthwhen compared to experiments, with the modelpredicting a value of 20 mm for both plumes. BothCFD vapor profiles show a general trendbutimprovementsto the model willsimulatetheexperimental results to a higher degree. · CTscanswillaiddiin1 characterizing1internalgeometry of injector nozzles. Acknowledgements ThissrresearchhWassupportedinparttbyanappointment to the U.S. Army Research LaboratoryPostdoctoral Fellowship program administered by Oak Ridge Associated Universities through a contract withthe U.S. Army Research Laboratory. We gratefullyy2acknowledgethecomputingresources provided on“Pershing”,a 1260 node (20,160cores, 40 TB of memory) computer cluster operated byU.S. Army Research Laboratory Department oofDefense Super Computing Resource Center (ARL-DSRC). In addition, we would like to acknowledge Dr. TimEdwards of the Air Force Research Laboratory forsupplying the JP-8. References 1. Reitz, R.D., Combustion and Flame160:1-8(2013). 2. Kweon, C.-B.M., “A Review of Heavy-FueledRotary Engine CombustionTechnologies,”USArmyResearchLaboratoryTTechnicalReport,ARL-TR-5546, May 2011. 3. Pickett,, ] L.M.,Genzale,, C.L., Bruneaux,G..Malbec, L.-M., Hermant, L., Christiansen, C.,Schramm,J., SAE 2010-01-2106(2010). ( 4. Bazyn,T T., and d M a rtin, G .C., 2 3rd Annual Conference o n Liquid Atomization and S praySystems, Ventura, California, May 2011. ) 5. Meijer, M., Somers,B., Johnson, J., Naber, J., Lee,S.-Y., Malbec, L.M., Bruneaux, G., Pickett, L.M.,Bardi, M., Payri, R., Bazyn, T., Atomization andSprays 22:777-806 (2012). 6Siebers, D.L., SAE 980809(1998).7 Pickett, L.M., and Hoogterp, L., SAE 2008-01-1083 (2008). 8. Kook, S., and Pickett, L.M., Fuel 93:539-548(2012). 9. Nesbit, J.E., Naber, J.D., Lee, S.-Y.,Kurtz, E., Ge,H.-W., Robarge, N., 23rd Annual Conference onLiquid Atomization and Spray Systems, Ventura,California, May 2011. ( 10. Kastengren, A .L., Tilocco, F . Z., P o well, C . F.,Manin, J . , P ickett, L .M., P a yri, R., B a zyn, T. , Atomization and Sprays 22:1011 - 1052 (2012). ) 11. Malbec, L.-M., Egusquiza, J., Bruneaux,G..Meijer, M., SAE 2013-24-0037 (2013). 12. Parrish.S.E., and Zink,:, R.J.,23rddAnnualConference onLiquid Atomization andSpraySystems, Ventura, California, May 2011. 13. Pickett, L.M., Kook, S., Williams, T.C., SAE 2009-01-0658 (2009). 14. Bravo, L., Kurman, M., Kweon, C., Submitted tothe 26th Annual Conference on Liquid Atomizationand Spray Systems,Portland, Oregon, May 2014. 15. Senecal, P.K., Pomraning, E., Xue, Q., Som, S.,Banerjee,, S., Hu,B.,, Liu, K., Deur, J.M.,Proceedings of the ASME 2013 InternalCombustion EngineDivisionFallTechnicalConference,Dearborn, Michigan, October 2013. 08t=33.3us t=33.3us t=33.3 us t=166.7 us t=166.7us t=166.7us t=500us t=333.3us t=333.3us t=1200us t=466.7us t=466.7us t=2100us(a) t=766.7us (b) t=766.7usc) position [mm] position[mm] Figure 10. Comparison of experimental Mie and schlieren overlay images for: (a) 1-hole, (b) 2-hole, and (C) 6-holeinjectors with injection duration of 0.7ms. position [mm] position [mm] Figure 11. Comparison of exp. Mie images for: (a) 2-hole and (b) 6-hole injectors with injection duration of 0.7ms. t=25 us 20 t=25 us 20 15 15 -10 EEE oc e 10 5 0 10 t=50us 20 t=50 us -20 15 -15 Eoc10Ec一 10 o a 5 -5 -0 -0 t=75 us 20 t=75 us -20 15 -15 EE 10 Eco110 -0 -0 t=100 us 20 t=100us 15 EEo10E 10u oa 5 -0 -0 t=150 us 20 t=150us -20 -15 15 c cE o-10E一 -5 -0 -0 t=250us 20 t=250 us 20 15 -15 EEco10 10oa 5 -0 -0 t=400 us 20 t=400 us -15 15 -10 c o 10 EEco5 -0 c) 0 (d) -20 -10 35-30 -25 -20 -15 -10 -5 0 position [mm] position (mm) Figure 14. CFD comparison to exp. images in columns: (a) 1-hole CFD, (b) 1-hole exp., (c) 2-hole exp., (d) 2-holeCFD. Figure 15. Select rendered CT scans (top) and CT slices (bottom) for the fuel injectors: (a) 1-hole, (b)2-hole, (c)6-hole. Corresponding author: matthew.s.kurman.civ@mail.mil The effect of injector nozzle configuration on liquid and vapor penetration lengths of JP-8 sprays was investigated. Non-reacting spray experiments were conducted in a high temperature (900 K), high pressure (60 bar) flow-through chamber which simulates realistic conditions found in compression-ignition engines. Three different Bosch CRIN3 fuel injectors consisting of a 1-hole axial, a 2-hole adjacent (spaced 60°), and a 6-hole (spaced 60°) nozzle configuration were used for the study. Prior to conducting the spray studies, each fuel injector was mapped with an injection analyzer to ensure consistent fuel delivery between injectors. For the experiments, fuel rail pressure was maintained at 1000 bar at two different fuel injection durations consisting of 0.45 ms and 0.7 ms, representing low and high loads. High-speed Mie and schlieren images were acquired and processed using LaVision software for the three different nozzle configurations. Furthermore, high-speed axial Mie scattering images were acquired for the 2 and 6-hole injectors. Results show that the 1-hole and 6-hole injectors have a quasi-steady liquid penetration length of 20 mm and for the 2-hole injector the liquid length was 15 mm. Results from the injector mapping revealed that fuel mass does not scale linearly with the increase in the number of orifices. The liquid penetration rate was similar for the 1 and 2-hole injectors, however, slower for the 6-hole injector. Plume to plume liquid length variations were present for both the 2 and 6-hole injectors. However, the 6-hole presented more variations than the other injectors tested. In addition, a 3D CFD study was conducted to compare modeling to experimental results. Fuel spray studies investigating liquid and vapor penetrations lengths can be useful to increase atomization and vaporization, thus ultimately improving combustion and fuel efficiency.
确定


还剩12页未读,是否继续阅读?

产品配置单


北京欧兰科技发展有限公司为您提供《柴油JP-8喷嘴中燃料注入喷嘴结构对JP-8喷雾性能的影响检测方案(激光粒度仪)》,该方案主要用于汽车电子电器中理化分析检测,参考标准--,《柴油JP-8喷嘴中燃料注入喷嘴结构对JP-8喷雾性能的影响检测方案(激光粒度仪)》用到的仪器有LaVision SprayMaster 喷雾成像测量系统、汽车发动机多参量测试系统、LaVision HighSpeedStar 高帧频相机、LaVision DaVis 智能成像软件平台
推荐专场


CCD相机/影像CCD
更多


该厂商其他方案
更多