


方案详情
文
采用LaVision公司以增强型CCD相近非核心部件搭建的平面激光诱导荧光系统(PLIF)对发动机气缸内进行激光诱导荧光(LIF)测量时对激光吸收的一种修正方法进行了探索和研究
方案详情

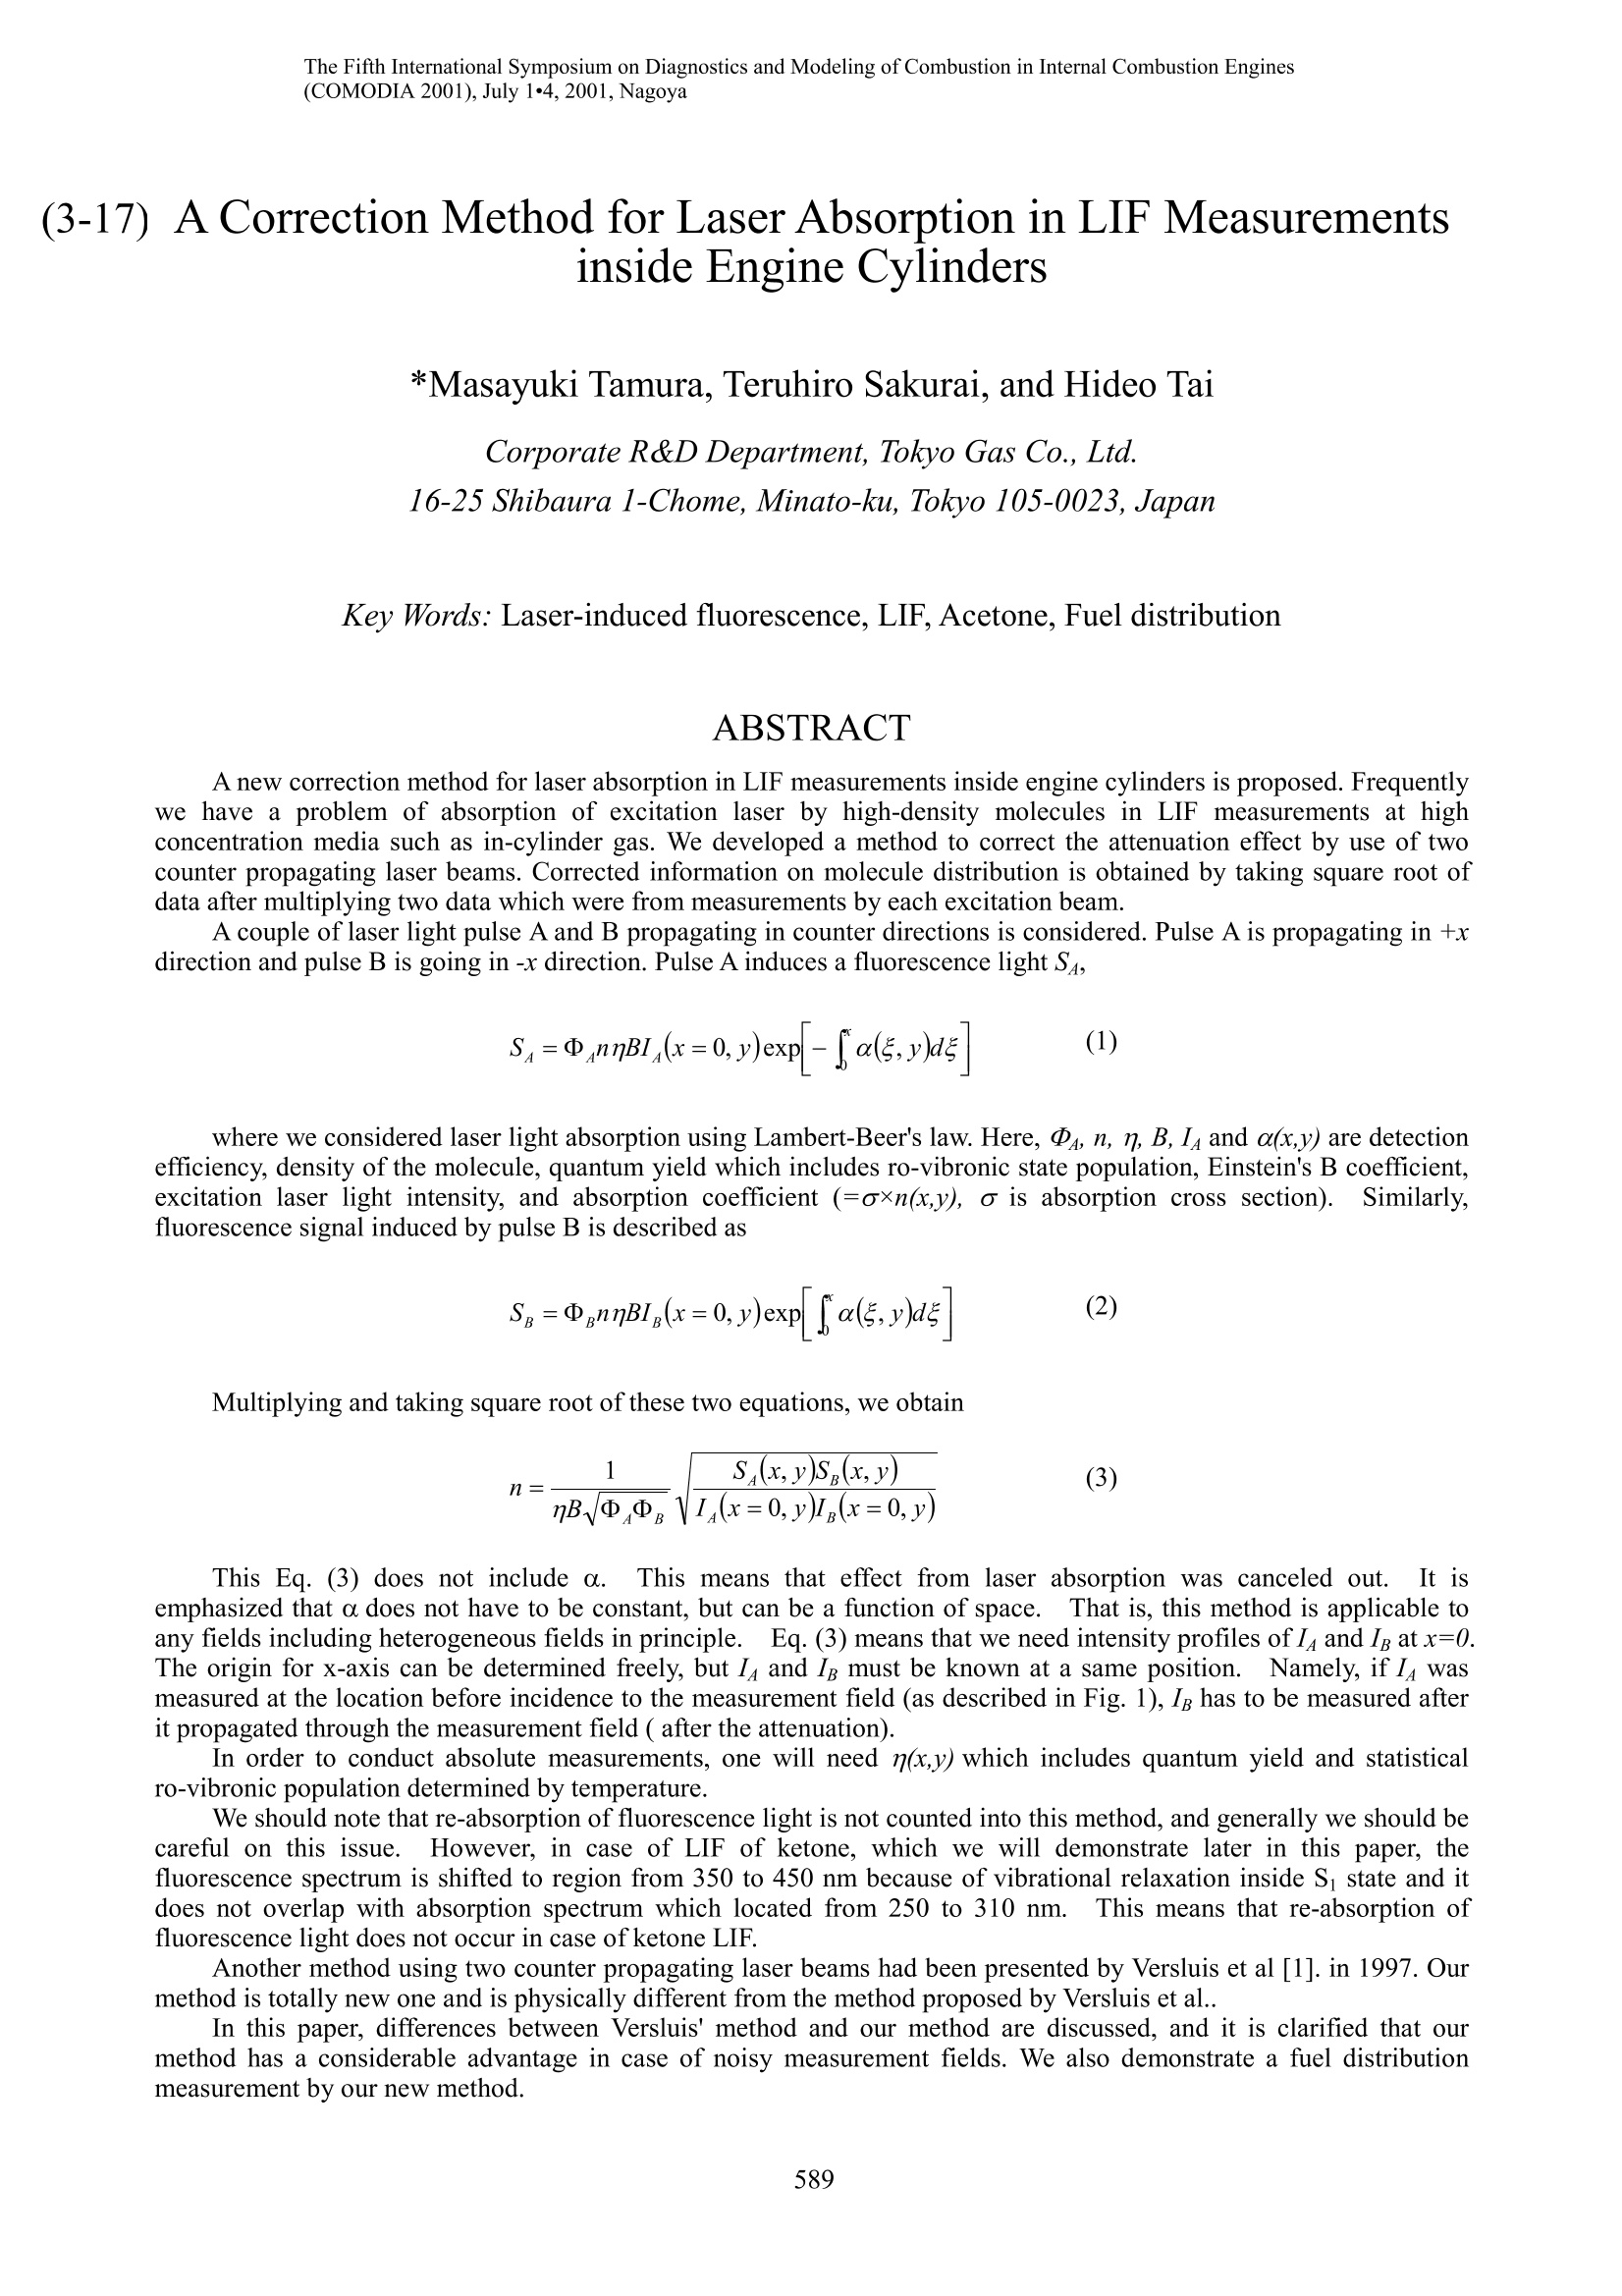
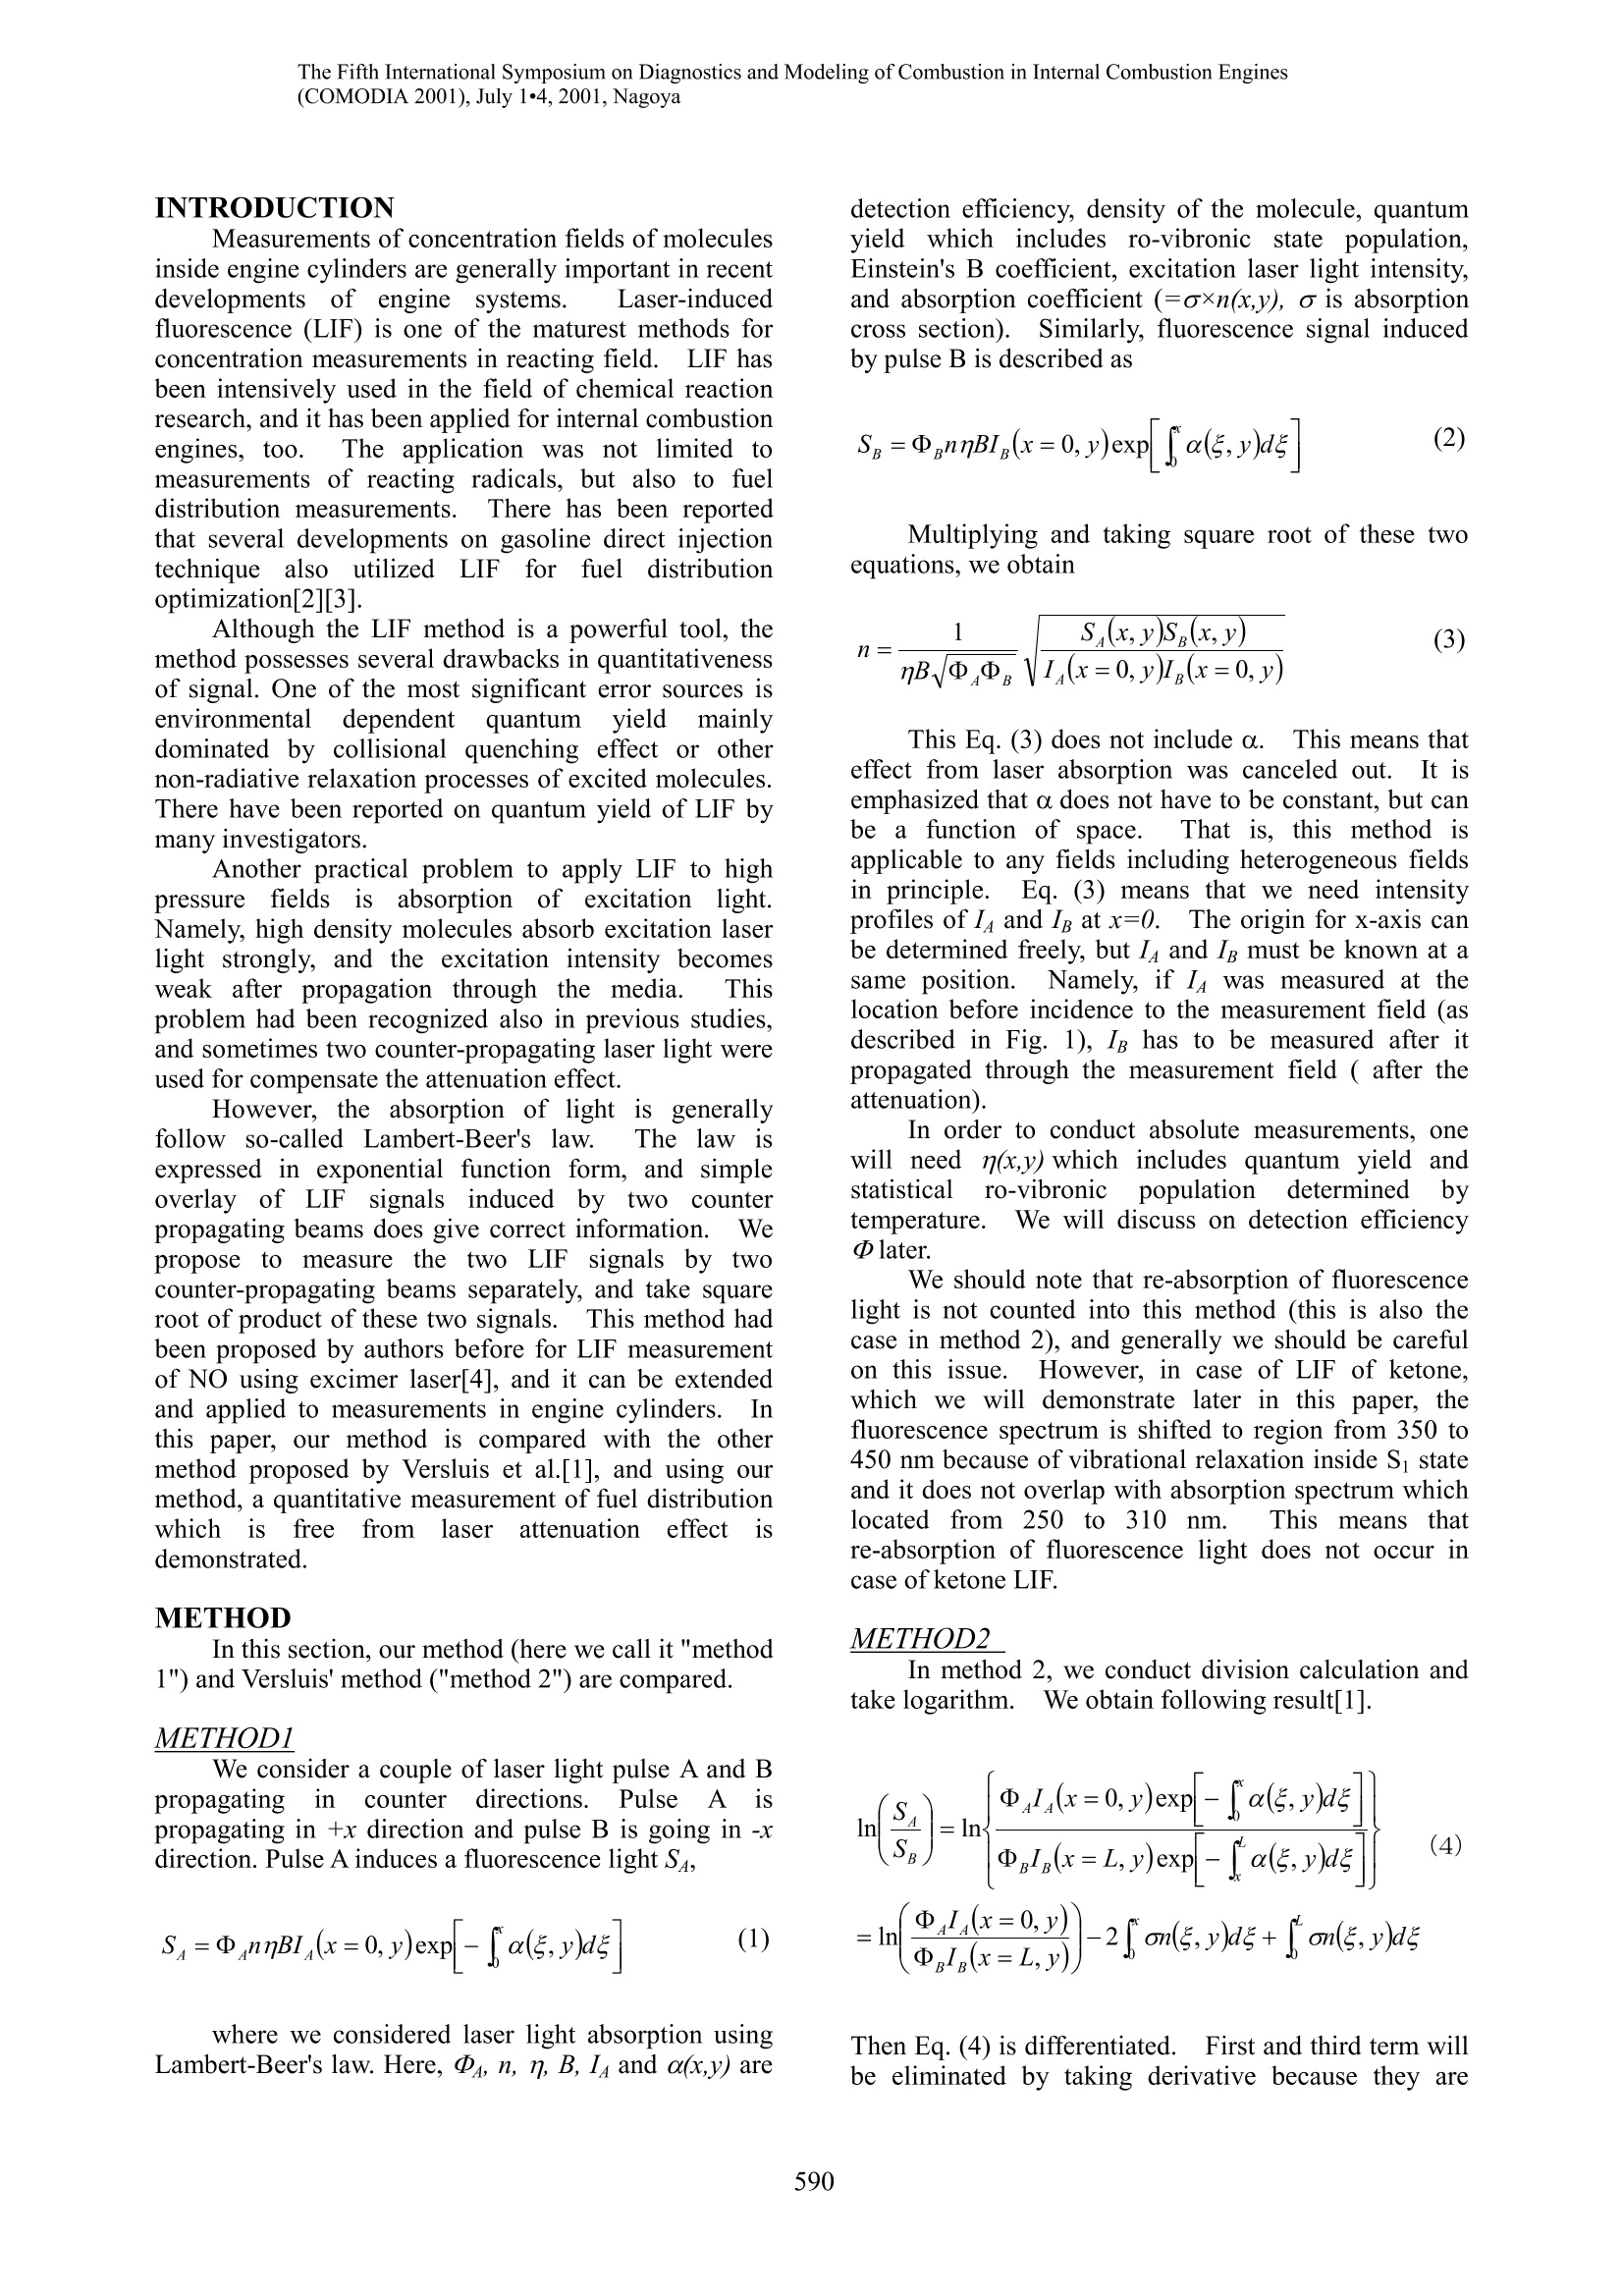
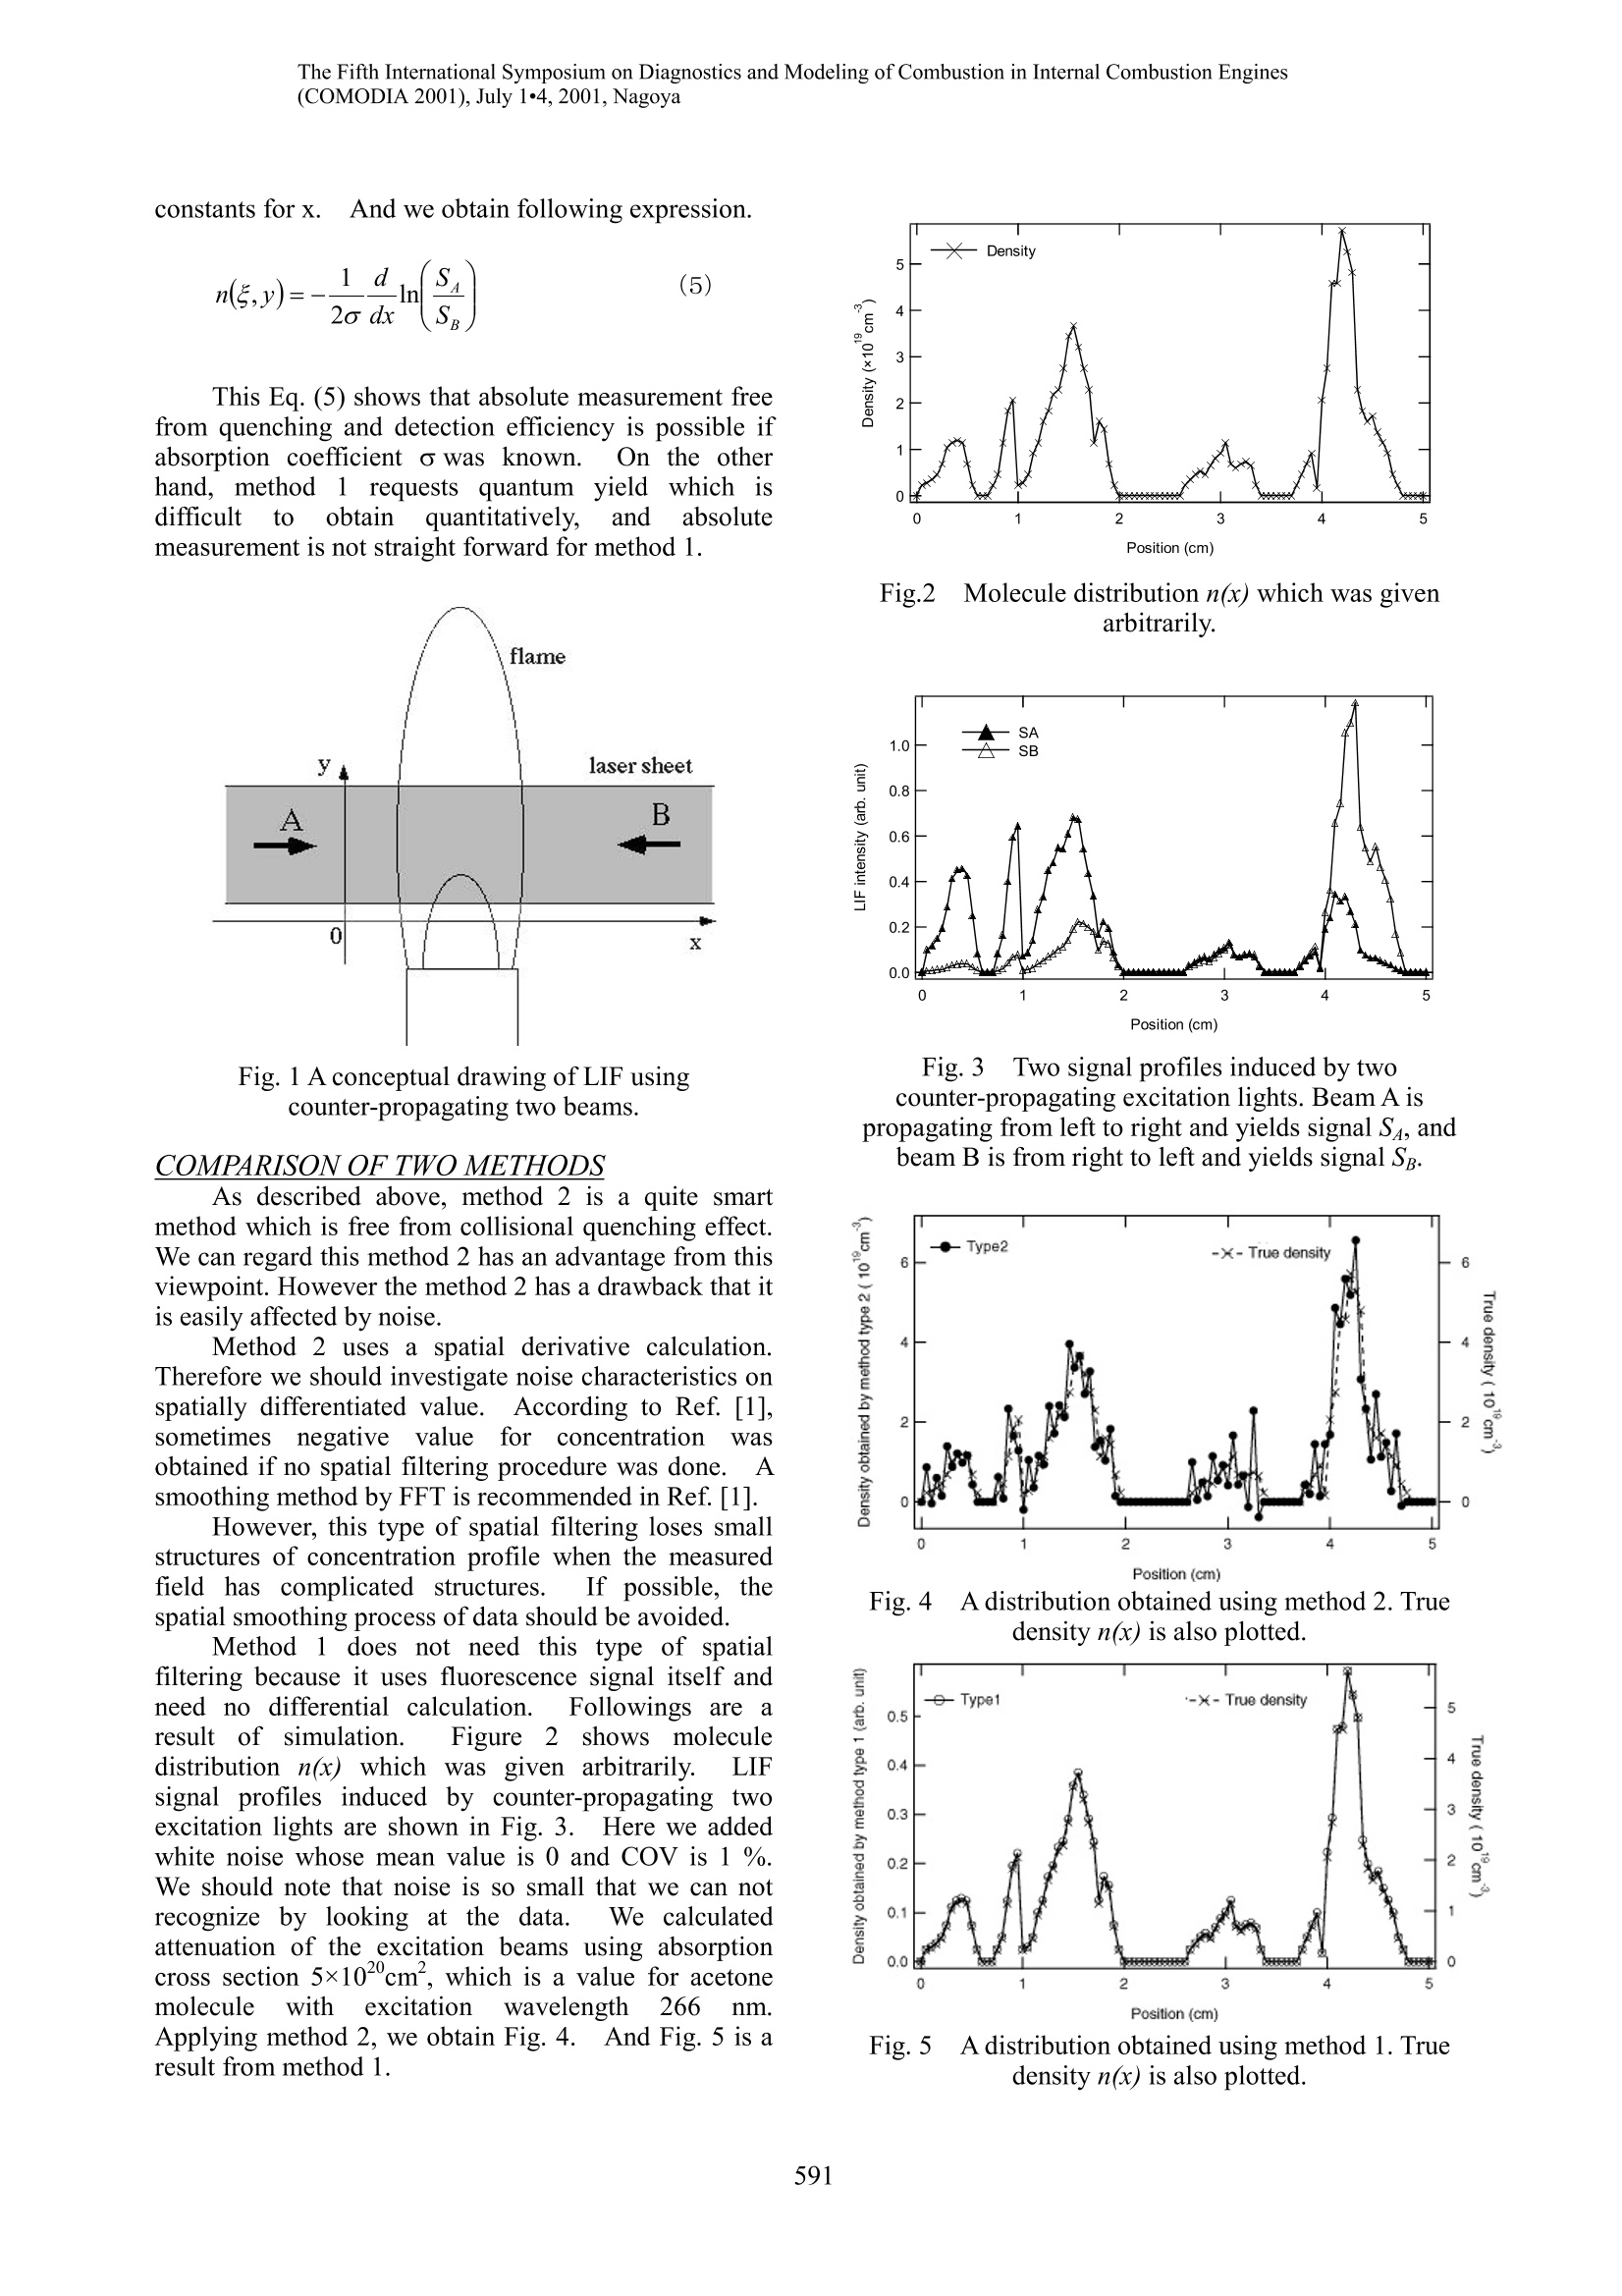
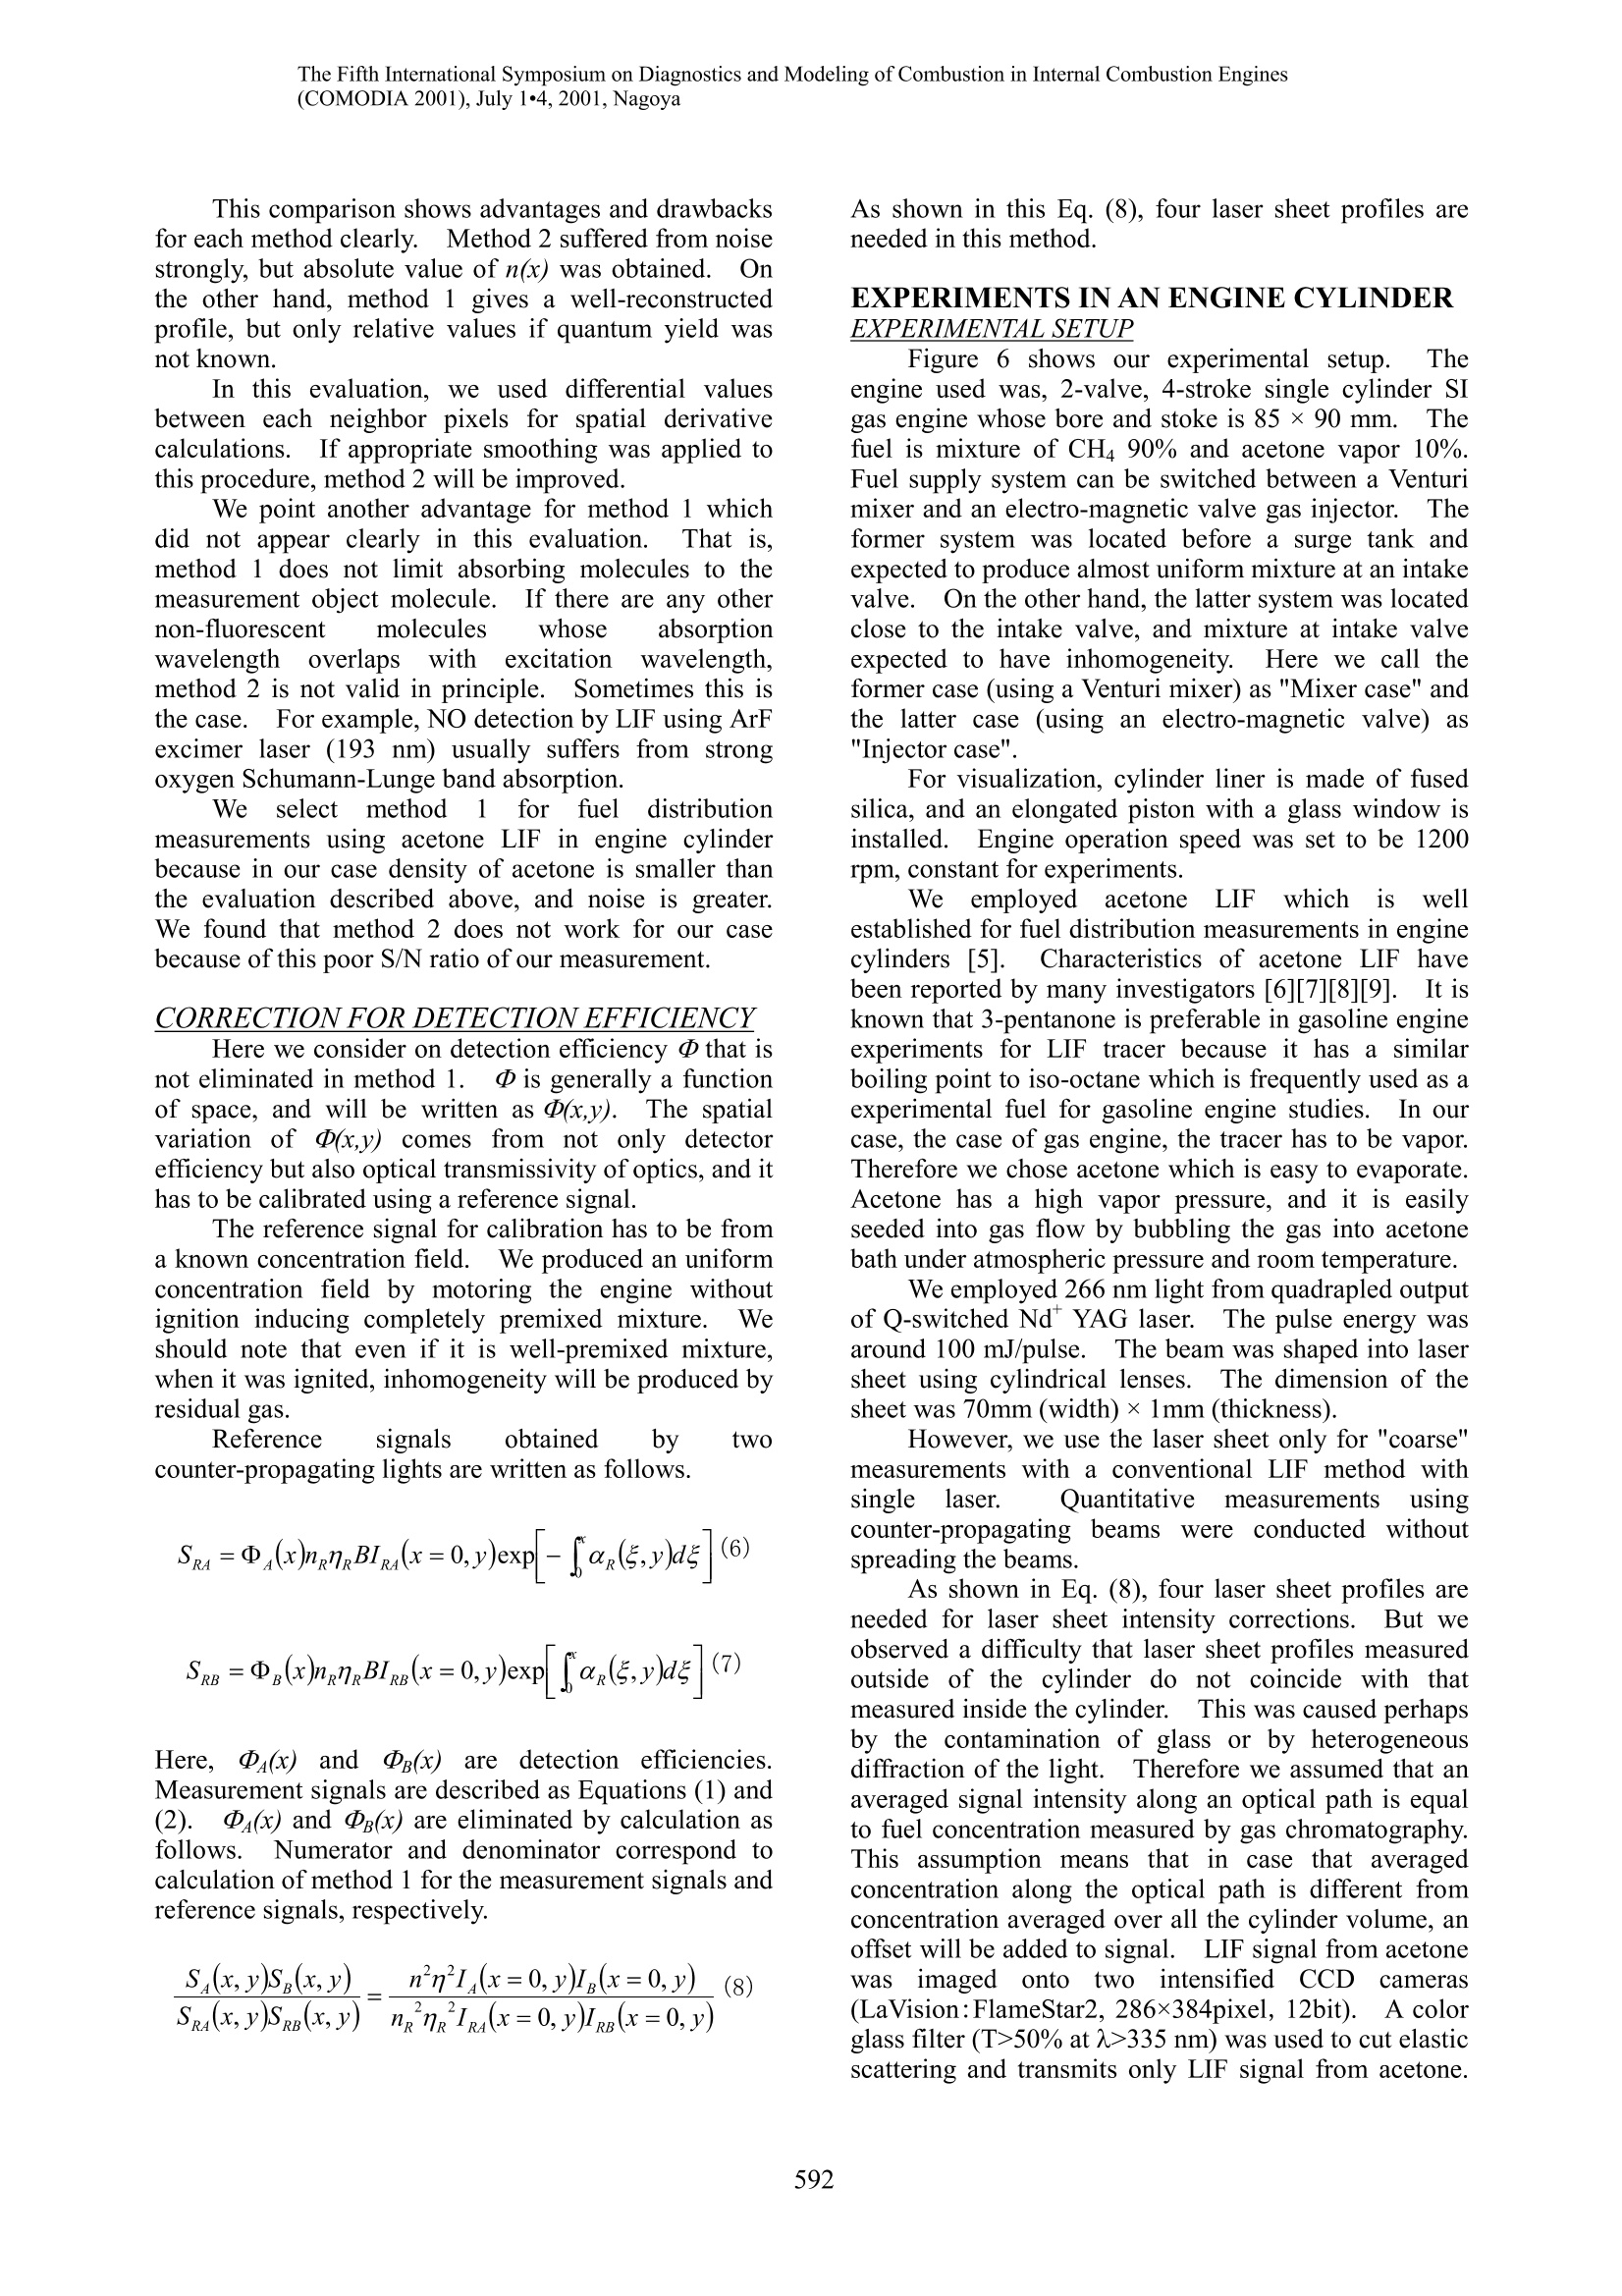
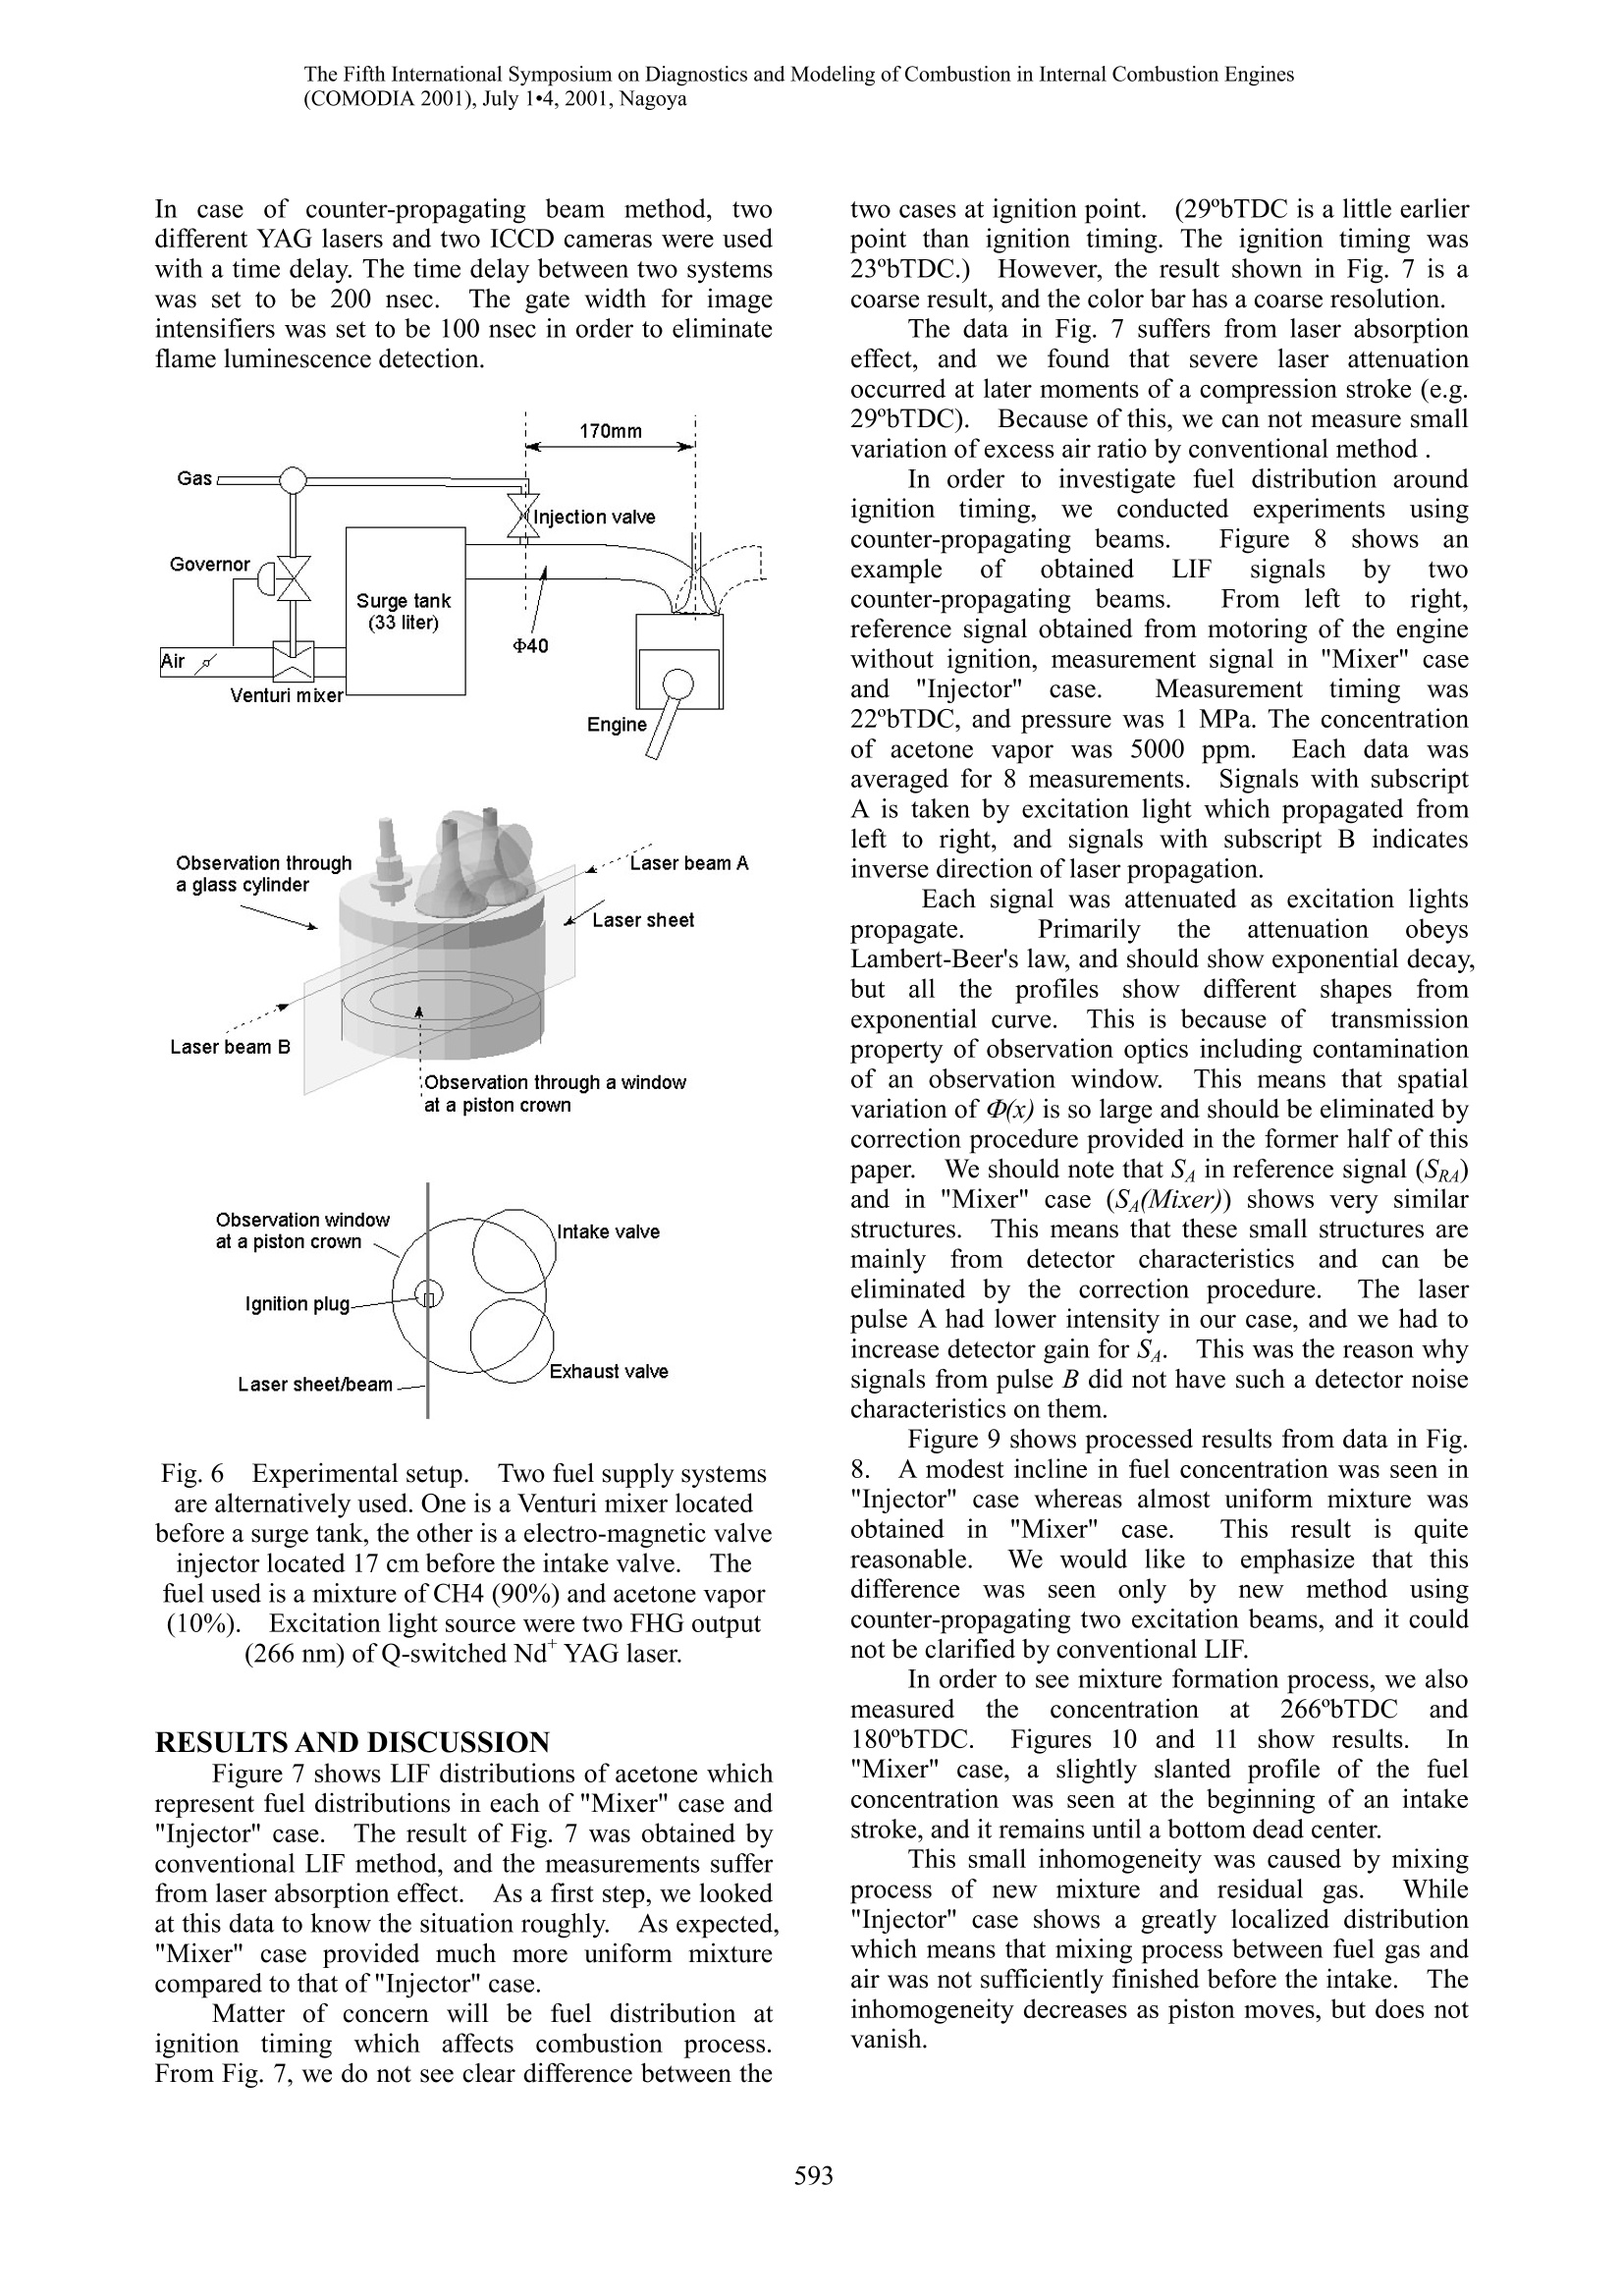
The Fifth International Symposium on Diagnostics and Modeling of Combustion in Internal Combustion Engines(COMODIA 2001), July 1·4, 2001, Nagoya (3-17) A Correction Method for Laser Absorption in LIF Measurementsinside Engine Cylinders *Masayuki Tamura, Teruhiro Sakurai, and Hideo Tai Corporate R&D Department, Tokyo Gas Co., Ltd.16-25 Shibaura 1-Chome, Minato-ku, Tokyo 105-0023, Japan Key Words: Laser-induced fluorescence, LIF, Acetone, Fuel distribution ABSTRACT A new correction method for laser absorption in LIF measurements inside engine cylinders is proposed. Frequentlywe have a problem of absorption of excitation laser by high-density molecules in LIF measurements at highconcentration media such as in-cylinder gas. We developed a method to correct the attenuation effect by use of twocounter propagating laser beams. Corrected information on molecule distribution is obtained by taking square root ofdata after multiplying two data which were from measurements by each excitation beam. A couple of laser light pulse A and B propagating in counter directions is considered. Pulse A is propagating in +xdirection and pulse B is going in -x direction. Pulse A induces a fluorescence light Sa, where we considered laser light absorption using Lambert-Beer’s law. Here, Di, n, n, B, Ia and a(x,y)are detectionefficiency, density of the molecule, quantum yield which includes ro-vibronic state population, Einstein's B coefficient,excitation laser light intensity, and absorption coefficient (=oxn(x,y), o is absorption cross section).).SSimilarly,fluorescence signal induced by pulse B is described as Multiplying and taking square root of these two equations, we obtain This Eq. (3) does not include a. This means that effect from laser absorption was canceled out. IIt isemphasized that a does not have to be constant, but can be a function ofspace..TThat is, this method is applicable toany fields including heterogeneous fields in principle. IEq. (3) means that we need intensity profiles of Ia and Ig atx=0.The origin for x-axis can be determined freely, but I and Ig must be known at a same position. Namely, if I wasmeasured at the location before incidence to the measurement field (as described in Fig. 1), Ig has to be measured afterit propagated through the measurement field ( after the attenuation). In order to conduct absolute measurements, one will need n(x,y) which includes quantum yield and statisticalro-vibronic population determined by temperature. We should note that re-absorption of fluorescence light is not counted into this method, and generally we should becareful on this issue. IHowever, in case of LIF of ketone, which we will demonstrate later in this paper, thefluorescence spectrum is shifted to region from 350 to 450 nm because of vibrational relaxation inside S state and itdoes not overlap with absorption spectrum which located from 250 to 310 nm. This means that re-absorption offluorescence light does not occur in case of ketone LIF. Another method using two counter propagating laser beams had been presented by Versluis et al [1]. in 1997. Ourmethod is totally new one and is physically different from the method proposed by Versluis et al.. In this paper, differences between Versluis' method and our method are discussed, and it is clarified that ourmethod has a considerable advantage in case of noisy measurement fields. We also demonstrate a fuel distributionmeasurement by our new method. INTRODUCTION Measurements of concentration fields of moleculesinside engine cylinders are generally important in recentdevelopments of engineesystems. Laser-inducedfluorescence (LIF) is one of the maturest methods forconcentration measurements in reacting field. LIF hasbeen intensively used in the field of chemical reactionresearch, and it has been applied for internal combustionengines, too. The application was not limited tomeasurements of reacting radicals, but also to fueldistribution measurements.S.There has been reportedthat several developments on gasoline direct injectiontechnique also utilized LIFfor fuel distributionoptimization[2][3]. Although the LIF method is a powerful tool, themethod possesses several drawbacks in quantitativenessof signal. One of the most significant error sources isenvironmental (dependent quantum yieldd mainlydominated by collisional quenching effect or othernon-radiative relaxation processes of excited molecules.There have been reported on quantum yield of LIF bymany investigators.S. Another practical problem to apply LIF to highpressure fields isi absorption of excitation light.Namely, high density molecules absorb excitation laserlight strongly, and the excitation intensity becomesweak after propagation through the media. Thisproblem had been recognized also in previous studies,and sometimes two counter-propagating laser light wereused for compensate the attenuation effect. However, the absorption of light is generallyfollow so-called Lambert-Beer's law. The law isexpressed in exponential function form, and simpleoverlay of LIF signals induced bbyy ttwwoo counterpropagating beams does give correct information.h. Wepropose ieasure the two LIF signalss by twocounter-propagating beams separately, and take squareroot of product of these two signals. This method hadbeen proposed by authors before for LIF measurementof NO using excimer laser[4], and it can be extendedand applied to measurements in engine cylinders.Inthis paper, our method is compared with the othermethod proposed by Versluis et al.[1], and using ourmethod, a quantitative measurement of fuel distributionwhich isfreefrom laser atteennuation effect isdemonstrated. METHOD In this section, our method (here we call it "method1") and Versluis' method ("method 2") are compared. METHODI We consider a couple of laser light pulse A and Bpropagatingin counter directions. Pulse Aispropagating in +x direction and pulse B is going in -xdirection. Pulse A induces a fluorescence light SA, where we considered laser light absorption usingLambert-Beer’s law. Here, Da, n, n, B, Ia and a(x,y) are detection efficiency, density of the molecule, quantumyield whichincludes ro-vibronic state population,Einstein's B coefficient, excitation laser light intensity,and absorption coefficient (=oxn(x,y), o is absorptioncross section). Similarly, fluorescence signal inducedby pulse B is described as Multiplying and taking square root of these twoequations, we obtain This Eq. (3) does not include a. This means thateffect from laser absorption was canceled out.It isemphasized that a does not have to be constant, but canbe a function of space. That is, this method isapplicable to any fields including heterogeneous fieldsin principle.Eq. (3) means that we need intensityprofiles of I and Ig at x=0.The origin for x-axis canbe determined freely, but Ia and Ig must be known at asame position.Namely, if I was measured at thelocation before incidence to the measurement field (asdescribed in Fig. 1), Ig has to be measured after itpropagated through the measurement field ( after theattenuation). In order to conduct absolute measurements, onewill needn(x,y)which includes quantum yield andstatistical ro-vibronicpopulation determined bytemperature. We will discuss on detection efficiency@later. We should note that re-absorption of fluorescencelight is not counted into this method (this is also thecase in method 2), and generally we should be carefulon this issue. However, in case of LIF of ketone,which we will demonstrate later in this paper, thefluorescence spectrum is shifted to region from 350 to450 nm because of vibrational relaxation inside S stateand it does not overlap with absorption spectrum whichlocated from 250 to 310 nm.TThis means thatre-absorption of fluorescence light does not occur incase of ketone LIF. METHOD2 In method 2. we conduct division calculation andtake logarithm.We obtain following result[1]. Then Eq. (4) is differentiated. First and third term willbe eliminated by taking derivative because they are constants for x..And we obtain following expression. This Eq. (5) shows that absolute measurement freefrom quenching and detection efficiency is possible ifabsorption coefficient o was known.On the otherhand, method1 requestsquantum yield which isdifficult toOobtainquantitatively, and absolutemeasurement is not straight forward for method 1. Fig. 1 A conceptual drawing of LIF usingcounter-propagating two beams COMPARISON OF TWO METHODS As described above, method 2 is a quite smartmethod which is free from collisional quenching effect.We can regard this method 2 has an advantage from thisviewpoint. However the method 2 has a drawback that itis easily affected by noise. Method 2 uses a spatial derivative calculation.Therefore we should investigate noise characteristics onspatially differentiated value. According to Ref. [1],sometimes negative value for concentrationwasobtained if no spatial filtering procedure was done. Asmoothing method by FFT is recommended in Ref.[1]. However, this type of spatial filtering loses smallstructures of concentration profile when the measuredfield has complicated structures.If possible, thespatial smoothing process of data should be avoided. Method1 does not need this type of spatialfiltering because it uses fluorescence signal itself andneed no differential calculation. Followings are aresult of simulation. Figure2showsSmoleculedistribution n(x) which was given arbitrarily.LLIFsignal profiles induced by counter-propagating twoexcitation lights are shown in Fig. 3. Here we addedwhite noise whose mean value is 0 and COV is 1 %.We should note that noise is so small that we can notrecognize by looking at the data.. WVe calculatedattenuation of the excitation beams using absorptioncross section 5×10 cm, which is a value for acetonemoleculeVwithexcitation wavelength 266 nm.Applying method 2, we obtain Fig. 4.And Fig. 5 is aresult from method 1. Fig.2 Molecule distribution n(x) which was givenarbitrarily. Fig. 3Two signal profiles induced by two counter-propagating excitation lights. Beam A is propagating from left to right and yields signal Sa, andbeam B is from right to left and yields signal Sg. Fig.4 A distribution obtained using method 2. Truedensity n(x) is also plotted. Fig.5 A distribution obtained using method 1. Truedensity n(x) is also plotted. This comparison shows advantages and drawbacksfor each method clearly. Method 2 suffered from noisestrongly, but absolute value of n(x) was obtained. Onthe other hand, method 1 gives a well-reconstructedprofile, but only relative values if quantum yield wasnot known. In this evaluation, we used differential valuesbetween each neighbor pixels for spatial derivativecalculations.s. If appropriate smoothing was applied tothis procedure, method 2 will be improved. We point another advantage for method 1 whichdid not appear clearly in this evaluation. That is,method 1 does not limit absorbing molecules to themeasurement object molecule. I]f there are any othernon-fluorescent molecules whose absorptionwavelength. overlaps with eexcitationnwavelength,method 2 is not valid in principle. Sometimes this isthe case.For example, NO detection by LIF using ArFexcimer laser (193 nm) usually suffers from strongoxygen Schumann-Lunge band absorption. We selectt method for fuel cdistributionmeasurements using acetone LIF in engine cylinderbecause in our case density of acetone is smaller thanthe evaluation described above, and noise is greater.We found that method 2 does not work for our casebecause of this poor S/N ratio of our measurement. CORRECTIONFOR DETECTION EFFICIENCY Here we consider on detection efficiencyD that isnot eliminated in method 1. Dis generally a functionof space, and will be written as D(x,y). The spatialvariation of D(x,y) comes from not only detectorefficiency but also optical transmissivity of optics, and ithas to be calibrated using a reference signal. The reference signal for calibration has to be froma known concentration field. We produced an uniformconcentration field by motoring the engine withoutignition inducing completely premixed mixture. Weshould note that even if it is well-premixed mixture,when it was ignited, inhomogeneity will be produced byresidual gas. Reference signals obtained by twocounter-propagating lights are written as follows. Here.a(x)aandDB(x) are detection efficiencies.Measurement signals are described as Equations (1) and(2)..DA(x) and PB(x) are eliminated by calculation asfollows.Numerator and denominator correspond tocalculation of method 1 for the measurement signals andreference signals, respectively. As shown in this Eq. (8), four laser sheet profiles areneeded in this method. EXPERIMENTS INANENGINE CYLINDER EXPERIMENTAL SETUP Figure 6 shows our experimental setup. Theengine used was, 2-valve, 4-stroke single cylinder SIgas engine whose bore and stoke is 85 x 90 mm.Thefuel is mixture of CH4 90% and acetone vapor 10%.Fuel supply system can be switched between a Venturimixer and an electro-magnetic valve gas injector.Theformer system was located before a surge tank andexpected to produce almost uniform mixture at an intakevalve..On the other hand, the latter system was locatedclose to the intake valve, and mixture at intake valveexpected to have inhomogeneity. Here we call theformer case (using a Venturi mixer) as "Mixer case" andthe latter case (using an electro-magnetic valve) as"Injector case". For visualization, cylinder liner is made of fusedsilica, and an elongated piston with a glass window isinstalled..Engine operation speed was set to be 1200rpm, constant for experiments. We employed1 acetone LIF whichi wellestablished for fuel distribution measurements in enginecylinders [5]. Characteristics of acetone LIF havebeen reported by many investigators [6][7][8][9].It isknown that 3-pentanone is preferable in gasoline engineexperiments for LIF tracer because it has a similarboiling point to iso-octane which is frequently used as aexperimental fuel for gasoline engine studies. In ourcase, the case of gas engine, the tracer has to be vapor.Therefore we chose acetone which is easy to evaporate.Acetone has a high vapor pressure, and it is easilyseeded into gas flow by bubbling the gas into acetonebath under atmospheric pressure and room temperature. We employed 266 nm light from quadrapled outputof Q-switched Nd* YAG laser.The pulse energy wasaround 100 mJ/pulse. The beam was shaped into lasersheet using cylindrical lenses.S.The dimension of thesheet was 70mm (width)x1mm (thickness). However, we use the laser sheet only for "coarse"measurements with a conventional LIF method withsinglelaser. Quantitative measurements usingcounter-propagating beamswere conducted withoutspreading the beams. As shown in Eq. (8), four laser sheet profiles areneeded for laser sheet intensity corrections.But weobserved a difficulty that laser sheet profiles measuredoutside of the cylinder do not coincide with thatmeasured inside the cylinder. This was caused perhapsby the contamination of glass or by heterogeneousdiffraction of the light. Therefore we assumed that anaveraged signal intensity along an optical path is equalto fuel concentration measured by gas chromatography.This assumption means that in case that averagedconcentration along the optical path is different fromconcentration averaged over all the cylinder volume, anoffset will be added to signal.LIF signal from acetonewasimaged ontotwointensified CCD ccameras(LaVision:FlameStar2, 286×384pixel, 12bit).A colorglass filter (T>50% at >335 nm) was used to cut elasticscattering and transmits only LIF signal from acetone. In case of counter-propagating beam method,twodifferent YAG lasers and two ICCD cameras were usedwith a time delay. The time delay between two systemswas set to be 200 nsec.The gate width for imageintensifiers was set to be 100 nsec in order to eliminateflame luminescence detection. Fig.6 Experimental setup. TTwo fuel supply systemsare alternatively used. One is a Venturi mixer locatedbefore a surge tank, the other is a electro-magnetic valveinjector located 17 cm before the intake valve.Thefuel used is a mixture of CH4 (90%) and acetone vapor(10%).).Excitation light source were two FHG output (266 nm) of Q-switched Nd YAG laser. RESULTS AND DISCUSSION Figure 7 shows LIF distributions of acetone whichrepresent fuel distributions in each of "Mixer" case and"Injector" case..TThe result of Fig. 7 was obtained byconventional LIF method, and the measurements sufferfrom laser absorption effect. As a first step, we lookedat this data to know the situation roughly.. As expected,"Mixer" case provided much more uniform mixturecompared to that of "Injector" case. Matter of concern will be fuel distribution atignition timing which affects combustion process.From Fig. 7, we do not see clear difference between the two cases at ignition point..(29bTDC is a little earlierpoint than ignition timing. The ignition timing was23°bTDC.)) However, the result shown in Fig. 7 is acoarse result, and the color bar has a coarse resolution. The data in Fig. 7 suffers from laser absorptioneffect, and we found that severe laser attenuationoccurred at later moments of a compression stroke (e.g.29°bTDC). Because of this, we can not measure smallvariation of excess air ratio by conventional method . In order to investigate fuel distribution aroundignition timing,,weconducted experimentsusingcounter-propagating tbeams. Figuree 8showsanexampleie of obtained LIF signals ytwocounter-propagatingbeams. Fromleft o right,reference signal obtained from motoring of the enginewithout ignition, measurement signal in "Mixer" caseand"Injector" case. MeasurementttimingWas22°bTDC, and pressure was 1 Ma. The concentrationof acetone vapor was 5000 ppm. IEach data wasaveraged for 8 measurements.s.Signals with subscriptA is taken by excitation light which propagated fromleft to right, and signals with subscript B indicatesinverse direction of laser propagation. Each signal was attenuated as excitation lightspropagate. Primarilythe ttennuation obeysLambert-Beer's law, and should show exponential decay,but all the profiles show different shapes fromexponential curve. This is because of ttransmissionproperty of observation optics including contaminationof an observation window.. This means that spatialvariation of D(x) is so large and should be eliminated bycorrection procedure provided in the former half of thispaper.We should note that S in reference signal (SRA)and in "Mixer" case (Sa(Mixer)) shows very similarstructures.This means that these small structures aremainly from detector characteristicss andcanbeeliminated by the correction procedure.The laserpulse A had lower intensity in our case, and we had toincrease detector gain for SA. This was the reason whysignals from pulse B did not have such a detector noisecharacteristics on them. Figure 9 shows processed results from data in Fig.8.A modest incline in fuel concentration was seen in"Injector"case whereas almost uniform mixture wasobtained in "Mixer" case. This resultislsquitereasonable. We would like to emphasize that thisdifferencewasseen only by newnmethod usingcounter-propagating two excitation beams, and it couldnot be clarified by conventional LIF. In order to see mixture formation process, we alsomeasuredthe concentration at 266bTDaCnd180°bTDC. Figures 10 and 11 show results.In"Mixer" case, a slightly slanted profile of the fuelconcentration was seen at the beginning of an intakestroke, and it remains until a bottom dead center. This small inhomogeneity was caused by mixingprocess of new mixture and residual gas.While"Injector" case shows a greatly localized distributionwhich means that mixing process between fuel gas andair was not sufficiently finished before the intake. Theinhomogeneity decreases as piston moves, but does notvanish. (COMODIA 2001), July 14, 2001, Nagoya Fig. 7LIF distributions of acetone which represent fuel distributions. Conventional LIF method was used, and themeasurements suffer from laser absorption effect. Fig. 8LIF signal distributions obtained by two counter-propagating laser beams.(Left: reference signal, Center: "Mixer" case, Right: "Injector" case) Fig. 9 A comparison of fuel distribution at ignitiontiming(22°bTDC). This data was taken by twocounter-propagating excitation beams and processed bymethod 1. Fig. 10A comparison of fuel distribution at ignitiontiming(266bTDC). This data was taken by two counter-propagating excitation beams and processed bymethod 1. AA llooccaalliizzeed distribution was observed in"Injector" case.There is also seen a slightly slanteddistribution in "Mixer" case. CONCLUSIONS We proposed a new method for quantitative LIFmeasurements free from laser attenuation problem afterabsorption of laser light by high density molecules.We compared two methods (Our method and methodproposed by Versluis et al.) and clarified advantages anddisadvantages for each.Our method has an advantagein insensitivity to noise. We demonstrated fuel concentration measurements in agas engine cylinder using this new method.1.. The resultshows that this method is sensitive enough to showsmall differences in fuel distributions at ignition timingsgenerated by two fuel supply systems. Fig. 11 A comparison of fuel distribution at ignitiontiming(180°bTDC). This data was taken by twocounter-propagating excitation beams and processed bymethod 1 REFERENCES [1]]Versluis, M., Georgiev, N.,Martinsson, L., Alden,M., and Kroll, S., Appl. Phys. B, 65: 411-417(1997) 2] Kuwahara, K., and Ando, H., The 14th InternalCombustion Engine Symposium, Japan,JapanSociety of Automotive Engineers and .JapanSociety of Mechanical Engineers, Nagoya, 1997,pp. 115 (in Japanese) [31 Kakuhou, A., Urushihara, T., Itoh, T., and Takagi,Y.. SAE paper 1999-01-0505, InternationalCongress and Exposition, 1999. [4] Tamura, M., Wolff, D., and Tai, H., Kogaku 25:228-231(1996) 5] Wolff, D., Beushausen, V., Schluter, H., Andresen,P., Hentschel, W., Manz, P., and Arndt S.,,Proceedings smanes o.of M oCrOMODIA 94,1994, pp.445 - 451 [6]Grossmann,F., Monkhouse, P. B.,Ridder, M., Sick,V. and Wolfrum, J., Appl. Phys. B, 62: 249-253(1996) [7] Yuen, L. S., Peters, J. E. and Lucht, R. P., Appl.Opt.36: 3271-3277(1997) 81 Thurber, M. C.,Grisch, F., Kirby, B. J., Votsmeier,M. and Hanson, R. K., Appl. Opt. 37: 4963-4978(1998) [9] Thurber, M. C. and Hanson, R. K.,Appl. Phys. B,69: 229-240(1999) A new correction method for laser absorption in LIF measurements inside engine cylinders is proposed. Frequently we have a problem of absorption of excitation laser by high-density molecules in LIF measurements at highconcentration media such as in-cylinder gas. We developed a method to correct the attenuation effect by use of two counter propagating laser beams. Corrected information on molecule distribution is obtained by taking square root of data after multiplying two data which were from measurements by each excitation beam. A couple of laser light pulse A and B propagating in counter directions is considered. Pulse A is propagating in +xdirection and pulse B is going in -x direction. Pulse A induces a fluorescence light SA,( ) ()= Φ = − xA A A S n BI x y y d0η 0, exp α ξ , ξ (1)where we considered laser light absorption using Lambert-Beer's law. Here,ΦA, n, η, B, IA and α(x,y) are detectionefficiency, density of the molecule, quantum yield which includes ro-vibronic state population, Einstein's B coefficient, excitation laser light intensity, and absorption coefficient (=σ×n(x,y), σ is absorption cross section). Similarly, fluorescence signal induced by pulse B is described as ( ) ()= Φ = xB B B S n BI x y y d0η 0, exp α ξ , ξ (2)Multiplying and taking square root of these two equations, we obtain ( ) ()( ) ()I x y I x yS x y S x yBnA BA BA B 0, 0,1 , ,Φ Φ = ==η(3)This Eq. (3) does not include α. This means that effect from laser absorption was canceled out. It is emphasized that α does not have to be constant, but can be a function of space. That is, this method is applicable to any fields including heterogeneous fields in principle. Eq. (3) means that we need intensity profiles of IA and IB at x=0.The origin for x-axis can be determined freely, but IA and IB must be known at a same position. Namely, if IA was measured at the location before incidence to the measurement field (as described in Fig. 1), IB has to be measured after it propagated through the measurement field ( after the attenuation). In order to conduct absolute measurements, one will need η(x,y) which includes quantum yield and statistical ro-vibronic population determined by temperature. We should note that re-absorption of fluorescence light is not counted into this method, and generally we should becareful on this issue. However, in case of LIF of ketone, which we will demonstrate later in this paper, thefluorescence spectrum is shifted to region from 350 to 450 nm because of vibrational relaxation inside S1 state and itdoes not overlap with absorption spectrum which located from 250 to 310 nm. This means that re-absorption of fluorescence light does not occur in case of ketone LIF. Another method using two counter propagating laser beams had been presented by Versluis et al [1]. in 1997. Ourmethod is totally new one and is physically different from the method proposed by Versluis et al..In this paper, differences between Versluis' method and our method are discussed, and it is clarified that our method has a considerable advantage in case of noisy measurement fields. We also demonstrate a fuel distributionmeasurement by our new method.
确定


还剩5页未读,是否继续阅读?

产品配置单


北京欧兰科技发展有限公司为您提供《发动机气缸中激光吸收修正检测方案(尾气检测)》,该方案主要用于汽车电子电器中其他检测,参考标准--,《发动机气缸中激光吸收修正检测方案(尾气检测)》用到的仪器有汽车发动机多参量测试系统、德国LaVision PIV/PLIF粒子成像测速场仪、PLIF平面激光诱导荧光火焰燃烧检测系统、LaVision SprayMaster 喷雾成像测量系统、激光诱导白炽光烟雾粒子成像分析仪(LII)
推荐专场


相关方案
更多
该厂商其他方案
更多