


方案详情
文
采用以LaVision公司特色高速图像增强器为核心搭建的平面激光诱导荧光(PLIF系统)对直喷火花塞引燃(DISI)发动机内燃料分布,引燃和燃烧过程进行了曲轴角分辨成像测量和分析。
方案详情

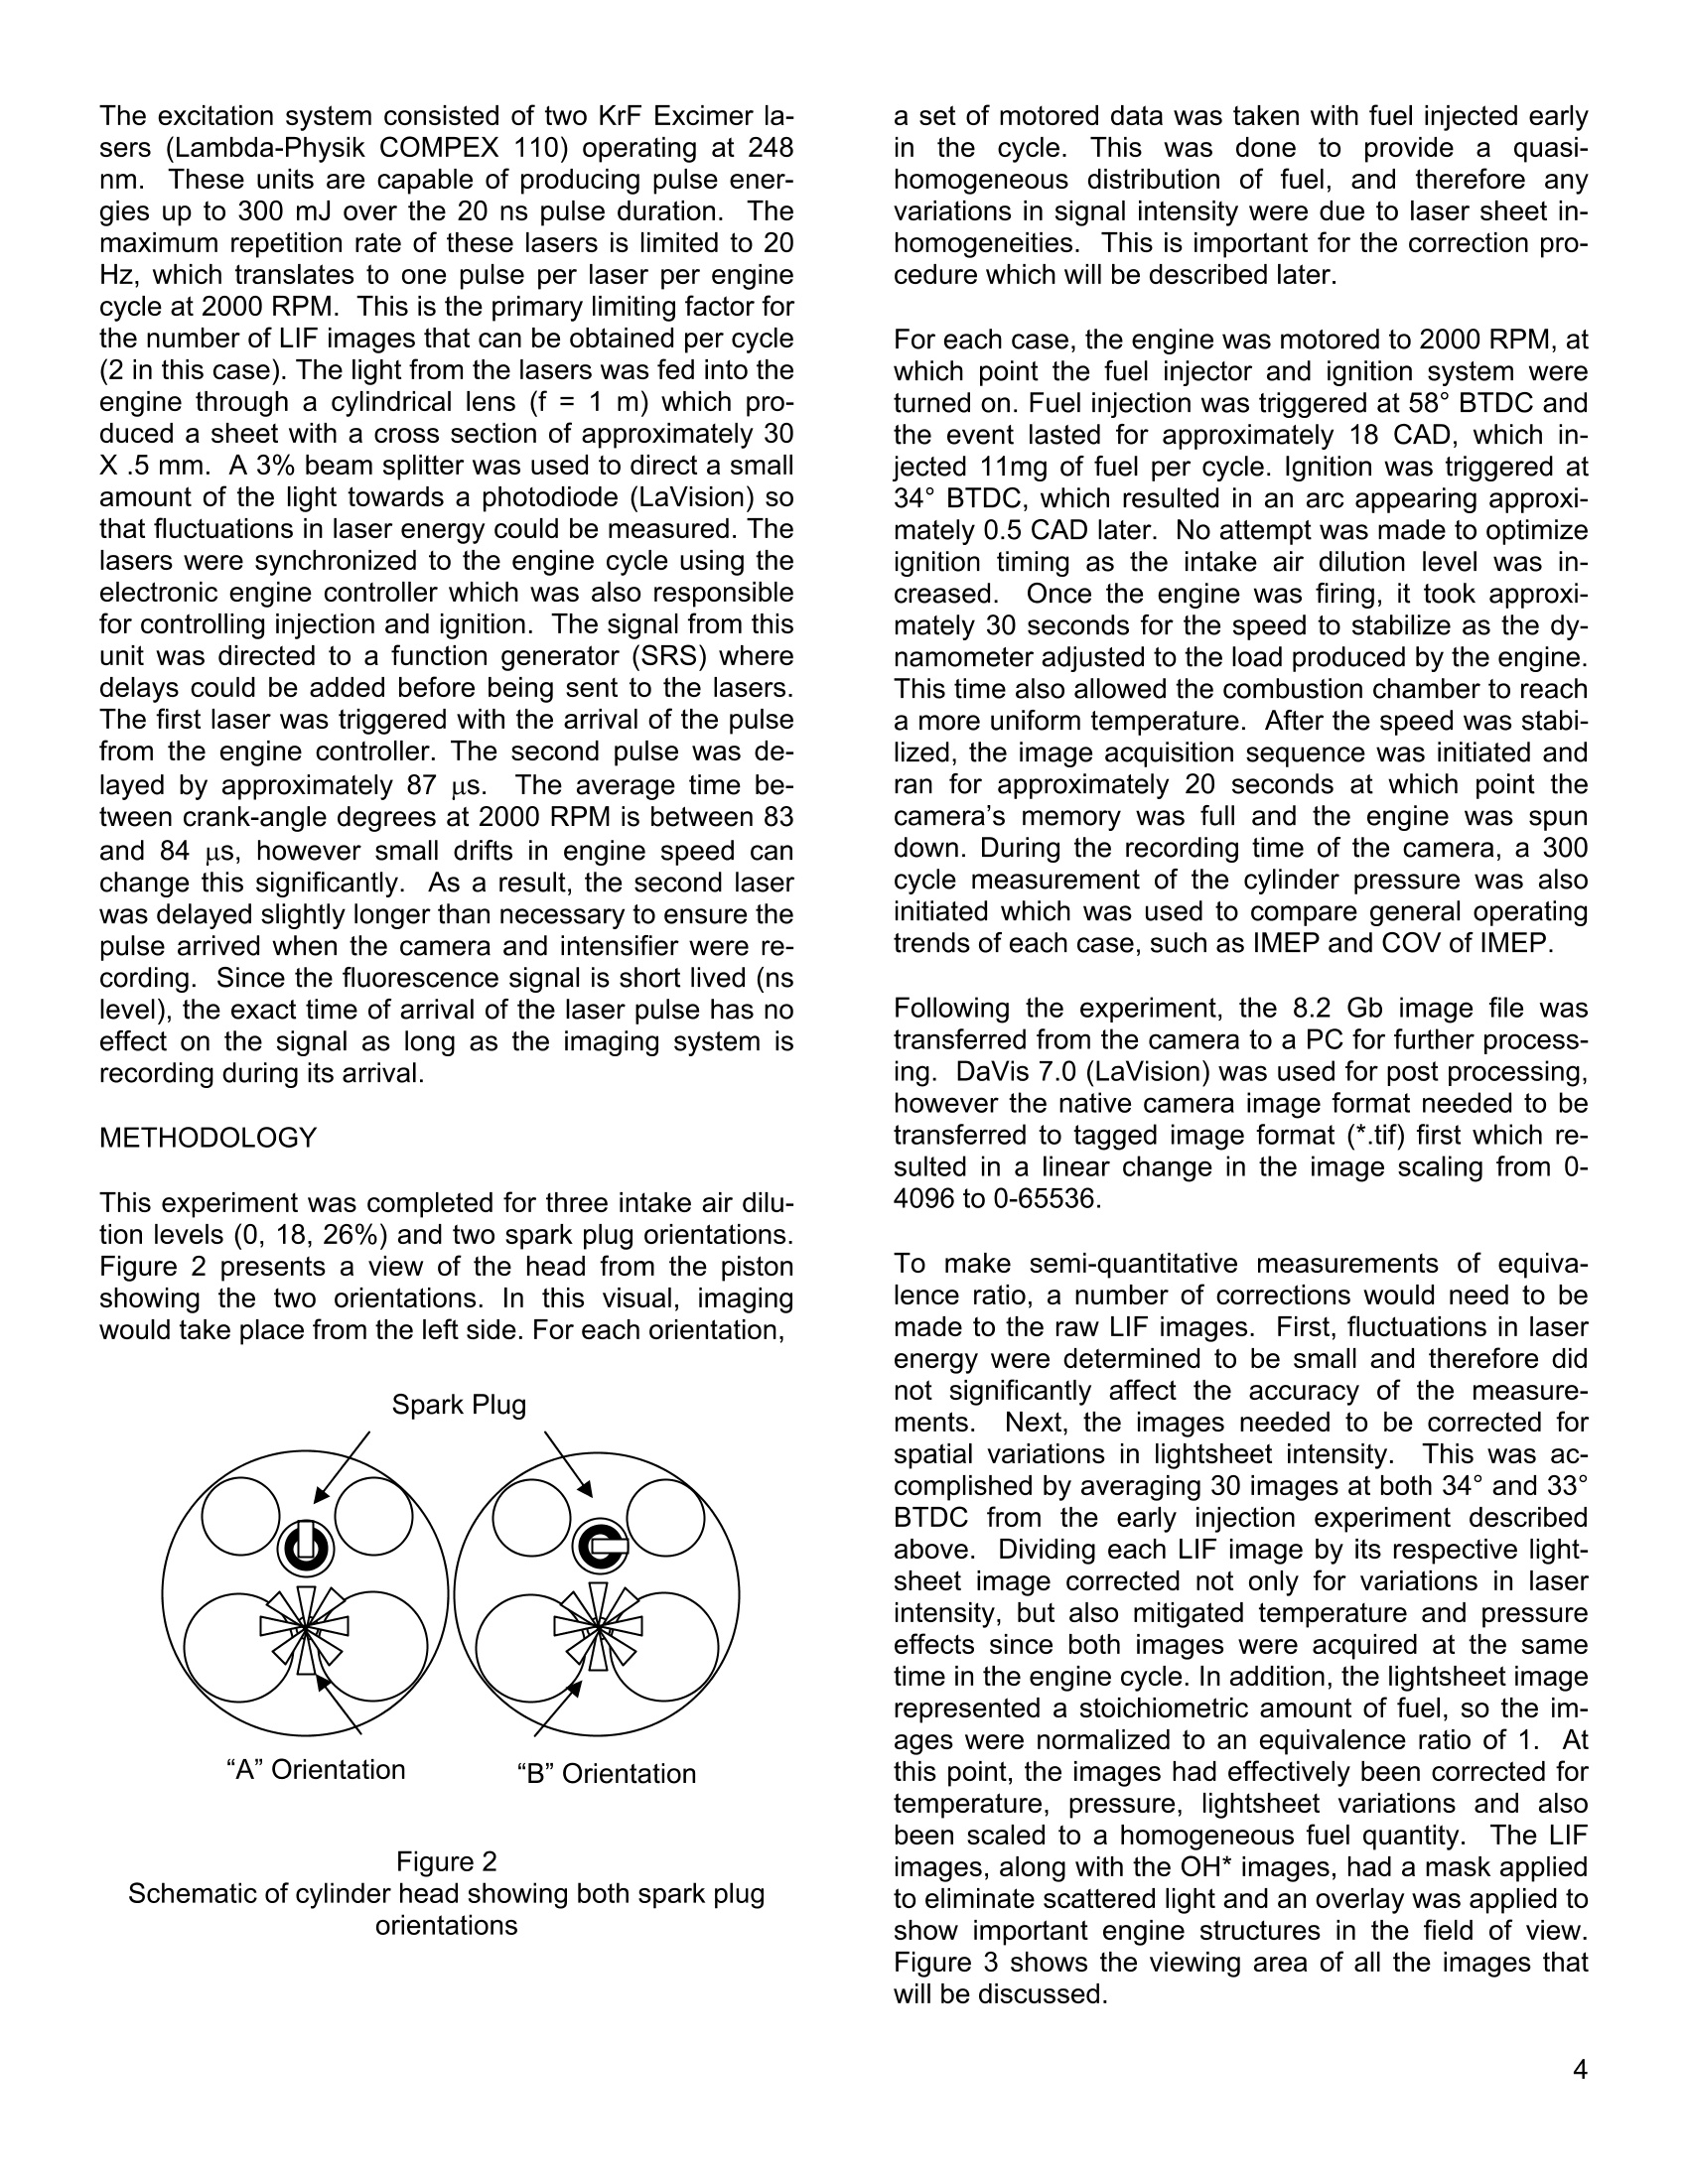
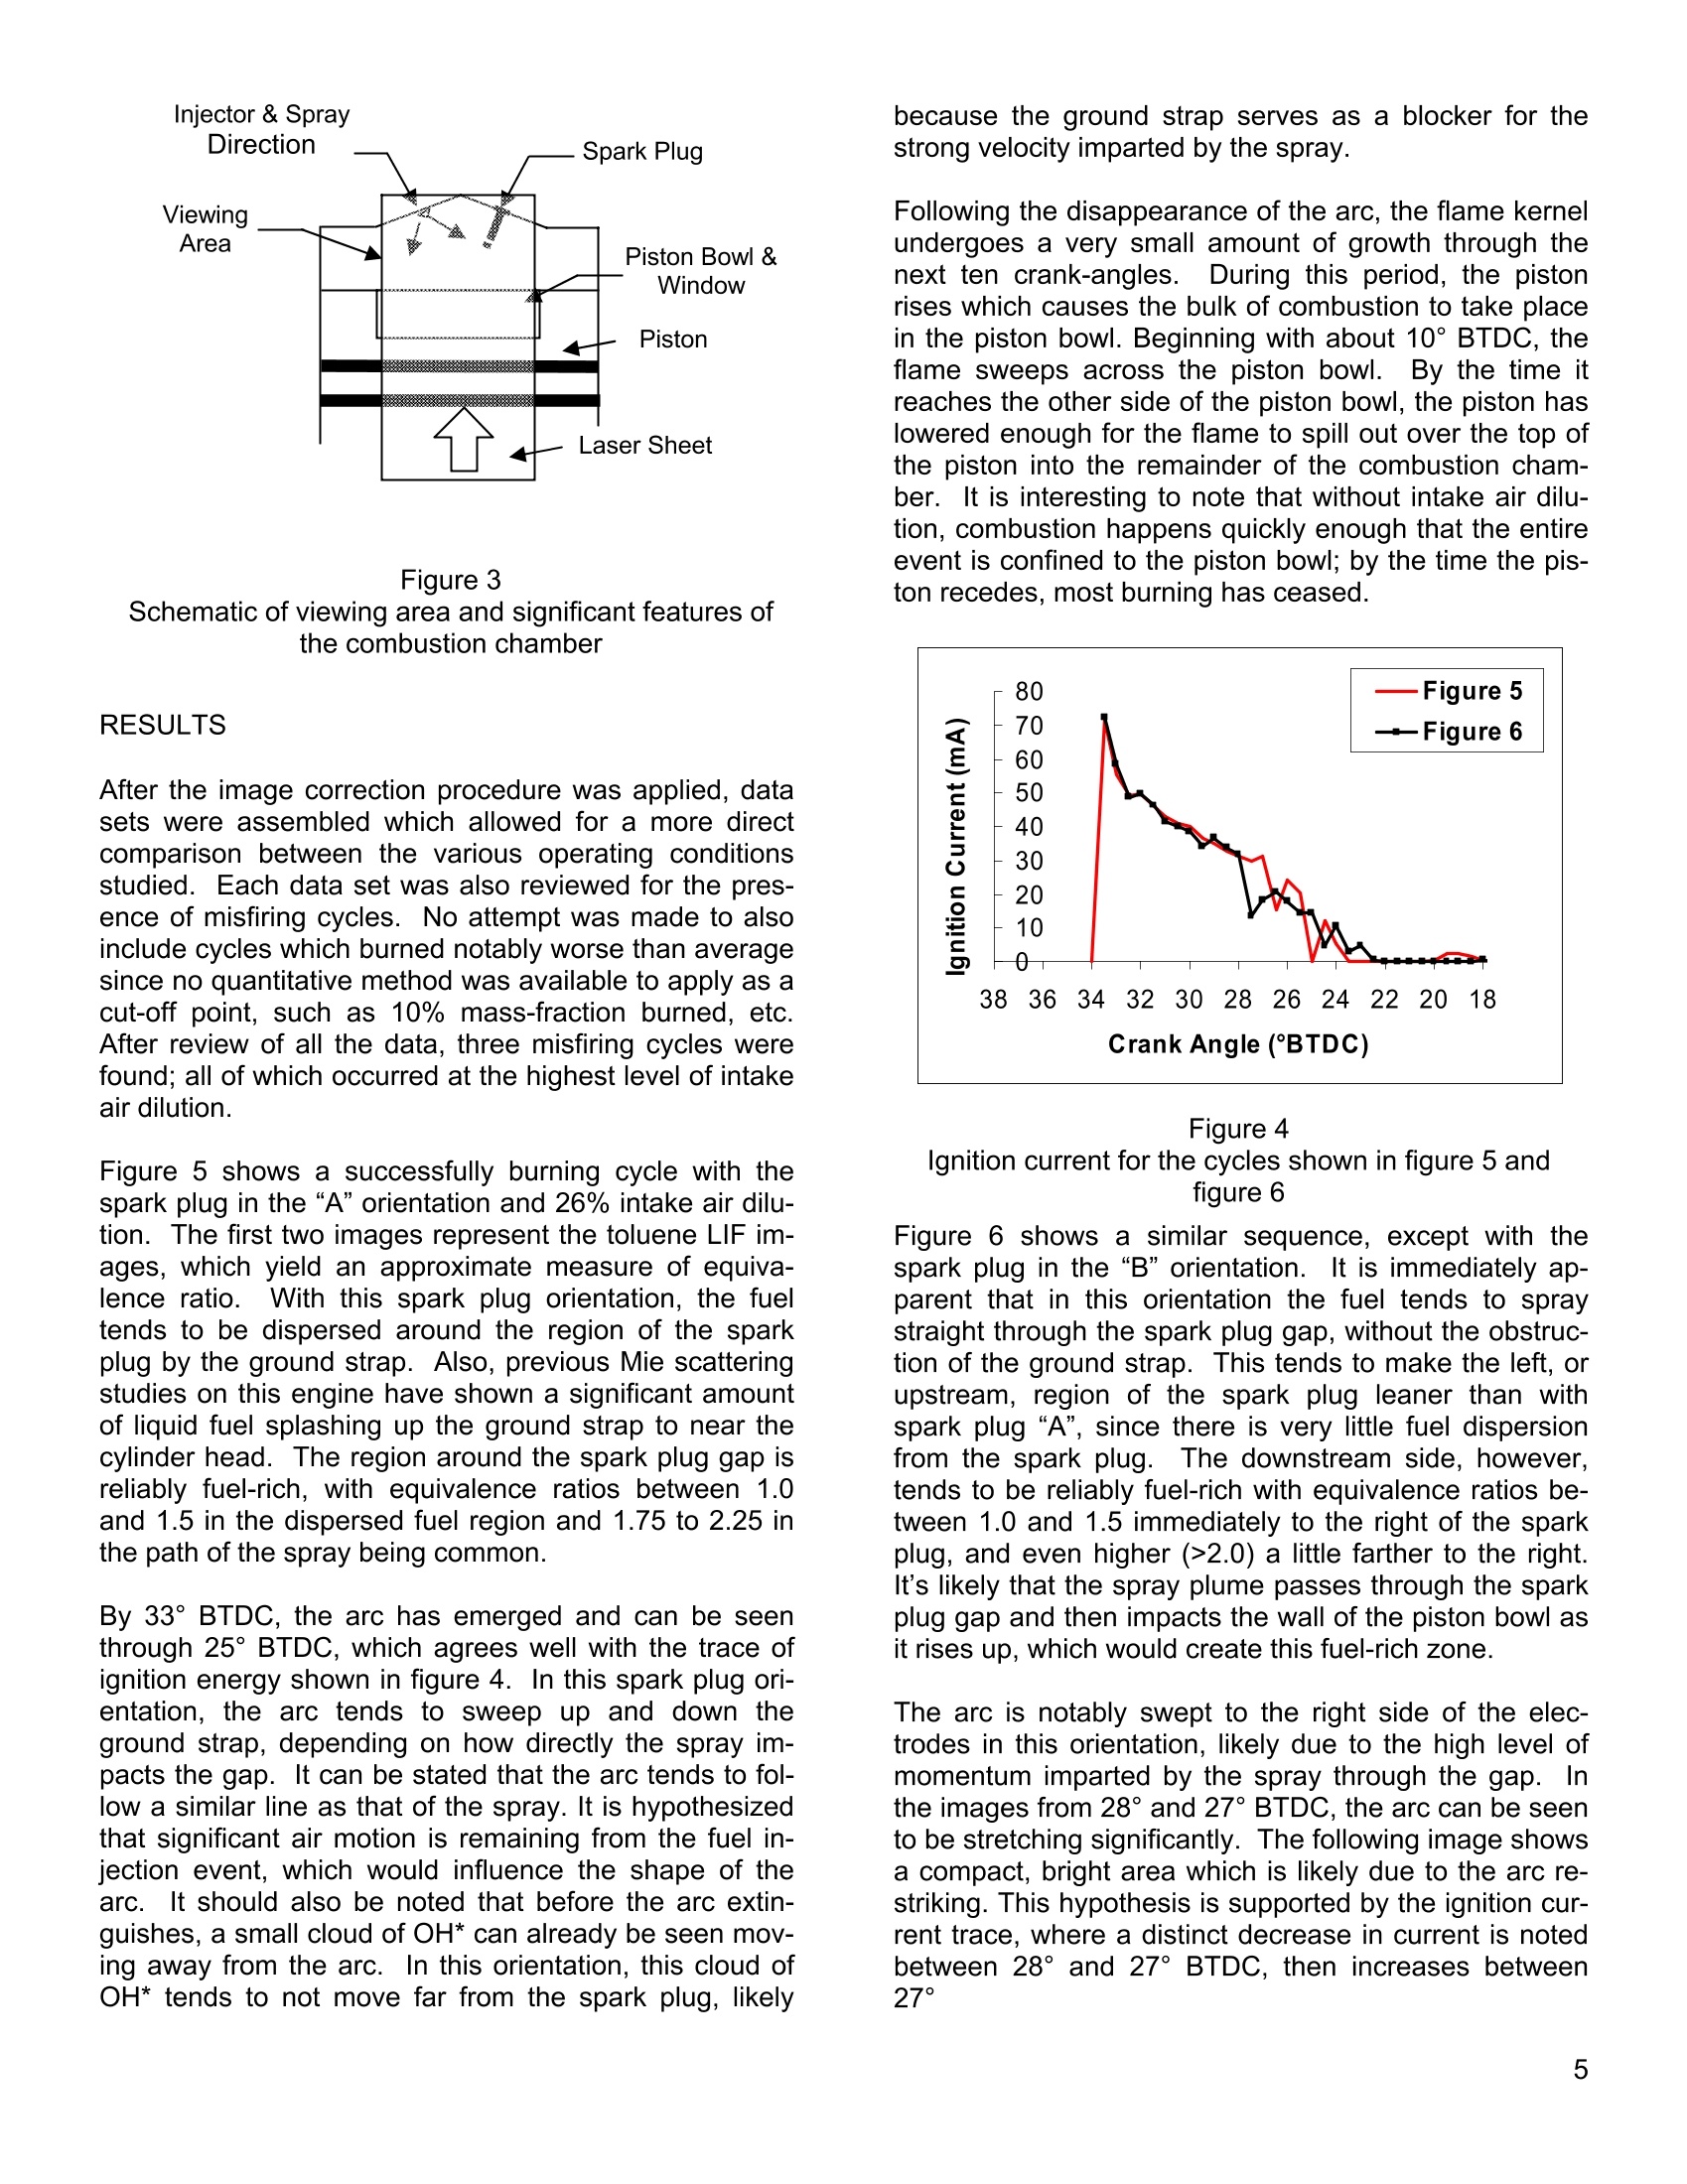
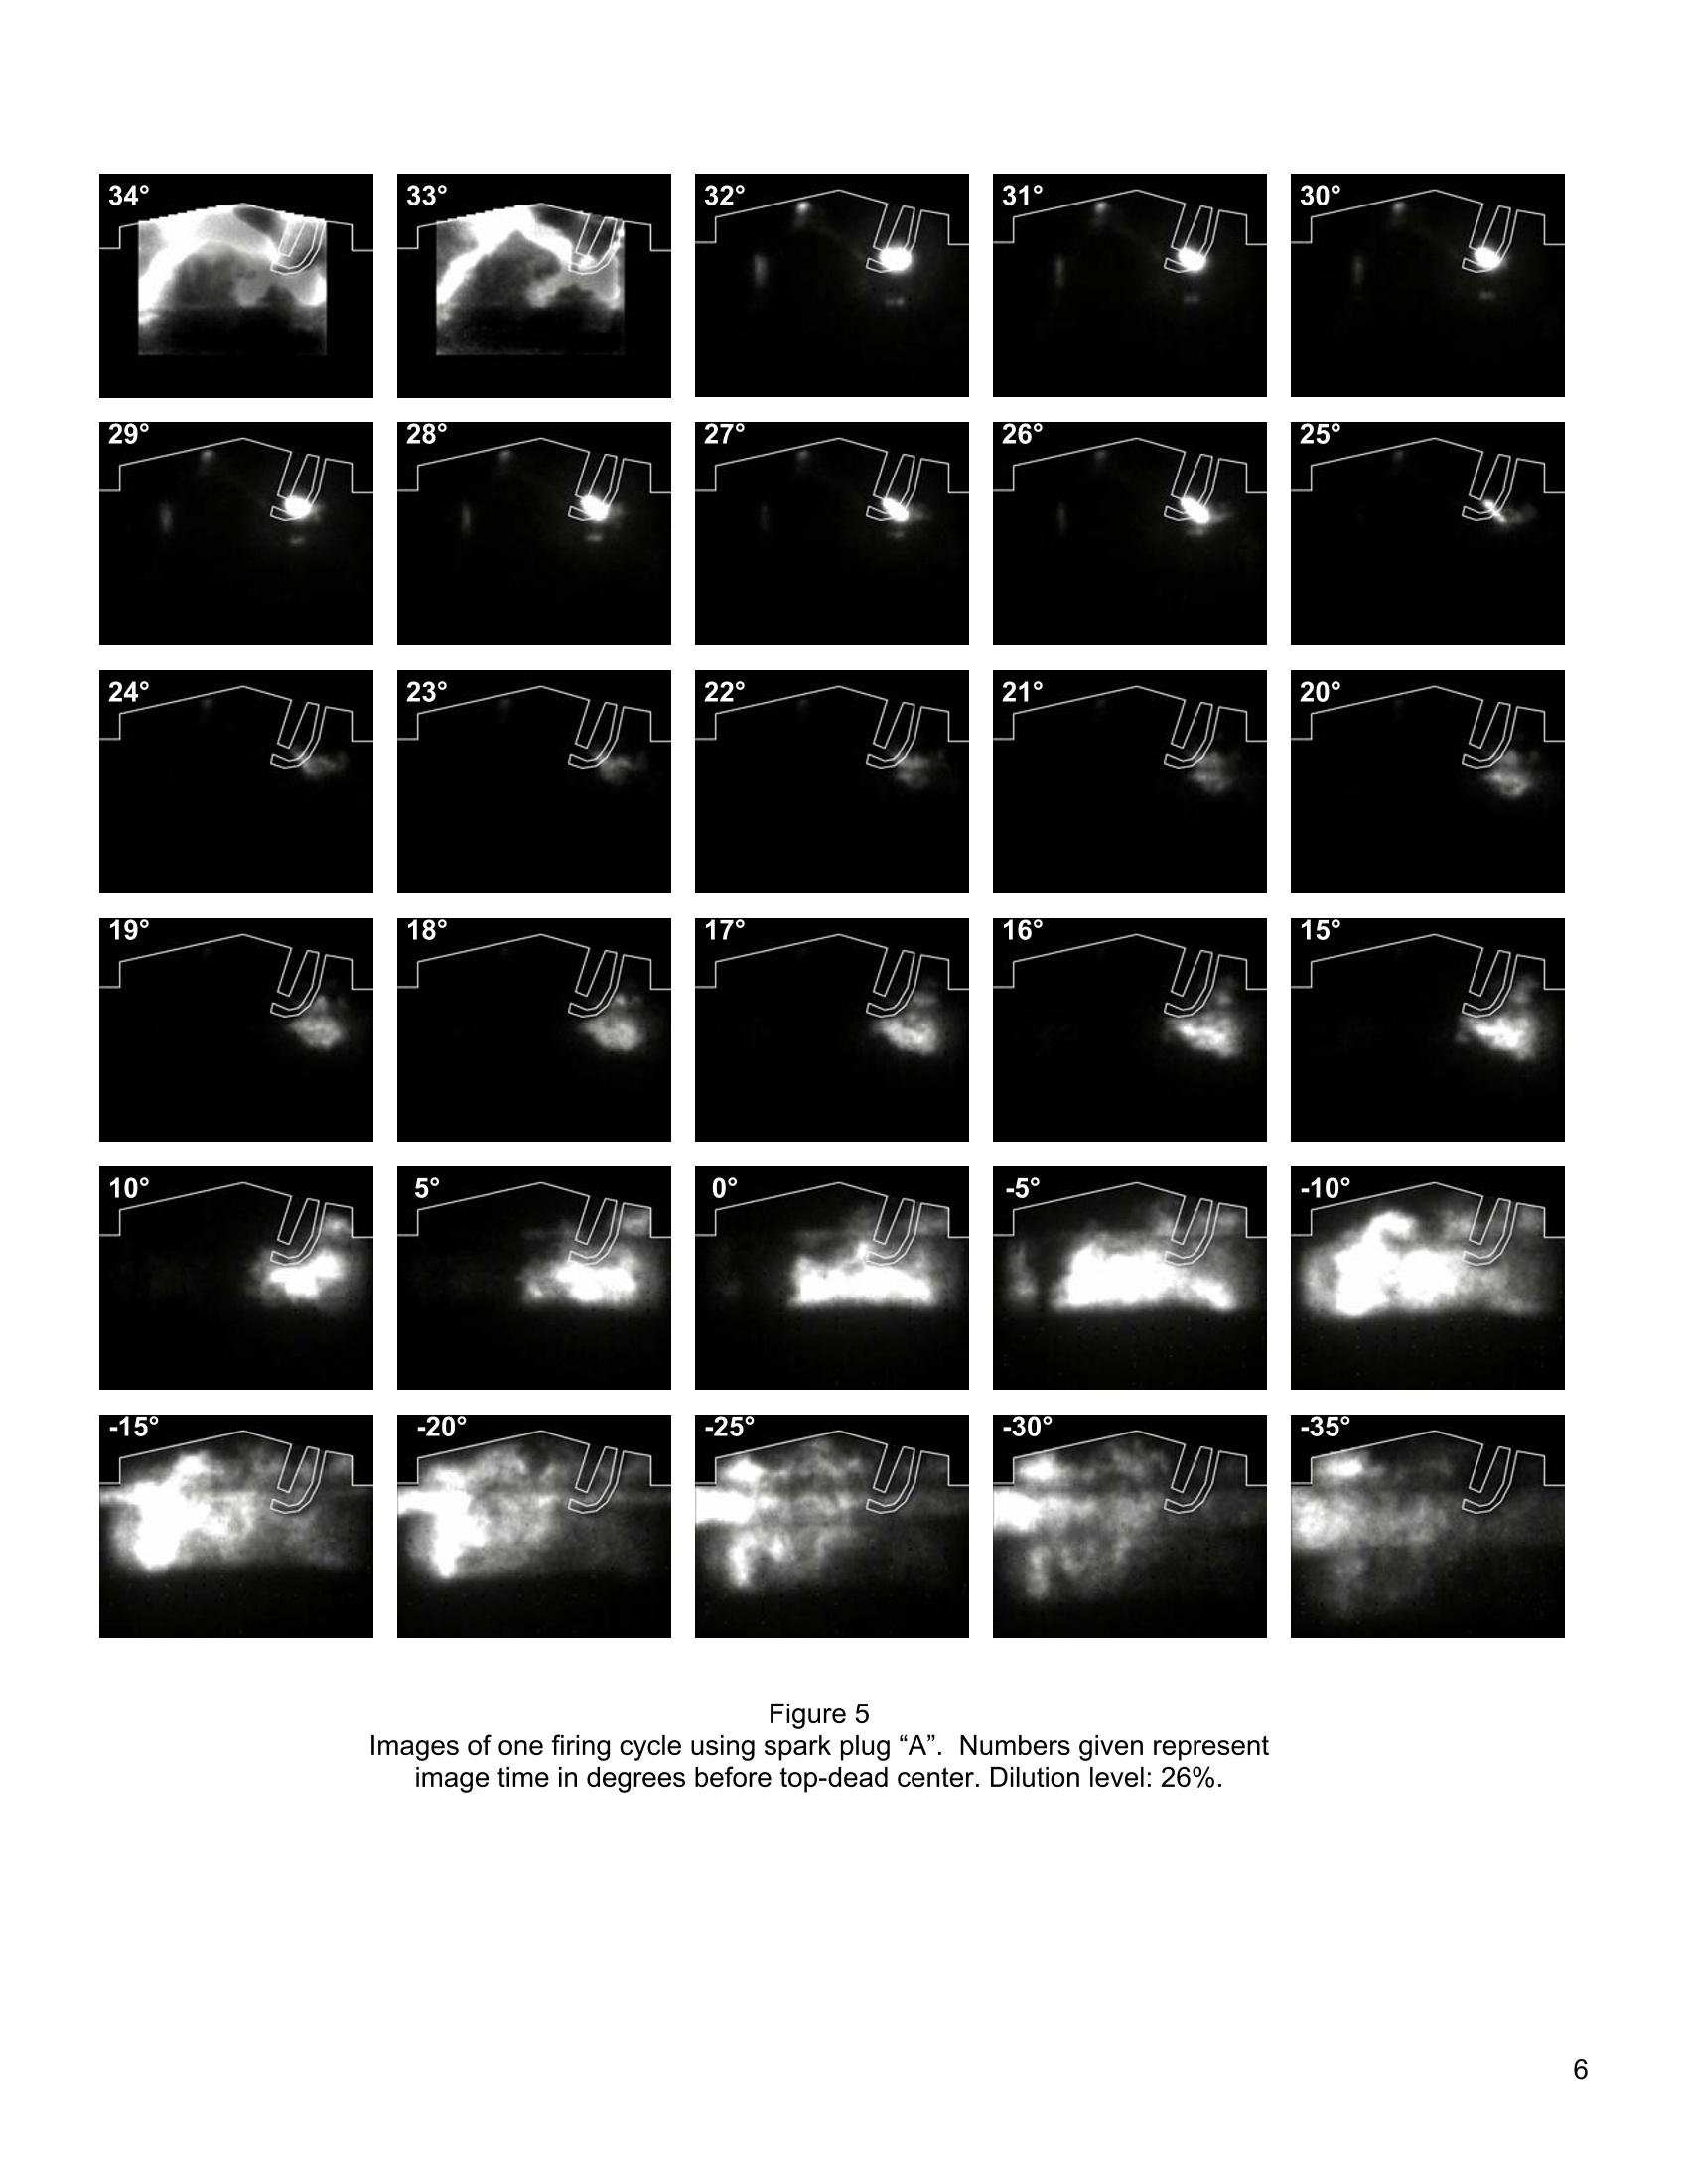
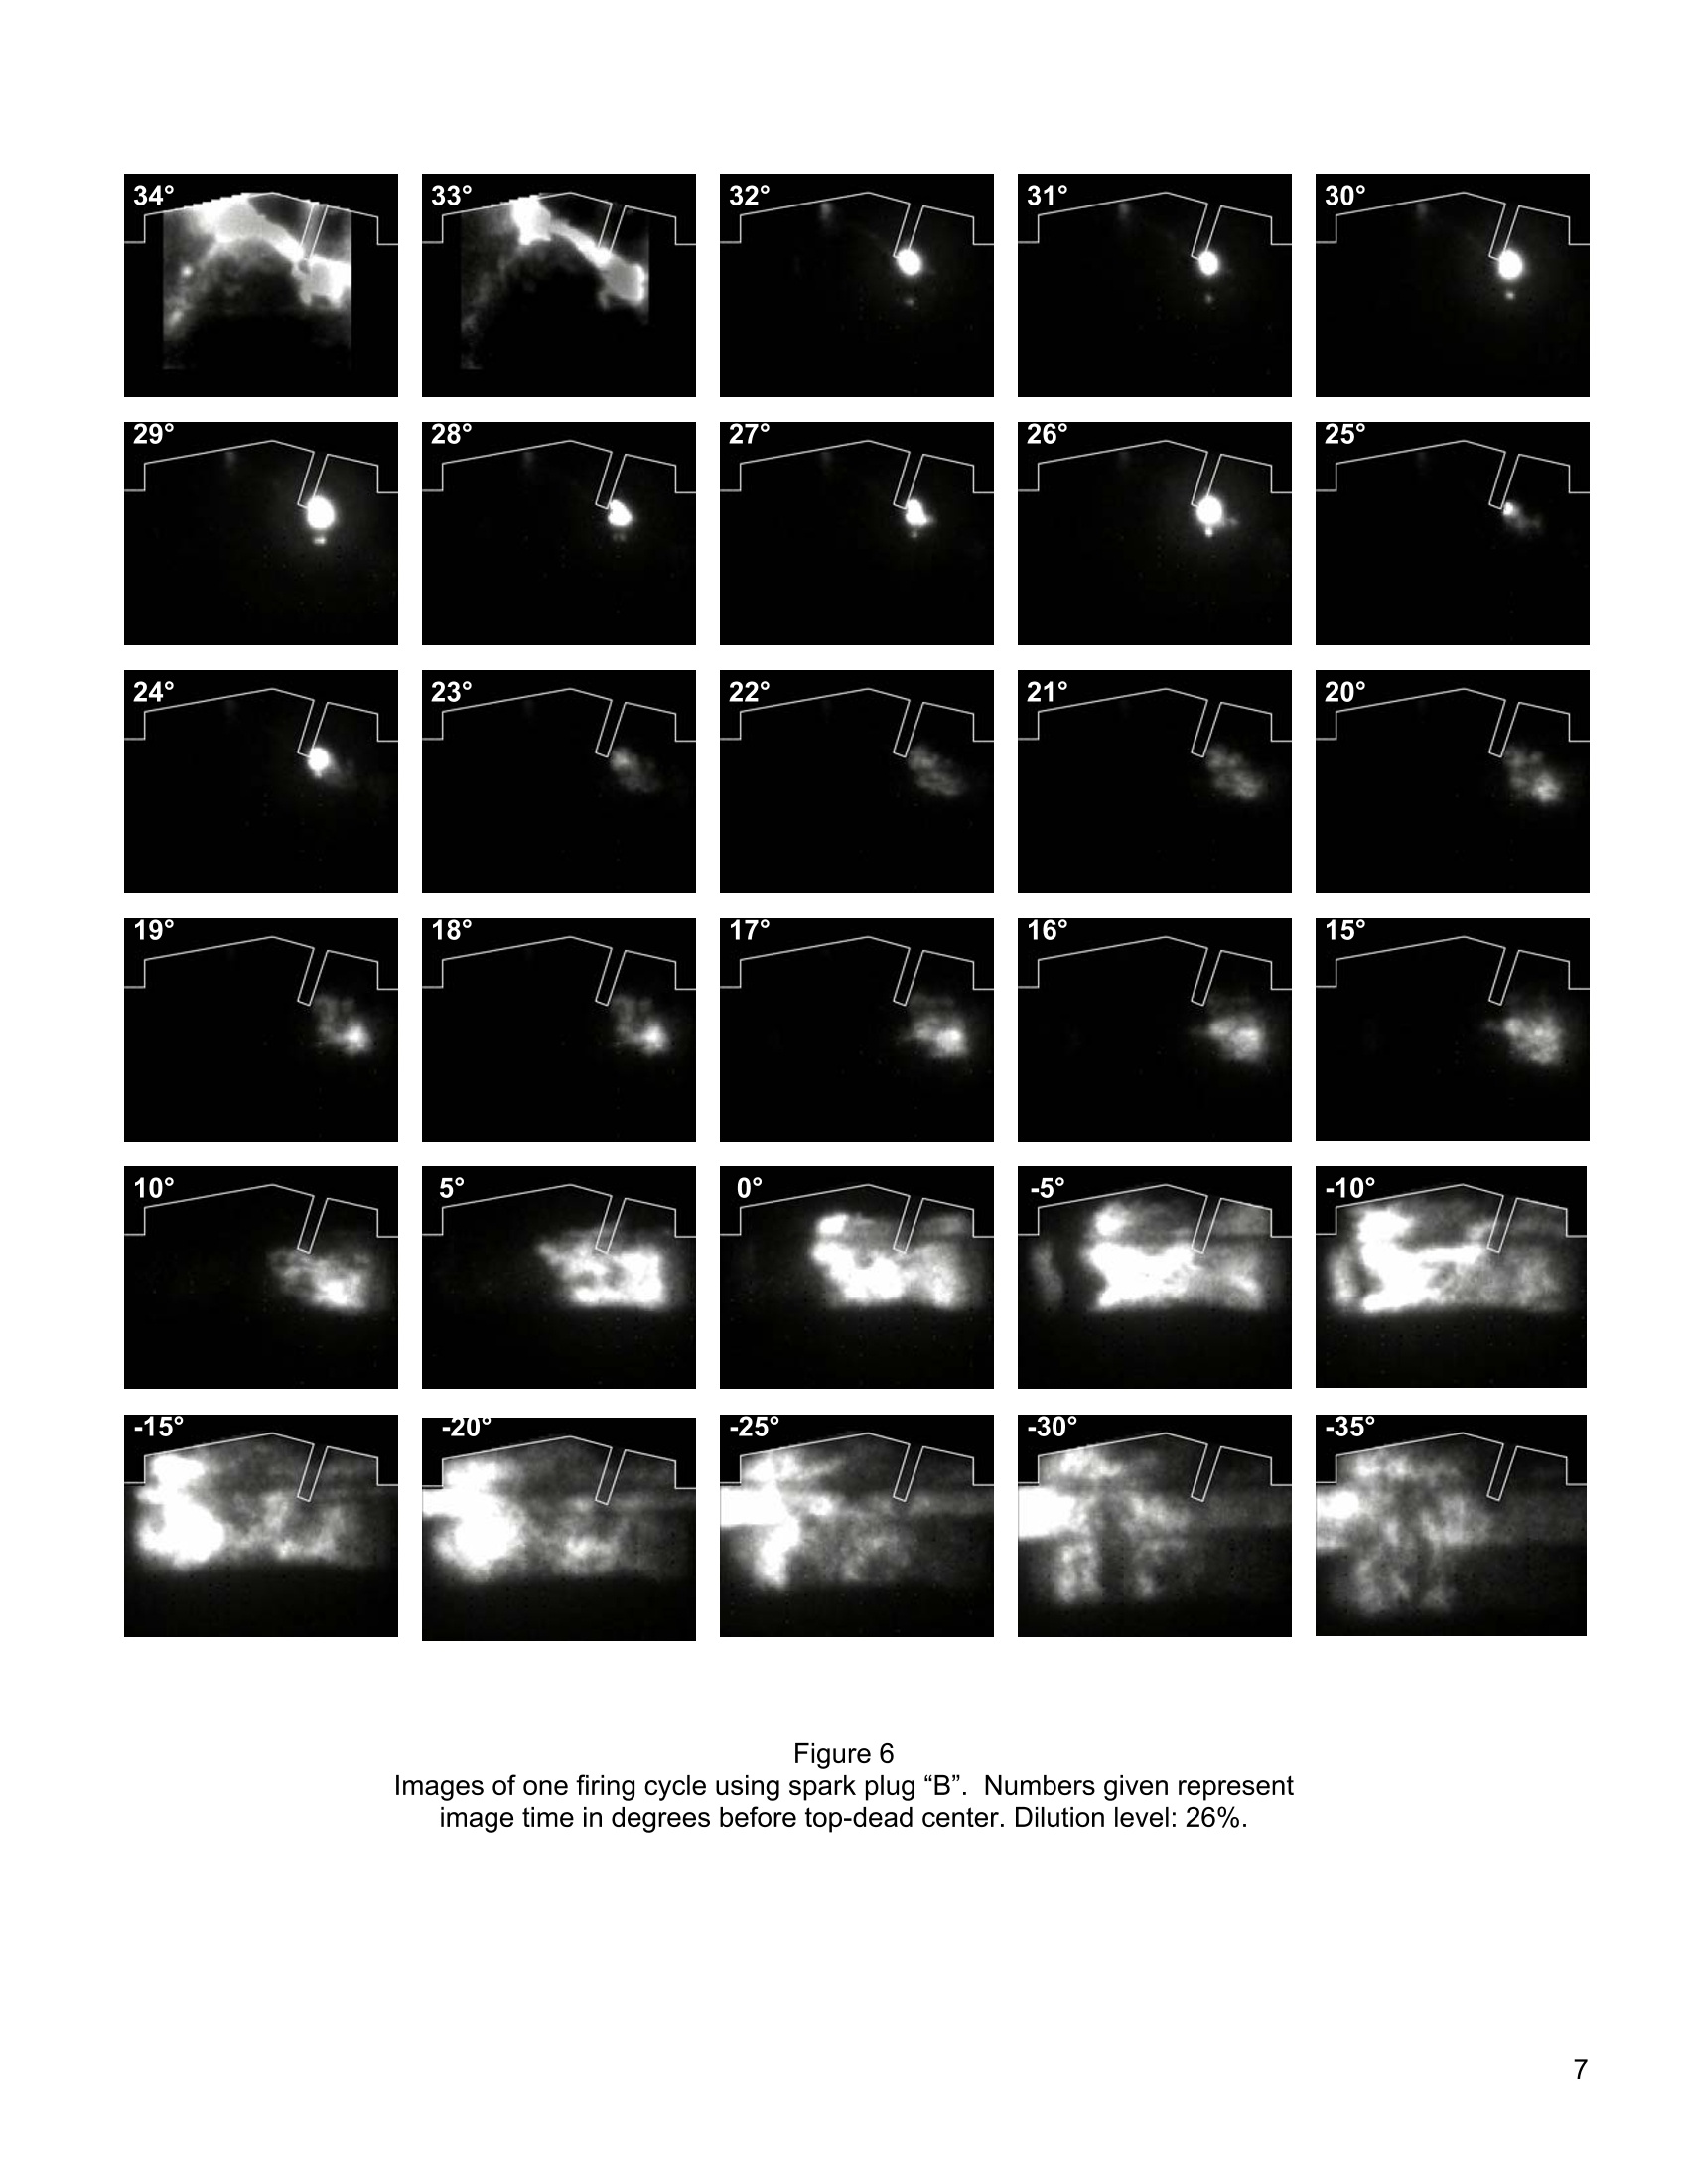
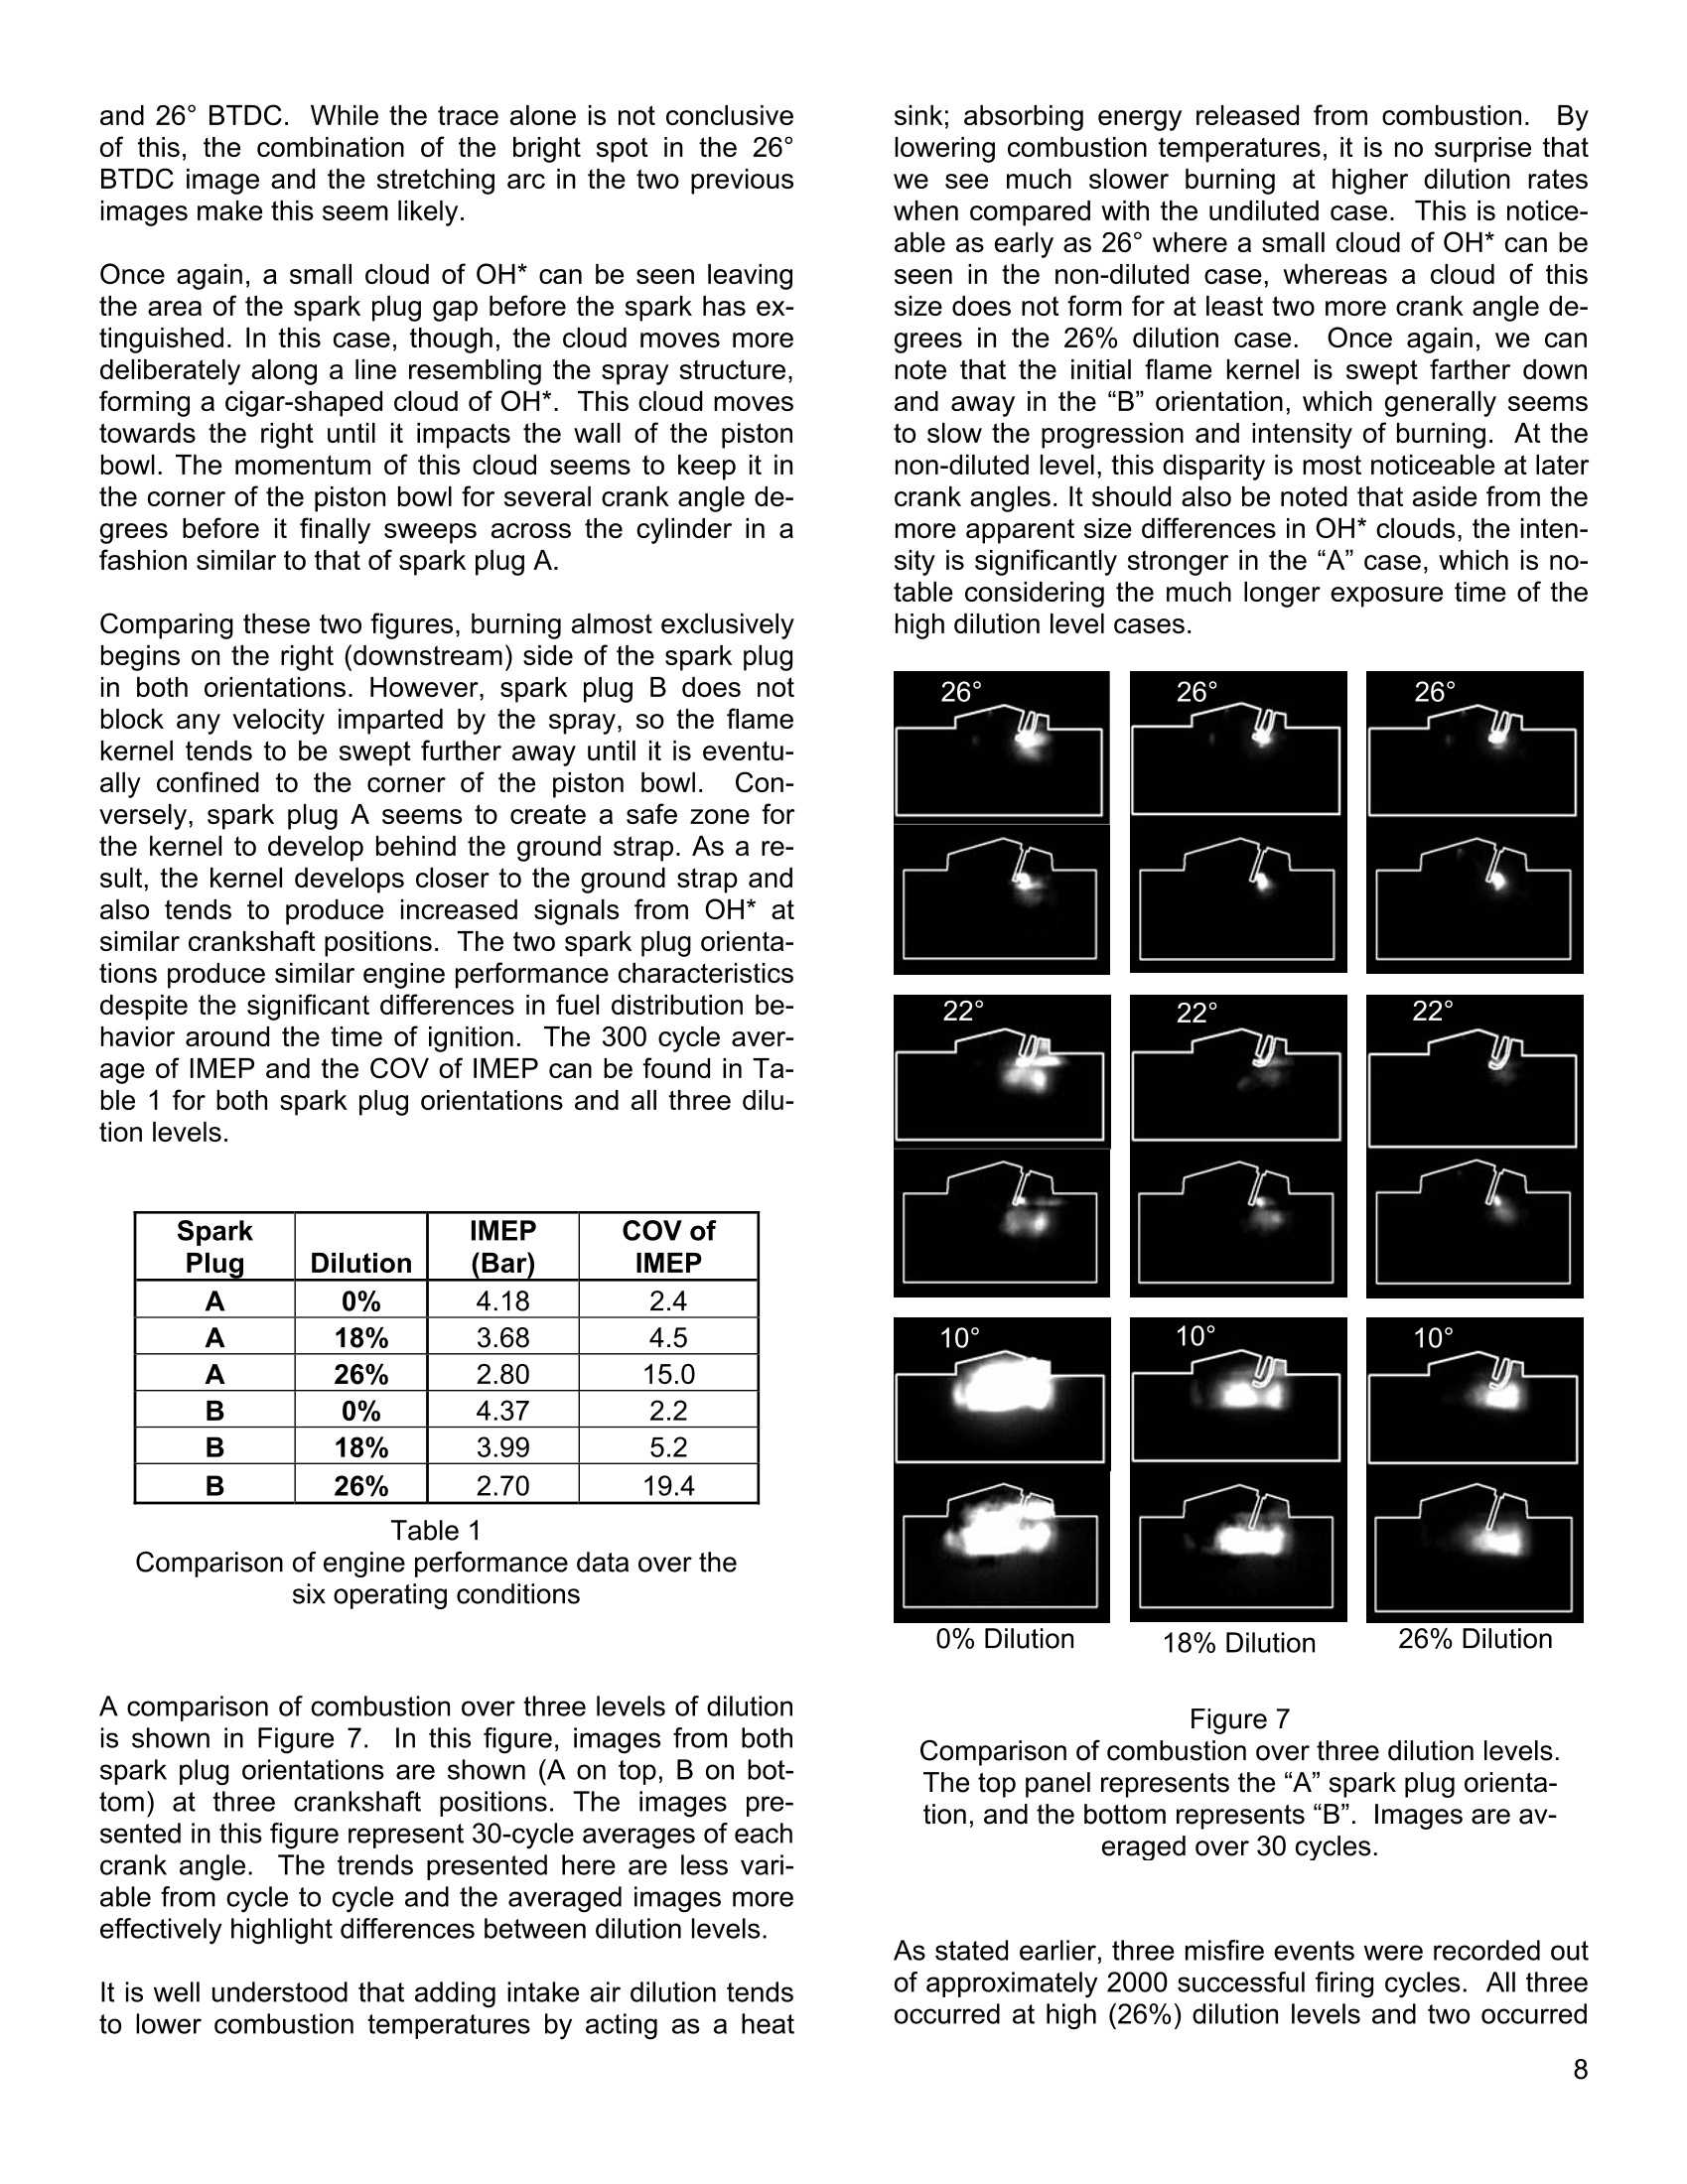
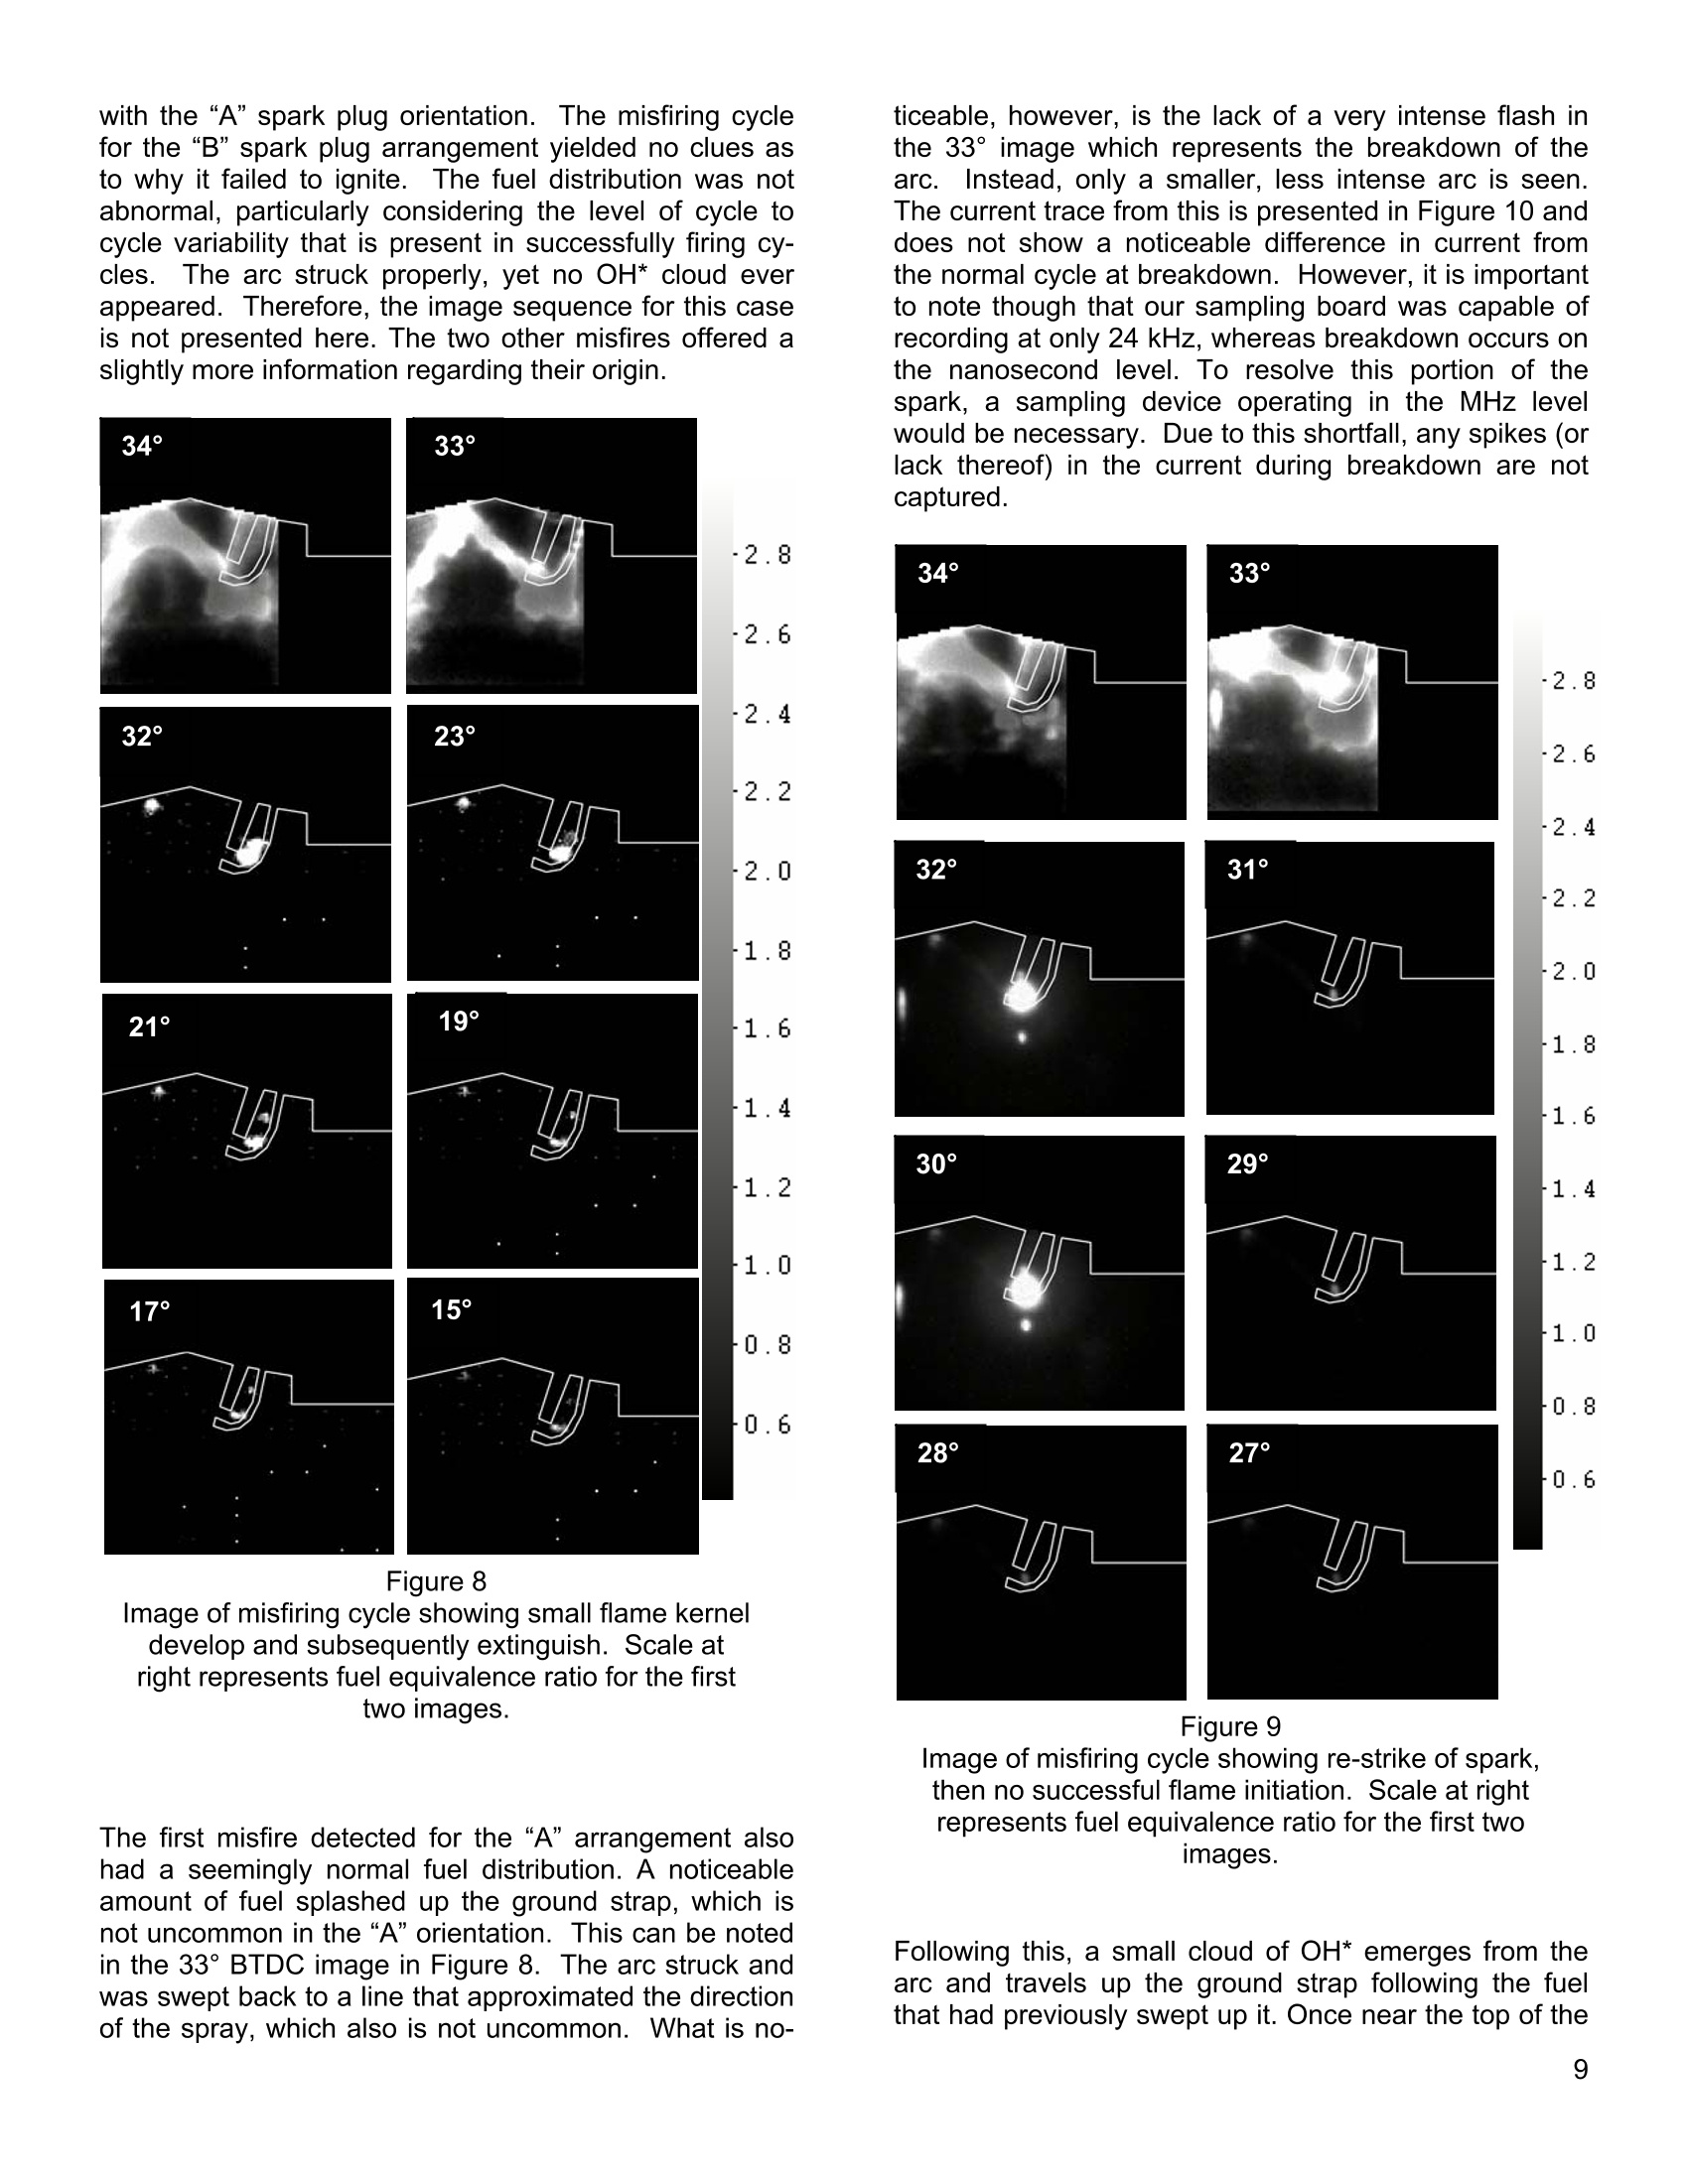
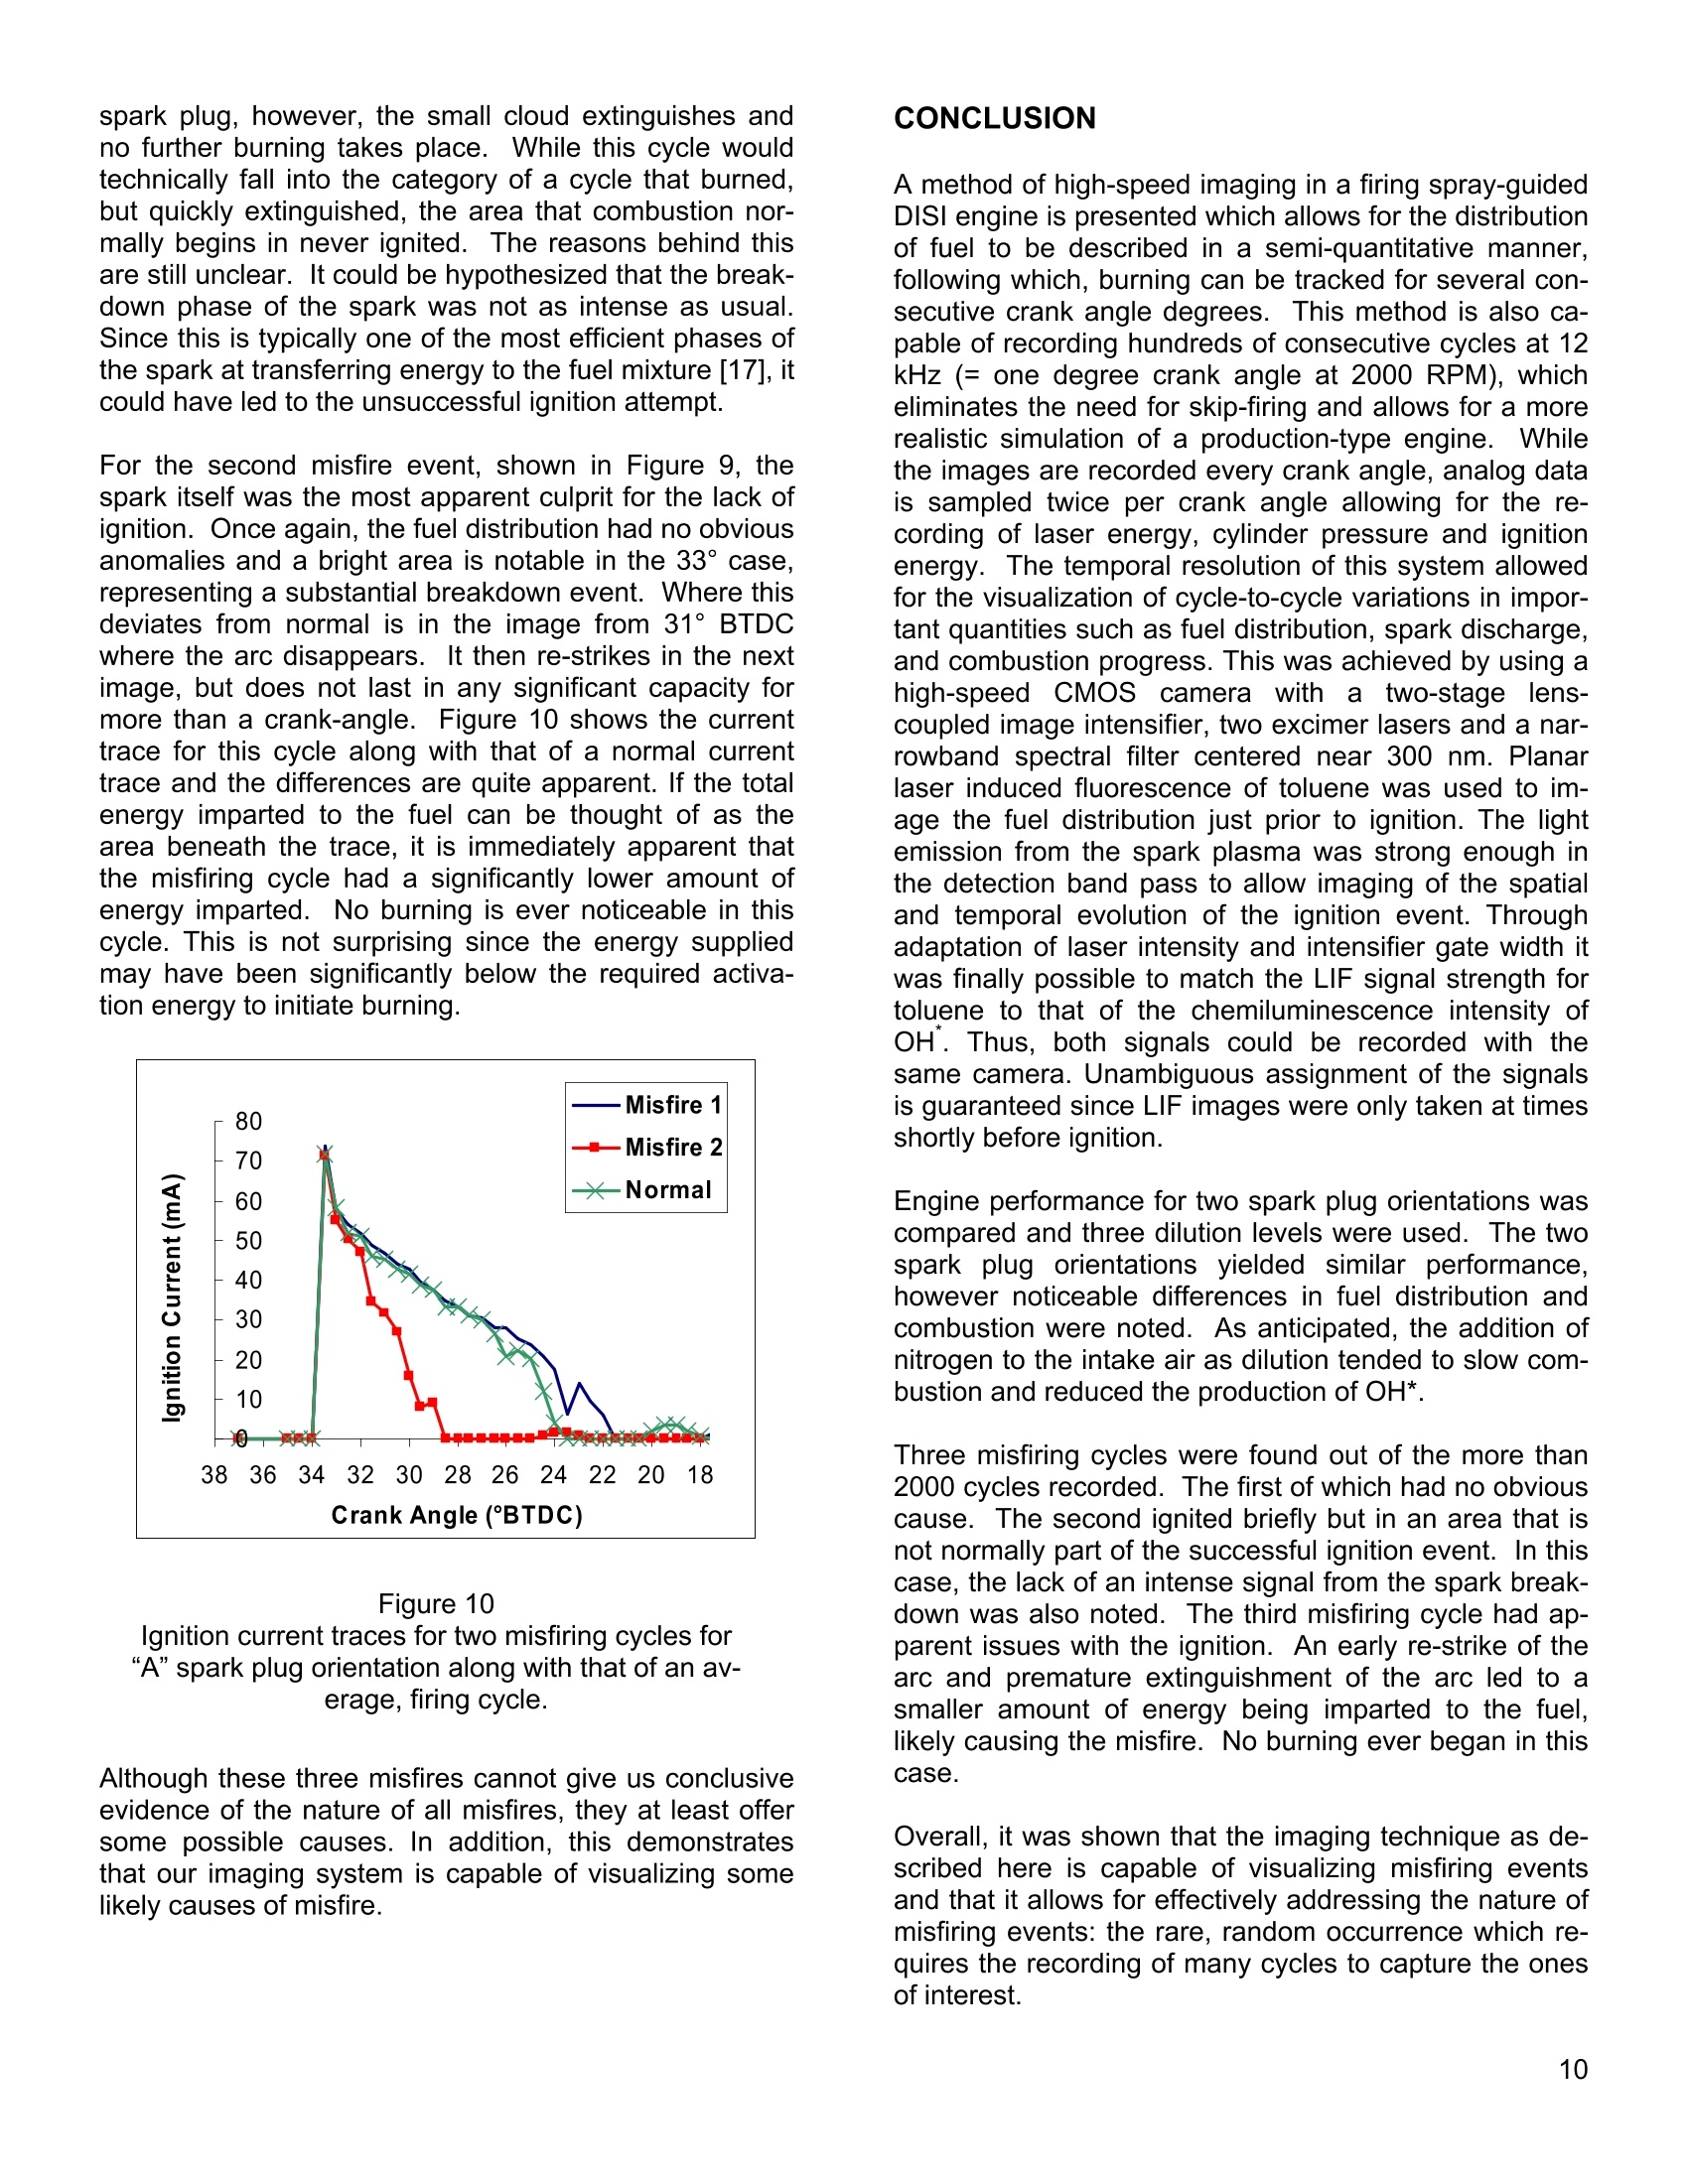
2005-01-3753 Crank-Angle Resolved Imaging of Fuel Distribution, Ignitionand Combustion in a Direct-Injection Spark-Ignition Engine James D.Smith, Volker SickThe University of Michigan ABSTRACT A combination of imaging techniques for investigationsof highly transient processes and cyclic variations in in-ternal combustion engines is presented. The single high-speed camera setup uses a CMOS camera combinedwith a two-stage image-intensifier and two excimer la-sers. Fuel mixing, ignition and combustion were moni-tored via planar laser induced fluorescence imaging oftoluene as a tracer that was added to iso-octane in com-bination with the simultaneous recording of light emis-sion from the spark plasma and OH chemiluminescenceof the developing flame. Image frame rates of 12 kHz forhundreds of cycles were achieved. Application to misfireevents in a spray-guided gasoline direct-injection engineis described to illustrate the merits of the technique. INTRODUCTION Increasing demand for higher fuel efficiency and loweremissions are driving forces behind the development oflean-burn engine concepts. One such concept, the di-rect-injection spark-ignition engine (DISl), allows for effi-ciencies on par with compression-ignition (CI) engineswithout the drawbacks normally associated with CI en-gines. To achieve this higher efficiency, these enginesdo not rely on throttling to control the power output of theengine. Instead, the mass of fuel injected determinespower output while the mass of air in the cylinder staysrelatively constant. During light load operation, this canlead to a fuel-air mixture that is overall far leaner thanthe limits of flammability; however, by concentrating thefuel in a smaller region around the spark plug, astoichiometric or slightly fuel-rich zone is created whichallows for ignition and combustion to occur.This concen-trated region, or cloud, tends to have high concentrationgradients, so placement of this cloud is crucial to main-taining an ignitable mixture at the spark plug. Three main methods exist for achieving this fuel stratifi-cation: wall guiding, air guiding and spray guiding [1].Wall guiding relies on features of the combustion cham-ber to direct and concentrate the fuel around the sparkplug. Commonly, fuel is injected towards the piston, where it is subsequently deflected back towards thespark plug. This has been deemed to be a reliablemethod of direct injection, as demonstrated by currentproduction vehicles using this technology. One down-side, however, is that the high level of wall wetting canlead to increased HC emissions as well as pool fireswhich tend to produce soot. Air guided concepts relyon varying levels of tumble, swirl and squish flows tomaintain fuel stratification. This concept offers the prom-ise of little wall wetting but at the expense of requiringcomplex methods of managing bulk air flow in the cylin-der. The final method, which is the focus of this study, isthe spray guided or spray jet controlled (SJC) concept.In this: concept, thefuel injector develops high-momentum spray plumes that can be targeted at impor-tant combustion chamber features such as the sparkplug. This concept offers lower wall wetting while notrequiring the complex in-cylinder flows as in an air-guided concept. The high levels of stratification, in addition to complexflows generated by the spray, tend to cause significantvariations in cycle-to-cycle performance. In addition, thisconcept has a tendency for random misfire events whichkeep it from reaching a level of further development. Forthese reasons, a method of optically tracking fuel distri-bution, ignition and combustion on a crank-angle re-solved basis has been developed. Optical diagnostics of engines is not new area of re-search. Researchers as far back as the 1930s trackedburning through quartz head windows and drum-typecameras..In the early 1960s, Bowditch developed atechnique for performing optical diagnostics on an over-head valve engine, which is still used to date [2]. Theavailability of high powered lasers over the last 20 yearshas allowed for not only the visualization of chemilumi-nescence, but also of fuel species and pollutants suchas NO [3]. One of the most common laser diagnostictools used is planar laser-induced fluorescence (PLIF),in which a laser sheet is used to excite a species in a 2-D plane. Fuel studies using this technique have beenunder development since the early 1990's [4-9]and haveevolved significantly, mostly towards achieving quantita-tive results. While these techniques are achieving good spatial resolution, camera and laser repetition rate limita-tions force phase-averaged investigations in most appli-cations, thereby preventing studies of cause and effectchains in highly transient processes. Commonly, one toten images are taken per cycle and then a number ofcycles are skipped while the camera's memory is trans-ferred. Even the best cases, having up to ten imagesper cycle [10, 11], do not allow the level of detail to berealized to accurately view the ignition process. In addi-tion, the need to skip-fire the engine leads to a conditionthat is less representative of an actual engine. To gainuseful information using these diagnostic tools, it iscommon to average images over several cycles be-cause there is generally only a small number of imagesrecorded (~50 images). Cycle averaging preserves de-tail relating to bulk properties. However, any cycle-to-cycle variation, which is so critical in the operation ofdirect-injection and particularlyspray-guided cdirect-injection engine concepts, is lost. To solve this problem, an optical diagnostic method ispresented that is capable of providing fuel distributioninformation around the time of ignition followed by im-ages of combustion using the OH radical (OH*). Mostimportantly, this is achieved at single crank-angle de-gree (CAD) resolution at 2000 RPM, using a singlecamera. The method also records several hundred con-secutive cycles, which allows for the engine to be oper-ated in a realistic fashion. This method is then appliedto a DISI engine in an attempt to gain insight into thecauses of misfiring cycles. Intake air dilution, or artificialEGR, is used in varying quantities to de-stabilize com-bustion and to also simulate a more realistic operatingregime. Two spark plug orientations are also looked atto discern their effect on ignition and combustion. DISCUSSION THEORY A method for imaging fuel distribution, ignition and com-bustion on a crank-angle resolved basis is presentedusing a single camera imaging system.This methodutilizes laser-induced fluorescence to acquire images offuel distribution around the time of ignition, then combus-tion is tracked using the OH radical. Repetition rate limi-tations on the lasers limit the number of LIF images totwo per cycle, followed by 68 consecutive OH* images. A key principle of this single camera system is havingthe ability to image both LIF and combustion, and to doso with comparable signal intensities. The spray-guidedengine concept tends to operate with locally rich fueldistributions leading to a high level of soot production.The natural luminosity, or chemiluminescence, of thissoot is very strong and effectively drowns out chemilu-minescence from other interesting species produced inthe combustion process. Unfortunately, tracking thissoot signal is not a good measure of the actual flamefront since it only represents areas that are burning rich. For that reason, it is necessary to be able to suppressthis soot signal. A more effective way of tracking flame progress isthrough chemiluminescence from OH*. OH* is a com-bustion intermediate produced in all hydrocarbon flamesand has been used in previous engine studies to trackcombustion [12]. Other species, such as CH, could beused as well, however OH*'s natural emission peakaround 308 nm makes it ideal to use in conjunction withultraviolet-fluorescing fuel tracers and to suppress detec-tion of soot luminosity. To track fuel distribution, a surrogate, non-fluorescingfuel is used and a dopant is added to provide fluores-icence.The reason for this is that normal gasoline hasseveral components that all fluoresce in largely unpre-dictable manners, which makes quantitative measure-ments impossible. In addition, gasoline effectively ab-sorbs ultraviolet laser light, so excitation can become aproblem in a fuel-rich environment. In this study, iso-octane is used as the base fuel because it provides adecent approximation of the evaporative and combustionproperties of gasoline. With the OH* signal centered around 308 nm, it was im-portant to select a fuel tracer that had similar emissioncharacteristics such that one optical filter setup could beused. Toluene was determined to be an excellent candi-date due to its fairly broad emission band from 280 to300 nm. The fluorescence properties of toluene havebeen studied extensively [13, 14] which makes it attrac-tive to use in a quantitative study. The signal is a func-tion of toluene number density, however is also stronglyquenched by oxygen. In areas of vaporized fuel, thistranslates to the signal approximating the fuel equiva-lence ratio under favorable conditions[8, 15, 16]. Thesignal is also dependant on laser energy, pressure andtemperature, which all need to be considered and cor-rected for when making quantitative measurements. In previous studies, having the fuel tracer and combus-tion signals so close in wavelength would have been ahindrance since the signals could not be spatially sepa-rated. In this case, however, temporal spacing betweenthe toluene images and the OH* images provide nodoubt which species is being viewed. This is becausethe toluene is imaged early in the ignition event whereno burning is occurring, thus no OH* is being produced.Later in the cycle, when OH* is forming on larger scales,there is no laser sheet to excite the remaining toluene. After devising a strategy of imaging fuel and combustionon single camera, the relative intensities of each signalneeded to be addressed. Ideally, the signal from thetoluene and OH* would be nearly equal. The toluenesignal is mainly dependent on excitation energy (laserpower) and fuel quantity. Increasing the toluene con-centration above 5% presents issues with laser absorp-tion, so that is not an option. The laser energy is adjust-able, however only within the limits of the lasers and damage thresholds of the optics and the engine as wellas the saturation properties of the fluorescence tracer.The OH* signal is mainly a function of OH* concentrationand camera exposure time. The OH*concentration var-ies throughout the cycle, and cannot be controlled with-out influencing combustion. Therefore, the only way tochange the recorded OH* signal level is to change theexposure, or gate, time of the camera. Increasing thegate time allows more photons to be registered for agiven image. Since the LIF signal is short (nanosecondlifetimes), it is not affected by changes in exposure timesas long as the exposure is at or above the limit of theimaging equipment (100 ns). Given this information, a method for matching signal in-tensities is presented. The first step is to determine anacceptable laser energy that allows for strong signals,but does not damage the equipment. In this study, ap-proximately 10 mJ per pulse at the engine was deter-mined to be a suitable energy level because it was wellwithin the operating limits of the laser and did not dam-age the equipment or saturate the toluene fluorescence.With the laser energy and toluene quantity now fixed,the gain on the image intensifier is adjusted to providethe highest signal without introducing excessive noise.The optimum gain setting for this study was found to be7/10 representing 3 counts per photoelectron and signallevels across the full dynamic range (0-4096 counts).Next, the OH* signal level is matched by increasing ordecreasing the exposure time. Caution must be exer-cised in this step since excessively long exposure timescan lead to blurring of the images. For this reason, gatetimes were kept under 20 us in this study.The exactsetting depended on the engine operating condition,mainly intake air dilution level. Higher levels of dilutiontended to reduce OH* formation, so longer gate timeswere needed to achieve comparable signals. Final gatetime settings were 8, 14, 18 us, for dilution levels of 0%,18% and 26%, respectively. EXPERIMENTAL SETUP The experimental setup consists of three systems: theoptically accessible engine, the image acquisition sys-tem and the excitation system. A schematic of the setupis shown in Figure 1. Access for the laser sheet is pro-vided through a Bowditch-type piston. The signal is col-lected through the full-length quartz cylinder, quartz pen-troof windows and windows in the side of the pistonbowl. The engine was fueled using a multi-hole fuel in-jector, with one spray plume targeted at the spark plug.The fuel, iso-octane and toluene (95/5), was pressurizedto 110 bar using nitrogen and a hydraulic accumulator.Air and diluent (nitrogen) were fed to the engine using asystem of critical orifices, fed by compressed air. Allcases presented in this study were run with 95 kPa MAPto simulate the un-throttled operation of the SIDI engine.Engine speed was controlled using a hydraulic dyna-mometer and the oil and coolant were conditioned to 95°C before running the experiment. In addition to re-cording all fluid temperatures, cylinder pressure was recorded using a fast-response transducer (Kistler) andignition current was recorded using an inductive sensor(Pearson). The image acquisition system is based around a high-speed CMOS camera (Phantom V7.1). This 12-bit cam-era is capable of recording 4800 frames per second(FPS) at full 800x600 pixel resolution, and at reducedresolution at rates of up to 160000 FPS. The currentwork was conducted at 12000 FPS, which allowed aresolution of 384x416 pixels. This camera operates bythe user initiating a sequence which then records im-ages at the specified recording rate until the cameramemory is full. At the current resolution, this was on theorder of 35000 images per experimental run. In addi-tion, framing could be paused during the exhaust andintake strokes where there is no valuable information forthis study. As a result, 70 images per cycle were re-corded beginning at 35°BTDC for more than 400 con-secutive cycles. To improve signal levels, a lens-coupled two-stage image intensifier (LaVision HS-IRO)was used with the camera. This unit can be triggered atrates up to 50000 FPS (sustained fired mode) and hasthe ability to reduce shutter times down to 100 ns. Thecamera and intensifier were both triggered directly fromthe engine crankshaft encoder which ensured good tim-ing agreement with engine events such as injection andignition. The camera has a delay on the order of a fewmicroseconds from the receipt of a trigger pulse to theopening of the electronic shutter. The intensifier had asmaller inherent delay; however an artificial delay wasadded to ensure good synchronization between the twounits. The camera gate was set to 50 ps for all experi-ments and any adjustments in exposure time were madeusing the intensifier. This ensured that the camera wasrecording all signals produced by the intensifier. Formuch shorter intensifier exposure times, the camerawould only be exposed to the dark phosphor on the in-tensifier for longer, which has no detrimental effect onthe image quality..The intensifier had a Halle UV-transparent lens attached and a 4-way reflection filterprovided excellent transmission (>90%) in the region of280 to 315 nm, which effectively blocked any scatteredlaser light but allowed signals from both toluene andOH* to pass. Figure 1 The excitation system consisted of two KrF Excimer la-sers (Lambda-Physik COMPEX 110) operating at 248nm.1.These units are capable of producing pulse ener-gies up to 300 mJ over the 20 ns pulse duration. Themaximum repetition rate of these lasers is limited to 20Hz, which translates to one pulse per laser per enginecycle at 2000 RPM. This is the primary limiting factor forthe number of LIF images that can be obtained per cycle(2 in this case). The light from the lasers was fed into theengine through a cylindrical lens (f=1 m) which pro-duced a sheet with a cross section of approximately 30X .5 mm. A 3% beam splitter was used to direct a smallamount of the light towards a photodiode (LaVision) sothat fluctuations in laser energy could be measured. Thelasers were synchronized to the engine cycle using theelectronic engine controller which was also responsiblefor controlling injection and ignition. The sigrn a(l sfRrsom thisunit was directed to a function generator (SRS) wheredelays could be added before being sent to the lasers.The first laser was triggered with the arrival of the pulsefrom the engine controller. The second pulse was de-layed by approximately 87 us. The average time be-tween crank-angle degrees at 2000 RPM is between 83and 84 us, however small drifts in engine speed canchange this significantly. As a result, the second laserwas delayed slightly longer than necessary to ensure thepulse arrived when the camera and intensifier were re-cording. Since the fluorescence signal is short lived (nslevel), the exact time of arrival of the laser pulse has noeffect on the signal as long as the imaging system isrecording during its arrival. METHODOLOGY This experiment was completed for three intake air dilu-tion levels (0, 18, 26%) and two spark plug orientations.Figure 2 presents a view of the head from the pistonshowing the two orientations. In this visual, imagingwould take place from the left side. For each orientation, Figure 2Schematic of cylinder head showing both spark plugorientations a set of motored data was taken with fuel injected earlyin the cycle. This; wasdone to providee a quasi-homogeneous distribution of fuel, and therefore anyvariations in signal intensity were due to laser sheet in-homogeneities. This is important for the correction pro-cedure which will be described later. For each case, the engine was motored to 2000 RPM, atwhich point the fuel injector and ignition system wereturned on. Fuel injection was triggered at 58°BTDC andthe event lasted for approximately 18 CAD, which in-jected 11mg of fuel per cycle. Ignition was triggered at34°BTDC, which resulted in an arc appearing approxi-mately 0.5 CAD later. No attempt was made to optimizeignition timing as the intake air dilution level was in-creased. Once the engine was firing, it took approxi-mately 30 seconds for the speed to stabilize as the dy-namometer adjusted to the load produced by the engine.This time also allowed the combustion chamber to reacha more uniform temperature. After the speed was stabi-lized, the image acquisition sequence was initiated andran for approximately 20 seconds at which point thecamera’s memory was full and the engine was spundown. During the recording time of the camera, a 300cycle measurement of the cylinder pressure was alsoinitiated which was used to compare general operatingtrends of each case, such as IMEP and COV of IMEP. Following the experiment, the 8.2 Gb image file wastransferred from the camera to a PC for further process-ing. DaVis 7.0 (LaVision) was used for post processing,however the native camera image format needed to betransferred to tagged image format (*.tif) first which re-sulted in a linear change in the image scaling from 0-4096 to 0-65536. To make semi-quantitative measurements of equiva-lence ratio, a number of corrections would need to bemade to the raw LIF images. First, fluctuations in laserenergy were determined to be small and therefore didnot significantly affect the accuracy of the measure-ments.. Next, the images needed to be corrected forspatial variations in lightsheet intensity. This was ac-complished by averaging 30 images at both 34°and 33°BTDC from the early injection experiment describedabove. Dividing each LIF image by its respective light-sheet image corrected not only for variations in laserintensity, but also mitigated temperature and pressureeffects since both images were acquired at the sametime in the engine cycle. In addition, the lightsheet imagerepresented a stoichiometric amount of fuel, so the im-ages were normalized to an equivalence ratio of 1. Atthis point, the images had effectively been corrected fortemperature, pressure, lightsheet variations and alsobeen scaled to a homogeneous fuel quantity.. The LIFimages, along with the OH* images, had a mask appliedto eliminate scattered light and an overlay was applied toshow important engine structures in the field of view.Figure 3 shows the viewing area of all the images thatwill be discussed. Figure 3 Schematic of viewing area and significant features ofthe combustion chamber RESULTS After the image correction procedure was applied, datasets were assembled which allowed for a more directcomparison between the various operating conditionsstudied. Each data set was also reviewed for the pres-ence of misfiring cycles. No attempt was made to alsoinclude cycles which burned notably worse than averagesince no quantitative method was available to apply as acut-off point, such as 10% mass-fraction burned, etc.After review of all the data, three misfiring cycles werefound; all of which occurred at the highest level of intakeair dilution. Figure 5 shows a successfully burning cycle with thespark plug in the“A” orientation and 26% intake air dilu-tion. The first two images represent the toluene LIF im-ages, which yield an approximate measure of equiva-lence ratio. With this spark plug orientation, the fueltends to be dispersed around the regiNoUnS oMfi rthe sparkplug by the ground strap. Also, previous Mie scatteringstudies on this engine have shown a significant amountof liquid fuel splashing up the ground strap to near thecylinder head. The region around the spark plug gap isreliably fuel-rich, with equivalence ratios between 1.0and 1.5 in the dispersed fuel region and 1.75 to 2.25 inthe path of the spray being common. By 33°BTDC, the arc has emerged and can be seenthrough 25°BTDC, which agrees well with the trace ofignition energy shown in figure 4. In this spark plug ori-entation, the arc tends to sweep up and down theground strap, depending on how directly the spray im-pacts the gap. It can be stated that the arc tends to fol-low a similar line as that of the spray. It is hypothesizedthat significant air motion is remaining from the fuel in-jection event, which would influence the shape of thearc. It should also be noted that before the arc extin-guishes, a small cloud of OH* can already be seen mov-ing away from the arc. In this orientation, this cloud ofOH* tends to not move far from the spark plug, likely Following the disappearance of the arc, the flame kernelundergoes a very small amount of growth through thenext ten crank-angles. During this period, the pistonrises which causes the bulk of combustion to take placein the piston bowl. Beginning with about 10°BTDC, theflame sweeps across the piston bowl. By the time inf thftreaches the other side of the piston bowl, the piston haslowered enough for the flame to spill out over the top ofthe piston into the remainder of the combustion cham-ber. It is interesting to note that without intake air dilu-tion, combustion happens quickly enough that the entireevent is confined to the piston bowl; by the time the pis-ton recedes, most burning has ceased. Figure 4Ignition current for the cycles shown in figure 5 and Figure 6 shows a similar sequence, except with thespark plug in the “B”orientation. It is immediately ap-parent that in this orientation the fuel tends to spraystraight through the spark plug gap, without the obstruc-tion of the ground strap. This tends to make the left, orupstream, region of the spark plug leaner than withspark plug “A", since there is very little fuel dispersionfrom the spark plug. The downstream side, however,tends to be reliably fuel-rich with equivalence ratios be-tween 1.0 and 1.5 immediately to the right of the sparkplug, and even higher (>2.0) a little farther to the right.It’s likely that the spray plume passes through the sparkplug gap and then impacts the wall of the piston bowl asit rises up, which would create this fuel-rich zone. The arc is notably swept to the right side of the elec-trodes in this orientation, likely due to the high level ofmomentum imparted by the spray through the gap. Inthe images from 28° and 27° BTDC, the arc can be seento be stretching significantly. The following image showsa compact, bright area which is likely due to the arc re-striking. This hypothesis is supported by the ignition cur-rent trace, where a distinct decrease in current is notedbetween 28° and 27°BTDC, then increases between27° Figure 5 Images of one firing cycle using spark plug “A". Numbers given representimage time in degrees before top-dead center. Dilution level: 26%. Figure6 Images of one firingcycle using spark plug“B".Numbers given represent image time in degrees before top-dead center. Dilution level: 26%. and 26°BTDC. While the trace alone is not conclusiveof this, the combination of the bright spot in the 26°BTDC image and the stretching arc in the two previousimages make this seem likely. Once again, a small cloud of OH* can be seen leavingthe area of the spark plug gap before the spark has ex-tinguished. In this case, though, the cloud moves moredeliberately along a line resembling the spray structure,forming a cigar-shaped cloud of OH*. This cloud movestowards the right until it impacts the wall of the pistonbowl. The momentum of this cloud seems to keep it inthe corner of the piston bowl for several crank angle de-grees before it finally sweeps across the cylinder in afashion similar to that of spark plug A. Comparing these two figures, burning almost exclusivelybegins on the right (downstream) side ot the spark plugin both orientations. However, spark plug B does notblock any velocity imparted by the spray, so the flamekernel tends to be swept further away until it is eventu-ally confined to the corner of the piston bowl. Con-versely, spark plug A seems to create a safe zone forthe kernel to develop behind the ground strap. As a re-sult, the kernel develops closer to the ground strap andalso tends to produce increased signals from OH* atsimilar crankshaft positions. The two spark plug orienta-tions produce similar engine performance characteristicsdespite the significant differences in fuel distribution be-havior around the time of ignition. The 300 cycle aver-age of IMEP and the COV of IMEP can be found in Ta-ble 1 for both spark plug orientations and all three dilu-tion levels. SparkPlug Dilution IMEP (Bar) COV ofIMEP A 0% 4.18 2.4 A 18% 3.68 4.5 A 26% 2.80 15.0 B 0% 4.37 2.2 B 18% 3.99 5.2 B 26% 2.70 19.4 Table 1Comparison of engine performance data over thesix operating conditions A comparison of combustion over three levels of dilutionis shown in Figure 7. In this figure, images from bothsgAAIpark plug orientations are shown (A on top, B on bot-tom) at three crankshaft positions. The images pre-sented in this figure represent 30-cycle averages of eachcrank angle. The trends presented here are less vari-able from cycle to cycle and the averaged images moreeffectively highlight differences between dilution levels. It is well understood that adding intake air dilution tendsto lower combustion temperatures by acting as a heat sink; absorbing energy released from combustion. Bylowering combustion temperatures, it is no surprise thatwe see much slower burning at higher dilution rateswhen compared with the undiluted case. This is notice-able as early as 26° where a small cloud of OH* can beseen in the non-diluted case, whereas a cloud of thissize does not form for at least two more crank angle de-grees in the 26% dilution case. Once again, we cannote that the initial flame kernel is swept farther downand away in the“B”orientation, which generally seemsto slow the progression and intensity of burning. At thenon-diluted level, this disparity is most noticeable at latercrank angles. It should also be noted that aside from themore apparent size differences in OH* clouds, the inten-sity is significantly stronger in the“A”case, which is no-table considering the much longer exposure time of thehigh dilution level cases. Figure 7 Comparison of combustion over three dilution levels.The top panel represents the“A” spark plug orienta-tion, and the bottom represents“B”. Images are av-eraged over 30 cycles. As stated earlier, three misfire events were recorded outof approximately 2000 successful firing cycles. All threeoccurred at high (26%) dilution levels and two occurred with the “A"spark plug orientation. The misfiring cyclefor the “B”spark plug arrangement yielded no clues asto why it failed to ignite.lThe fuel distribution was notabnormal, particularly considering the level of cycle tocycle variability that is present in successfully firing cy-cles.. The arc struck properly, yet no OH* cloud everappeared. Therefore, the image sequence for this caseis not presented here. The two other misfires offered aslightly more information regarding their origin. ticeable, however, is the lack of a very intense flash inthe 33° image which represents the breakdown of thearc. Instead, only a smaller, less intense arc is seen.The current trace from this is presented in Figure 10 anddoes not show a noticeable difference in current fromthe normal cycle at breakdown. However, it is importantto note though that our sampling board was capable ofrecording at only 24 kHz, whereas breakdown occurs onthe nanosecond level. To resolve this portion of thespark, a sampling device operating in the MHz levelwould be necessary. Due to this shortfall, any spikes (orlack thereof) in the current during breakdown are notcaptured. 34° 33° Figure 8 Image of misfiring cycle showing small flame kerneldevelop and subsequently extinguish. Scale atright represents fuel equivalence ratio for the firsttwo images. Figure 9 Image of misfiring cycle showing re-strike of spark,then no successful flame initiation. Scale at rightrepresents fuel equivalence ratio for the first twoimages. The first misfire detected for the “A”arrangement alsohad a seemingly normal fuel distribution. A noticeableamount of fuel splashed up the ground strap, which isnot uncommon in the“A”orientation. This can be notedin the 33°BTDC image in Figure 8. The arc struck andwas swept back to a line that approximated the directionof the spray, which also is not uncommon. What is no- Following this, a small cloud of OH* emerges from thearc and travels up the ground strap following the fuelthat had previously swept up it. Once near the top of the spark plug, however, the small cloud extinguishes andno further burning takes place. While this cycle wouldtechnically fall into the category of a cycle that burned,but quickly extinguished, the area that combustion nor-mally begins in never ignited. The reasons behind thisare still unclear. It could be hypothesized that the break-down phase of the spark was not as intense as usual.Since this is typically one of the most efficient phases ofthe spark at transferring energy to the fuel mixture [17], itcould have led to the unsuccessful ignition attempt. For the second misfire event, shown in Figure 9, thespark itself was the most apparent culprit for the lack ofignition. Once again, the fuel distribution had no obviousanomalies and a bright area is notable in the 33°case,representing a substantial breakdown event. Where thisdeviates from normal is in the image from 31°BTDCwhere the arc disappears. It then re-strikes in the nextimage, but does not last in any significant capacity formore than a crank-angle. Figure 10 shows the currenttrace for this cycle along with that of a normal currenttrace and the differences are quite apparent. If the totalenergy imparted to the fuel can be thought of as thearea beneath the trace, it is immediately apparent thatthe misfiring cycle had a significantly lower amount ofenergy imparted. No burning is ever noticeable in thiscycle. This is not surprising since the energy suppliedmay have been significantly below the required activa-tion energy to initiate burning. Figure 10 Ignition current traces for two misfiring cycles for“A”spark plug orientation along with that of an av-erage, firing cycle. Although these three misfires cannot give us conclusiveevidence of the nature of all misfires, they at least offersome possible causes. In addition, this demonstratesthat our imaging system is capable of visualizing somelikely causes of misfire. A method of high-speed imaging in a firing spray-guidedDISl engine is presented which allows for the distributionof fuel to be described in a semi-quantitative manner,following which, burning can be tracked for several con-secutive crank angle degrees. This method is also ca-pable of recording hundreds of consecutive cycles at 12kHz (= one degree crank angle at 2000 RPM), whicheliminates the need for skip-firing and allows for a morerealistic simulation of a production-type engine.Whilethe images are recorded every crank angle,analog datais sampled twice per crank angle allowing for the re-cording of laser energy, cylinder pressure and ignitionenergy. The temporal resolution of this system allowedfor the visualization of cycle-to-cycle variations in impor-tant quantities such as fuel distribution, spark discharge,and combustion progress. This was achieved by using ahigh-speed CMOs camera with2atwo-stage lens-coupled image intensifier, two excimer lasers and a nar-rowband spectral filter centered near 300 nm. Planarlaser induced fluorescence of toluene was used to im-age the fuel distribution just prior to ignition. The lightemission from the spark plasma was strong enough inthe detection band pass to allow imaging of the spatialand temporal evolution of the ignition event. Throughadaptation of laser intensity and intensifier gate width itwas finally possible to match the LIF signal strength fortoluene to that of the chemiluminescence intensity ofOH. Thus, both signals could be recorded with thesame camera. Unambiguous assignment of the signalsis guaranteed since LIF images were only taken at timesshortly before ignition. Engine performance for two spark plug orientations wascompared and three dilution levels were used. The twospark plug orientations yielded similar performance,however noticeable differences in fuel distribution andcombustion were noted. As anticipated, the addition ofnitrogen to the intake air as dilution tended to slow com-bustion and reduced the production of OH*. Three misfiring cycles were found out of the more than2000 cycles recorded. The first of which had no obviouscause. The second ignited briefly but in an area that isnot normally part of the successful ignition event. In thiscase, the lack of an intense signal from the spark break-down was also noted. The third misfiring cycle had ap-parent issues with the ignition. An early re-strike of thearc and premature extinguishment of the arc led to asmaller amount of energy being imparted to the fuel,likely causing the misfire. No burning ever began in thiscase. Overall, it was shown that the imaging technique as de-scribed here is capable of visualizing misfiring eventsand that it allows for effectively addressing the nature ofmisfiring events: the rare, random occurrence which re-quires the recording of many cycles to capture the onesof interest. ACKNOWLEDGMENTS This work was sponsored by General Motors Corpora-tion through the Collaborative Research Laboratory onEngine Systems Research at The University of Michi-aan. The authors would like to thank David L. Reuss ofGeneral Motors R&D for use of his image intensifier. CONTACT Smithdj@umich.edu REFERENCES 1. Zhao, F., M.C. Lai, and D.L. Harrington, Auto-motive Spark-Ignited Direct Injection GasolineEngines. Progress in Energy and CombustionScience,1999.25:p.437-562. 2. Bowditch, F.W.,A New Tool For CombustionResearch. SAE, 1960.610002. 3. Fissenewert, U., V. Sick, and H. Pucher, Char-acterization of Combustion and NO Formation ina Spray-Guided Gasoline Direct-Injection En-gine Using Chemiluminescence Imaging, NO-PLIF, and Fast NO Exhaust Gas Analysis.SAE,2005(2005-01-2089). 4. Einecke, S., C. Schulz, and V. Sick, Measure-ment of Temperature, Fuel Concentration andEquivalence Ratio Fields Using Tracer LIF in ICEngine Combustion. Applied Physics B:Lasersand Optics, 2000.71: p.717-723. 5. Arnold, A., A. Buschmann, B. Cousyn, M.Decker, V. Sick, F. Vannobel, and J. Wolfrum,Simultaneous Imaging of Fuel and Hydroxy/Radicals in an In-Line Four Cylinder SI EngsAFine.SAE Transactions, 1993.102(Journal of En-gines, Section 4): p.1-9. 6. Ghandhi, J.B. and F.V. Bracco, Fuel DistributionEffects on the Combustion of a Direct-InjectionStratified Charge Engine. SAE, 1995(950460). 7. Fujikawa, T.,Y. Nomura, Y. Hattori, T. Kobaya-shi, and M. Kanda, Analysis of Cycle-By-CycleVariation in a Direct Injection Gasoline EngineUsing a Laser Induced Flourescence Technique.International Journal of Engine Research,2003.4(2):p. 143-154. 8. Frieden, D. andV. Sick, Investigation of the FuelInjection, Mixing and Combustion Processes inan SIDI Engine Using Quasi-3D LIF Imaging.SAE,2003(2003-01-0068). 9. Schulz, C. and V. Sick, Tracer-LIF Diagnostics:Quantitative Measurement of Fuel Concentra-tion, Temperature and Fuel/Air Ratio in PracticalCombustion Systems. Progress in Energy andCombustion Science, 2001.31(1): p. 75-83. .10 Hult, J., M. Richter, J. Nygren, M. Alden, A.Hultquist, M. Christensen, and B. Johansson,Application of a High-Repetition Rate Laser Di-agnostic System for Single-Cycle Resolved Im-aging in Internal Combustion Engines. AppliedOptics, 2002. 41(24):p.5002-5014. 11. Miles, R.B., in Applied Combustion Diagnostics,K. Kohse-Hoinghaus and J.B. Jeffries, Editors.2002, Taylor and Francis: New York. 12. Fansler, T.D., M.C. Drake, B.D. Stojkovic, andM.E. Rosalik, Local Fuel Concentration, Ignitionand Combustion in a Stratified Charge Spark lg-nited Direct Injection Engine: Spectroscopic, Im-aging and Pressure-Based Measurements. In-ternational Journal of Engine Research, 2002.4(2):p.61-87. 13. Koban, W., J.D. Koch, R.K. Hanson, and C.Schulz, Absorption and Fluorescence of Tolu-ene Vapor at Elevated Temperatures. Phys.Chem. Chem. Phys.,2004.6:p.2940-2945. 14. Koban, W., J.D. Koch, V. Sick, N. Wermuth,R.K. Hanson, and C. Schulz, Predicting LIF Sig-nal Strength For Toluene and 3-Pentanone Un-der Engine-Related Temperature and PressureConditions. Proc. Combust. Inst., 2005. 30: p.1545-1553. 15. Frieden, D. and V. Sick, A Two-Tracer LIF Strat-egy for Quantitative Oxygen Imaging in EnginesApplied to Study the Influence of Skip-Firing onIn-Cylinder Oxygen Contents of an SIDI Engine.SAE, 2003(2003-01-1114). 16 Reboux, J., D. Puechberty, and F. Dionnet, ANew Approach of Planar Laser Induced Floures-cence Applied to Fuel/Air Ratio Measurement inthe Compression Stroke of an Optical S.I. En-gine. SAE, 1994(941988). 17. Kalghatgi, G.T., Spark Ignition, Early Flame De-velopment and Cyclic Variation in I.C. Engines.SAE,1987(870163). chematic of experimental setup A combination of imaging techniques for investigationsof highly transient processes and cyclic variations in internalcombustion engines is presented. The single highspeedcamera setup uses a CMOS camera combinedwith a two-stage image-intensifier and two excimer lasers.Fuel mixing, ignition and combustion were monitoredvia planar laser induced fluorescence imaging oftoluene as a tracer that was added to iso-octane in combinationwith the simultaneous recording of light emissionfrom the spark plasma and OH* chemiluminescenceof the developing flame. Image frame rates of 12 kHz forhundreds of cycles were achieved. Application to misfireevents in a spray-guided gasoline direct-injection engineis described to illustrate the merits of the technique.
确定

还剩9页未读,是否继续阅读?

产品配置单


北京欧兰科技发展有限公司为您提供《直喷火花塞引燃(DISI)发动机中燃料分布,引燃和燃烧过程的曲轴角分辨成像检测方案(粒子图像测速)》,该方案主要用于汽车电子电器中其他检测,参考标准--,《直喷火花塞引燃(DISI)发动机中燃料分布,引燃和燃烧过程的曲轴角分辨成像检测方案(粒子图像测速)》用到的仪器有德国LaVision PIV/PLIF粒子成像测速场仪、PLIF平面激光诱导荧光火焰燃烧检测系统、汽车发动机多参量测试系统、LaVision SprayMaster 喷雾成像测量系统、LaVision HighSpeedStar 高帧频相机
推荐专场


汽车尾气分析仪
更多


相关方案
更多
该厂商其他方案
更多