


方案详情
文
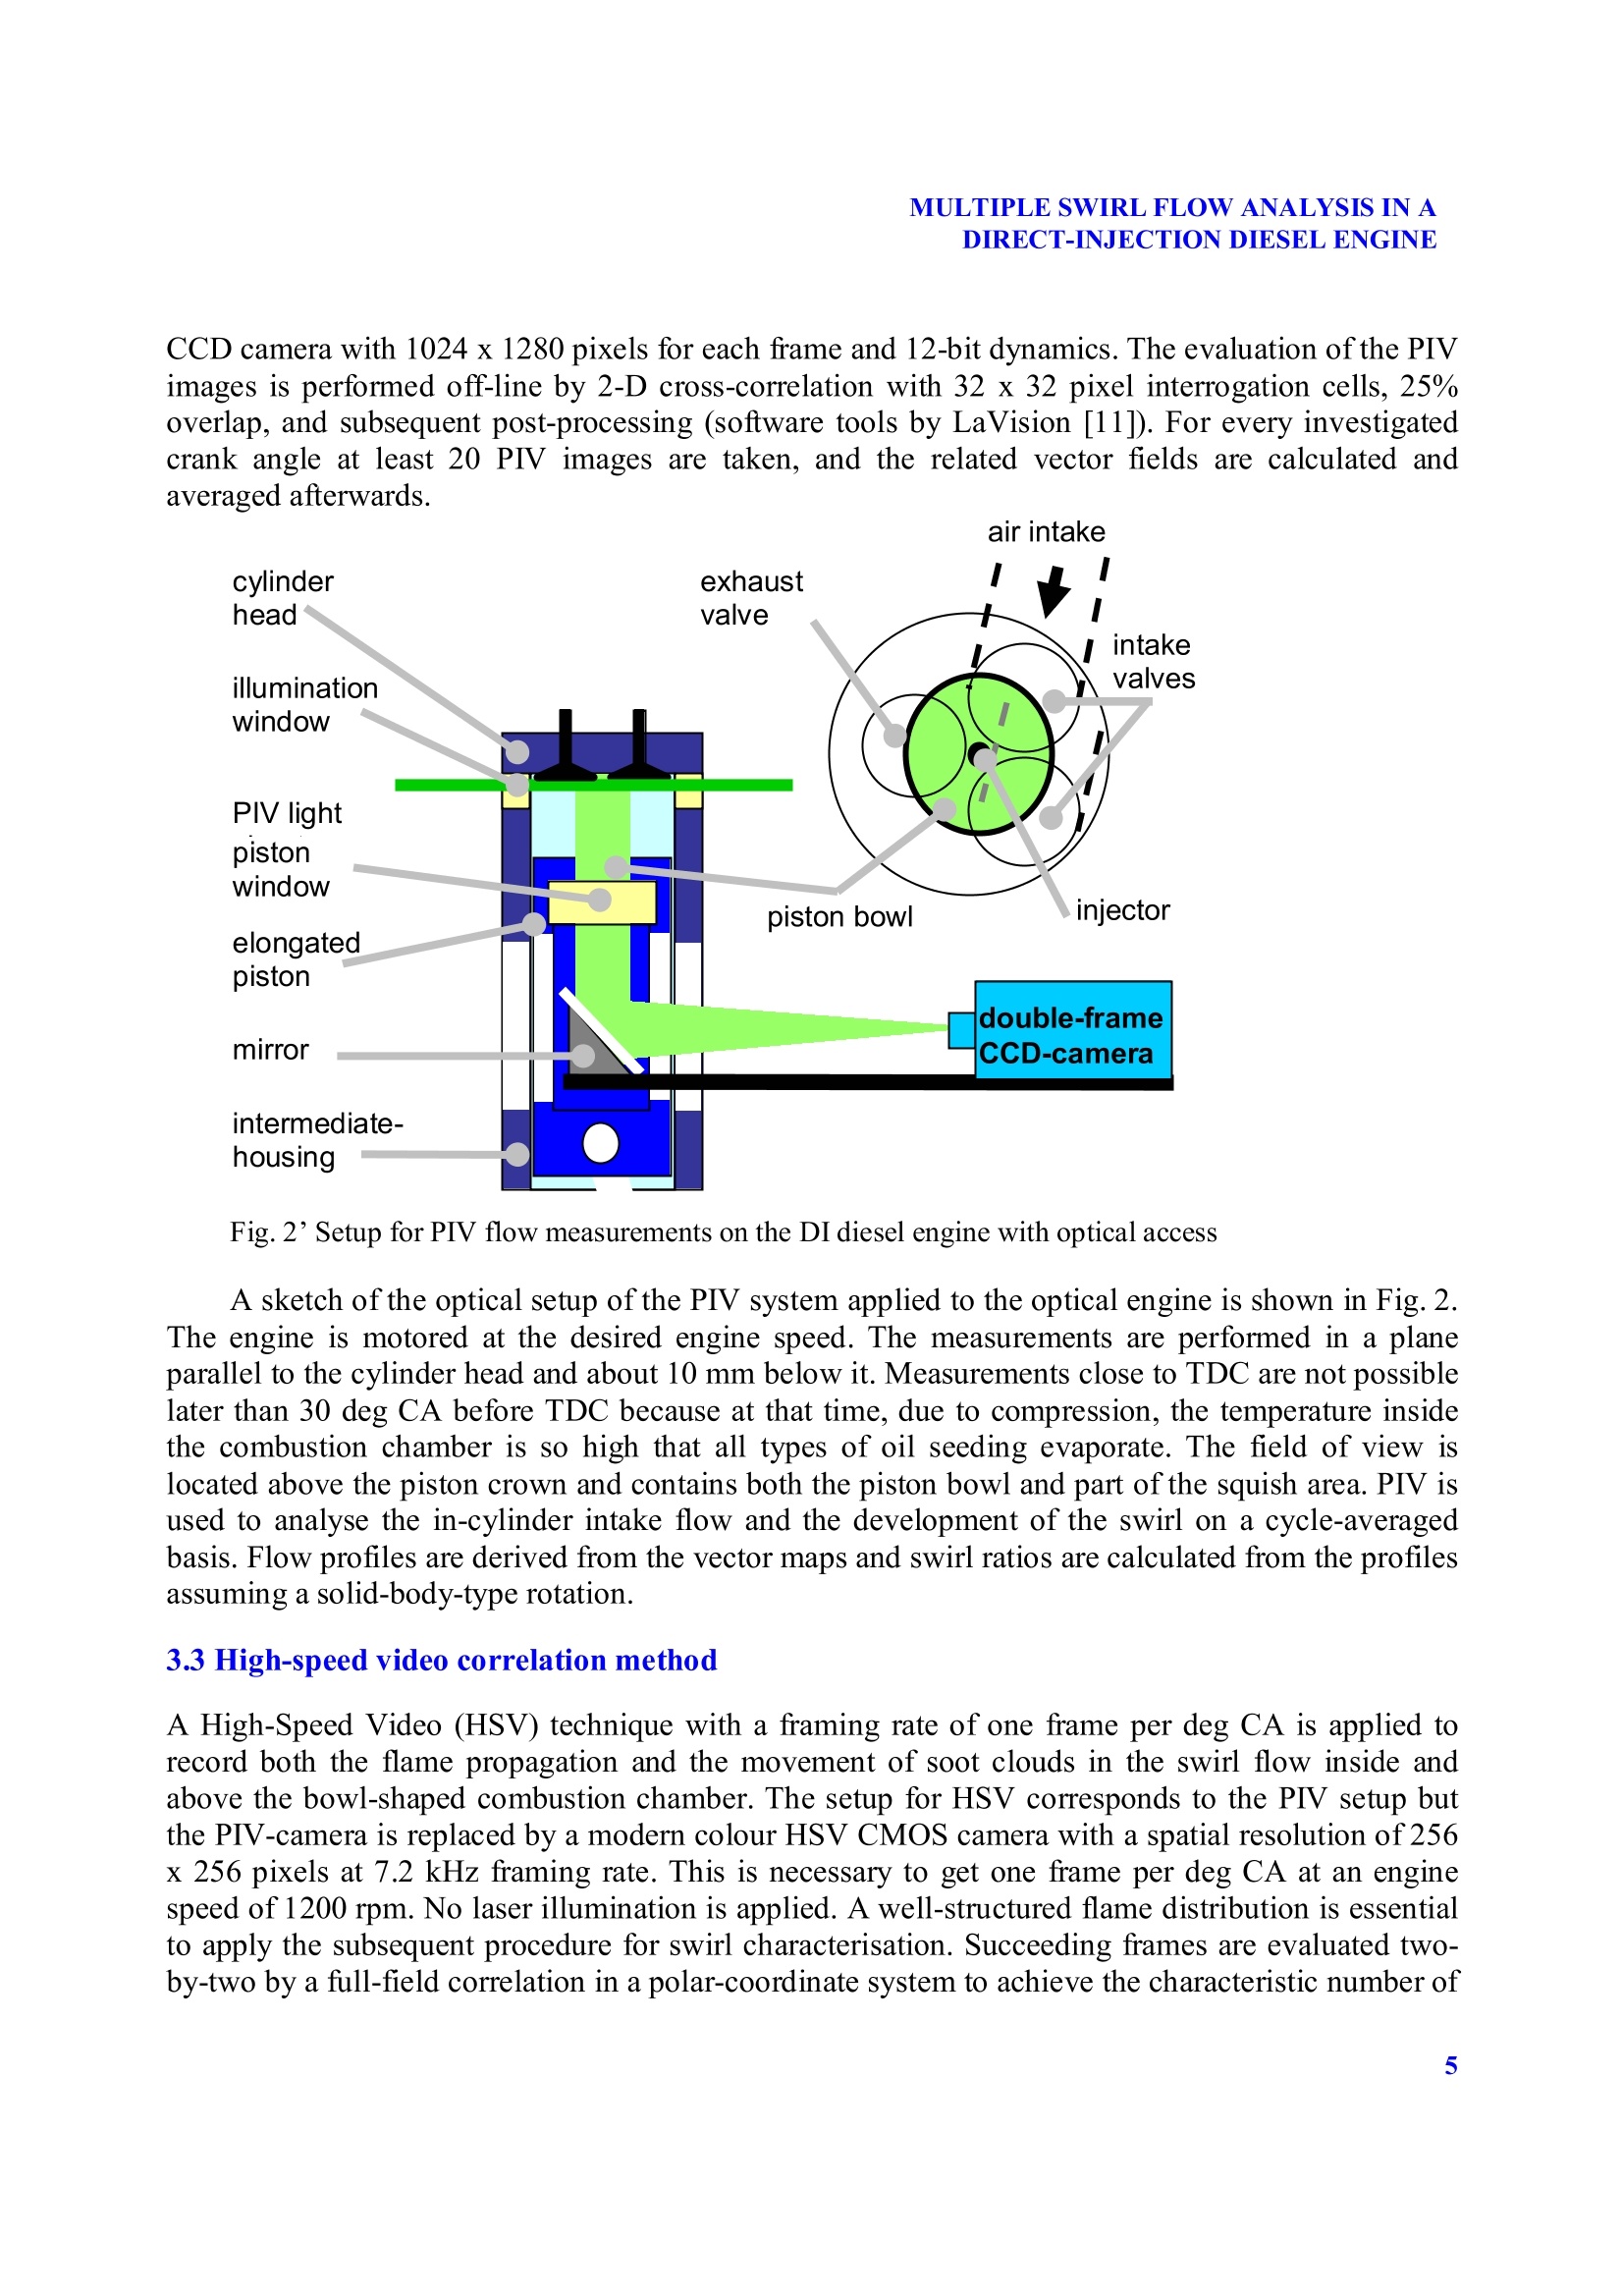
才用LaVision公司特色的DaVis软件平台构成的完整粒子成像测速(PIV)系统对直喷柴油发动机中多漩涡流动进行了测量和分析
方案详情

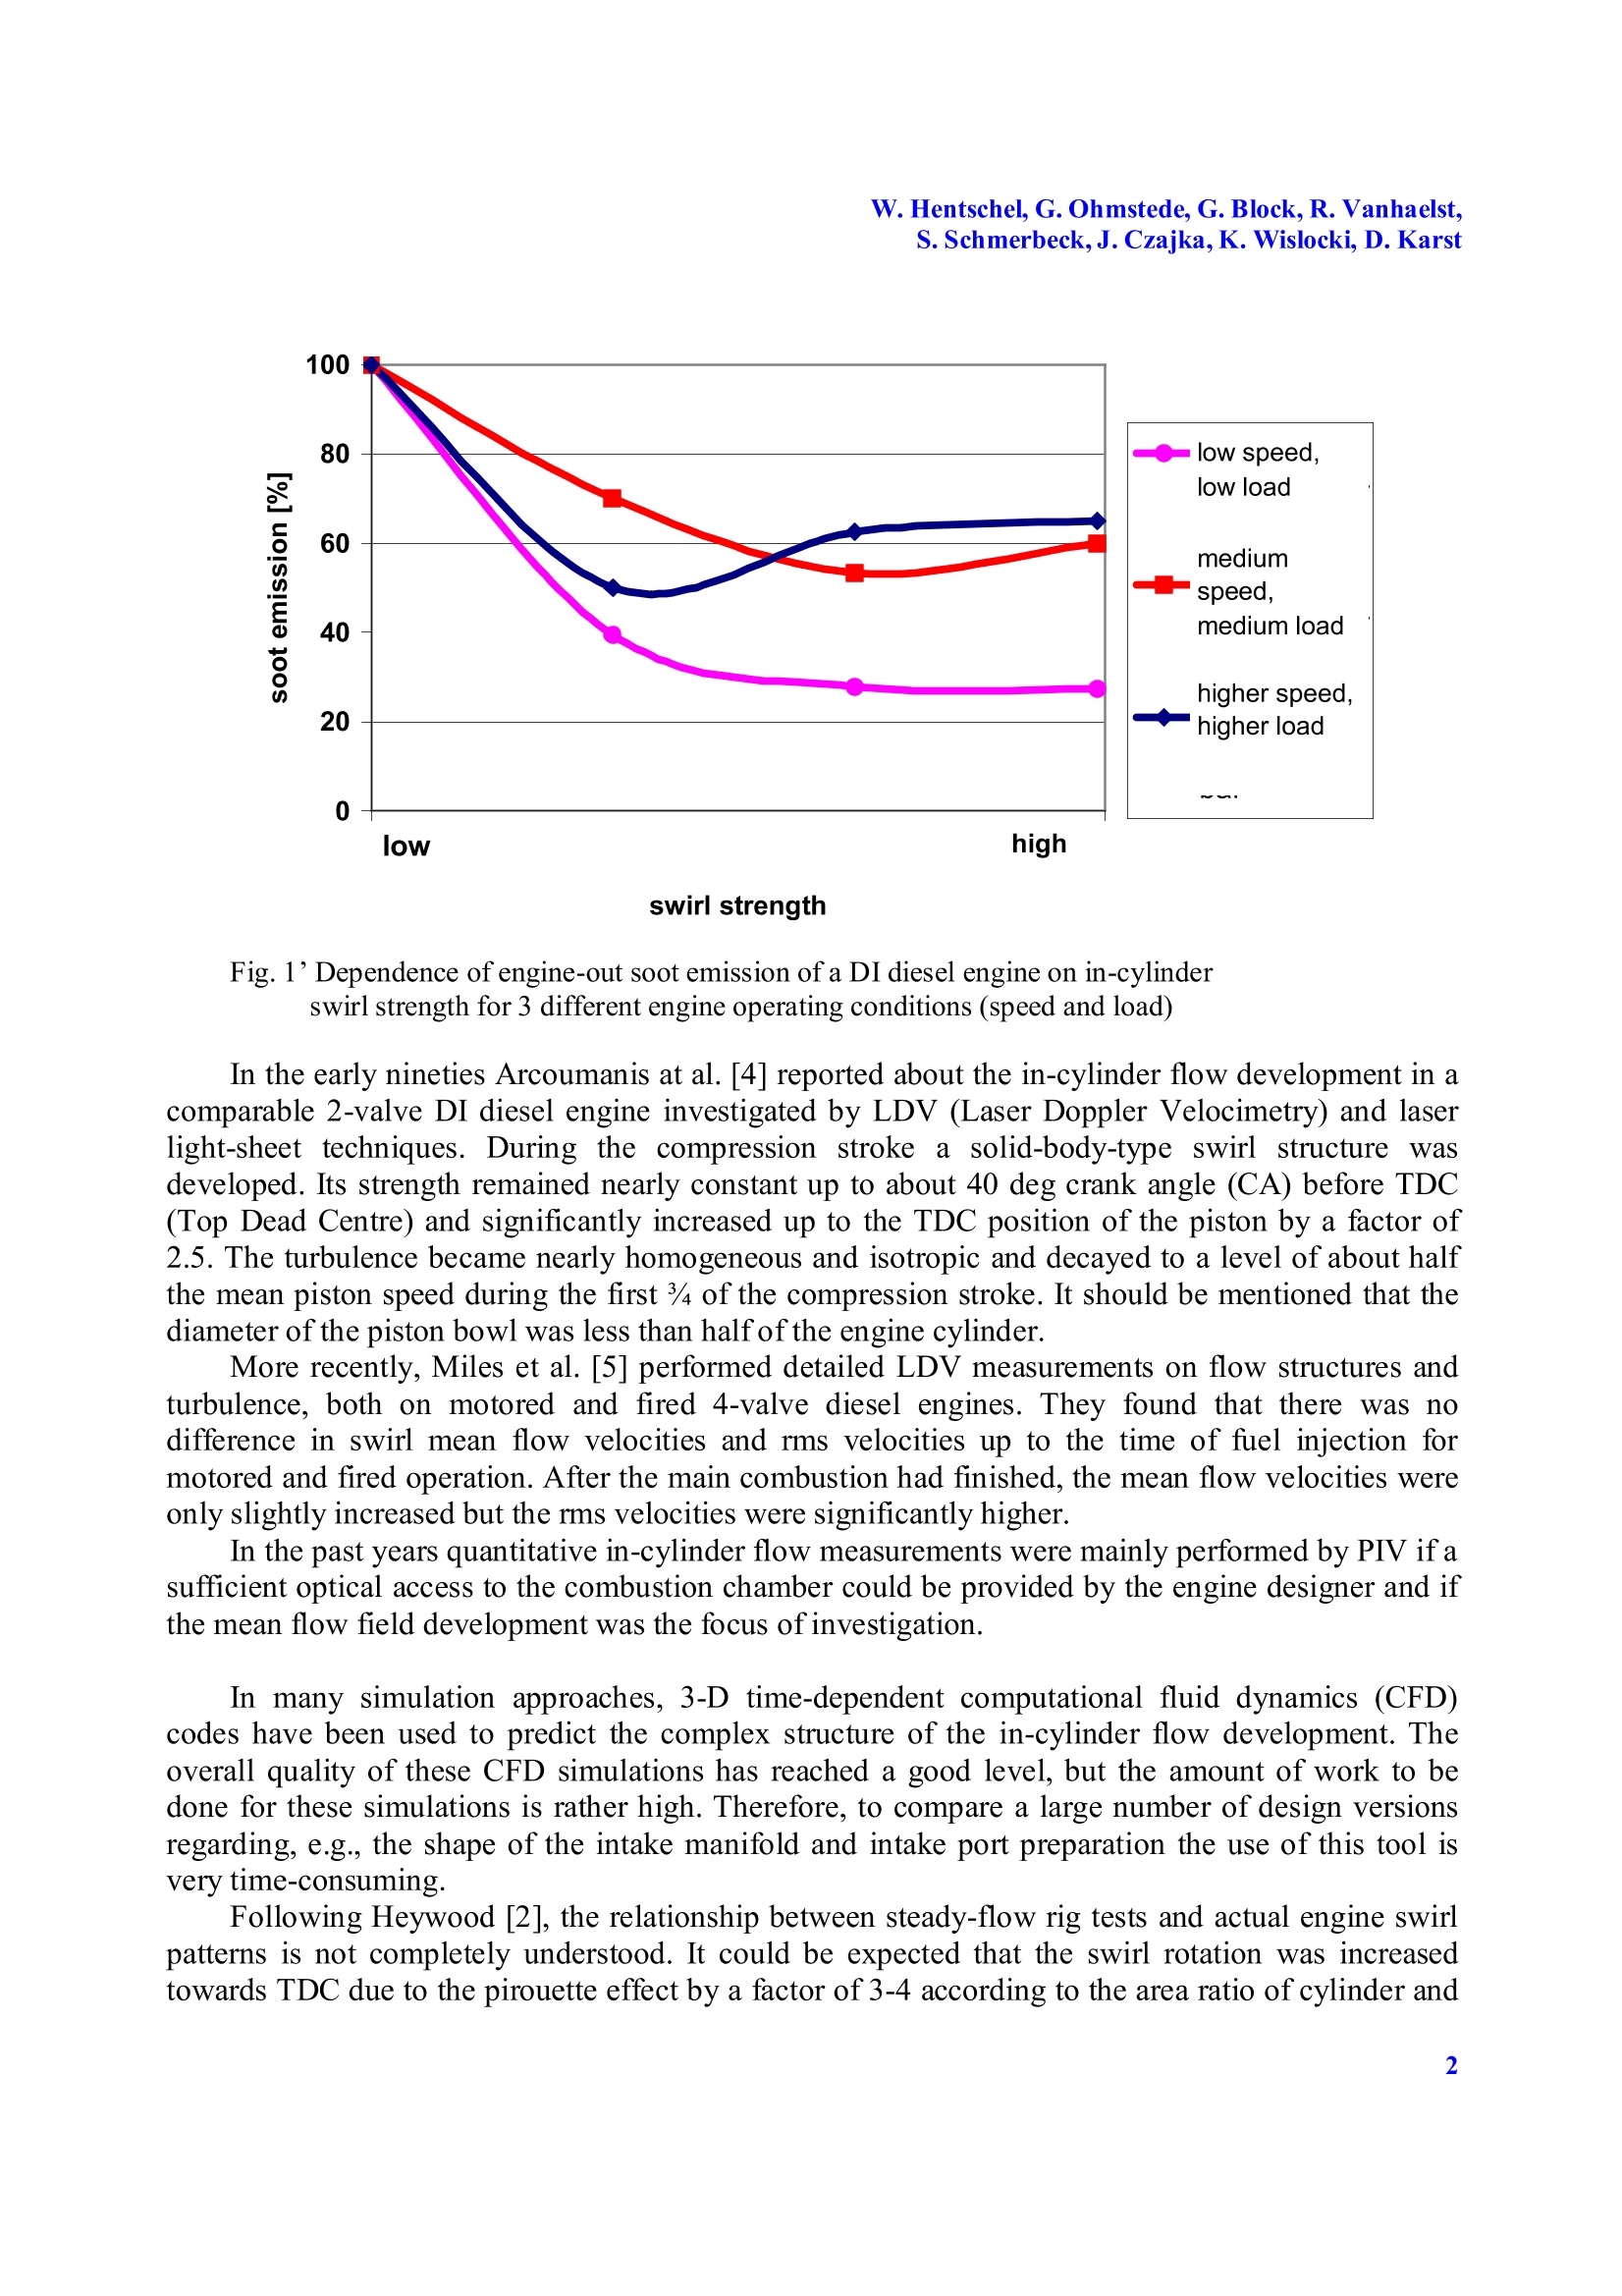
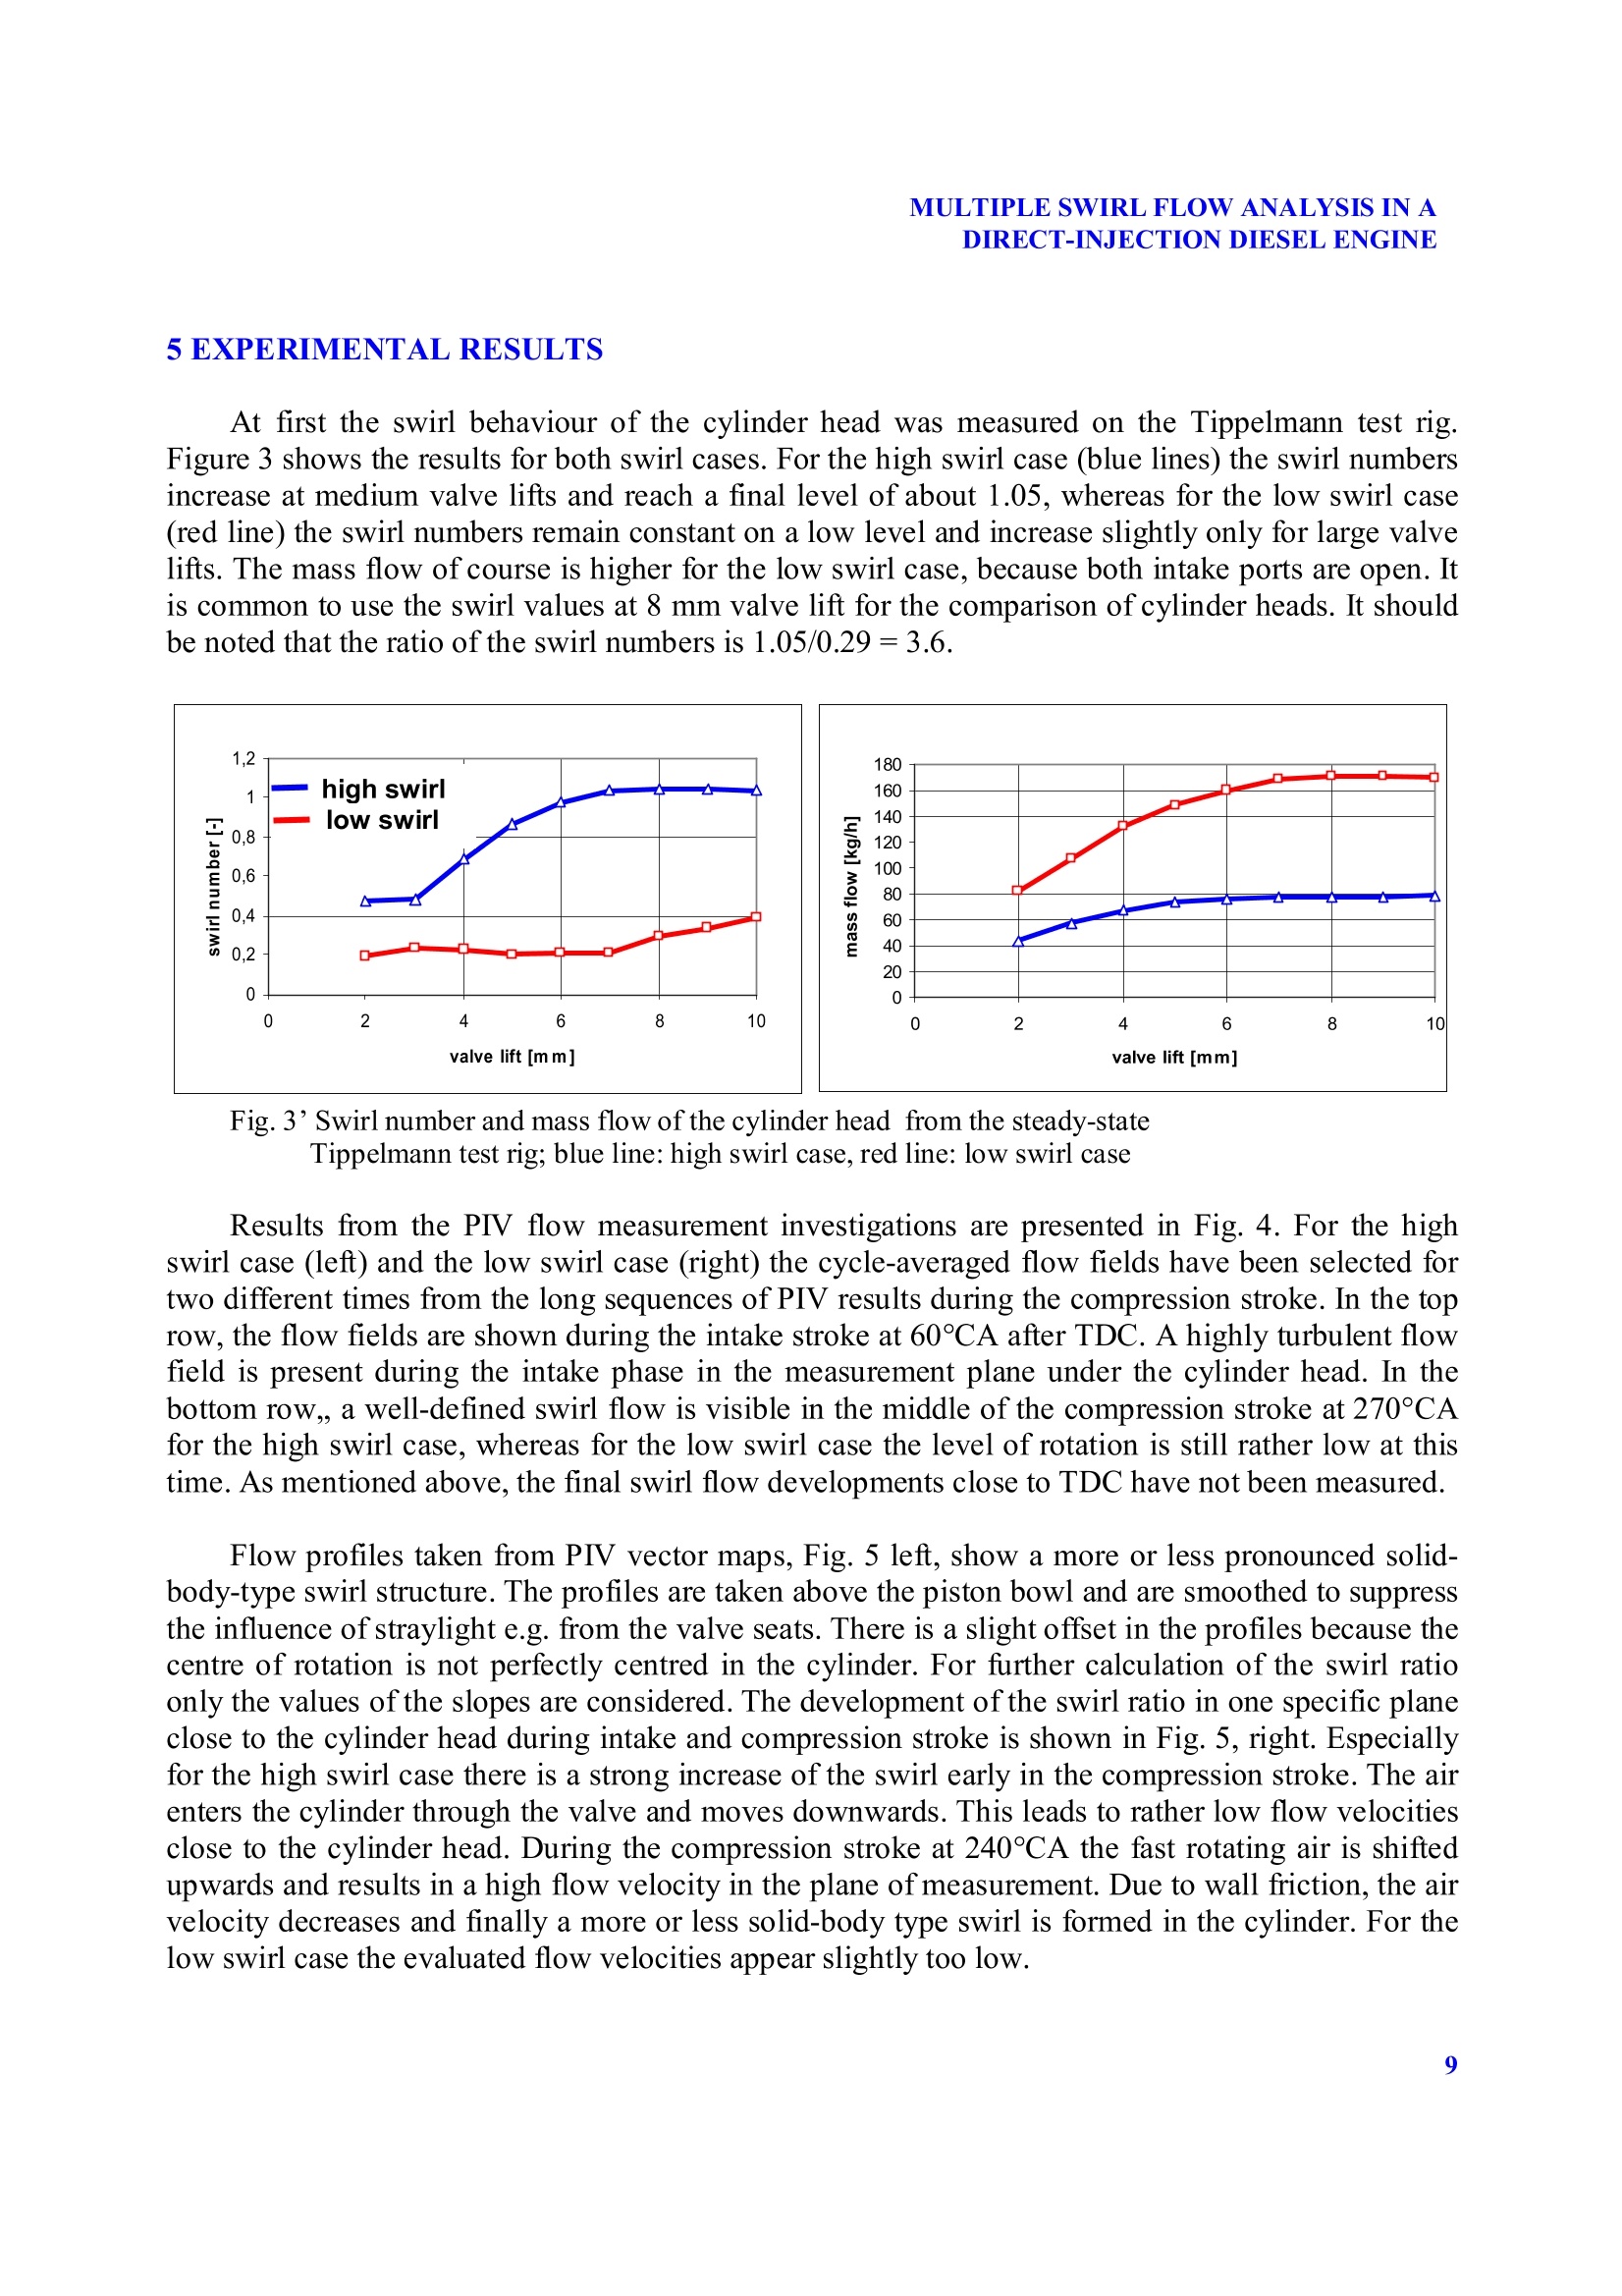
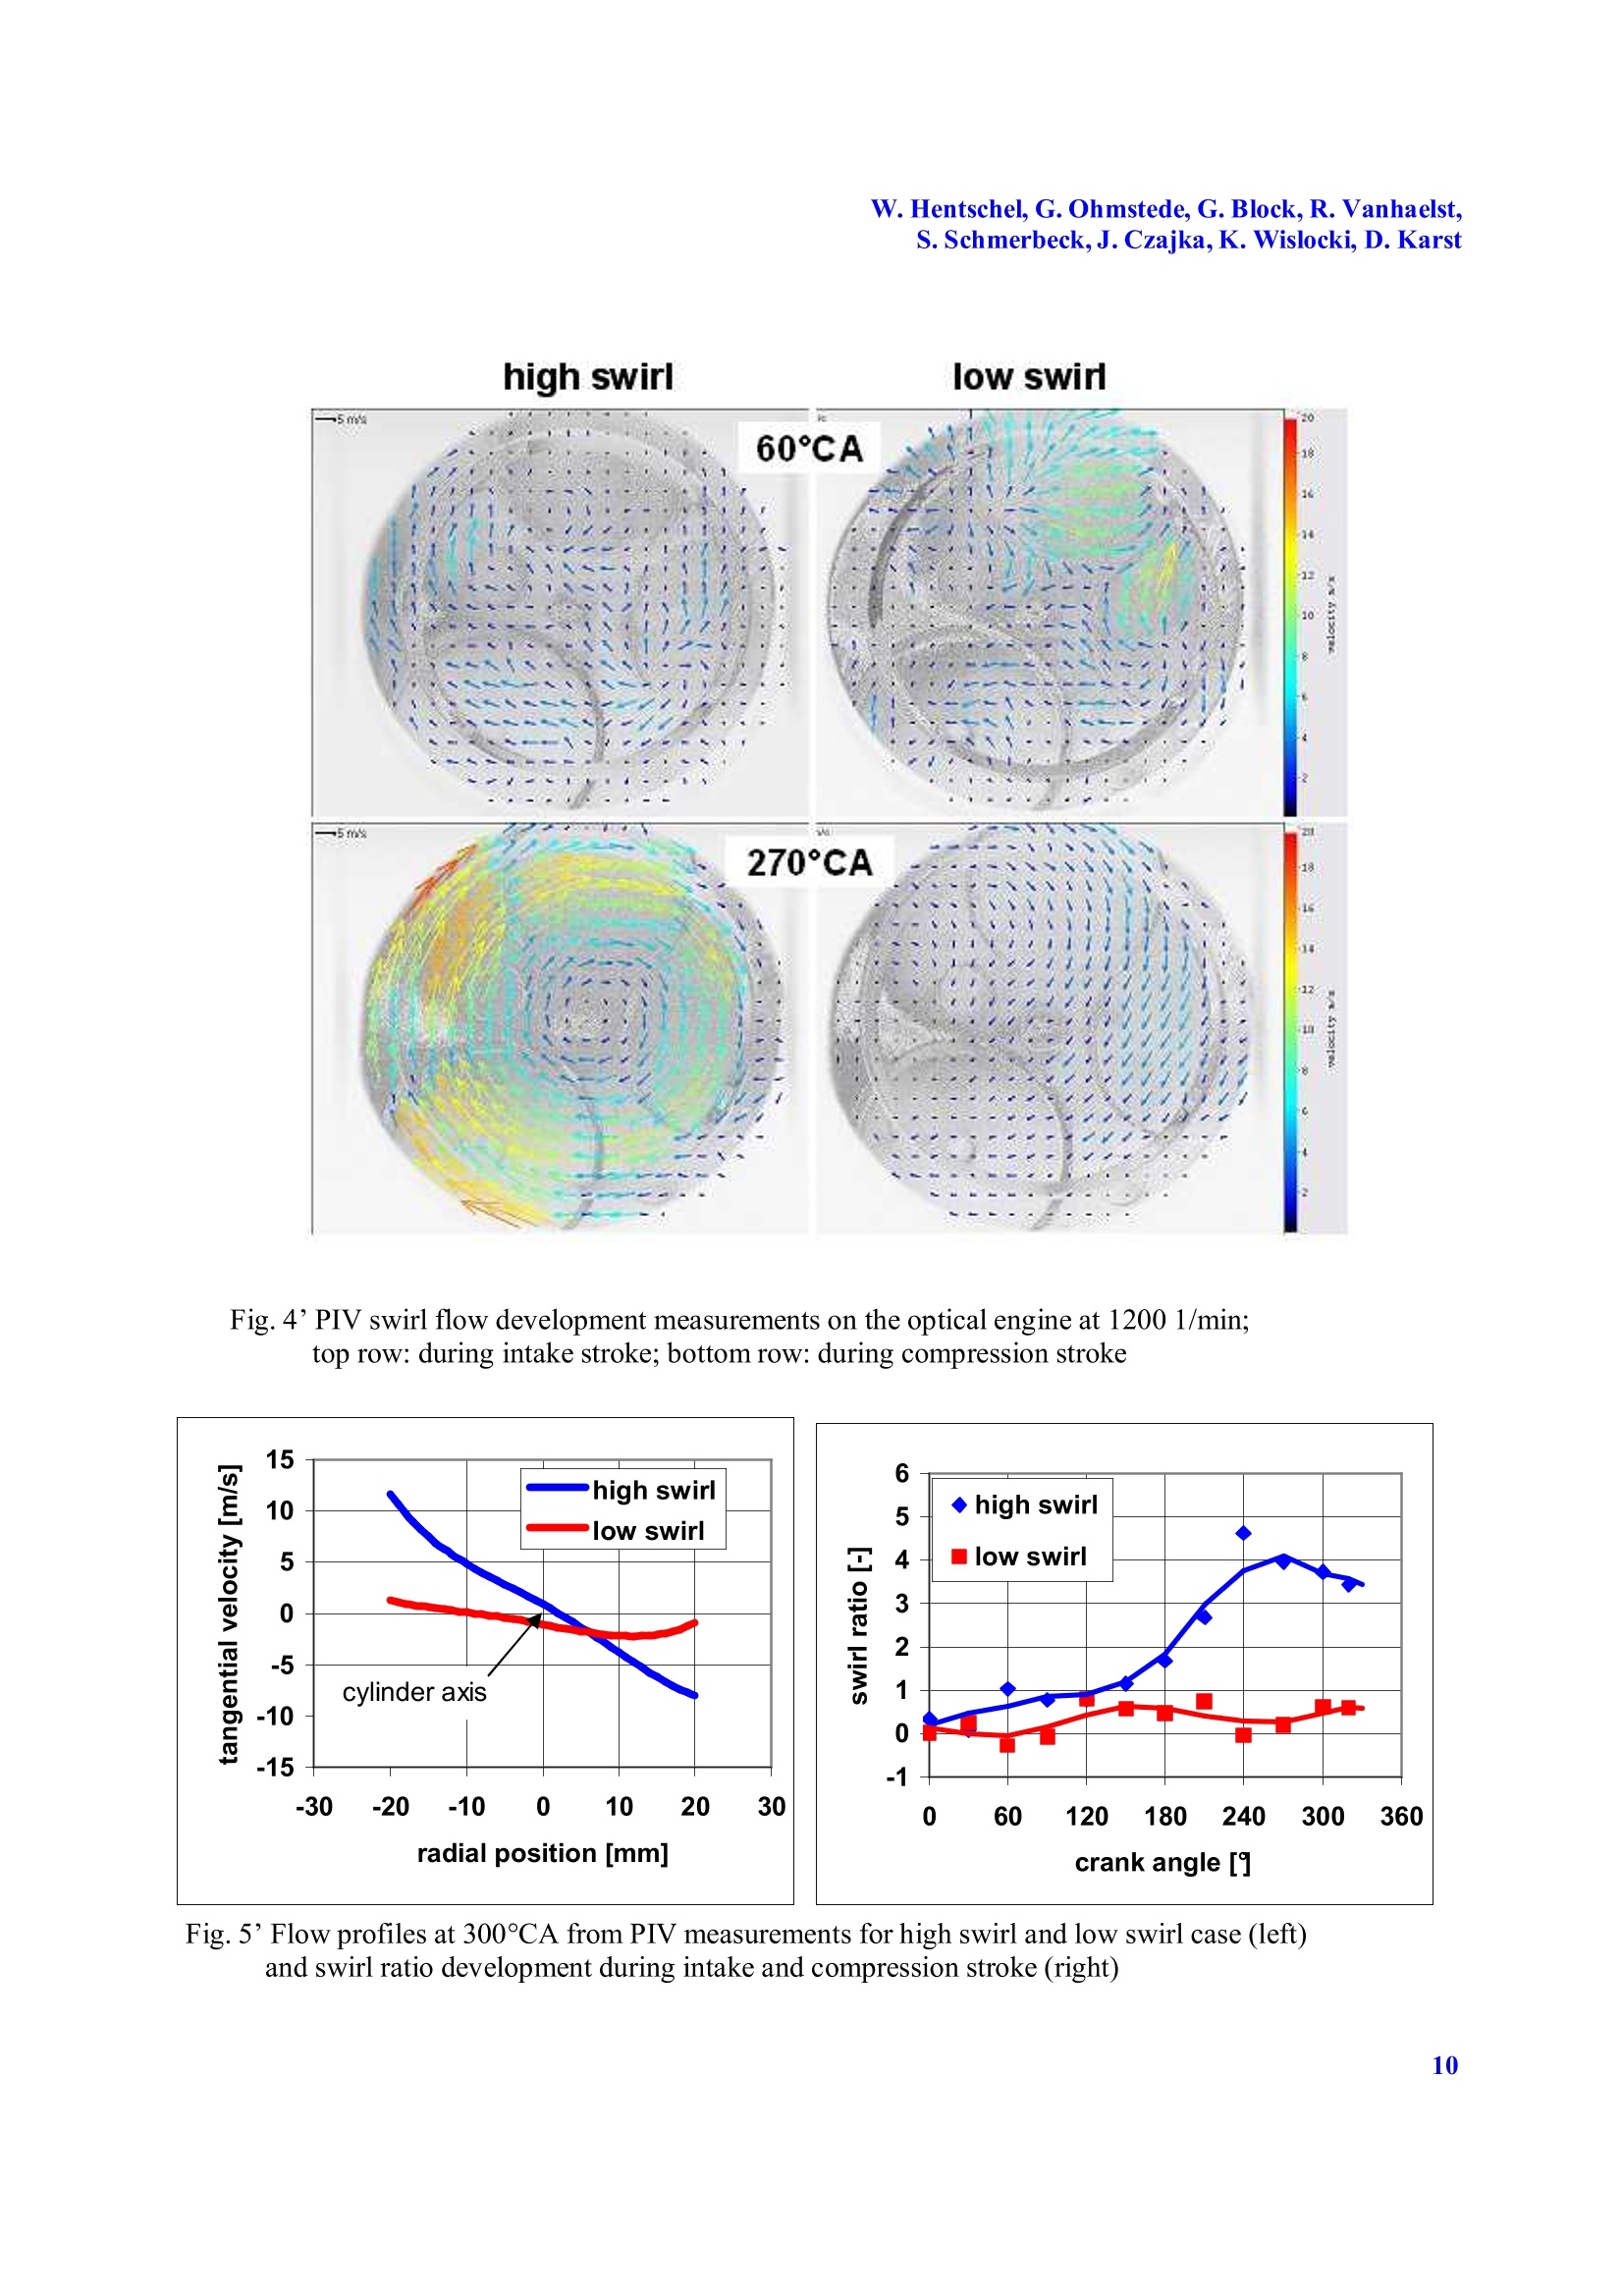
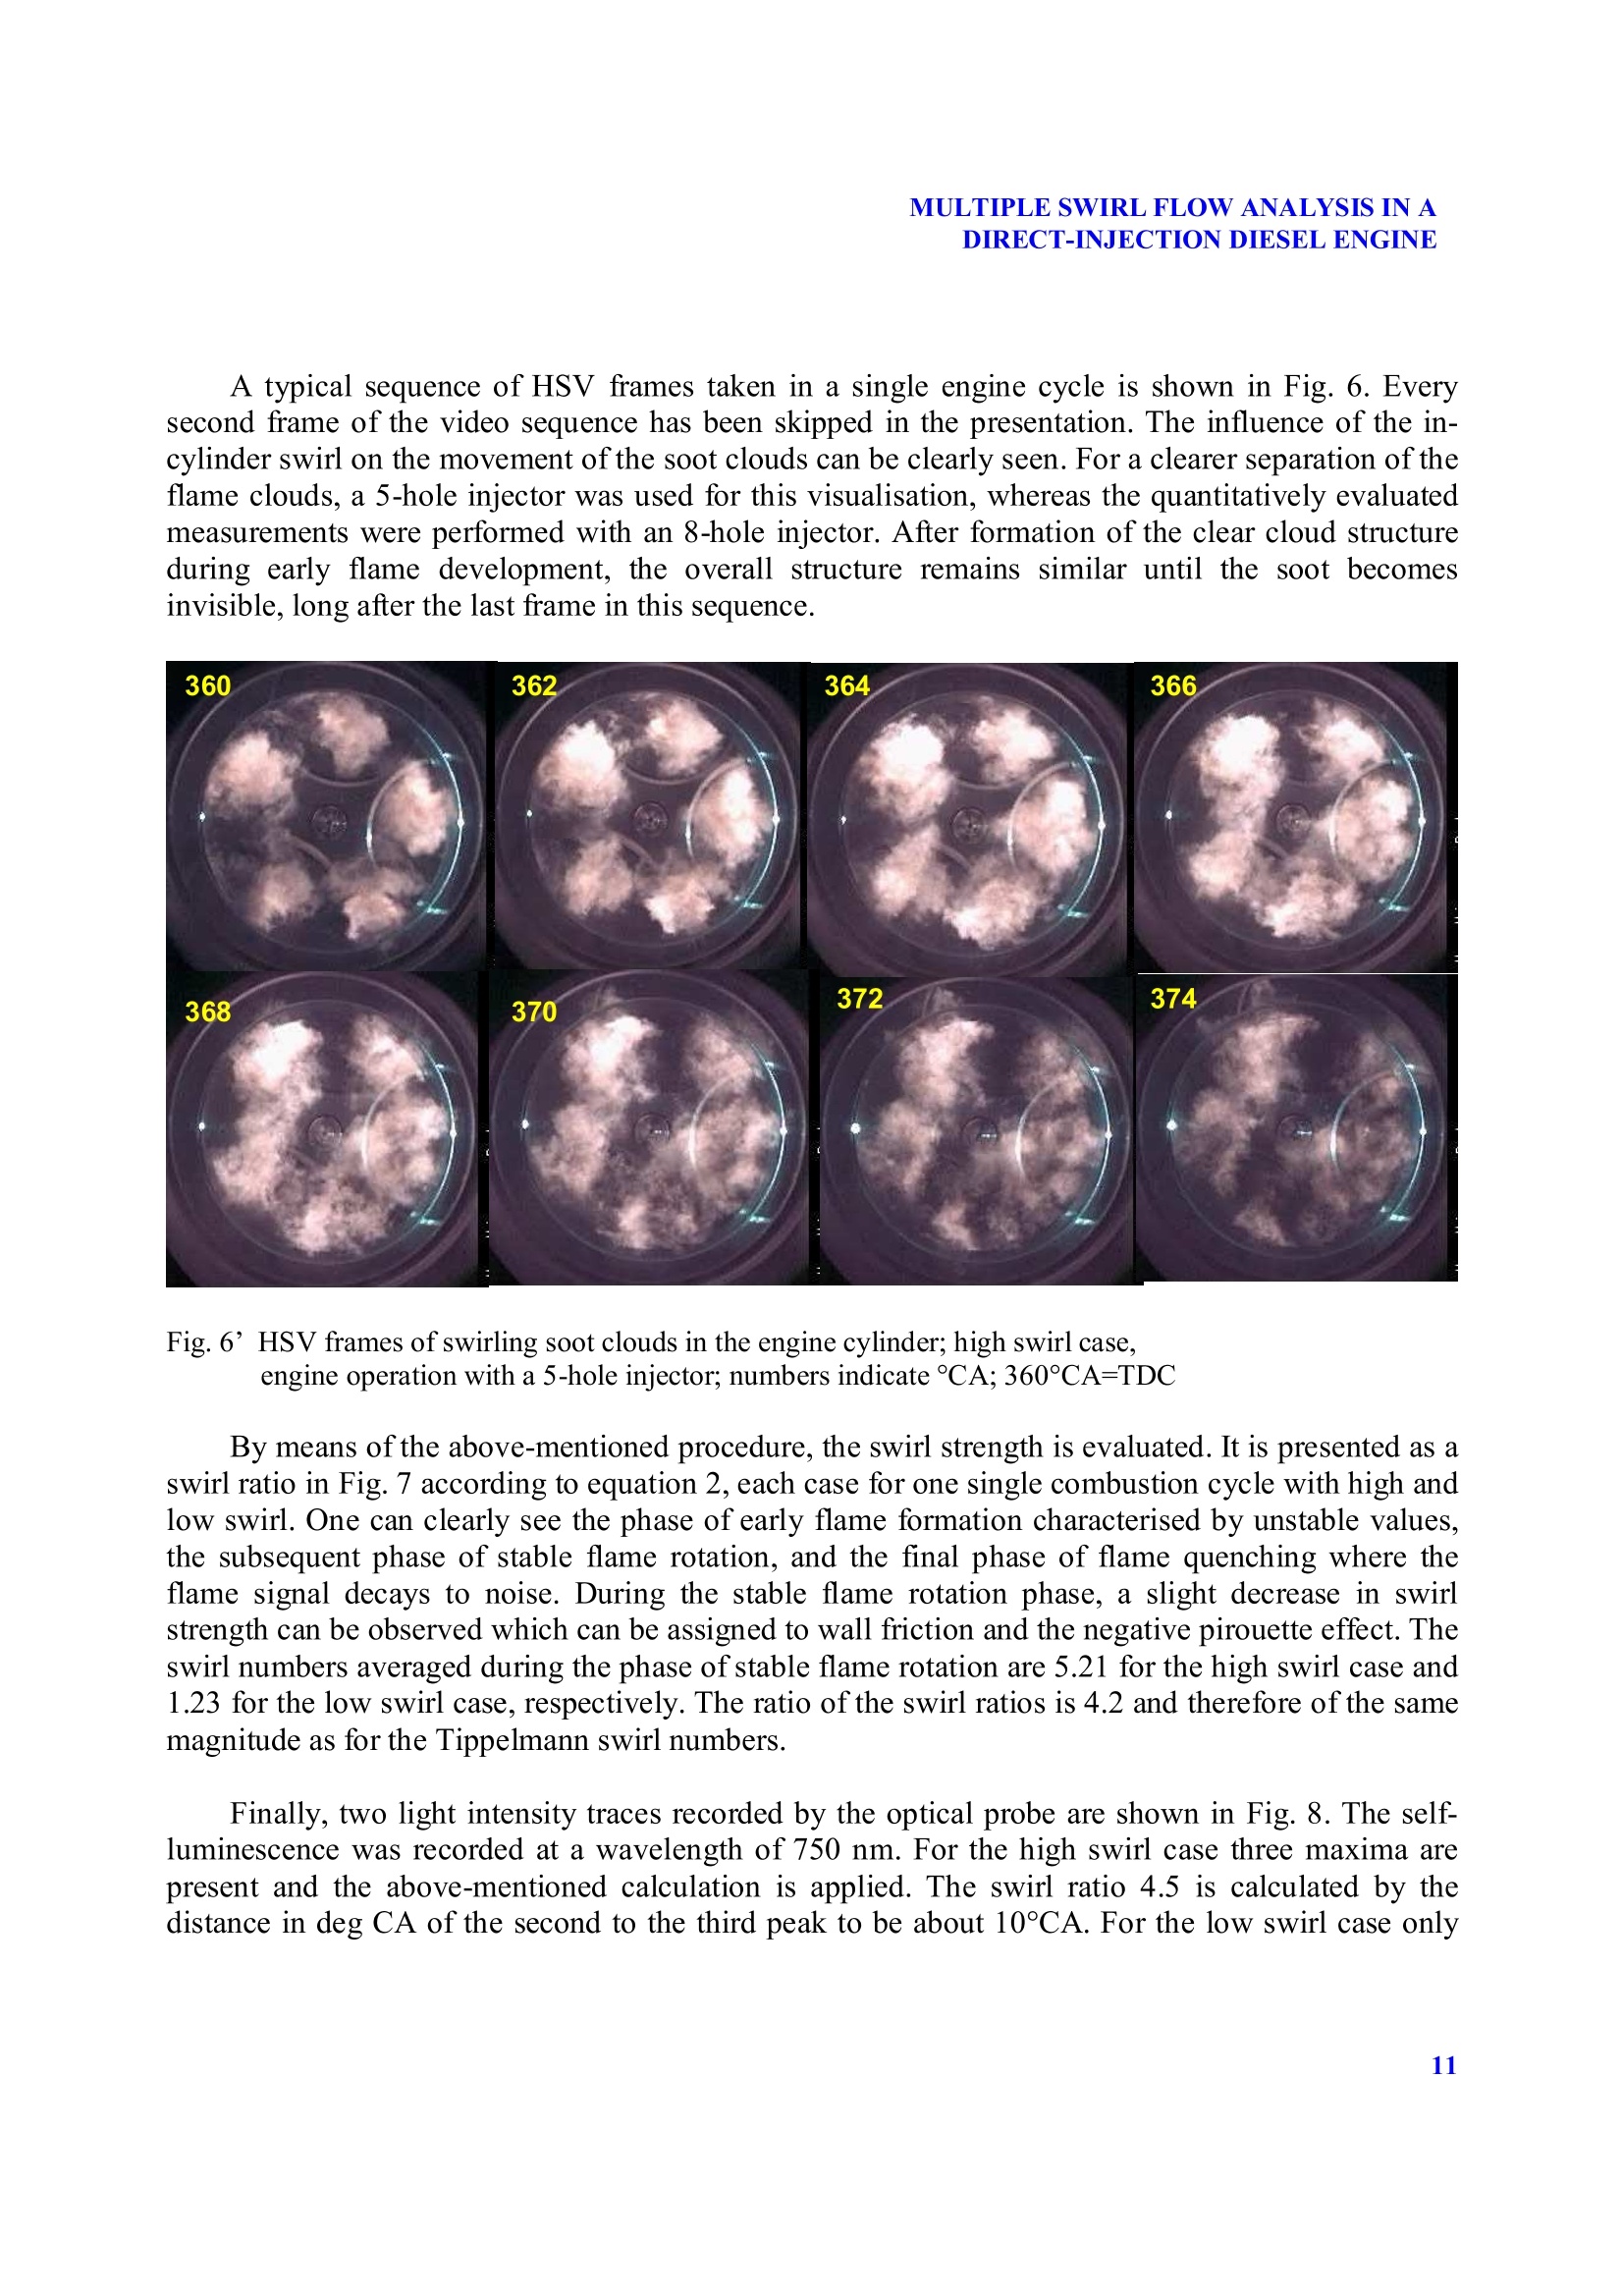
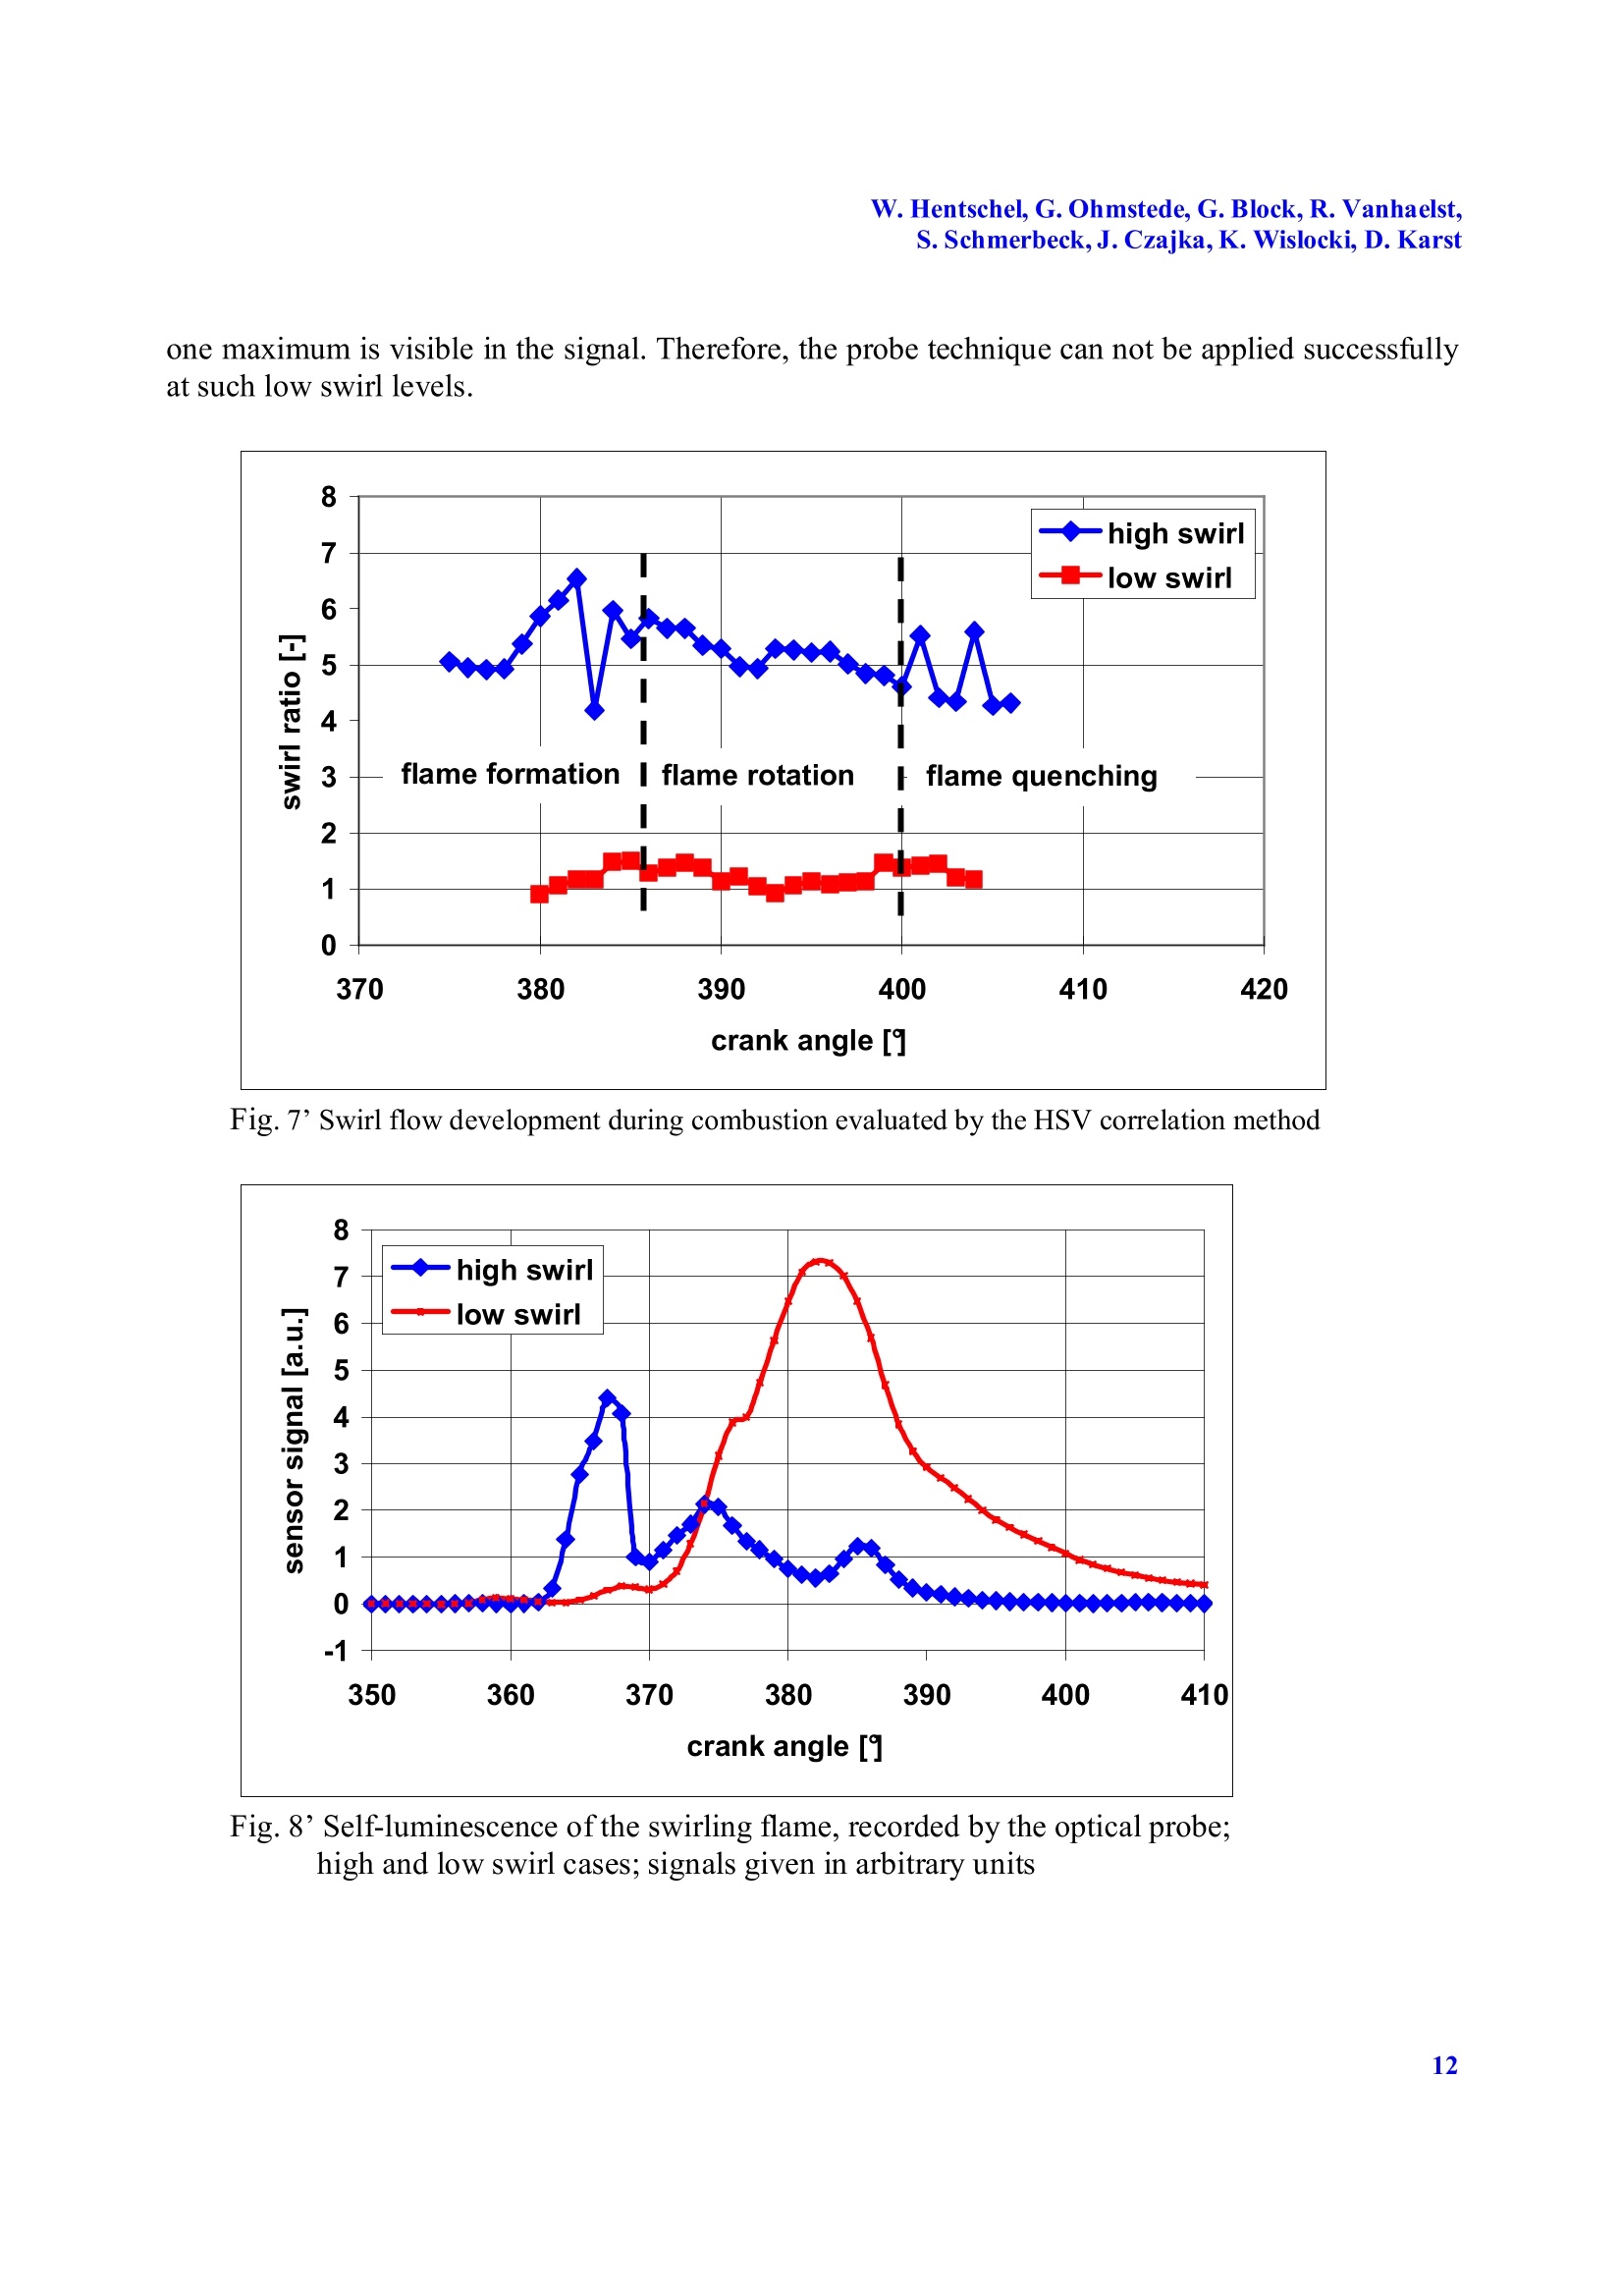
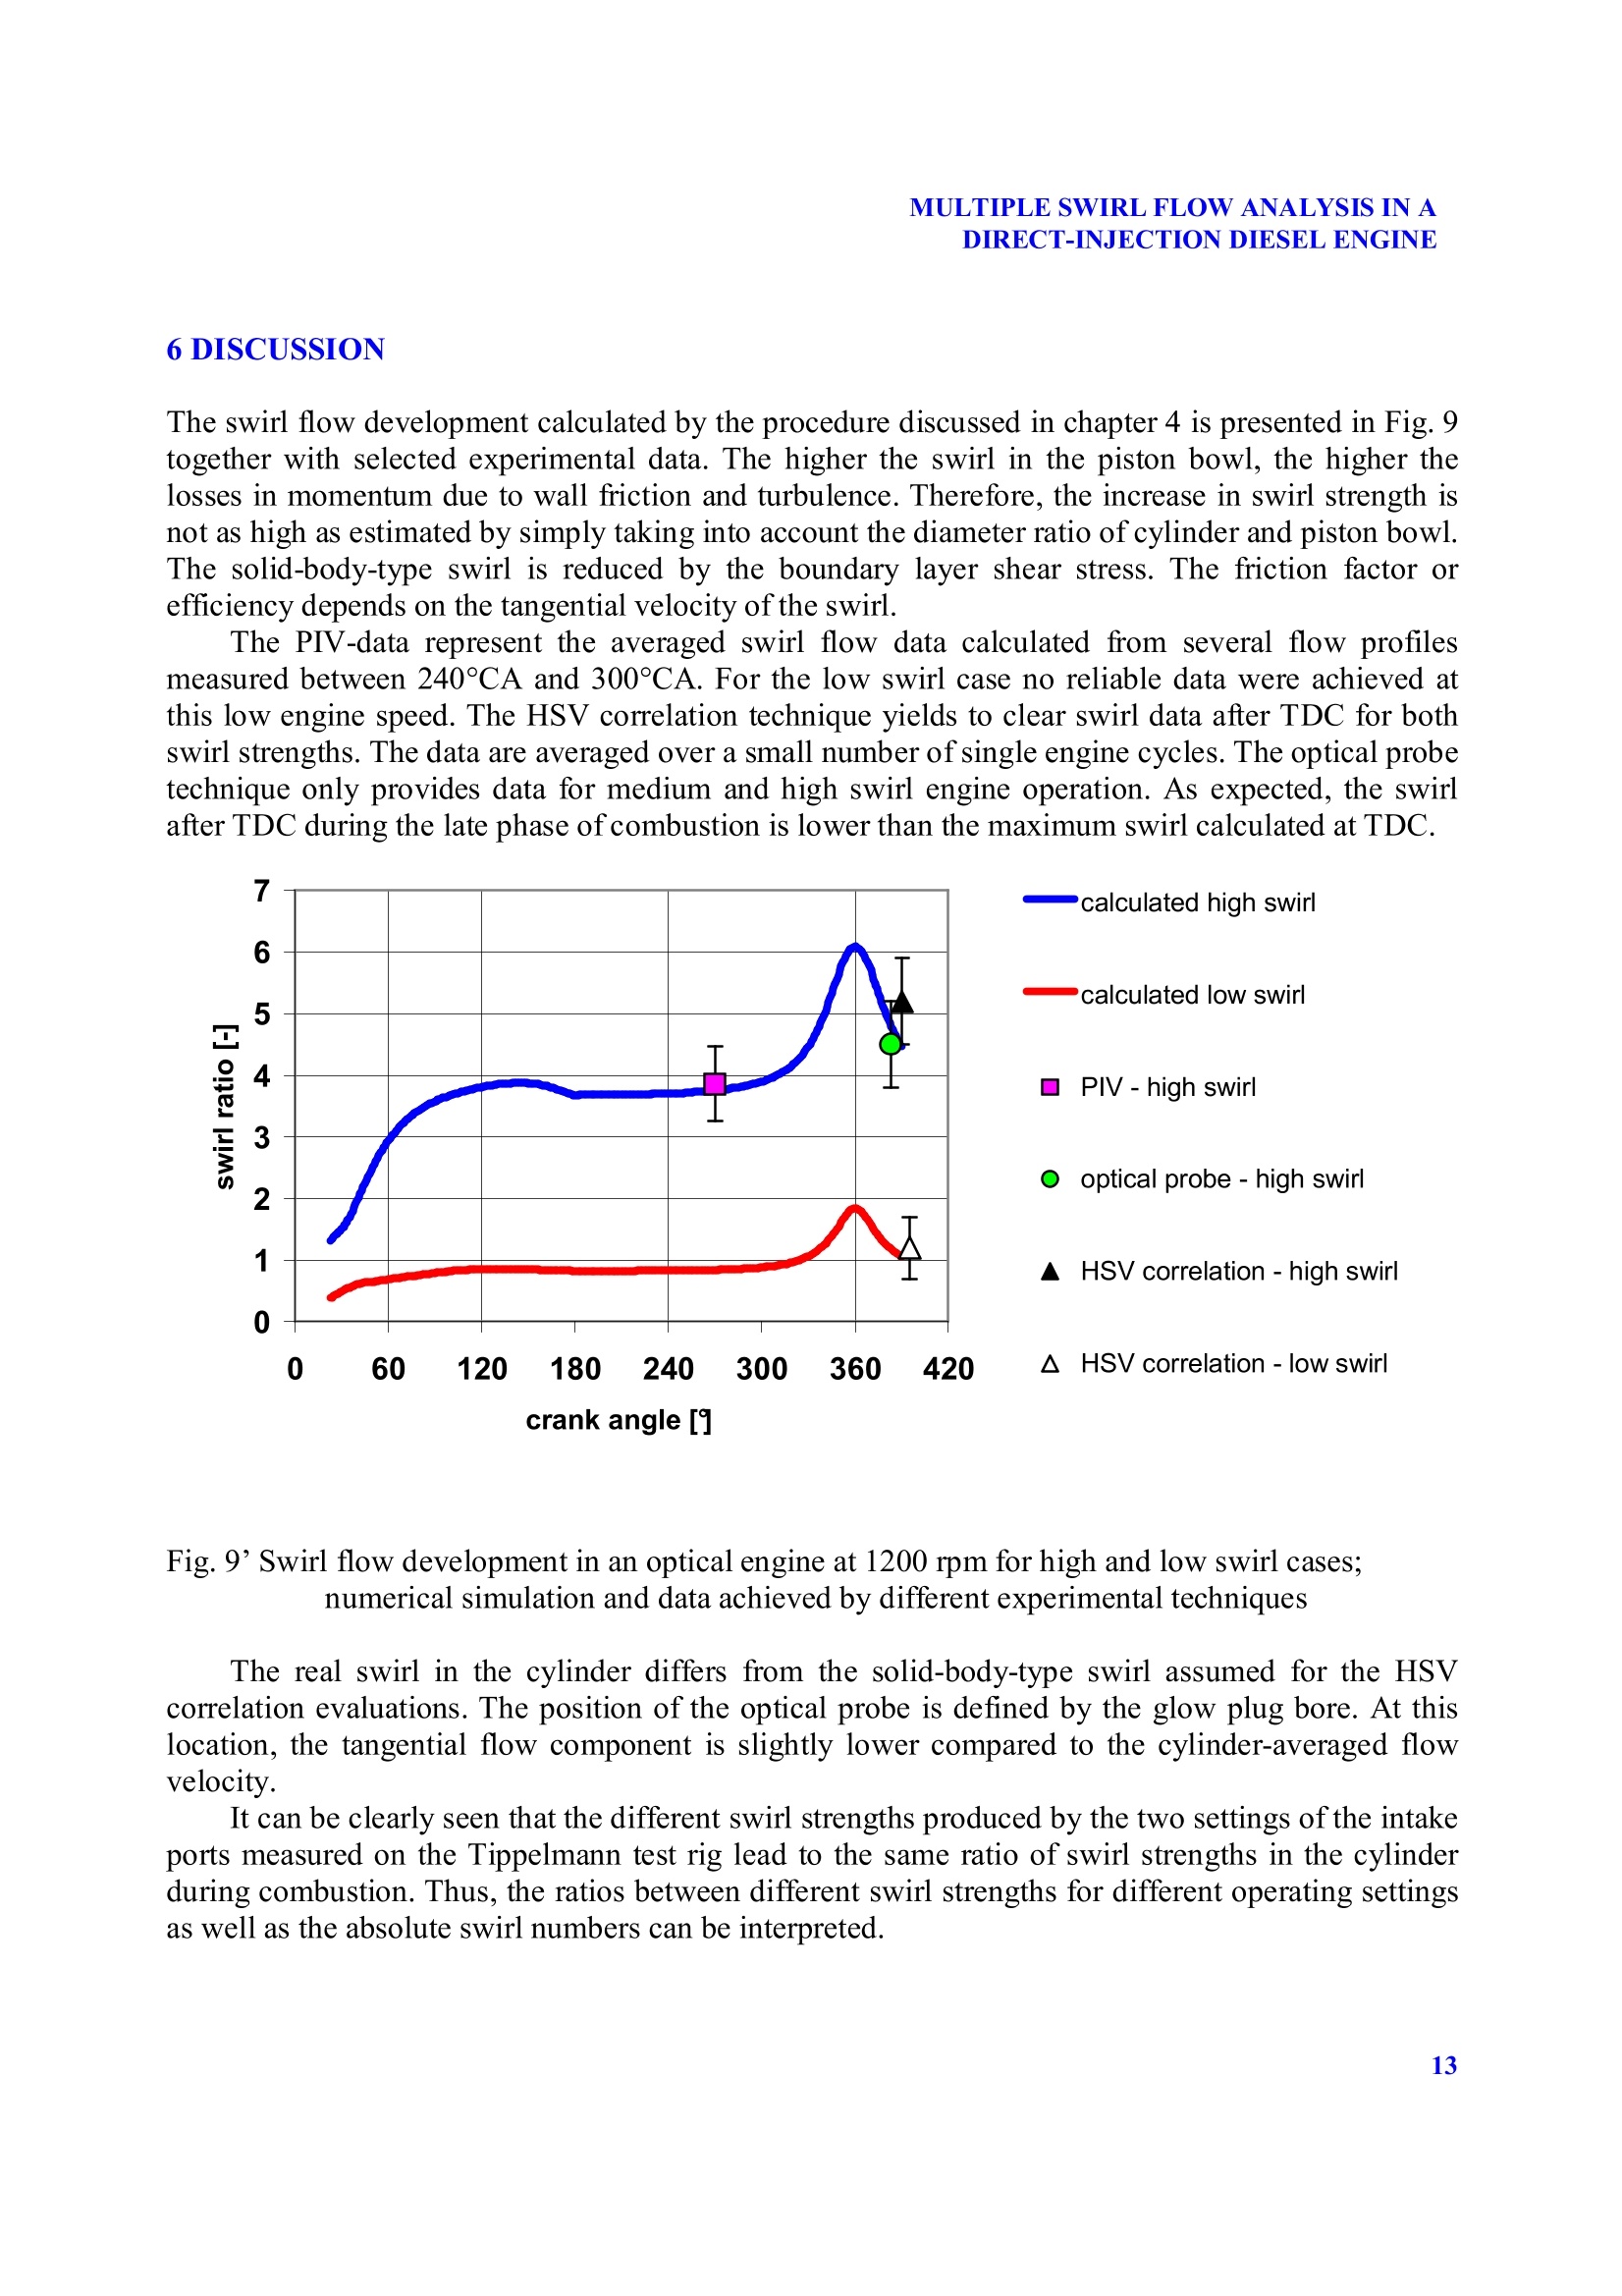
12TH INTERNATIONAL SYMPOSIUM ON FLOW VISUALIZATIONSeptember 10-14, 2006, German Aerospace Center (DLR), Gottingen, Germany W. Hentschel, G.Ohmstede, G. Block,R. Vanhaelst,S. Schmerbeck,J.Czajka, K. Wislocki, D. Karst MULTIPLE SWIRL FLOW ANALYSIS IN ADIRECT-INJECTION DIESEL ENGINE W. Hentschel*,G.Ohmstede*,G. Block*,R.Vanhaelst*, S.Schmerbeck*; J. Czajka**,K. Wislocki**, D. Karst*** *Volkswagen AG,Research and Development, Wolfsburg, Germany **Poznan Technical University, Poznan, Poland ***Kistler Instrumente AG, Winterthur,Switzerland Keywords: swirl flow; direct-injection diesel engine, optical measurement techniques ABSTRACT The amount of soot emissions from small high-speed direct-injection diesel engines is sensitivelydependent on the strength of the in-cylinder swirl flow which is important for the formation ofanignitable mixture. Three optical techniques -Particle Image Velocimetry (PIV), a full-fieldcorrelation method based on high-speed video recording ofthe swirling flames, and an optical probetechnique - have been applied to characterise the setup and the final strength of the swirling airmotion during compression stroke and the time of combustion. Two different swirl levels wereinvestigated. The experimental results are compared to calculations based on integral flowmeasurements performed under steady-state conditions. The final swirl at the time of combustionpredicted by the simple model calculation is in good agreement with the experimental results. 1 INTRODUCTION The formation of an ignitable mixture in the cylinder of a direct-injection (DI) internal -combustion(IC) diesel engine is governed by the interaction of the swirling air flow and the high-pressure fuelinjection. The amount of soot formed during combustion depends - besides other parameters - on thestrength of the swirl flow. A too weak swirl flow will lead to an insufficient mixture formationfollowed by a sooting combustion due to the rich mixture. On the other hand, a too strong swirl flowwill shift the burning zones towards neighbouring spray clouds which will also lead to enhanced sootformation. It was found by sophisticated full-engine investigations that there exist a relativeminimum of the soot emissions depending on the in-cylinder swirl strength. This principaldependence has been published by Bauder et al. [1]. Three examples of soot emissions measured atdifferent engine operating conditions are shown in Fig. 1. The required swirl differs, e.g., withengine speed and load. It can be adjusted by swirl flaps inside the intake manifold. The optimisation of swirl is required to improve DI diesel engines with extreme low pollutanemissions to meet future legislative requirements. Fundamentals about swirl formation in dieselengines and design aspects have been published by many authors; see, e.g., Heywood [2] andPischinger et al. [3]. Fig. 1'Dependence of engine-out soot emission of a DI diesel engine on in-cylinderswirl strength for 3 different engine operating conditions (speed and load) In the early nineties Arcoumanis at al. [4] reported about the in-cylinder flow development in acomparable 2-valve DI diesel engine investigated by LDV (Laser Doppler Velocimetry) and laserlight-sheet techniques. During the compression stroke a1ssolid-body-type swirl structure wasdeveloped. Its strength remained eAlnearly constant up to about 40 deg crank angle (CA) before TDC(Top Dead Centre) and significantly increased up to the TDC position of the piston by a factor of2.5. The turbulence became nearly homogeneous and isotropic and decayed to a level of about halfthe mean piston speed during the first 34 of the compression stroke. It should be mentioned that thediameter of the piston bowl was less than half of the engine cylinder. More recently,Miles et al. [5] performed detailed LDV measurements on flow structures andturbulence, both on motored and fired 4-valve diesel engines. They found that there was nodifference in swirl mean flow velocities and rms velocities up to the time of fuel injection formotored and fired operation. After the main combustion had finished, the mean flow velocities wereonly slightly increased but the rms velocities were significantly higher. In the past years quantitative in-cylinder flow measurements were mainly performed by PIV if asufficient optical access to the combustion chamber could be provided by the engine designer and ifthe mean flow field development was the focus of investigation. In many simulation approaches, 3-D time-dependent computational fluid dynamics (CFD)codes have been used to predict the complex structure of the in-cylinder flow development. Theoverall quality of these CFD simulations has reached a good level, but the amount of work to bedone for these simulations is rather high. Therefore, to compare a large number of design versionsregarding,e.g., the shape of the intake manifold and intake port preparation the use of this tool isvery time-consuming. Following Heywood [2], the relationship between steady-flow rig tests and actual engine swirlpatterns is not completely understood. It could be expected that the swirl rotation was increasedtowards TDC due to the pirouette effect by a factor of 3-4 according to the area ratio of cylinder and piston bowl. However, due to wall effects and dissipation the swirl ratio is just increased by a factorof about 2. Steady-flow tests adequately describe the swirl generation characteristics of the intakeport and intake valve. However, the swirl flow set up in the cylinder during intake stroke can changesignificantly during compression. The approach in the present study is twofold. Firstly, we want to characterise the formation andthe strength of the in-cylinder swirl flow by optical diagnostic techniques. With the knowledge fromliterature mentioned before, the PIV flow measurements are carried out in a motored engine.However, to study the swirl flow during combustion, the engine has to be fired. The swirl ratio isevaluated from observations of the flame clouds in the cylinder. Secondly, it is our aim to improve amuch more simple calculation procedure in a way that the final swirl during combustion can bepredicted with good confidence on the basis of flow measurements in a steady-flow rig and somegeometrical data of the engine. 2 RESEARCH ENGINE The major goal of the optical engine investigations is to gain deeper insight into the in-cylinderprocesses such as flow generation, fuel injection and spray formation, atomisation and mixing, auto-ignition, combustion, and the formation and reduction of pollutants. The optical engine used for the swirl investigation is based on a VOLKSWAGEN 2.0 1 TDIfour-cylinder engine. The bore and stroke of the engine are 81 mm x 95.5 mm. The diameter of thebowl-in-piston combustion chamber is 53 mm. The injection system is a CRi3 common rail systemwith rail pressures up to 1600 bar, and the nozzle used is equipped either with 5 injection holes or 8injection holes. To design the optical engine, the standard-production engine needed to be modifiedto realise a direct optical access to the combustion chamber for the application of opticalmeasurement techniques. Therefore, the following components, cylinder head, piston and crankcase,were adapted. The principal design of the optical DI diesel engine was outlined in more detail in aprevious paper by Hentschel [6], recent research results achieved with this specific engine werepublished by Steiger et al. [7]. The research cylinder head used has two intake valves and one exhaust valve with thepossibility to adjust the swirl level by closing one of the intake ports. In the ‘high-swirl’case onlythe outer intake port is passed by the airflow, whereas in the low swirl’case the air enters thecylinder through both intake valves. The illumination of the combustion chamber was enabled by one quartz glass window in theside of the crankcase. The second optical access to the engine is realised through a quartz glasswindow in the bottom of the piston bowl and by a mirror in the piston. Therefore, the crankcase andthe piston needed to be elongated (see Fig. 2). The elongation leads to a lower compression ratio ofthe engine, caused by the compression of the long piston near the TDC. To compensate for the lowerpressure and temperature, the optical engine is equipped with a supercharger and an electric heater tomeet the thermodynamic conditions of the standard-production four-cylinder engine. The load points tested in the optical engine are based on the emission-relevant load points of theNEDC cycle (New European Driving Cycle for emission and fuel consumption measurements). Thefirst load point was determined at 1200 rpm with an amount of injected fuel of about 10 mg, which is equivalent to a torque of 40 Nm in the four-cylinder engine. Fuel injection was slightly modifiedcompared to the standard engine parameters with respect to start of injection and the fuel pressure toachieve a bright and well-structured flame, which is necessary for the application of the opticaldiagnostic techniques.These modifications have no significant influence on the swirl strength duringcombustion. In this paper, the following terminology is used for the crank angle counting and the position ofthe piston: The flow measurements start at TDC (Top Dead Centre) of gas exchange called 0CAwhen the intake valves start to open and the piston is moving from top to bottom. At 180°CA thepiston is in the bottom position and the intake valves close. Between 180°CA and 360°CA all valvesare closed and the piston moves from bottom to top; the air is compressed- compression stroke.Around 360℃A at TDC, the fuel is injected into the compressed hot air and the combustion starts.Most measurements of the rotating flame clouds are performed between TDC and 400°CA. 3 METHODS OF SWIRL MEASUREMENT The experimental methods used in this investigation for the measurement of intake port-generatedin-cylinder swirl will be presented briefly. For more details see, e.g., the cited literature. 3.1 Tippelmann test rig One of the well-established techniques for the measurement of swirl formation by cylinder headflows is the steady-flow rig acc. to Tippelmann [8]. The air passes the intake manifold, intake portsand the open intake valves at a well-defined pressure gradient of 50 mbar between intake port andcylinder. The swirling air flow in the cylinder leads to a torque on an axially mounted honeycombstructure placed at a well defined distance below the cylinder head. From the momentum and themass flow rate a swirl number is calculated for each valve lift between 2 mm and 10 mm. Becausethe centre of rotation of the honeycomb structure is identical to the cylinder axis, the measured swirlcomponent is per definition related to the cylinder axis and not to the true centre of air rotation. Thecalculation procedure for the swirl number is outlined in chapter 4. By means of this simple deviceand procedure, cylinder heads can be characterised fastly with respect to their swirl number, and theresult of the measurement is just a simple number. 3.2 Particle Image Velocimetry A standard commercial PIV system is used containing a double-pulse frequency-doubled Nd:YAGlaser and a digital CCD camera with high spatial resolution and high sensitivity and dynamics;details about the PIV system and more examples are described by Hentschel et al. [9,10]. The light-sheet is formed by the 8 mm diameter laser beam with a modular light-sheet optical system whichallows alignment of the light-sheet thickness and of the aperture angle. The light sheet is 0.5 mm -1.0 mm in width inside the engine cylinder, energy is approx. 2 x 50 mJ. Essential to enginemeasurements is the synchronisation of laser and camera of the PIV system with the engine to takethe PIV images at pre-selected crank angles of the engine. For seeding the flow we use oil dropletsof 1 um-2 um in diameter produced by an aerosol generator. The images are taken by a fast macro-lens provided with a 532 nm narrow-band interference filter with a high-resolution double-frame CCD camera with 1024 x 1280 pixels for each frame and 12-bit dynamics. The evaluation of the PIVimages is performed off-line by 2-D cross-correlation with 32 x 32 pixel interrogation cells, 25%overlap, and subsequent post-processing (software tools by LaVision [11]). For every investigatedcrank angle at least 20 PIV images are taken, and the related vector fields are calculated andaveraged afterwards. Fig.2'Setup for PIV flow measurements on the DI diesel engine with optical access A sketch of the optical setup ofthe PIV system applied to the optical engine is shown in Fig. 2.The engine is motored at the desired engine speed. The measurements are performed in a planeparallel to the cylinder head and about 10 mm below it. Measurements close to TDC are not possiblelater than 30 deg CA before TDC because at that time, due to compression, the temperature insidethe combustion chamber is so high that all types of oil seeding evaporate. The field of view islocated above the piston crown and contains both the piston bowl and part of the squish area. PIV isused to analyse the in-cylinder intake flow and the development of the swirl on a cycle-averagedbasis. Flow profiles are derived from the vector maps and swirl ratios are calculated from the profilesassuming a solid-body-type rotation. 3.3 High-speed video correlation method A High-Speed Video (HSV) technique with a framing rate of one frame per deg CA is applied torecord both the flame propagation and the movement of soot clouds in the swirl flow inside andabove the bowl-shaped combustion chamber. The setup for HSV corresponds to the PIV setup butthe PIV-camera is replaced by a modern colour HSV CMOS camera with a spatial resolution of 256x 256 pixels at 7.2 kHz framing rate. This is necessary to get one frame per deg CA at an enginespeed of 1200 rpm. No laser illumination is applied. A well-structured flame distribution is essentialto apply the subsequent procedure for swirl characterisation. Succeeding frames are evaluated two-by-two by a full-field correlation in a polar-coordinate system to achieve the characteristic number of the swirl strength and its development during a single combustion cycle; for details see Czajka [12].A standard PIV software [11] is used for this full-field analysis on a 256 x 256 pixel-sized grid. Thecorrelation function is checked to be sure that reliable vectors are evaluated. The x-componentof theone resulting vector represents the spatially averaged flame rotation and thus characterises the globalswirl strength in the combustion chamber. Evaluation of the images is meaningful after auto-ignitionand first flame development have finished and the resulting soot clouds move in the swirling flowfield. At the end of combustion, about 40 deg CA after TDC, the soot is oxidised or cooled down andis no longer visible. Typically, the final swirl strength values are achieved by averaging over a periodof 10 to 15 deg CA. The accuracy of this procedure is high enough to resolve even the light decreasein swirl strength during the engine cycle after TDC. As for the Tippelmann test rig results the centreof rotation is assumed to be in the centre of the cylinder. 3.4 Optical probe technique The development of robust, stable and easy-to-use optical sensors for in-cylinder analysis hasreached a level of performance which allows the use as development tools in engine research anddevelopment; see e.g. Kunte et al. [13], Wenzel et al. [14],Vanhaelst [15] and Berg et al. [16] foroptical sensors used for DI diesel and gasoline engines. In the present case, the sensor is placed inthe glow plug bore ofthe engine and replaces the standard glow plug. It consists of a front end quartzglass lens and an optical fibre to guide the light to a detector unit with different optical filters. Forour measurements, optical filters at 600 nm, 750 nm and 900 nm are used. The acceptance angle ofthe sensor can be adjusted by adaptors in front of the lens. It must be large enough to collect asufficient amount of light and should be small enough to avoid integration over a too large area andthereby to smooth the signal too much. The present sensor has an acceptance angle of about 15°FWHM (Full Width Half Maximum). More than 20 successive cycles are recorded with hightemporal resolution. Sensor fouling by soot may reduce the possible period of operation, but this wasnot a problem for the measurements in this study. Future sensors may contain an electric heatingdevice to achieve a constantly high probe tip temperature and thereby avoid the grow-up of sootdeposits [13]. At high swirl, the single-cycle signal trace shows a high first maximum during flamedevelopment, and two or three succeeding smaller relative maxima when the soot clouds fromwindward neighbouring sprays passed the detection cone of the sensor. The swirl data presentedbelow are from the time interval between the second and third maximum expressed in deg CA. Theresulting accuracy is about 10 % and just one swirl ratio is achieved per engine cycle. In addition, nolow swirl case can be evaluated because1 no third or even no second maximum can be observed.Implicitly, a centred solid-body-type rotation is assumed in the swirl evaluation. A more accurateinvestigation of the periodicity in the probe light signal can be achieved by Fast FourierTransformation of the signal traces and subsequent analysis of the spectra as shown by Schubiger[17]. This should be applied in further experiments. 4 SWIRL CALCULATION In this paragraph, a method to calculate the angular velocity of a solid body rotating flow ωs in thetop dead centre of an operating engine from the steady-flow Tippelmann test-rig-measurements is described. The angular velocity and the swirl ratio are calculated in two steps, at first during theinduction stroke, and then during the compression stroke. 4.1 Swirl generation during the induction stroke Since it is very difficult to determine the swirl flow in an operating engine, steady flow test rigs arecommonly used to quantify the swirl. The swirl coefficient Cs according to Tippelmann is thendefined by where M is the torque at the steady-flow impulse torque swirl meter, rcy is the cylinder radius, V isthe volume flow rate through the intake port, and p is the density of air. The quality of the intake port of a cylinder head is usually judged with the Tippelmann swirl at8 mm intake valve lift. For the engine described in this paper, the swirl at 8 mm intake valve lift canbe varied between 0.29 and 1.05. This Tippelmann swirl coefficient doesn’t give any information onthe swirl intensity in the top dead centre in an operating engine. When swirl measurements are performed in an operating engine, a swirl ratio Rs instead of theswirl coefficient Cs is used. The swirl ratio can be written as the angular velocity of a solid bodyrotating flow ωs, divided by the crankshaft angular rotation speed (N is the engine speed in 1/s) To calculate the swirl ratio in the cylinder during the induction stroke from the steady-flow testrig results, all the contributions to the angular momentum of the intake mass flow have to beintegrated at the corresponding valve lift. If it is assumed that the valve lift and the intake portmaintain their characteristics under transient conditions, the steady-flow test rig results can be usedto calculate the equivalent solid-body angular velocity at the end of the induction stroke. It can beproven that where 0 is the crank angle at the start of the intake process, 02 is the crank angle at the end of the intake process, Deyl is the cylinder bore, and m is the mass flow rate through the intake port.The result M; defined as has to be integrated from the opening of the intake valves (0i) till the closing of the intake valves(02). The result M; has to be divided by the integral of the air mass flow. The cylinder bore has to betaken into account as well. The solid body angular velocity in an operating engine used for further calculations is calledwcyl. The angular velocity ωs is multiplied with a volumetric efficiency ny based on intake manifoldconditions via the next equation The volumetric efficiency is introduced to transfer the idealised test rig conditions to a real,operating, turbocharged diesel engine. It allows to consider the air conditions in the intake manifold,such as air temperature, air density and air pressure. In accordance with Heywood [2] the maximumvaries in the range between 80 and 90 percent. 4.2 Swirl modification during the compression stroke The total angular momentum Mcy of the cylinder charge decays during the compression phase due tofriction at the chamber walls and turbulent dissipation. The variation of the total angular momentumcan be written as where M; is the angular momentum generated during the induction stroke; it remains constant duringcompression. The friction torque, Mr, is caused by friction on the cylinder wall, cylinder head andpiston crown. The friction at the chamber walls with a surface S can be written as The friction is estimated by a simplified formula for the wall shear stress t over a flat plate The friction factor Cr is given by the flat plate formula where A is an empirical constant and Rep is the equivalent of the flat plate Reynolds number; seePischinger et al. [3]. Since the angular momentum during the compression is conserved, the angular velocity can becalculated from where Icyl is the moment of inertia of the charge about the cylinder axis. The rotation impulse is being compressed from the cylinder diameter to the piston bowldiameter. It can be proven [3] that the moment of inertia of the charge about the cylinder axis for abowl-in-piston combustion chamber is where mcyl is the cylinder charge mass, x is the distance of the piston crown from the cylinder head,hg is the depth of the piston bowl and DB is the diameter of the piston bowl. At the TDC position, i.e. x~0, and from equation 3, 10 and 11 it can be seen that the angularvelocity in absence of wall friction is increased by a factor (Deyi/DB)}, typically about 3-4. This factoris not in accordance with the measurements [3] and the results of this publication. Therefore, frictionand wall dissipation in the fluid due to turbulence have to be considered. 5 EXPERIMENTAL RESULTS At first the swirl behaviour of the cylinder head was measured on the Tippelmann test rig.Figure 3 shows the results for both swirl cases. For the high swirl case (blue lines) the swirl numbersincrease at medium valve lifts and reach a final level of about 1.05, whereas for the low swirl case(red line) the swirl numbers remain constant on a low level and increase slightly only for large valvelifts. The mass flow of course is higher for the low swirl case, because both intake ports are open. Itis common to use the swirl values at 8 mm valve lift for the comparison of cylinder heads. It shouldbe noted that the ratio of the swirl numbers is 1.05/0.29=3.6. Fig. 3’Swirl number and mass flow of the cylinder head from the steady-stateTippelmann test rig; blue line:high swirl case, red line: low swirl case Results from the PIV flow measurement investigations are presented in Fig. 4. For the highswirl case (left) and the low swirl case (right) the cycle-averaged flow fields have been selected fortwo different times from the long sequences of PIV results during the compression stroke. In the toprow, the flow fields are shown during the intake stroke at 60°CA after TDC. A highly turbulent flowfield is present during the intake phase in the measurement plane under the cylinder head. In thebottom row,, a well-defined swirl flow is visible in the middle of the compression stroke at 270°CAfor the high swirl case, whereas for the low swirl case the level of rotation is still rather low at thistime. As mentioned above, the final swirl flow developments close to TDC have not been measured. Flow profiles taken from PIV vector maps, Fig. 5 left, show a more or less pronounced solid-body-type swirl structure. The profiles are taken above the piston bowl and are smoothed to suppressthe influence of straylight e.g. from the valve seats. There is a slight offset in the profiles because thecentre of rotation is not perfectly centred in the cylinder. For further calculation of the swirl ratioonly the values of the slopes are considered. The development of the swirl ratio in one specific planeclose to the cylinder head during intake and compression stroke is shown in Fig. 5, right. Especiallyfor the high swirl case there is a strong increase of the swirl early in the compression stroke. The airenters the cylinder through the valve and moves downwards. This leads to rather low flow velocitiesclose to the cylinder head. During the compression stroke at 240℃A the fast rotating air is shiftedupwards and results in a high flow velocity in the plane of measurement. Due to wall friction, the airvelocity decreases and finally a more or less solid-body type swirl is formed in the cylinder. For thelow swirl case the evaluated flow velocities appear slightly too low. Fig. 4'PIV swirl flow development measurements on the optical engine at 1200 1/min;top row: during intake stroke; bottom row: during compression stroke Fig. 5’ Flow profiles at 300°CA from PIV measurements for high swirl and low swirl case (left)and swirl ratio development during intake and compression stroke (right) A typical sequence of HSV frames taken in a single engine cycle is shown in Fig. 6. Everysecond frame of the video sequence has been skipped in the presentation. The influence of the in-cylinder swirl on the movement of the soot clouds can be clearly seen. For a clearer separation of theflame clouds, a 5-hole injector was used for this visualisation, whereas the quantitatively evaluatedmeasurements were performed with an 8-hole injector. After formation of the clear cloud structureduring early flame development, the overall structure remains similar until the soot becomesinvisible,long after the last frame in this sequence. Fig. 6’HSV frames of swirling soot clouds in the engine cylinder; high swirl case,engine operation with a 5-hole injector; numbers indicate CA; 360°CA=TDC By means of the above-mentioned procedure, the swirl strength is evaluated. It is presented as aswirl ratio in Fig. 7 according to equation 2, each case for one single combustion cycle with high andlow swirl. One can clearly see the phase of early flame formation characterised by unstable values,the subsequent phase of stable flame rotation, and the final phase of flame quenching where theflame signal decays to noise. During the stable flame rotation phase, a slight decrease in swirlstrength can be observed which can be assigned to wall friction and the negative pirouette effect. Theswirl numbers averaged during the phase of stable flame rotation are 5.21 for the high swirl case and1.23 for the low swirl case, respectively. The ratio of the swirl ratios is 4.2 and therefore of the samemagnitude as for the Tippelmann swirl numbers. Finally, two light intensity traces recorded by the optical probe are shown in Fig. 8. The self-luminescence was recorded at a wavelength of 750 nm. For the high swirl case three maxima arepresent and the above-mentioned calculation is applied. The swirl ratio 4.5 is calculated by thedistance in deg CA of the second to the third peak to be about 10°CA. For the low swirl case only one maximum is visible in the signal. Therefore, the probe technique can not be applied successfullyat such low swirl levels. Fig.7'Swirl flow development during combustion evaluated by the HSV correlation method Fig. 8'Self-luminescence ofthe swirling flame, recorded by the optical probe;high and low swirl cases; signals given in arbitrary units 6 DISCUSSION The swirl flow development calculated by the procedure discussed in chapter 4 is presented in Fig.9together with selected experimental data. The higher the swirl in the piston bowl, the higher thelosses in momentum due to wall friction and turbulence. Therefore, the increase in swirl strength isnot as high as estimated by simply taking into account the diameter ratio of cylinder and piston bowl.The solid-body-type swirl is reduced by the boundary layer shear stress. The friction factor orefficiency depends on the tangential velocity of the swirl. The PIV-data represent the averaged swirl flow data calculated from several flow profilesmeasured between 240°CA and 300°CA. For the low swirl case no reliable data were achieved atthis low engine speed. The HSV correlation technique yields to clear swirl data after TDC for bothswirl strengths. The data are averaged over a small number of single engine cycles. The optical probetechnique only provides data for medium and high swirl engine operation. As expected, the swirlafter TDC during the late phase of combustion is lower than the maximum swirl calculated at TDC. Fig. 9' Swirl flow development in an optical engine at 1200 rpm for high and low swirl cases;numerical simulation and data achieved by different experimental techniques The real swirl in the cylinder differs from the solid-body-type swirl assumed for the HSVcorrelation evaluations. The position of the optical probe is defined by the glow plug bore. At thislocation, the tangential flow component is slightly lower compared to the cylinder-averaged flowvelocity. It can be clearly seen that the different swirl strengths produced by the two settings of the intakeports measured on the Tippelmann test rig lead to the same ratio of swirl strengths in the cylinderduring combustion. Thus, the ratios between different swirl strengths for different operating settingsCas well as the absolute swirl numbers can be interpreted. 7 CONCLUSION The formation of the swirl flow in the cylinder during the compression stroke and the swirl strengthduring combustion have been analysed by means of different optical methods, PIV, an HSVcorrelation method, and an optical probe technique. The mPIYethods complement one another. PIVmeasurements have been performed during the intake and compression stroke, but not later than30°CA before TDC.The application of the HSV correlation method and the optical probe techniqueare restricted to the combustion phase when bright soot clouds are present. For PIV and HSVcorrelation an optical engine with large scale optical access to the combustion chamber is required. A zero-dimensional calculation procedure was used to calculate the swirl strength in the engineat the time of combustion. Input data are only geometrical data of the engine, valve lift curves, andsteady-state flow results achieved from a standard Tippelmann test rig. In addit1i0onn,1 a friction factorhas to be taken into account when calculating the swirl ratio. With this simple approach, it is possibleto predict the swirl at the time of combustion with sufficient accuracy. A simple verification can beprovided by analysing the light intensity profiles recorded by an optical probe mounted in the glowplug bore. To apply this type of probes no engine modifications are required. Unfortunately, theprobe technique is slightly restricted to medium- and high-swirl engine operation, because at leasttwo peaks must be visible in the self-luminescence recording. The swirl information gained will help to optimise the development process for next generationDI diesel engines, and to meet future emission requirements. Besides the optimisation of the swirlstrength, a (partly) homogenised combustion process and new synthetic fuels will contribute to muchlower soot emissions in future diesel engines; see e.g. Steiger et al. [7]. These techniquessummarised under the key word ‘combined combustion system' (CCS) are under investigation atVolkswagen Engine Research. 1 Bauder R, Brucker D, Hatz W, Lorch H, Macher A, Pamio Z, Reuss T, Riegger R, Schiffgens H-J.Der[neue3.0-1-V6-TDI-MotorrVon Audi:Teil2: Thermodynamik,-2Applikation undAbgasnachbehandlung. MTZ Vol 9, pp 684-694, 2004, in German. ( 2. HeywoodJ B. Internal combustion engine fundamentals.McGraw-Hill Book Co,1988 . ) ( 3. Pischinger R R, Kell M,Sams T. Thermodynamikder V e rbrennungskraftmaschine e Der Fahrzeugantrieb. Springer Wien N ew York, 2nd ed., 2002, in German. ) ( 4. Arcoumanis C, Whitelaw J H, Hentschel W, Schindler K-P. Flow and combustion in a transparent 1.9litre direct injection diesel engine. Proc Instn Mech E ngrs V o l 208, Part D: Journal of A utomobileEngineering, pp 191-205,1994. ) ( 5. Miles P. The evolution of flow structures and turbulence in a fired HSDI diesel engine. SAE TechnicalPaper Series 2001-01-3501, 2 001. ) ( 6. H entschel W . M o dern To o ls for diesel en g ine combustion investigation. 26. Symp (Int) on Combustion / The Combustion Institute, Naples, pp 2503-2515,1 9 96. ) ( 7. Steiger W, Kohnen C . N e w combustion systems base d on a new f u el s p ecification. Proc 26. Int.Vienna Engine Symp, pp 91-11 0 Vienna, 2006, i n German. ) ( 8. Tippelmann G. A new method of investigation for swirl ports.SAE Technical Paper Series 7 70404, 1977. ) 9. Hentschel W, Block B, Oppermann W. PIV-Investigation of the In-cylinder Tumble Flow in an IC-engine. Proc. Proc 8th Int Conf on Laser Anemometry Advanced andApplications, Rome, pp 429-438, 1999. 10.Hentschel W, Block B, Ohmstede G, Oppermann W, Henning H. Application of modern opticalmetrology to the investigation of flow, spray, mixture-distribution and auto-ignition at early pre-injection in a CR diesel engine. Proc 5. Int Symp on Combustion Diagnostics, Baden-Baden, pp75-88,2002. 11.LaVision. DaVis-Software,version 7, PIV-Module. 12.Czajka J. Zur Bestimmung des Dralls in Diesel Brennverfahren. Diploma thesis, Wolfsburg/Poznan,2005, in German, not published. 13.).Kunte S, Boulouchos K, Hentschel W, Kallmeyer F, Cavalloni C, Karst D. Optical indicating oncombustion engines with smallest sensors. Proc.10. Symp The Working Process of the InternalCombustion Engine, Graz, 2005. 14. Wenzel S, Schmerbeck S Kohnen C Stolte U. Tools and methods to investigate diesel enginecombustion. Proc. VII Congr. Engine Combustion Processes - Current Problems and ModernTechniques, Munich, pp 75-86, 2005, in German. 15.Vanhaelst R. Optische und thermodynamische Methoden zur Untersuchung der teilhomogenenDieselverbrennung, PhD dissertation,Otto-von-Guericke-Universitat Magdeburg, 2003, in German. 16.).Berg T, Thiele O, Beushausen V, Hentschel W. Optical sensors for automotive engine-researchapplications. 4 IEEE Int. Conf. on Sensors, Irvine, 2005, on CD. 17..Schubiger R. Untersuchungen zur Russbildung und -oxidation in der dieselmotorischen Verbrennung:ThermodynamischeKenngrossen, Verbrennungsanalyse und Mehrfarbenendoskopie. PhDdissertation ETH Zirich Nr. 14445,2001, in German. The amount of soot emissions from small high-speed direct-injection diesel engines is sensitivelydependent on the strength of the in-cylinder swirl flow which is important for the formation of anignitable mixture. Three optical techniques - Particle Image Velocimetry (PIV), a full-fieldcorrelation method based on high-speed video recording of the swirling flames, and an optical probetechnique - have been applied to characterise the setup and the final strength of the swirling airmotion during compression stroke and the time of combustion. Two different swirl levels wereinvestigated. The experimental results are compared to calculations based on integral flowmeasurements performed under steady-state conditions. The final swirl at the time of combustionpredicted by the simple model calculation is in good agreement with the experimental results.
确定
还剩13页未读,是否继续阅读?

产品配置单


北京欧兰科技发展有限公司为您提供《直喷柴油发动机中漩涡流动检测方案(粒子图像测速)》,该方案主要用于汽车电子电器中理化分析检测,参考标准--,《直喷柴油发动机中漩涡流动检测方案(粒子图像测速)》用到的仪器有德国LaVision PIV/PLIF粒子成像测速场仪、PLIF平面激光诱导荧光火焰燃烧检测系统、汽车发动机多参量测试系统、LaVision SprayMaster 喷雾成像测量系统
推荐专场


相关方案
更多
该厂商其他方案
更多