


采用LaVision公司特色的以DaVis软件平台为基础构成的粒子成像测速(PIV)系统对直接喷射火花塞引燃(DISI)引擎进气道产生的流动不稳定性进行了测试和研究。
方案详情

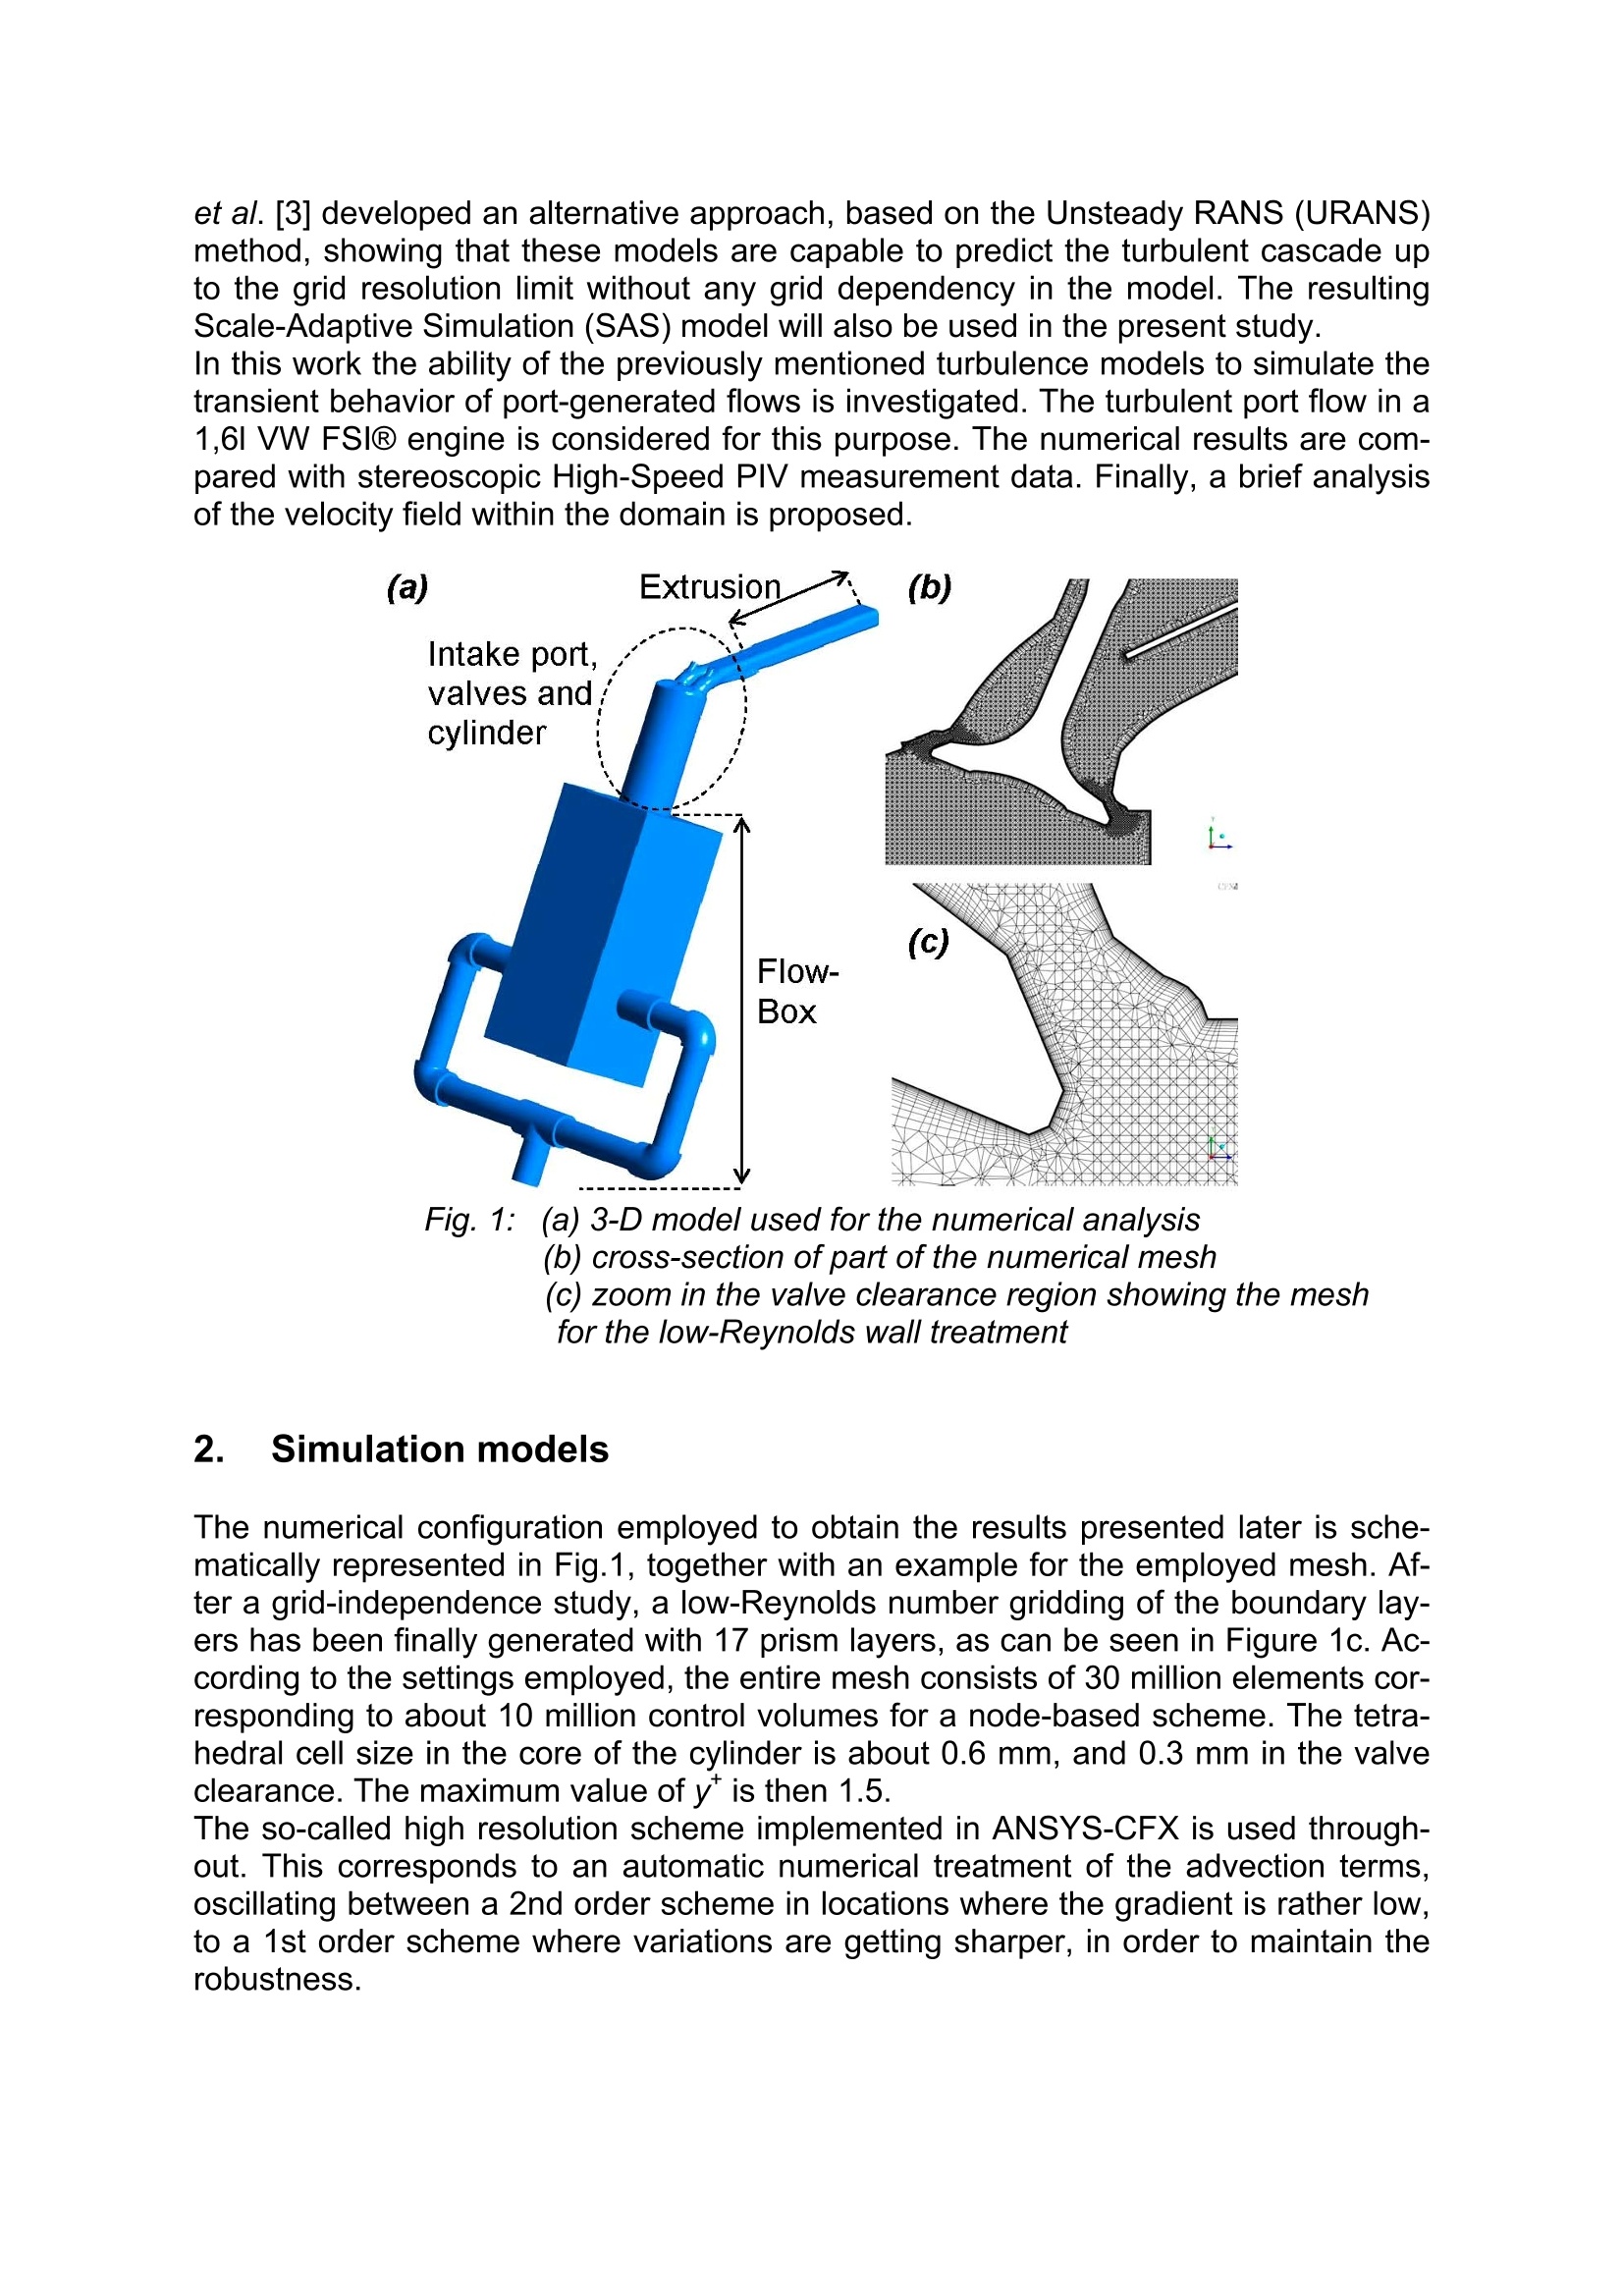
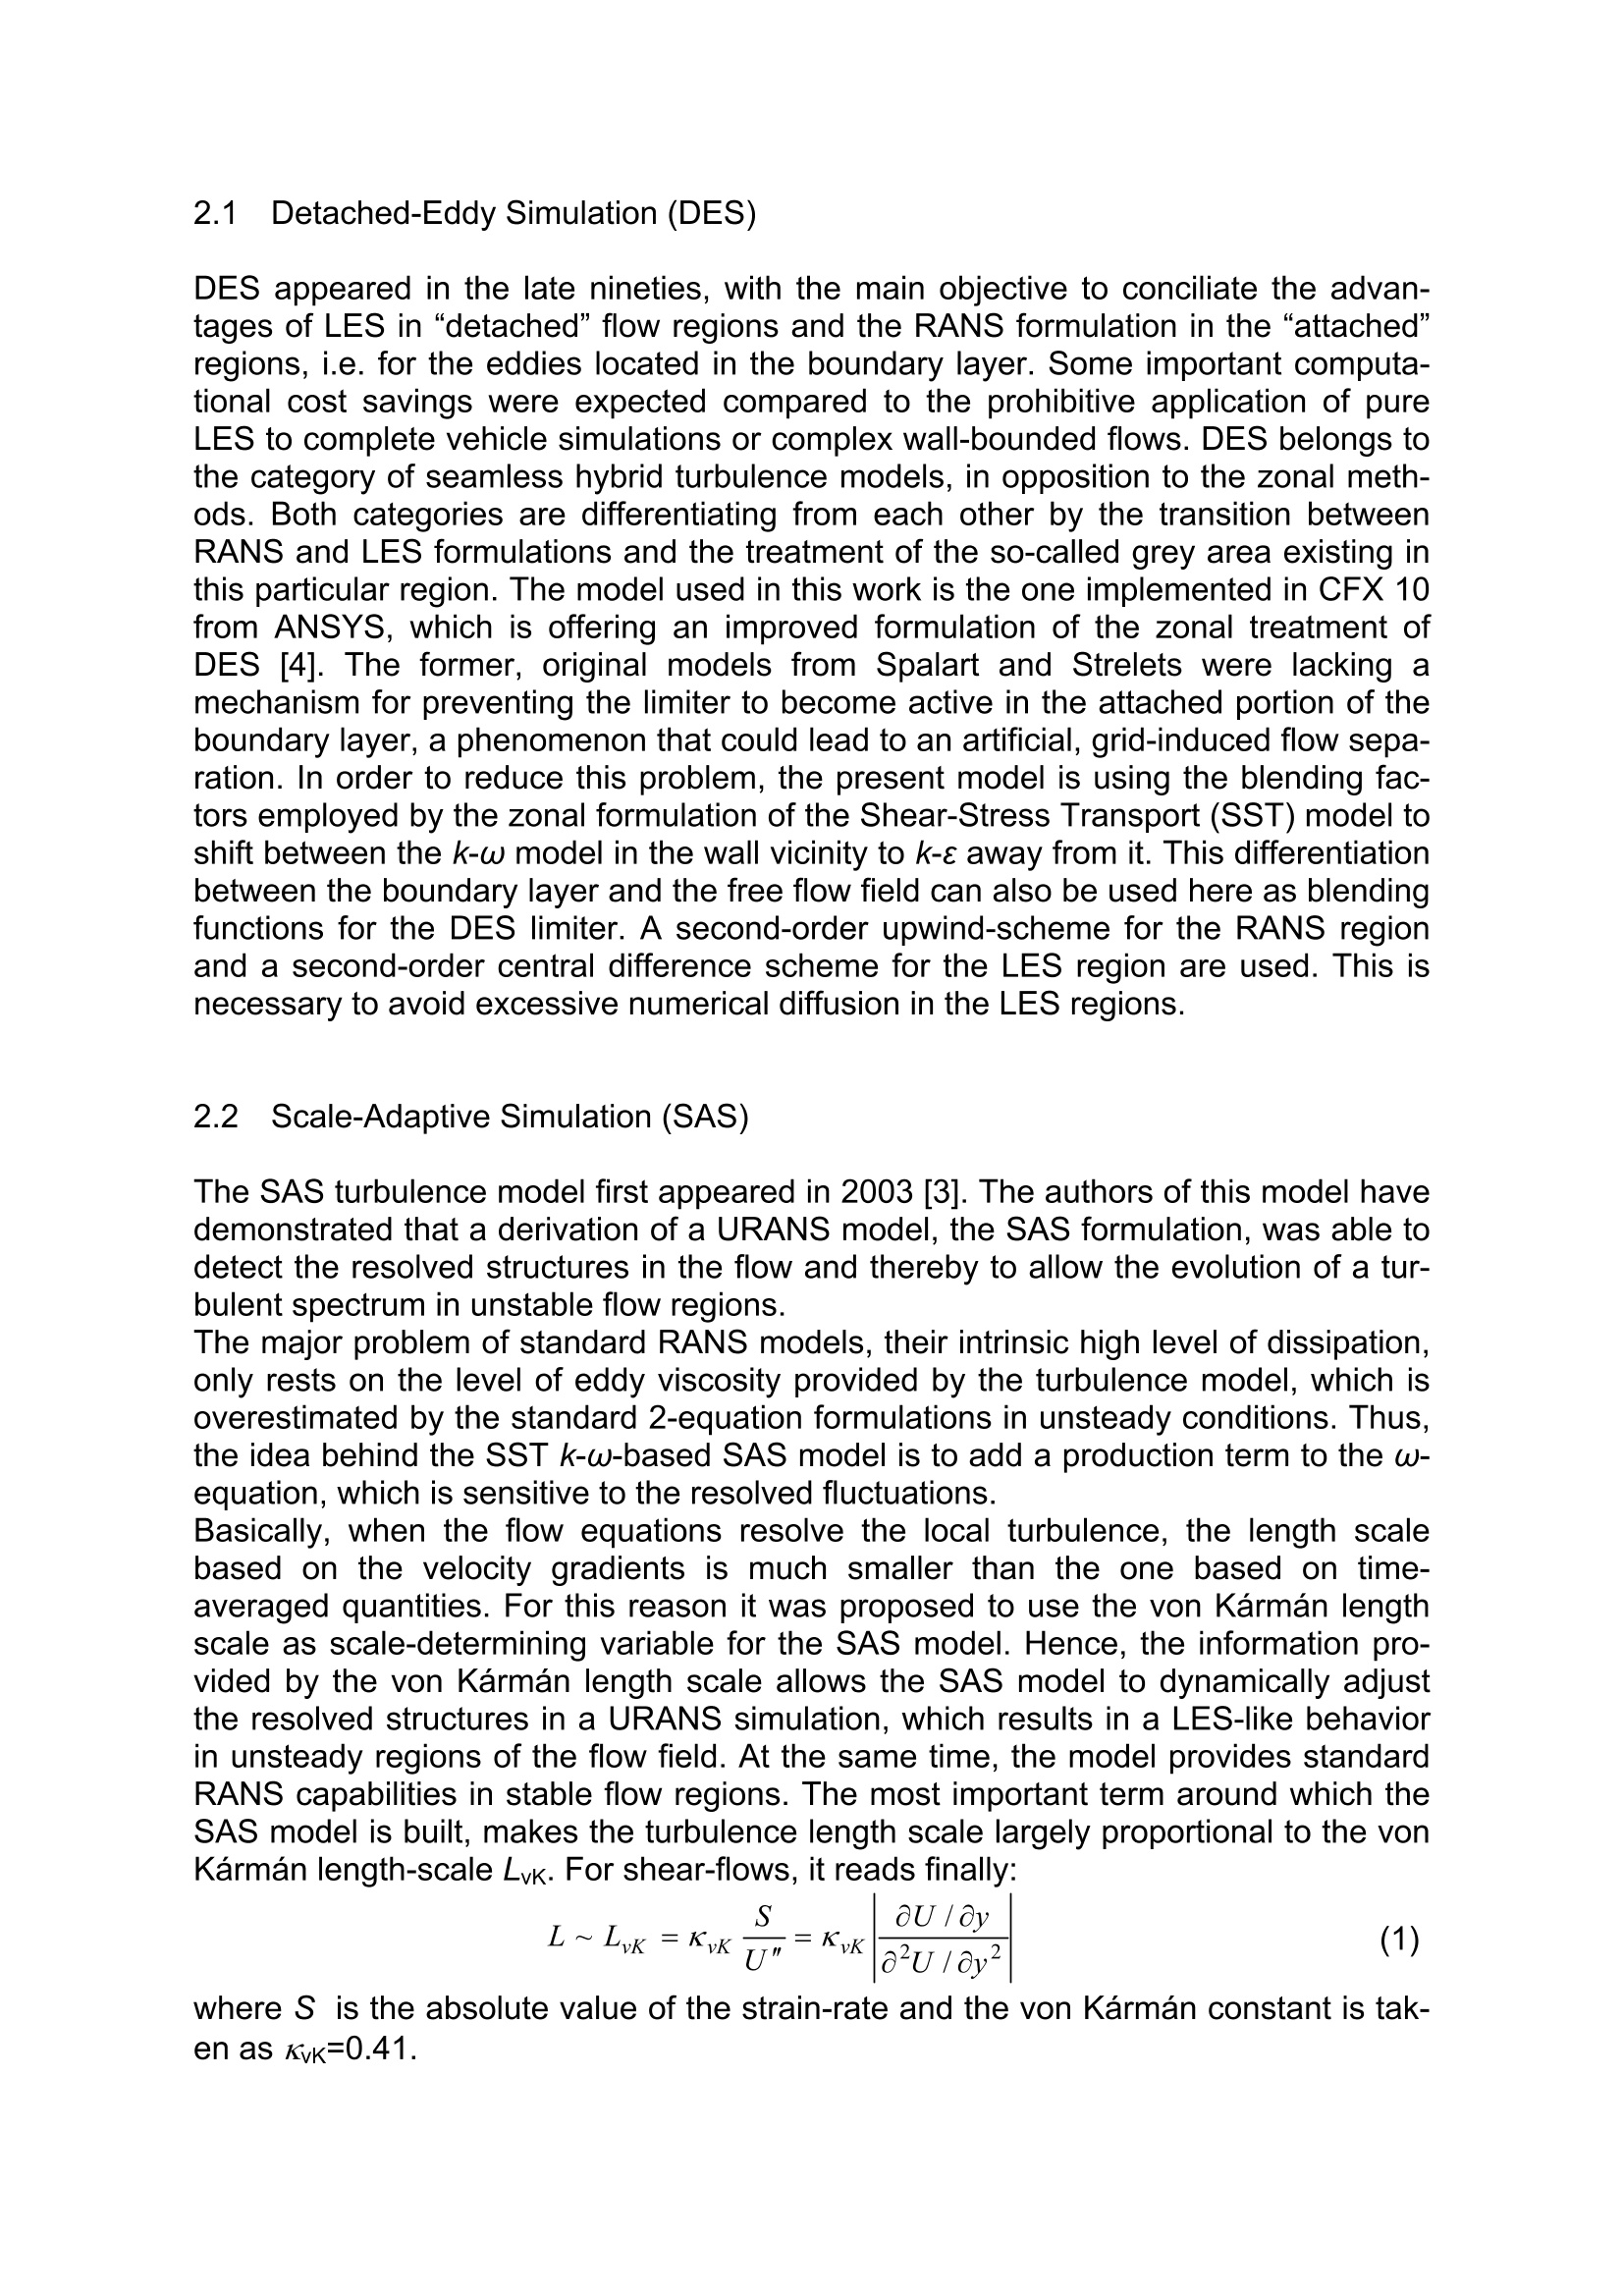
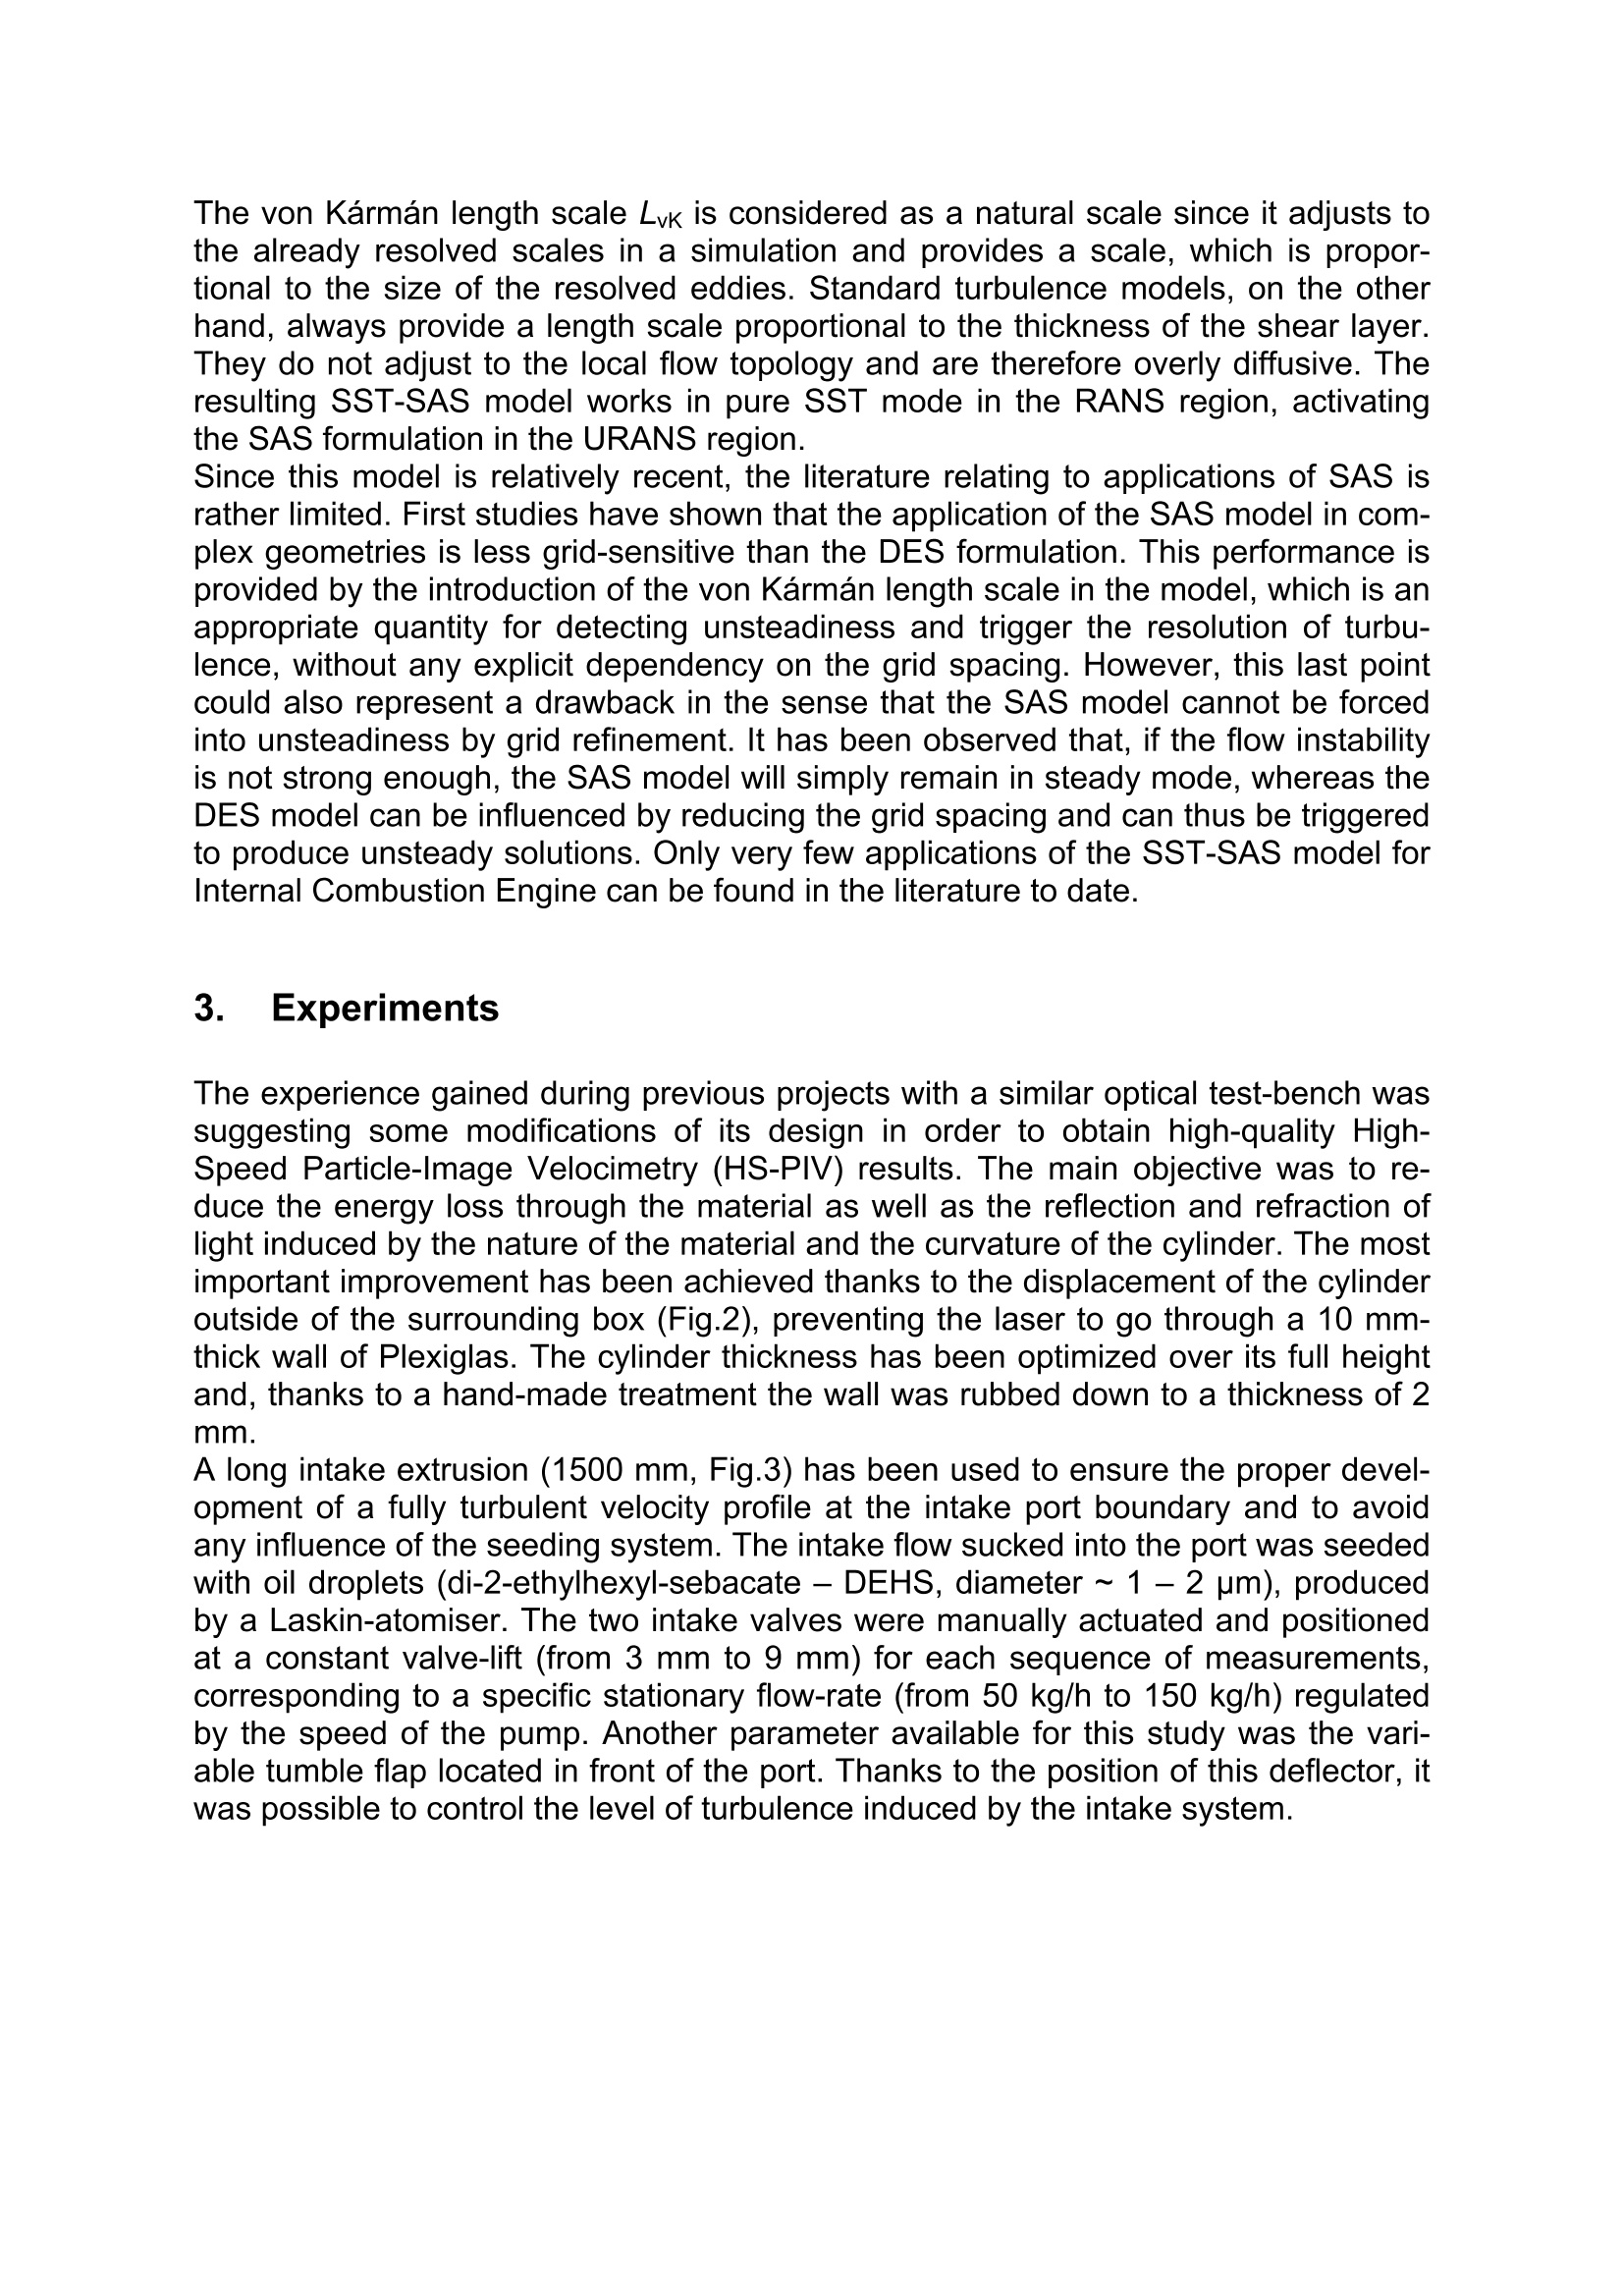
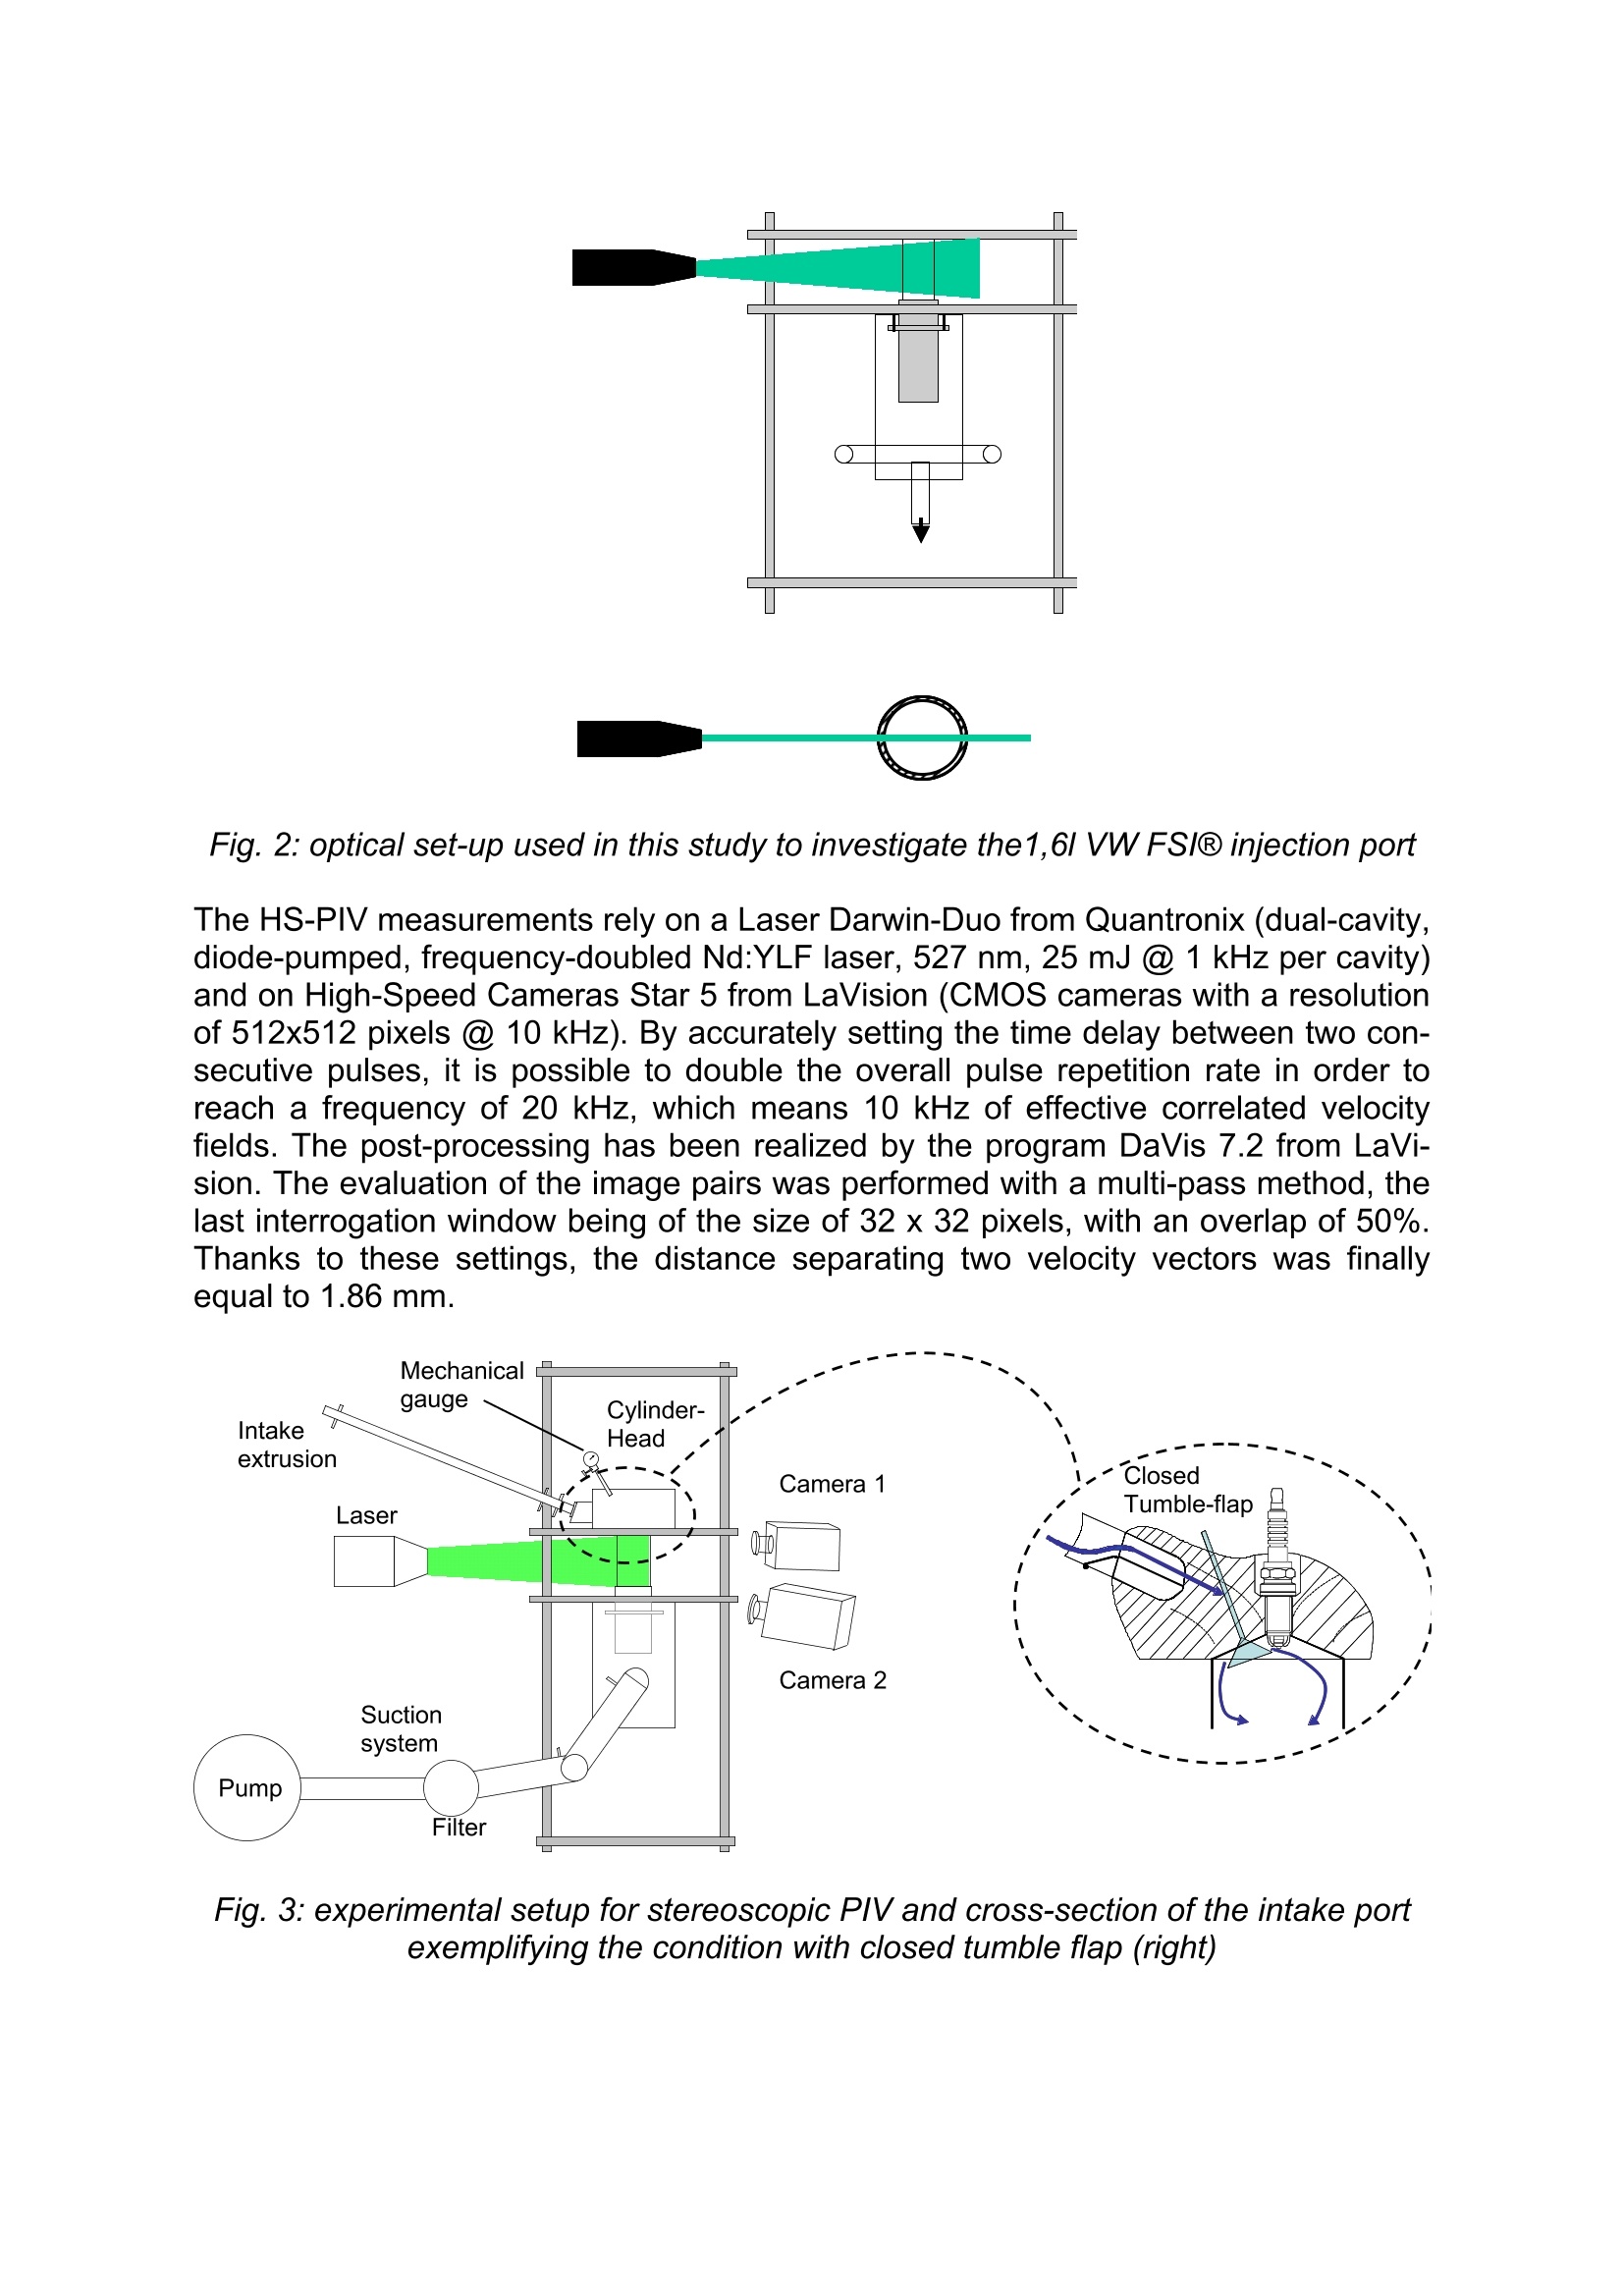
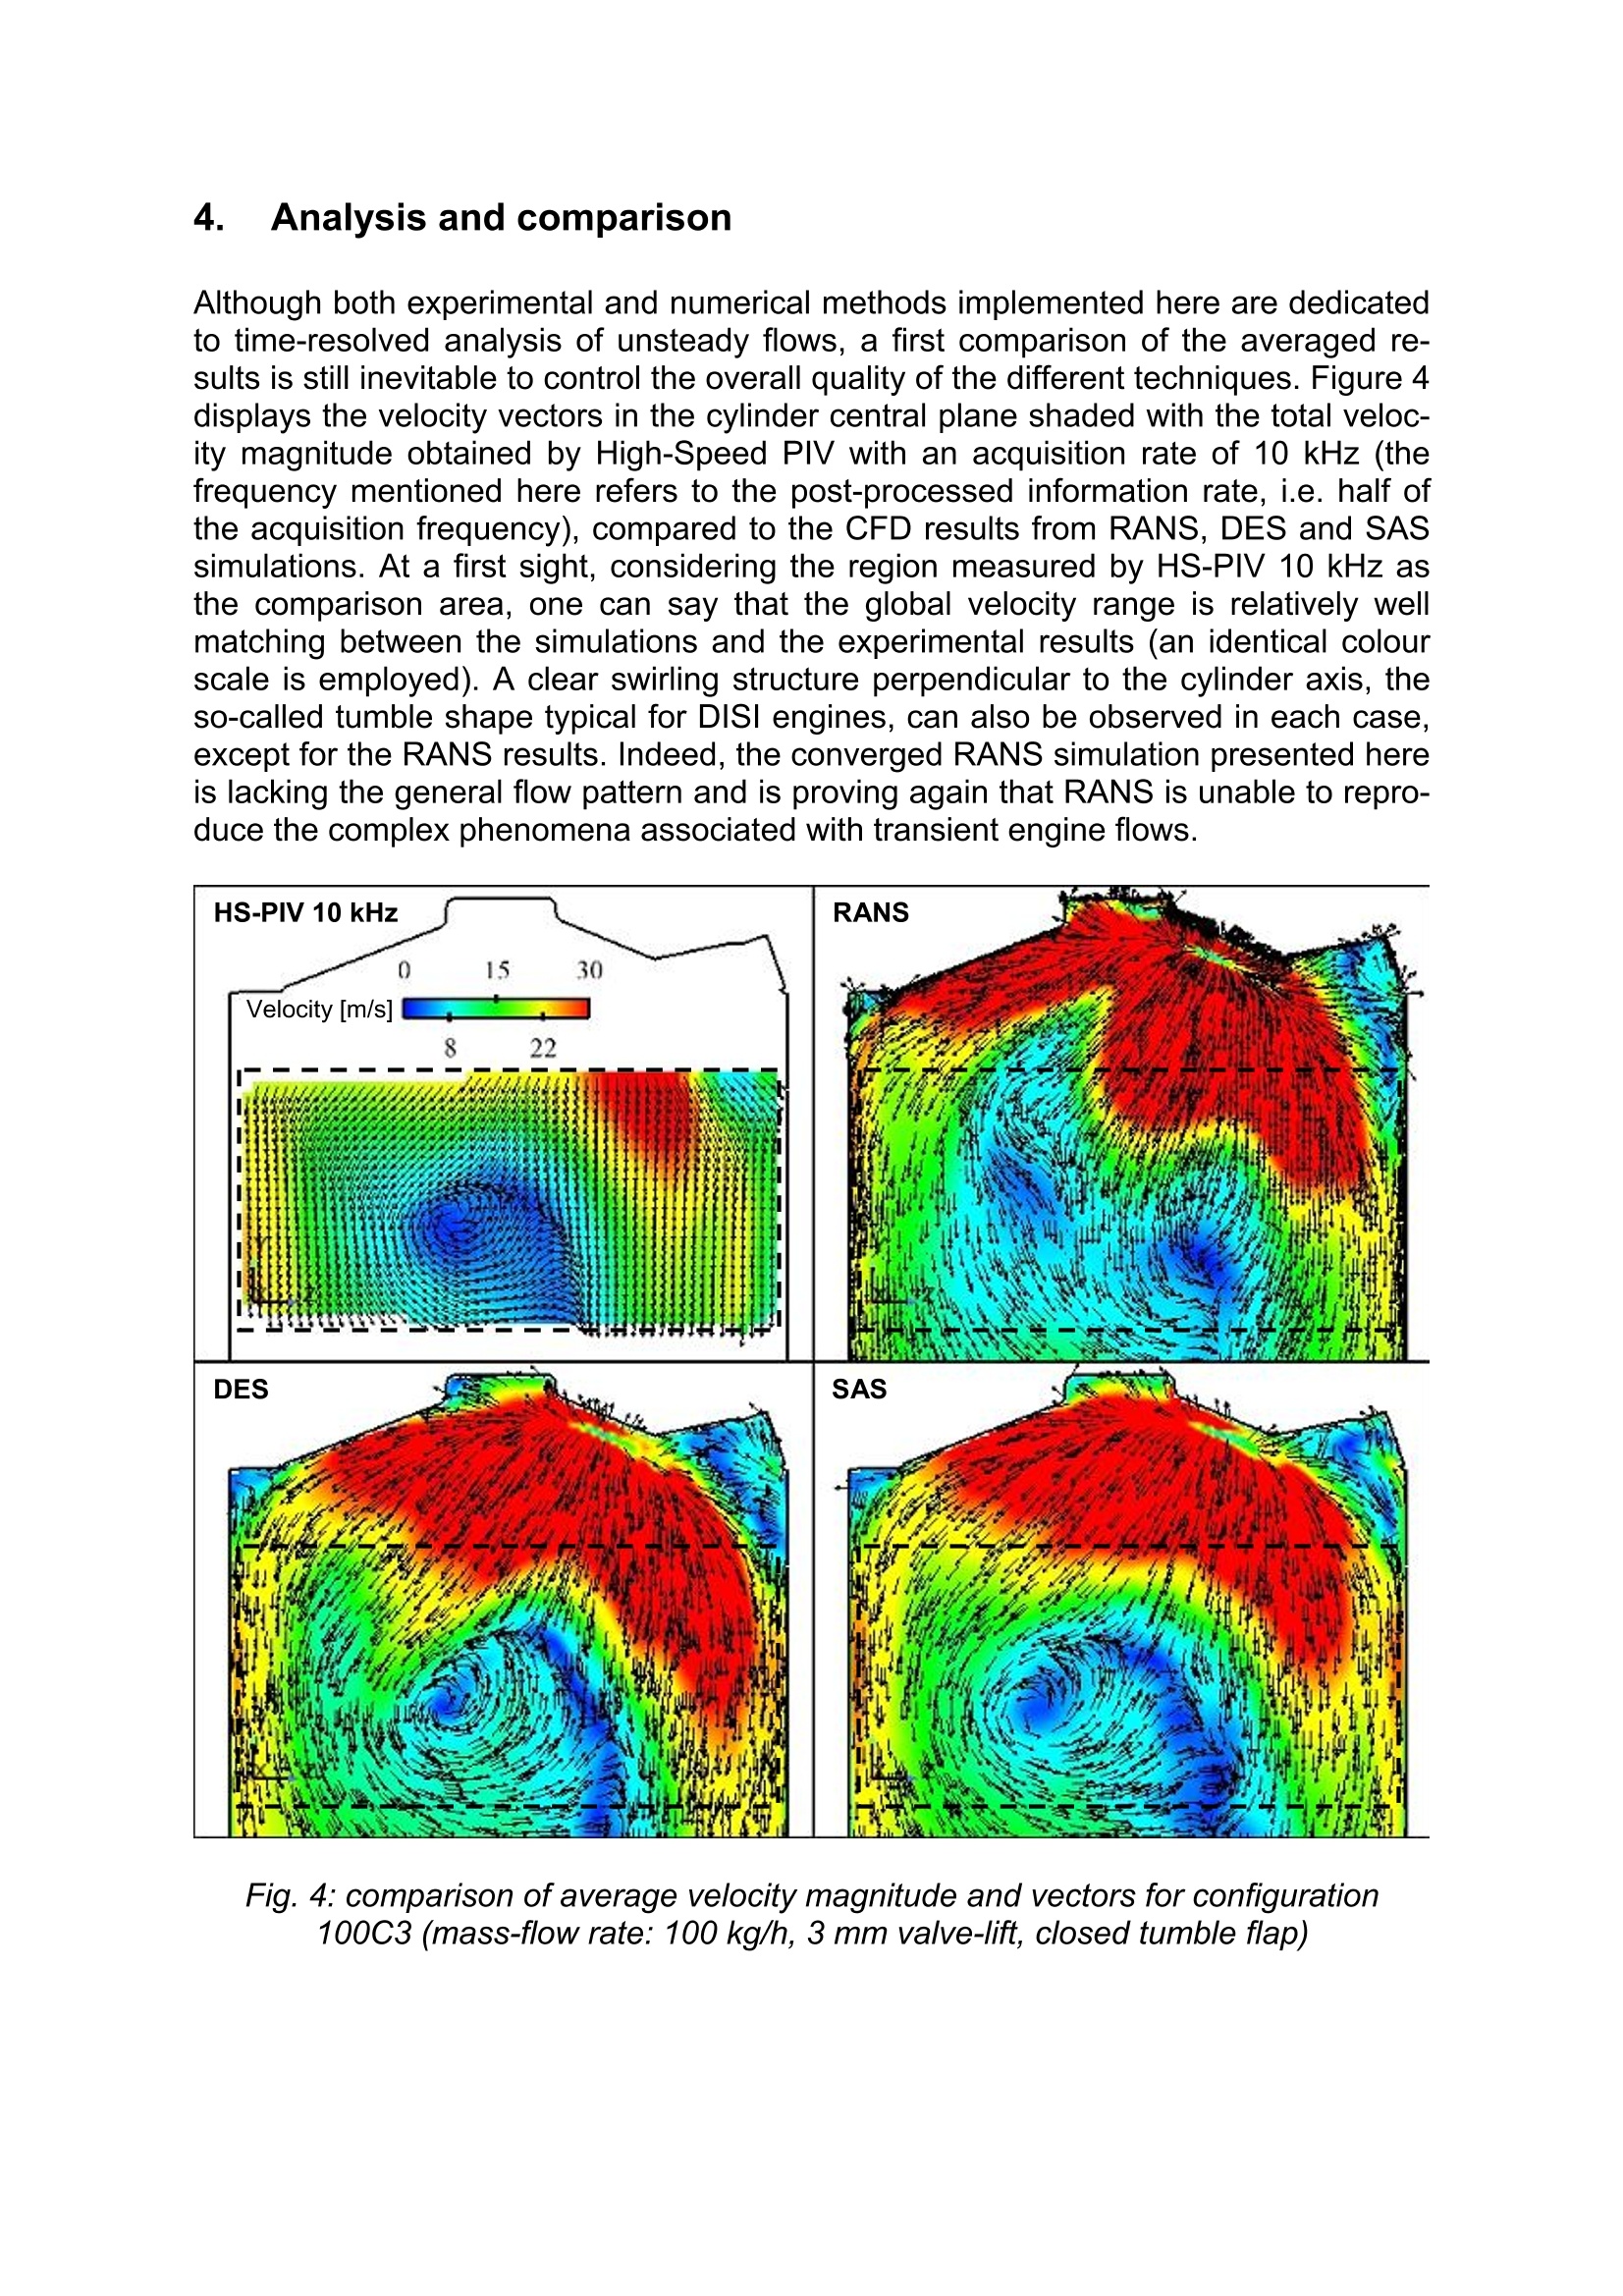
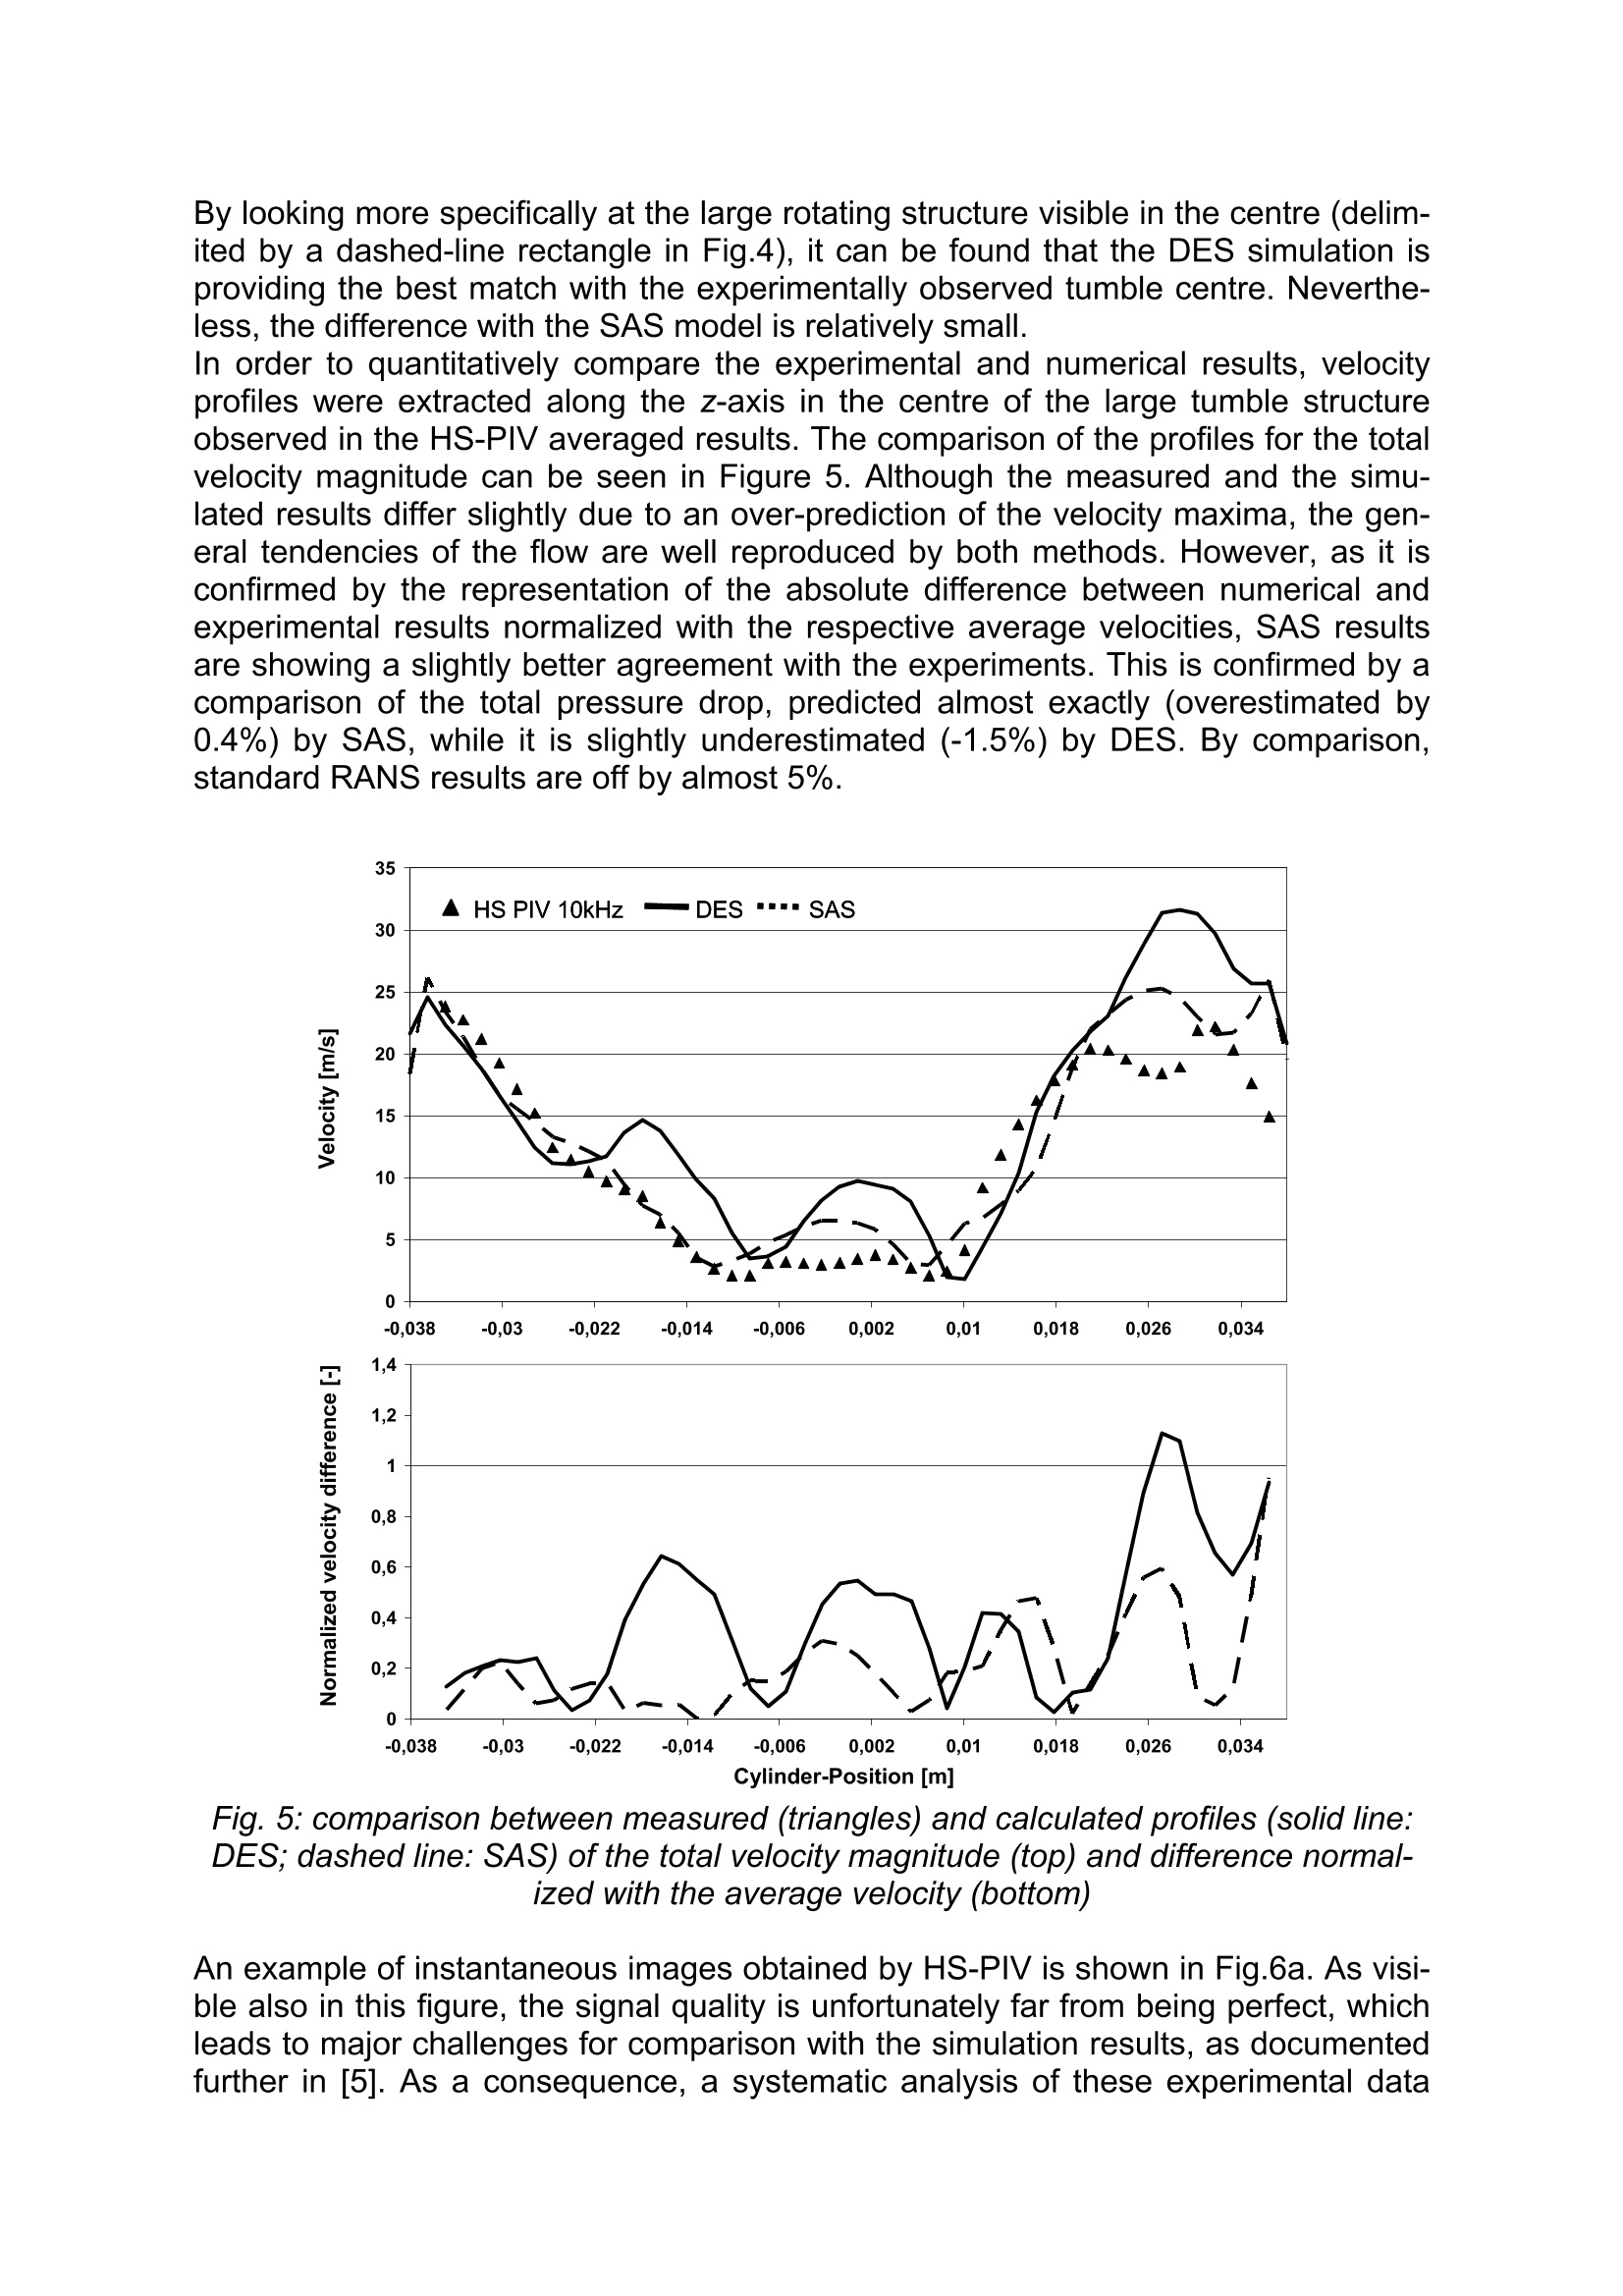
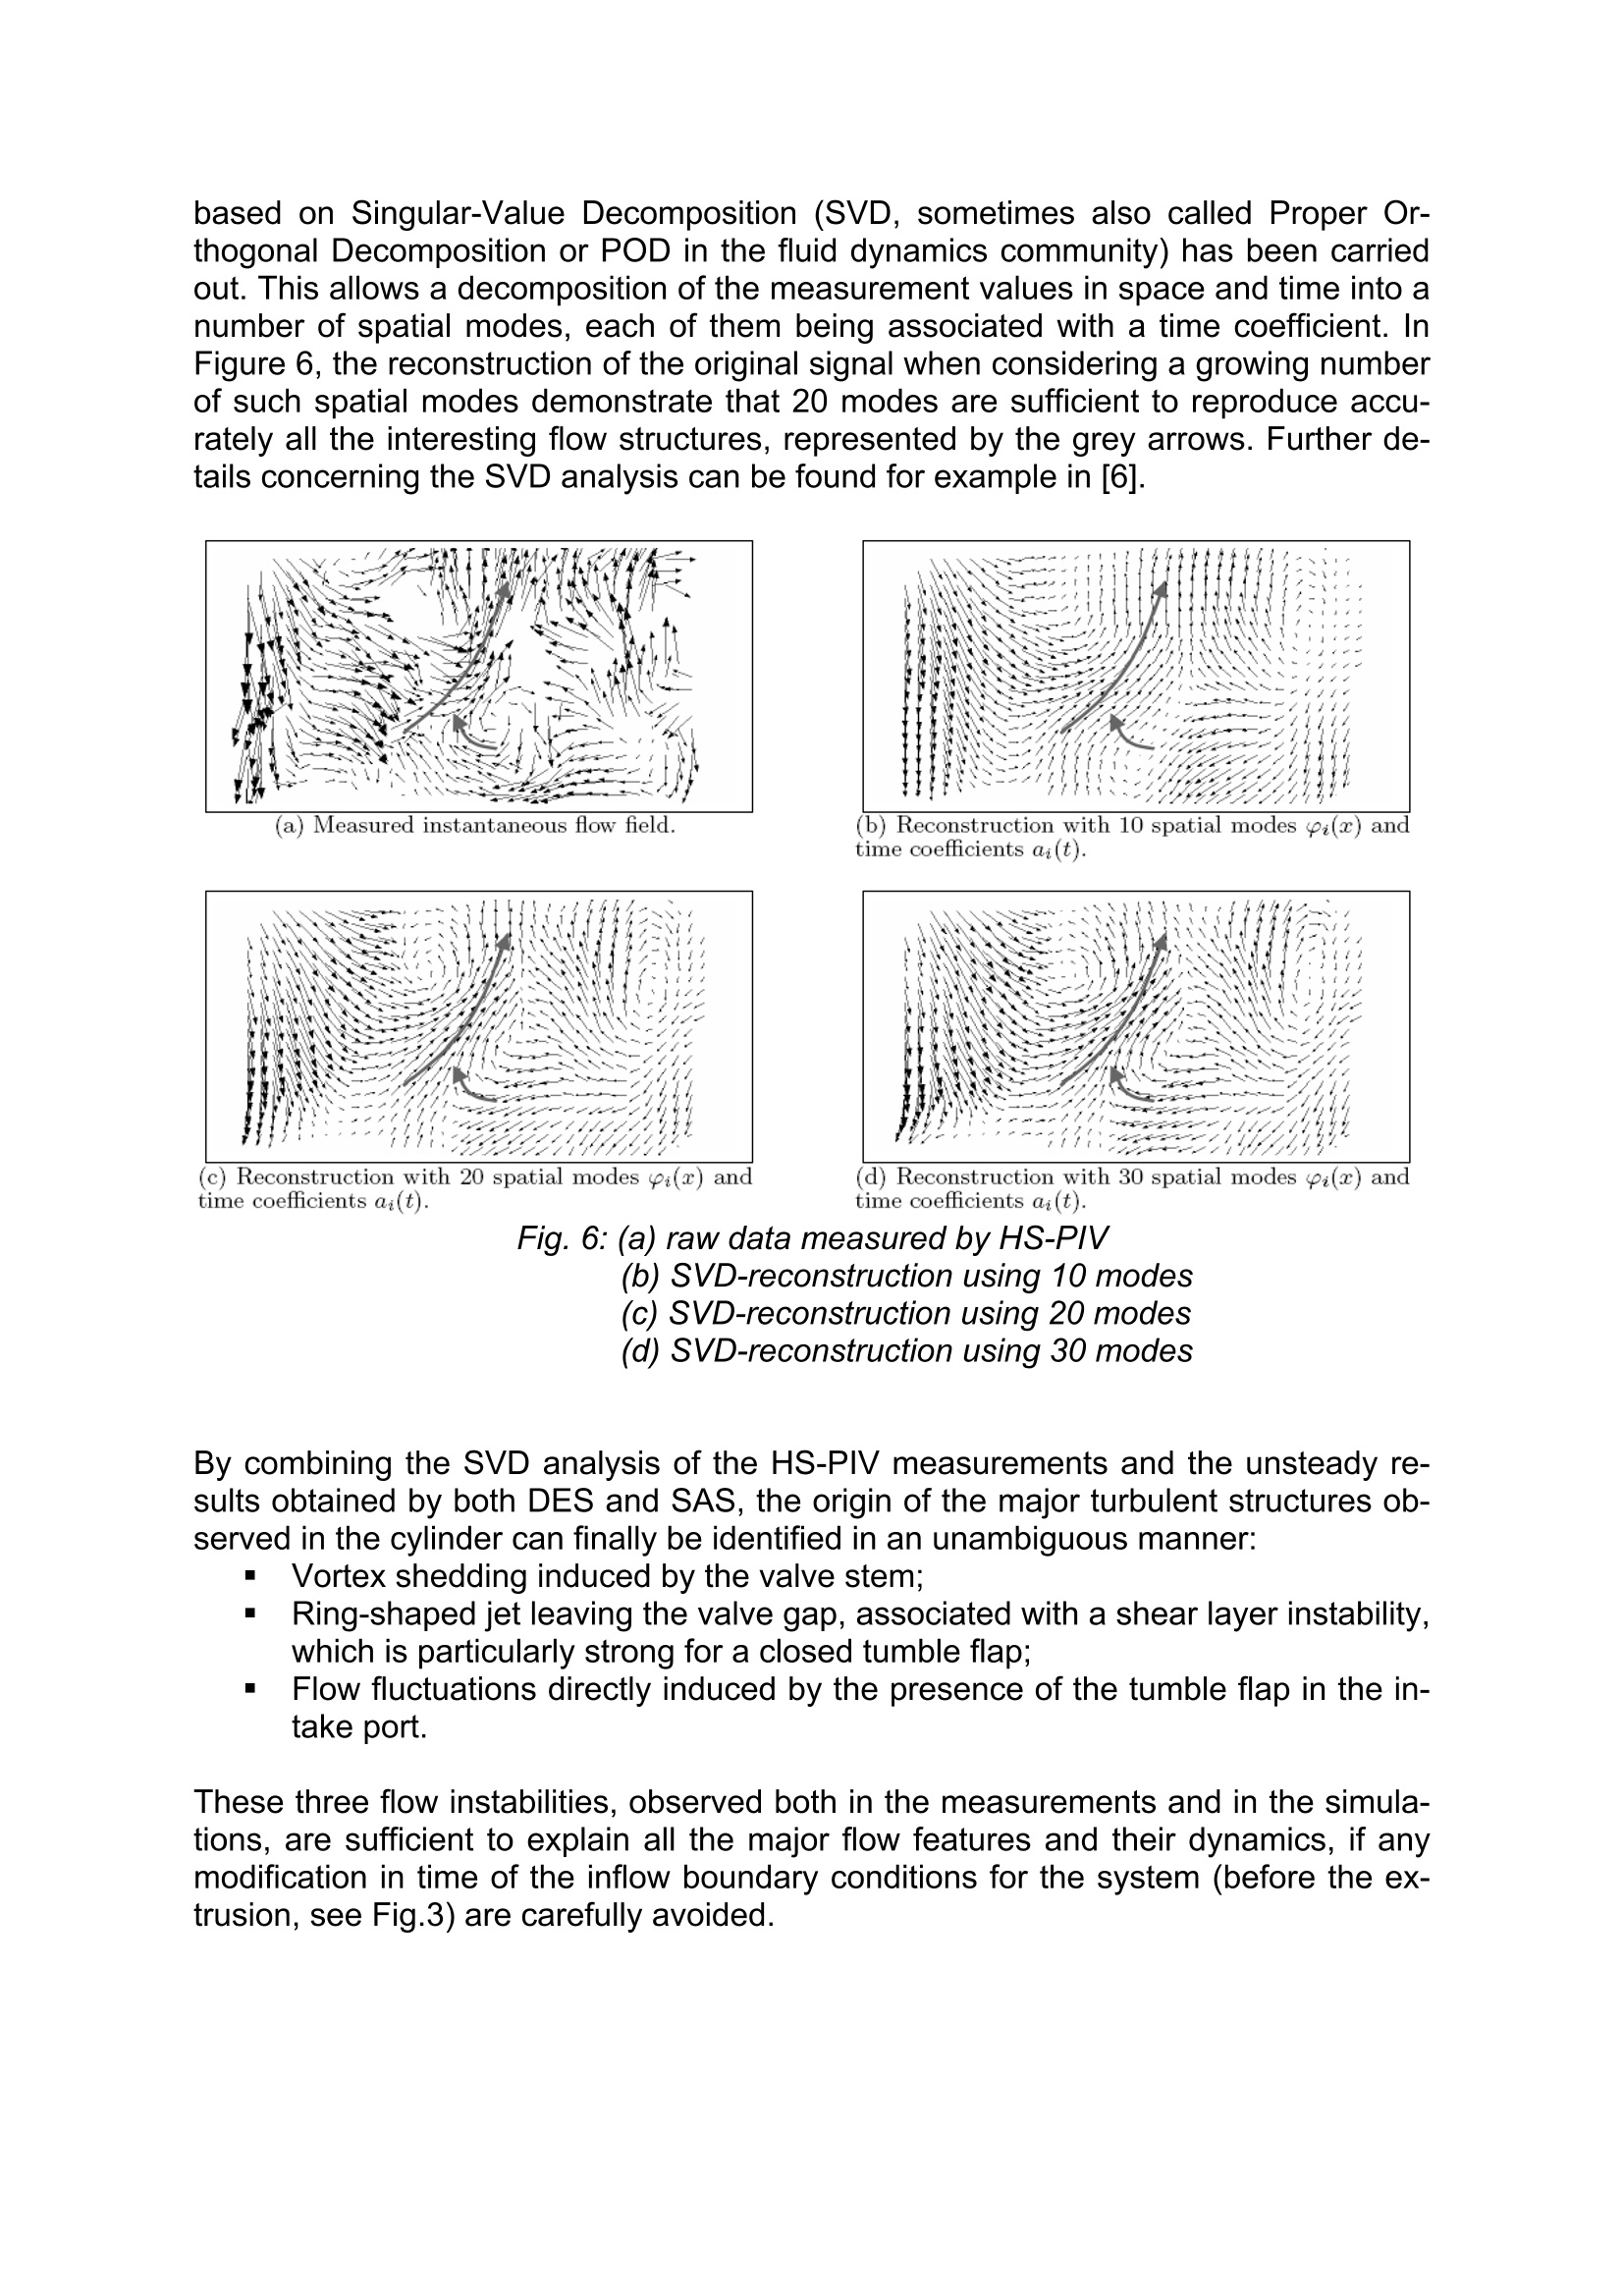
Flow Fluctuations Generated by the Intake Port of a DISIEngine Dominique Thevenin Olivier Imberdis Michael Hartmann Henry Bensler Lars Kapitza Abstract The numerical simulation of the turbulent flow induced by the intake port of a moderndirect injection gasoline engine requires the application of advanced turbulence mod-els taking into account the unsteady nature of the flow. The validation of such modelsnecessitates the availability of high-quality, unsteady experimental data. The presentpaper describes a comparative analysis between such numerical simulations relyingeither on Detached Eddy Simulation (DES) or Scale-Adaptive Simulation (SAS), andexperimental data obtained by High-Speed Particle Image Velocimetry (HS-PIV). Theflow field generated by the cylinder-head of a production four-valve gasoline enginein a configuration with fixed valve positions has been considered. With an acquisitionfrequency of 20 kHz and a mesh size of about 30 million cells, a particularly goodresolution of the turbulent structures was achieved both in the experiment and thesimulation. Post-processing issues become very important for such conditions andwill be also briefly considered. Kurzfassung Fur die numerische Simulation der einlasskanalgenerierten turbulenten Stromung ineinem modernen Otto-Motor mit Direkteinspitzung ist es notwendig fortschrittlicheTurbulenzmodellen zu verwenden, die die Zeitabhangigkeit der Stromung beruck-sichtigen. Um solche Modelle zu validieren werden qualitativ hochwertige, zeitaufge-loste experimentelle Messungen benotigt. Die vorliegende Arbeit beschreibt einenentsprechenden Vergleich zwischen numerischen Stromungssimulationen unterVerwendung der Detached Eddy Simulation (DES), sowie der Scale-Adaptive Simu-lation (SAS) und Ergebnissen aus Messungen, die durch High-Speed Particle ImageVelocimetry (HS-PIV) gewonnen wurden. Die einlasskanalgenerierte Stromung ineinem Serienmotor wird bei konstantem Ventilhub betrachtet. Dank einer Datenauf-nahmefrequenz von 20 kHz und eines numerischen Gitters mit ca. 30 Millionen Zel-len wird eine sehr gute Auflosung der turbulenten Strukturen im Experiment und inder Simulation erzielt. Die Frage der Datenanalyse ist fur solche Bedingungen be-sonders schwierig und wird daher auch kurz angesprochen. 1. Introduction The application of 3D Computational Fluid Dynamics (CFD) is taking an ever increas-ing role in the development of engine components as it is being used much earlier inthe design process. Knowledge of the flow structure in the intake ports and cylindersis of primary importance to optimize global internal combustion engine performance.For today's modern direct injection spark ignition (DISI) engines, this requirement iseven more critical to better understand phenomena such as air-fuel mixing, the com-bustion process and engine cyclic variations. Indeed, these engines, which are pre-senting numerous advantages compared to the more conventional port-fuel injectionengines, are subjected to strong cycle-to-cycle fluctuations. Amongst the flourishingliterature concerning the topic, various studies are corroborating the assumption thatturbulence and aerodynamic fluctuations are one of the sources of engine cyclicvariations. For instance, Hentschel et al. [1] have analyzed the temporal developmentof the in-cylinder flow field, the spray formation and its interaction with the surround-ing air by comparing some optical measurement results conducted in a pressurechamber as well as in an optical engine. In engine experiments higher cyclic fluctua-tions have been observed compared to the pressure chamber, where the spray for-mation parameters could be accurately controlled. This is reinforcing the idea that thecycle-to-cycle variations in DISI engines may find a part of their origin in the in-cylinder flow fluctuations. Current numerical methods based on Reynolds Averaged Navier-Stokes (RANS)methods are often applied to simulate both steady and unsteady port flows, but theinherent averaging concept results in information loss. Indeed, the flow generated bythe intake-port of a DISI engine is highly turbulent, characterized by a very broadrange of scales. This last characteristic is the main issue with which numerical simu-lation needs to deal with. Even though computer capacity has drastically increasedduring the last decades, the large range of scales inherent in turbulent flows makes itimpossible to directly solve the governing Navier-Stokes equations for complex appli-cations. Different turbulence models are therefore used to modify these equationsand to generate a new set of equations, which can be numerically approximated us-ing available resources. The most widely accepted unsteady approach is Large-Eddy-Simulation (LES) where the Navier-Stokes equations are filtered using a spatialoperator with a filter-width proportional to the local grid spacing. The later aspect im-plies a direct connection between the level of resolution of turbulence scales and themesh refinement, which can make the method very expensive for certain complexindustrial applications with wall-bounded flows. This is particularly true for the predic-tion of high Reynolds number boundary layers for which the resolution requirementsare prohibitively high. In an attempt to overcome the previously mentioned restriction,Spalart et al. [2] proposed a hybrid method which combines features of classicalRANS formulations with elements of LES methods. This concept, called DetachedEddy Simulation (DES), is intended to take advantage of both methods by coveringthe boundary layer by a RANS model and switching to a LES mode in detached re-gions. This allows the calculation to capture the instability of the shear layer and thedevelopment of the coherent structures in the wake, with more accurate prediction ofthe unsteady forces than can be obtained by steady or unsteady RANS methods.Although DES is a convenient way to apply turbulence-resolving models to industrial flows, this method is not without problems. As mentioned earlier, an important triggerparameter for the shift between the two modes is the local grid spacing. In certaincases this explicit grid dependency can lead to a premature flow separation. Menter et al. [3] developed an alternative approach, based on the Unsteady RANS (URANS)method, showing that these models are capable to predict the turbulent cascade upto the grid resolution limit without any grid dependency in the model. The resultingScale-Adaptive Simulation (SAS) model will also be used in the present study.In this work the ability of the previously mentioned turbulence models to simulate thetransient behavior of port-generated flows is investigated. The turbulent port flow in a1,6I VW FSIQ engine is considered for this purpose. The numerical results are com-pared with stereoscopic High-Speed PIV measurement data. Finally, a brief analysisof the velocity field within the domain is proposed. Fig. 1:((a) 3-D model used for the numerical analysis (b) cross-section of part of the numerical mesh (c) zoom in the valve clearance region showing the meshfor the low-Reynolds wall treatment 2. Simulation models The numerical configuration employed to obtain the results presented later is sche-matically represented in Fig.1, together with an example for the employed mesh. Af-ter a grid-independence study, a low-Reynolds number gridding of the boundary lay-ers has been finally generated with 17 prism lavers, as can be seen in Fiqure 1c. Ac-cording to the settings employed, the entire mesh consists of 30 million elements cor-responding to about 10 million control volumes for a node-based scheme. The tetra-hedral cell size in the core of the cylinder is about 0.6 mm, and 0.3 mm in the valveclearance. The maximum value of y*is then 1.5. The so-called high resolution scheme implemented in ANSYS-CFX is used through-out. This corresponds to an automatic numerical treatment of the advection terms,oscillating between a 2nd order scheme in locations where the gradient is rather low,to a 1st order scheme where variations are getting sharper, in order to maintain therobustness. 2.1 Detached-Eddy Simulation (DES) DES appeared in the late nineties, with the main objective to conciliate the advan-tages of LES in “detached”flow regions and the RANS formulation in the“attached”regions, i.e. for the eddies located in the boundary layer. Some important computa-tional cost savings were expected compared to the prohibitive application of pureLES to complete vehicle simulations or complex wall-bounded flows. DES belongs tothe category of seamless hybrid turbulence models, in opposition to the zonal meth-ods. Both categories are differentiating from each other by the transition betweenRANS and LES formulations and the treatment of the so-called grey area existing inthis particular region. The model used in this work is the one implemented in CFX 10from ANSYS, which is offering an improved formulation of the zonal treatment ofDES [4]. The former, original models from Spalart and Strelets were lacking amechanism for preventing the limiter to become active in the attached portion of theboundary layer, a phenomenon that could lead to an artificial, grid-induced flow sepa-ration. In order to reduce this problem, the present model is using the blending fac-tors employed by the zonal formulation of the Shear-Stress Transport (SST) model toshift between the k-w model in the wall vicinity to k-e away from it. This differentiationbetween the boundary layer and the free flow field can also be used here as blendingfunctions for the DES limiter.A second-order upwind-scheme for the RANS regionand a second-order central difference scheme for the LES region are used. This isnecessary to avoid excessive numerical diffusion in the LES regions. 2.22$Scale-Adaptive Simulation (SAS) The SAS turbulence model first appeared in 2003 [3]. The authors of this model havedemonstrated that a derivation of a URANS model, the SAS formulation, was able todetect the resolved structures in the flow and thereby to allow the evolution of a tur-bulent spectrum in unstable flow regions. The major problem of standard RANS models, their intrinsic high level of dissipation,only rests on the level of eddy viscosity provided by the turbulence model, which isoverestimated by the standard 2-equation formulations in unsteady conditions. Thus,the idea behind the SST k-w-based SAS model is to add a production term to the w-equation, which is sensitive to the resolved fluctuations. Basically, when the flow equations resolve the local turbulence, the length scalebased on the velocity gradients is much smaller than the one based on time-averaged quantities. For this reason it was proposed to use the von Karman lengthscale as scale-determining variable for the SAS model. Hence, the information pro-vided by the von Karman length scale allows the SAS model to dynamically adjustthe resolved structures in a URANS simulation, which results in a LES-like behaviorin unsteady regions of the flow field. At the same time, the model provides standardRANS capabilities in stable flow regions. The most important term around which theSAS model is built, makes the turbulence length scale largely proportional to the von Karman length-scale Lvk. For shear-flows, it reads finally: where S is the absolute value of the strain-rate and the von Karman constant is tak-en as Kvk=0.41. The von Karman length scale Lvk is considered as a natural scale since it adjusts tothe already resolved scales in a simulation and provides a scale, which is propor-tional to the size of the resolved eddies. Standard turbulence models, on the otherhand, always provide a length scale proportional to the thickness of the shear layer.They do not adjust to the local flow topology and are therefore overly diffusive. Theresulting SST-SAS model works in pure SST mode in the RANS region, activatingthe SAS formulation in the URANS region. Since this model is relatively recent, the literature relating to applications of SAS israther limited. First studies have shown that the application of the SAS model in com-plex geometries is less grid-sensitive than the DES formulation. This performance isprovided by the introduction of the von Karman length scale in the model, which is anappropriate quantity for detecting unsteadiness and trigger the resolution of turbu-lence, without any explicit dependency on the grid spacing. However, this last pointcould also represent a drawback in the sense that the SAS model cannot be forcedinto unsteadiness by grid refinement. It has been observed that, if the flow instabilityis not strong enough, the SAS model will simply remain in steady mode, whereas theDES model can beinfluenced by reducing the grid spacing and can thus be triggeredto produce unsteady solutions. Only very few applications of the SST-SAS model forInternal Combustion Engine can be found in the literature to date. 3. Experiments The experience gained during previous projects with a similar optical test-bench wassuggesting some modifications of its design in order to obtain high-quality High-Speed Particle-Image Velocimetry (HS-PIV) results. The main objective was to re-duce the energy loss through the material as well as the reflection and refraction oflight induced by the nature of the material and the curvature of the cylinder. The mostimportant improvement has been achieved thanks to the displacement of the cylinderoutside of the surrounding box (Fig.2), preventing the laser to go through a 10 mm-thick wall of Plexiglas. The cylinder thickness has been optimized over its full heightand, thanks to a hand-made treatment the wall was rubbed down to a thickness of 2mm. AA long intake extrusion (1500 mm, Fig.3) has been used to ensure the proper devel-op叩ment of a fully turbulent velocity profile at the intake port boundary and to avoidany influence of the seeding system. The intake flow sucked into the port was seededwith oil droplets (di-2-ethylhexyl-sebacate-DEHS, diameter~ 1-2 pm), producedby a Laskin-atomiser. The two intake valves were manually actuated and positionedat a constant valve-lift (from 3 mm to 9 mm) for each sequence of measurements,corresponding to a specific stationary flow-rate (from 50 kg/h to 150 kg/h) regulatedby the speed of the pump. Another parameter available for this study was the vari-able tumble flap located in front of the port. Thanks to the position of this deflector, itwas possible to control the level of turbulence induced by the intake system. Fig.2: optical set-up used in this study to investigate the1,6/ VW FS/Q injection port The HS-PIV measurements rely on a Laser Darwin-Duo from Quantronix (dual-cavity,diode-pumped, frequency-doubled Nd:YLF laser, 527 nm, 25 mJ @ 1 kHz per cavity)and on High-Speed Cameras Star 5 from LaVision (CMOS cameras with a resolutionof 512x512 pixels @ 10 kHz). By accurately setting the time delay between two con-secutive pulses, it is possible to double the overall pulse repetition rate in order toreach a frequency of 20 kHz, which means 10 kHz of effective correlated velocityfields. The post-processing has been realized by the program DaVis 7.2 from LaVi-sion. The evaluation of the image pairs was performed with a multi-pass method, thelast interrogation window being of the size of 32 x 32 pixels, with an overlap of 50%.Thanks to these settings, the distance separating two velocity vectors was finallyequal to 1.86 mm. Fig. 3: experimental setup for stereoscopic PIV and cross-section of the intake portexemplifying the condition with closed tumble flap (right) 4. Analysis and comparison Although both experimental and numerical methods implemented here are dedicatedto time-resolved analysis of unsteady flows, a first comparison of the averaged re-sults is still inevitable to control the overall quality of the different techniques. Figure 4displays the velocity vectors in the cylinder central plane shaded with the total veloc-ity magnitude obtained by High-Speed PIV with an acquisition rate of 10 kHz (thefrequency mentioned here refers to the post-processed information rate, i.e. half ofthe acquisition frequency), compared to the CFD results from RANS, DES and SASsimulations. At a first sight, considering the region measured by HS-PIV 10 kHz asthe comparison area, one can say that the global velocity range is relatively wellmatching between the simulations and the experimental results (an identical colourscale is employed). A clear swirling structure perpendicular to the cylinder axis, theso-called tumble shape typical for DISI engines, can also be observed in each case,except for the RANS results. Indeed, the converged RANS simulation presented hereis lacking the general flow pattern and is proving again that RANS is unable to repro-duce the complex phenomena associated with transient engine flows. Fig. 4: comparison of average velocity magnitude and vectors for configuration100C3 (mass-flow rate: 100 kg/h, 3 mm valve-lift, closed tumble flap) By looking more specifically at the large rotating structure visible in the centre (delim-ited by a dashed-line rectangle in Fig.4), it can be found that the DES simulation isproviding the best match with the experimentally observed tumble centre. Neverthe-less, the difference with the SAS model is relatively small. In order to quantitatively compare the experimental and numerical results, velocityprofiles were extracted along the z-axis in the centre of the large tumble structureobserved in the HS-PIV averaged results. The comparison of the profiles for the totalvelocity magnitude can be seen in Figure 5. Although the measured and the simu-lated results differ slightly due to an over-prediction of the velocity maxima, the gen-eral tendencies of the flow are well reproduced by both methods. However, as it isconfirmed by the representation of the absolute difference between numerical andexperimental results normalized with the respective average velocities, SAS resultsare showing a slightly better agreement with the experiments. This is confirmed by acomparison of the total pressure drop, predicted almost exactly (overestimated by0.4%) by SAS, while it is slightly underestimated (-1.5%) by DES. By comparison,standard RANS results are off by almost 5%. Fig. 5: comparison between measured (triangles) and calculated profiles (solid line:DES; dashed line: SAS) of the total velocity magnitude (top) and difference normal-ized with the average velocity (bottom) An example of instantaneous images obtained by HS-PIV is shown in Fig.6a. As visi-ble also in this figure, the signal quality is unfortunately far from being perfect, whichleads to major challenges for comparison with the simulation results, as documentedfurther in [5]. As a consequence, a systematic analysis of these experimental data Fig.6: (a) raw data measured by HS-PIV (b) SVD-reconstruction using 10 modes (c) SVD-reconstruction using 20 modes (d) SVD-reconstruction using 30 modes By combining the SVD analysis of the HS-PIV measurements and the unsteady re-sults obtained by both DES and SAS, the origin of the major turbulent structures ob-served in the cylinder can finally be identified in an unambiguous manner: Vortex shedding induced by the valve stem; Ring-shaped jet leaving the valve gap, associated with a shear layerinstability,which is particularly strong for a closed tumble flap; Flow fluctuations directly induced by the presence of the tumble flap in the in-take port. These three flow instabilities, observed both in the measurements and in the simula-tions, are sufficient to explain all the major flow features and their dynamics, if anymodification in time of the inflow boundary conditions for the system (before the ex-trusion, see Fig.3) are carefully avoided. 5. Conclusions By combining High-Speed Particle Image Velocimetry measurements with high-quality, transient flow computations relying on Detached Eddy Simulation or Scale-Adaptive Simulation, the origin of the turbulent flow fluctuations generated by the cyl-inder-head of a production four-valve gasoline engine in a configuration with fixedvalve positions can be explained in a quantitative manner. Three major flow instabili-ties (induced by valve stem, valve lift and tumble flap) are present in the system andcontrol its dynamics. The DES and SAS simulations appear to be both able to repro-duce the major features observed in the transient flow. For some properties, the ac-curacy of SAS is better, but this is not systematic and DES appears to be superior forother flow parameters. Since the level of accuracy of the HS-PIV measurements isstill limited, it is impossible at this stage to decide if DES or SAS is really more ap-propriate for such a confiquration. Both appear to be acceptable, but SAS leads tonoticeably faster computations due a lower grid-dependency allowing for a somewhatreduced spatial resolution. SAS will therefore be preferred in the next steps of thisstudy. Increasing the quality of the HS-PIV measurements appears to be the mostimportant condition in order to get an even better understanding of the unsteady flowin the cylinder. Literature ( [1] Hentschel W., B . B l ock, T . Hovestadt, H . Meyer, G. Ohmstede, V. R i chter, B.Stiebels, A. Winkler, "Optical Diagnostics and CFD-Simulations to Su p port theCombustion P rocess D evelopment o f the Volkswagen FSI Di r ect-InjectionGasoline Engine”, SAE 2001-01-3648, 2001. ) ( [21 Spalart P.R., W.H. Jou, M. Strelets, S .R. A llmaras.“ C omments on the feasibilityof LES f or Wings and on a l Hybrid RANS/LES Approach”, A dvances in DNS/LES, Proc. 1 st AFOSR International Conference on DNS/LES, Louisiana T ech. U niversity, 1997. ) ( [3] Menter F .R., M. K untz, R. B ender, “A Scale-Adaptive S imulation Model forTurbulent F low Predictions", AIAA p aper 2003-0767, 41st Aerospace Sci e nceMeeting & Exhibit, Reno, Nevada, USA, 2003 ) ( [4] Menter, F .R. , M. K u ntz, “ D evelopment and app l ication of a zonal DES turb u -lence model for CFX-5”, Ansys CFX Validation Report, p p.3-7, 2 003. ) [5] Imberdis, O., M. Hartmann, H. Bensler, L. Kapitza, D. Thevenin.“A numericaland experimental investigation of a DISI-engine intake port generated turbulentflow", J. Engines 116, pp. 1373-1387,2007. [61 Kapitza, L.,O. Imberdis, H. Bensler, J. Willand, D. Thevenin.“Rekonstruktionund Visualisierung der instationaren, einlasskanalgenerierten Zylinderin-nenstromung an einem Volkswagen 1.6L FSI Zylinderkopf", Tagung Simulationand Visualization (SimVis) 2008,Magdeburg, Germany, pp. 1-12, 2008. The numerical simulation of the turbulent flow induced by the intake port of a moderndirect injection gasoline engine requires the application of advanced turbulence modelstaking into account the unsteady nature of the flow. The validation of such modelsnecessitates the availability of high-quality, unsteady experimental data. The presentpaper describes a comparative analysis between such numerical simulations relyingeither on Detached Eddy Simulation (DES) or Scale-Adaptive Simulation (SAS), andexperimental data obtained by High-Speed Particle Image Velocimetry (HS-PIV). Theflow field generated by the cylinder-head of a production four-valve gasoline enginein a configuration with fixed valve positions has been considered. With an acquisitionfrequency of 20 kHz and a mesh size of about 30 million cells, a particularly goodresolution of the turbulent structures was achieved both in the experiment and thesimulation. Post-processing issues become very important for such conditions andwill be also briefly considered.
确定
还剩8页未读,是否继续阅读?

产品配置单


北京欧兰科技发展有限公司为您提供《直接喷射火花塞引燃(DISI)引擎进气道中流动不稳定性检测方案(粒子图像测速)》,该方案主要用于汽车电子电器中理化分析检测,参考标准--,《直接喷射火花塞引燃(DISI)引擎进气道中流动不稳定性检测方案(粒子图像测速)》用到的仪器有德国LaVision PIV/PLIF粒子成像测速场仪、PLIF平面激光诱导荧光火焰燃烧检测系统、汽车发动机多参量测试系统、LaVision SprayMaster 喷雾成像测量系统
推荐专场


汽车尾气分析仪
更多


相关方案
更多
该厂商其他方案
更多