


方案详情
文
发动机的效率和排放取决于燃料的雾化和分散情况。燃料的雾化和分散情况严重依赖于环境压力和温度。在这项工作中,为了研究发动机条件下的柴油喷雾,设计并制造了一个带有电加热、恒容、加压容器。控制电子学和软件被开发和测试,以确保安全和精确操作。使用了商用的博世六孔汽车柴油喷油器。喷雾的空间和时间发展情况进行了研究。在文献中,液体长度和锥形角度被广泛用于量化燃料分散情况。在这项工作中,使用高速暗场技术量化这些参数。建立了模型来描述液体核心的时间演变。这样的模型可以用来预测柴油喷雾行为和发动机性能。
方案详情

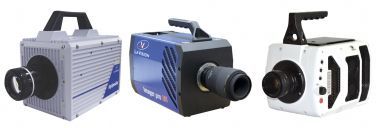
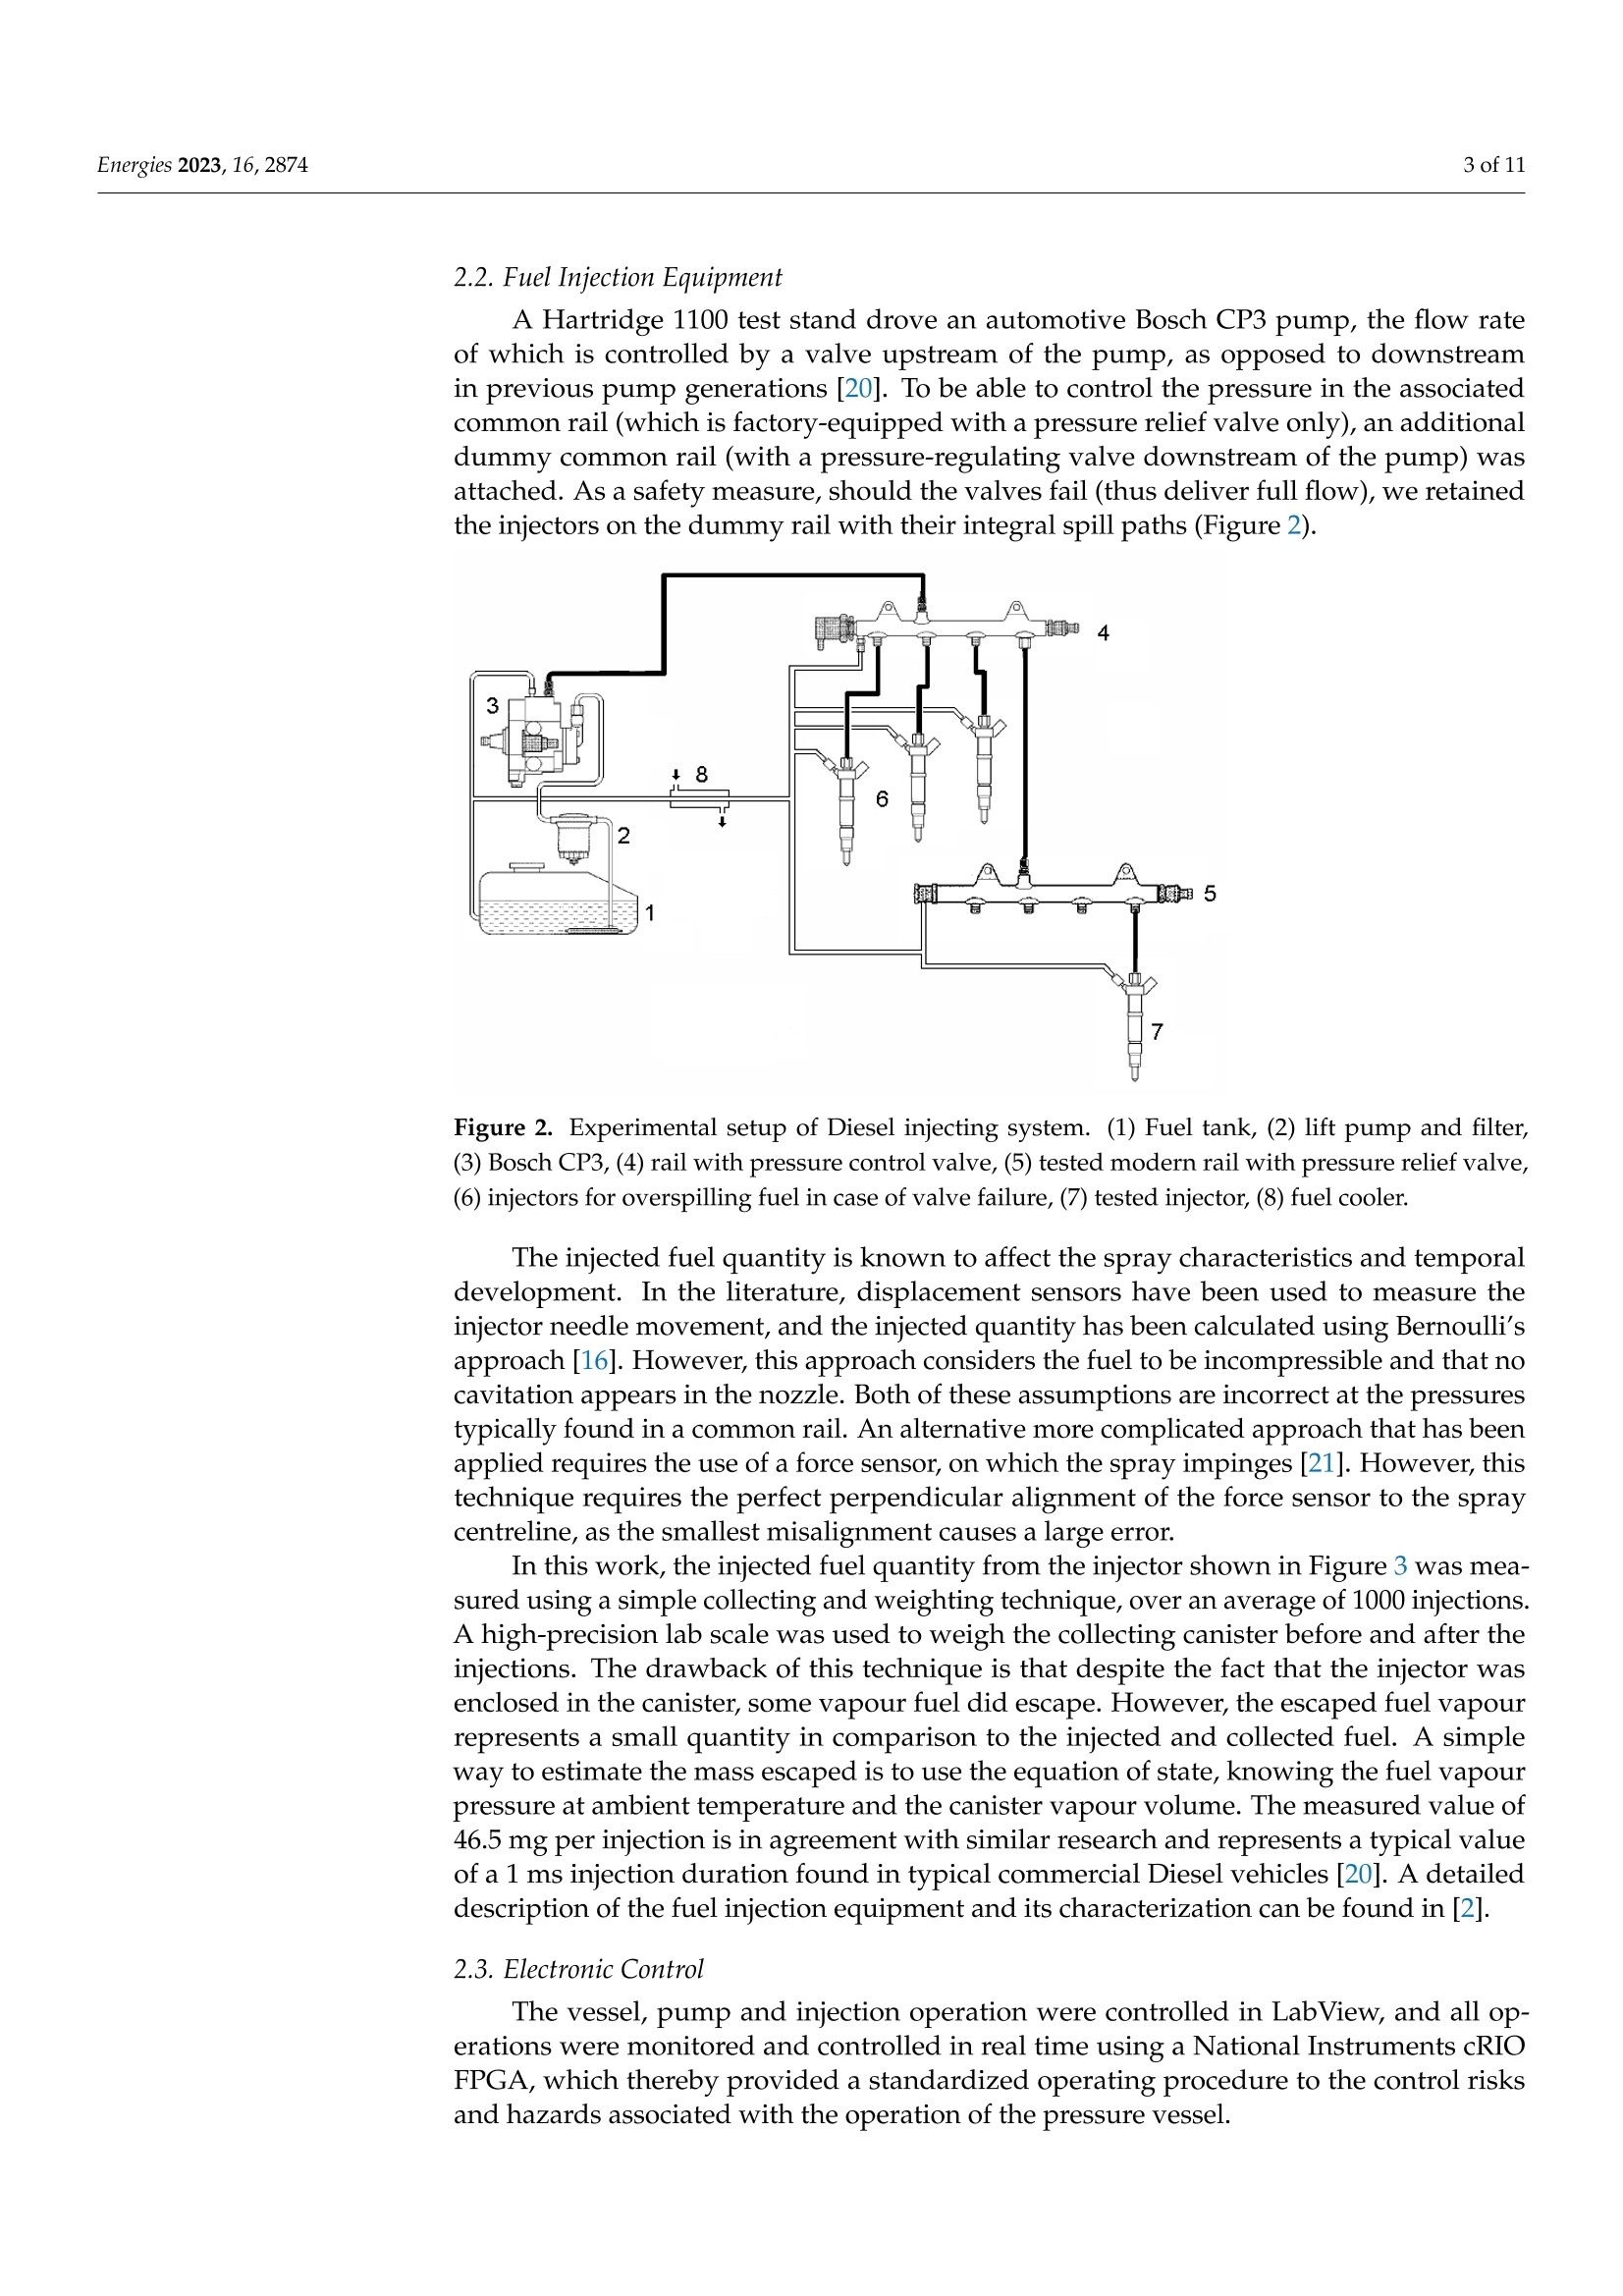
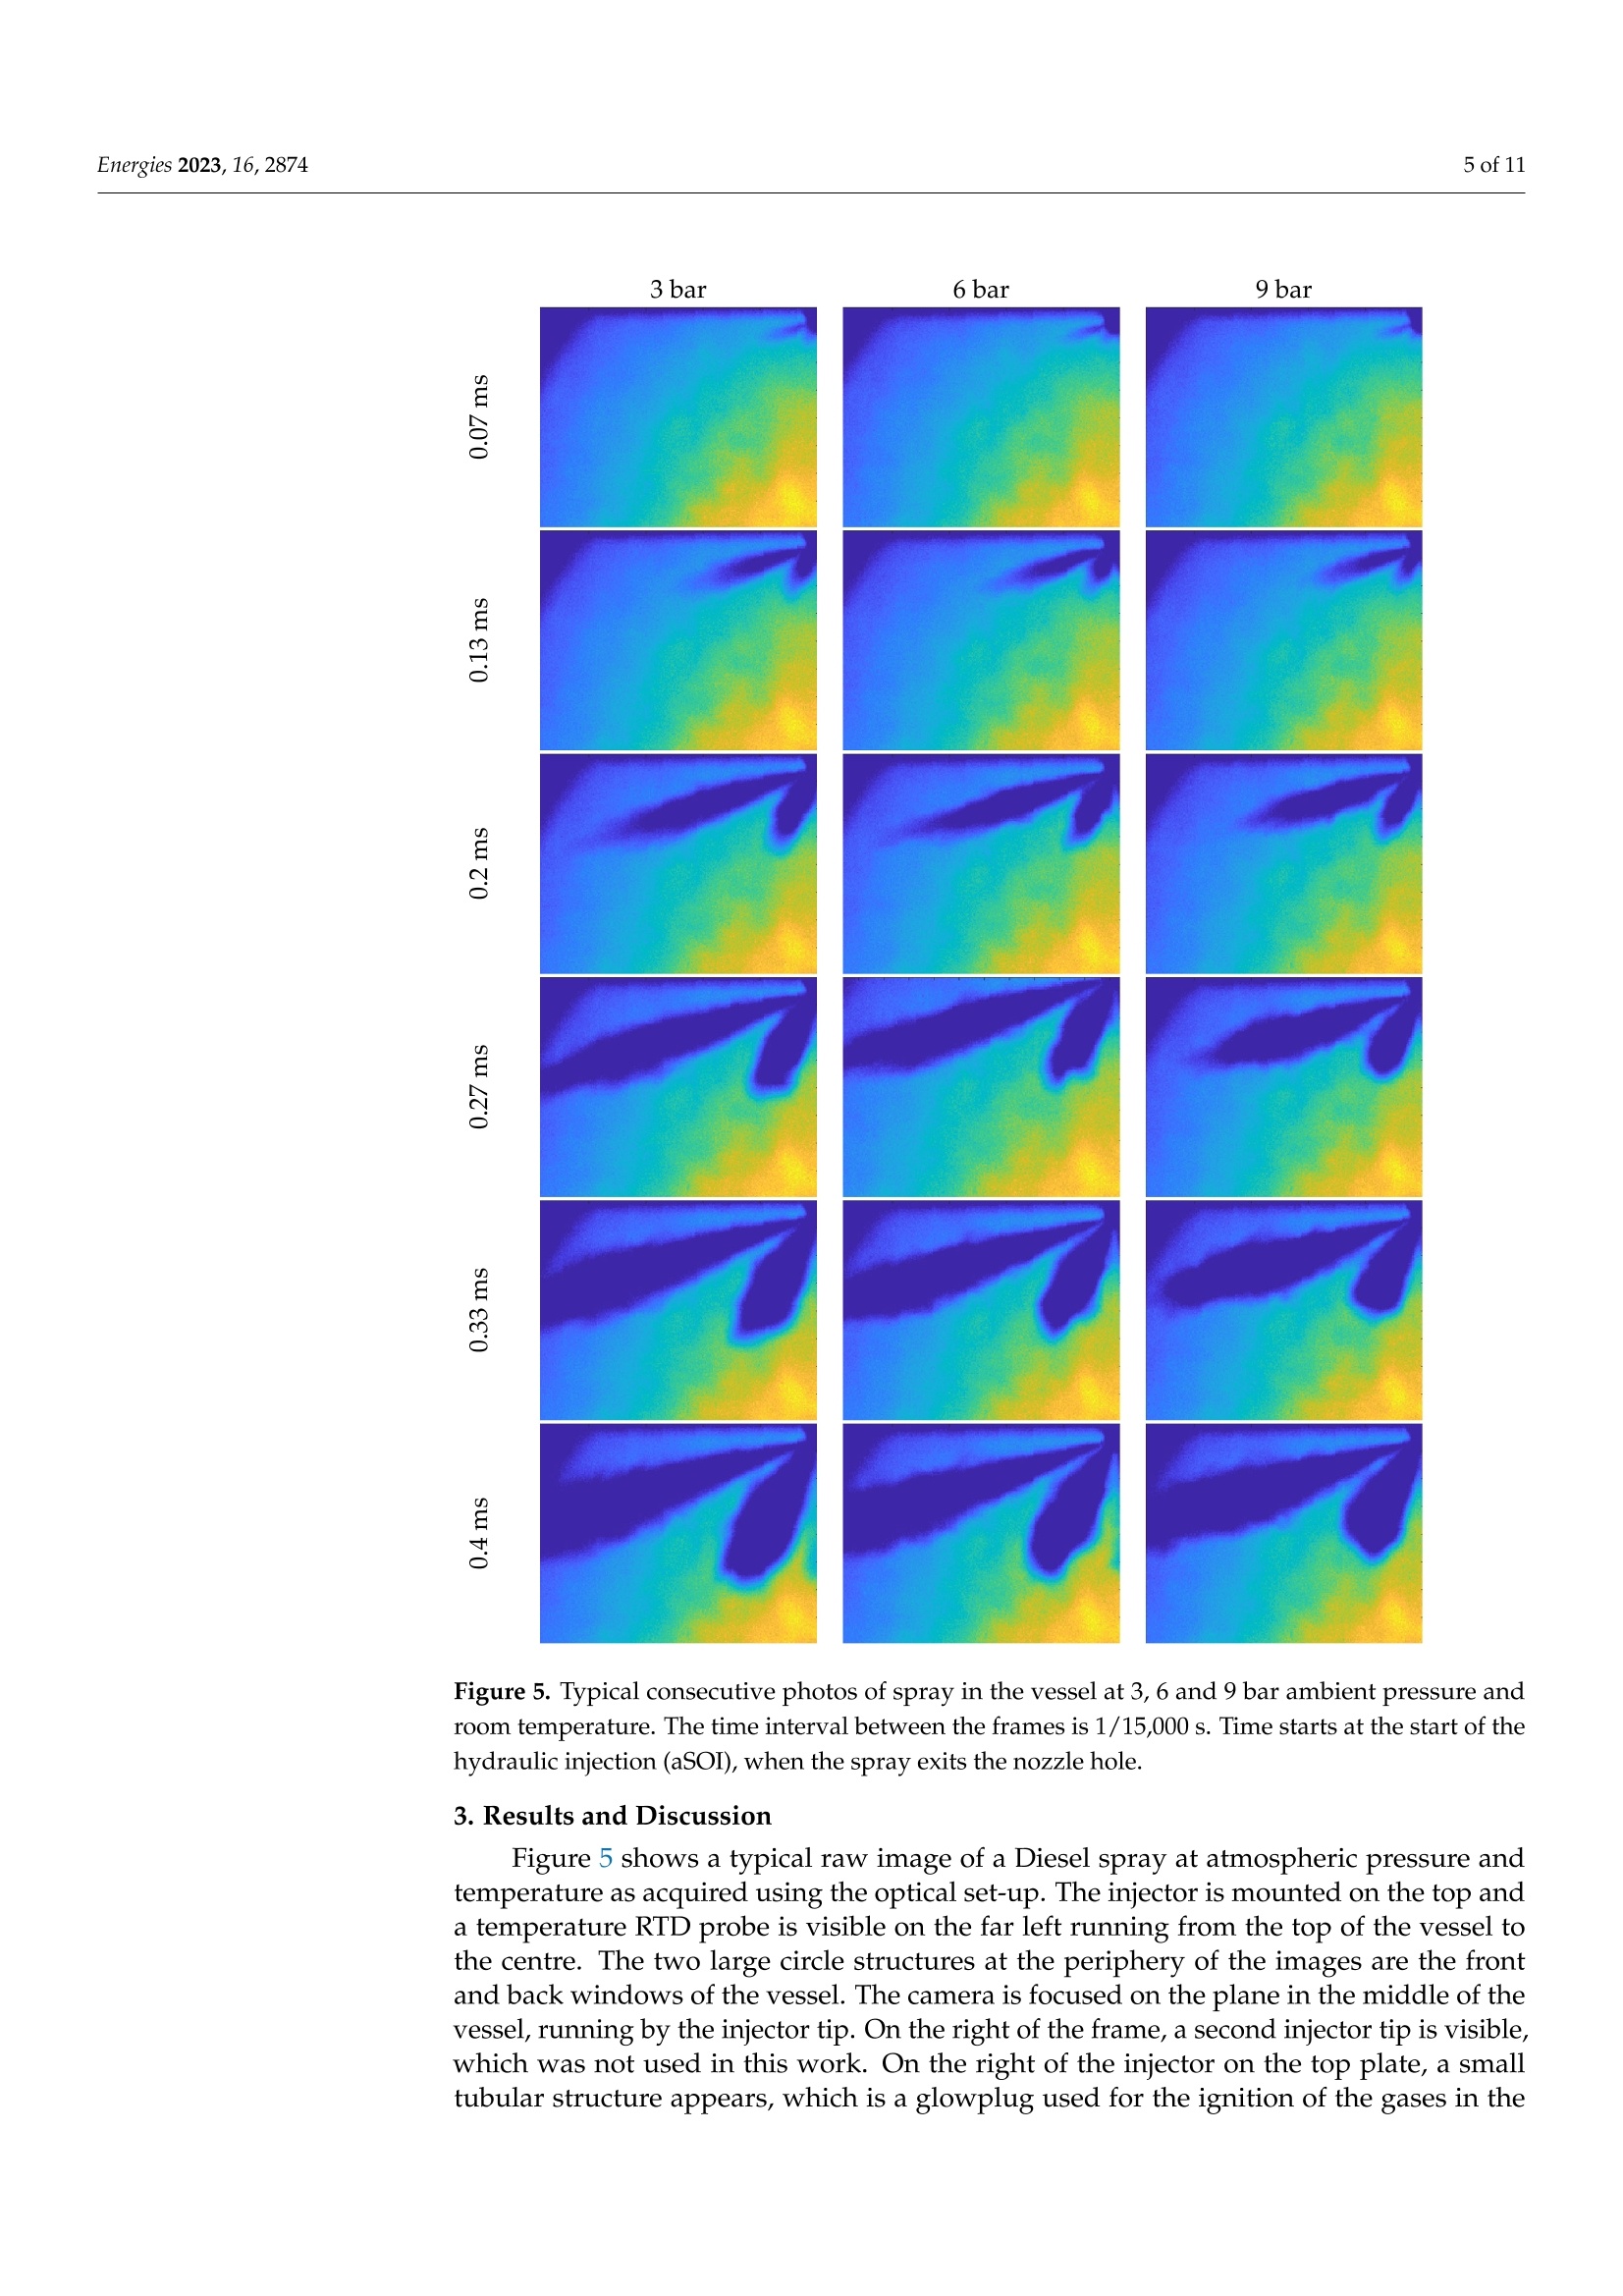
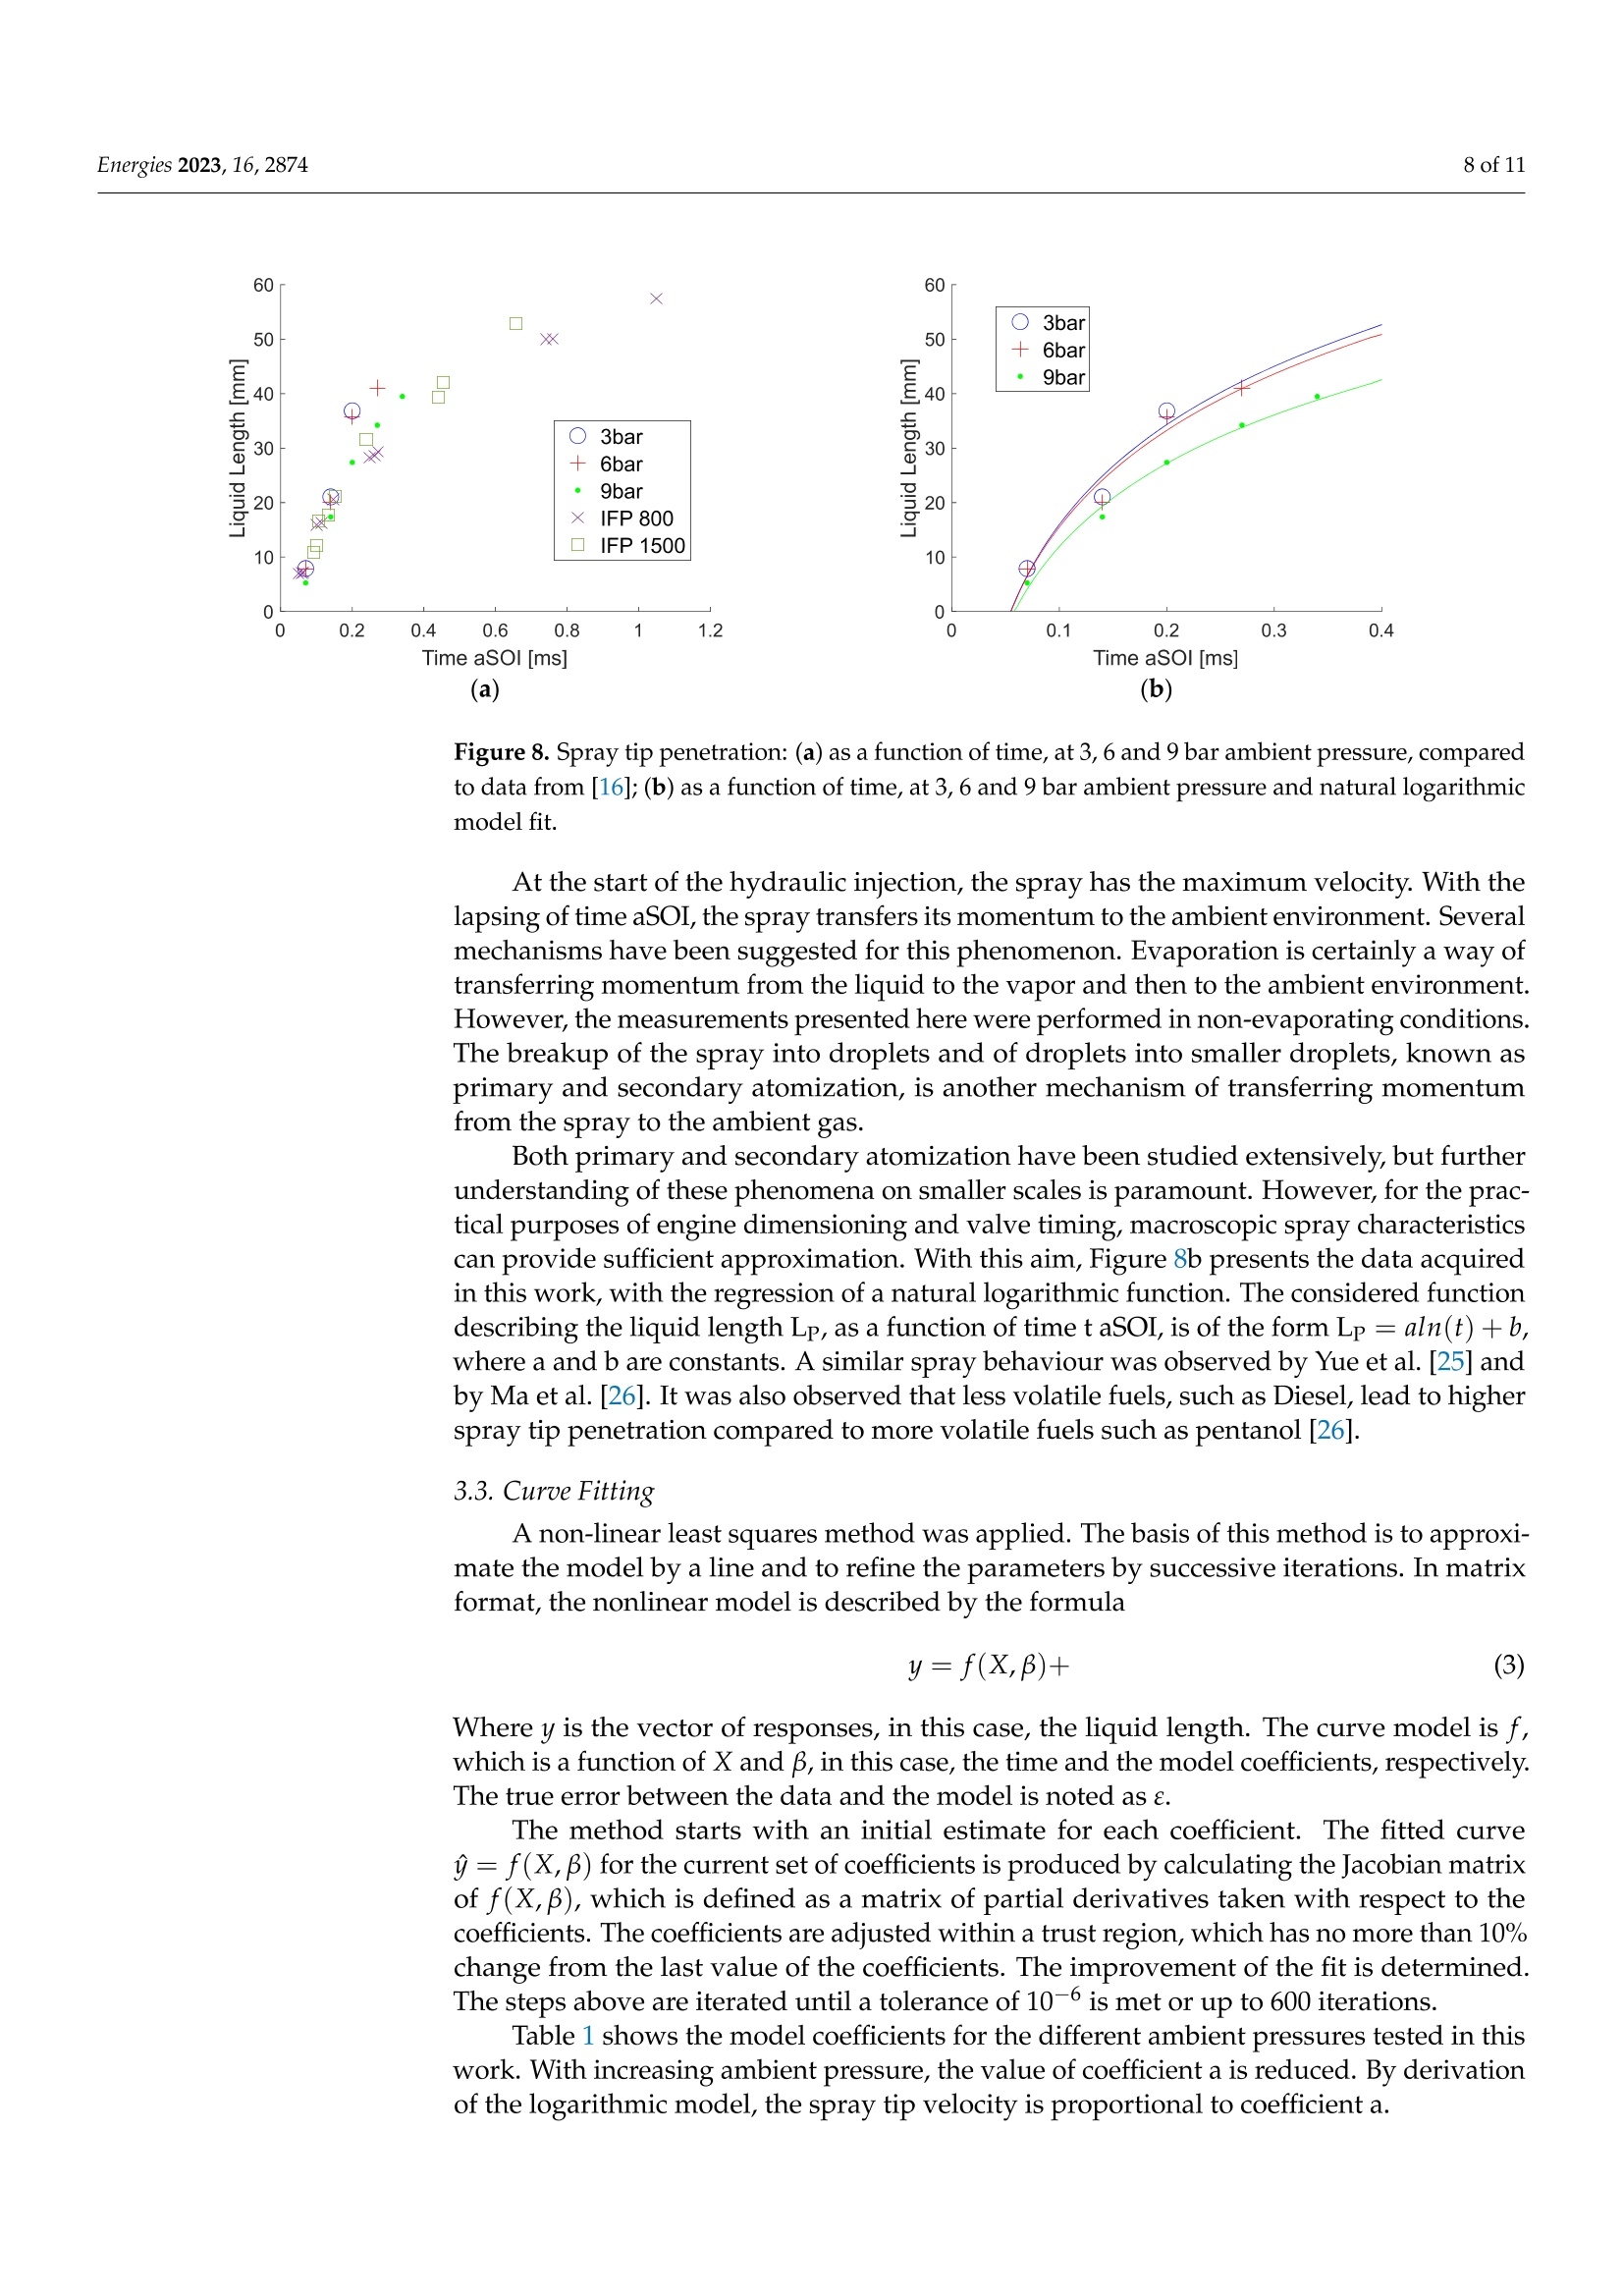
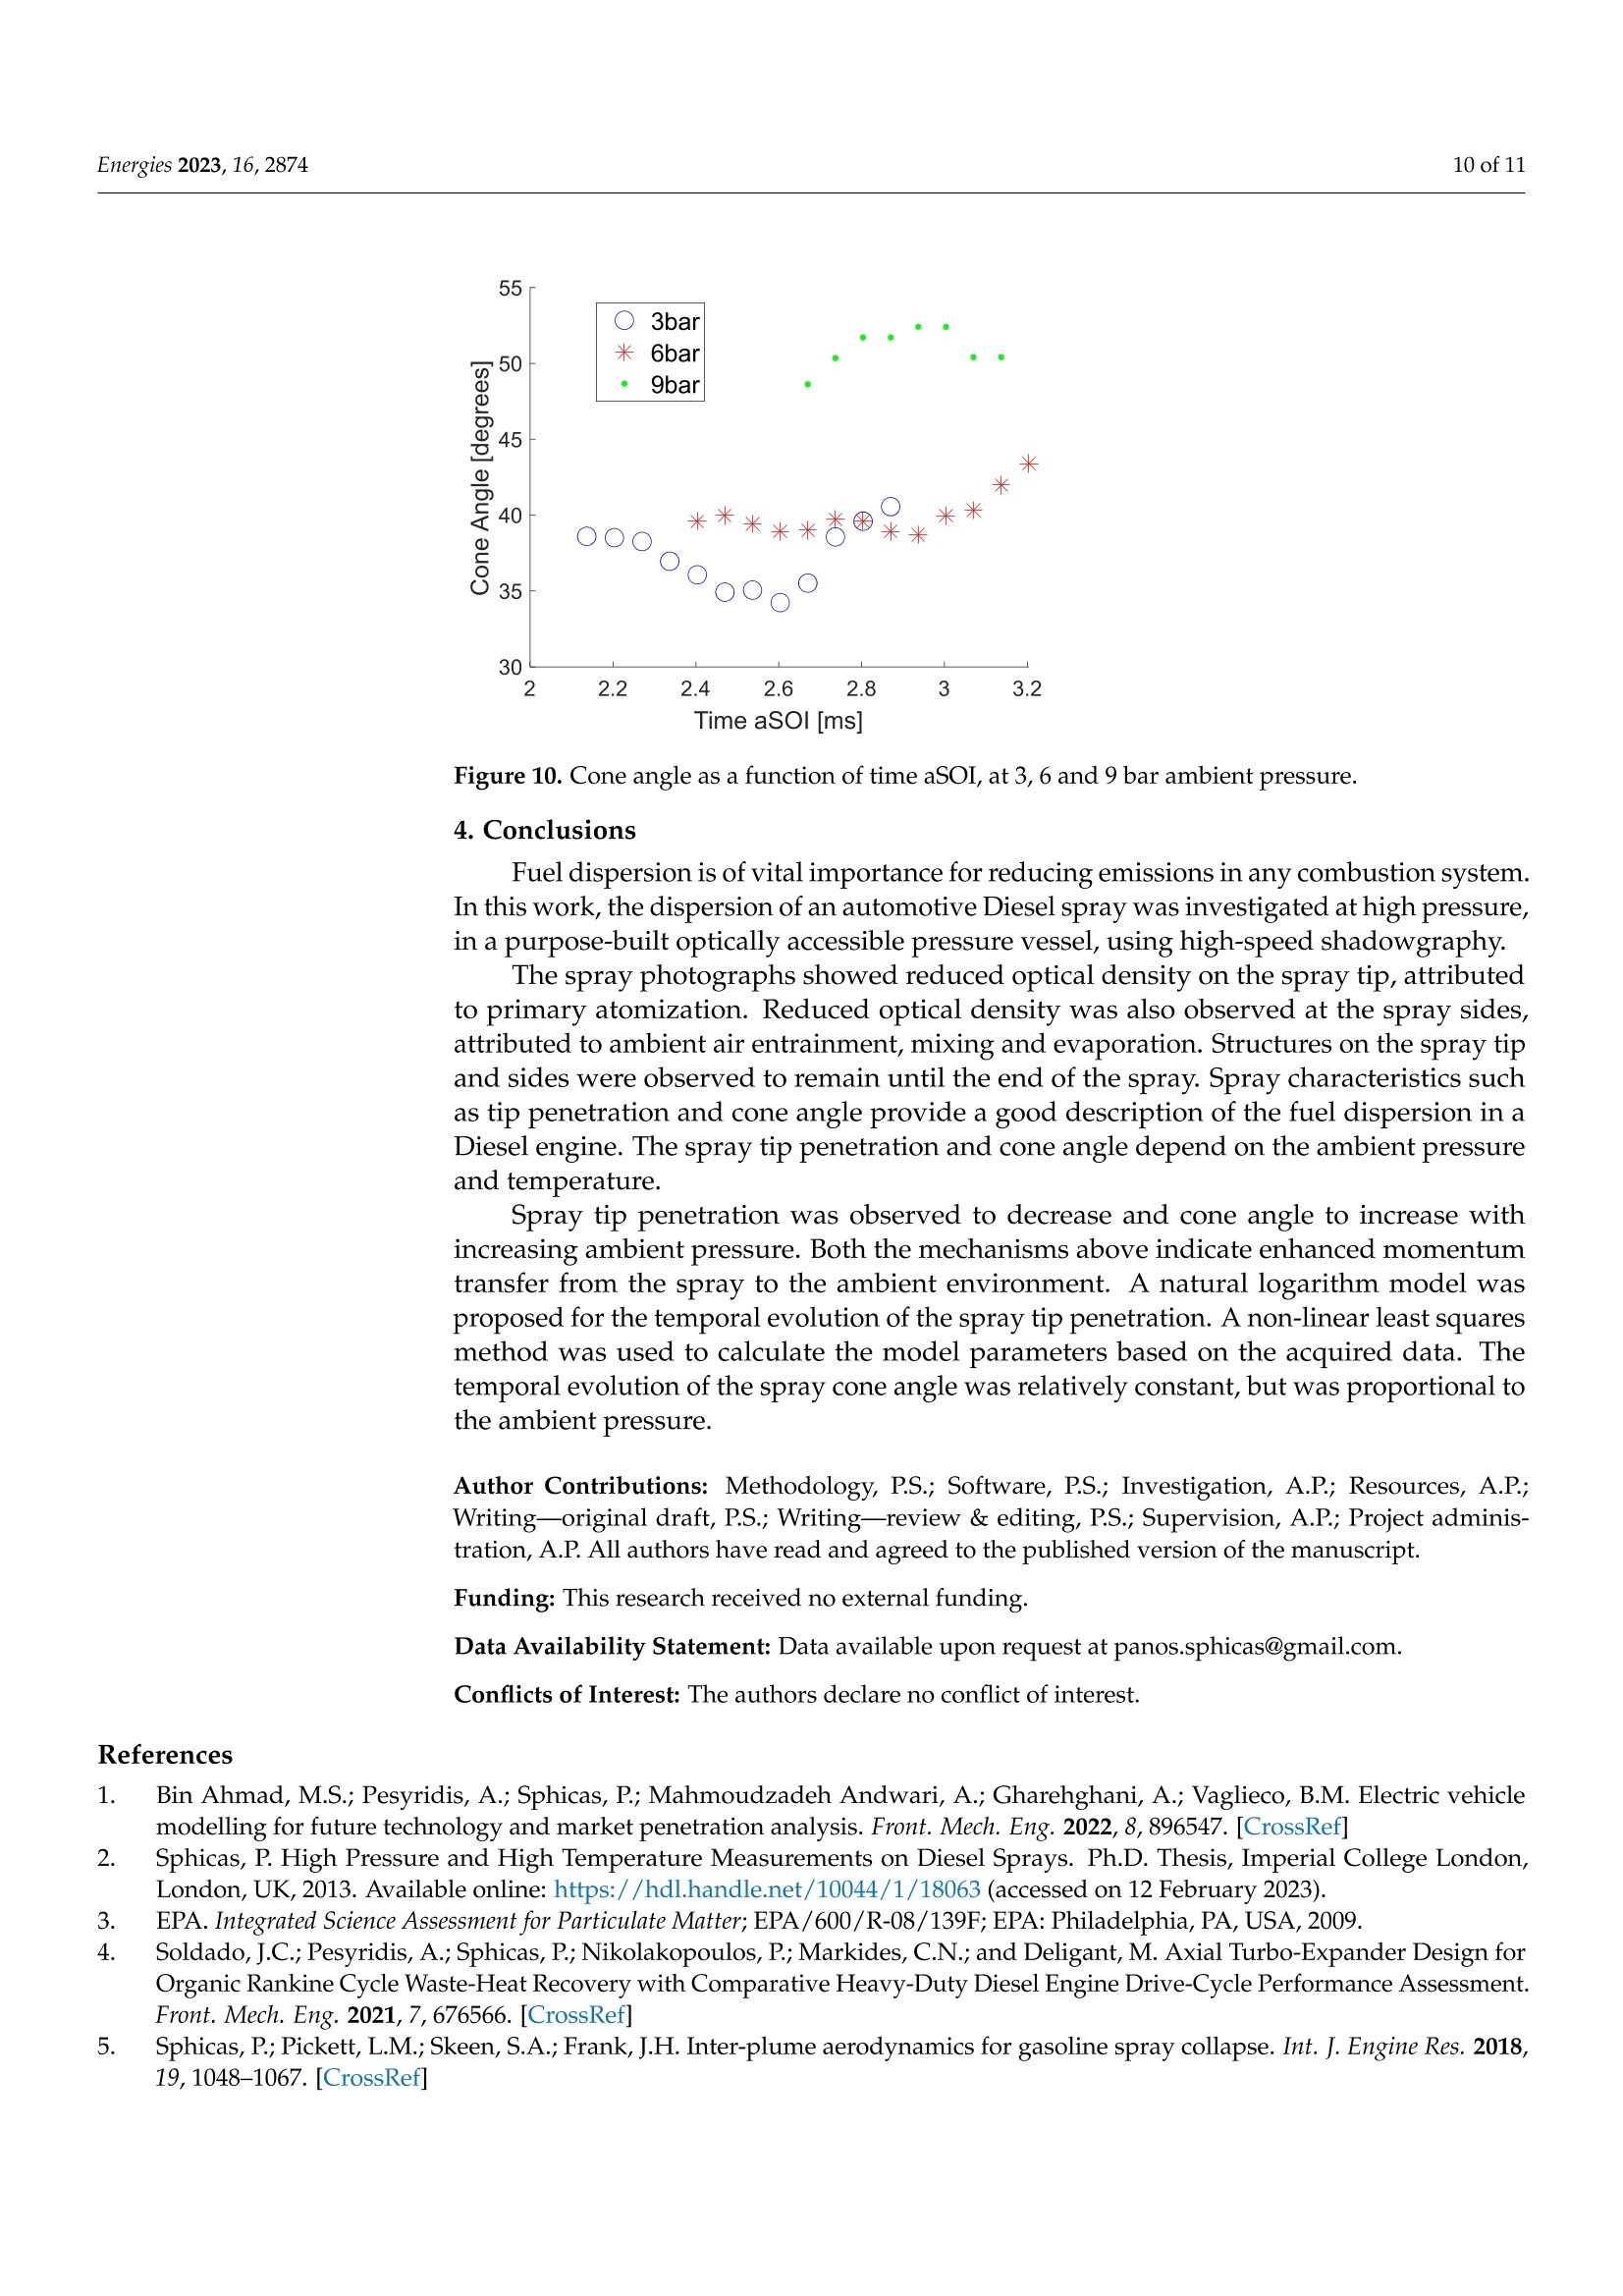
当前汽车动力总成技术正朝着车队电气化的方向发展[1]。然而,车队电气化面临许多挑战。此外,重型车辆和现有车辆的电气化几乎是不可能的。目前,在美国,所有车型中约有1300万台柴油发动机。这些发动机排放的物质是21000人过早死亡的原因。柴油发动机中最危险的排放物是颗粒物(PM),它单独导致每年15000人的死亡,并且具有高度致癌性[2,3]。尾气后处理和余热回收系统可以减少车辆排放[4],但不能消除它们。在典型的现代柴油发动机中,燃料直接注入汽缸。众所周知,燃料蒸发和与空气的混合越好,颗粒物排放越低[1]。对于具有多个喷孔的喷雾,测量[5]和模拟[6]表明,喷雾在中心线上创建了一个低压区域,这会降低燃料的分散效果。在极端情况下,尤其是注射持续时间较长的情况下,喷雾中心线上的低压甚至可能导致整个喷雾坍塌成为一个单一实体[7]。在喷雾中增加喷孔的数量会增强低压区域[8]。柴油燃料的喷雾穿透深度和锥角是燃料分散的相关参数。喷雾结构主要受注射压力和时间的影响,影响燃料的蒸发和与周围气体的混合[9,10]。然而,喷雾中的蒸发和混合现象也严重依赖于周围的压力和温度。因此,在柴油发动机注入时通常发现的值附近研究这些现象非常重要。Regenerate responseenergies 2 of 11Energies 2023, 16,2874 Article Diesel Spray Liquid Length Imaging at High Pressure Panos Sphicas l and Apostolos Pesyridis 2.3.*0D 1 Department of Mechanica l Engineering, School of Engineering, University of Birmingham, Dubai Internat i ona l Academic City, Dubai P.O. Box 341799, United Arab Emi r ates; p.sphicas@bham.ac .uk 2 Department of Mechanical and Aerospace Engineer i ng, College of Engineering, Design and Physical Sciences,Brunel University London, Uxbridge UB8 3PH, UK 3 College of Engineering, Alasala University, Dammam 32324, Saudi Arabia Correspondence: a.pesyridis@brunel.ac.uk Abstract: Engine efficiency and emissions depend on the fuel atomization and dispersion. The f uel atomization and dispersion depend heavi l y on the ambient pressure and temperature. In this work,to study Diesel sprays in engine conditions, an electrically heated, constant-volume, pressurized vessel was designed and manufactured. The controlling electronics and software were developed and tested to ensure safe and precise operation. A commercial Bosch six-hole automotive Diesel injector was used. The spray spatial and temporal development were studied. I n the l iterature, spray liquid l ength and cone angle are extensively used to quantify fuel dispersion. In this wor k , these parameters were quanti f ied using a high-speed shadowgraph technique. Models were derived to describe the temporal evolution of the liquid core. Such models can be used t o predict the Diesel spray behaviour and t he engine performance. Keywords: Diesel spray; shadowgraph; l iquid core 1. Introduction Citation: Sphicas, P; Pesy r idis,A. en16062874 Academic Editors: Georgios Current automotive powertrain technology is moving towards the elec t rification of the f leet [1]. However , electrification of the vehicle fleet has many challenges. Moreover,electrif i cation of heavy-duty vehicles and existing vehicles i s almost impossible. Currently,in the US, there are approximately 13 million Diesel engines in all vehicle types. Emissions from these engines are responsible for the premature death of 21,000 people. The most dangerous emission from a Diesel engine is particulate matter (PM), which is solely respon-sible for the death of 15,000 people annually and is highly carcinogenic [2,3]. Exhaust gas aftertreatment and waste heat recovery systems can reduce the vehicle emissions [4] but not eliminate them. Mavropoulos, E.C. Andritsaki s and Roussos G. Papagiannakis Received: 13 February 2023 Revised: 9 March 2023Accepted: 16 March 2023Published: 20 March 2023 In a typical modern Diesel engine, fuel i s i njected directly i nto t he cylinder. I t is known that the better t he fuel evaporation and dispersion wi t h air, the l ower t he particulate emissions [1]. For sprays with many plumes, measurements [5] and simulations [6] have shown that the plumes create a low-pressure r egion in the centreline of the spray, which deteriorates fuel dispersion. In extreme cases, particularly with long injection duration,the low pressure i n the centreline of the spray may even lead to the complete col l apse of the spray in a single entity [7]. Increased number of plumes i n a spray enhances the low-pressure region [8]. Copyright: o 2023 by the authors.Licensee MDPI, Basel, Switzerland.This article is an open access ar t icle distributed under the terms and conditions of the Creat i ve Commons At tri bution (CC BY) l i cense (https://creativecommons.org/licenses/by/4.0/) The Diesel fuel spray penetration and cone angle are relevant parameters i n fuel dispersion. The spray s t ructure, primarily i nfluenced by the i njection pressure and duration,affects the evaporation of the fuel and the mixing of the vapour with t he surrounding gases [9,10]. However, evaporation and mixing phenomena in a spray are also heavily dependent on t he pressure and temperature of t he surroundings. Therefore, i t i s i mportant to study these phenomena at values typically found near t he injection t iming of a Diesel engine. Back-illumination techniques take advantage of t he di f ference in t he t ransmittance be-tween t he ambient air and injected fuel . The liquid phase of the spray is, therefore, visualised using back-illumination [2]. A shadowgraph technique was used by Tsujimura et al. [13]to study hydrogen sprays, Hwang et al. [14] to study DME (dimethyl ether) sprays, He-lin et al. [15] to study LPG (liquefied petroleum gas) sprays and Verhoeven et al . [16] to study n-dodecane sprays. I n the l iterature, several researchers applied optical techniques to visualize Diesel sprays. Baert et al. [17] studied t he Diesel spray from eight-hole injectors, Bae et al . [18] f rom a ten-hole injector and Kunkulagunta et al. [19] from a f ive-hole injector. There is limited work published on the six-hole injector, which is the most widely used i n small automotive Diesel engines. This work combines back-illumination with high-speed cinematography to provide quanti t ative results on the t empora l development and evaporation of the spray of a six-hole Diesel i njector. Additionally, Diesel sprays visualized in optical engines are restricted by the moving piston and valves. For this work, a pressurised vessel was designed and manufactured and was electronically operated and controlled so as to create engine-like conditions. I n this way, optical access is better than i n optical Diesel engines or endoscope measurements i n full meta l engines. 2. Experimental Setup and Image Processing 2.1. Optically Accessible Vessel A constant-volume vessel (Figure 1) was designed and manufactured to allow the study of Diesel sprays in a high-temperature and -pressure nitrogen environment. The gas condi t ions up to a maximum pressure of 40 bar and 500 K are achieved using a high-pressure regulator and four electrical cartridge heaters of 500 W each. The vessel is made of stainless steel 316L and has three quartz windows of 125 mm diameter and 83 mm thickness. A magnetically coupled stirrer is used to mix the gases in the vessel, thereby avoiding breaching the pressure vessel by a shaft. Bronkhorst mass flow controllers (MFC)control the amount of ni t rogen entering t he vessel. A detailed description of the vessel design and characterization can be found in [2]. Figure 1. Schematic of constant-volume vessel. 2.2. Fuel Injection Equipment A Hartridge 1100 test stand drove an automotive Bosch CP3 pump, the f low rate of which is controlled by a valve upstream of the pump, as opposed to downstream in previous pump generations [20]. To be able to control the pressure i n the associated common rail (which is factory-equipped with a pressure relief valve only), an additional dummy common rail (with a pressure-regulating valve downstream of the pump) was attached. As a safety measure, should the valves fail (thus deliver full f low), we retained the injectors on the dummy rail with their integral spill paths (Figure 2). 7 Figure 2. Experimental setup of Diesel i njecting system. (1) Fuel t ank, (2) lift pump and fil t er,(3) Bosch CP3, (4) rail with pressure control valve, (5) tested modern r ail with pressure r elief valve,(6) i njectors for overspilling f uel i n case of valve failure, (7) t ested injector, (8) f uel cooler. The injected fuel quantity i s known to affect the spray characteristics and temporal development. In the l iterature, displacement sensors have been used t o measure the injector needle movement, and the injec t ed quantity has been calculated using Bernoulli’s approach [16]. However, this approach considers the f uel to be incompressible and that no cavitation appears in the nozzle. Both of these assumptions are incorrect at the pressures typically found i n a common rail. An alternative more complicated approach that has been applied requires the use of a force sensor, on which the spray impinges [21]. However, this technique requires the perfec t perpendicular alignment of the force sensor to the spray centreline, as the smallest misalignment causes a l arge error. In this work, the injected fuel quantity from the injector shown in Figure 3 was mea-sured using a simple collecting and weighting technique, over an average of 1000 i njections.A high-precision lab scale was used to weigh the collecting canister before and after the injections. The drawback of this technique i s that despite the fact t hat the injector was enclosed in the canister, some vapour fuel did escape. However, the escaped fuel vapour represents a small quantity in comparison to the injected and collected fuel. A simple way to estimate the mass escaped i s to use the equation of state, knowing the fuel vapour pressure at ambient temperature and the canister vapour volume. The measured value of 46.5 mg per injection is in agreement with simi l ar research and represents a typical value of a 1 ms injection duration found in typical commercial Diesel vehicles [20]. A detailed description of the fuel injection equipment and its characterization can be found i n [2]. 2.3. Electronic Control The vessel, pump and injection operation were controlled in LabView, and all op-erations were monitored and controlled in real t ime using a National Instruments cRIO FPGA, which thereby provided a standardized operat i ng procedure t o the control risks and hazards associated wi t h the operation of the pressure vessel. Fuel i nl e t Figure 3. Bosch common rail fuel i njector, Bosch (2005) Timing uncertainties are of the order of 5 ns, which is negligible i n t he i njection timescale (0.3 ms). The pressure drop i n the common rail during injection is compensated for by the FPGA controller. Additionally, the volume of the first and second common rail and the connecting l ines is several times larger than the injected quantity, so t he pressure drop in t he common rail during injection can be considered negligible. A detailed description of the control hardware and software and its characterization can be found in [2]. 2.4. Optics As the spray i njec t ion lasts for a very short t ime, of the order of 1 ms, to obtain good temporal resolution of the injection, a high-speed camera must be used. In this work, a high-speed camera (LaVision HighSpeedStar 6) was used to capture i mages of the spray.The acquisi t ion speed was set to 15,000 frames per second. However, as there is a trade-off between tempora l and spatial resolution, the resolution was set to 512 by 512 pixels, which was considered sufficient to capture clear i mages of the sprays using a f= 150 mm lens,where f is the focal length. The spatial resolution was 0.14 mm per pixel. The camera was triggered by the cRIO, and acquisition paused at the end of every spray, allowing for the vessel’s nitrogen atmosphere to be purged and reheated. When t he 16 GB camera memory was f ull, the i mages were copied to the computer’s hard drive and the process continued. The spray was back-illuminated using a standard 12 V 45 W automotive light bulb,and a paper diffuser was used to even out luminosity. The homogeneity of the l ight source after the diffuser was optically checked in the captured images as shown in Figure 4a . A typical image acquired with ful l resolution is presented i n Figure 4b. Some consecutive instantaneous sample raw images appear in Figure 5, and the t ime interva l between them is 1/15,000 s. A detailed description of the optical diagnostic and testing can be found in [2]. (a) (b) Figure 4. (a) Schematic of optical setup used i n t his work to back-illuminate the Diesel spray;(b) typical photo of a Diesel spray in the vessel Figure 5. Typica l consecutive photos of spray in the vessel at 3, 6 and 9 bar ambient pressure and room temperature. The time interval between the frames is 1/15,000 s. Time starts at the start of the hydraulic injection (aSOI), when the spray exits the nozzle hole. 3. Results and Discussion Figure 5 shows a typical raw image of a Diesel spray at atmospheric pressure and temperature as acquired using the optical set-up. The i njector i s mounted on the t op and a temperature RTD probe is visible on the far left running from the top of the vessel to the centre. The two large circle structures a t the periphery of t he images are the front and back windows of t he vessel. The camera i s focused on t he plane in t he middle of t he vessel , running by the injector tip. On t he right of the frame, a second i njector t ip is visible,which was not used i n this work. On t he right of the i njec t or on the top plate, a small tubular structure appears, which is a glowplug used for the ignition of the gases in the vesse l to build up the temperature in the vessel . The scope of this paper is t he study of non-evaporating sprays, so all results presented are in room temperature. On the image of the spray in Figure 5, four plumes appear but the injector has six holes.The two plumes appearing in the middle are hiding two more plumes in the background.The plumes on the far l ef t and t he far right of the spray are single plumes along the l ine of sight. A detailed schematic of the injector orientation and the resulting spray plume orientations is given i n [22]. Figure 5 presents the temporal evolution of three Diesel spray events at different ambient pressures. The three columns of frames, from left to right, represent ambient pressure of 3, 6 and 9 bar, respectively. The order of t he i mages from top to bottom represents the temporal evolution of the spray events. The time interval between the frames is 1/15,000 s as the acquisition rate was 15,000 fps. The spray exits the nozzle hole at 0.17 ms ±5 ns after the electronic signal for the start of injection. This time delay between the signal and the actual hydraulic start of i njection is the hydraulic delay. To remove the effect of t he injector hydraulic delay from the presented data, al l results are presented in t ime after the start of the hydraulic injection (aSOI). The centreline of every spray is more optically dense than t he periphery. This i s due to more l iquid fuel mass in the centreline of the spray. Addi t ionally, the centre of the spray has experienced less primary and secondary atomization, l ess air entrainment, l ess mixing with the surrounding air and l ess evaporation. The combined resulting effects of t hese phenomena are captured in t he photos as spray regions of less optical density compared t o the centreline of t he spray. The spray t ip and the spray sides are l ighter blue i n colour. The sides of the spray, along the centreline, experience air entrainment, mixing and evaporation,while the tip of the spray experiences primary atomizat i on and evaporation. Structures are visible on the spray t ip and sides. On the spray tip, these structures are the outcome of l ocal micrometre- and nanometre-level uneven distributions of tip velocity and l iquid f uel concentration. The structures on the spray tip move l inearly along the spray axis. At the spray sides, the structures are the outcome of local enhanced air entrainment.The side struc t ures follow the curling air entrainment motion and form small vortices on the sides of the spray. Both the t ip and side struc t ures form early on in the spray injection and formation and remain unti l the end of the spray. 3.1. Image Correction and Processing The images were processed using a combination of DaVis software and purpose-programmed codes in C++ and MATLAB. A LaVision cal i bration target was used to match pixels to l ength on the focal plane and dewarp t he edges of t he i mage. Prior to measurements, a dark image was shot and was then subtracted from the acquired images. The captured i mages of the spray represent the projection of the spray on the camera plane, as shown in Figure 6. In order to acquire useful information on the actual spray geometry, the spray characteristics measured on t he images have to be corrected for the inclination of the spray to t he camera CCD plane. For the two middle plumes of t he spray,it can be easily shown t hat where Lp is the projection t i p penetration of the spray, Lp the actual tip penetration and e the angle between the spray plane and the CCD surface. To acquire the projection tip penetration, the images were rotated, and the tip pen-etration length was measured along the centreline of the spray, using a threshold of 40counts to differentiate between vapour fuel and nitrogen environment. Then, Equation (1)was used. Simi l arly, the projection of the spray centreline on the CCD o/ can be correlated to the actual The cone angle can be calculated by measuring the spray width at a distance of 50 mm from the injector tip. A similar technique has been used by other researchers in the past [2,23]. He at al. proposed that t he spray cone angle is measured at half the spray tip penetration length [24]. This was due to the higher spray fluctuation and evaporation observed in their work. Figure 6. Representation of spray, with marked t ip penetration length and angles of spray centreline . Figure 7 presents a t ypical intensity profile, along the axis of the spray plume. The beginning of the axis of the plume is the nozzle hole and the axis extends up to the vessel wall. The presence of l iquid blocks the l ight, so the captured i mage records no l ight or zero counts where liquid is present. This can be seen on the left side of the plot. In this sample intensity profile t aken at 3 bar ambient pressure and 0.27 ms aSOI, there are zero i ntensity counts for about the first 65 pixels. Then, t he intensity starts increasing rapidly. A t hreshold of 80 count s was chosen to signify t he end of the liquid l ength. Figure 7. Col l ected l ight intensity profile along spray plume line, starting from the nozzle hole extending to the vessel wall. The spray macroscopic liquid structure is quite repetitive, so five spray injection events were enough to provide statistica l conversion of the measured l iquid l ength and the cone angle. The data acquired from t he plume temporal evolution of the f ive spray events were ensemble averaged to provide the figures presented in the next section. 3.2. Spray Penetration Simi l ar to the past work of Yeom et al . [9], Reitz et al. [10] and Sphicas [2], this work also observed a decrease in the spray liquid length with i ncreasing ambient pressure.Figure 8a presents the plume t ip penetration as a function of t ime at various ambient pressures. The data from this work are marked with circles, crosses and dots f or ambient pressure of 3, 6 and 9 bar , respectively. On the same graph, data f rom IFP are presented in squares and X marks. These data were acquired at 1bar ambient pressure and 387 K for 800and 1500 bar injection pressure, respectively, Verhoeven et al. [16]. (a) (b) Figure 8. Spray tip penetration: (a) as a funct i on of time, at 3, 6 and 9 bar ambient pressure, compared to data from [16]; (b) as a func t ion of time, at 3, 6 and 9 bar ambient pressure and natural l ogarithmic model f it. At the start of the hydraulic i njection, the spray has the maximum velocity. With the lapsing of time aSOI , the spray transfers i ts momentum to the ambient environment. Several mechanisms have been suggested for this phenomenon. Evaporation is certainly a way of transferring momentum from the liquid to t he vapor and t hen to the ambient environment.However, the measurements presented here were performed i n non-evaporating conditions.The breakup of the spray into droplets and of droplets into smaller droplets, known as primary and secondary atomization, is another mechanism of transferring momentum from the spray to the ambient gas. Both primary and secondary atomization have been studied extensively, but further understanding of these phenomena on smaller scales is paramount. However, for the prac-tical purposes of engine dimensioning and valve timing, macroscopic spray characteristics can provide suf f icient approximation. Wi t h this aim, F i gure 8b presents t he data acquired in this work, with the regression of a natural logarithmic function. The considered f unction describing the l iquid length Lp, as a function of time t aSOI , i s of the form Lp= aln(t)+b,where a and b are constants. A similar spray behaviour was observed by Yue et al. [25] and by Ma et al. [26]. It was also observed that less volatile fuels, such as Diesel , lead to higher spray ti p penetration compared to more volatile fuels such as pentanol [26]. 3.3. Curve Fitting A non-linear l east squares method was applied. The basis of this method is to approxi-mate the model by a line and to refine the parameters by successive iterations. In matrix format, the nonlinear model is described by the formula Where y is the vector of responses, in this case, the liquid length. The curve model is f.which i s a function of X and B, in this case, the t ime and the model coefficients, respectively.The true error between the data and t he model is noted as e. The method starts with an initial estimate for each coefficient. The fitted curve y = f(X,B) for the current set of coefficients i s produced by calculating the J acobian matrix of f(X,B), which i s defined as a matrix of partial derivatives taken with respect t o t he coef f icients. The coef f icients are adjusted wi t hin a trust region, which has no more t han 10%change from the last value of the coefficients. The improvement of t he fit is determined.The steps above are iterated until a tolerance of 10-6 i s met or up t o 600 iterations. Table 1 shows the model coefficients f or t he different ambient pressures t ested i n t his work. With increasing ambient pressure, the value of coefficient a is reduced. By derivation of t he logarithmic model, t he spray t ip velocity is proportional to coefficient a. Table 1. Model coefficients Coefficients a b R2 3 bar 26.4 76.8 0.9456 6 bar 25.53 74.33 0.9625 9 bar 21.98 62.65 0.9922 3.4. Spray Tip Velocity In Figure 8b, for any time aSOI and the value of the spray l iquid length penetration for different values of ambient pressure, i t is easily observed that increased ambient pressure leads to decreased spray penetration. For example, at 100 ms aSOI, the spray tip penetration is 16, 15.55 and 12.04 mm for 3, 6 and 9 bar ambient pressure, respectively. It is evident that increased ambient pressure decreases the spray t ip penetration with decreasing rate. As a result, with increased ambient pressure, the spray tip velocity i s reduced. The mechanism i n place can be attributed to i ncreased momentum exchange f rom the spray to the ambient environment with increased ambient pressure. A similar observation was reached in Table 1, where increased ambient pressure leads to a reduced value of coefficient a. For example, at 3,6 and 9 bar ambient pressure, the value of coefficient a is 26.4,25.53and 21.98, respectively. The velocity follows the i nverse f unction of t ime, as expected from derivation of the natural logarithm equation Lp = aln(t) +b. Figure 9 presents the spray tip velocity as a function of time. Figure 9. Spray tip penetration velocity. 3.5. Spray Cone Angle Another macroscopic observation of improved momentum transfer is the cone angle of t he plume. Figure 10 shows t he measured cone angle of the plumes with time aSOI . The cone angle is relatively constant as a function of time, indicating that the i njection duration is not affecting the value of the cone angle. This makes the cone angle of the plume a direct measure of the momentum exchange. The value of the cone angle, at t he ambient pressures tested in this work, is proportional to the ambient pressure. For example, at 3 bar ambient pressure, the spray cone angle is between 35 and 37 degrees. At 6 bar, i t is approximately 40 to 42 degrees and at 9 bar, around 50 degrees. Increased ambient pressure increases t he cone angle of the plume. This indicates that the denser ambient environment makes the plume spread radially and increases the momentum transfer to the ambient environment. In Figure 10, for reduced ambient pressure, data points are reported at earlier times aSOI. This happens because the plume t ip requires ti me aSOI to reach the 50 mm down-stream line, where the cone angle was measured. For higher ambient pressure, the plume tip requires more time to reach the 50 mm l i ne. For example, at 3, 6 and 9 bar, t he first reading at 50 mm occurs at approximately 2.1, 2.4 and 2.6 ms aSOI. Figure 10. Cone angle as a func t ion of t ime aSOI, at 3, 6 and 9 bar ambient pressure. 4. Conclusions Fuel dispersion is of vital importance for reducing emissions i n any combustion system.In this work, the dispersion of an automotive Diesel spray was investigated at high pressure,in a purpose-built optically accessible pressure vessel , using high-speed shadowgraphy. The spray photographs showed reduced optical density on the spray tip, attributed to primary atomization. Reduced optical density was also observed at the spray sides,attributed to ambient air entrainment, mixing and evaporation. Structures on the spray tip and sides were observed to remain unti l the end of the spray. Spray characteristics such as tip penetration and cone angle provide a good description of the fuel dispersion in a Diesel engine. The spray tip penetration and cone angle depend on the ambient pressure and temperature. Spray tip penetration was observed to decrease and cone angle to increase with increasing ambient pressure. Both the mechanisms above indicate enhanced momentum ansfer from t he spray to t he ambient environment. A natural logarithm model was proposed for the temporal evolution of the spray tip penetration. A non-linear l east squares method was used to calculate the model parameters based on the acquired data. The temporal evolution of the spray cone angle was relativel y constant, but was proportional to the ambient pressure. Author Contributions: Methodology, P.S.; Software, P.S.; Investigation, A.P; Resources, A.P.;Wri t ing -original draft, P.S.; Writing-review & editing, P.S.; Supervision, A.P.; Project adminis-tration, A.P. Al l authors have read and agreed to the published version of the manuscript. Funding: This research received no external funding. Data Availability Statement: Data available upon r equest at panos.sphicas@gmail.com. Conflicts of Interest: The authors declare no conflict of interest. References 1. Bin Ahmad, M.S.; Pesyridis, A.; Sphicas, P; Mahmoudzadeh Andwari, A.; Gharehghani, A.; Vaglieco, B.M. E lectric vehicle modelling for future t echnology and market penetration analysis. Front. Mech. Eng. 2022,8,896547. [CrossRef] 3. EPA. Integrated Science Assessment for Particulate Matter; EPA/600/R-08/139F; EPA: Philadelphia,PA, USA, 2009.4. Soldado, J.C.; Pesyridis, A.;Sphicas, P; Nikolakopoulos, P; Markides, C.N.; and Deligant, M. Axial Turbo-Expander Design for Organic Rankine Cycle Waste-Heat Recovery with Comparative Heavy-Duty Diesel Engine Drive-Cycle Performance Assessment.Front. Mech. Eng. 2021,7,676566.[CrossRef ] 6. Sphicas, P.; Pickett, L .M.; Skeen, S.; Frank, J.; Lucchini, T.; Sinoir, D.; D'Errico, G.; Saha, K.; Som, S. A Comparison of Experimental and Modeled Velocity in Gasoline Direct-Injection Sprays with Plume Interaction and Collapse. SAE Int. J . Fuels Lubr. 2017,10, 184-201. [CrossRef ] 7. Sphicas, P.; Pickett, L .M.; Skeen, S.A.; Frank, J .H.; Parrish, S. Interplume Velocity and Extinction Imaging Measurements to Understand Spray Collapse when Varying I njec t ion Duration or Number of Injections. At. Sprays 2018,28,837-856. [CrossRef] 8. Sphicas, P. Investigation of the Effect of Plume Number on Spray Col l apse. In Proceedings of t he ASME 2019 Internal Combustion Engine Division Fall Technical Conference, Chicago, IL, USA, 20-23 October 2019. [CrossRe f ] 9. Yeom, J.K.; Kang, B.M.; Lee, M.J.; Chung, S.S.; Ha, J.Y.; Fujimoto, H. A study on the mixture formation process of evaporating diesel spray by offset incidence laser beam. KSME Int. J . 2002,16,1702-1709. [CrossRef ] 10. Reitz, R.; Bracco, F. On the Dependence of Spray Angle and Other Spray Parameters on Nozzle Design and Operating Conditions; SAE Technical Paper 790494; SAE: Warrendale, PA, USA, 1979. [CrossRef ] 11. Bruneaux, G. Liquid and vapor spray structure i n high-pressure common r ail diesel injection. At. Sprays 2001, 11,533-556.[CrossRef ] 12. Naber, J.D.; Siebers, D. Effects of Gas Density and Vaporization on Penetration and Dispersion of Diesel Sprays. SAE Tech. Pap.1996, 960034.[CrossRef] 13. Tsujimura, T.; Mikami, S.; Achiha, N.; Tokunaga, Y.; Senda, J .; Fujimoto, H. A study of direct i njection diesel engine fueled with hydrogen. SAE Trans. 2003, 112, 390-405. 14. Hwang, J.S.; Ha, J.S.; No, S.Y. Spray Charactreistics of Dme In Conditions of Common Rail Injection System(I I ). Int. J. Automot .Technol. 2003, 4, 119-124. 15. Helin, X.; Yusheng, Z.; Huiya, Z. Experimental and Numer i cal Study of the Characteristics of Liquid Phase LPG and Diesel Fuel Sprays;SAE Technical Paper 2006-32-0076; SAE: Warrendale, PA, USA, 2006. 16. Verhoeven, D.; Vanhemelryck,J.; Bari t aud , T. Macroscopic and Ignition Characteristic s of High-Pressure Sprays of Single-Component Fuels; SAE Technical Paper 981069;SAE: Warrendale, PA, USA, 1998. [CrossRef] 17. Klein-Douwel, R.J.H.; Frijters, P.J.M.; Somers, L.M.T .; de Boer, W.A.; Baert, R.S.G. Macroscopic diesel f uel spray shadowgraphy using high speed digital imaging in a high pressure cell. Fuel 2007,86,1994-2007. [CrossRef ] 18. Bae, C.; Kang, J. Diesel Spray Development of VCO Nozzles for High Pressur e Direc t Injection; SAE Technical Paper 2000-01-1254;SAE: Warrendale, PA, USA, 2000. 19. Kunkulagunta, K. Video i maging and analysis of common r ai l sprays in an optical engine using shadowgraphy technique. SAE Trans . 2000, 109,1528-1537. Robert Bosch GmbH. Diesel-Engine Management; John Wiley & Sons Inc.: Hoboken, NJ, USA, 2005. Payri, R.; Salvador, F.J .; Gimeno, J.; de l a Morena, J. Macroscopic Behavior of Diesel Sprays in the Near-Nozzle Field. SAE Int. J.Engines 2009, 1, 528-536. [CrossRef ] 22. Frank, H.; Pickett, L .M.; Bisson, S.E .; Patterson, B.D.; Ruggles, A.J.; Skeen, S.A.; Manin,J.;Huang, E.; Cicone, D.;Sphicas, P . Sandia Report , SAND2015-8758, 2015. Available online: https://prod-n g.sandia.go v/techlibnoauth (accessed on 12 February 2023). 23. Delacourt, E.; Desmet, B.; Besson, B. Characterisation of very high pressure diesel sprays using digital imaging techniques. Fuel 2005,84,859-867. [CrossRef] 24. He, J .; Chen, H.; Chen, Y.; Su, x.; Zhang, P; Xu, H.; Zhou, C. Optical study on the spray and combustion of diesel cyclopentanol blend fuels on a constant volume chamber. Fuel 2022,315, 123171.[CrossRef ] 26. Ma, Y.; Huang , S.; Huang, R.; Zhang, Y.; Xu, S. Spray and evaporation characterist i cs of N-pentanol -diesel blends i n a constant volume chamber. Energy Convers. Manag. 2016, 130, 240-251. [CrossRef ] Disclaimer/Publisher’s Note: The statements, opinions and data contained in all publications are solely those of t he individual author(s) and contributor(s) and not of MDPI and/or the editor(s). MDPI and/or t he editor(s) disclaim responsibility for any i njury to people or property resulting from any ideas, methods, i nstructions or products referred to in the content.
确定


还剩9页未读,是否继续阅读?

产品配置单


北京欧兰科技发展有限公司为您提供《高压下柴油喷雾液柱长度成像测量》,该方案主要用于汽车排放与节能中柴油喷雾液柱长度检测,参考标准--,《高压下柴油喷雾液柱长度成像测量》用到的仪器有LaVision HighSpeedStar 高帧频相机、LaVision DaVis 智能成像软件平台
推荐专场


相关方案
更多
该厂商其他方案
更多