


采用LaVision公司以增强型CCD相机为核心构成的平面激光诱导荧光测试系统(PLIF)对均质混合进气直喷汽油发动机中燃料和空气的混合程进行了测量和研究。
方案详情

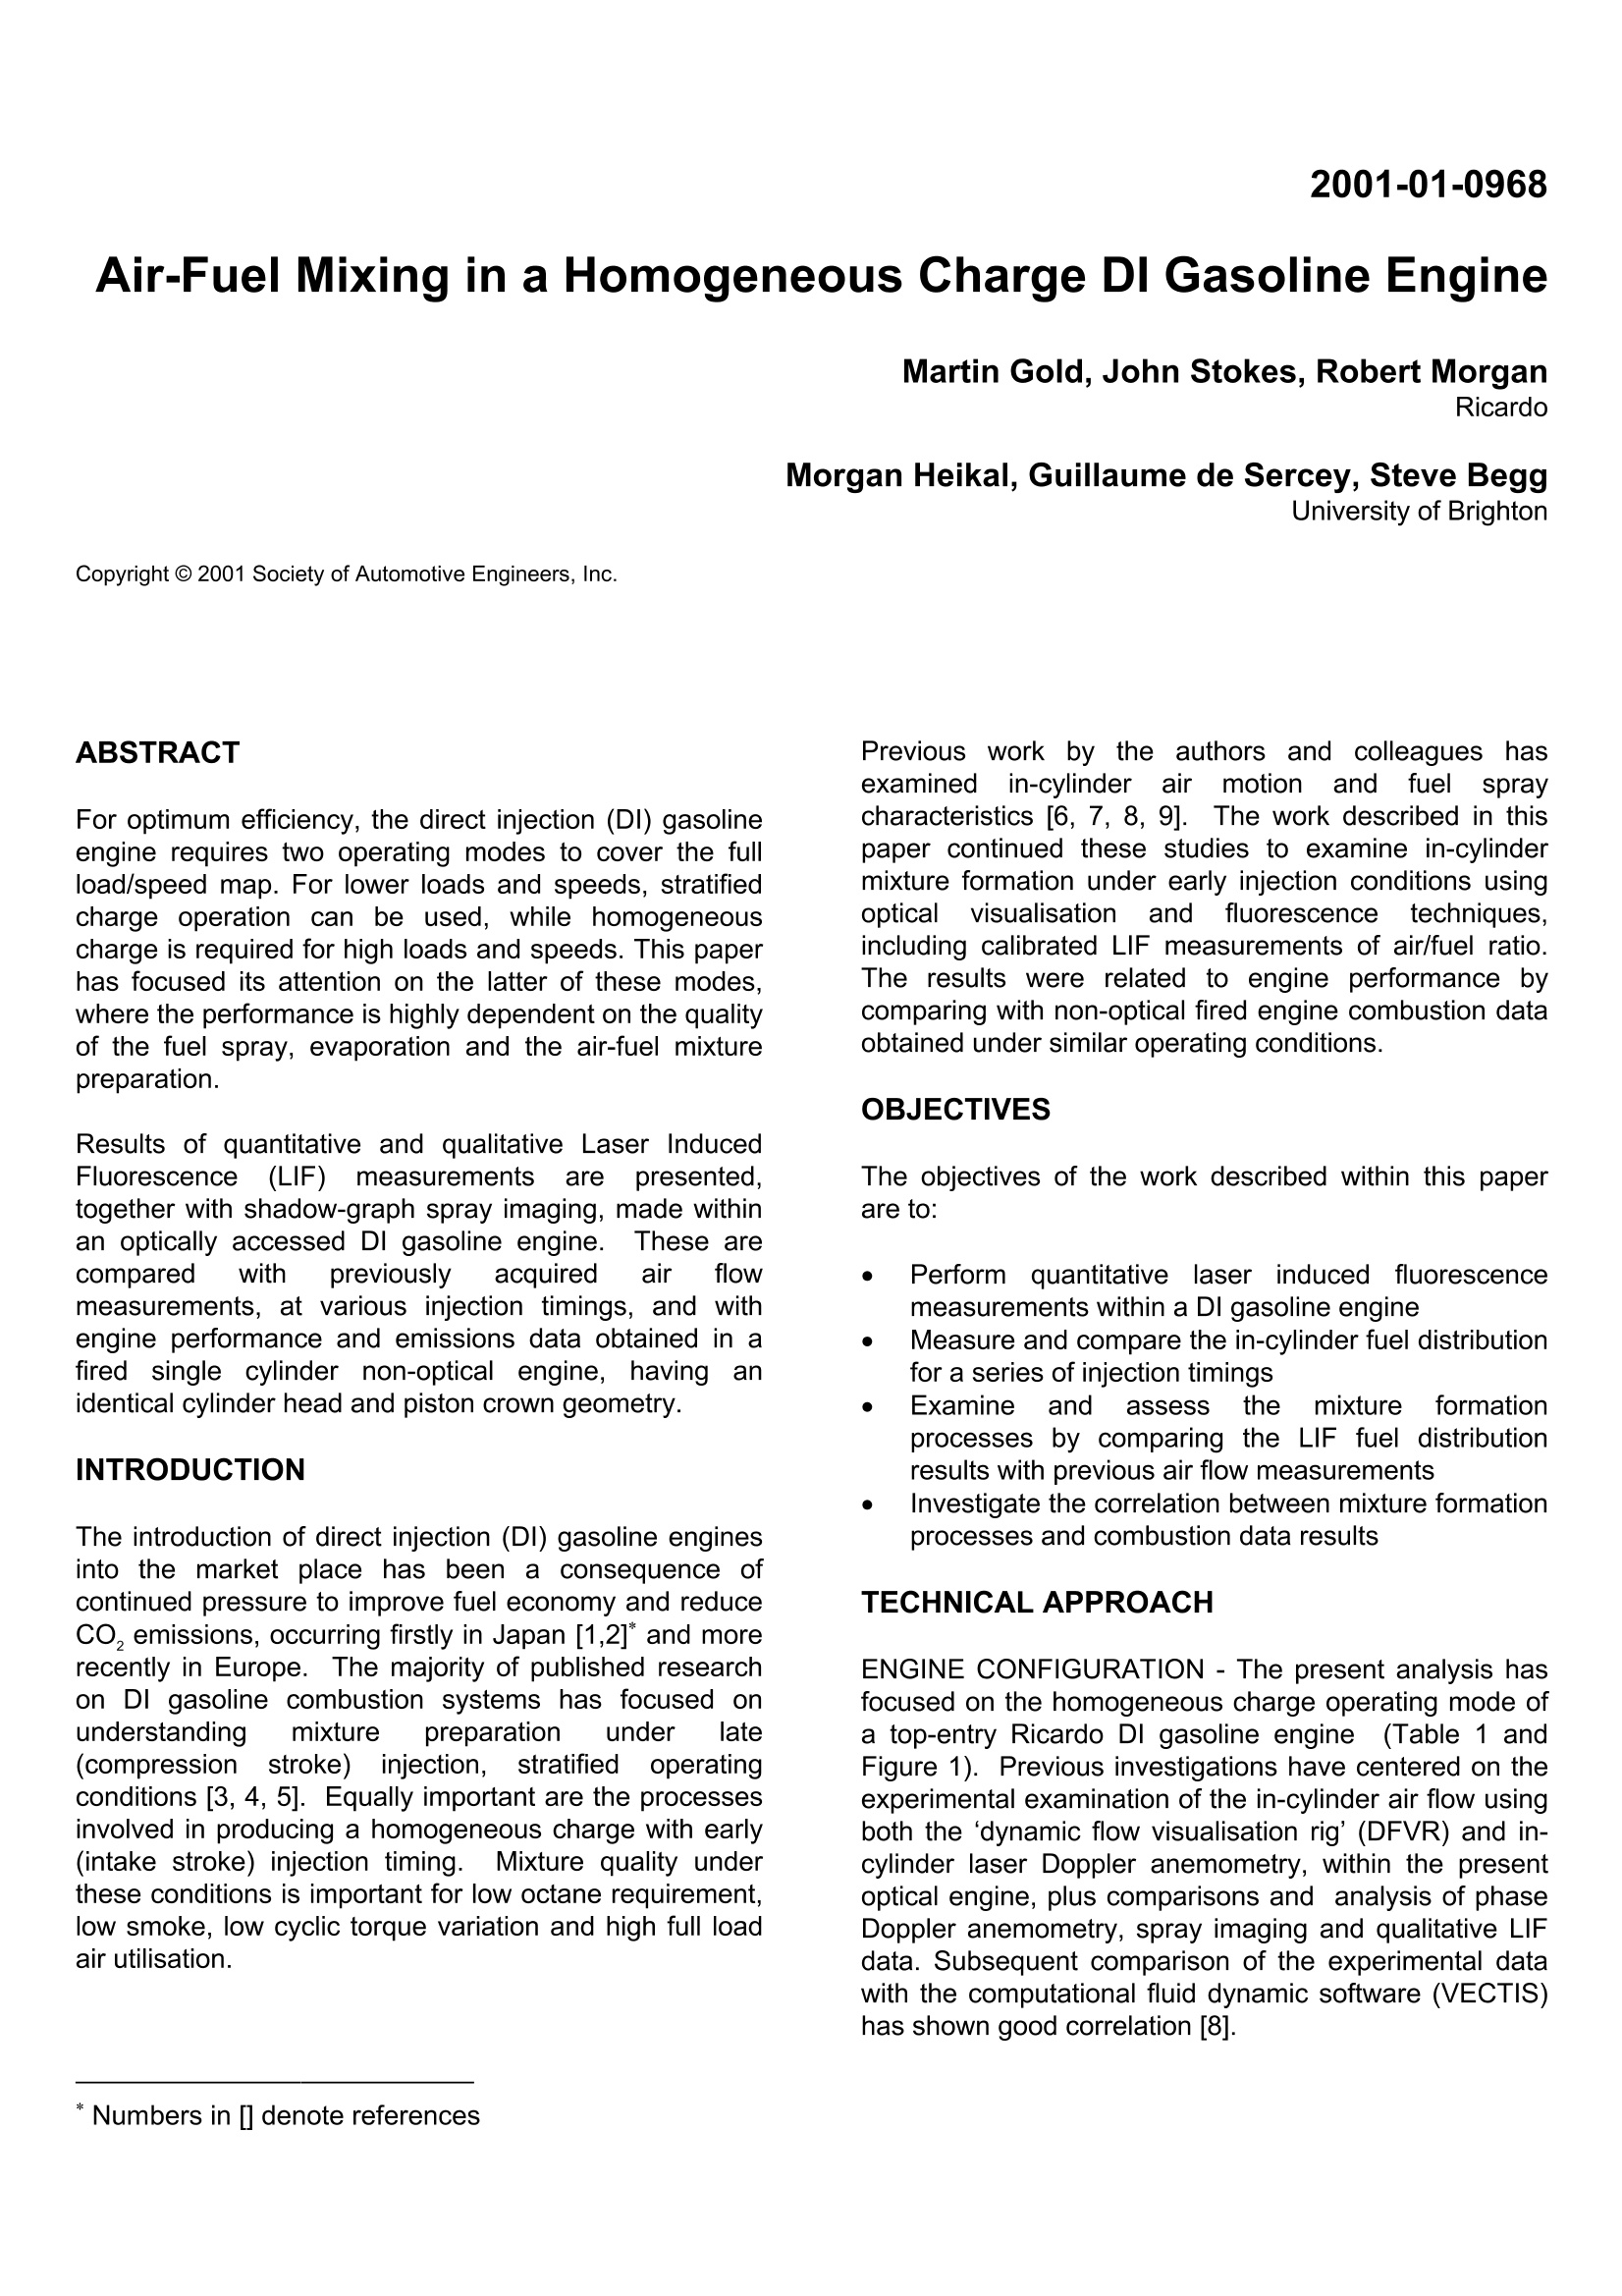
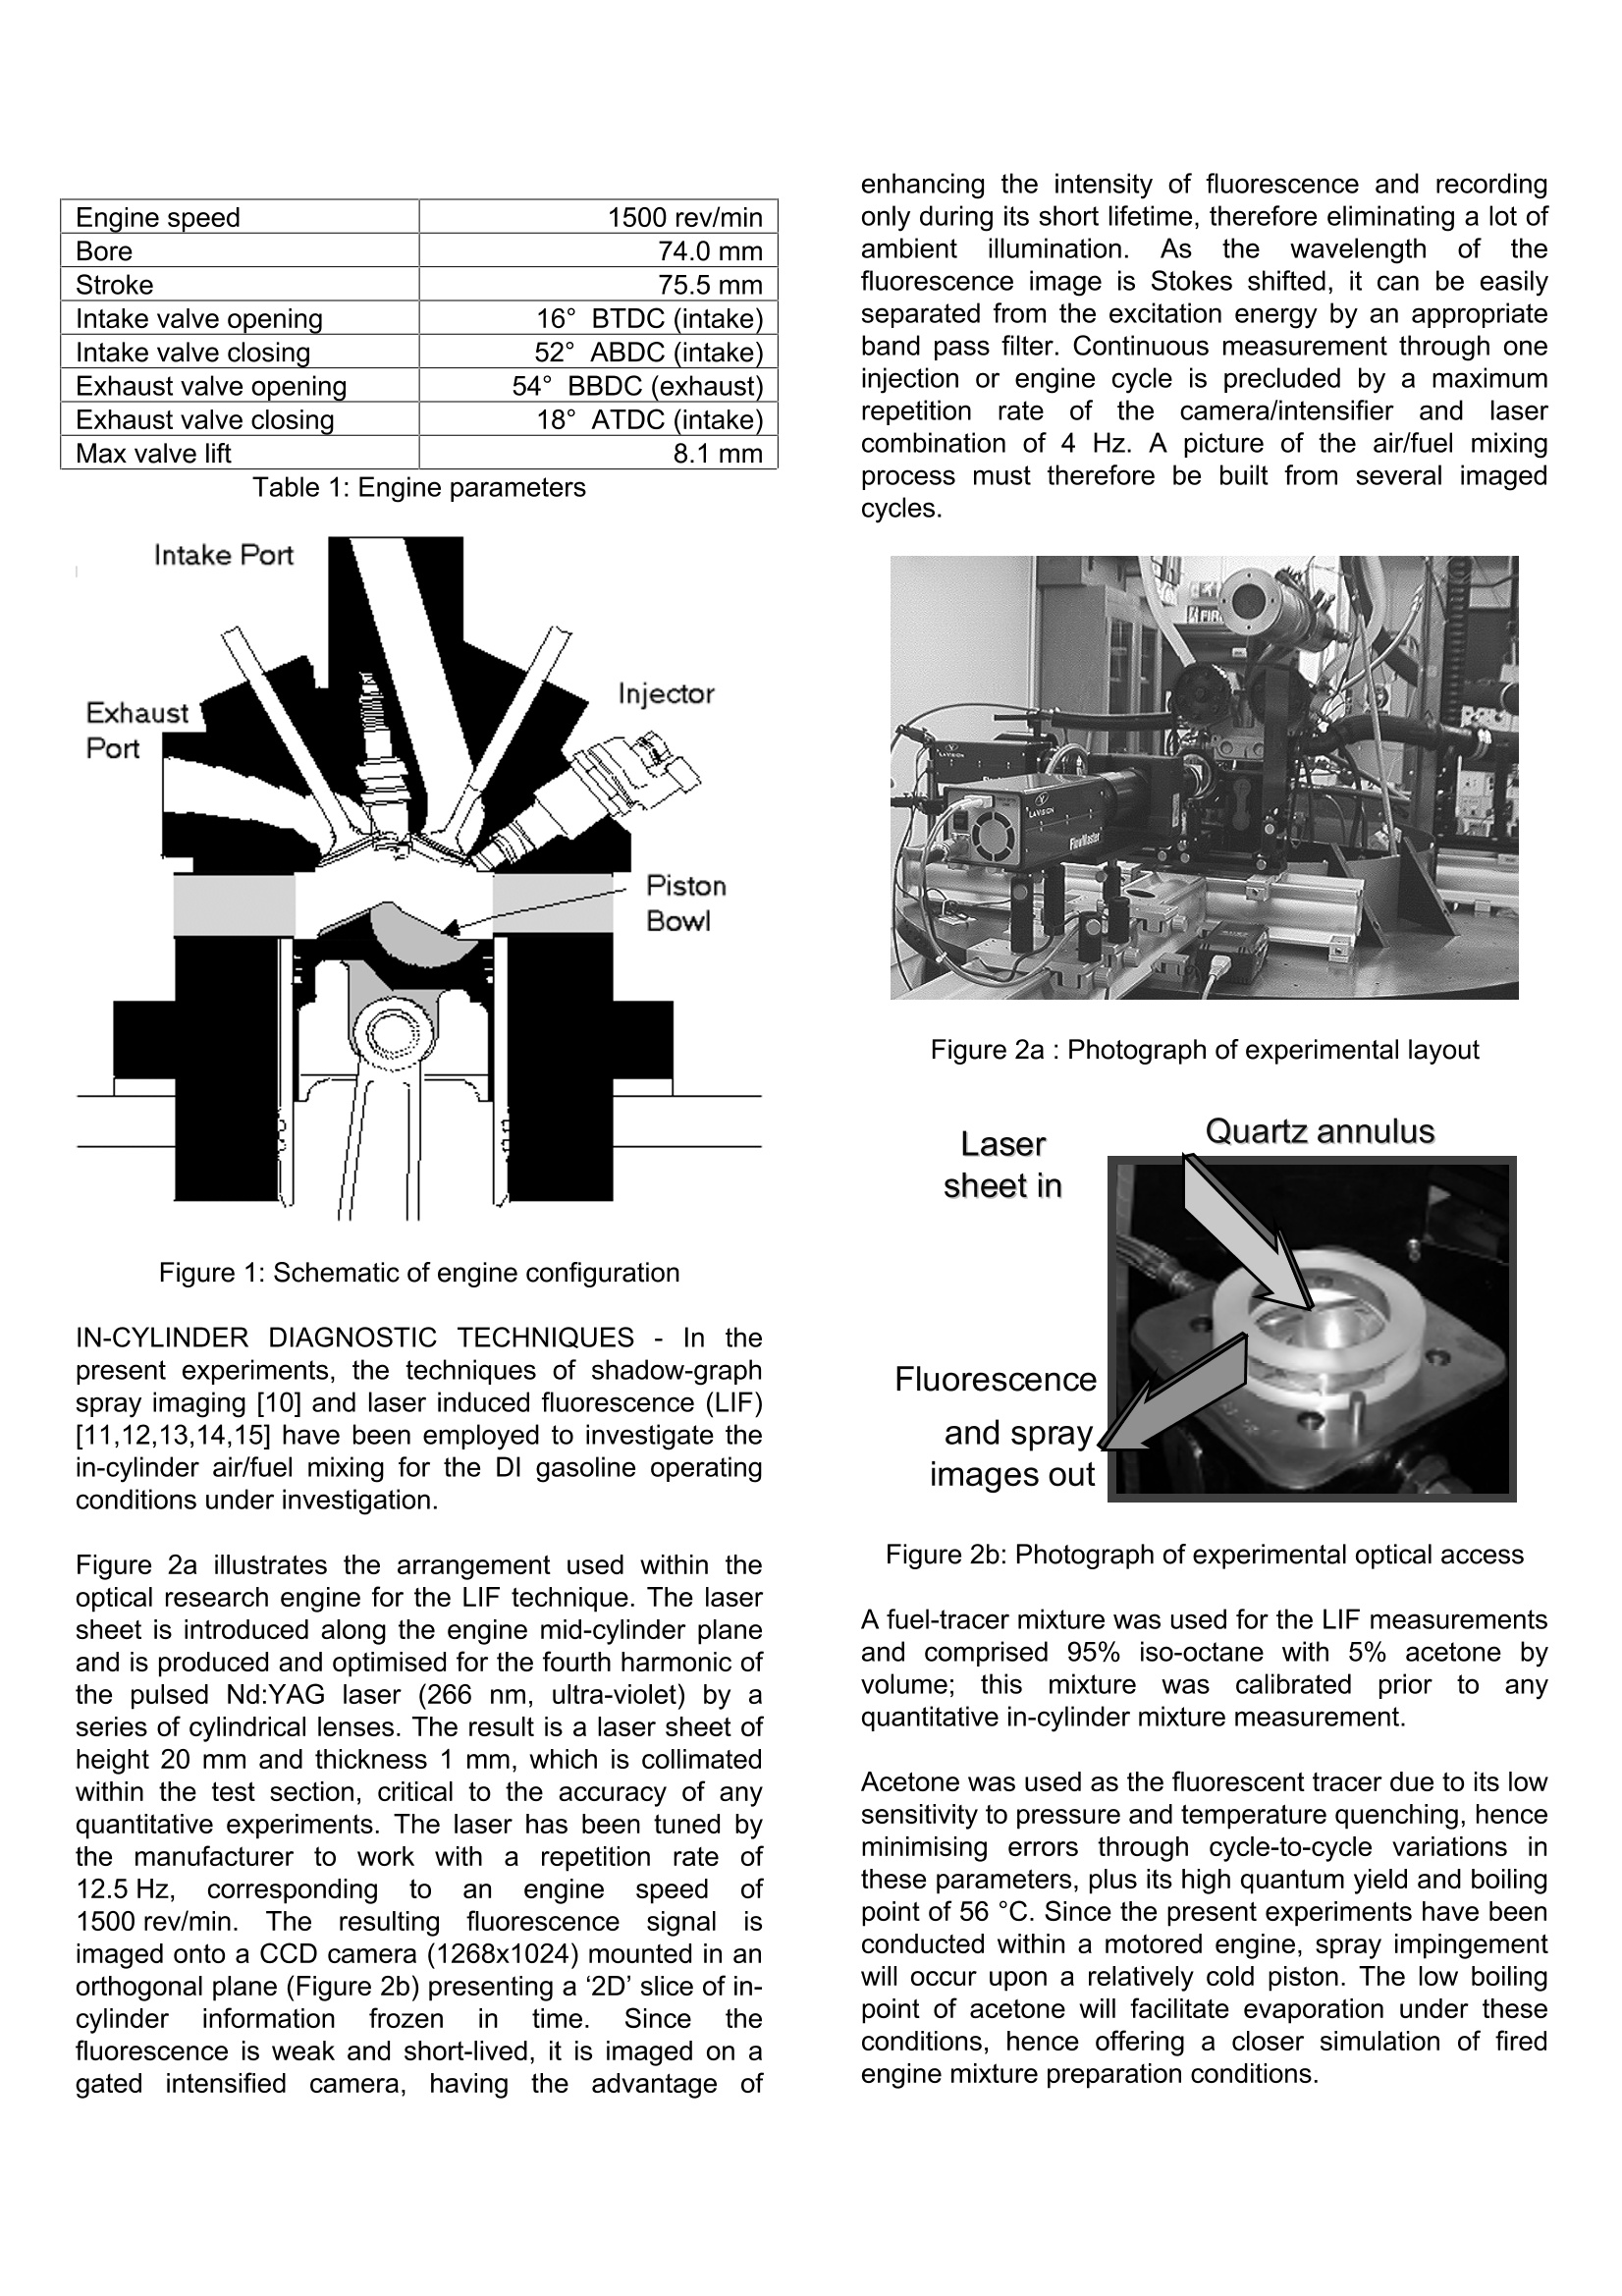
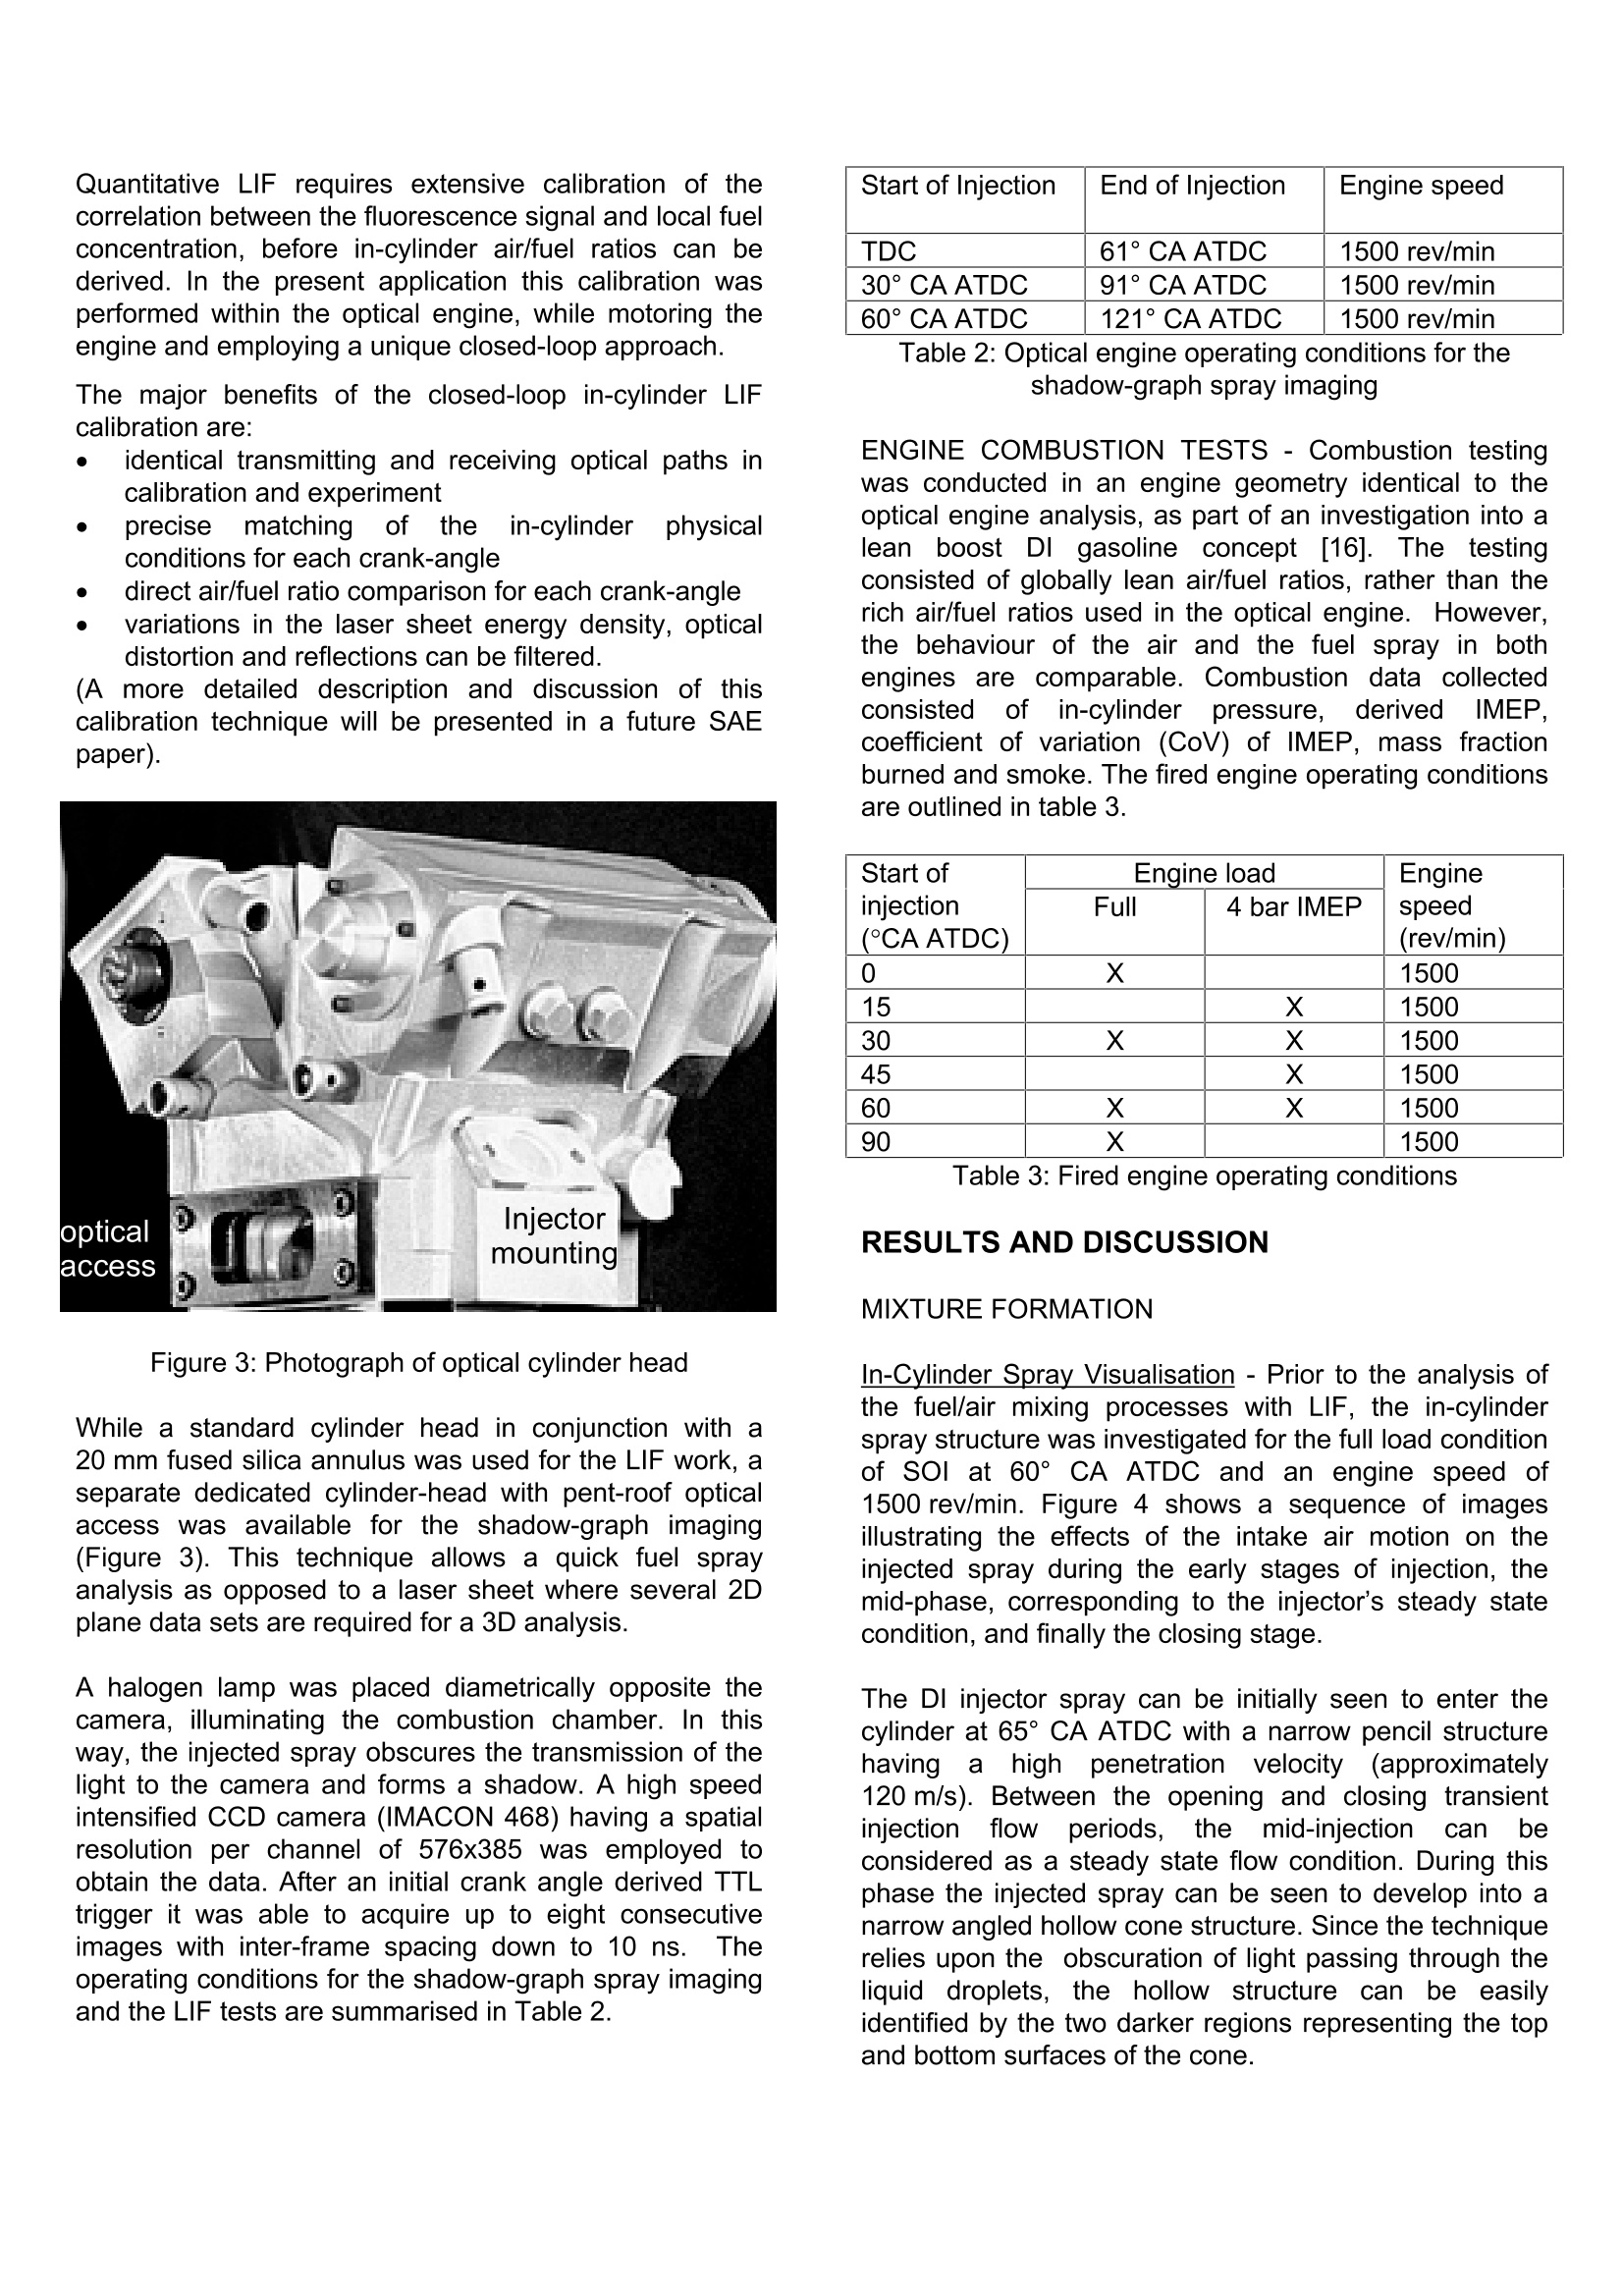
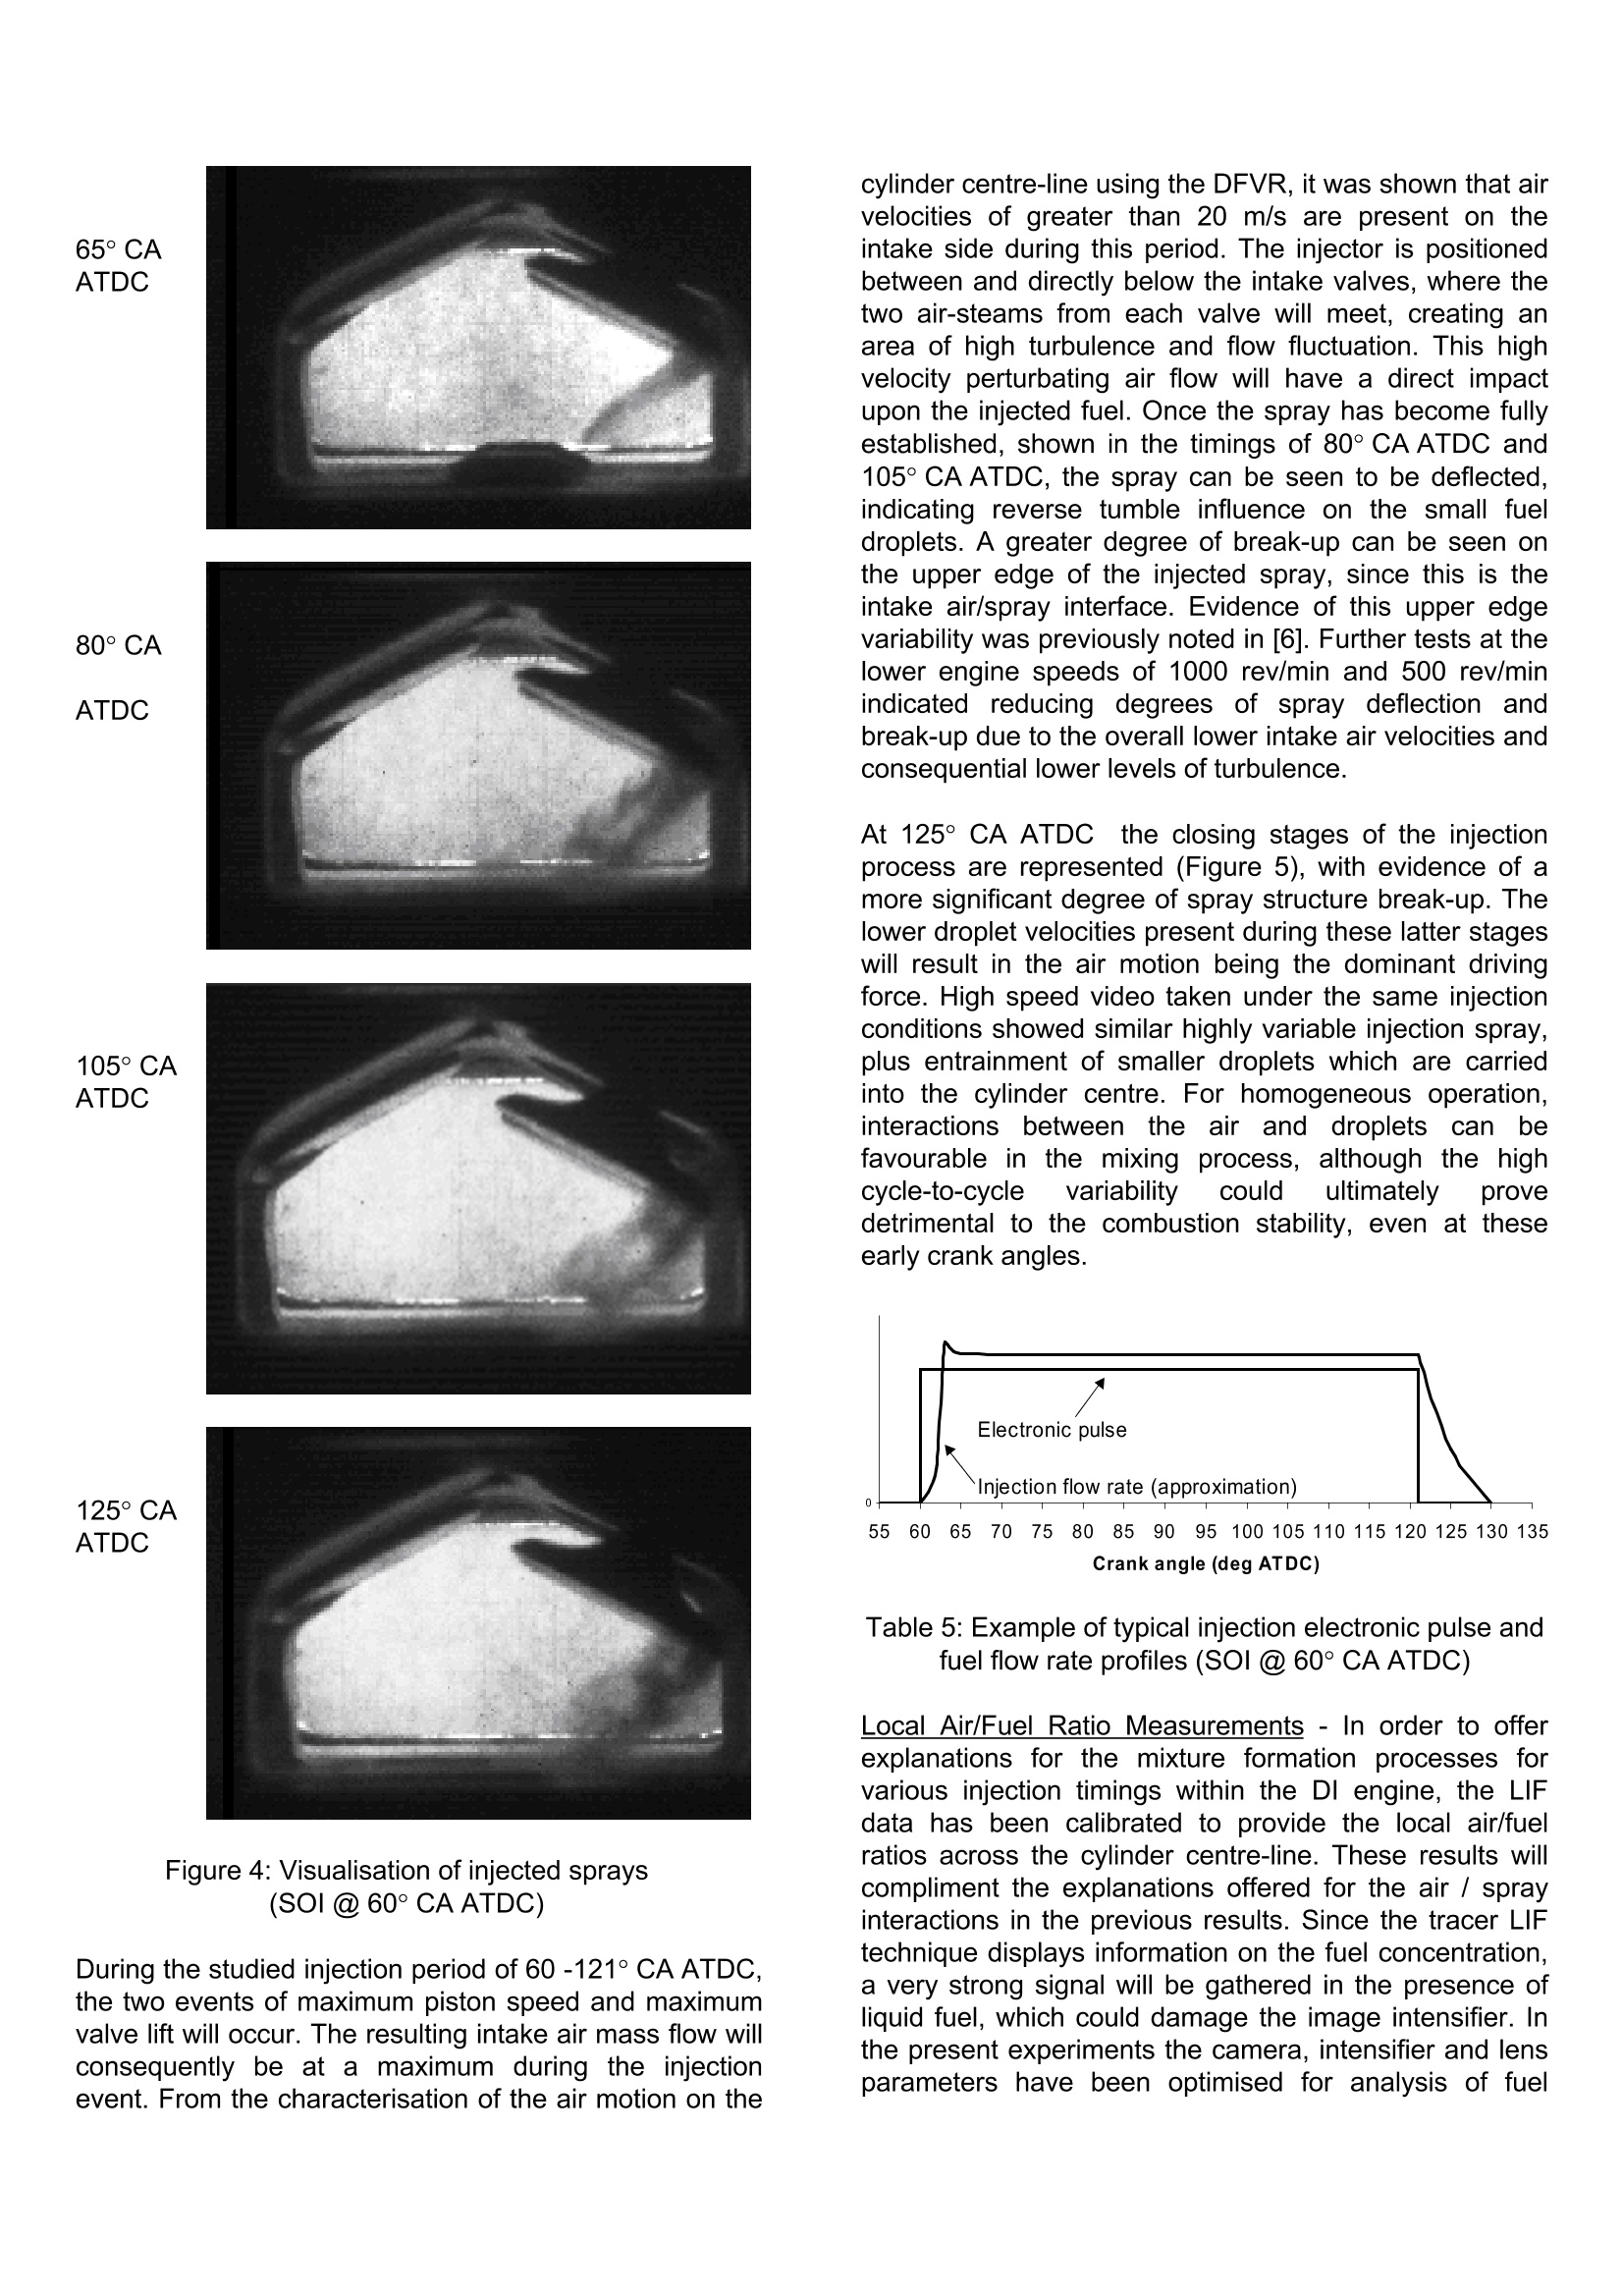
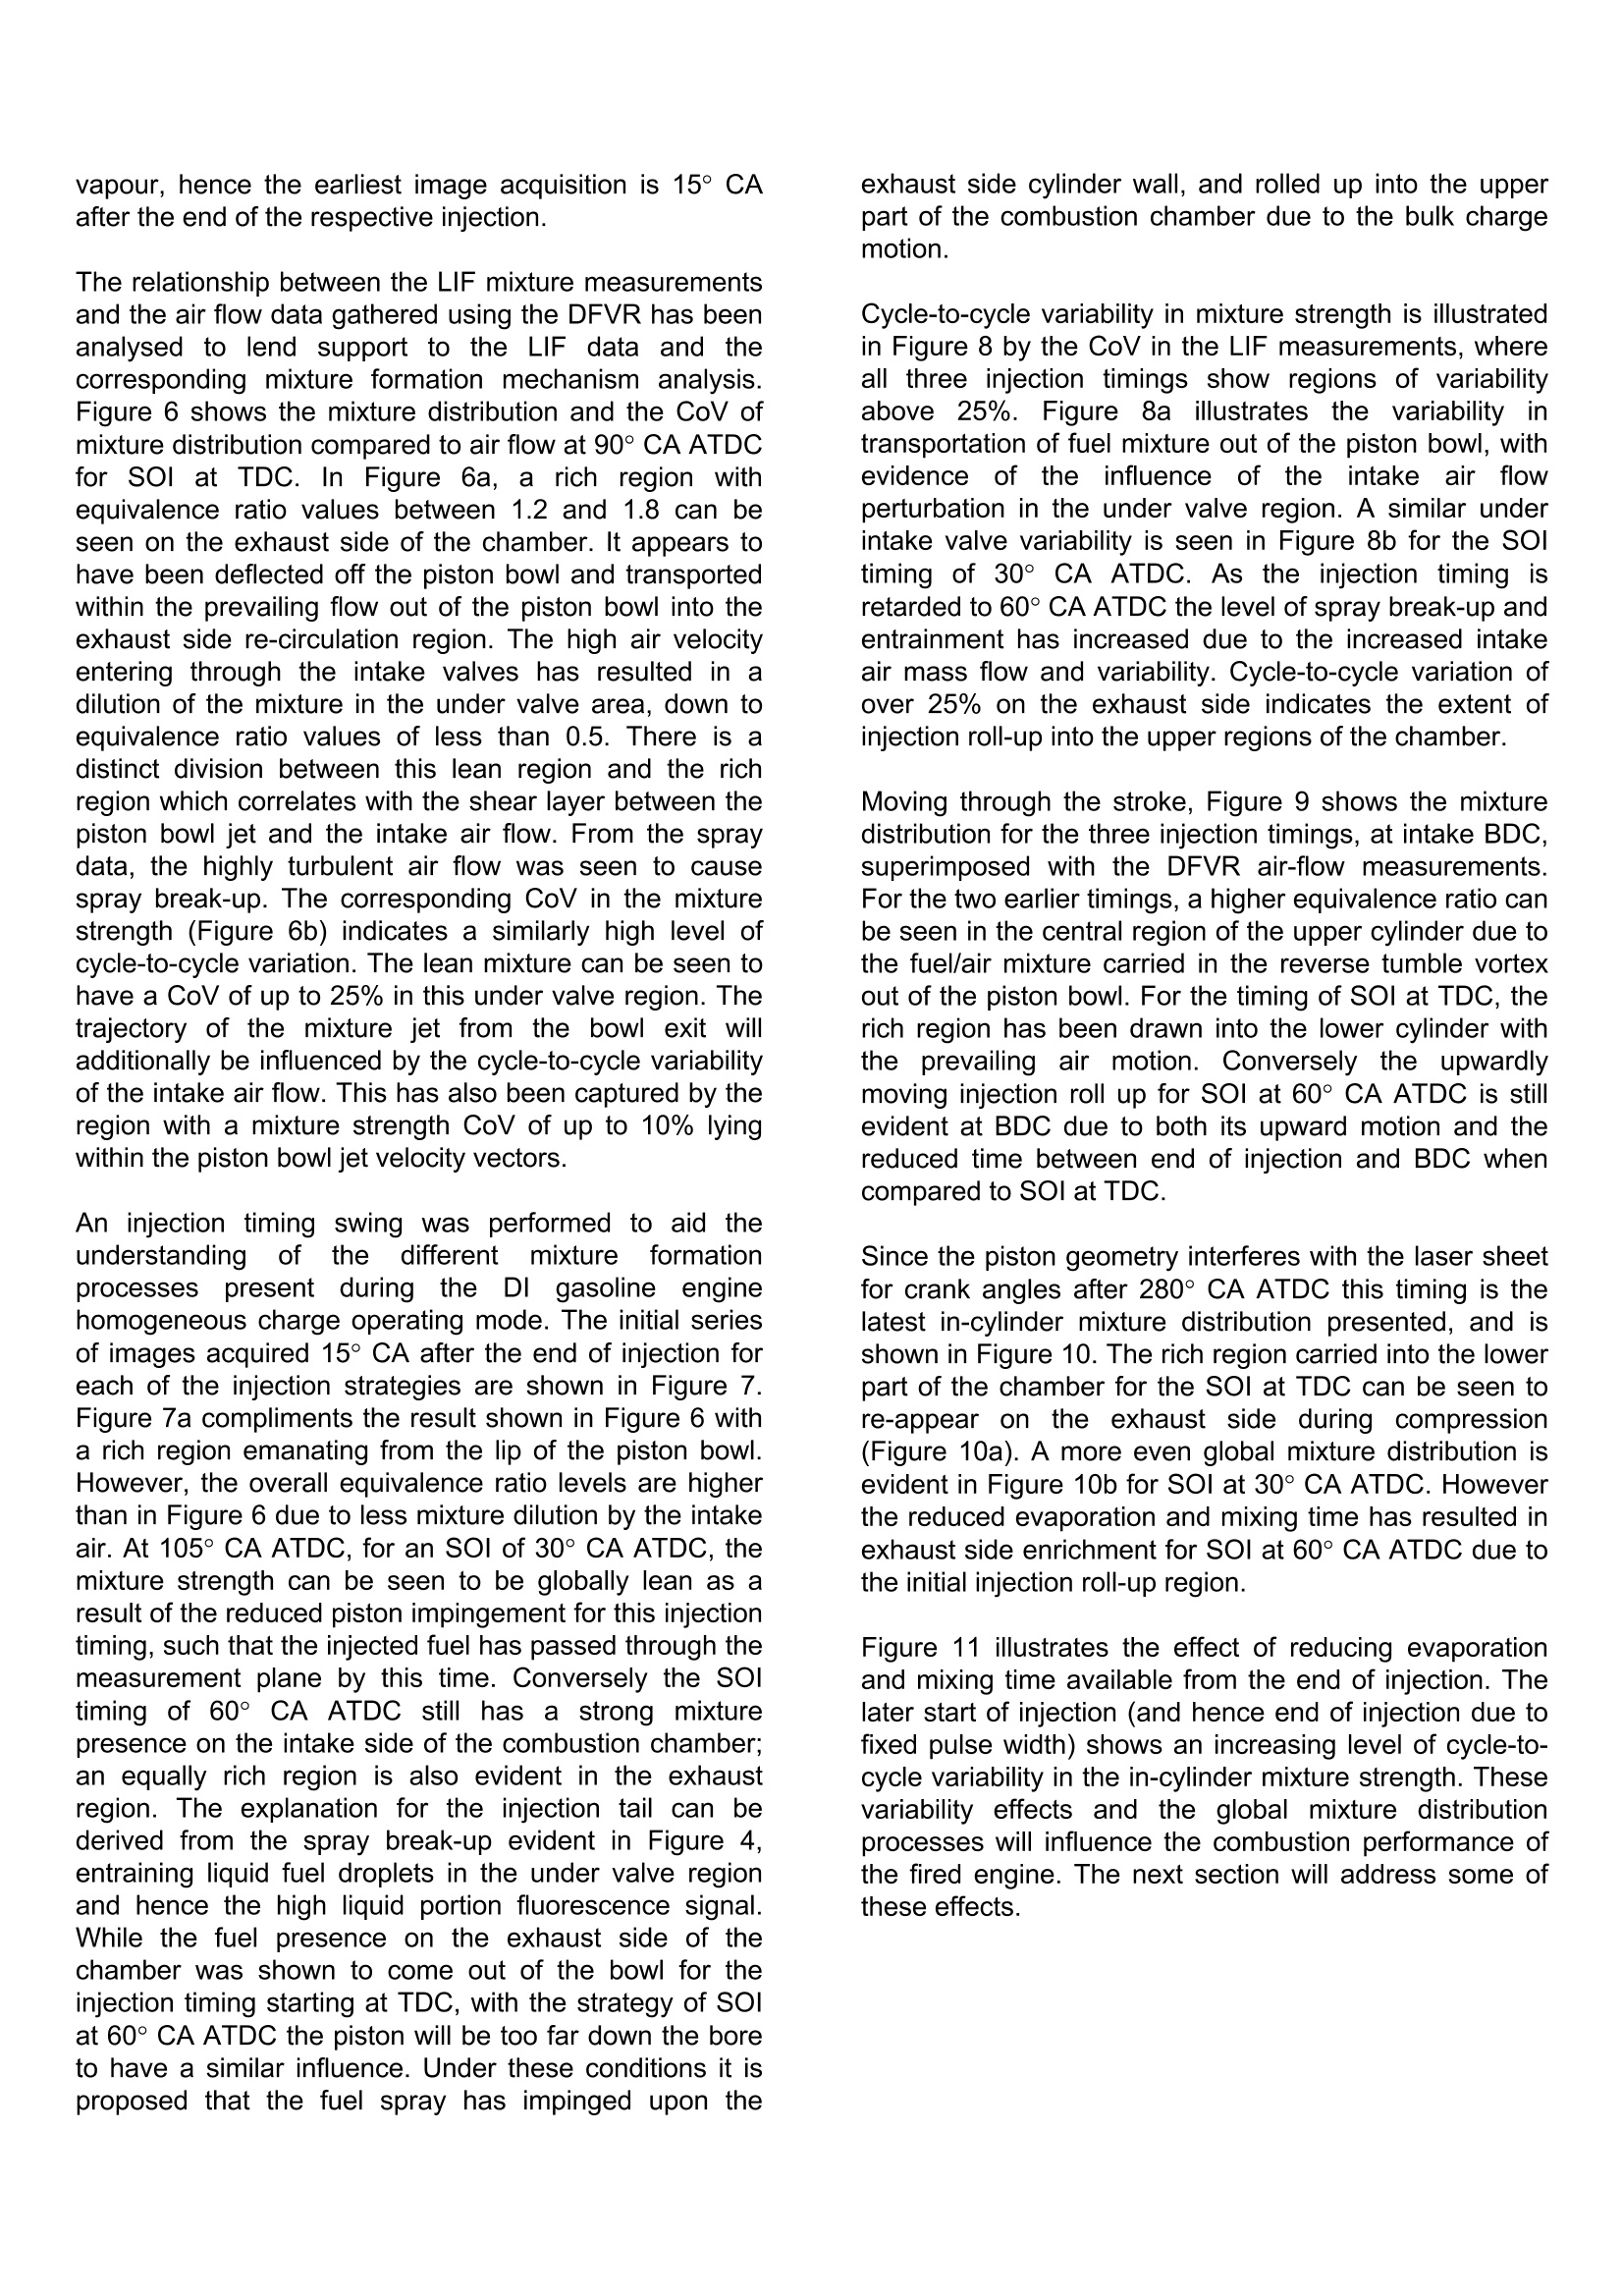
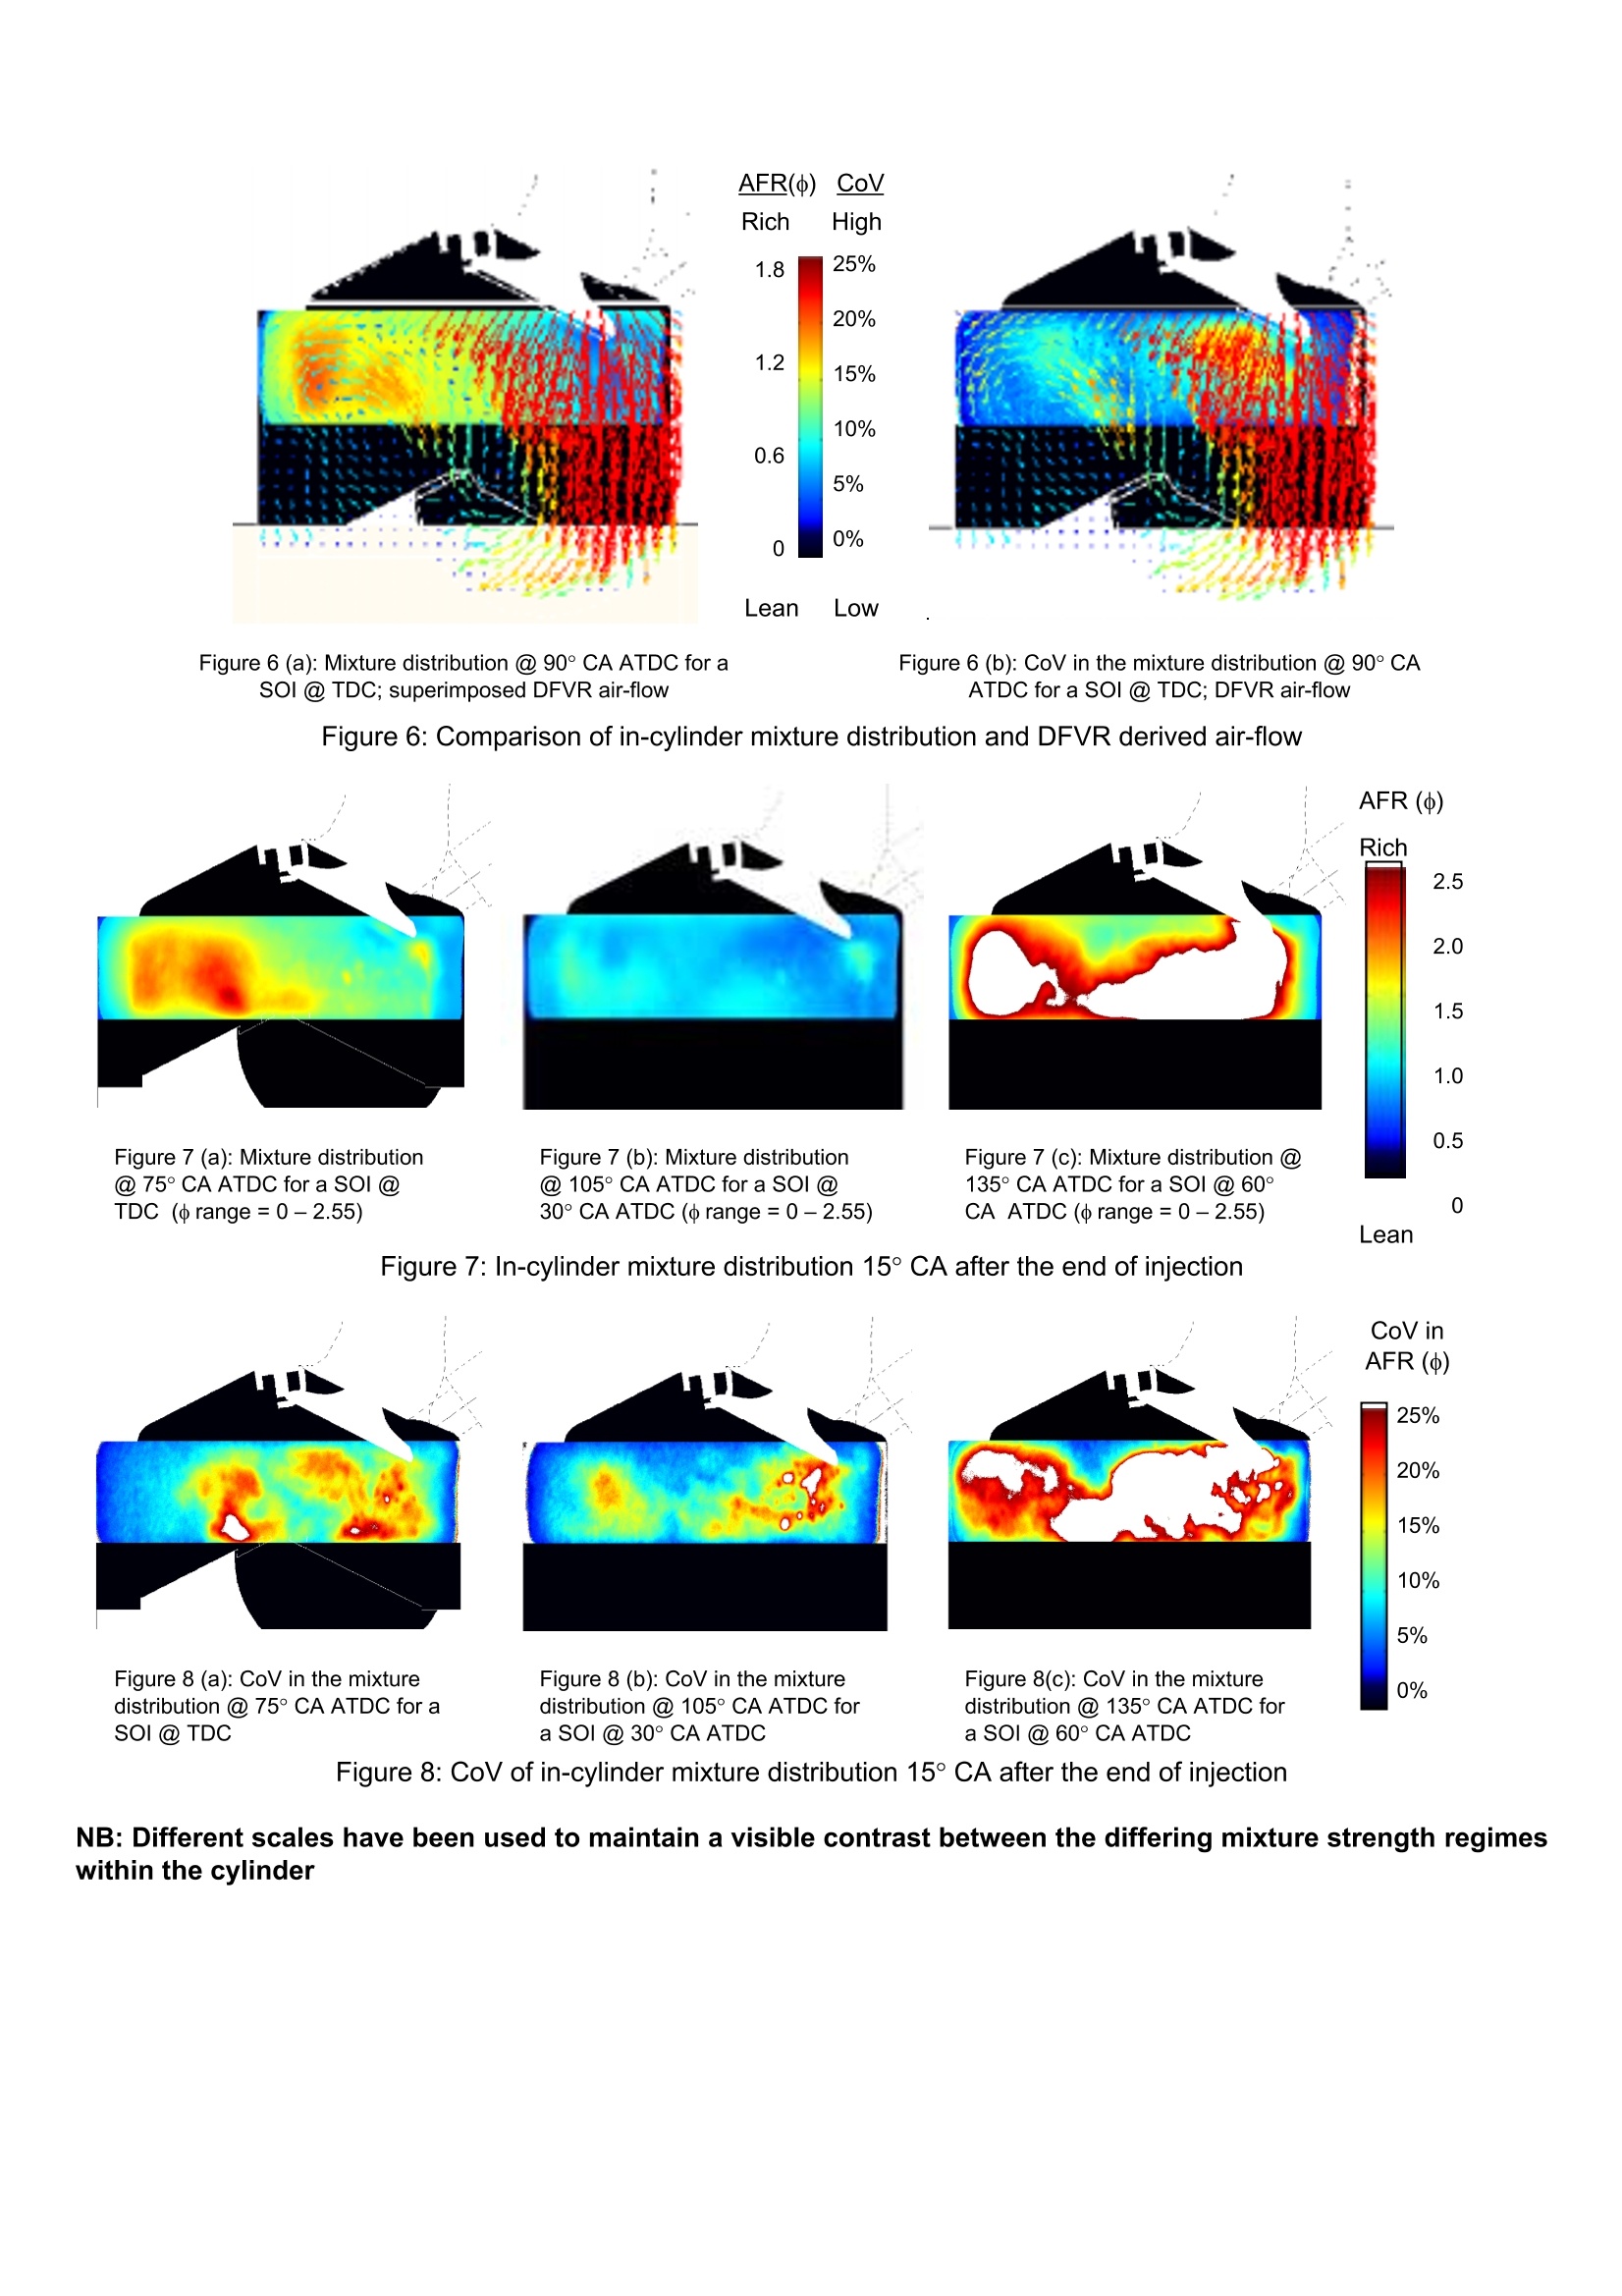
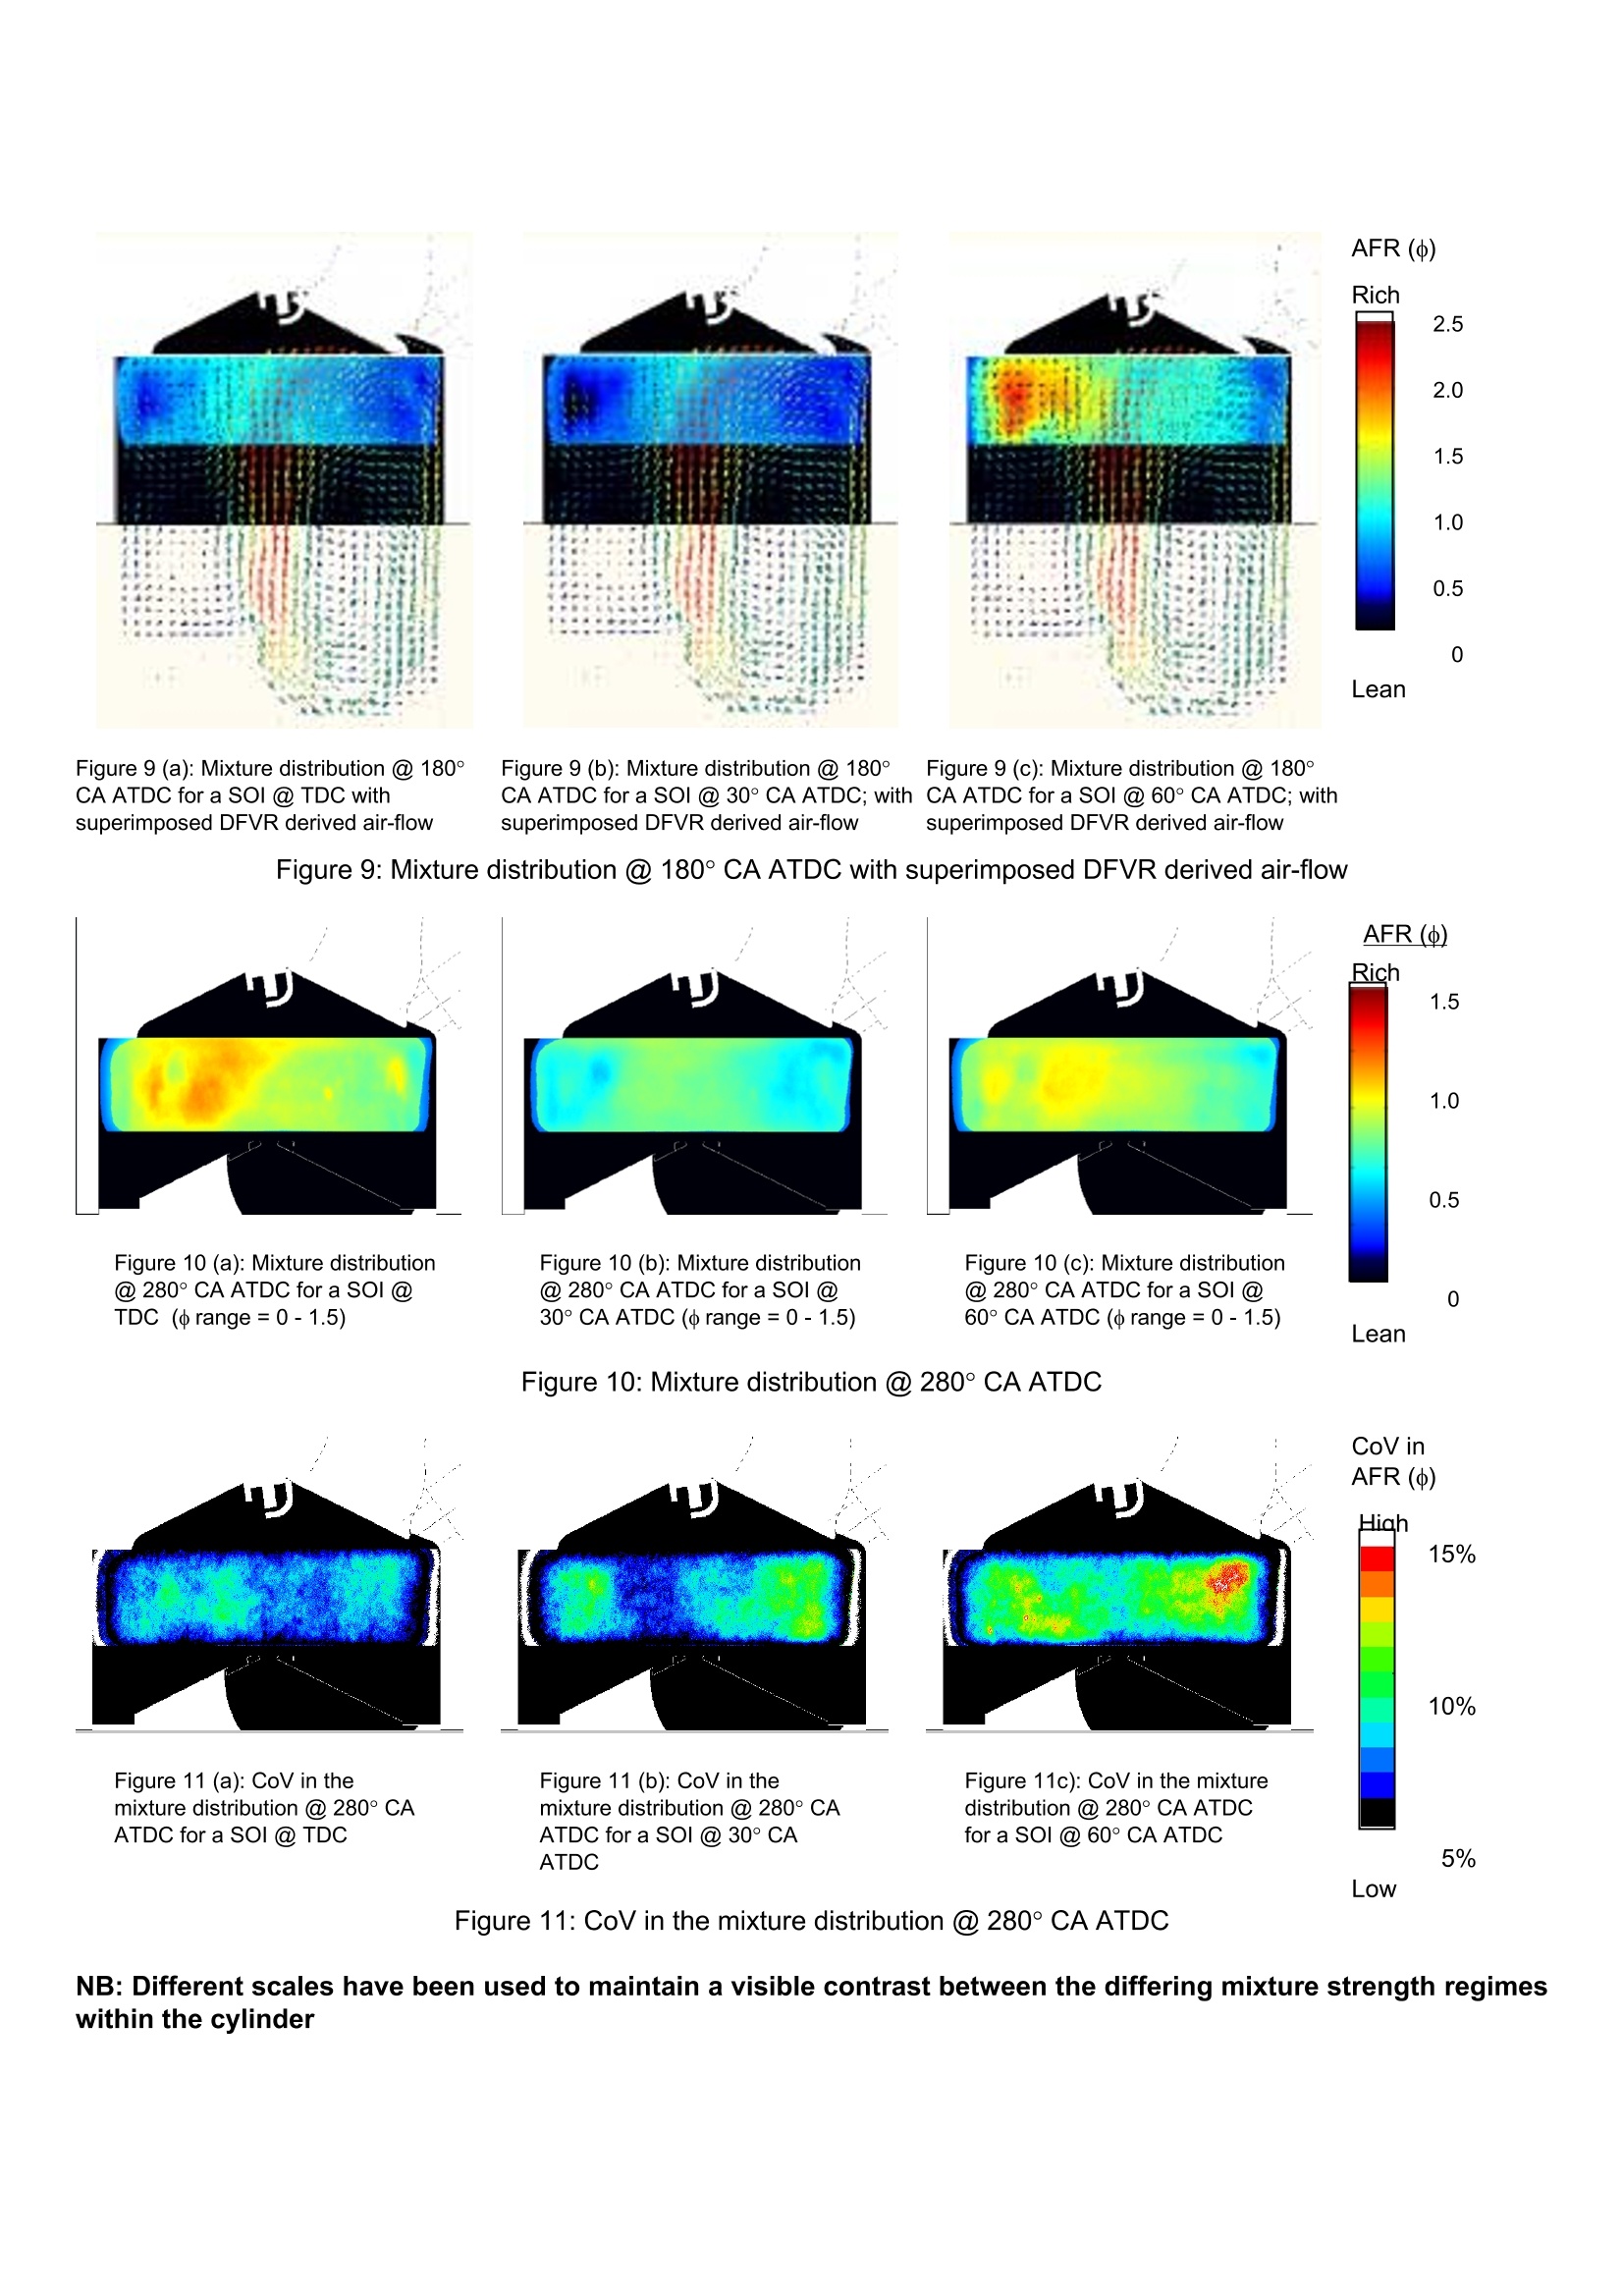
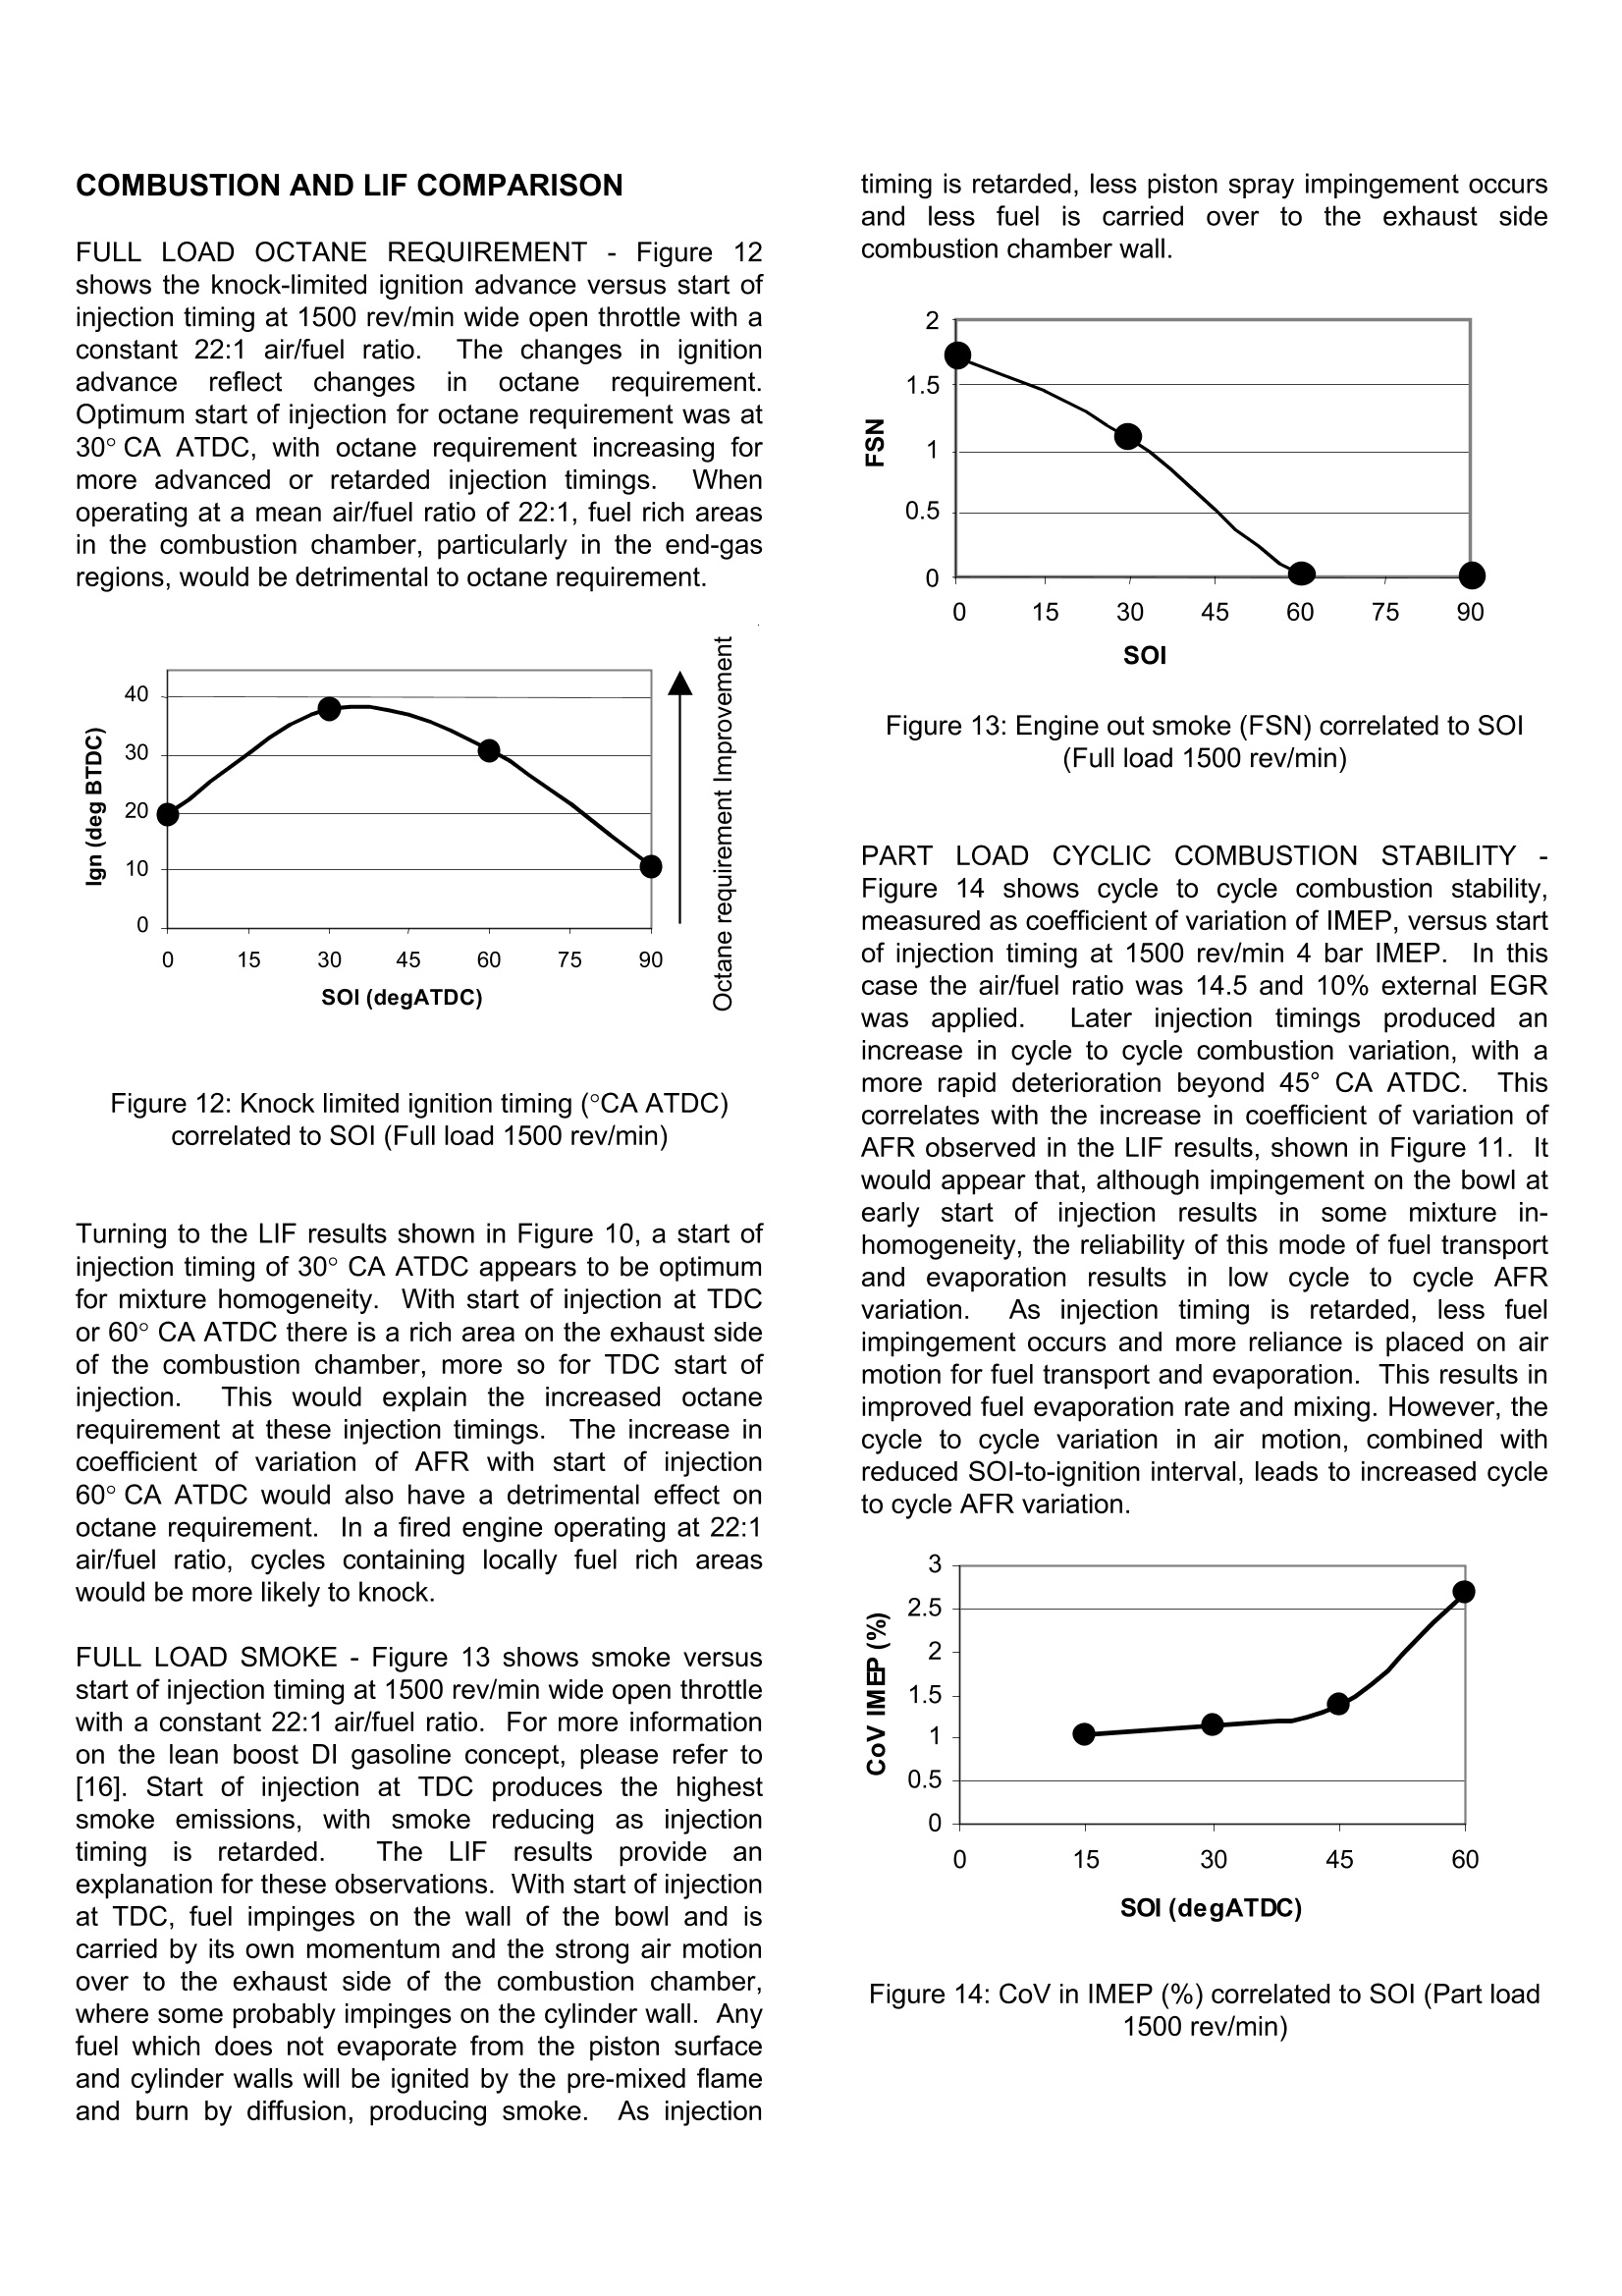
2001-01-0968 Air-Fuel Mixing in a Homogeneous Charge DI Gasoline Engine Martin Gold, John Stokes, Robert Morgan RicardoMorgan Heikal, Guillaume de Sercey, Steve Begg ABSTRACT For optimum efficiency,the direct injection (DI) gasolineengine requires two operating modes to cover the fullload/speed map. For lower loads and speeds, stratifiedcharge operation can be used, while homogeneouscharge is required for high loads and speeds. This paperhas focused its attention on the latter of these modes,where the performance is highly dependent on the qualityof the fuel spray, evaporation and the air-fuel mixturepreparation. Results of quantitative and qualitative Laser InducedFluorescence (LIF))measurementsare presented,together with shadow-graph spray imaging, made withinan optically accessed DI gasoline engine. ‘These arecompared with previouslyyacquired air flowmeasurements, at various injection timings, and withengine performance and emissions data obtained in afired single cylinder non-optical engine, having anidentical cylinder head and piston crown geometry. INTRODUCTION The introduction of direct injection (DI) gasoline enginesinto the market place has been a consequence ofcontinued pressure to improve fuel economy and reduceco, emissions, occurring firstly in Japan [1,2]* and morerecently in Europe. The majority of published researchon DI gasoline combustion systems has focused onunderstanding mixture preparation under late(compressionsstroke)injection, stratified operatingconditions [3, 4, 5]. Equally important are the processesinvolved in producing a homogeneous charge with early(intake stroke) injection timing. Mixture quality underthese conditions is important for low octane requirement,low smoke, low cyclic torque variation and high full loadair utilisation. Previous work by the authors and colleaguesnhasexamined in-cylinderr airirmotionandfuelspraycharacteristics [6, 7, 8, 9]. The work described in thispaper continued these studies to examine in-cylindermixture formation under early injection conditions usingoptical visualisation andfluorescencetechniques,including calibrated LIF measurements of air/fuel ratio.The results were related to engine performance bycomparing with non-optical fired engine combustion dataobtained under similar operating conditions. OBJECTIVES The objectives of the work described within this paperare to: ●FPerformniquantitative laser induced fluorescencemeasurements within a Dl gasoline engine Measure and compare the in-cylinder fuel distributionfor a series of injection timings Examineandassess the mixture formationprocesses by comparing the LIF fuel distributionresults with previous air flow measurements Investigate the correlation between mixture formationprocesses and combustion data results TECHNICAL APPROACH ENGINE CONFIGURATION -The present analysis hasfocused on the homogeneous charge operating mode ofa top-entry Ricardo DI gasoline engine ((Table 1 andFigure 1). Previous investigations have centered on theexperimental examination of the in-cylinder air flow usingboth the ‘dynamic flow visualisation rig'(DFVR) and in-cylinder laser Doppler anemometry, within the presentoptical engine, plus comparisons and analysis of phaseDoppler anemometry, spray imaging and qualitative LIFdata. Subsequent comparison of the experimental datawith the computational fluid dynamic software (VECTIS)has shown good correlation [8]. Engine speed 1500 rev/min Bore 74.0 mm Stroke 75.5 mm Intake valve opening 16°BTDC (intake) Intake valve closing 52°ABDC (intake) Exhaust valve opening 54°BBDC (exhaust) Exhaust valve closing 18°ATDC (intake) Max valve lift 8.1 mm Table 1: Engine parameters Figure 1: Schematic of engine configuration lN-CYLINDER DIAGNOSTIC TECHNIQUES- In thepresent experiments, the techniques of shadow-graphspray imaging [10] and laser induced fluorescence (LIF)[11,12,13,14,15] have been employed to investigate thein-cylinder air/fuel mixing for the DI gasoline operatingconditions under investigation. Figure 2a illustrates the arrangement used within theoptical research engine for the LIF technique. The lasersheet is introduced along the engine mid-cylinder planeand is produced and optimised for the fourth harmonic ofthe pulsed Nd:YAG laser (266 nm, ultra-violet) by aseries of cylindrical lenses. The result is a laser sheet ofheight 20 mm and thickness 1 mm, which is collimatedwithin the test section, critical to the accuracy of anyquantitative experiments. The laser has been tuned bythe manufacturer to work with a repetition rate12.5 Hz.correspondingg to ann enginespeed:d1500 rev/min. The resultingfluorescence signalimaged onto a CCD camera (1268x1024) mounted in anorthogonal plane (Figure 2b) presenting a‘2D'slice of in-cylinder. informationfrozenilrn time.Sincethefluorescence is weak and short-lived, it is imaged on agatedl intensified camera, hhaving the advantage of enhancing the intensity of fluorescence and recordingonly during its short lifetime, therefore eliminating a lot ofambient illumination. AAsS theewavelength ofthefluorescence image is Stokes shifted, it can be easilyseparated from the excitation energy by an appropriateband pass filter. Continuous measurement through oneinjection or engine cycle is precluded by a maximumrepetition rate of the camera/intensifier and lasercombination of 4 Hz. A picture of the air/fuel mixingprocess must therefore be built from several imagedcycles. Figure 2a : Photograph of experimental layout Figure 2b: Photograph of experimental optical access A fuel-tracer mixture was used for the LIF measurementsand comprised 95% iso-octane with 5% acetone byvolume; this mixture sdcalibrated prior to anyquantitative in-cylinder mixture measurement. Acetone was used as the fluorescent tracer due to its lowsensitivity to pressure and temperature quenching, henceminimising errors through cycle-to-cycle variations inthese parameters, plus its high quantum yield and boilingpoint of 56 C. Since the present experiments have beenconducted within a motored engine, spray impingementwill occur upon a relatively cold piston. The low boilingpoint of acetone will facilitate evaporation under theseconditions, hence offering a closer simulation of firedengine mixture preparation conditions. Quantitative LIF requires extensive calibration of thecorrelation between the fluorescence signal and local fuelconcentration, before in-cylinder air/fuel ratios can bederived. In the present application this calibration wasperformed within the optical engine, while motoring theengine and employing a unique closed-loop approach. The major benefits of the closed-loop in-cylinder LIFcalibration are: identical transmitting and receiving optical paths incalibration and experiment precise: matching of thein-cylinderphysicalconditions for each crank-angle direct air/fuel ratio comparison for each crank-angle variations in the laser sheet energy density, opticaldistortion and reflections can be filtered. (A more detailed description and discussion of thiscalibration technique will be presented in a future SAEpaper). Figure 3: Photograph of optical cylinder head While a standard cylinder head in conjunction with a20 mm fused silica annulus was used for the LIF work, aseparate dedicated cylinder-head with pent-roof opticalaccess was available for the shadow-graph imaging(Figure 3). This technique allows a quick fuel sprayanalysis as opposed to a laser sheet where several 2Dplane data sets are required for a 3D analysis. A halogen lamp was placed diametrically opposite thecamera, illuminating the combustion chamber. In thisway, the injected spray obscures the transmission of thelight to the camera and forms a shadow. A high speedintensified CCD camera (IMACON 468) having a spatialresolution per channel of 576x385 was employed toobtain the data. After an initial crank angle derived TTLtrigger it was able to acquire up to eight consecutiveimages with inter-frame spacing down to 10 ns. Theoperating conditions for the shadow-graph spray imagingand the LIF tests are summarised in Table 2. Start of Injection End of Injection Engine speed TDC 61°CA ATDC 1500 rev/min 30°CA ATDC 91°CA ATDC 1500 rev/min 60°CA ATDC 121°CA ATDC 1500 rev/min Table 2: Optical engine operating conditions for theshadow-graph spray imaging ENGINE COMBUSTION TESTS - Combustion testingwas conducted in an engine geometry identical to theoptical engine analysis, as part of an investigation into alean boost DIgasoline concept[16]. The testingconsisted of globally lean air/fuel ratios, rather than therich air/fuel ratios used in the optical engine. However,the behaviour of the air and the fuelspray in bothengines are comparable. Combustion data collectedconsisted off in-cylinder pressure,(derivedIMEP.coefficient of variation (CoV) of IMEP, mass fractionburned and smoke. The fired engine operating conditionsare outlined in table 3. Start of injection (°CA ATDC) Engine load Engine speed (rev/min) Full 4 bar IMEP X 1500 15 X 1500 30 X X 1500 45 1500 60 1500 90 1500 Table 3: Fired engine operating conditions RESULTS AND DISCUSSION MIXTURE FORMATION In-Cylinder Spray Visualisation - Prior to the analysis ofthe fuel/air mixing processes with LIF, the in-cylinderspray structure was investigated for the full load conditionof SOl at 60°CA ATDC and an engine speed of1500 rev/min. Figure 4 shows a sequence of imagesillustrating the effects of the intake air motion on theinjected spray during the early stages of injection, themid-phase, corresponding to the injector’s steady statecondition, and finally the closing stage. The DI injector spray can be initially seen to enter thecylinder at 65° CA ATDC with a narrow pencil structurehavinagcai high penetrationnvelocity (approximately120 m/s). Between the opening and closing transientinjectionflowperiods,the mid-injectionl canbeconsidered as a steady state flow condition. During thisphase the injected spray can be seen to develop into anarrow angled hollow cone structure. Since the techniquerelies upon the obscuration of light passing through theliquid droplets, the hollow structure can be easilyidentified by the two darker regions representing the topand bottom surfaces of the cone. Figure 4: Visualisation of injected sprays(SOI @ 60° CA ATDC) During the studied injection period of 60 -121° CA ATDC,the two events of maximum piston speed and maximumvalve lift will occur. The resulting intake air mass flow willconsequently be at a maximum during the injectionevent. From the characterisation of the air motion on the cylinder centre-line using the DFVR, it was shown that airvelocities of greater than 20 m/s are present on theintake side during this period. The injector is positionedbetween and directly below the intake valves, where thetwo air-steams from each valve will meet, creating anarea of high turbulence and flow fluctuation. This highvelocity perturbating air flow will have a direct impactupon the injected fuel. Once the spray has become fullyestablished, shown in the timings of 80° CA ATDC and105° CA ATDC, the spray can be seen to be deflected,indicating reverse tumble influence on the small fueldroplets. A greater degree of break-up can be seen onthe upper edge of the injected spray, since this is theintake air/spray interface. Evidence of this upper edgevariability was previously noted in [6]. Further tests at thelower engine speeds of 1000 rev/min and 500 rev/minindicated reducing degrees of spray deflection andbreak-up due to the overall lower intake air velocities andconsequential lower levels of turbulence. At 125°CA ATDC the closing stages of the injectionprocess are represented (Figure 5), with evidence of amore significant degree of spray structure break-up. Thelower droplet velocities present during these latter stageswill result in the air motion being the dominant drivingforce. High speed video taken under the same injectionconditions showed similar highly variable injection spray,plus entrainment of smaller droplets which are carriedinto the cylinder centre. For homogeneous operation,interactions between the air and dropletscan befavourable in the mixing process, although the highcycle-to-cycle variability could ultimately provedetrimental to the combustion stability, even at theseearly crank angles. Table 5: Example of typical injection electronic pulse andfuel flow rate profiles (SOI @ 60°CA ATDC) Local Air/Fuel Ratio Measurements - In order to offerexplanations for the mixture formation processes forvarious injection timings within the DI engine, the LIFdata has been calibrated to provide the local air/fuelratios across the cylinder centre-line. These results willcompliment the explanations offered for the air / sprayinteractions in the previous results. Since the tracer LIFtechnique displays information on the fuel concentration,a very strong signal will be gathered in the presence ofliquid fuel, which could damage the image intensifier. Inthe present experiments the camera, intensifier and lensparameters have been optimised for analysis of fuel vapour, hence the earliest image acquisition is 15°CAafter the end of the respective injection. The relationship between the LIF mixture measurementsand the air flow data gathered using the DFVR has beenanalysed to lend support to the LIF data and thecorresponding mixture formation mechanism analysis.Figure 6 shows the mixture distribution and the CoV ofmixture distribution compared to air flow at 90° CA ATDCfor SOl atTDC. In Figure 6a, a rich region withequivalence ratio values between 1.2 and 1.8 can beseen on the exhaust side of the chamber. It appears tohave been deflected off the piston bowl and transportedwithin the prevailing flow out of the piston bowl into theexhaust side re-circulation region. The high air velocityentering through the intake valves has resulted in adilution of the mixture in the under valve area, down toequivalence ratio values of less than 0.5. There is adistinct division between this lean region and the richregion which correlates with the shear layer between thepiston bowl jet and the intake air flow. From the spraydata, the highly turbulent air flow was seen to causespray break-up. The corresponding CoV in the mixturestrength (Figure 6b) indicates a similarly high level ofcycle-to-cycle variation. The lean mixture can be seen tohave a CoV of up to 25% in this under valve region. Thetrajectory of the mixture jet from the bowl exit willadditionally be influenced by the cycle-to-cycle variabilityof the intake air flow. This has also been captured by theregion with a mixture strength CoV of up to 10% lyingwithin the piston bowl jet velocity vectors. An injection timing swing was performed to aid theunderstandingoff the differenttmixture formationprocessespresent during the DI gasoline enginehomogeneous charge operating mode. The initial seriesof images acquired 15° CA after the end of injection foreach of the injection strategies are shown in Figure 7.Figure 7a compliments the result shown in Figure 6 witha rich region emanating from the lip of the piston bowl.However, the overall equivalence ratio levels are higherthan in Figure 6 due to less mixture dilution by the intakeair. At 105°CA ATDC, for an SOl of 30° CA ATDC, themixture strength can be seen to be globally lean as aresult of the reduced piston impingement for this injectiontiming, such that the injected fuel has passed through themeasurement plane by this time. Conversely the SOltiming of 60°CA ATDC still has a strong mixturepresence on the intake side of the combustion chamber;an equally rich region is also evident in the exhaustregion. The explanation for the injection tail can bederived from the spray break-up evident in Figure 4,entraining liquid fuel droplets in the under valve regionand hence the high liquid portion fluorescence signal.While the fuel presence on the exhaust side of thechamber was shown to come out of the bowl for theinjection timing starting at TDC, with the strategy of SOlat 60°CA ATDC the piston will be too far down the boreto have a similar influence. Under these conditions it isproposed that the fuel spray has impinged upon the exhaust side cylinder wall, and rolled up into the upperpart of the combustion chamber due to the bulk chargemotion. Cycle-to-cycle variability in mixture strength is illustratedin Figure 8 by the CoV in the LIF measurements, whereall three injection timings show regions of variabilityabove 25%. Figure 8a illustrates the variability intransportation of fuel mixture out of the piston bowl, withevidence of the influence of the intake air flowperturbation in the under valve region. A similar underintake valve variability is seen in Figure 8b for the SOltiming of 30° CA ATDC. As the injection timing isretarded to 60° CA ATDC the level of spray break-up andentrainment has increased due to the increased intakeair mass flow and variability. Cycle-to-cycle variation ofover 25% on the exhaust side indicates the extent ofinjection roll-up into the upper regions of the chamber. Moving through the stroke, Figure 9 shows the mixturedistribution for the three injection timings, at intake BDC,superimposed with the DFVR air-flow measurements.For the two earlier timings, a higher equivalence ratio canbe seen in the central region of the upper cylinder due tothe fuel/air mixture carried in the reverse tumble vortexout of the piston bowl. For the timing of SOI at TDC, therich region has been drawn into the lower cylinder withthe prevailing air motion. Conversely the upwardlymoving injection roll up for SOI at 60°CA ATDC is stillevident at BDC due to both its upward motion and thereduced time between end of injection and BDC whencompared to SOl at TDC. Since the piston geometry interferes with the laser sheetfor crank angles after 280° CA ATDC this timing is thelatest in-cylinder mixture distribution presented, and isshown in Figure 10. The rich region carried into the lowerpart of the chamber for the SOl at TDC can be seen tore-appear on the exhaust side during compression(Figure 10a). A more even global mixture distribution isevident in Figure 10b for SOl at 30°CA ATDC. Howeverthe reduced evaporation and mixing time has resulted inexhaust side enrichment for SOl at 60°CA ATDC due tothe initial injection roll-up region. Figure 11 illustrates the effect of reducing evaporationand mixing time available from the end of injection. Thelater start of injection (and hence end of injection due tofixed pulse width) shows an increasing level of cycle-to-cycle variability in the in-cylinder mixture strength. Thesevariability effects and the global mixture distributionprocesses will influence the combustion performance ofthe fired engine. The next section will address some ofthese effects. AFR(0) CoV Rich High 1.8 25% 20% 1.2 15% 10% 0.6 5% 0 0% Lean Low Figure 6 (a): Mixture distribution @ 90°CA ATDC for aSOI @ TDC; superimposed DFVR air-flow Figure 6 (b): CoV in the mixture distribution @ 90°CA ATDC for a SOI @ TDC; DFVR air-flow Figure 6: Comparison of in-cylinder mixture distribution and DFVR derived air-flow Figure 7: In-cylinder mixture distribution 15° CA after the end of injection Figure 8: CoV of in-cylinder mixture distribution 15°CA after the end of injection NB: Different scales have been used to maintain a visible contrast between the differing mixture strength regimeswithin the cylinder AFR (0) Figure 9 (a): Mixture distribution @ 180°CA ATDC for a SOI @ TDC withsuperimposed DFVR derived air-flow Figure 9 (b): Mixture distribution @ 180°superimposed DFVR derived air-flow Figure 9 (c): Mixture distribution @ 180°CA ATDC for a SOI @ 30°CA ATDC; with CA ATDC for a SOI @ 60°CA ATDC; withsuperimposed DFVR derived air-flow Figure 9: Mixture distribution @ 180° CA ATDC with superimposed DFVR derived air-flow AFR (Q) Rich 1.5 1.0 0.5 Figure 10 (a): Mixture distribution@ 280° CA ATDC for a SOI @TDC (orange=0-1.5) Figure 10 (b): Mixture distribution@ 280° CA ATDC for a SOI @30° CA ATDC ( range=0- 1.5) 0 Lean Figure 10: Mixture distribution @ 280° CA ATDC LoW Figure 11: CoV in the mixture distribution @ 280° CA ATDC NB: Different scales have been used to maintain a visible contrast between the differing mixture strength regimeswithin the cylinder COMBUSTION AND LIF COMPARISON FULL LOAD OCTANE REQUIREMENT - Figure 12shows the knock-limited ignition advance versus start ofinjection timing at 1500 rev/min wide open throttle with aconstant 22:1 air/fuel ratio.0.The changes in ignitionadvancereflect changes inoctaneerequirement.Optimum start of injection for octane requirement was at30° CA ATDC, with octane requirement increasing formore advanced or retarded injection timings.Whenoperating at a mean air/fuel ratio of 22:1, fuel rich areasin the combustion chamber, particularly in the end-gasregions, would be detrimental to octane requirement. Figure 12: Knock limited ignition timing (°CA ATDC)correlated to SOI (Full load 1500 rev/min) Turning to the LIF results shown in Figure 10, a start ofinjection timing of 30° CA ATDC appears to be optimumfor mixture homogeneity. With start of injection at TDCor 60°CA ATDC there is a rich area on the exhaust sideof the combustion chamber, more so for TDC start ofinjection.This would explain the increased octanerequirement at these injection timings.TThe increase incoefficient of variation of AFR with start of injection60° CA ATDC would also have a detrimental effect onoctane requirement. In a fired engine operating at 22:1air/fuel ratio, cycles containing locally fuel rich areaswould be more likely to knock. FULL LOAD SMOKE - Figure 13 shows smoke versusstart of injection timing at 1500 rev/min wide open throttlewith a constant 22:1 air/fuel ratio. For more informationon the lean boost DI gasoline concept, please refer to[16]. Start of injection at TDC produces the highestsmoke emissions, with smoke reducingg as injectiontiming is retarded. The LIF resultsprovide anexplanation for these observations. With start of injectionat TDC, fuel impinges on the wall of the bowl and iscarried by its own momentum and the strong air motionover to the exhaust side of the combustion chamber,where some probably impinges on the cylinder wall. Anyfuel which does not evaporate from the piston surfaceand cylinder walls will be ignited by the pre-mixed flameand burn by diffusion, producing smoke. As injection timing is retarded, less piston spray impingement occursand less fuel is carried over to the exhaust sidecombustion chamber wall. Figure 13: Engine out smoke (FSN) correlated to SOI(Full load 1500 rev/min) PART「LOAD CYCLIC COMBUSTIONSSTABILITY -Figure 14 shows cycle to cycle combustion stability,measured as coefficient of variation of IMEP, versus startof injection timing at 1500 rev/min 4 bar IMEP. In thiscase the air/fuel ratio was 14.5 and 10% external EGRwas applied.l.Later injection timings produced anincrease in cycle to cycle combustion variation, with amore rapid deterioration beyond 45° CA ATDC. Thiscorrelates with the increase in coefficient of variation ofAFR observed in the LIF results, shown in Figure 11. Itwould appear that, although impingement on the bowl atearly start of injection results in some mixture in-homogeneity, the reliability of this mode of fuel transportand evaporation results in low cycle to cycle AFRvariation..As injection timing is retarded, less fuelimpingement occurs and more reliance is placed on airmotion for fuel transport and evaporation. This results inimproved fuel evaporation rate and mixing. However, thecycle to cycle variation in air motion, combined withreduced SOI-to-ignition interval,leads to increased cycleto cycle AFR variation. Figure 14: CoV in IMEP (%) correlated to SOI (Part load1500 rev/min) CONCLUSION The use of in-cylinder diagnostic techniques in a single-cylinder DI gasoline engine has revealed strongcorrelation between data from different optical techniquesand combustion performance. The following conclusionscan be drawn from the observations: ● The high velocity spray from a DI injector will bedeflected by intake air during the homogeneousoperating mode. ● Different injection timings result in different mixtureformation processes. Fuel vapour is carried out of the piston bowl by thereverse tumble air motion for early injection timings ● There is evidence of fuel spray impingement and’rolling-up’on the exhaust side cylinder wall for latertimings. Vaporised fuel is carried in the prevailing reversetumble air motion out of the piston bowl towards thespark-plug. This process is evident at 180°CA ATDCfor all injection timings. ● A start of injection of 30° CA ATDC offers optimummixture conditions for engine octane requirement.This can be explained by the areas of enrichmentevident at 280° CA ATDC for the SOI timings of TDCand 60°CA ATDC. ● As the time between injection and ignition increases,the variability in combustion stability improves, adirect consequence of increased time for fuelevaporation and air/fuel vapour mixing. ACKNOWLEDGMENTS The authors would like to thank the University of Brightonand Mr. R. Osborne (Ricardo) for providing data for thispaper and the EPSRC for the use of the IMACON 468CCD camera. We would also like to thank the directors ofRicardo Consulting Engineers for allowing the paper tobe published. REFERENCES 1.l.rKume T.; Iwamoto Y.; Lida K.; Murakami M.;Akishino K.; Ando H. (1996); “Combustion controltechnologies for direct injection SI engines.” SAEpaper 960600. .Ando H. (1996)“Combustion control technologies forgasoline engines," Proceeds IMechE conference -'Lean burn combustion engines’ S433/001/96. 3. Ekenberg M. and Bengt J., (2000);“Fuel Distributionin an air assist direct injected spark ignition enginewith central injection and spark plug measured withlaser-induced fluorescence", SAE paper 2000-01-1898 4. Sacadura J.C, Robin L., Dionnet F., Gervais D.,Gastaldi P. and Ahmed A. (2000);“Experimentalinvestigation of an optical direct injection Sl engineusing fuel/air ratio laser induced fluorescence", SAEpaper 2000-01-1794. 5. Zhao H, WilliamsJ Damiano L., BryceD..Ladommatos N and Ma T. (2000);“Optical engineand laser diagnostics for stratified charge andcontrolled auto-ignition combustion studies", IMechE- International conference on computational andexperimental methods in reciprocating engines, 1-2Nov 2000 6.. CComer M.A., Bowen P.J., Sapsford S.M. JohnsR.J.R.,(1998), “The transient effects of line pressurefor pressure swirl gasoline injectors”, ILASS 98,Manchester, July 1998. 7. Comer M.A., Bowen P.J., Bates C.J. Sapsford S.M.,“CFD modelling of direct injection gasoline sprays",ILASS 99, Toulouse, July 1999. 8..Faure M.A., Sadler M., Oversby K.K., Stokes J.,Begg S.M., Pommier L.S., Heikal M.R., (1998)“ A ofLDA and PIV techniques to the validation of a CFDmodel of a direct injection gasoline engine,” SAEpaper 982705. 9.1.Gold M., Li G., Sapsford S., Stokes J., (2000)“Application of optical techniques to the study ofmixture preparation in direct injectionngasolineengines and validation of a CFD model," SAE paper2000-01-0538 10. Arcoumanis C., Whitelaw J.H., Hentschel W. andSchindler K.P. (1994);“Flow and combustion in atransparent 1.9 litre direct injection diesel engine(I.Mech.E.Proceedings,,ParttD,JournalilofAutomotive Engineering, 1994, Vol. 208, No. D3,pp191-205.) 11. Seitzman and Hanson (1993), ,"Planar fluorescenceimaging in gases." Instrumentation for flows withcombustion, (1993), Academic Press Ltd, London, pp405-466 12. Baritaud T.A. and Heinze T.A. (1992) “Gasolinedistribution measurements with PLIF in a Sl engine,"SAE paper 922355. 13. Zhao and Ladommatos, (1998)“Optical diagnosticsfor in-cylinder mixture formation measurements in ICengines”, Progress in energy & combustion science,1998, pp297-336. 14. Ipp W., Wagner V., Kramer H, Wensing M., LeipertzA., Arndt S., Jain A.K., (1999);“Spray formation ofhigh pressure swirl gasoline injectors investigated bytwo-dimensional Mie and LIEF techniques"; SAEpaper 1999-01-0498 15. Gold M R, Arcoumanis C., Whitelaw J H, Gaade J.,andd Wallace .(2000);“mixturepreparationstrategies in 1 optical four-valve port-injectedgasoline engine.” International Journal of EngineResearch, 2000, Vol. 1, No. 1, pp41-56. 16. Stokes J., Lake T.H., Osborne R.J., "A GasolineEngine Concept for Improved Fuel Economy - TheLean Boost System", SAE paper 2000-01-2902 For optimum efficiency, the direct injection (DI) gasolineengine requires two operating modes to cover the fullload/speed map. For lower loads and speeds, stratifiedcharge operation can be used, while homogeneouscharge is required for high loads and speeds. This paperhas focused its attention on the latter of these modes,where the performance is highly dependent on the qualityof the fuel spray, evaporation and the air-fuel mixturepreparation.Results of quantitative and qualitative Laser InducedFluorescence (LIF) measurements are presented,together with shadow-graph spray imaging, made withinan optically accessed DI gasoline engine. These arecompared with previously acquired air flowmeasurements, at various injection timings, and withengine performance and emissions data obtained in afired single cylinder non-optical engine, having anidentical cylinder head and piston crown geometry.
确定
还剩7页未读,是否继续阅读?

产品配置单


北京欧兰科技发展有限公司为您提供《均质混合进气直喷汽油发动机中燃料和空气的混合检测方案(流量计)》,该方案主要用于汽车电子电器中热性能检测,参考标准--,《均质混合进气直喷汽油发动机中燃料和空气的混合检测方案(流量计)》用到的仪器有PLIF平面激光诱导荧光火焰燃烧检测系统、德国LaVision PIV/PLIF粒子成像测速场仪、汽车发动机多参量测试系统、激光诱导白炽光烟雾粒子成像分析仪(LII)、LaVision SprayMaster 喷雾成像测量系统


相关方案
更多
该厂商其他方案
更多