


采用LaVision公司特色的以高速图像增强器为核心部件构成的平面激光诱导荧光(PLIF)测试系统对透明单冲程压缩机用于均质混合进气压缩燃烧(HCCI)进行了实验研究。
方案详情

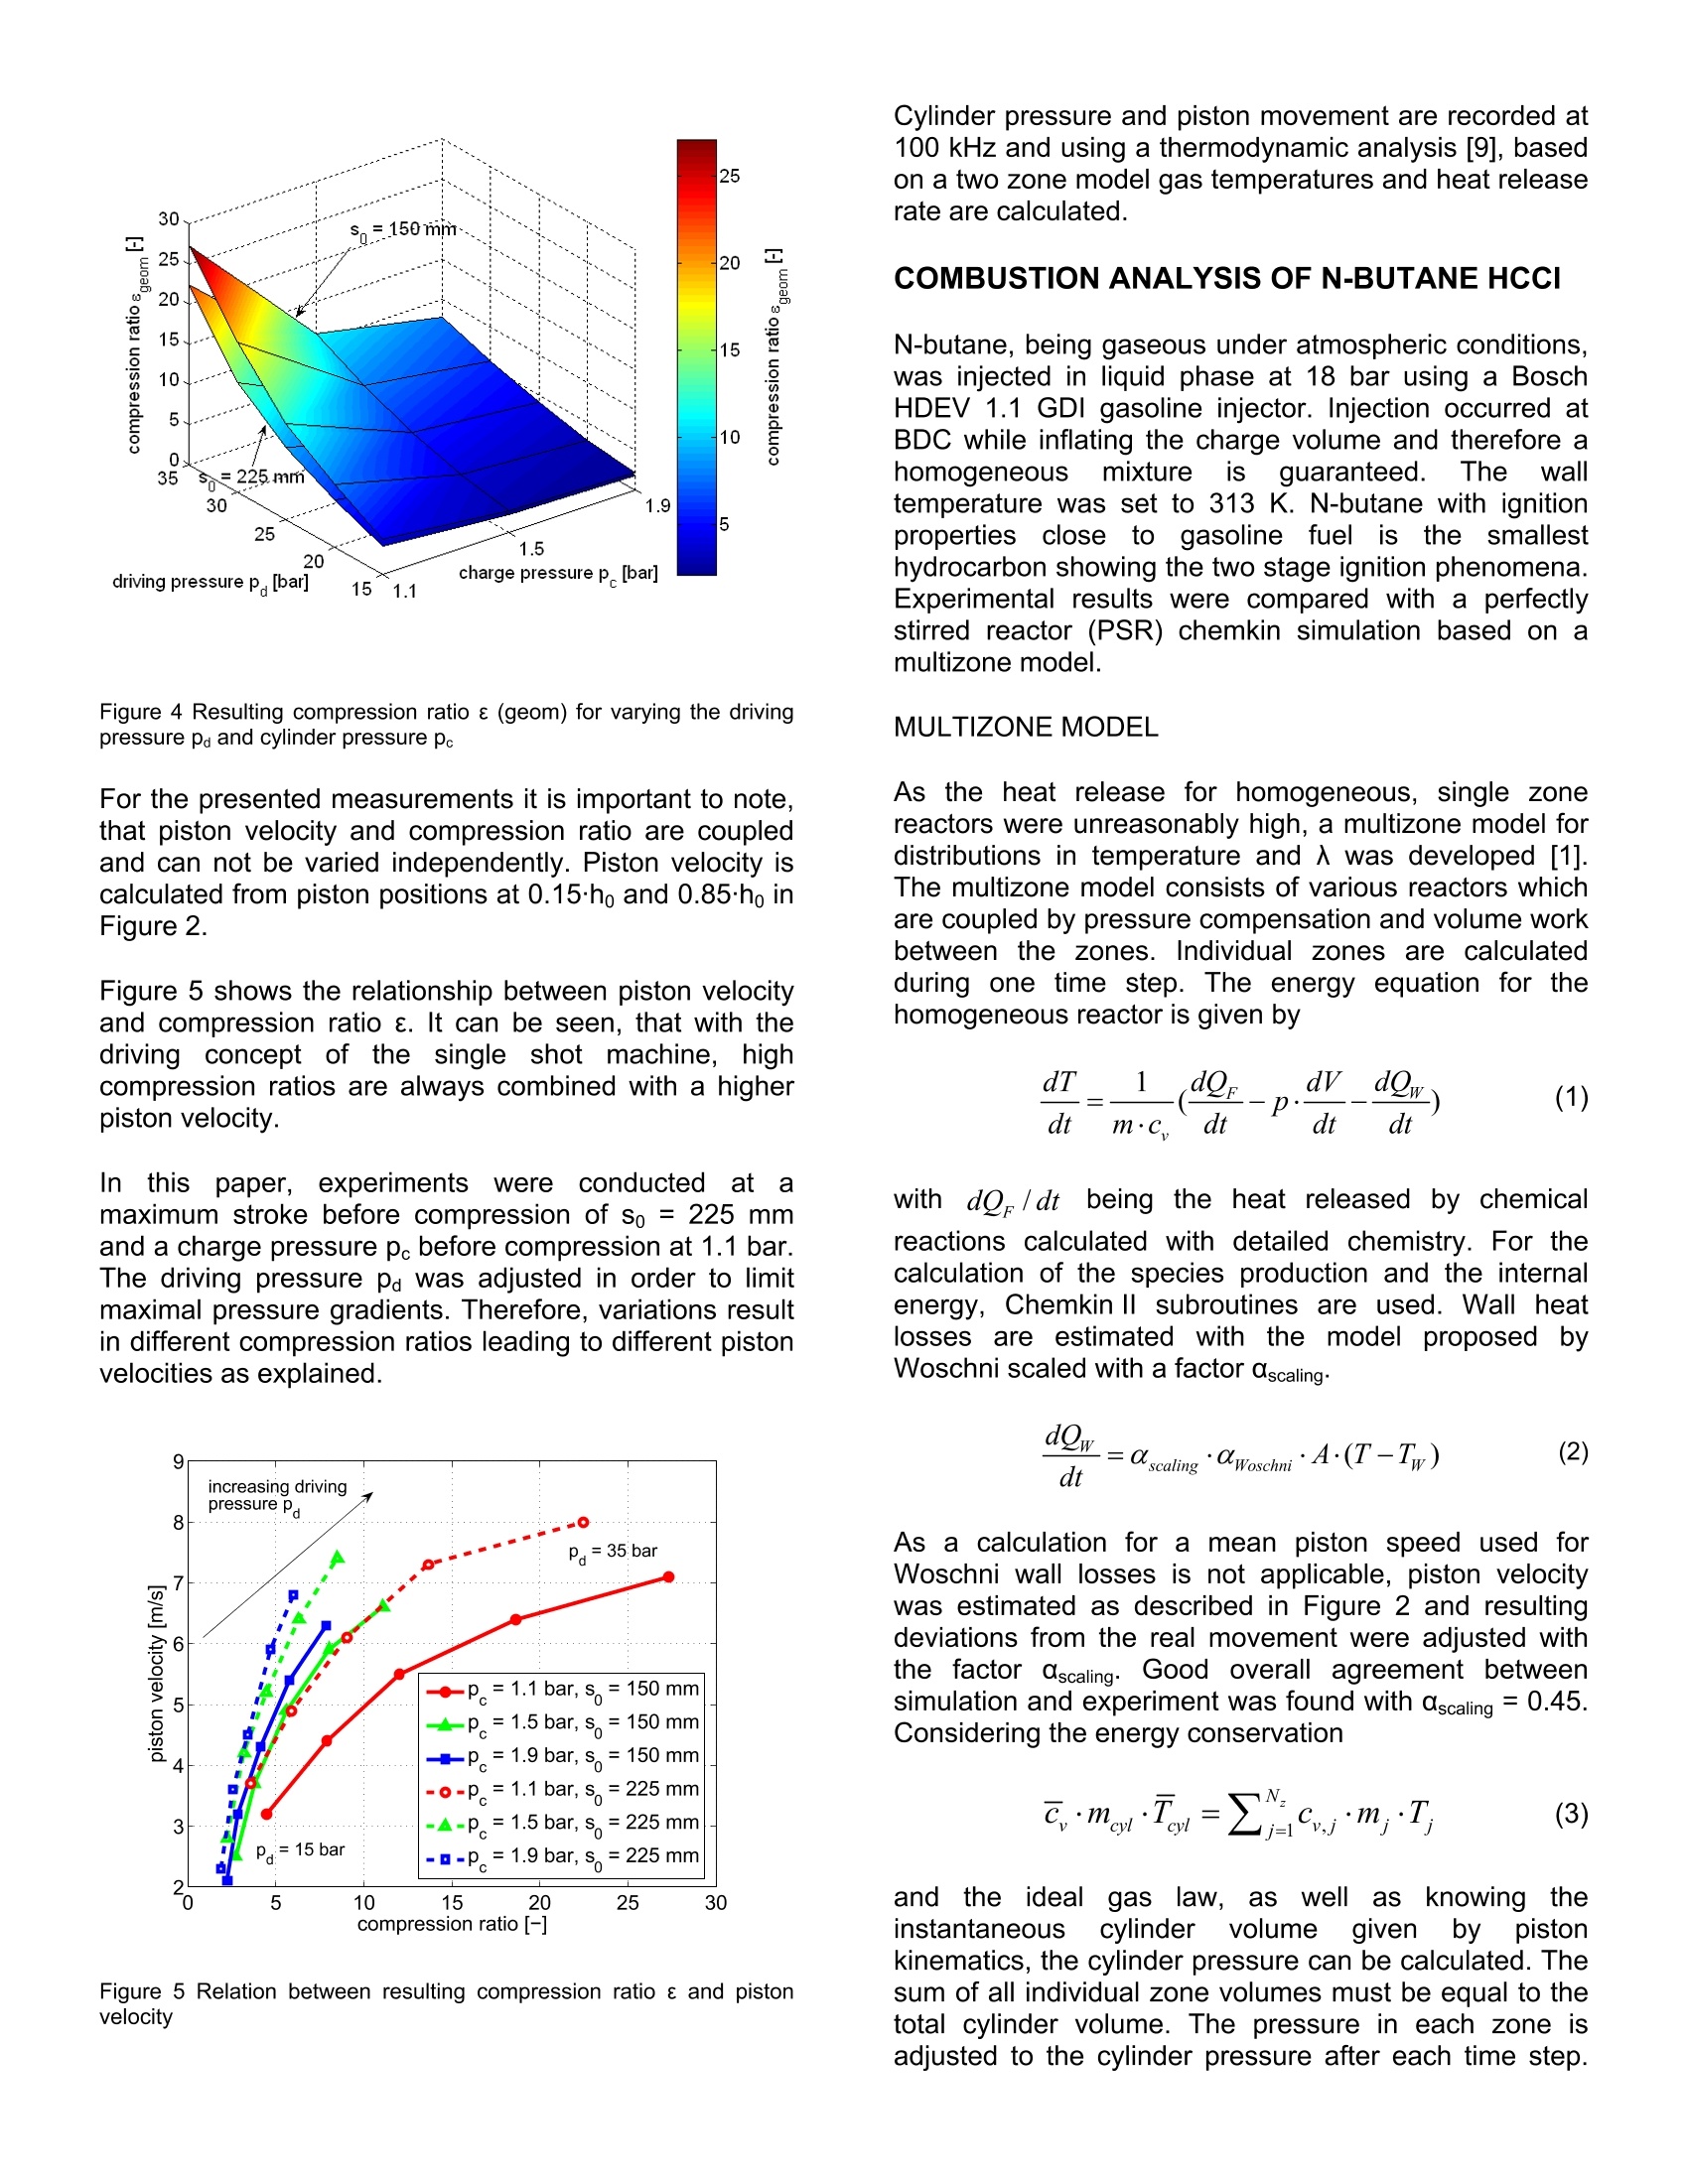
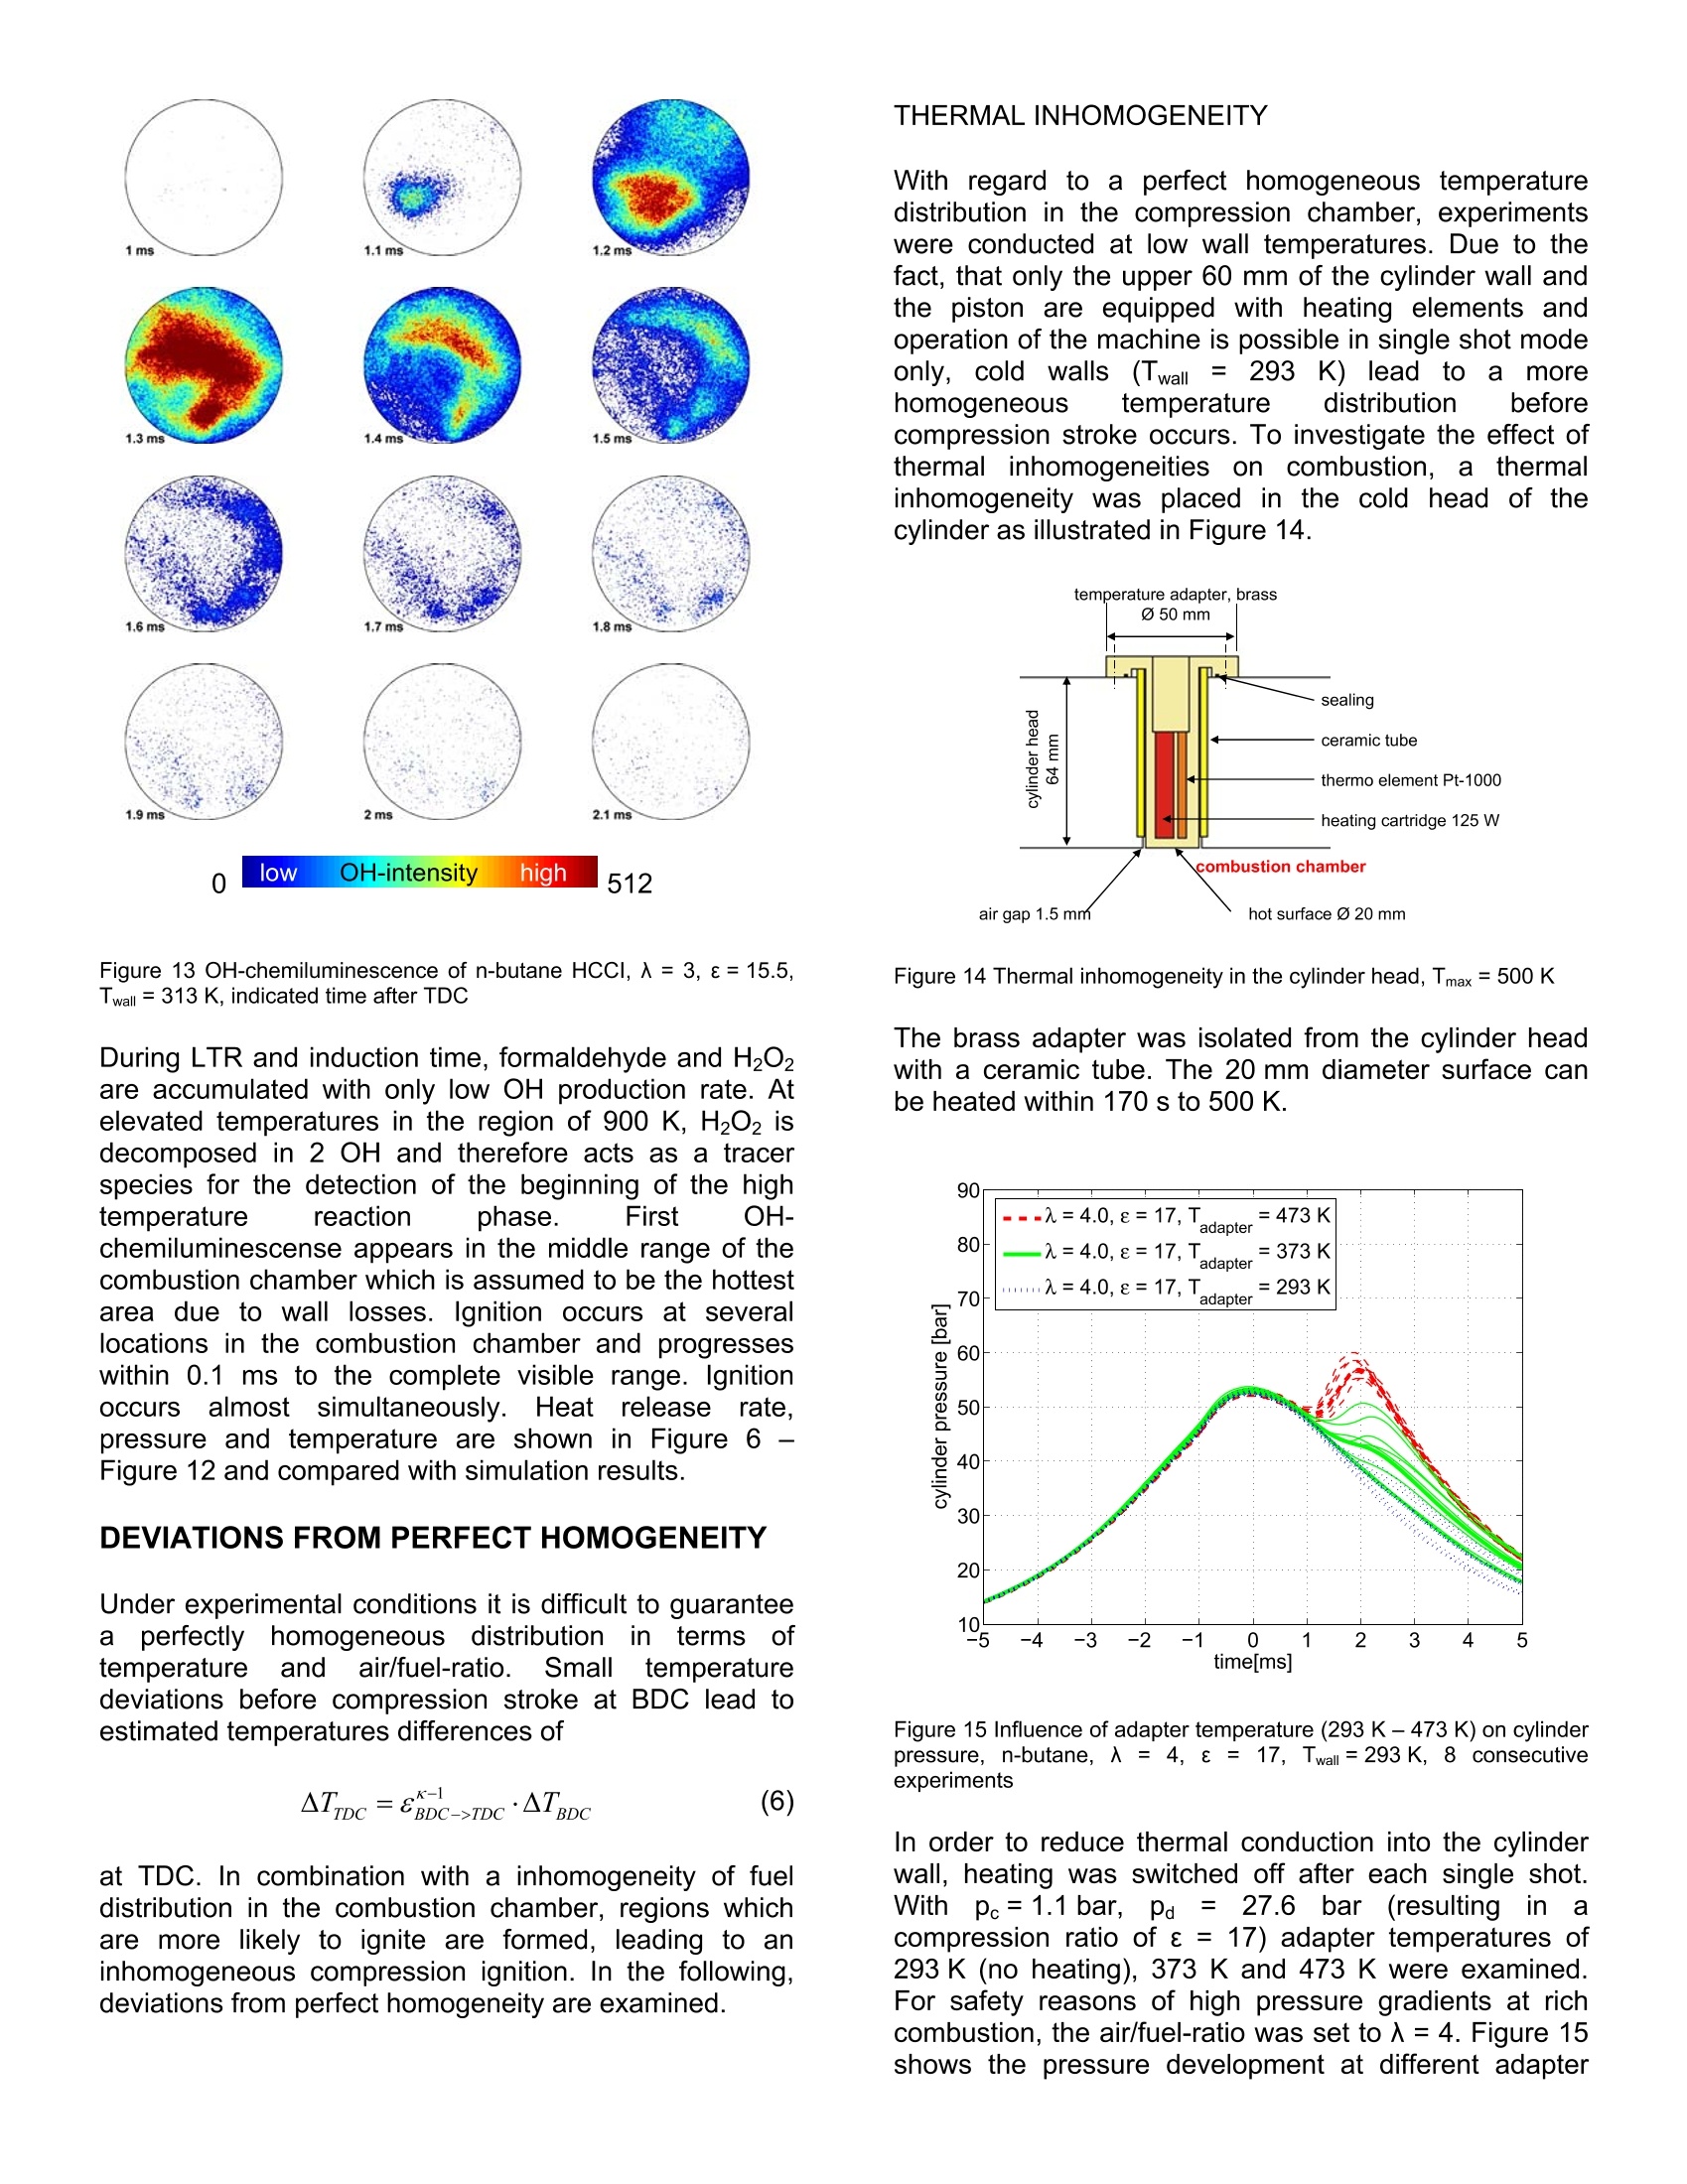
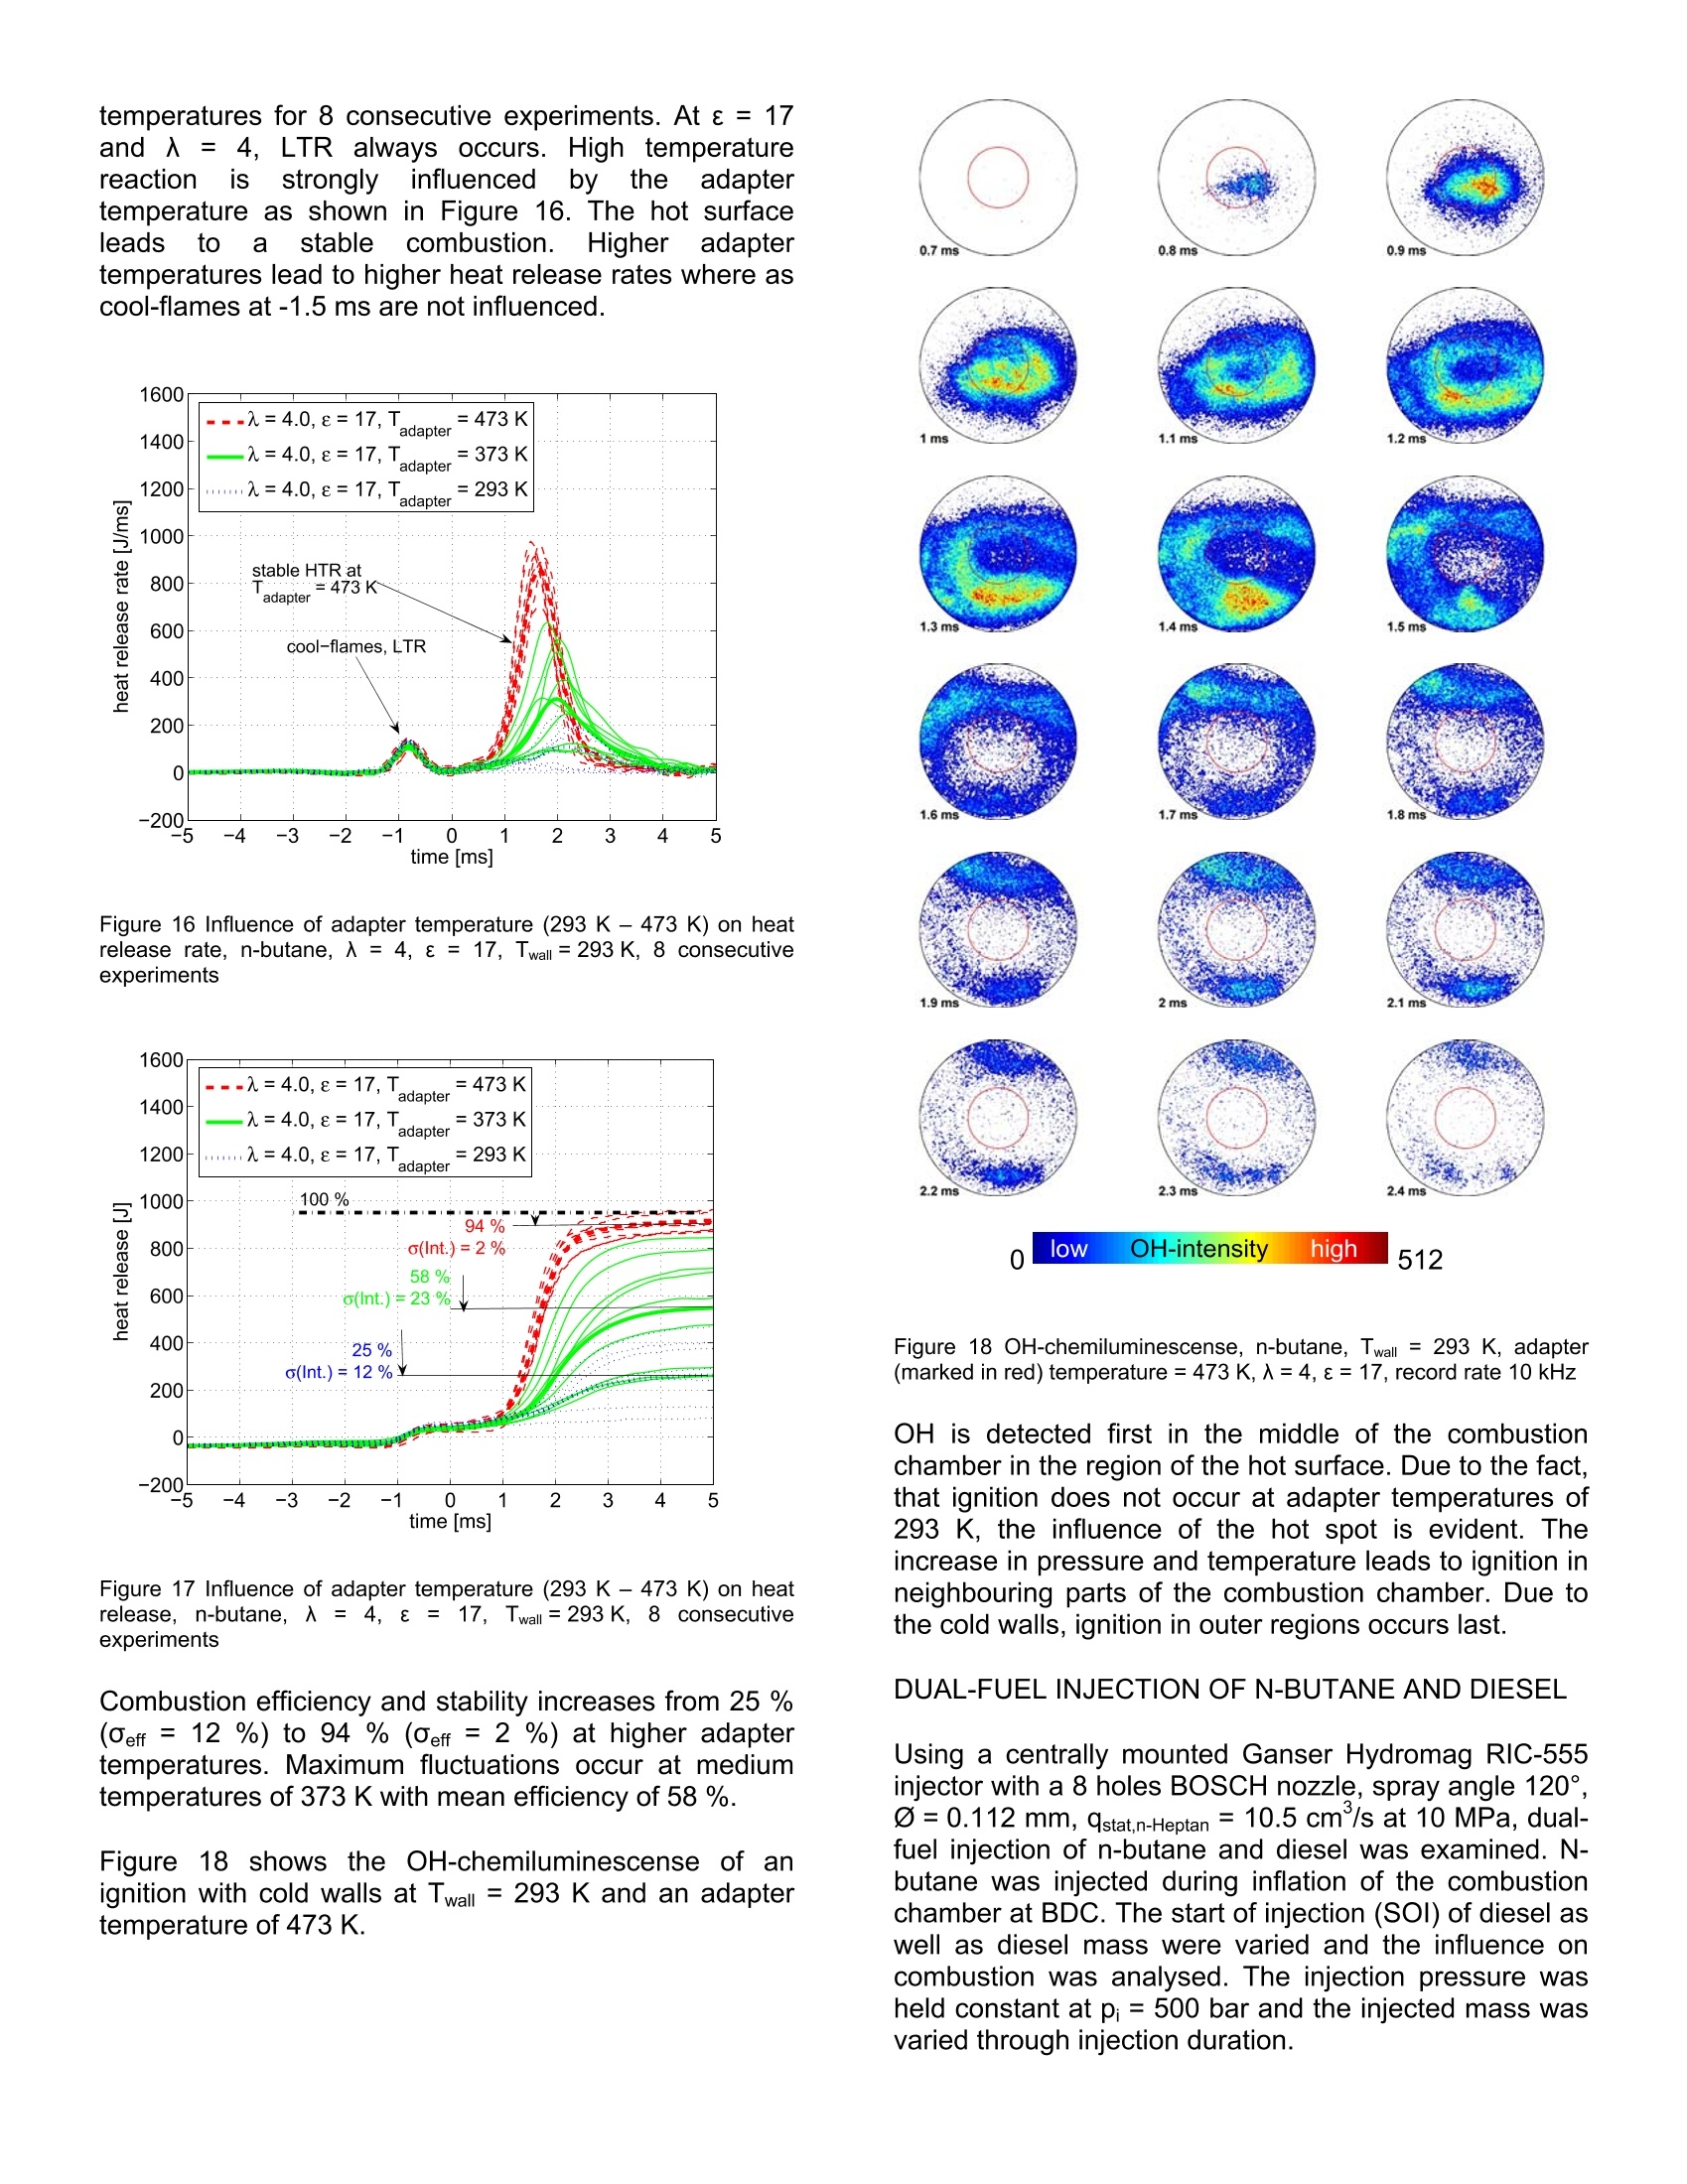
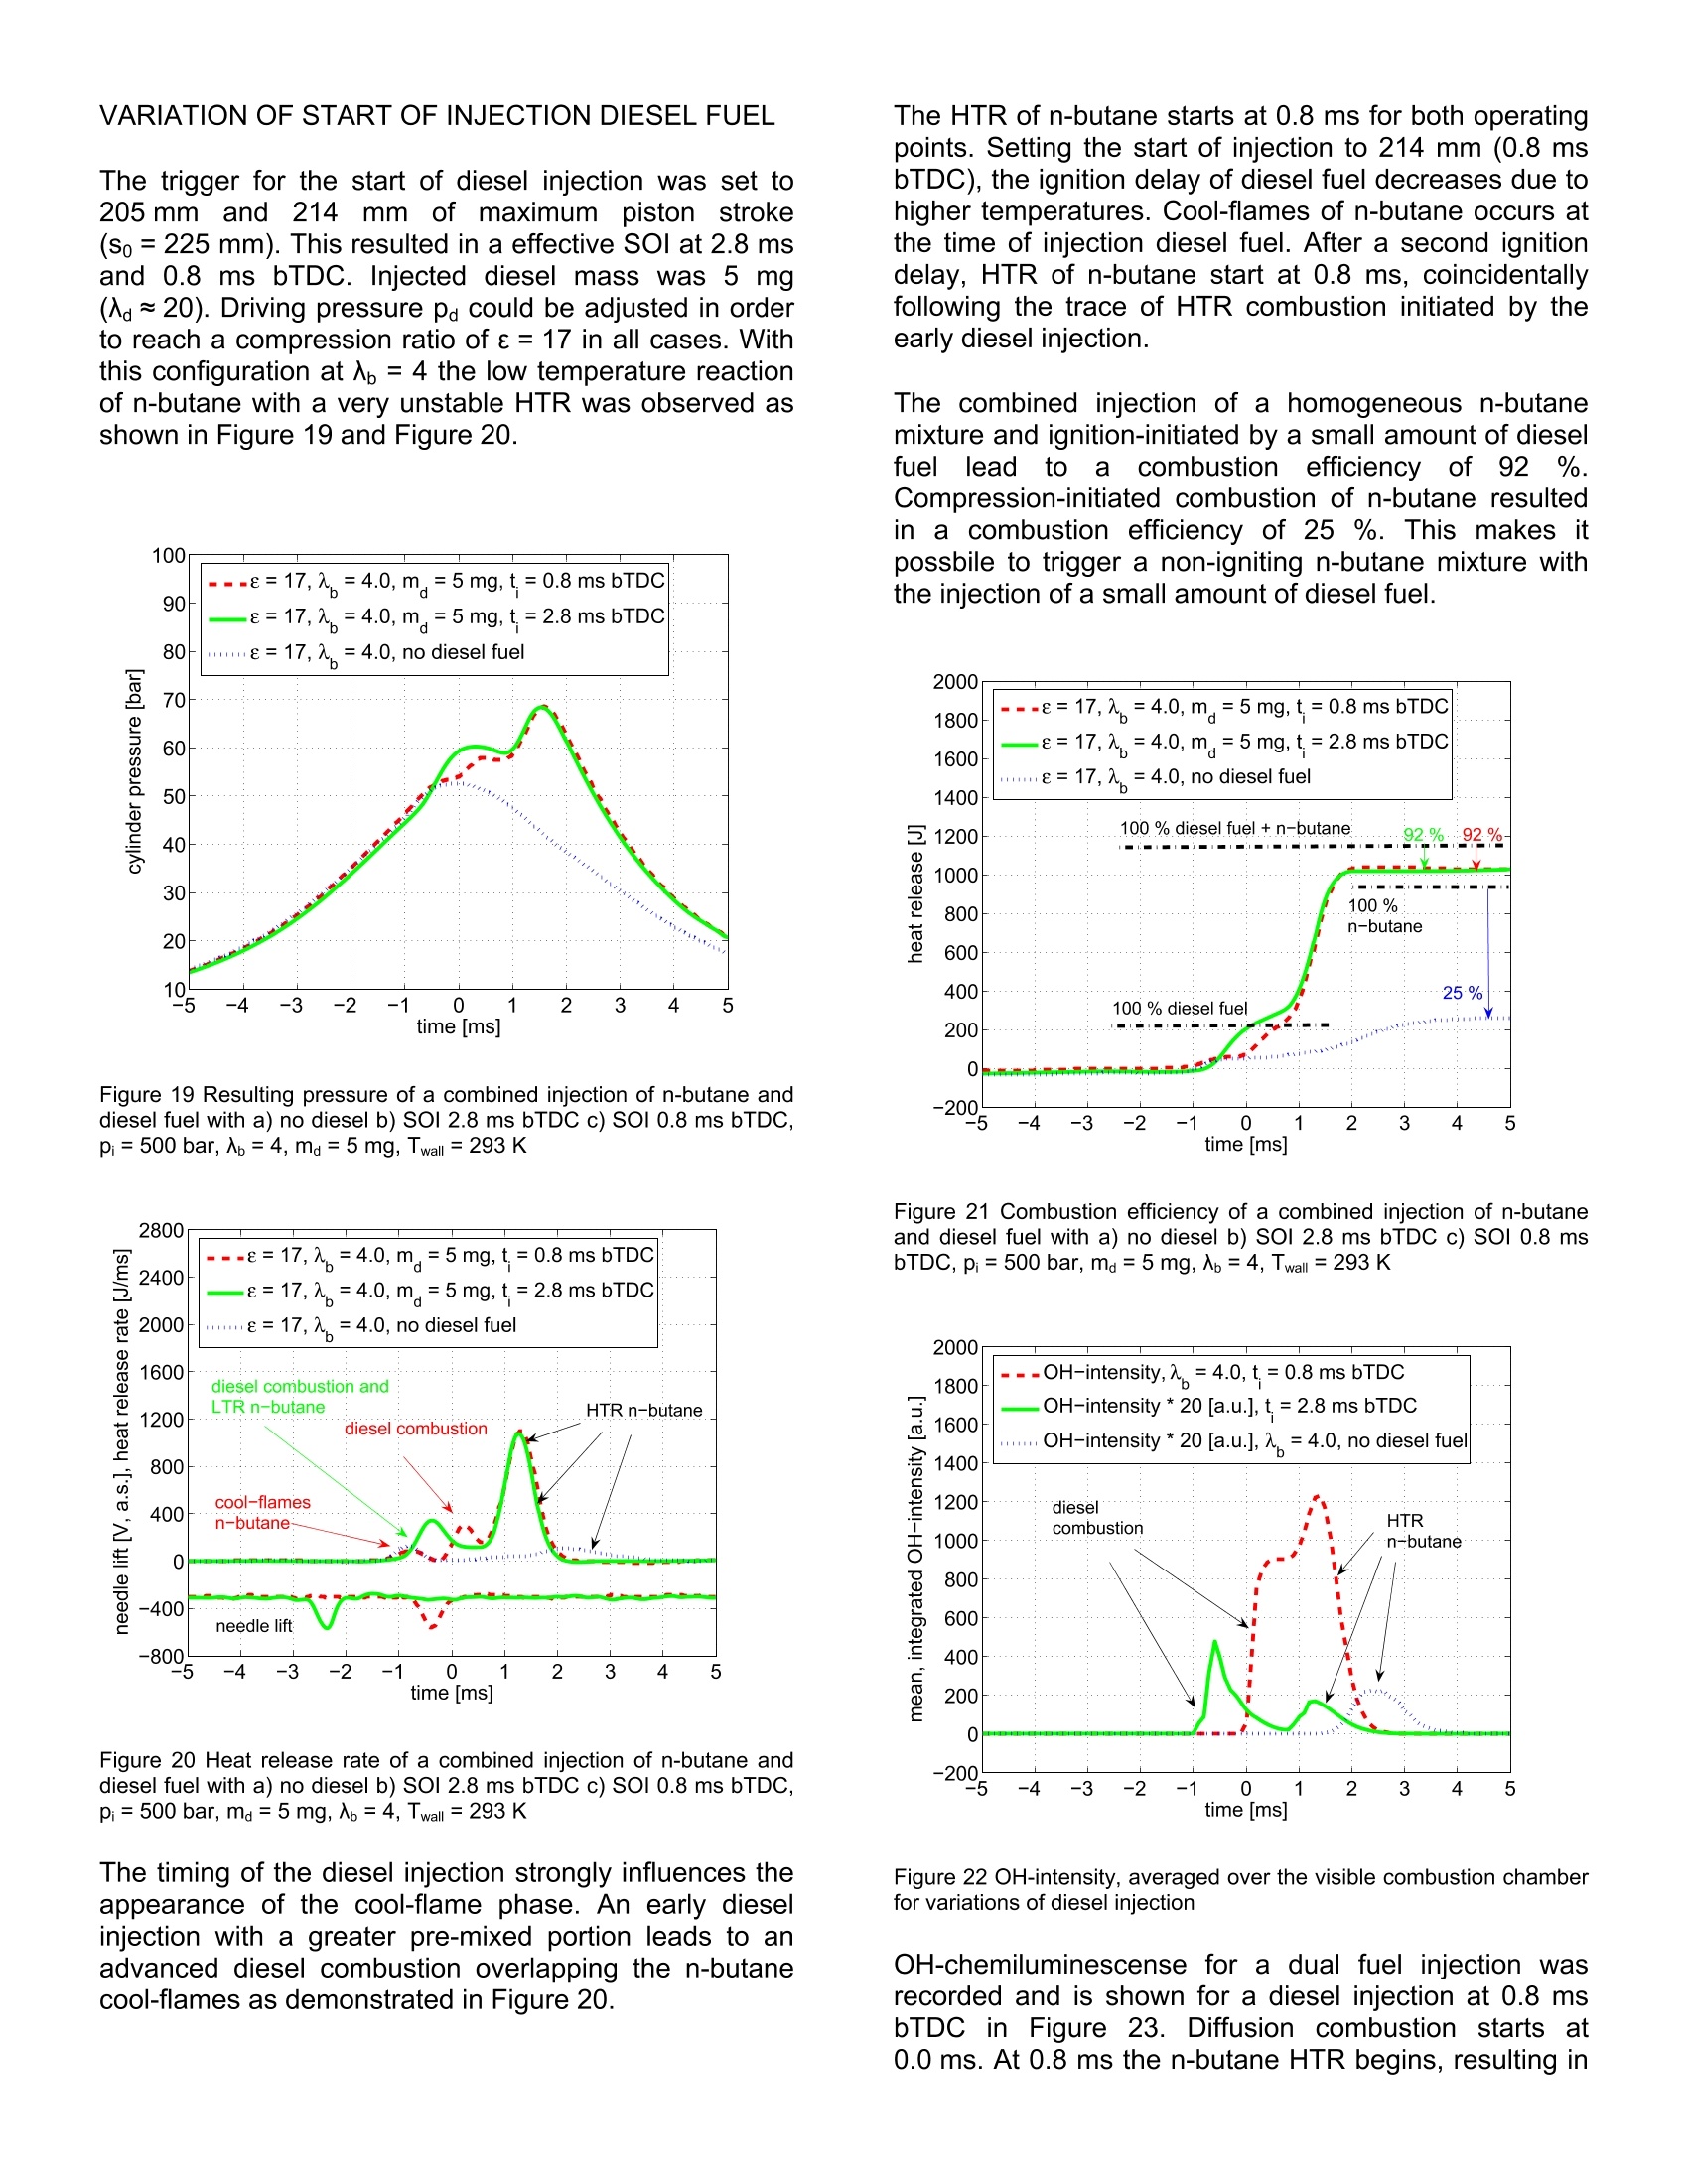
2007-24-0009 2007-24-0009 SAEInternational SAE TECHNICALPAPER SERIES Experimental Investigations using a TransparentSingle Shot Compression Machine for HCCI Combustion A. Escher, P. Kirchen, K. Boulouchos Swiss Federal Institute of Technology, Aerothermochemisity and Combustion Systems Laboratory CE2007 Capri, Naples Italv 8"InternationalConference September 16-20, 2007 nEnginesforAutomobile Experimental investigations using a transparent single shotcompression machine for HCCI-combustion A. Escher, P. Kirchen, K. Boulouchos Swiss Federal Institute of Technology, Aerothermochemisity and Combustion Systems Laboratory ABSTRACT In this study, experimental results of homogeneouscharge compression ignition HCCI of n-butane in asingle shotitmachineare presented. N-butanemeasurements are compared with a multizone model.Individual zones are calculated using a perfectly stirredreactor andl Chemkin chemistry. Theeinfluence oftemperature before combustion on heat release rate andduration of combustion is shown in a sensitivity analysis.Asaperfect homogeneoustemperature and fueldistribution are difficult to establish under experimentalconditions, deviations from perfect homogeneity areshown. The influence of a hot surface in the cylinderhead in terms of heat release rate and ignitability isexamined. Further, dual fuel injections of n-butane anddiesel are studied to trigger the n-butane ignition with adefined start of combustion. INTRODUCTION Due to the high compression ratio and overall leancombustion at part load, diesel engines have a highthermal efficiency.. In conventional diesel diffusioncombustion, as the speed of the chemical reaction isfaster than the speed of the mixing of the fuel and air,the combustionreactionnstarts near stoichiometricair/fuel- ratio and proceeds across a wide-ranging regionfrom lean to rich. NOx and soot are accordinglygeneratedand it:isdifficultto reducebothsimultaneously. It is known, that NOx formation has astrong correlation with the gas temperature in thecombustion chamber. To solve thissproblem, it isdesirable to complete the mixing processbeforecombustion begins and to burn the fuel in a lean andhomogeneous state which reduces the combustiontemperature. To comply with future emission standards,a combination of internal and external reduction ofexhaust emissionsisnecessary. In recent years,development of next generation, high efficiency enginesutilizing compression ignition combustion of a leanmixture and thus combining advantages from both dieseland Sl engines have become an increasingly attractive.A perfect premixing of fuel is desired and various combinations are possible, ranging from gaseous fuelsand therefore guaranteeing a perfectly homogeneousfuel mixture up to injection at high in-jection pressures atan early state. A premixed charge aims to depart fromthe heterogeneous mixing-controlled combustion whichcan be seen as the fundamental cause for particulateand NOx formation. However, there are some limitationsto overcome. The operating region of HCCI combustionis narrow, limited by too early self-ignition and thusleading to high mechanical strain and noise emissionsand on the other hand,by incomplete combustion in coldregions of the combustion chamber lead to high uHCand CO emissions. To shorten development processesof new combustion chambers, engine system and tounderstand combustion process, the use of simulation iscontinuouslyincreasing. The limited calculationcapacities and the shortened time from development toproduct require an adequate modelling of the complexchemical and physical process. In literature, differentcomplexity levels for modelling HCCl processes can befound. A widely used approach is the treatment of thecombustion as a perfectly stirred reactor with variablevolume and heat losses. This approach is very useful if avaluation of suitability is performed and only trends areessentials suchas globalpredictions..Onttheexperimental side, it is very difficult to establishaperfectly homogeneous mixture in terms of temperatureand fuel distribution. Inhomogeneity leads to preferredlocations of ignitions (“hot spots") and makes it difficult tocompare simulation results with experimental data. EXPERIMENTAL SETUP, SINGLE SHOTMACHINE (SSM) For experimental investigations, a single shot machinewas used for simulations of the compression andexpansion stroke of a real engine [3, 10]. In the region ofTDC (± 2 ms), piston movement is comparable with acrankshaft piston motion. The driving concept is basedon two cylindrical and concentrically mounted drivingpistons moving in opposite directions. This conceptguarantees a mass balanced motion for any drivingcondition and thus a nearly vibration free operation. Figure 1 shows the schematic working principle of thesingle shot machine. Figure 1 Single Shot Machine (SSM) [11] The maximum stroke of each experiment is set througha mechanical end stop between So; =120 mm and250 mm bTDC. The driving volume as well as thecombustion chamber are inflated up to typical pressuresof pa=30 bar, pc = 1.1 bar. A hydraulic bypass in thedriving part of the machine is opened and the connectingrod gently moves out of the top bottom position. Passinga stroke of hmin =21 mm, full oil pressure acts on theconnection rod surface and compression stroke occurs.The increasing cylinder pressure in the combustionchamber slows down the connection rod. The systemswings back and forth several times until friction stopsthe piston completely at which time the experiment isfinished. Increased air pressure in the combustionchamber moves the piston back to BDC in its originalposition. Figure 2 shows typical traces of a compressionand expansion stroke. Figure 2 Typical traces of pressure andpiston position ofacompression and expansion stroke All trigger events such as start of injection, start of high-speed recording must be set in 1/100 mm piston strokeresolutioni prior tto compression stroke. After theexperiment, the maximum piston position (So-hend) isallocated to 0 ms and recorded signals are shiftedaccordingly. As Smax varies between sets of conductedVariations.i, comparing measurements withdifferent piston kinematics are not suitable at a time based scale.Due to the lack of a crankshaft or a fixed and predefinedgeometry, the piston kinematics are influenced by aninteracting set of various parameters. The pressure peand pa influence the piston velocity and the resultingcompression ratio e of the “free-flying system". As thereis only the pressure in the combustion chamber to limitpiston movement, the air/fuel-ratio 入, the start of injectionand the heat release rate influence the piston kinematicsas well. In order to reduce maximum pressure gradients,the driving pressure pa must be reduced at higher loadsto lower the resulting compression ratio e. bore B 84 mm stroke S0 120 -250 mm compression ratio e 2-27 simulated engine speed n 1000-3000 rpm max. cylinder pressure Pmax 200 bar heating T upper part of cylinder and piston up to 400 K piston, optical access owindow = 52 mm piston, bowl @bow =52 mm, 4 mm injection highly flexible # experiments 15-20 per hour Table1 Operating range and specifications of the single strokemachine Figure 3 shows the measured maximum peak pressurefor driving pressuresPdfrom 15 -355 bar andcombustion chamber pressure before compression pefrom 1.1 -1.9 bar at two different maximum strokes So at150 mm and 225 mm. Higher compression ratios andtherefore higher peak pressuresin h tthe combustionchambers are reached at high Pd andlow pc. Figure 3 Resulting maximum pressure for varying the driving pressurepa and cylinder pressure pe Figure 4 Resulting compression ratio e (geom) for varying the drivingpressure paand cylinder pressure pc For the presented measurements it is important to note,that piston velocity and compression ratio are coupledand can not be varied independently. Piston velocity iscalculated from piston positions at 0.15ho and 0.85ho inFigure 2. Figure 5 shows the relationship between piston velocityand compression ratio e. It can be seen, that with thedriving concept of the single shot machine, highcompression ratios are always combined with a higherpiston velocity. Inthiss paper, experimentsswere conducted atamaximum stroke before compression of So =225 mmand a charge pressure pe before compression at 1.1 bar.The driving pressure pa was adjusted in order to limitmaximal pressure gradients. Therefore, variations resultin different compression ratios leading to different pistonvelocities as explained. Figure 5 Relation between resulting compression ratio e and pistonvelocity Cylinder pressure and piston movement are recorded at100 kHz and using a thermodynamic analysis [9], basedon a two zone model gas temperatures and heat releaserate are calculated. COMBUSTION ANALYSIS OF N-BUTANE HCCI N-butane, being gaseous under atmospheric conditions,was injected in liquid phase at 18 bar using a BoschHDEV 1.1 GDI gasoline injector. Injection occurred atBDC while inflating the charge volume and therefore ahomogeneousmixture is guaranteed. Thewalltemperature was set to 313 K. N-butane with ignitionproperties close;to (gasoline fuelisthe smallesthydrocarbon showing the two stage ignition phenomena.Experimental results were compared with a perfectlystirred reactor (PSR) chemkin simulation based on amultizone model. MULTIZONE MODEL As the heat release for homogeneous, single zonereactors were unreasonably high, a multizone model fordistributions in temperature and 入 was developed [1].The multizone model consists of various reactors whichare coupled by pressure compensation and volume workbetween the zones.Individual zones are calculatedduring one time step. The energy equation for thehomogeneous reactor is given by with do/dtt being the heat released by chemicalreactions calculated with detailed chemistry. For thecalculation of the species production and the internalenergy, Chemkin Il subroutines are used. Wall heatlosses are estimated with the modelproposed byWoschni scaled with a factor ascaling. As a calculation for a mean piston speed used forWoschni wall losses is not applicable, piston velocitywas estimated as described in Figure 2 and resultingdeviations from the real movement were adjusted withthe factor ascaling. Good overall agreement betweensimulation and experiment was found with ascaling =0.45.Considering the energy conservation andthe idealgas law, aswellass kkrnowing theinstantaneouscylinderr volumee(given tby pistonkinematics, the cylinder pressure can be calculated. Thesum of all individual zone volumes must be equal to thetotal cylinder volume. The pressure in each zone isadjusted to the cylinder pressure after each time step. To conserve the zone mass, volume work between thezones is done. For comparisions with experimental data,pressure and temperature at -15 ms bTDC was used forinitialising the calculations. Pressure was measured inthe experiment and global mean temperature wascalculated using the thermodynamic analysis packageWEG [9]. A normal distribution wass usedwithpredefined standard deviation for initializing temperaturezones. Initialization of distributions in terms of 入 were modelledaccordingly with standard deviations in air/fuel ratio forthezones.The reaction mechanismused Wasdeveloped by Barroso[1]and validated with n-butaneengine results. It consists of 453 reactions and 140species. COMPARISON BETWEEN EXPERIMENT ANDMULTIZONE MODEL, N-BUTANE HCCI Figure 6 and Figure 7 show the comparison of bothpressure and temperature between experiment andsimulation with 5 temperature zones (Nr =5) and 3 入zones (N=3). Due to the marginal mass flow in thesingle shot mode of the test apparatus, measurement ofair/fuel-ratio from the exhaust was not possible.入 wascalculatedbased on the knowngeometry, initialpressure and temperature as well as fuel mass. Derivedfrom Figure 6 it is assumed, that the experiment wasconducted at 入=3.1 (入nominal=3.0). Figure 6 Comparison between measured and calculated pressure,入b=3, e=15.5, scaling =0.45, Twall= 313 K, Nr= 5,Nx= 3, ar =6 K,ox=0.05 Figure 7 Comparison between calculated temperatures (Chemkinsimulation 入=2.9 -4.5 vs. heat release analysis), 入b=3,e=15.5,ascaling= 0.45, Twall = 313 K,Nr=5,Nx=3,or=6K,a=0.05 Pressure and temperature are captured very well by themodel, with small deviations in peak temperature. Alsothe occurrence of LTR and HTR shows a very wellagreement as demonstrated in Figure 8. LTR appears at-1.2 ms independently of 入. A leaner combustion leadsto a long second ignition delay of the HTR and anelongated reaction time. Variations of single shot operating parameters, differentair/fuel-ratios and compression ratios were conductedand the conditions in the combustion chamber at thetiming of LTR and HTR was examined. In agreementwith [6, 12] it was found, that low temperature reactionoccurred in a region of 800 K nearly independently of theair/fuel-ratio between入=2.5 and 5. Figure 8 Comparison between experiment and simulation of heatrelease rate, 入b=3,e=15.5, ascaling =0.45, Twall= 313 K, NT=5,Nx=3,or=6K,0x=0.05 Piston velocity was in the range of 5 m/s. After a secondignition delay, HTR occurred in the region of 900 K. Theinduction time between LTR and HTR strongly dependsonthe air/fuel-ratio. A richer mixture leads to an advanced start of the high temperature reaction withhigher pressure gradients. Details of measurementsconducted are published in [4]. Figure 9 Variation of simulation temperature To,s at 15 ms bTDCbetween 416 K and 428 K at 15 ms bTDC, 入b =3,e= 15.5,ascaling = 0.45, Twall =313 K,NT=5,Nx=3,or=6K,0x=0.05 Figure 10 Variation of simulation temperature To,s at 15 ms bTDCbetween 416 K and 428 K at 15 ms bTDC, 入b= 3,e =15.5,ascaling=0.45, Twall=313 K, NT=5, N=3,oT=6 K, ax = 0.05,experimental trace was calculated using heat release analysis. The beginning of compression initiated combustion isvery sensitive on temperature deviations [5, 7, 8]. Ananalysis of temperature revealed that small changes oftemperatures lead to an incomplete combustion or anadvanced start of combustion. Figure 9 and Figure 10show numerical results of pressure and temperature byvarying the temperature at 15 ms bTDC between 416 Kand 428 K. The nominal temperature in the experimentwas 422 K. Figure 11 Variation of simulation temperature To,s at 15 ms bTDCbetween 416 K and 428 K at 15 ms bTDC, 入b = 3, e = 15.5,ascaling = 0.45, Twall =313 K, NT=5,Nx=3, oT=6 K, ax=0.05 Figure 12 Variation of simulation temperature To,s at 15 ms bTDCbetween 416 K and 428 K at 15 ms bTDC, 入b =3, e = 15.5,ascaling =0.45, Twall = 313 K,Nr=5,Nx=3, or=6K,ax=0.05 A reduced temperature by only 6 K at 15 ms bTDC leadsto an incomplete combustion of the compression ignitedn-butane mixture. An increased temperature leads to anadvanced start and more rapid combustion with higherpressure gradients. OH-CHEMILUMINESCENCE Using an intensified LaVision High-Speed-Star 5 CMOScamera, OH-chemiluminescense was captured throughthe transparent piston. The piston window is made ofSQ-1 quartz with 92 % transmission at 300 nm. A fixedfocal length UV lens Nikkor 105 mm/f4.5 was used witha OH-filter at 313±2nm. Frame rate was set to 10 kHz.The bore of the single shot machine is 84 mm, thediameter of the transparent window in the piston 52 mm. Figure 13 shows in a single cycle the recorded OH-chemiluminescence. 1ms 1.1 ms 1.2 ms 1.9 ms 2ms 2.1 ms 0 low OH-intensity high 512 Figure 13 OH-chemiluminescence of n-butane HCCI, 入 = 3, 8=15.5,Twall =313 K, indicated time after TDC During LTR and induction time, formaldehyde and H202are accumulated with only low OH production rate. Atelevated temperatures in the region of 900 K, H202 isdecomposed in 2 OH and therefore acts as a tracerspecies for the detection of the beginning of the hightemperature reaction phase. First OH-chemiluminescense appears in the middle range of thecombustion chamber which is assumed to be the hottestarea due to wall losses. Ignition occurs at severallocations in the combustion chamber and progresseswithin 0.11 ms to the complete visible range. Ignitionoccurs almostt simultaneously.Heatreleaserate.pressure and temperature are shown in Figure 6 -Figure 12 and compared with simulation results. DEVIATIONS FROM PERFECT HOMOGENEITY Under experimental conditions it is difficult to guaranteeaperfectly homogeneous distribution interms oftemperatureand air/fuel-ratio. Small temperaturedeviations before compression stroke at BDC lead toestimated temperatures differences of at TDC. In combination with a inhomogeneity of fueldistribution in the combustion chamber, regions whichare more likely to ignite are formed, leading to aninhomogeneous compression ignition. In the following,deviations from perfect homogeneity are examined. THERMAL INHOMOGENEITY With regard to a perfect homogeneous temperaturedistribution in the compression chamber, experimentswere conducted at low wall temperatures. Due to thefact, that only the upper 60 mm of the cylinder wall andthe piston are equipped with heating elements andoperation of the machine is possible in single shot modeonly,cold walls(Twall = 2293K) lead to a imorehomogeneous temperature distribution beforecompression stroke occurs. To investigate the effect ofthermal1inhomogeneities on combustion, a thermalinhomogeneity was placed in the cold head of thecylinder as illustrated in Figure 14. Figure 14 Thermal inhomogeneity in the cylinder head, Tmax= 500 K The brass adapter was isolated from the cylinder headwith a ceramic tube. The 20 mm diameter surface canbe heated within 170 s to 500 K. Figure 15 Influence of adapter temperature (293 K-473 K) on cylinderpressure, n-butane, 入= 4, 8 = 17, Twall=293 K, 8 consecutiveexperiments In order to reduce thermal conduction into the cylinderwall, heating was switched off after each single shot.With1pc = 1.1 bar, pa=27.6 bar (resulting1 inacompression ratio of e= 17) adapter temperatures of293 K (no heating), 373 K and 473 K were examined.For safety reasons of high pressure gradients at richcombustion, the air/fuel-ratio was set to 入=4. Figure 15shows the pressure development at different adapter temperatures for 8 consecutive experiments. At e = 17and 入==4.,LTR always occurs. High temperaturereaction is stronglyinfluenced bythe adaptertemperature as shown in Figure 16. The hot surfaceleads to astablecombustion. Higher adaptertemperatures lead to higher heat release rates where ascool-flames at-1.5 ms are not influenced. Figure 16 Influence of adapter temperature (293 K - 473 K) on heatrelease rate, n-butane, 入= 4, e = 17, Twall=293 K, 8 consecutiveexperiments Figure 17 Influence of adapter temperature (293 K-473 K) on heatrelease, n-butane,入=4,e = 17, Twall=293 K, 8 consecutiveexperiments Combustion efficiency and stability increases from 25 %(0eff =12%) to 94%(0eff=2%) at higher adaptertemperatures. Maximum fluctuations occur at mediumtemperatures of 373 K with mean efficiency of 58 %. Figure 18 shows the OH-chemiluminescense of anignition with cold walls at Twall= 293 K and an adaptertemperature of 473 K. Figure 18 OH-chemiluminescense, n-butane, Twall = 293 K, adapter(marked in red) temperature= 473 K,入=4, e= 17, record rate 10 kHz OH is detected first in the middle of the combustionchamber in the region of the hot surface. Due to the fact,that ignition does not occur at adapter temperatures of293 K, the influence of the hot spot is evident. Theincrease in pressure and temperature leads to ignition inneighbouring parts of the combustion chamber. Due tothe cold walls, ignition in outer regions occurs last. DUAL-FUEL INJECTION OF N-BUTANE AND DIESEL Using a centrally mounted Ganser Hydromag RIC-555injector with a 8 holes BOSCH nozzle, spray angle 120°,0=0.112 mm, qstat,n-Heptan = 10.5 cm°/s at 10 MPa, dual-fuel injection of n-butane and diesel was examined. N-butane was injected during inflation of the combustionchamber at BDC. The start of injection (SOI) of diesel aswell as diesel mass were varied and the influence oncombustion was analysed. The injection pressure washeld constant at pi= 500 bar and the injected mass wasvaried through injection duration. The trigger for the start of diesel injection was set to205mm and 214mm of maximum pistonstroke(So=225 mm). This resulted in a effective SOl at 2.8 msand 0.8 ms bTDC. Injected diesel mass was 5 mg(Xa~20). Driving pressure pa could be adjusted in orderto reach a compression ratio of e =17 in all cases. Withthis configuration at Ab =4 the low temperature reactionof n-butane with a very unstable HTR was observed asshown in Figure 19 and Figure 20. Figure 19 Resulting pressure of a combined injection of n-butane anddiesel fuel with a) no diesel b) SOl 2.8 ms bTDC c) SOI 0.8 ms bTDC,p:=500 bar, 入b=4, ma=5 mg, Twall =293 K Figure 20 Heat release rate of a combined injection of n-butane anddiesel fuel with a) no diesel b) SOI 2.8 ms bTDC c) SOl 0.8 ms bTDC,pi=500 bar, ma=5 mg, 入b=4, Twall=293 K The timing of the diesel injection strongly influences theappearance of the cool-flame phase. An early dieselinjection with a greater pre-mixed portion leads to anadvanced diesel combustion overlapping the n-butanecool-flames as demonstrated in Figure 20. The HTR of n-butane starts at 0.8 ms for both operatingpoints. Setting the start of injection to 214 mm (0.8 msbTDC), the ignition delay of diesel fuel decreases due tohigher temperatures. Cool-flames of n-butane occurs atthe time of injection diesel fuel. After a second ignition1_..delay, HTR of n-butane start at 0.8 ms, coincidentallyfollowing the trace of HTR combustion initiated by theearly diesel injection. The combined injection of a homogeneous n-butanemixture and ignition-initiated by a small amount of dieselfuellead to aacombustion efficiency of 92%.Compression-initiated combustion of n-butane resultedin a combustion efficiency of 25 %. This makes itpossbile to trigger a non-igniting n-butane mixture withthe injection of a small amount of diesel fuel. Figure 21 Combustion efficiency of a combined injection of n-butaneand diesel fuel with a) no diesel b) SOI 2.8 ms bTDC c) SOI 0.8 msbTDC, pi=500 bar, ma=5 mg, 入b =4, Twall=293 K Figure 22 OH-intensity, averaged over the visible combustion chamberfor variations of diesel injection OH-chemiluminescense for a dual fuel injection wasrecorded and is shown for a diesel injection at 0.8 msbTDC in Figure 23. Diffusion combustion starts at0.0 ms. At 0.8 ms the n-butane HTR begins, resulting in an increase of OH-intensity with aa maximum peakbetween 1.0 and 1.5 ms. 0 ms 0.1 ms 0.2 ms 0.3 ms0.4 ms 0.5ms 0.6 ms 0.8 ms 1.8 ms 1.9 ms 2mshs 2.1 mss 2.2 ms 2.3ms 2.4 ms 2.5 ms 2.6 ms low OH-intensity high 512 Figure 23 OH-chemiluminescense, n-butane, 入b=4, ma=5 mg,e=17,t=0.8 ms bTDC, pi= 500 bar, Twall =293 K OH-intensity was averaged over the visible combustionchamber for each time step and displayed in Figure 22.Advancing the diesel injection leads to an increasedpremixed ratio of the diesel combustion and therefore toreduced overall OH-intensity. When no diesel is injected,the compression initiated combustion of n-butane has areduced intensity during HTR. VARIATION OF INJECTED DIESEL MASS ATACONSTANT N-BUTANE AIR/FUEL-RATIO In the following, results are presented with a dual fuelinjection of n-butane and diesel varying the injectedmass of diesel fuel at a constant 入b=4. The trigger markfor diesel injection was set to 210 mm at a maximumstroke of So = 225 mm. As combustion pressuresstrongly influence the resulting position of TDC, thecompression ratio e and timing relative to TDC can notbe held constant for all variation. As combustion of n-butane depends on engine speed [2], an adjustment ofdriving pressure was not suitable. Compression ratio erange therefore from 15.4 (ma=9mg) to 16.7 (ma = 5mg). Deviation in compression ratio lead to a differenttiming of the effective diesel injection relative to TDC. Figure 24 shows the resulting pressure and temperaturetraces for a premixed n-butane/air composition at 卜b=4ignited by a diesel fuel injection with a variation ofinjected diesel mass. Itt was found, that a p-T-plot(pressuree Vs. temperature) is the bestnmethodpresenting data...Atimebased comparison isinappropriate due to the single shot machine's behaviorwith a free flying piston mechanism. With the variationshown, it was not possible to maintain the samecompression ratio and piston velocity by adjusting thedriving pressure. Figure 24 Resulting pressure and temperature of a combined injectionof n-butane and diesel fuel varying the injectied diesel mass md, SOIbetween 1.5 and 1.7 ms bTDC, pi=500 bar, 入b=4, Twall =293 K Combustion of diesel fuel leads to a pressure andtemperature increase and influences the conditions inthe combustion chamber at the start of n-butane hightemperature reaction. The temperature before HTR as well as the duration which the remaining mixture isexposed to that temperature is strongly influenced by theamount of diesel fuel. For the following, T defines the temperature after thediesel combustion where the temperature increase startsto level off, see Figure 30 - Figure 32. The temperatureat the start of the high temperature of n-butane isdefined as T2. Ta referrs to the mean of T and T2. Thetimethen-butaneinmixturerremainsatelevatedtemperatures between T and T2 is defined as t. Ahigher amount of diesel fuel leads to an increasedtemperature T as shown in Figure 25. During time t themixtures heats up more due to the assumed underlyingLTR reaction of n-butane. Figure 25 Increase of temperature due to the diesel combustion forma= 9 mg, 7 mg and 5 mg, SOl between 1.5 and 1.7 ms bTDC,pi=500 bar, b=4, Twall= 293 K Figure 26 Time remaining in ms on a temperature level of Ta andduration of n-butane HTR An increased mean temperatureTabeforehightemperature reaction of n-butane leads to an advancedbeginning of the HTR heat release rate. The time themixturesremains at elevated temperature variesbetween 0.21 ms (ma=9 mg) and 0.81 ms (ma =5 mg). Figure 27 H.R.R. of diesel and n-butane combustion, 入b =4,ma=9 mg, pi=500 bar, t=1.5 ms bTDC, e= 15.4, Twall=293 K Figure 28 H.R.R. of diesel and n-butane combustion, 入b =4,4.ma=7 mg,pi=500 bar, t =1.6 ms bTDC,e=15.6, Twall= 293 K Figure 29 H.R.R. of diesel and n-butane combustion, 入6\b=4,ma=5 mg, pi= 500 bar, t =1.7 ms bTDC, e =16.7, Twall= 293 K Figure 30 Temperature of diesel and n-butane combustion, 入b =4,ma=9 mg, pi=500 bar,t= 1.5 ms bTDC, e= 15.4, Twall=293 K Figure 31 Temperature of diesel and n-butane combustion, Ab = 4,ma=7 mg, pi=500 bar, t = 1.6 ms bTDC,e= 15.6, Twall=293K Figure 32 Temperature of diesel and n-butane combustion, 入b = 4,ma=5 mg, pi=500 bar,t=1.7 ms bTDC,e= 16.7, Twall =293 K CONCLUSIONS Experimental and numerical investigations in a singleshot machine were presented with regard to the n-butane homogeneous charge compressionniignition(HCCI). The comparison of heat release, pressure andtemperature between the experiment and simulation witha multizone model showed a very good agreement. Itwas found, that LTR is not affected by air/fuel-ratio in therange examined. On the other hand, richer fuel mixtureslead to a shorter induction time as well as a faster HTR.High-speedOH-chemiluminescencerrevealed thatcombustion starts almost simultaneously in the cylinder.The influence of a hot surface in the cylinder head(thermal inhomogeneity,“hot spot") on combustion wasanalysed. Ignition initiation ofa homogeneous n-butanemixture was possible at elevated adapter temperatures(473 K) leading to a stable and faster combustionwhereasS no ignitionnoccurredattlowadaptertemperatures.5. High-speed OH-chemiluminescenceshowed the beginning of combustion in the proximity ofthe hot surface. With a dual fuel injection of n-butaneand diesel, it was possible to ignite a very lean n-butanemixture (b = 4). Thiss method, leading to aninhomogeneity of fuel and temperature distribution in thecombustionchamber. as well as thettihermalinhomogeneityinthecylinder head,,showed thepossibility to influencethe timing andthe overallcombustion efficiency of a lean n-butane mixture. ACKNOWLEDGMENTS The authors wish to thank to the“Forschungsvereinigung1Verbrennungskraftmaschinene.V.”(FVV, Frankfurt) and the Swiss Federal Office ofEnergy for the financial contribution to this project. REFERENCES ( [1] Barroso , , G G . . , , C hemical k inetic mechanism reduction, multizone and 3D-CRFD modelling ofhomgeneous charge c ompression ignition engines. 2006, ETH Z urich, Diss 16437. ) ( [2] Dec, J. and K elly-Zion , P . HCCI Combustion Fundamentals:: In-Cylinder Diagnostics a nd Kinetic-Rate Computations. inDiese EngineEmissions Reduction Workshop, DEER 2000 ) [3] Eisen, S.-M., Visualisierung der dieselmoto-rischenVerbrennung einer schnellilienKompressionsmaschine,,Lehrstuhl furThermodynamik der TU Munchen. 2003 [4] Escher, A., Experimentelle Untersuchungen derhomogenen, kompressionsgezundetenVerbrennung.2007, ETH Zurich, Diss 17251. [5] Goyal, G. and Warnatz, J. Numerical studies ofhot spot ignition in a H202 and CH4 - airmixtures. in Proceedings Combustion Institute.1990. ( [6] llda, N. and I g arashi, T., Auto-ignition of n- butane and D ME/air r mixtures s ir in a Homogeneous C harge Compression I gnitionEngine. SAE, 2000.2000-01-1832. ) [7] Konig, G., Maly, R.R., Bradley, D., Lau, A.K.C.,et al., Role of Exothermic Centrex on KnockInitiation and Knock Damage. SAE 902136,1990. [8] Lutz. A.E.,Kee,R.J.,Miller, J.A.,, andOppenheim, A.K. Dynamic effects of autoignitioncenters for hydrogen and C1,2 - hydrocarbonfuels.in Proceedings Combustion Institute.1989. [9] Obrecht, P., WEG -Warmeentwicklungsgesetz,Rechenprogramm zur thermodynamischenAnalyseaus Brennraumdruckverlaufen, inLaboratoriumnfurirAAerothermochemieundVerbrennungssysteme, LAV ETH Zurich. 2007,ETH Zurich: Zurich. [10] Ofner., B., Dieselmotorische Kraftstoff-zerstaubung und Gemischbildung mit Common-Rail Einspritzsystem, in FakultatMaschinenwesen. TUJMunchen.2001,. TUMunchen. [111 Testem, Handbuch TeRCM-K8401, HandbuchSchnelle Kompressionsmaschine zur Simulationvon innermotorischen Gemischbildungen undVerbrennungsvorgangen. 2004, Hoflach b.Alling: Gesellschaft fur Mess- und DatentechnikmbH. 1121 Yamasaki, Y. and llda, N. Numerical Analysis ofAuto Ignition and Combustion of n-Butane andAir Mixture in The HCCI Engine by UsingElementary Reactions. in The Fifth Symposiumon Diagnostics and Modelling of Combustion inInternalEEngines,,CCOMODIA2001.2001.Nagoya. CONTACT Andreas Escher Swiss Federal Institute of Technology, ETHZ LAV, ML L 18 Sonneggstrasse 3 CH - 8092 Zurich, Switzerland escher@lav.mavt.ethz.ch, www.lav.ethz.ch DEFINITIONS, ACRONYMS, ABBREVIATIONS BDC bottom dead center compression ratio H.R.R. heat release rate HTR high temperature reaction 入 relative air/fuel-ratio 入b relative n-butane air/fuel-ratio LTR low temperature reaction Mnumber of temperature zones 以 number of入zones mp mass of diesel fuel Pd driving air pressure, pressure in the drivingpart of the single stroke machine pc pressure in the combustion chamberbefore start of compresson SOI start of injection TDC top dead center In this study, experimental results of homogeneouscharge compression ignition HCCI of n-butane in asingle shot machine are presented. N-butanemeasurements are compared with a multizone model.Individual zones are calculated using a perfectly stirredreactor and Chemkin chemistry. The influence oftemperature before combustion on heat release rate andduration of combustion is shown in a sensitivity analysis.As a perfect homogeneous temperature and fueldistribution are difficult to establish under experimentalconditions, deviations from perfect homogeneity areshown. The influence of a hot surface in the cylinderhead in terms of heat release rate and ignitability isexamined. Further, dual fuel injections of n-butane anddiesel are studied to trigger the n-butane ignition with adefined start of combustion.
确定


还剩11页未读,是否继续阅读?

产品配置单


北京欧兰科技发展有限公司为您提供《透明单冲程压缩机中均质混合进气压缩燃烧(HCCI)检测方案(流量计)》,该方案主要用于汽车电子电器中热性能检测,参考标准--,《透明单冲程压缩机中均质混合进气压缩燃烧(HCCI)检测方案(流量计)》用到的仪器有PLIF平面激光诱导荧光火焰燃烧检测系统、德国LaVision PIV/PLIF粒子成像测速场仪、汽车发动机多参量测试系统、LaVision SprayMaster 喷雾成像测量系统、LaVision HighSpeedStar 高帧频相机
推荐专场


汽车尾气分析仪
更多


相关方案
更多
该厂商其他方案
更多