


Development of Optical Diagnostic Techniques to Correlate Mixing and Auto-Ignition
Processes in High Pressure Diesel Jets — A tracer laser-induced fluorescence (LIF) technique for the
visualization of fuel distribution in the presence of oxygen was developed and then used sequentially with
high speed chemiluminescence imaging to study the correlation between the mixing and auto-ignition
processes of high pressure Diesel jets. A single hole common rail Diesel injector allowing high injection
pressures up to 150 MPa was used. The reacting fuel spray was observed in a high pressure, high temperature
cell that reproduces the thermodynamic conditions which exist in the combustion chamber of a
Diesel engine during injection. Both free jet and flat wall impinging jet configurations were studied.
Several tracers were first considered with the objective of developing a tracer-LIF technique in the presence
of oxygen. 5-nonanone was selected for its higher fluorescence efficiency. This technique was subsequently
combined with high speed chemiluminescence imaging to study the correlation between mixing
and auto-ignition. In the free jet configuration and for the parameter range studied, it was found that
auto-ignition is preferentially located in rich regions of the upstream mixing zone. Also, in the jet wall
configuration, auto-ignition appears in the centre of the jet and propagates towards the periphery, in the
vicinity of the wall.
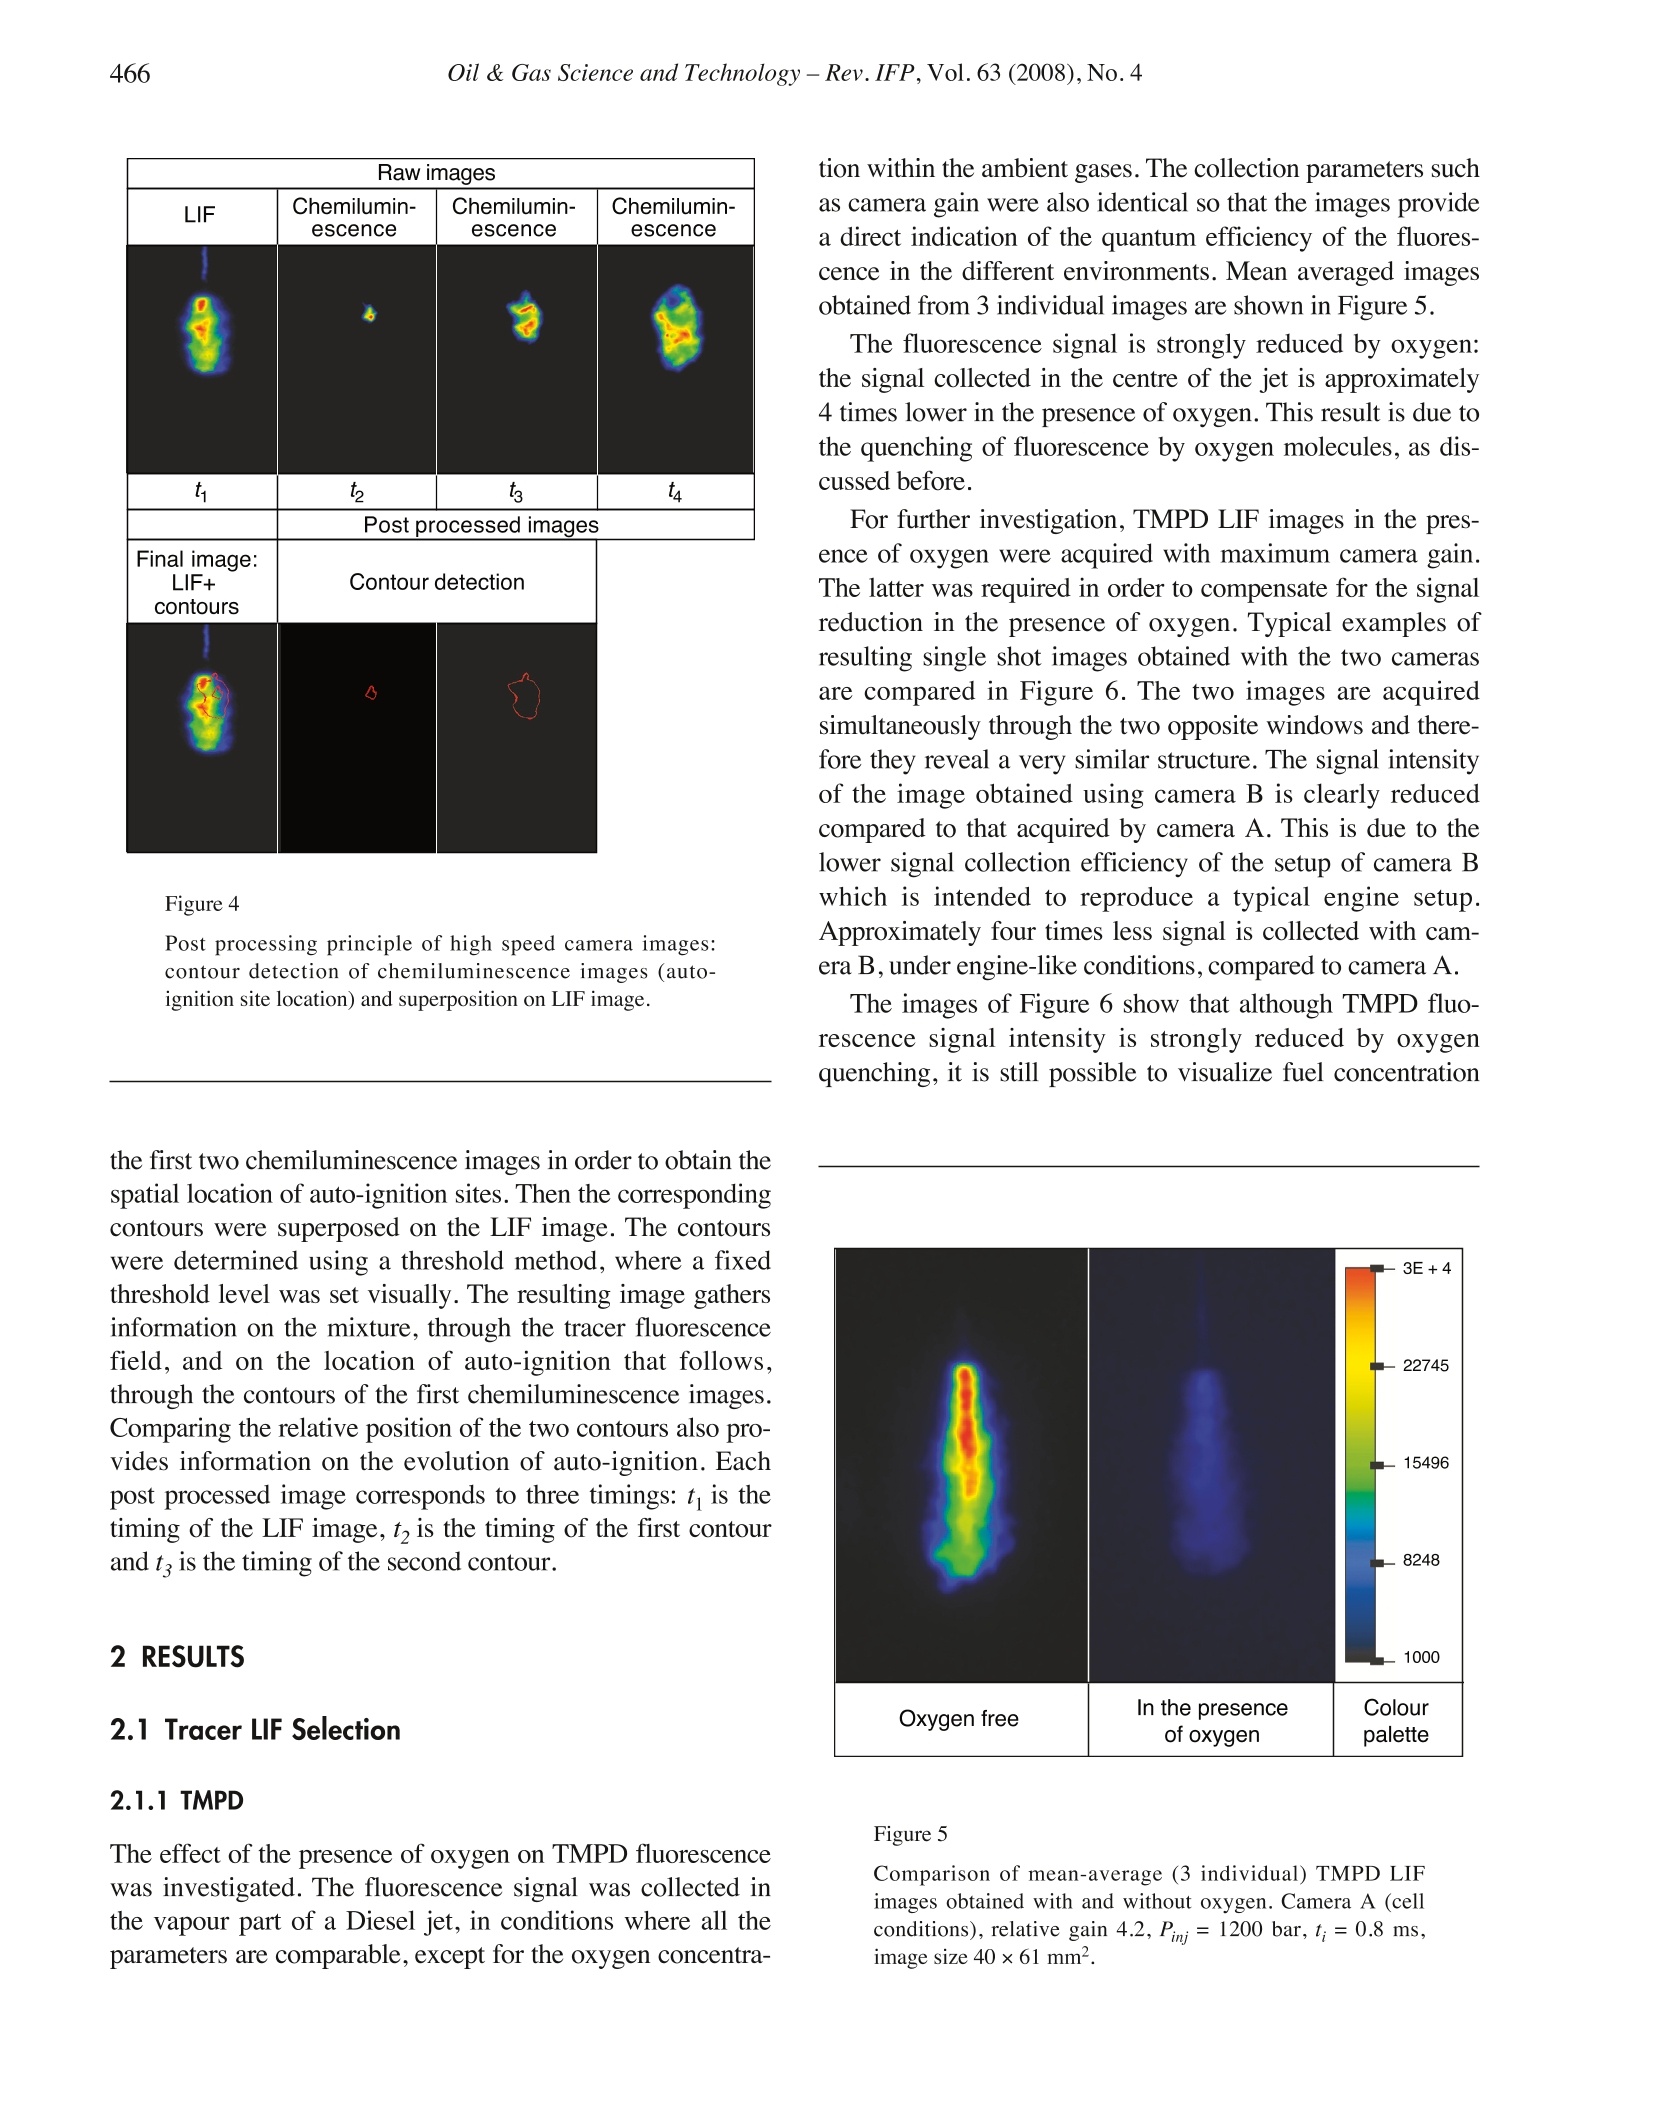
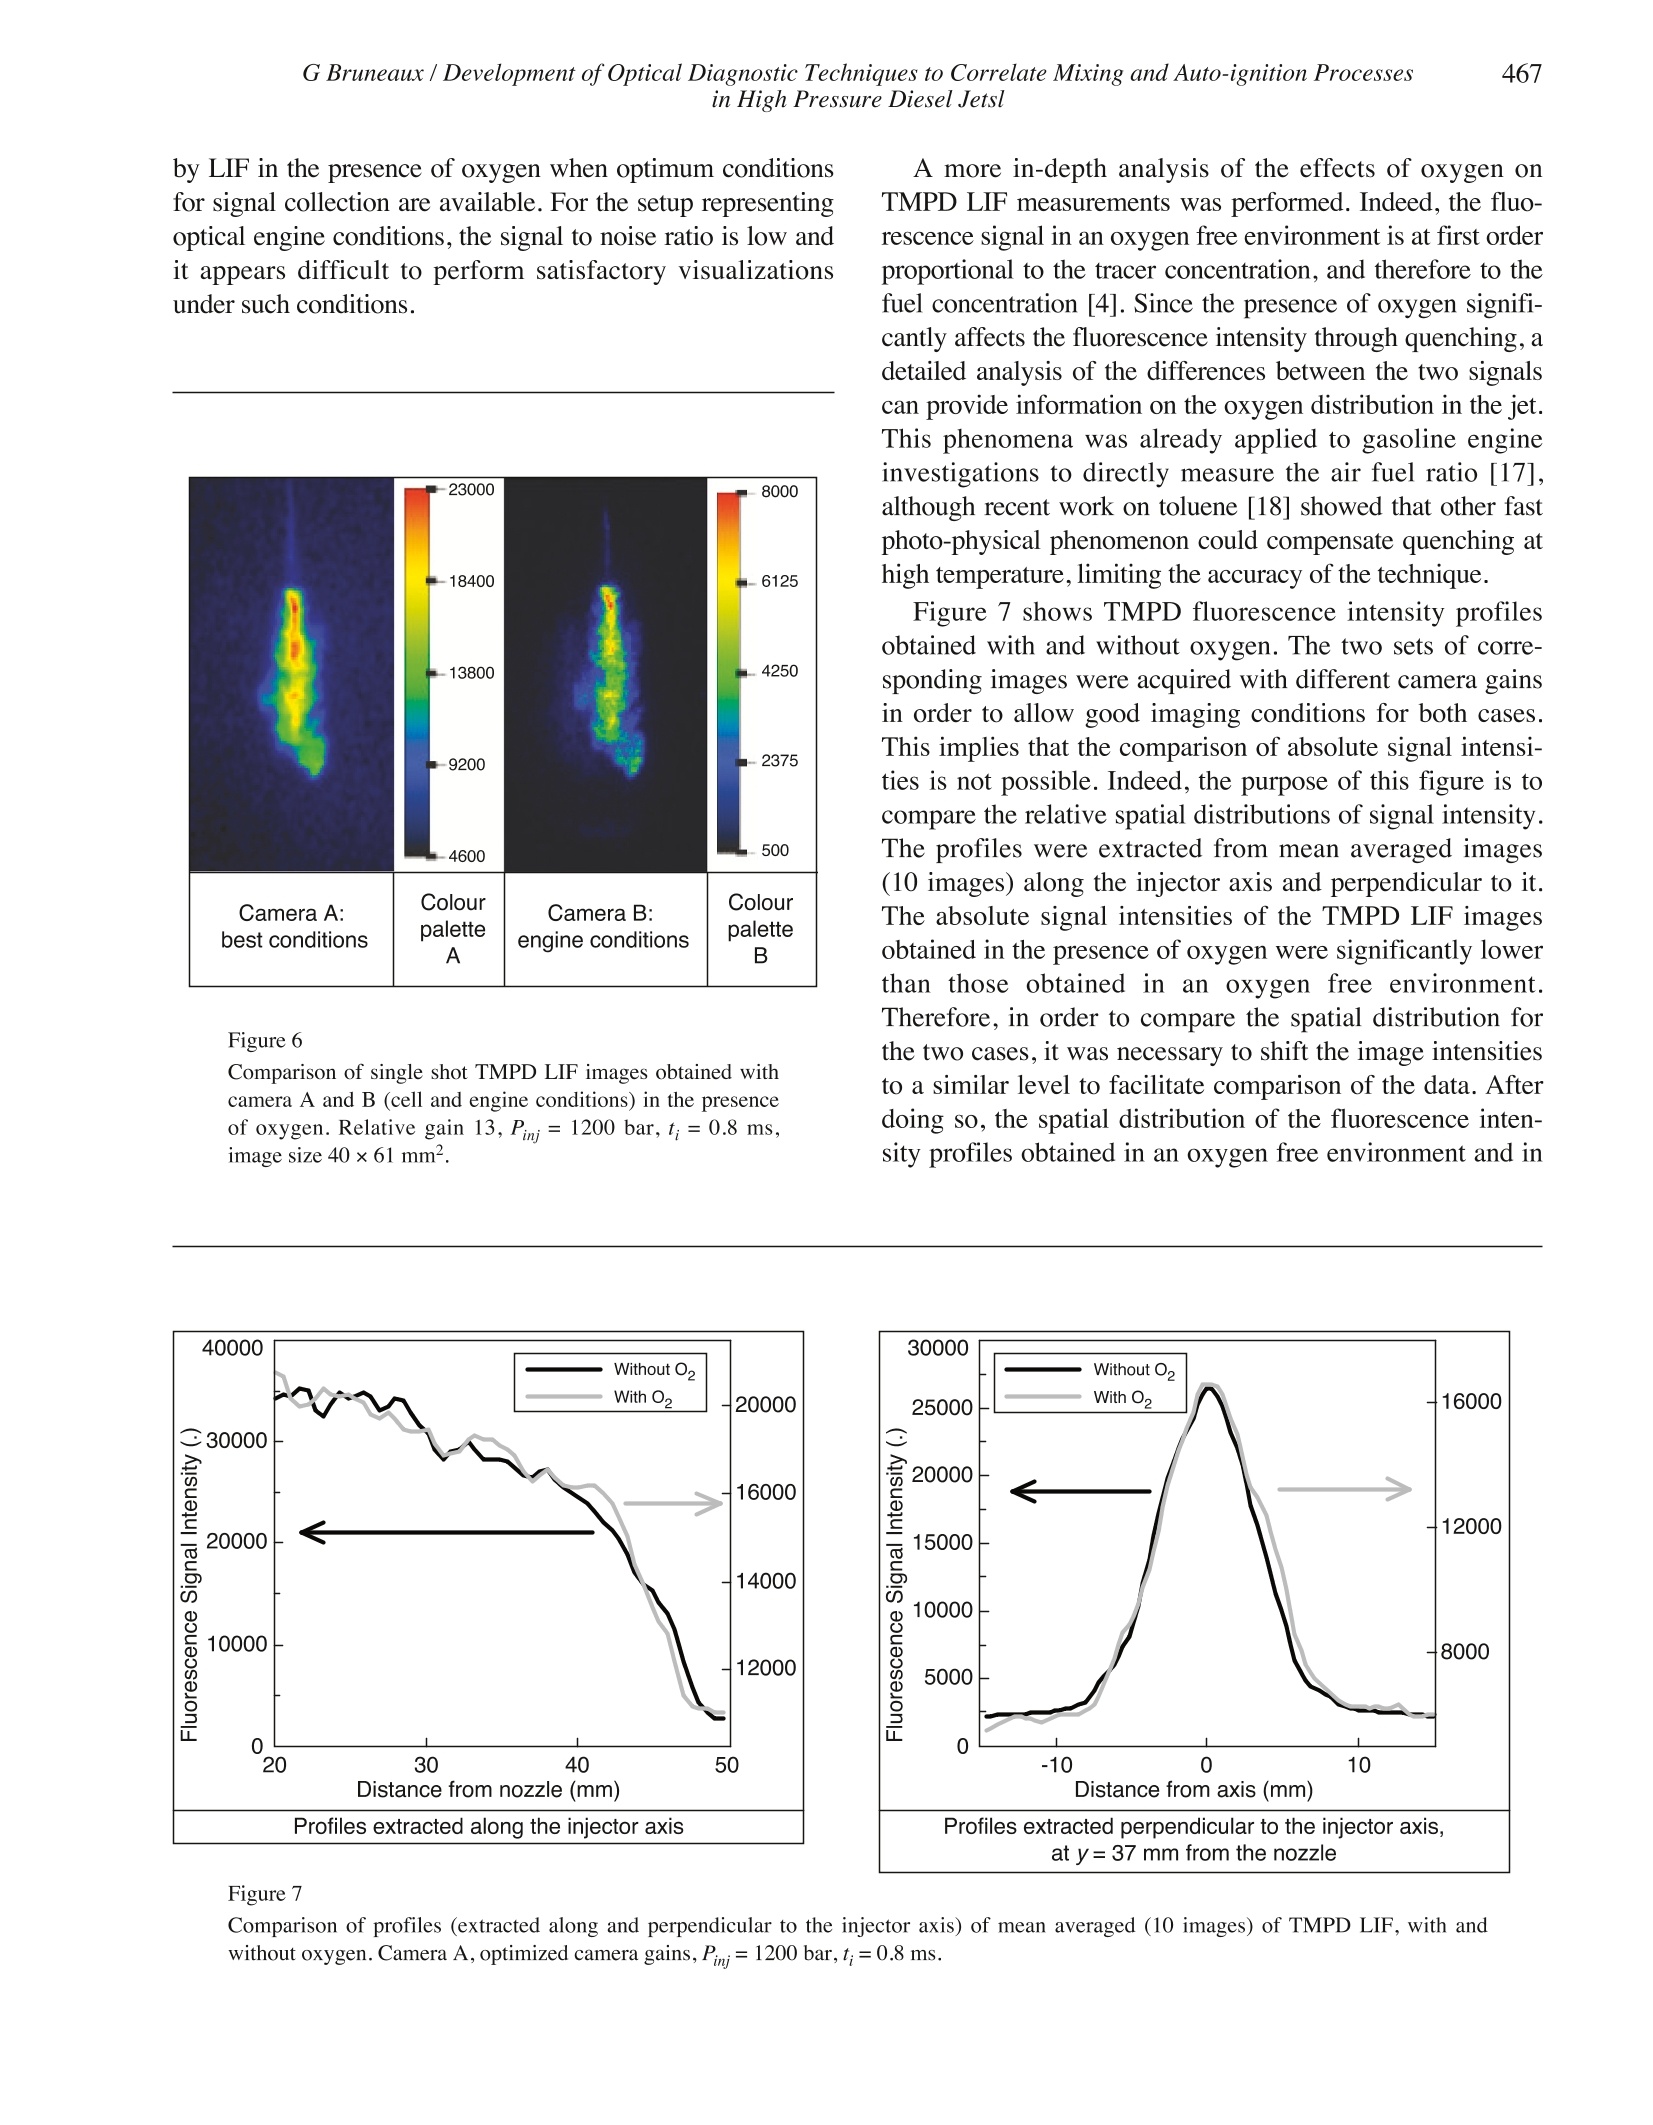
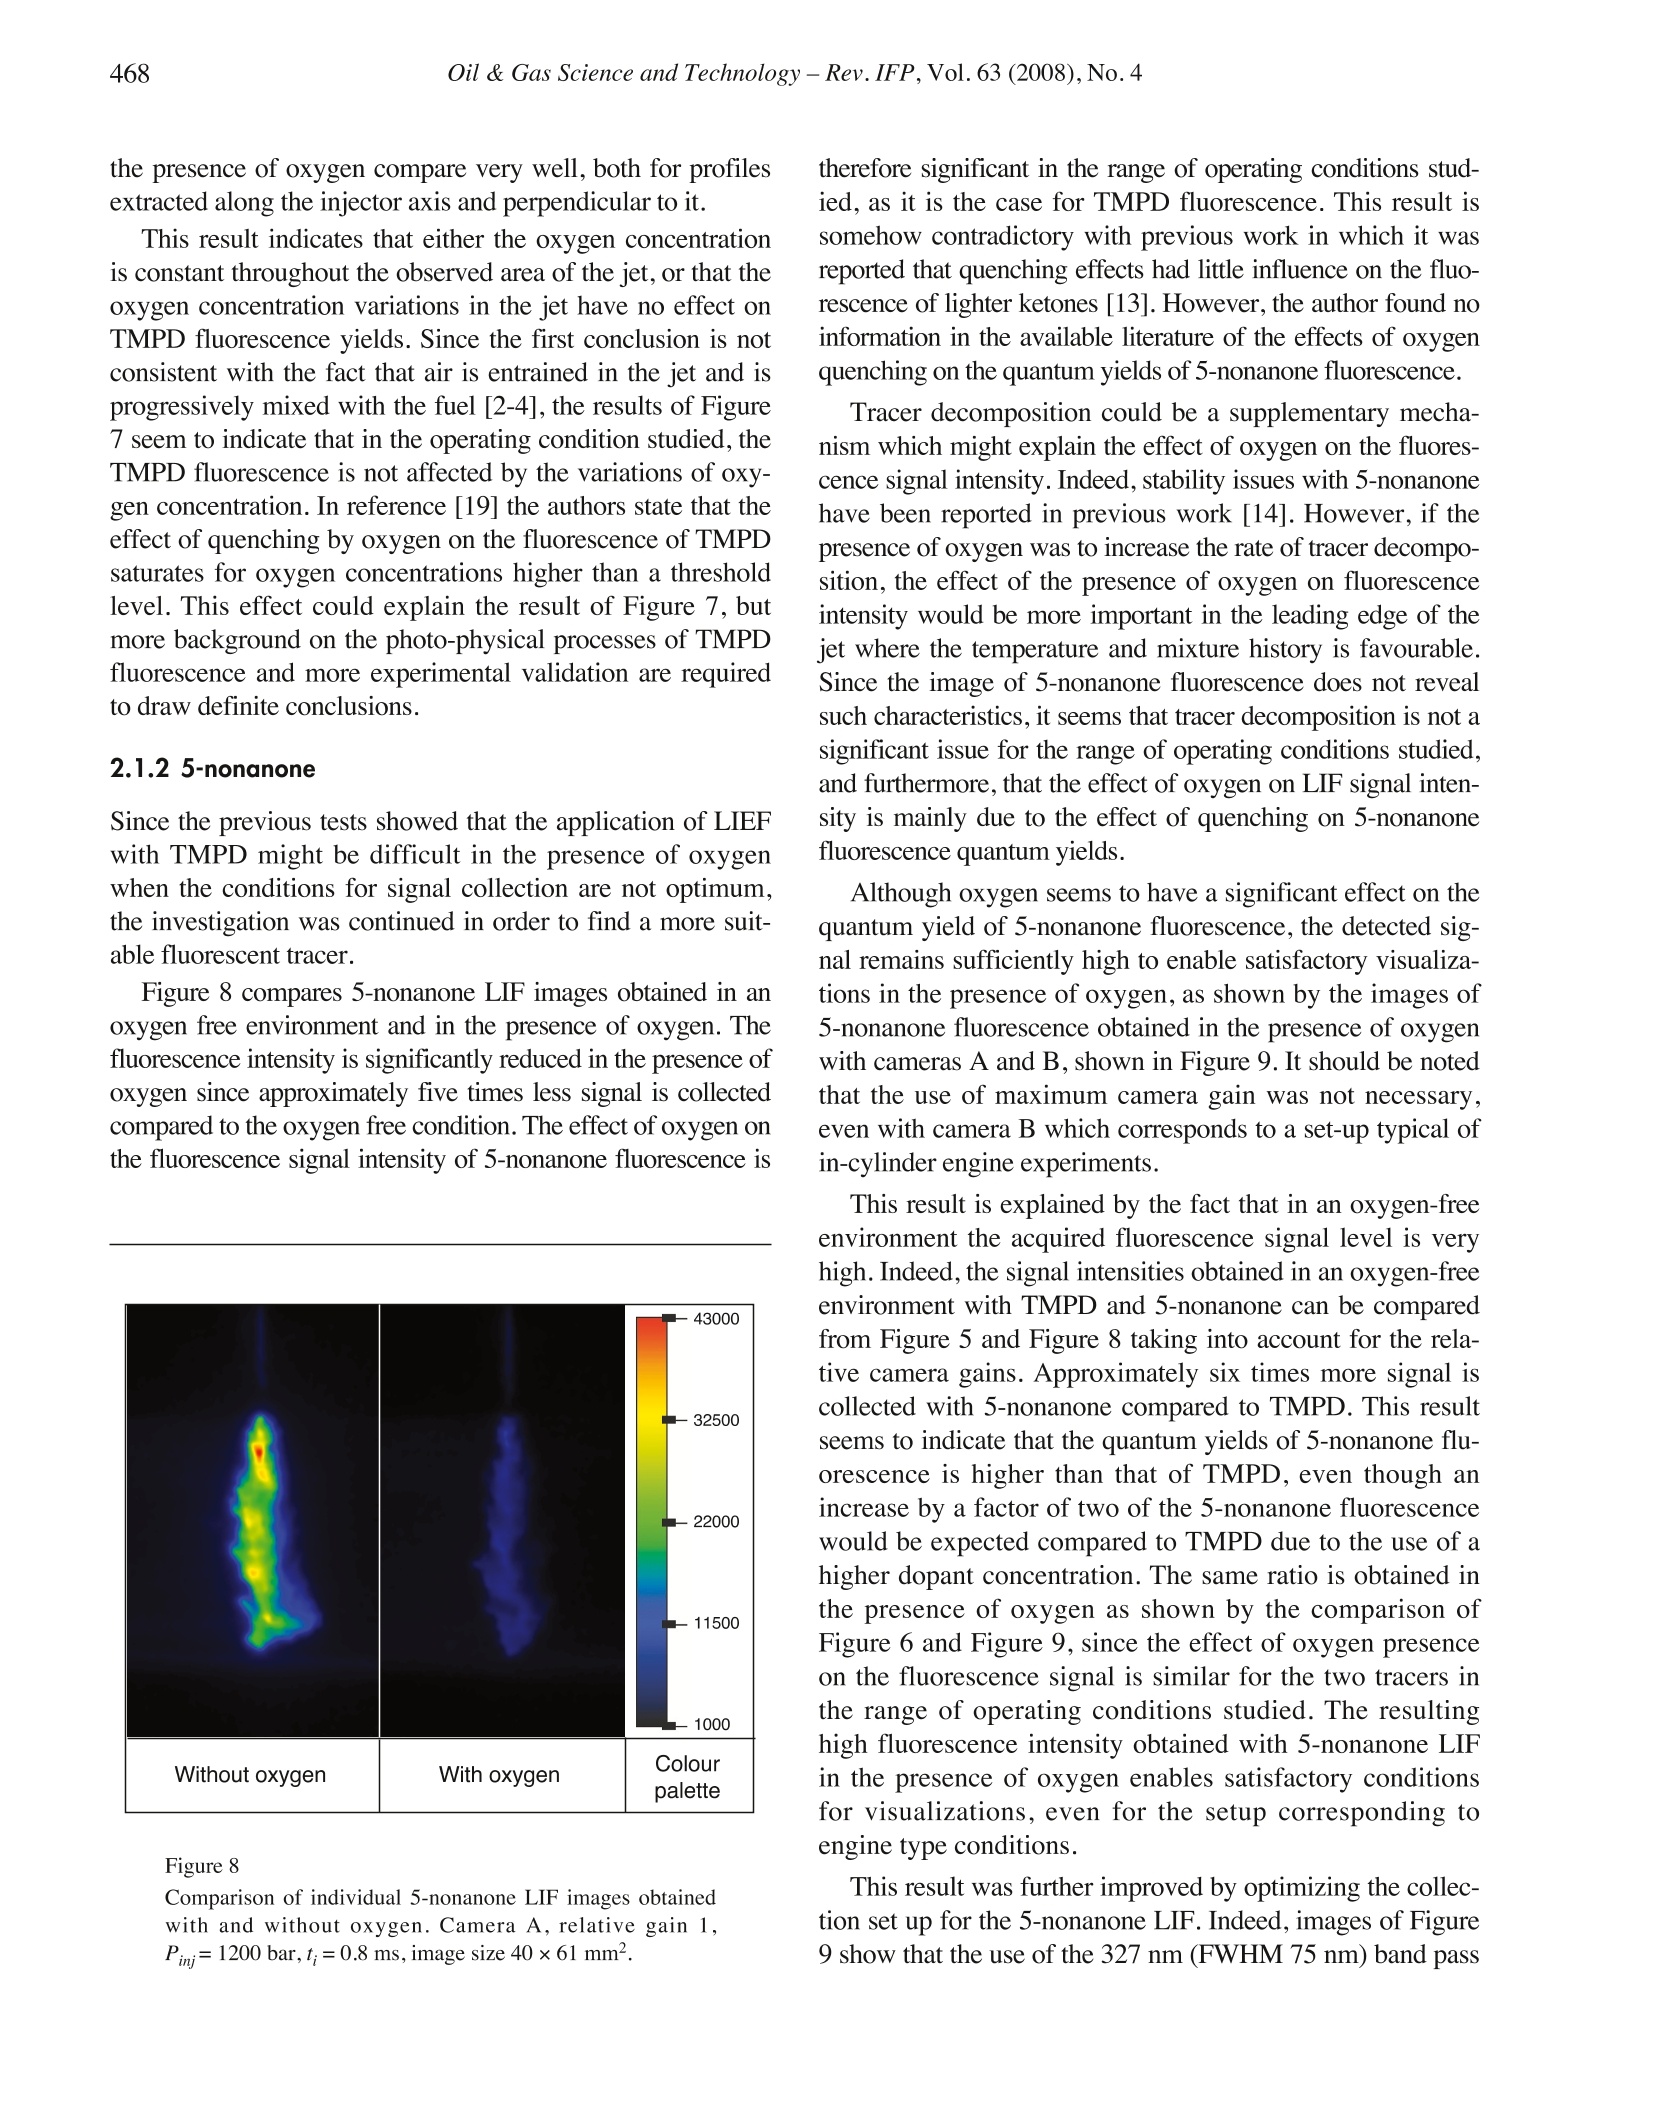
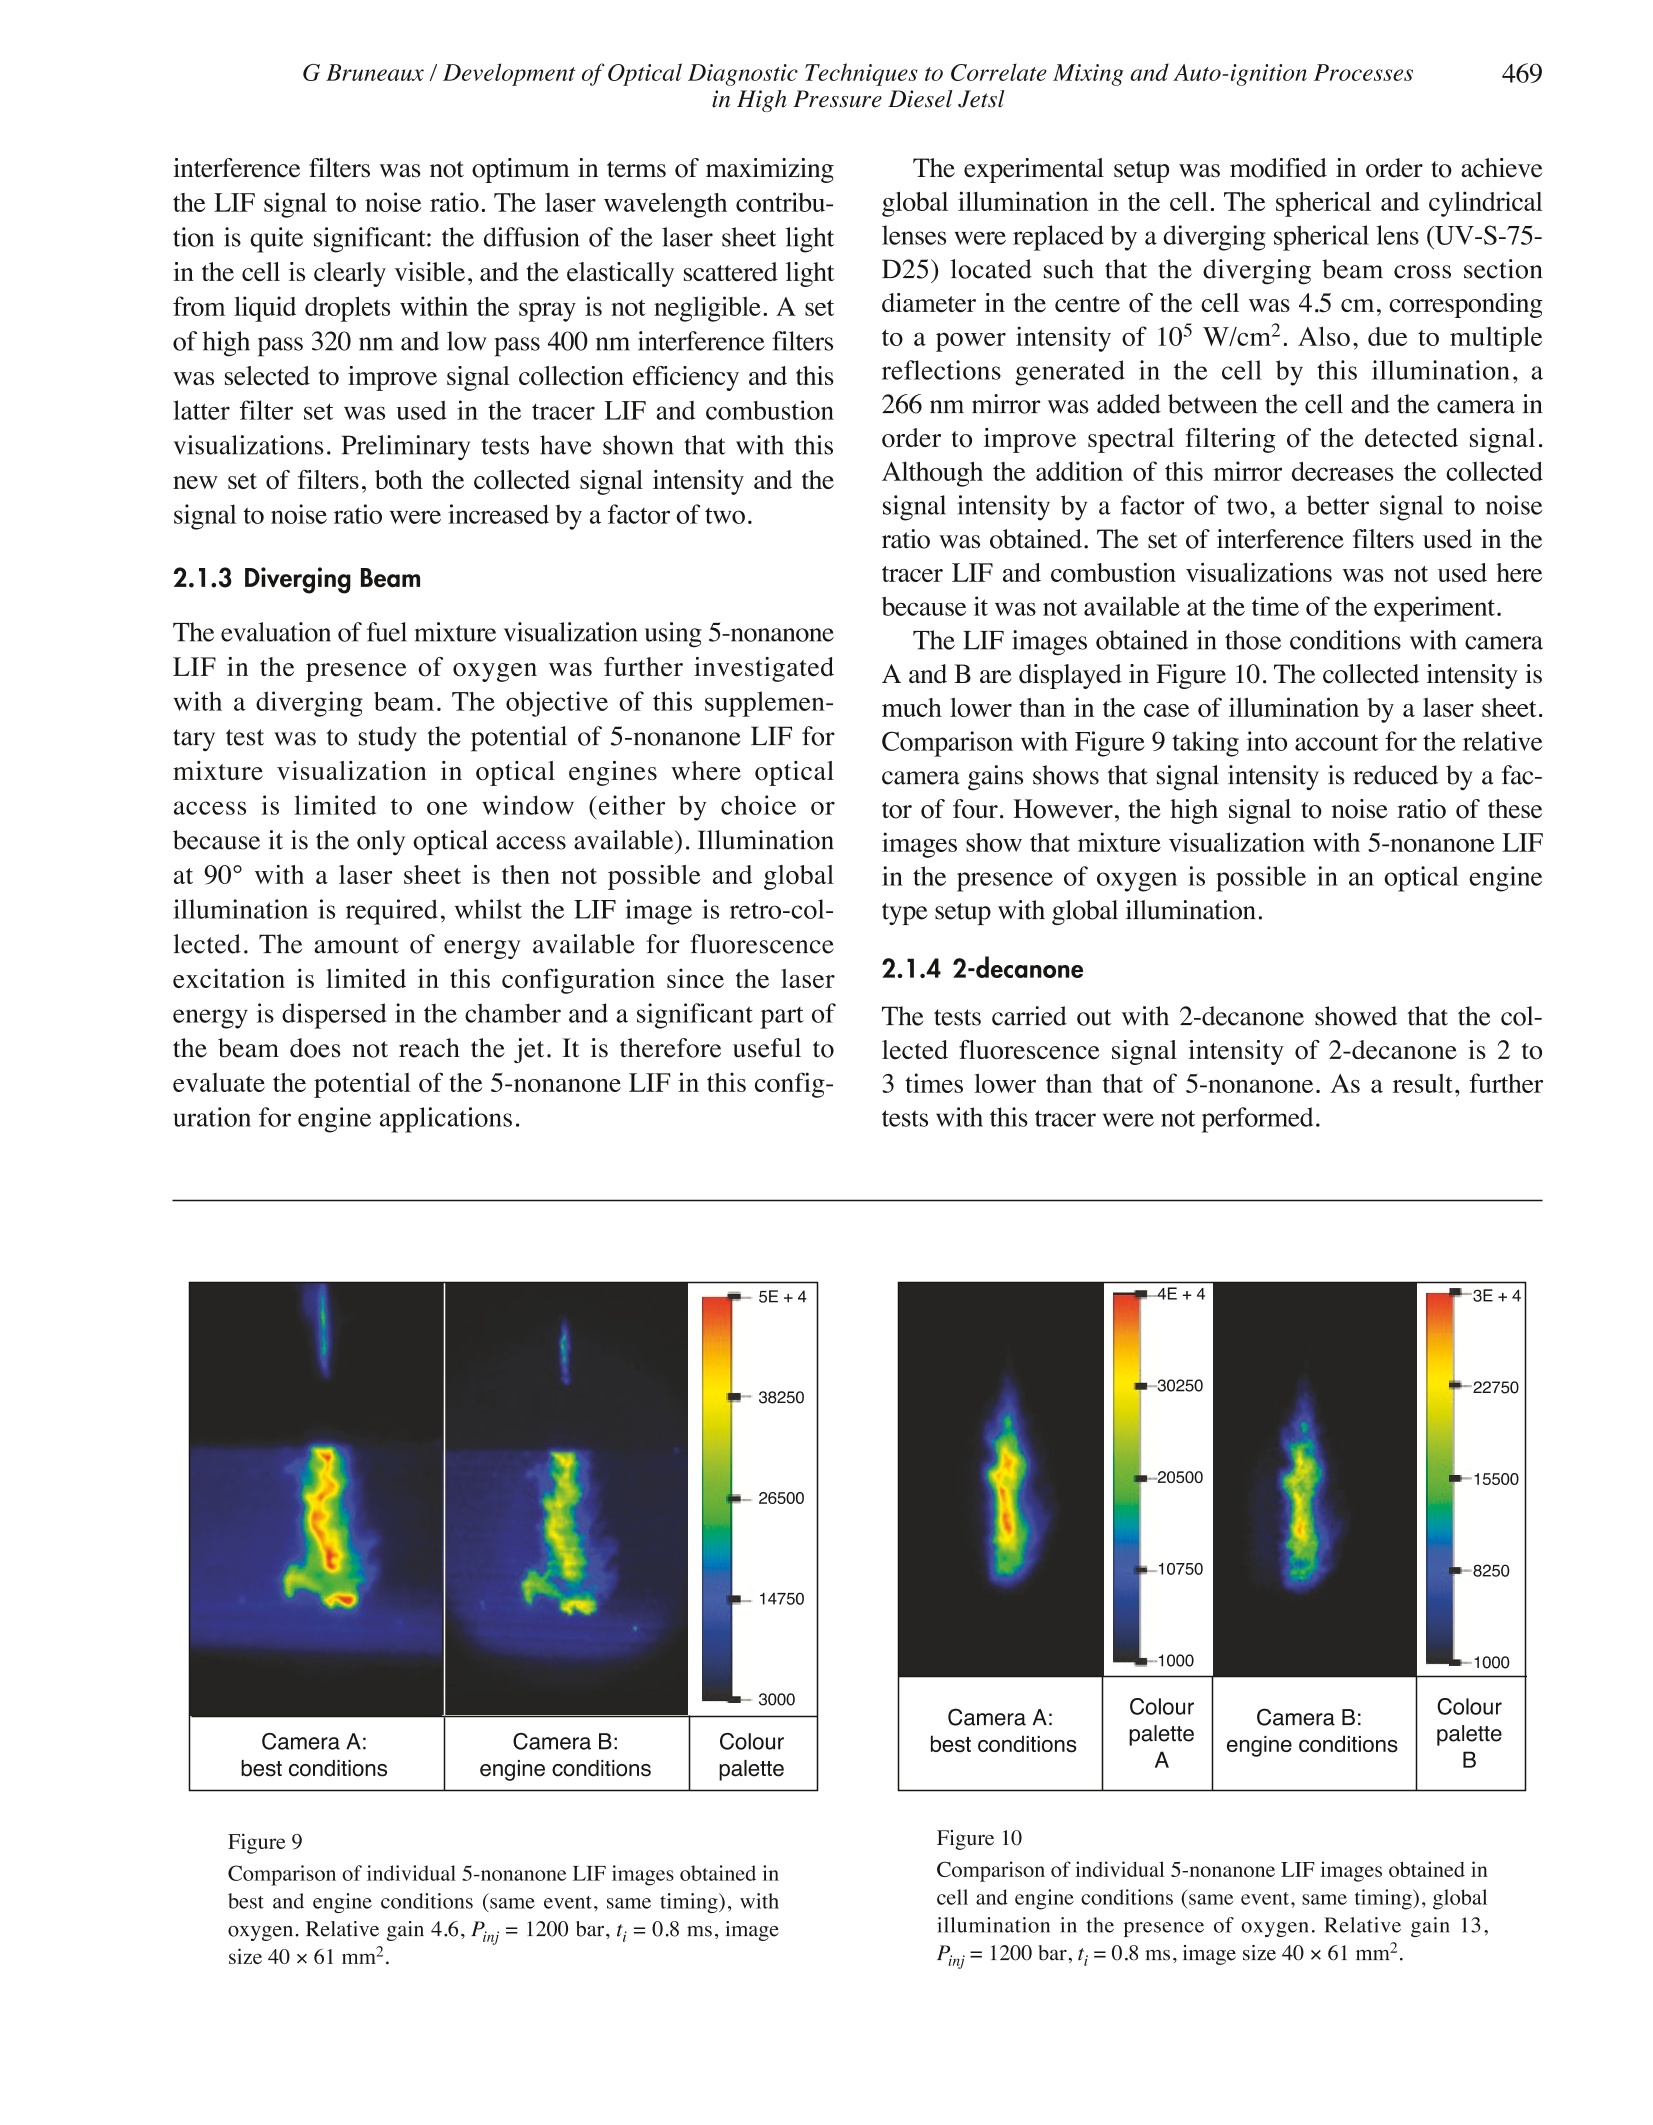
方案详情

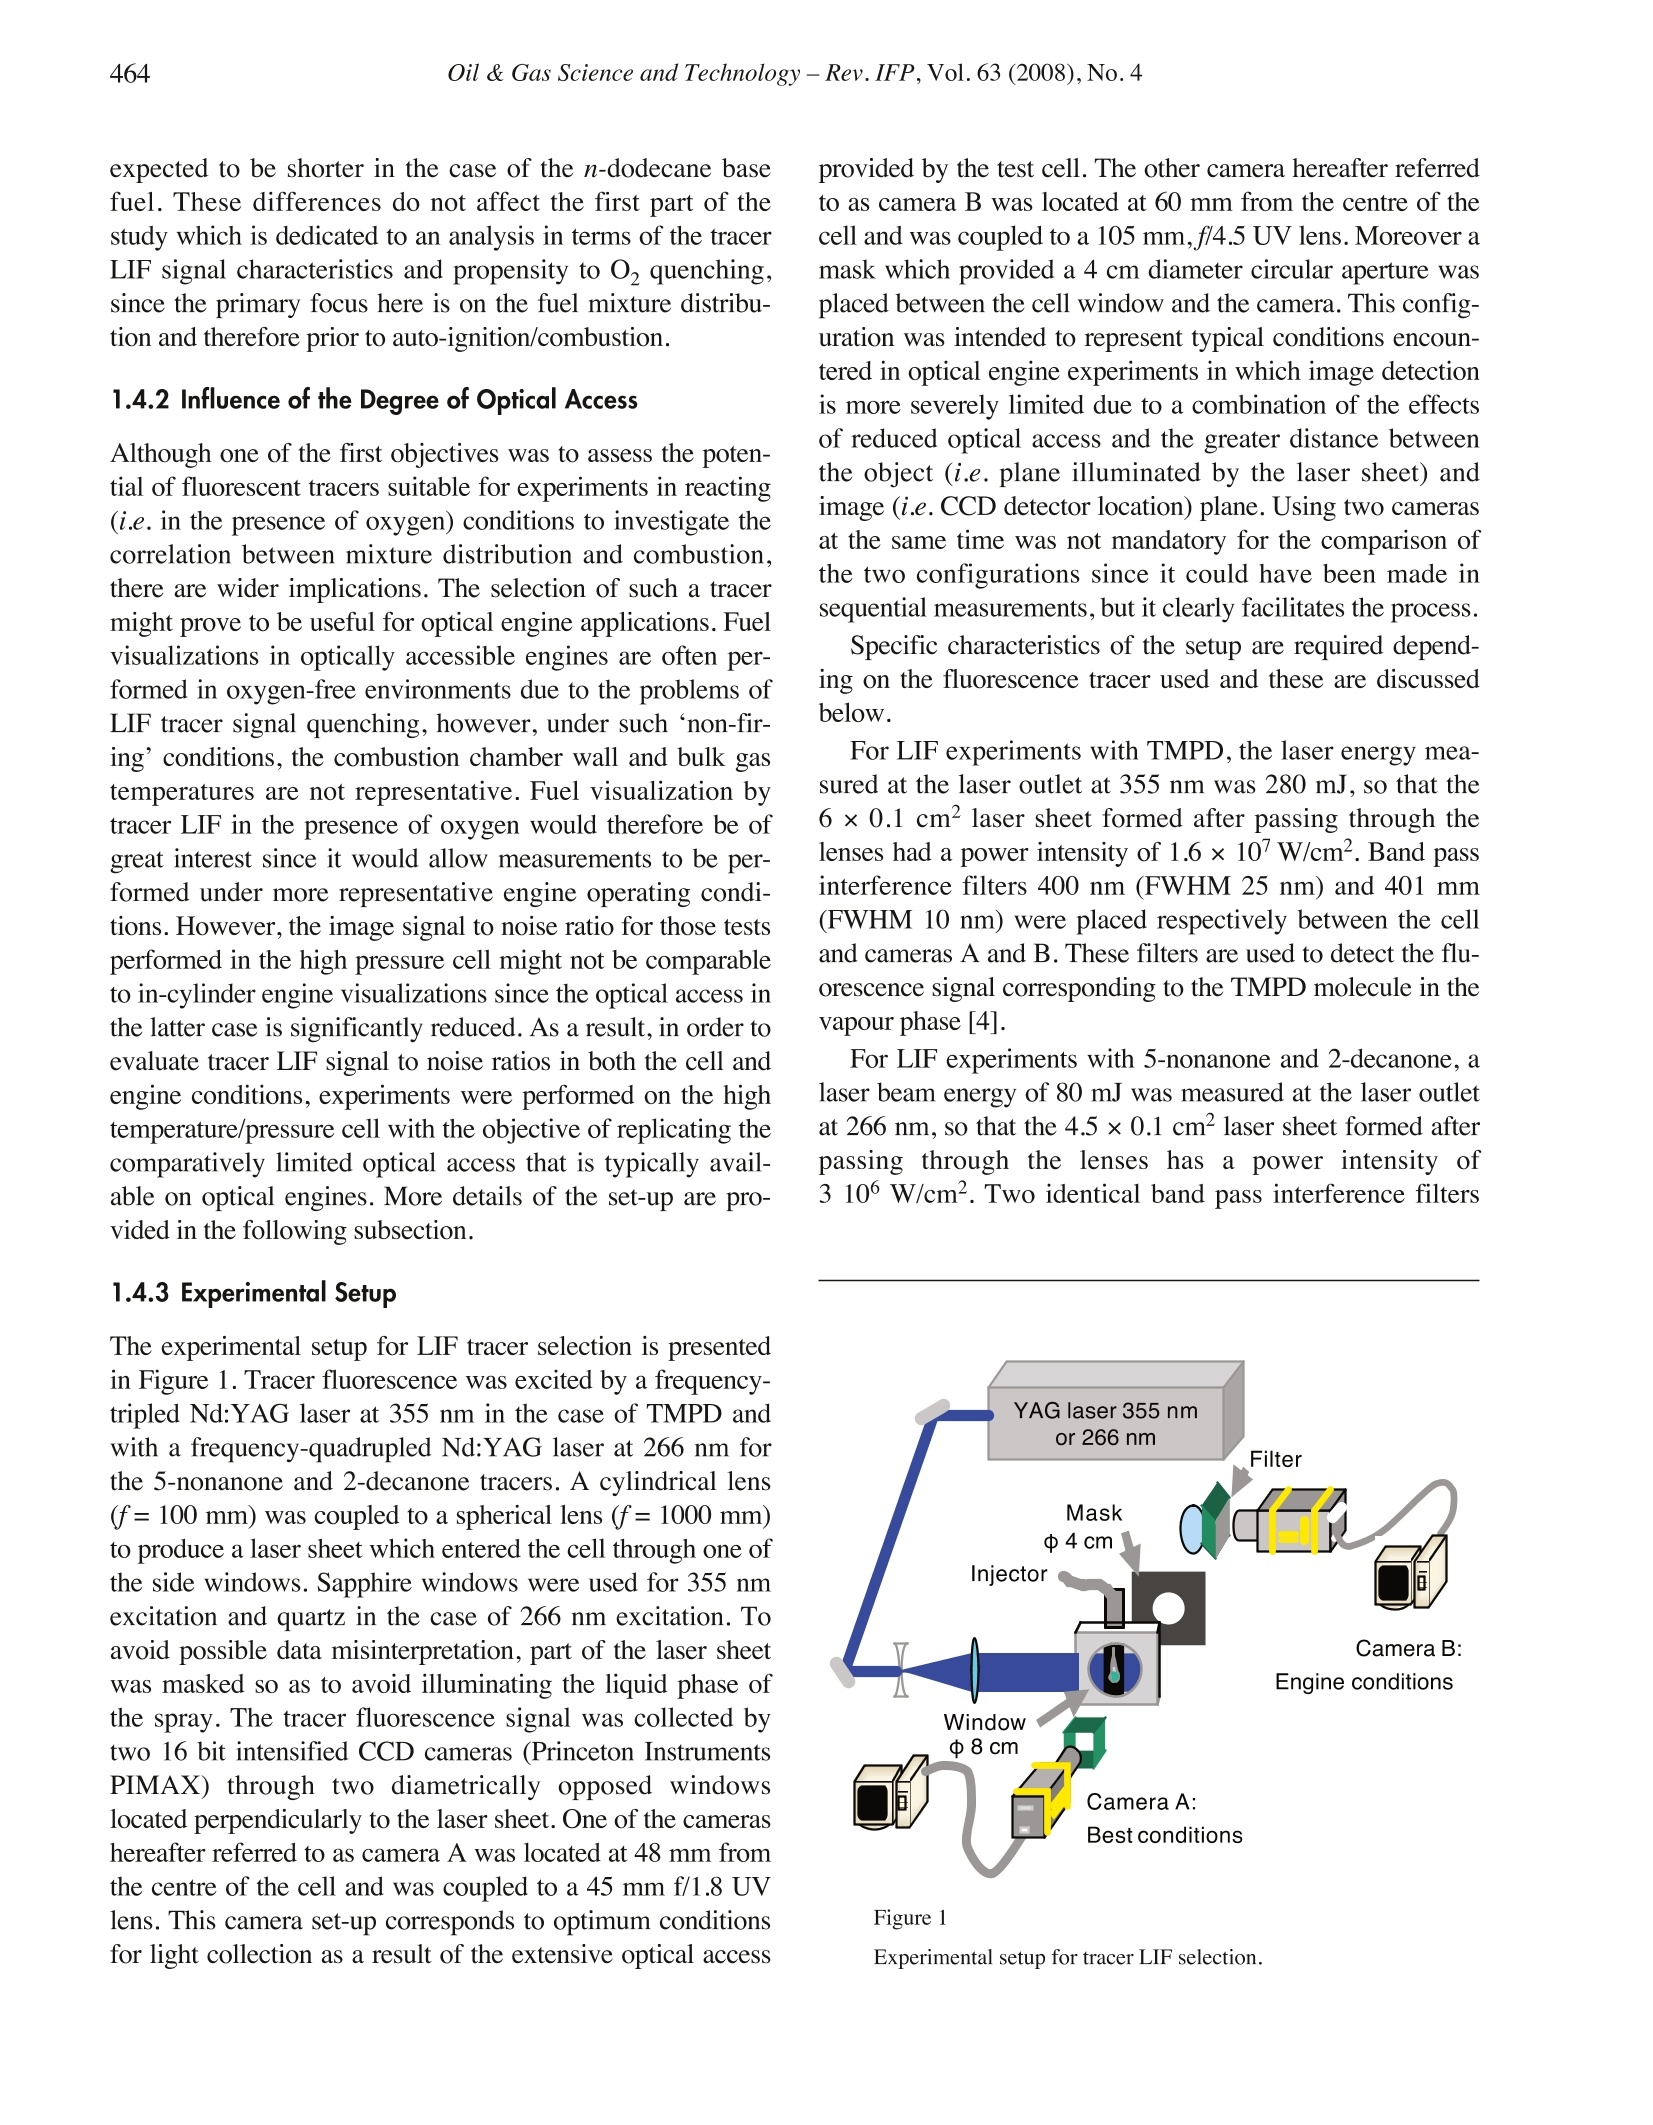
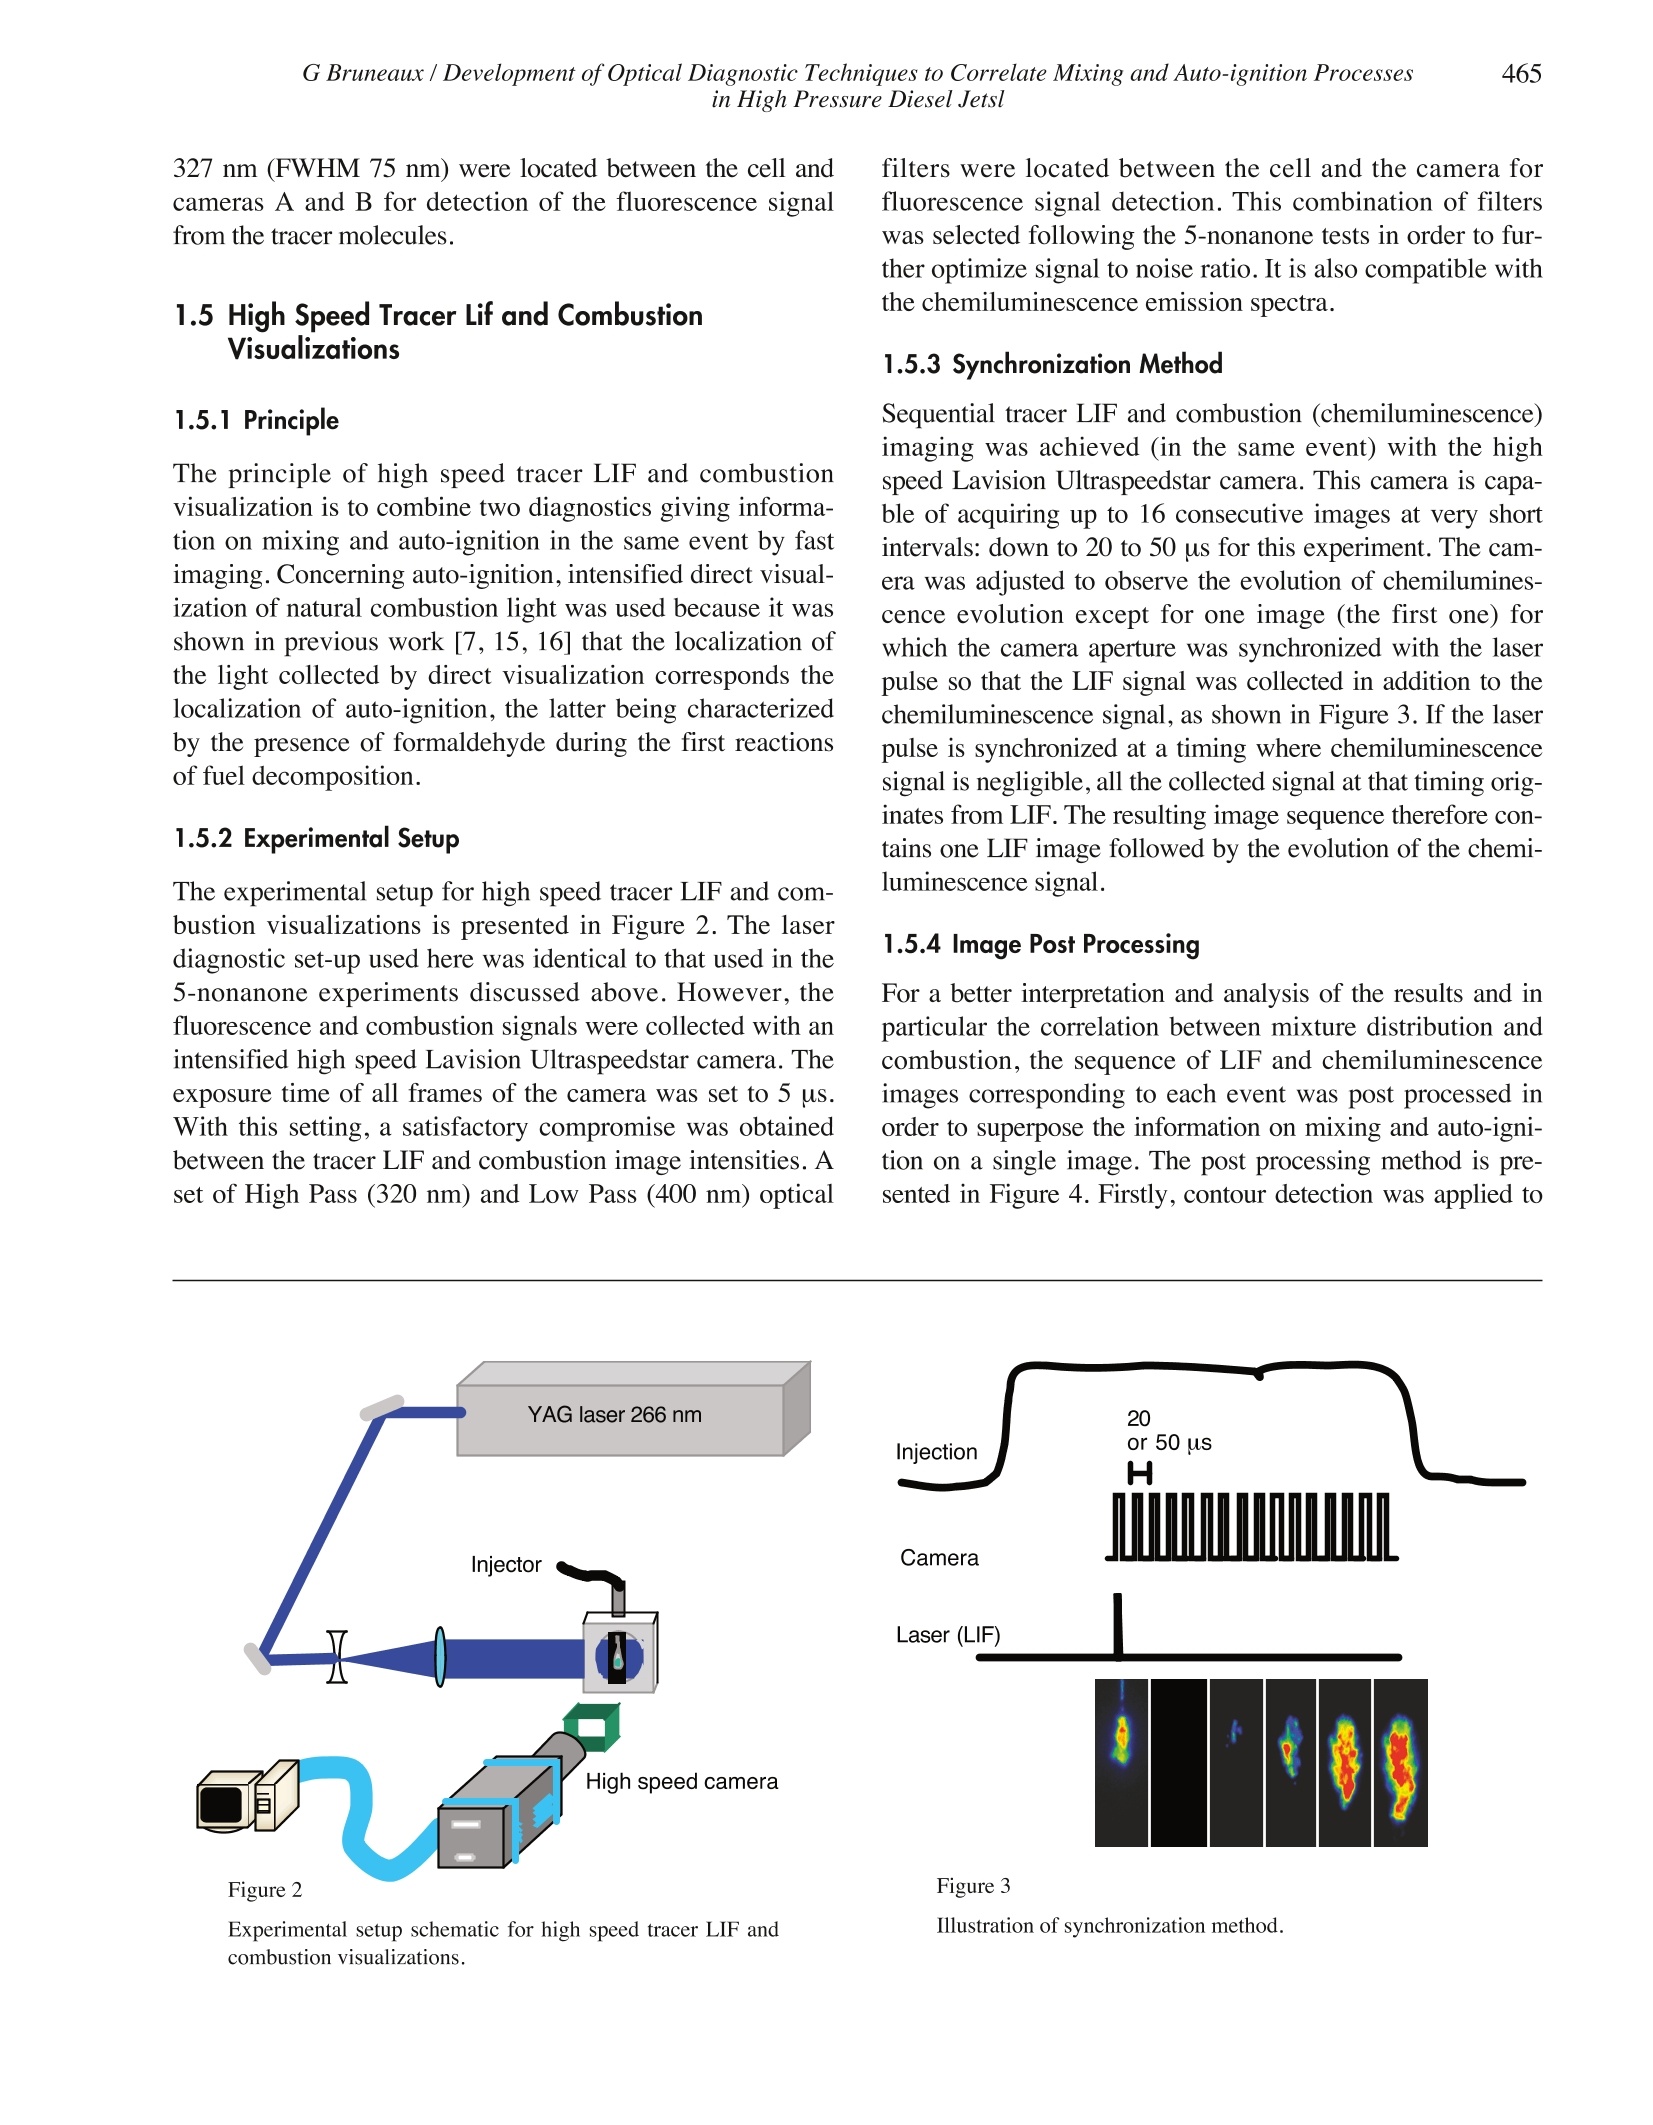
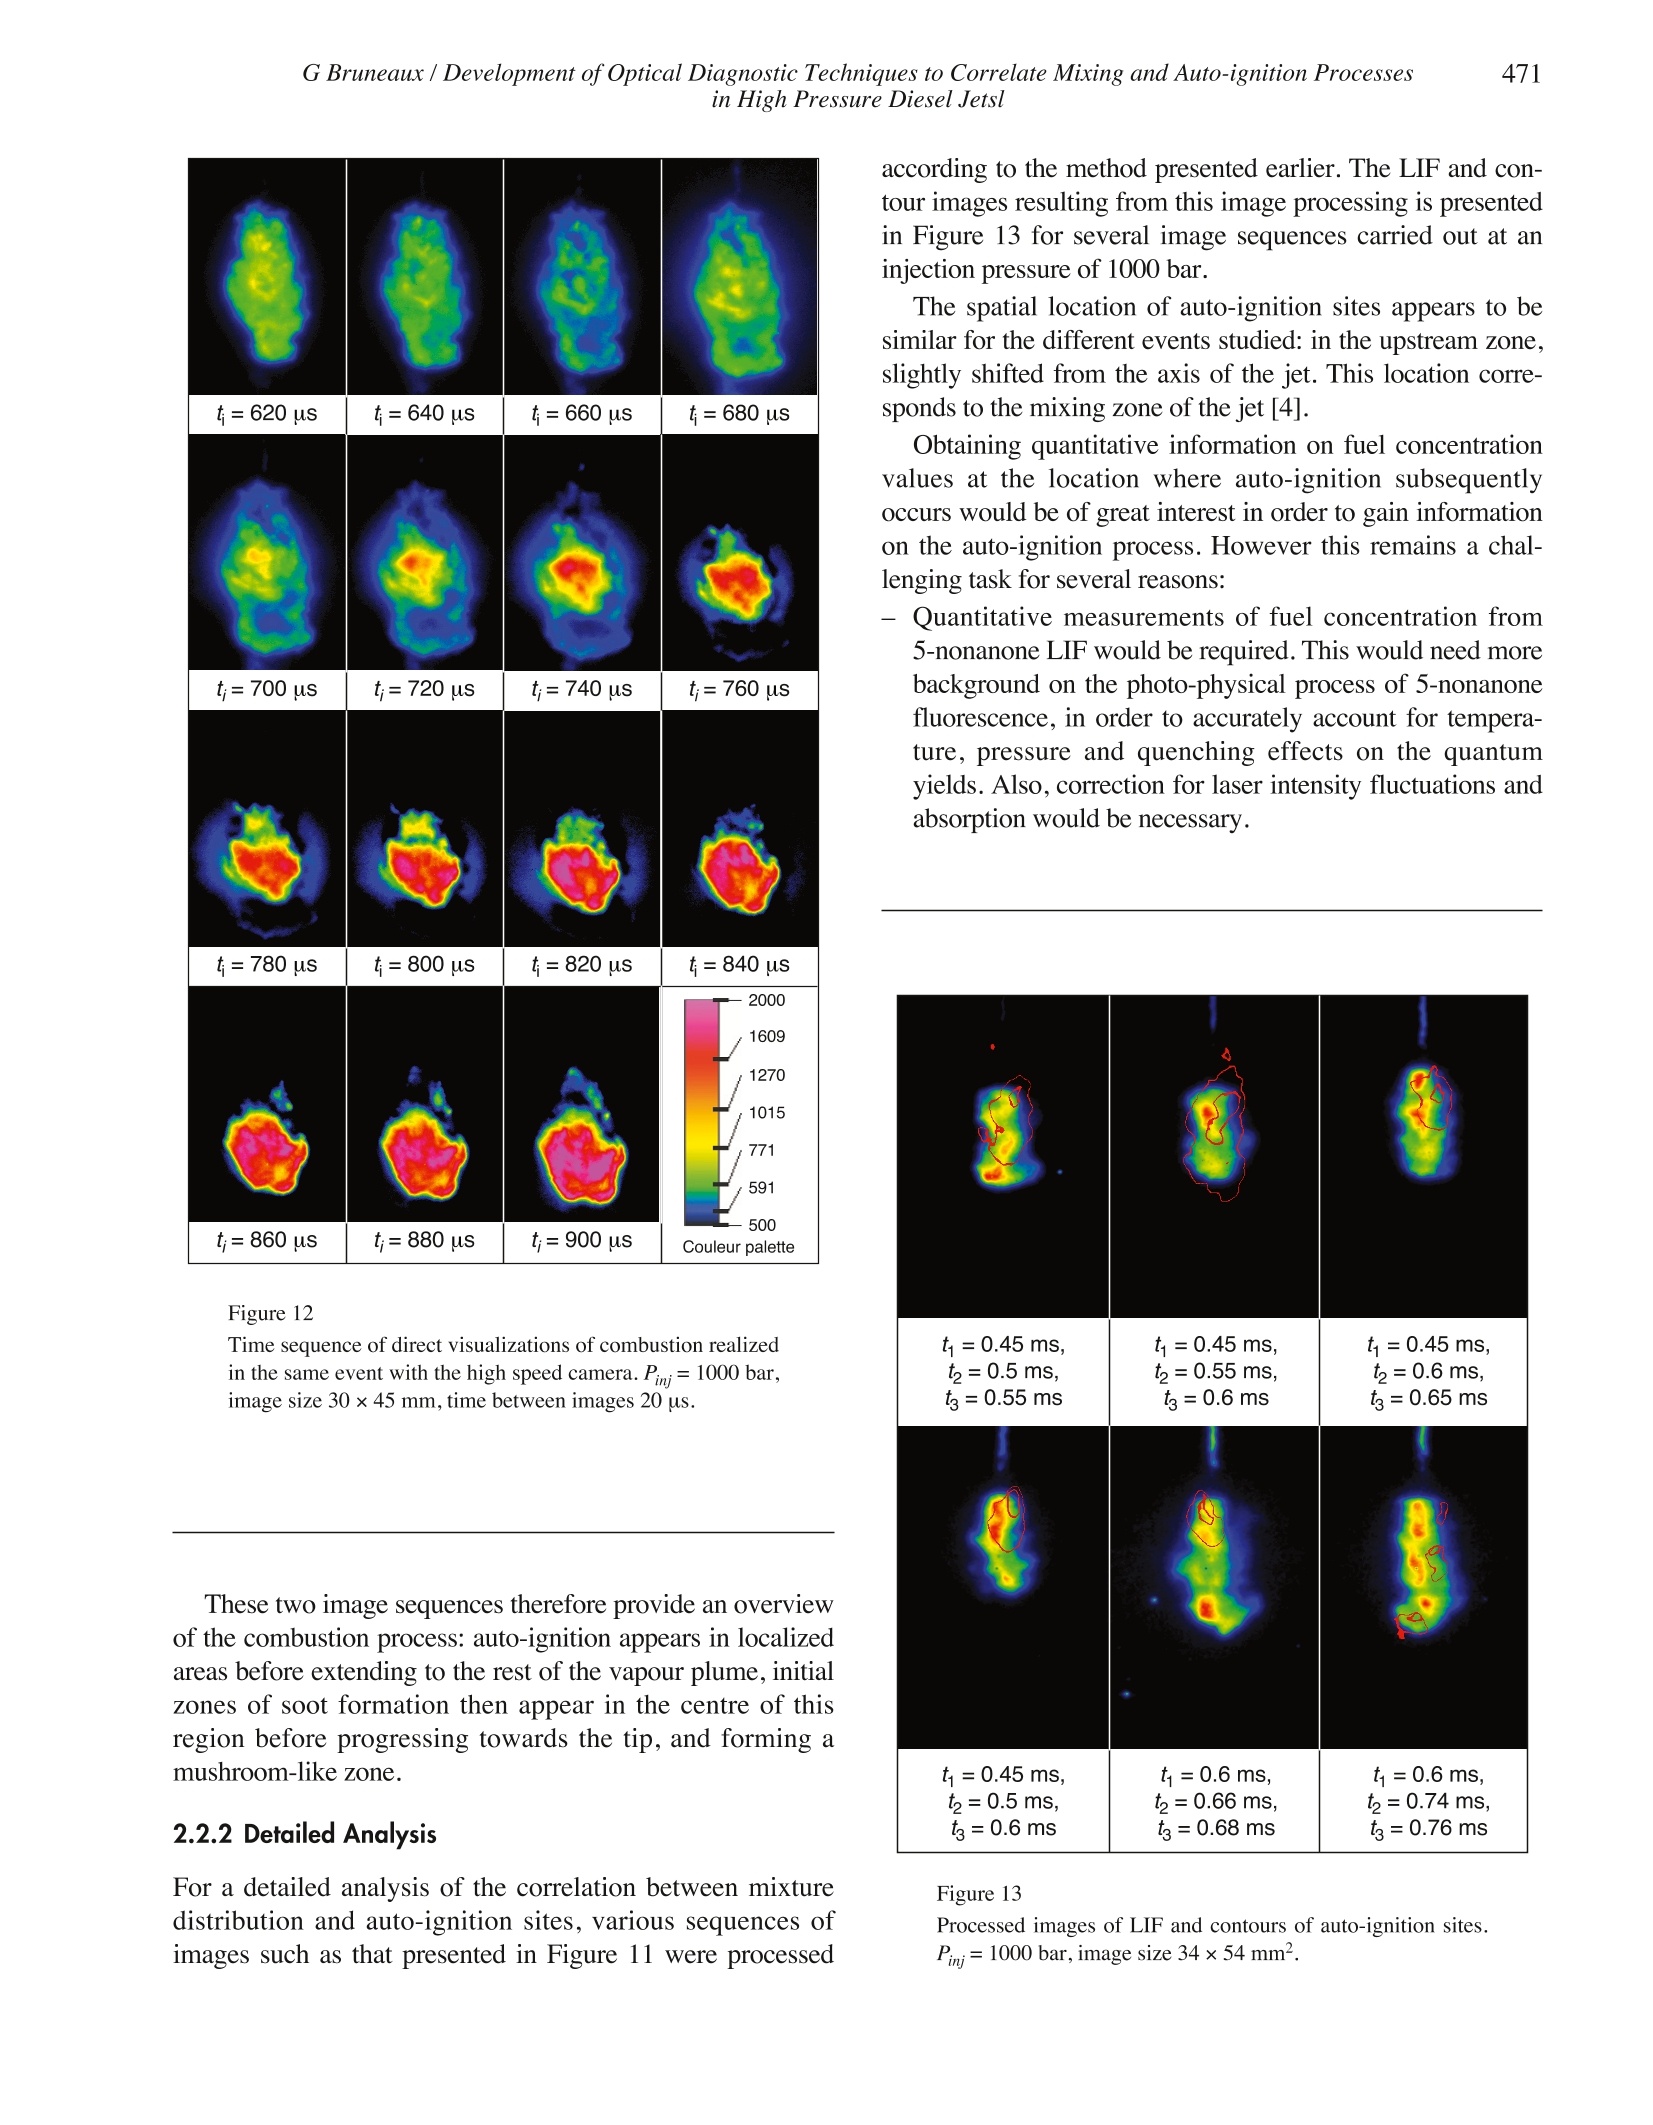
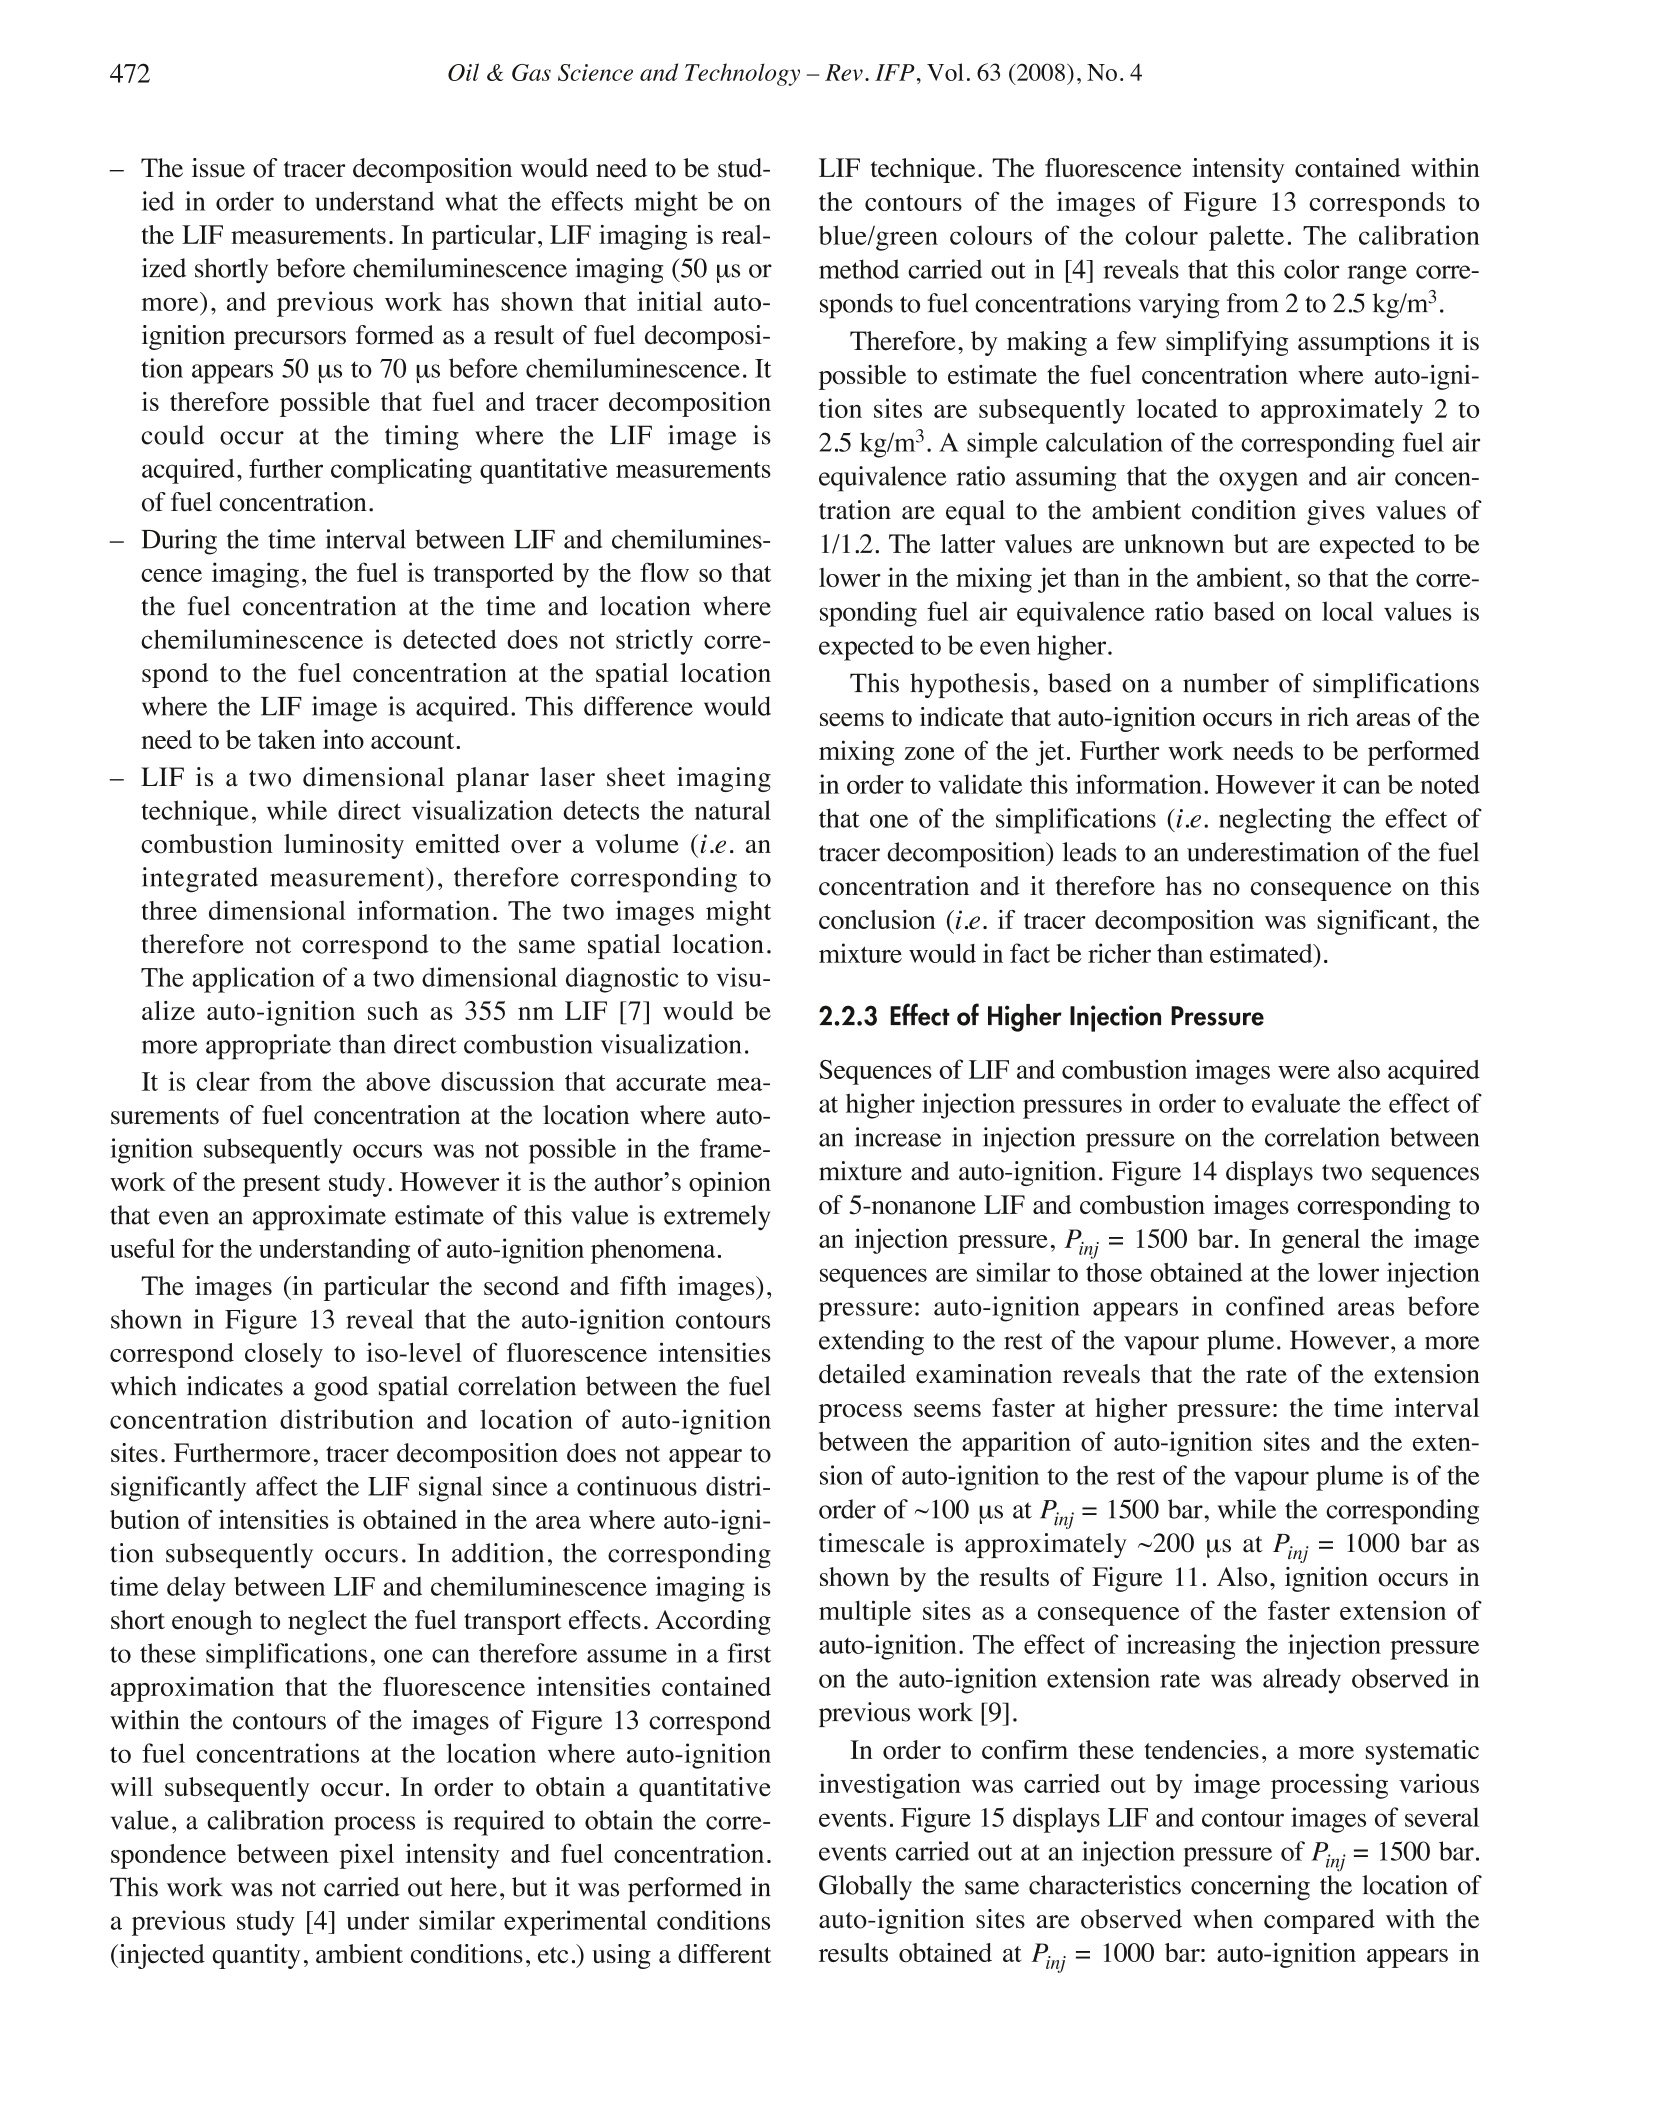
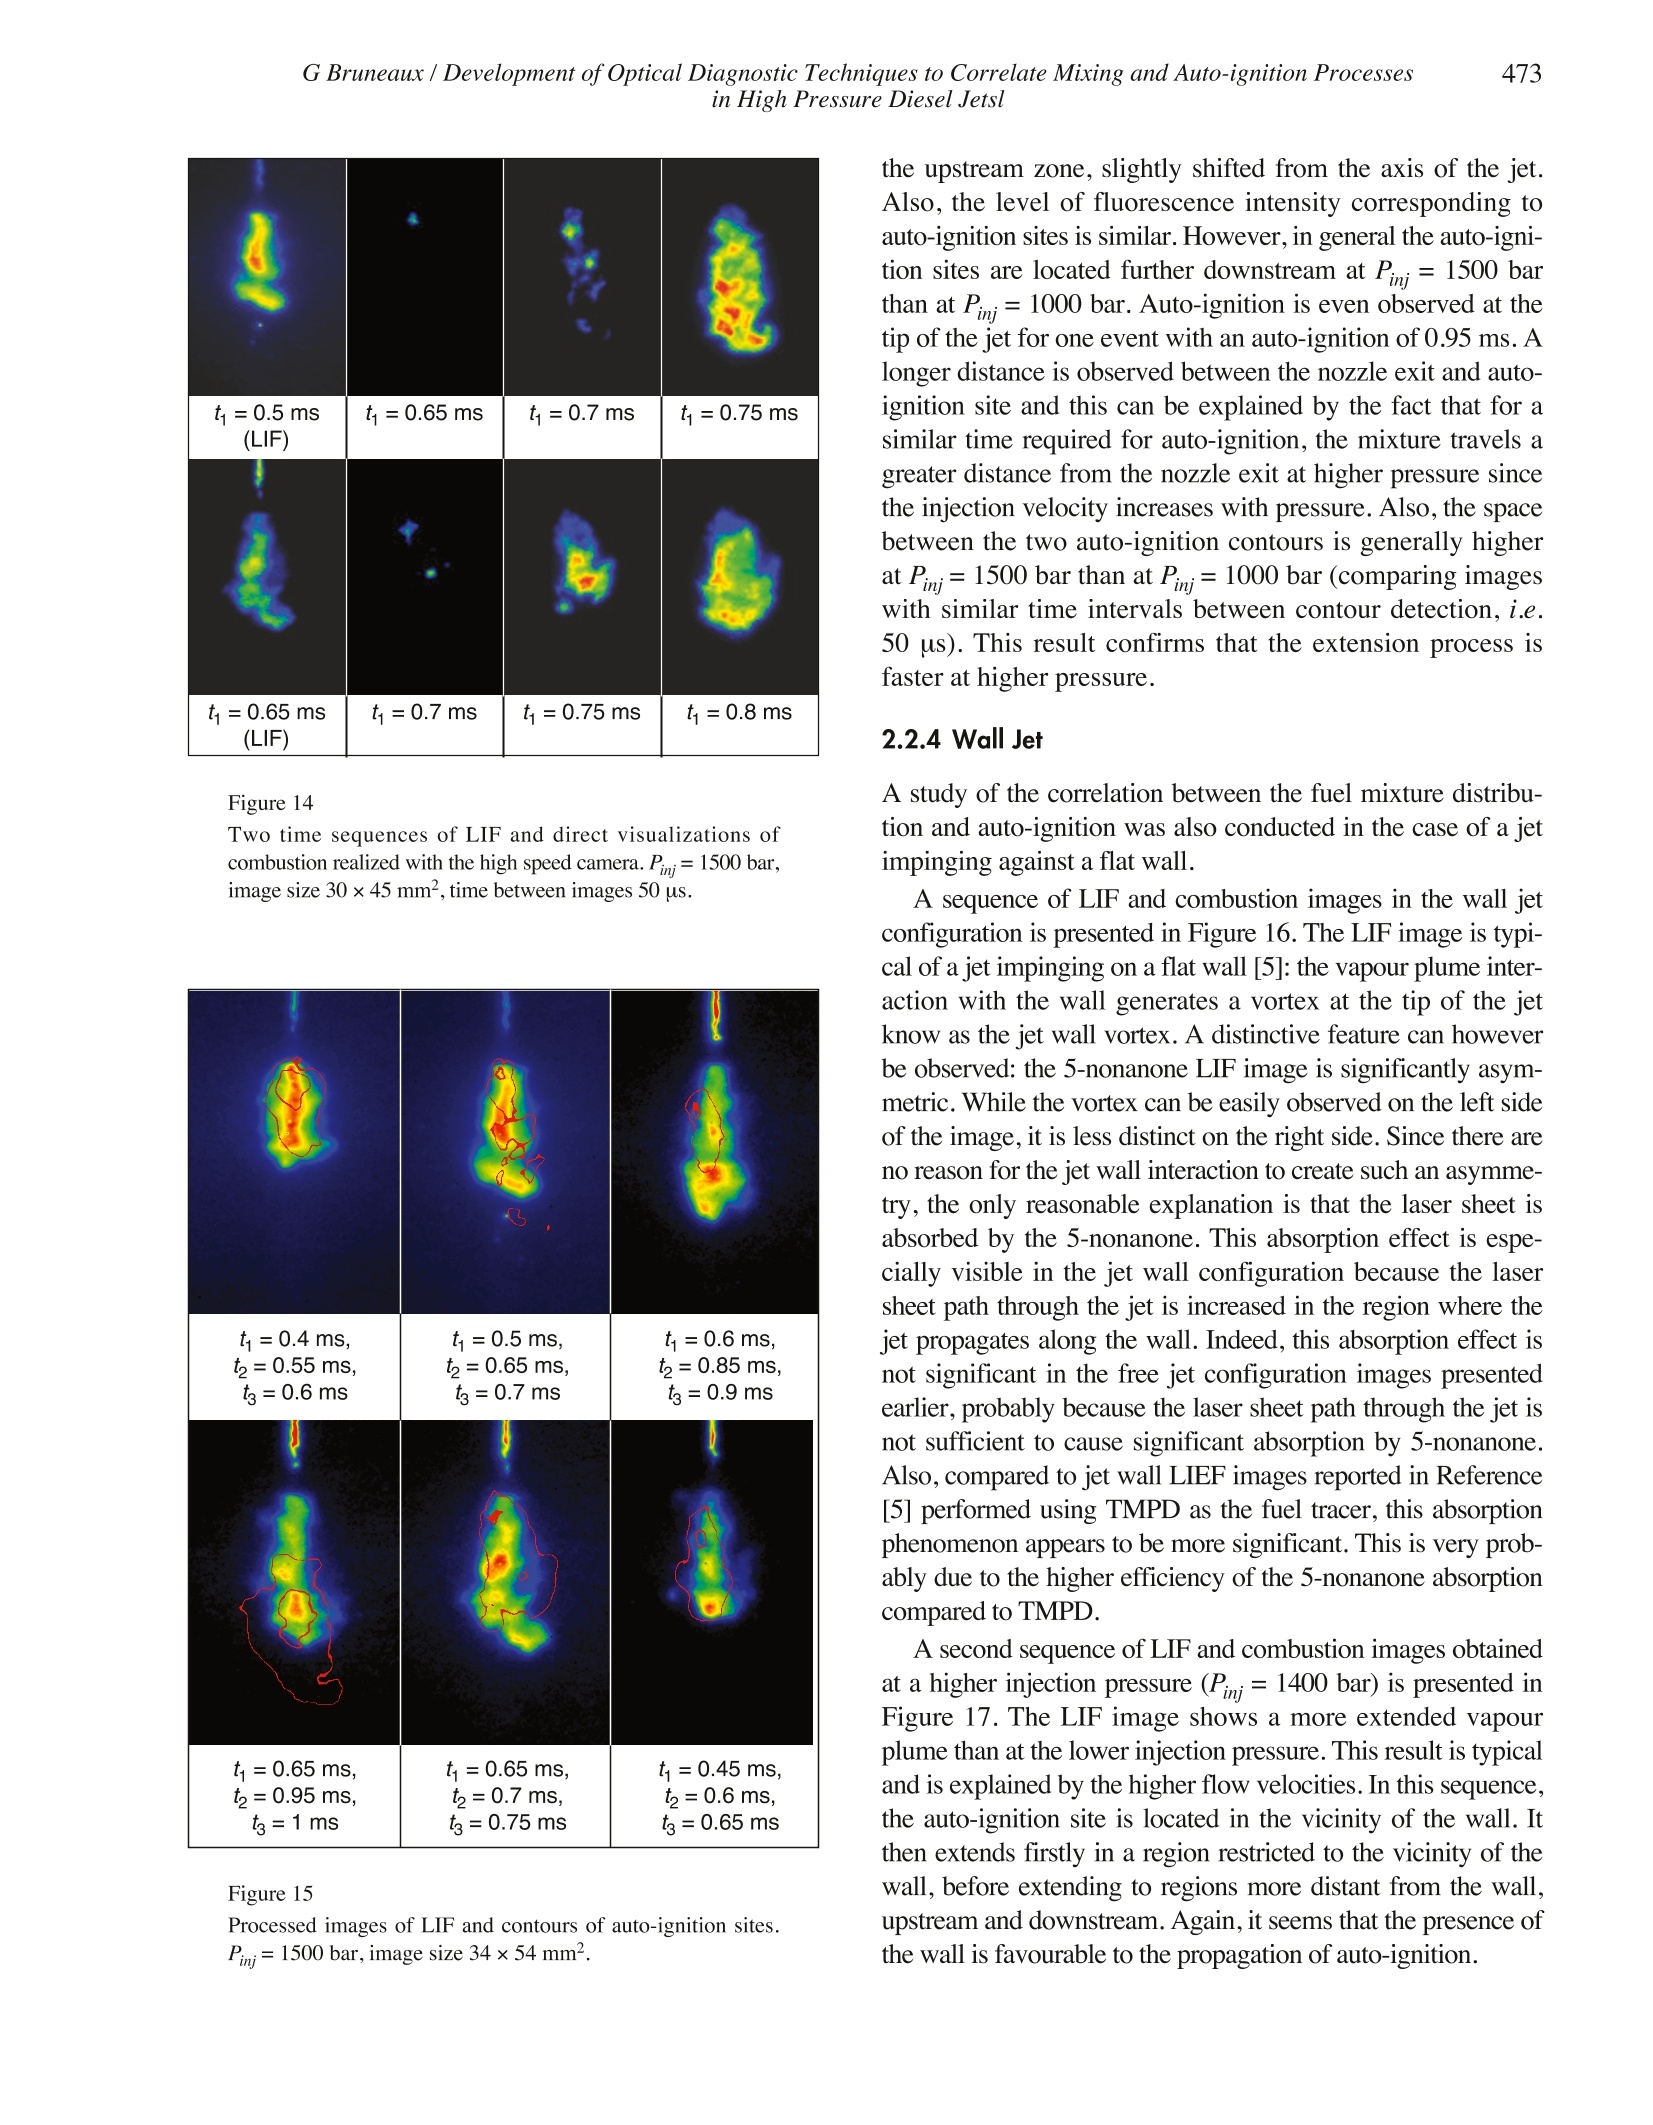
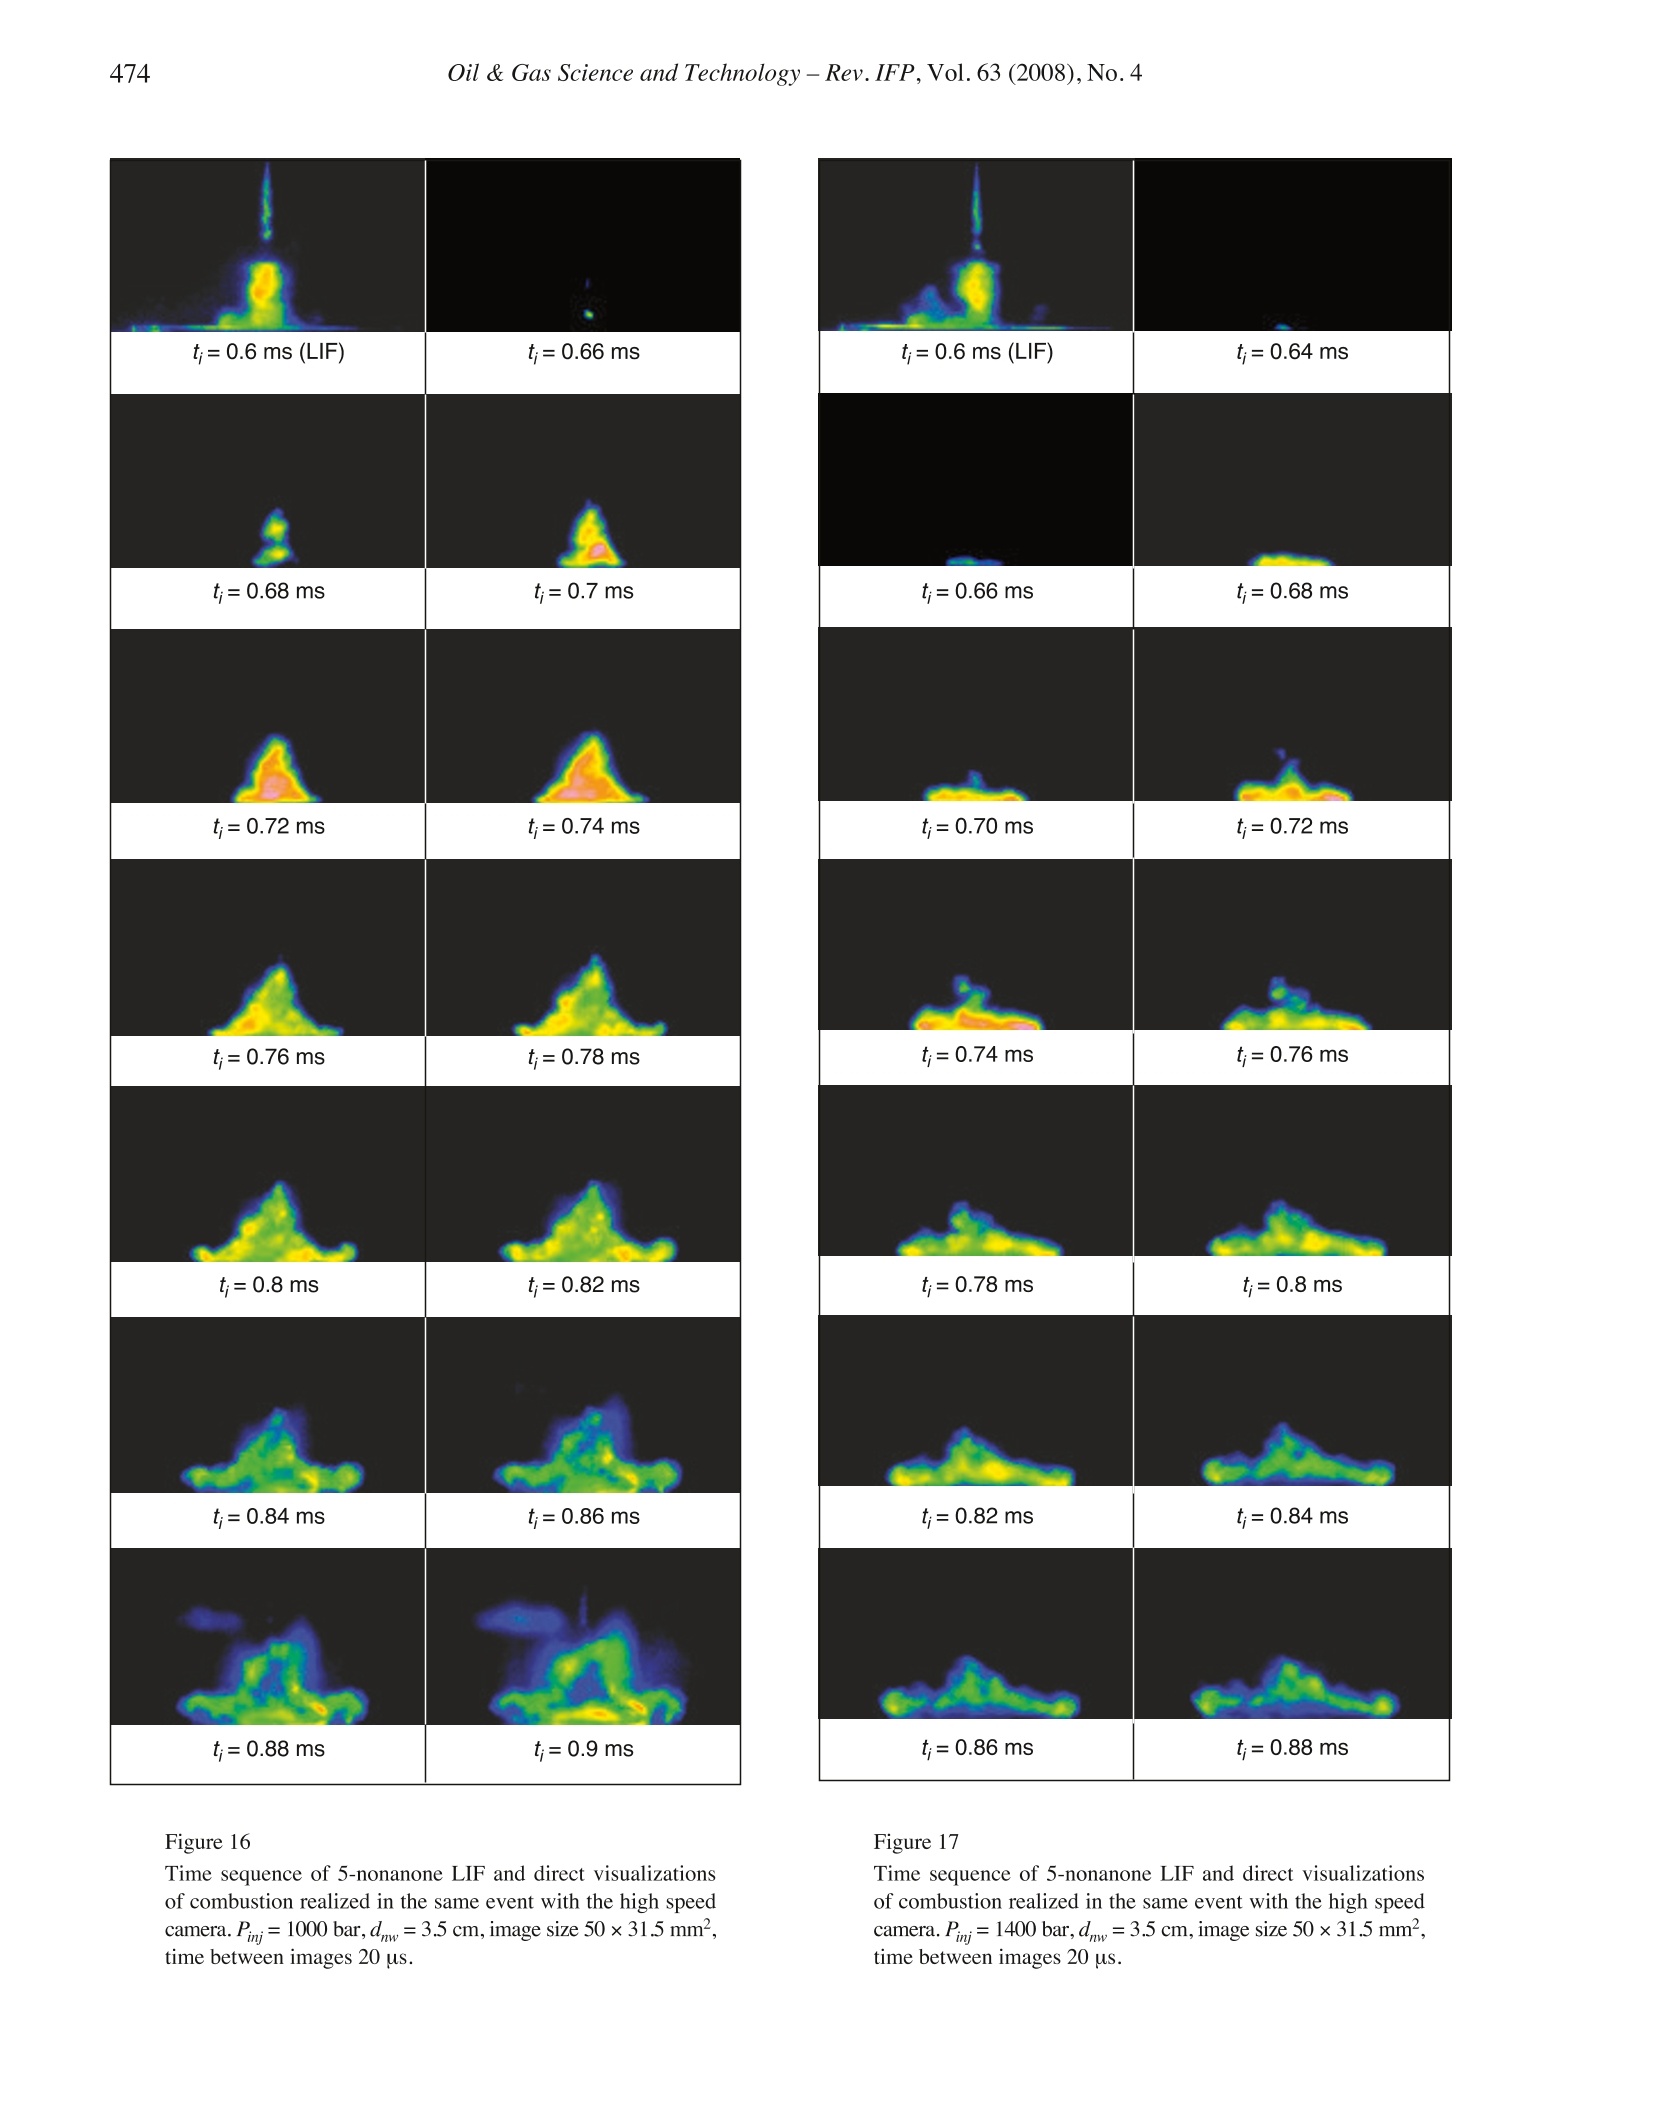
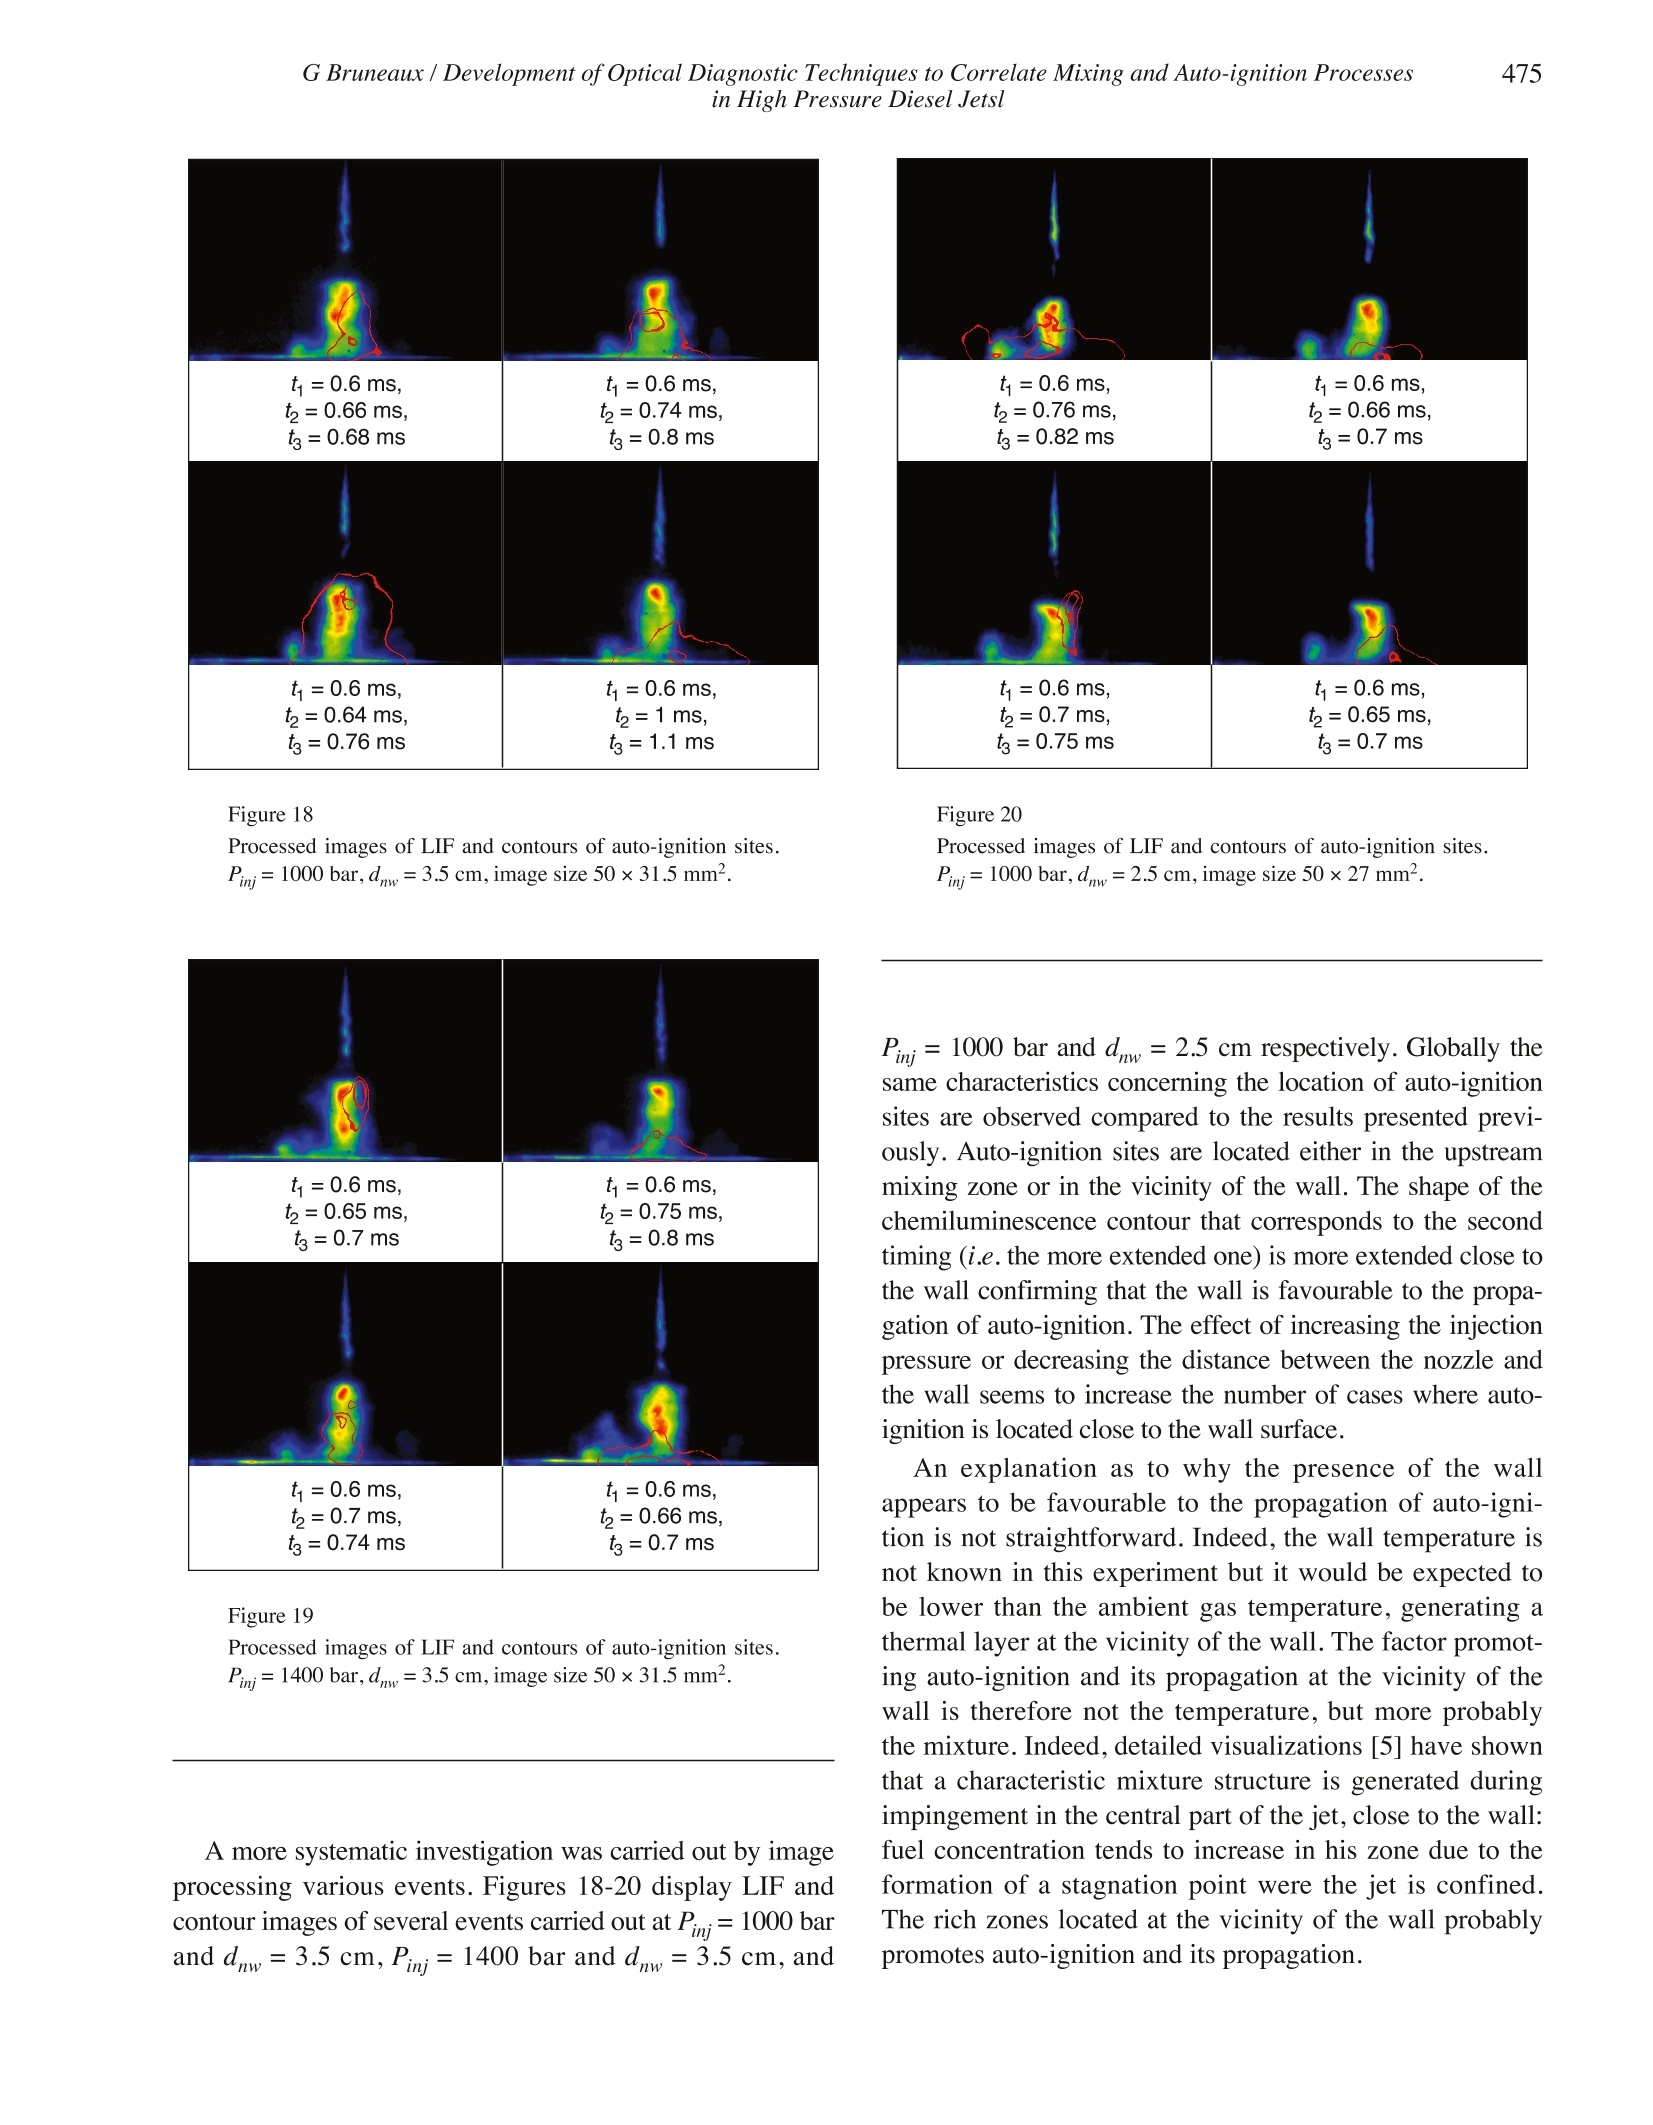
Oil& Gas Science and Technology-Rev. IFP,Vol. 63 (2008),No.4,pp. 461-477Copyright O 2008, Institut francais du petroleDOI: 10.2516/ogst:2008031Dossie r Oil & Gas Science and Technology-Rev. IFP,Vol.63 (2008), No.4462 Copyright C 2008 Institut francais du petrole Diesel Engines and Fuels: a Wide Range of Evolutions to Come Motorisation et carburants Diesel : un large spectre d'evolutions à venir Development of Optical Diagnostic Techniquesto Correlate Mixing and Auto-Ignition Processesin High Pressure Diesel Jets Gilles Bruneaux Institut francais du petrole, IFP, Division Techniques d'Applications Energetiques, 1-4 avenue de Bois-Preau, 92852 Rueil-Malmaison Cedex- Francee-mail: gilles.bruneaux@ifp.fr Resume -Developpement de techniques de diagnostic optique pour correler le melange et l'auto-inflammation en injection directe Diesel haute pression - Une technique de visualisation du carbu-rant par Fluorescence Induite par Laser (LIF) en presence d'oxygene est developpee pour Ietude de I'in-jection directe Diesel haute pression. Un nouveau traceur, le 5 nonanone, est selectionne sur la base d’uneetude bibliographique. Des essais sont effectues avec ce dernier dans une enceinte haute pression hautetemperature qui reproduit les conditions thermodynamiques rencontrees dans la chambre de combustiond’un moteur Diesel au moment de l'injection. Ils montrent que le signal de fluorescence collecte a l’airest suffisamment important pour permettre d'envisager des visualisations du carburant en presenced’oxygene dans des configurations difficiles, comme par exemple par illumination globale.Ensuite, latechnique de LIF a l'air est combinee a une visualisation rapide de la chimiluminescence afin d'analyserla correlation entre la structure du melange et l'auto-inflammation du jet Diesel. Dans la configurationd'un jet libre et dans la gamme de parametres etudies, I'auto-inflammation est principalement localiseedans des zones riches en amont de la zone de melange. Dans la configuration d'un jet interagissant avecune paroi perpendiculaire,l'auto-inflammation apparait dans le centre du jet et se propage aux extremitesau voisinage de la paroi. Abstract - Development ofOptical Diagnostic Techniques to Correlate Mixing and Auto-IgnitionProcesses in High Pressure Diesel Jets- A tracer laser-induced fluorescence (LIF) technique for thevisualization offuel distribution in the presence ofoxygen was developed and then used sequentially withhigh speed chemiluminescence imaging to study the correlation between the mixing and auto-ignitionprocesses of high pressure Diesel jets. A single hole common rail Diesel injector allowing high injectionpressures up to 150 MPa was used. The reacting fuel spray was observed in a high pressure, high tem-perature cell that reproduces the thermodynamic conditions which exist in the combustion chamber ofaDiesel engine during injection. Both free jet and flat wall impinging jet configurations were studied.Several tracers were first considered with the objective of developing a tracer-LIF technique in the pres-ence of oxygen. 5-nonanone was selected for its higher fluorescence efficiency. This technique was subsequently combined with high speed chemiluminescence imaging to study the correlation between mixingand auto-ignition. In the free jet configuration and for the parameter range studied, it was found thatauto-ignition is preferentially located in rich regions of the upstream mixing zone. Also, in the jet wallconfiguration, auto-ignition appears in the centre of the jet and propagates towards the periphery, in thevicinity of the wall. DEFINITIONS, ACRONYMS, ABBREVIATIONS Nozzle hole diameter (mm) Distance between the nozzle and the wall in the jet wallconfiguration (mm) LIF JLaser Induced Fluorescence LIEF Laser Induced Exciplex Fluorescence inj Injection pressure (bar) ti Time between the start of injection and imaging (ms) Horizontal abscissa, origin at the nozzle hole centre (mm) y Vertical abscissa, origin at the nozzle hole centre (mm) INTRODUCTION High Pressure Direct Injection (HPDI) is now a well-estab-lished technology which allows the efficient reduction ofengine-out emissions in DI Diesel engines. But althoughongoing research on HPDI has led to an improved under-standing of the physical processes occurring in the combus-tion chamber, further studies are required in order to ensurethat this technology is exploited to its full potential in termsof optimizing combustion processes. Numerous studies onthe mixing [1-5] and combustion processes [6-8] have beenreported in the literature, however there is a need for animproved understanding of the correlation between these twoprocesses. This is the primary aim of the present work and isbased upon the application of optical diagnostics. In order to achieve this goal, sequential diagnostics ofboth mixing and combustion processes are to be applied to aDiesel jet. However, established diagnostics for mixing stud-ies such as Laser Induced Fluorescence (LIF) suffer from sig-nificant quenching due to the presence of oxygen molecules.This effect explains why most mixing studies with LIF areperformed in an oxygen-free environment, which1iisinevitably a major limitation when mixing has to be observedunder reacting (i.e. combustion) conditions. A tracer LIFtechnique enabling mixing visualizations in the presence ofoxygen therefore needs to be developed. This is the secondaim of the present work. The first part of the investigation was then to select asuitable LIF tracer which enables visualization of the fuelmixture in the presence of oxygen. In order to achieve this,several fluorescent tracers suitable for a Diesel type fuelwere considered and tested. This particular LIF techniquewas then combined with high speed chemiluminescenceimaging of the combustion process. Indeed, previous work[6] has shown that chemiluminescence imaging is a usefultechnique for visualization of auto-ignition sites since,during the first stages of combustion, the chemilumines-cence emission correlates spatially with the location ofauto-ignition precursors (formaldehyde). Visualizationsof the mixture structure and auto-ignition sites were performed during a single cycle (i.e. single injection event),enabling a detailed analysis of the correlation between thetwo processes. Single cycle imaging using both techniquesis necessary for unambiguous interpretation of the data.Indeed, simply taking into account the mean averagedimages can be misleading since the mean averagedimages are not necessarily representative of the single-shotimage [4]. A high pressure cell was used in the present study since itprovides extensive optical access for the application of laserdiagnostics. This experimental apparatus is therefore firstlypresented, followed by the experimental techniques. Theresults section first of all discusses the selection of the fluo-rescent tracer and subsequently the studies of the correlationbetween fuel mixture distribution and auto-ignition, for boththe free jet and wall jet configurations. EXPERIMENTAL APPARATUS 1.1 High Pressure Cell The results presented here have been performed in a high-pressure, high-temperature cell which enables the study ofspray behaviour under thermodynamic conditions similar tothose of a Diesel engine at a specified injection timing. Themajor advantage of performing measurements in an opticalcell is that the gas phase conditions such as air flow, tempera-ture and pressure are more easily controlled than in anengine, whilst providing better optical access for the applica-tion of laser diagnostic techniques. The flow in the cell isessentially that induced by the spray itself. Further details concerning the cell and its operation can befound in previous publications [9]. The injector is mountedwithin the top face of the cell. Five 80 mm diameter 20 mmthick sapphire windows can be mounted on the other remain-ing faces. Prior to performing the experiments, the gases within thecell are heated and pressurized to reproduce typical in-engineconditions by a pre-combustion technique similar to thatdescribed in [10]. The start of injection (SOI) takes place at aspecified time after pre-combustion ignition. The SOI time isdetermined so that injection takes place when the temperatureand pressure in the cell have reached the desired values. Thepre-combustion gas mixture can be computed to consume acertain quantity of the oxygen initially introduced in the cell.As a result, experiments can be performed at various oxygenconcentrations. For the experiments presented in this paper,“oxygen-free”corresponds to 0% oxygen during injectionwhile“in the presence of oxygen”corresponds to 21% oxy-gen by volume in the surrounding gases. An ambient densityof 25 kg/m’and ambient temperature of 800 K were used forall the tests reported in this paper. 1.2 Wall Holder In order to study jet wall impingement, a flat metal insert(also referred to as a wall) was mounted in the centre of thecell. The wall holder was configured so that the metal insertplane was perpendicular to the jet axis. The distance dnwbetween the nozzle hole and the wall was adjustable between21.5 and 35.0 mm. This range is characteristic of the distancebetween the injector nozzle and the piston bowl wall of lightduty Diesel engines. For the experiments presented in thepaper, distances of 25 and 35 mm were used. Also, since the wall is heated by the pre-combustionevent, during fuel injection the surface wall temperature isexpected to be higher than its initial temperature before pre-combustion (i.e. 454 K), but it was not measured during thisstudy. However, measurements made in similar conditionselsewhere [11] with thermocouples reported surface walltemperatures of 500 K. More detailed information on the wall holder and its effecton chamber conditions are presented in [5]. 1.3 Injection System The injector and its driver electronics were supplied by CRTAG. A single-hole nozzle with nominal hole diameter/lengthof 0.15/0.6 mm was used. A hydro-pneumatic pump manu-factured by Top Industrie SA was used to supply fuel at aconstant injection pressure. The injection duration for all testspresented in the paper is 2 ms. Results of mass flow ratemeasurement with this injector are available in [4]. 1.4 Tracer LIF Selection 1.4.1 Principle The fluorescent tracer commonly used to visualize themixture formation of Diesel injection is TMPD. It is prin-cipally selected since its boiling temperature of 260°C atambient conditions is representative of the middle boilingpoint behaviour of standard Diesel fuels, and also becauseit enables a distinction between the liquid and vapourphases through the formation of an Exciplex (more infor-mation on the Exciplex formation between TMPD and a-methylnaphtalene can be found in [2]). However, TMPDand TMPD/a-methylnaphtalene exciplex fluorescence forvisualization in the vapour and liquid phases respectivelyare significantly quenched by oxygen molecules [2, 12].The resulting reduction of signal to noise ratio makes mix-ture visualization in the presence of oxygen extremelychallenging. Other parameters such as temperature, pres-sure, gas composition can influence the fluorescence signalbut oxygen quenching is the most limiting in term of signalto noise ratio. The tracer TMPD has been evaluated withinthe present study, whilst in addition, other tracers were investigated which are less sensitive to oxygen quenchingand might therefore result in improved LIF signal to noiseratio. In general, ketone molecules are good candidates sincephoto-physical phenomena occurring during fluorescenceexcitation for this family of molecules makes them less sensi-tive to quenching [13]. Another important criterion for thechoice of fluorescent tracer is that the boiling temperatureshould be similar to that of the fuel. Applying these criteria,two molecules were identified: 5-nonanone with a boilingtemperature of 188℃, and 2-decanone with a boiling temper-ature of 21yx0°C. Previous tests with 5-nonanone [14] showthat a good signal to noise ratio can be obtained in the pres-ence of oxygen. However, tracer decomposition in the fuelsupply system might lead to experimental difficulties. The fuels used for the tests differ according to the tracerproperties. When TMPD, excited at 355 nm, is used as atracer, the base fuel was a mixture of 70% n-decane (boilingpoint 174.1°℃) with 30% a-methyl-naphthalene (boilingpoint 244.8°℃) by volume. This base fuel was then dopedwith 0.5% of TMPD by mass. This mixture has been used inprevious experiments [4,5]. In contrast however,the absorp-tion bands of 5-nonanone and 2-decanone are in the range220-270 nm and are therefore excited at 266 nm by the fourthharmonic of a Nd:YAG laser. Since o-methyl-naphthalenealso emits fluorescence upon excitation at 266 nm [12], sig-nificant LIF signal interference occurs and it was thus neces-sary to select other non-fluorescing base fuels (or fuel mix-tures). n-dodecane was chosen as the base fuel since it doesnot fluoresce when excited at 266 nm and its boiling point of216°℃ at ambient conditions is representative of the boilingpoint of the more volatile components within standard Dieselfuels. 1% tracer (either 5-nonanone or 2-decanone) by masswas then added to the base fuel. The properties of the threetracers and base fuels are summarized in Table 1. TABLE 1 Summary of tracers and base fuels properties Tracer Boilingpoint(C) Excitationwavelength(nm) Base fuel Boiling point(C) TMPD 260 355 70% n-decane/30% aMN 174.1/244.8 S-nonanone 188 266 n-dodecane 216 2-decanone 210 266 n-dodecane 216 An important factor that should be noted are the differ-ences in cetane number (CN) between the two base fuelsused in this study. The overall CN of the n-decane (CN74)/a-methylnaphthalene (CN 0) mixture is 53, compara-ble to a standard Diesel fuel whilst the CN of n-dodecaneis 80. As a result, the auto-ignition delays would be expected to be shorter in the case of the n-dodecane basefuel. These differences do not affect the first part of thestudy which is dedicated to an analysis in terms of the tracerLIF signal characteristics and propensity to O2 quenching,since the primary focus here is on the fuel mixture distribu-tion and therefore prior to auto-ignition/combustion. 1.4.2 Influence of the Degree of Optical Access Althoughone of the first objectives was to assess the poten-tial of fluorescent tracers suitable for experiments in reacting(i.e. in the presence of oxygen) conditions to investigate thecorrelation between mixture distribution and combustion.there are wider implications. The selection of such a tracermight prove to be useful for optical engine applications. Fuelvisualizations in optically accessible engines are often per-formed in oxygen-free environments due to the problems ofLIF tracer signal quenching, however, under such ‘non-fir-ing’conditions, the combustion chamber wall and bulk gastemperatures are not representative. Fuel visualization bytracer LIF in the presence of oxygen would therefore be ofgreat interest since it would allow measurements to be per-formed under more representative engine operating condi-tions. However,the image signal to noise ratio for those testsperformed in the high pressure cell might not be comparableto in-cylinder engine visualizations since the optical access inthe latter case is significantly reduced. As a result, in order toevaluate tracer LIF signal to noise ratios in both the cell andengine conditions, experiments were performed on the hightemperature/pressure cell with the objective of replicating thecomparatively limited optical access that is typically avail-able on optical engines. More details of the set-up are pro-vided in the following subsection. 1.4.3 Experimental Setup The experimental setup for LIF tracer selection is presentedin Figure 1. Tracer fluorescence was excited by a frequency-tripled Nd:YAG laser at 355 nm in the case of TMPD andwith a frequency-quadrupled Nd:YAG laser at 266 nm forthe 5-nonanone and 2-decanone tracers. A cylindrical lens(f=100 mm) was coupled to a spherical lens (f=1000 mm)to produce a laser sheet which entered the cell through one ofthe side windows. Sapphire windows were used for 355 nmexcitation and quartz in the case of 266 nm excitation. Toavoid possible data misinterpretation, part of the laser sheetwas masked so as to avoid illuminating the liquid phase ofthe spray. The tracer fluorescence signal was collected bytwo 16 bit intensified CCD cameras (Princeton InstrumentsPIMAX) through two diametrically opposed windowslocated perpendicularly to the laser sheet. One of the camerashereafter referred to as camera A was located at 48 mm fromthe centre of the cell and was coupled to a 45 mm f/1.8 UVlens. This camera set-up corresponds to optimum conditionsfor light collection as a result of the extensive optical access provided by the test cell. The other camera hereafter referredto as camera B was located at 60 mm from the centre of thecell and was coupled to a 105 mm, f/4.5 UV lens. Moreover amask which provided a 4 cm diameter circular aperture wasplaced between the cell window and the camera. This config-uration was intended to represent typical conditions encoun-tered in optical engine experiments in which image detectionis more severely limited due to a combination of the effectsof reduced optical access and the greater distance betweenthe object (i.e. plane illuminated by the laser sheet) andimage (i.e. CCD detector location) plane. Using two camerasat the same time was not mandatory for the comparison ofthe two configurations since it could have been made insequential measurements, but it clearly facilitates the process. Specific characteristics of the setup are required depend-ing on the fluorescence tracer used and these are discussedbelow. For LIF experiments with TMPD, the laser energy mea-sured at the laser outlet at 355 nm was 280 mJ, so that the6 ×0.1 cm² laser sheet formed after passing through thelenses had a power intensity of 1.6×10⁷W/cm². Band passinterference filters 400 nm (FWHM 25 nm) and 401 mm(FWHM 10 nm) were placed respectively between the celland cameras A and B. These filters are used to detect the flu-orescence signal corresponding to the TMPD molecule in thevapour phase [4]. For LIF experiments with 5-nonanone and 2-decanone, alaser beam energy of 80 mJ was measured at the laser outletat 266 nm, so that the 4.5×0.1 cm²laser sheet formed afterpassing through the lenses has a power intensity of3 10 W/cm². Two identical band pass interference filters 327 nm (FWHM 75 nm) were located between the cell andcameras A and B for detection of the fluorescence signalfrom the tracermolecules. 1.5 High Speed Tracer Lif and CombustionVisualizations 1.5.1 Principle The principle of high speed tracer LIF and combustionvisualization is to combine two diagnostics giving informa-tion on mixing and auto-ignition in the same event by fastimaging. Concerning auto-ignition, intensified direct visual-ization of natural combustion light was used because it wasshown in previous work [7, 15, 16] that the localization ofthe light collected by direct visualization corresponds thelocalization of auto-ignition, the latter being characterizedby the presence of formaldehyde during the first reactionsof fuel decomposition. 1.5.2 Experimental Setup The experimental setup for high speed tracer LIF and com-bustion visualizations is presented in Figure 2. The laserdiagnostic set-up used here was identical to that used in the5-nonanone experiments discussed above. However, thefluorescence and combustion signals were collected with anintensified high speed Lavision Ultraspeedstar camera. Theexposure time of all frames of the camera was set to 5 us.With this setting,a satisfactory compromise was obtainedbetween the tracer LIF and combustion image intensities. Aset of High Pass (320 nm) and Low Pass (400 nm) optical Figure 2 Experimental setup schematic for high speed tracer LIF andcombustion visualizations. filters were located between the cell and the camera forfluorescence signal detection. This combination of filterswas selected following the 5-nonanone tests in order to fur-ther optimize signal to noise ratio. It is also compatible withthe chemiluminescence emission spectra. 1.5.3 Synchronization Method Sequential tracer LIF and combustion (chemiluminescence)imaging was achieved (in the same event) with the highspeed Lavision Ultraspeedstar camera.This camera is capa-ble of acquiring up to 16 consecutive images at very shortintervals: down to 20 to 50 us for this experiment. The cam-era was adjusted to observe the evolution of chemilumines-cence evolution except for one image (the first one) forwhich the camera aperture was synchronized with the laserpulse so that the LIF signal was collected in addition to thechemiluminescence signal, as shown in Figure 3. If the laserpulse is synchronized at a timing where chemiluminescencesignal is negligible, all the collected signal at that timing orig-inates from LIF. The resulting image sequence therefore con-tains one LIF image followed by the evolution of the chemi-luminescence signal. 1.5.4 Image Post Processing For a better interpretation and analysis of the results and inparticular the correlation between mixture distribution andcombustion, the sequence of LIF and chemiluminescenceimages corresponding to each event was post processed inorder to superpose the information on mixing and auto-igni-tion on a single image. The post processing method is pre-sented in Figure 4. Firstly, contour detection was applied to Figure 3 Illustration of synchronization method. Figure 4 Post processing principle of high speed camera images:contour detection of chemiluminescence images (auto-ignition site location) and superposition on LIF image. the first two chemiluminescence images in order to obtain thespatial location of auto-ignition sites.Then the correspondingcontours were superposed on the LIF image. The contourswere determined using a threshold method, where a fixedthreshold level was set visually. The resulting image gathersinformation on the mixture, through the tracer fluorescencefield, and on the location of auto-ignition that follows,through the contours of the first chemiluminescence images.Comparing the relative position of the two contours also pro-vides information on the evolution of auto-ignition. Eachpost processed image corresponds to three timings:t is thetiming of the LIF image, t is the timing of the first contourand t is the timing of the second contour. 2 RESULTS 2.1 Tracer LIF Selection 2.1.1 TMPD The effect of the presence of oxygen on TMPD fluorescencewas investigated. The fluorescence signal was collected inthe vapour part of a Diesel jet, in conditions where all theparameters are comparable, except for the oxygen concentra- tion within the ambient gases. The collection parameters suchas camera gain were also identical so that the images providea direct indication of the quantum efficiency of the fluores-cence in the different environments. Mean averaged imagesobtained from 3 individual images are shown in Figure 5. The fluorescence signal is strongly reduced by oxygen:the signal collected in the centre of the jet is approximately4 times lower in the presence of oxygen. This result is due tothe quenching of fluorescence by oxygen molecules, as dis-cussed before. For further investigation, TMPD LIF images in the pres-ence of oxygen were acquired with maximum camera gain.The latter was required in order to compensate for the signalreduction in the presence of oxygen. Typical examples ofresulting single shot images obtained with the two camerasare compared in Figure 6. The two images are acquiredsimultaneously through the two opposite windows and there-fore they reveal a very similar structure. The signal intensityof the image obtained using camera B is clearly reducedcompared to that acquired by camera A. This is due to thelower signal collection efficiency of the setup of camera Bwhich is intended to reproduce a typical engine setup.Approximately four times less signal is collected with cam-era B, under engine-like conditions, compared to camera A. The images of Figure 6 show that although TMPD fluo-rescence signal intensity is strongly reduced by oxygenquenching, it is still possible to visualize fuel concentration Figure 5 Comparison of mean-average (3 individual) TMPD LIFimages obtained with and without oxygen. Camera A (cellconditions), relative gain 4.2, Pn=1200 bar,t;=0.8 ms,image size 40×61 mm². by LIF in the presence of oxygen when optimum conditionsfor signal collection are available. For the setup representingoptical engine conditions, the signal to noise ratio is low andit appears difficult to perform satisfactory visualizationsunder such conditions. Figure6 Comparison of single shot TMPD LIF images obtained withcamera A and B (cell and engine conditions) in the presenceof oxygen. Relative gain 13, Pimj= 1200 bar, t;= 0.8 ms,image size 40×61 mm². Figure 7 A more in-depth analysis of the effects of oxygen onTMPD LIF measurements was performed. Indeed, the fluo-rescence signal in an oxygen free environment is at first orderproportional to the tracer concentration, and therefore to thefuel concentration [4]. Since the presence of oxygen signifi-cantly affects the fluorescence intensity through quenching, adetailed analysis of the differences between the two signalscan provide information on the oxygen distribution in the jet.This phenomena was already applied to gasoline engineinvestigations to directly measure the air fuel ratio [17],although recent work on toluene [18] showed that other fastphoto-physical phenomenon could compensate quenching athigh temperature, limiting the accuracy of the technique. Figure 7 shows TMPD fluorescence intensity profilesobtained with and without oxygen. The two sets of corre-sponding images were acquired with different camera gainsin order to allow good imaging conditions for both cases.This implies that the comparison of absolute signal intensi-ties is not possible. Indeed, the purpose of this figure is tocompare the relative spatial distributions of signal intensity.The profiles were extracted from mean averaged images(10 images) along the injector axis and perpendicular to it.The absolute signal intensities of the TMPD LIF imagesobtained in the presence of oxygen were significantly lowerthan those obtained in an oxygen free environment.Therefore, in order to compare the spatial distribution forthe two cases, it was necessary to shift the image intensitiesto a similar level to facilitate comparison of the data. Afterdoing so, the spatial distribution of the fluorescence inten-sity profiles obtained in an oxygen free environment and in the presence of oxygen compare very well, both for profilesextracted along the injector axis and perpendicular to it. This result indicates that either the oxygen concentrationis constant throughout the observed area of the jet, or that theoxygen concentration variations in the jet have no effect onTMPD fluorescence yields. Since the first conclusion is notconsistent with the fact that air is entrained in the jet and isprogressively mixed with the fuel [2-4], the results of Figure7 seem to indicate that in the operating condition studied, theTMPD fluorescence is not affected by the variations of oxy-gen concentration. In reference [19] the authors state that theeffect of quenching by oxygen on the fluorescence of TMPDsaturates for oxygen concentrations higher than a thresholdlevel. This effect could explain the result of Figure 7, butmore background on the photo-physical processes of TMPDfluorescence and more experimental validation are requiredto draw definite conclusions. 2.1.2 5-nonanone Since the previous tests showed that the application of LIEFwith TMPD might be difficult in the presence of oxygenwhen the conditions for signal collection are not optimum,the investigation was continued in order to find a more suit-able fluorescent tracer. Figure 8 compares 5-nonanone LIF images obtained in anoxygen free environment and in the presence of oxygen.Thefluorescence intensity is significantly reduced in the presence ofoxygen since approximately five times less signal is collectedcompared to the oxygen free condition. The effect of oxygen onthe fluorescence signal intensity of 5-nonanone fluorescence is Figure 8 Comparison of individual 5-nonanone LIF images obtainedwith and without oxygen. Camera A, relative gain 1,P=1200 bar,t;=0.8 ms, image size 40×61 mm. therefore significant in the range of operating conditions stud-ied, as it is the case for TMPD fluorescence. This result issomehow contradictory with previous work in which it wasreported that quenching effects had little influence on the fluo-rescence of lighter ketones [13]. However, the author found noinformation in the available literature of the effects of oxygenquenching on the quantum yields of 5-nonanone fluorescence. Tracer decomposition could be a supplementary mecha-nism which might explain the effect of oxygen on the fluores-cence signal intensity. Indeed, stability issues with 5-nonanonehave been reported in previous work [14]. However, if thepresence of oxygen was to increase the rate of tracer decompo-sition, the effect of the presence of oxygen on fluorescenceintensity would be more important in the leading edge of thejet where the temperature and mixture history is favourable.Since the image of 5-nonanone fluorescence does not revealsuch characteristics, it seems that tracer decomposition is not asignificant issue for the range of operating conditions studied,and furthermore, that the effect of oxygen on LIF signal inten-sity is mainly due to the effect of quenching on 5-nonanonefluorescence quantum yields. Although oxygen seems to have a significant effect on thequantum yield of 5-nonanone fluorescence, the detected sig-nal remains sufficiently high to enable satisfactory visualiza-tions in the presence of oxygen, as shown by the images of5-nonanone fluorescence obtained in the presence of oxygenwith cameras A and B, shown in Figure 9. It should be notedthat the use of maximum camera gain was not necessary,even with camera B which corresponds to a set-up typical ofin-cylinder engine experiments. This result is explained by the fact that in an oxygen-freeenvironment the acquired fluorescence signal level is veryhigh. Indeed, the signal intensities obtained in an oxygen-freeenvironment with TMPD and 5-nonanone can be comparedfrom Figure 5 and Figure 8 taking into account for the rela-tive camera gains. Approximately six times more signal iscollected with 5-nonanone compared to TMPD. This resultseems to indicate that the quantum yields of 5-nonanone flu-orescence is higher than that of TMPD, even though anincrease by a factor of two of the 5-nonanone fluorescencewould be expected compared to TMPD due to the use of ahigher dopant concentration. The same ratio is obtained inthe presence of oxygen as shown by the comparison ofFigure 6 and Figure 9, since the effect of oxygen presenceon the fluorescence signal is similar for the two tracers inthe range of operating conditions studied. The resultinghigh fluorescence intensity obtained with 5-nonanone LIFin the presence of oxygen enables satisfactory conditionsfor visualizations, even for the setup corresponding toengine type conditions. This result was further improved by optimizing the collec-tion set up for the 5-nonanone LIF. Indeed, images of Figure9 show that the use of the 327 nm (FWHM 75 nm) band pass interference filters was not optimum in terms of maximizingthe LIF signal to noise ratio. The laser wavelength contribu-tion is quite significant: the diffusion of the laser sheet lightin the cell is clearly visible, and the elastically scattered lightfrom liquid droplets within the spray is not negligible. A setof high pass 320 nm and low pass 400 nm interference filterswas selected to improve signal collection efficiency and thislatter filter set was used in the tracer LIF and combustionvisualizations. Preliminary tests have shown that with thisnew set of filters, both the collected signal intensity and thesignal to noise ratio were increased by a factor of two. 2.1.3 Diverging Beam The evaluation of fuel mixture visualization using 5-nonanoneLIF in the presence of oxygen was further investigatedwith a diverging beam. The objective of this supplemen-tary test was to study the potential of 5-nonanone LIF formixture visualization in optical engines where opticalaccess is limited to one window (either by choice orbecause it is the only optical access available). Illuminationat 90°with a laser sheet is then not possible and globalillumination is required, whilst the LIF image is retro-col-lected. The amount of energy available for fluorescenceexcitation is limited in this configuration since the laserenergy is dispersed in the chamber and a significant part ofthe beam does not reach the jet. It is therefore useful toevaluate the potential of the 5-nonanone LIF in this config-uration for engine applications. Figure 9 Figure 10 Comparison of individual 5-nonanone LIF images obtained inbest and engine conditions (same event, same timing), withoxygen. Relative gain 4.6, Pn=1200 bar, t;=0.8 ms, imagesize 40×61 mm2. The experimental setup was modified in order to achieveglobal illumination in the cell. The spherical and cylindricallenses were replaced by a diverging spherical lens (UV-S-75-D25) located such that the diverging beam cross sectiondiameter in the centre of the cell was 4.5 cm, correspondingto a power intensity of 105 W/cm2. Also, due to multiplereflections generated in the cell by this illumination, a266 nm mirror was added between the cell and the camera inorder to improve spectral filtering of the detected signal.Although the addition of this mirror decreases the collectedsignal intensity by a factor of two, a better signal to noiseratio was obtained. The set of interference filters used in thetracer LIF and combustion visualizations was not used herebecause it was not available at the time of the experiment. The LIF images obtained in those conditions with cameraA and B are displayed in Figure 10. The collected intensity ismuch lower than in the case of illumination by a laser sheet.Comparison with Figure 9 taking into account for the relativecamera gains shows that signal intensity is reduced by a fac-tor of four. However, the high signal to noise ratio of theseimages show that mixture visualization with 5-nonanone LIFin the presence of oxygen is possible in an optical enginetype setup with global illumination. 2.1.4 2-decanone The tests carried out with 2-decanone showed that the col-lected fluorescence signal intensity of 2-decanone is 2 to3 times lower than that of 5-nonanone. As a result, furthertests with this tracer were not performed. Comparison of individual 5-nonanone LIF images obtained incell and engine conditions (same event, same timing), globalillumination in the presence of oxygen. Relative gain 13,P;=1200 bar,t;=0.8 ms,image size 40×61 mm. 2.2 High Speed Tracer LIF and CombustionVisualizations The tracer selection in the presence of oxygen carried outin the previous section have shown that the best results (interms of LIF signal to noise ratio) were obtained with the5-nonanone fluorescence. LIF with TMPD in the presenceof oxygen is also possible if good visualization conditions(extensive optical access) are available. However, highspeed visualizations performed here required the use of ahigh speed intensified camera whose collection efficiencyis lower than that of the intensified single-frame CCD cam-era used during the tracer selection work. It is thereforevery probable that the collection conditions achieved with thehigh speed camera would not be sufficient to enable appro-priate visualizations with TMPD LIF. The 5-nonanone tracerwas therefore used for high speed imaging studies of mixturedistribution and combustion in the presence of oxygen. 2.2.1 Free Jet A typical image sequence of 5-nonanone LIF and combus-tion visualizations in the free jet configuration are presentedin Figure 11. The LIF image was acquired at t;=600 us afterthe start of injection, and the following combustion imageswere recorded at 20 us intervals thereafter. The combustionimage obtained at t;=620 us displays a small luminous spotthat corresponds to chemiluminescence emission and is char-acteristic of auto-ignition [6]. This auto-ignition region thenexpands progressively in the vapour plume until t;=820/840 us. A zone of high luminosity then appears in thecentre of the vapour plume at t;=860/880 us. Previousexperiments [20] have shown that such bright regionsappearing more than 100 us after the start of auto-ignition aredue to the incandescence of soot particles. Soot thereforeseems to form initially in the centre of the luminous regionwhere auto-ignition has taken place. For a further analysis of the temporal evolution, a secondsequence of combustion images is shown in Figure 12. Thefirst LIF image of the sequence is not displayed because it isnot relevant. Indeed, this image sequence was synchronizedin a similar manner to the previous one with the first imageacquired at t;=600 us. But in this second sequence, auto-ignition occurred earlier such that the chemiluminescencelight emitted at the instant corresponding to LIF image acqui-sition was of sufficiently high intensity to dominate the LIFsignal. Furthermore one would expect that any fuel/tracerpresent would have already been consumed by the combus-tion process, which would therefore reduce (or even elimi-nate) the LIF signal level. Since auto-ignition occurred earlierin this sequence, the interest is to present a sequence ofimages that provide a representative continuation of the firstimage sequence: the first combustion images (at t;=620 us)of this sequence correspond to a time when auto-ignitionalready covers the vapour plume. It corresponds to what is Figure 11 Time sequence of 5-nonanone LIF and direct visualizationsof combustion realized in the same event with the high speedcamera. Pini= 1000 bar, image size 30 × 45 mm, timebetween images 20 us. observed in the 12th image (i.e.t;=820 us) of the firstsequence (images of Fig.11). This second sequence ofimages therefore corresponds to events happening in thecontinuity of the sequence of Figure 11. Indeed, the samebright spot corresponding to soot formation appears in thecentre of the vapour plume at approximately 700 us. Thenthe bright spot progresses towards the jet tip, and the lastimages of the sequence reveal a mushroom-like shape,which is typical of combustion images during the diffusionflame stage [2], where the dominant light emission is dueto soot incandescence. t=860 us t;=880 us Couleur palette Figure 12 Time sequence of direct visualizations of combustion realizedin the same event with the high speed camera. Pmj=1000 bar,image size 30 ×45 mm, time between images 20 us. These two image sequences therefore provide an overviewof the combustion process: auto-ignition appears in localizedareas before extending to the rest of the vapour plume, initialzones of soot formation then appear in the centre of thisregion before progressing towards the tip, and forming amushroom-like zone. 2.2.2 Detailed Analysis For a detailed analysis of the correlation between mixturedistribution and auto-ignition sites, various sequences ofimages such as that presented in Figure 11 were processed according to the method presented earlier. The LIF and con-tour images resulting from this image processing is presentedin Figure 13 for several image sequences carried out at aninjection pressure of 1000 bar. The spatial location of auto-ignition sites appears to besimilar for the different events studied: in the upstream zone,slightly shifted from the axis of the jet. This location corre-sponds to the mixing zone of the jet [4]. Obtaining quantitative information on fuel concentrationvalues at the location where auto-ignition subsequentlyoccurs would be of great interest in order to gain informationon the auto-ignition process. However this remains a chal-lenging task for several reasons: 一(Ouantitative measurements of fuel concentration from5-nonanone LIF would be required. This would need morebackground on the photo-physical process of 5-nonanonefluorescence, in order to accurately account for tempera-ture, pressure and quenching effects on the quantumyields. Also, correction for laser intensity fluctuations andabsorption would be necessary. Figure 13Processed images of LIF and contours of auto-ignition sites.P=1000 bar, image size 34×54 mm’. - The issue of tracer decomposition would need to be stud-ied in order to understand what the effects might be onthe LIF measurements. In particular, LIF imaging is real-ized shortly before chemiluminescence imaging (50 us ormore), and previous work has shown that initial auto-ignition precursors formed as a result of fuel decomposi-tion appears 50 us to 70 us before chemiluminescence. Itis therefore possible that fuel and tracer decompositioncould occur at the timing where the LIF image isacquired,further complicating quantitative measurementsof fuel concentration. 一During the time interval between LIF and chemilumines-cence imaging, the fuel is transported by the flow so thatthe fuel concentration at the time and location wherechemiluminescence is detected does not strictly corre-spond to the fuel concentration at the spatial locationwhere the LIF image is acquired. This difference wouldneed to be taken into account. - LIF is a two dimensional planar laser sheet imagingtechnique,while direct visualization detects the naturalcombustion luminosity emitted over a volume (i.e. anintegrated measurement), therefore corresponding tothree dimensional information. The two images mighttherefore not correspond to the same spatial location.The application of a two dimensional diagnostic to visu-alize auto-ignition such as 355 nm LIF [7] would bemore appropriate than direct combustion visualization. It is clear from the above discussion that accurate mea-surements of fuel concentration at the location where auto-ignition subsequently occurs was not possible in the frame-work of the present study. However it is the author’s opinionthat even an approximate estimate of this value is extremelyuseful for the understanding of auto-ignition phenomena. The images (in particular the second and fifth images),shown in Figure 13 reveal that the auto-ignition contourscorrespond closely to iso-level of fluorescence intensitieswhich indicates a good spatial correlation between the fuelconcentration distribution and location of auto-ignitionsites. Furthermore, tracer decomposition does not appear tosignificantly affect the LIF signal since a continuous distri-bution of intensities is obtained in the area where auto-igni-tion subsequently occurs. In addition, the correspondingtime delay between LIF and chemiluminescence imaging isshort enough to neglect the fuel transport effects. Accordingto these simplifications, one can therefore assume in a firstapproximation that the fluorescence intensities containedwithin the contours of the images of Figure 13 correspondto fuel concentrations at the location where auto-ignitionwill subsequently occur. In order to obtain a quantitativevalue, a calibration process is required to obtain the corre-spondence between pixel intensity and fuel concentration.This work was not carried out here, but it was performed ina previous study [4] under similar experimental conditions(injected quantity, ambient conditions, etc.) using a different LIF technique. The fluorescence intensity contained withinthe contours of the images of Figure 13 corresponds toblue/green colours of the colour palette. The calibrationmethod carried out in [4] reveals that this color range corre-sponds to fuel concentrations varying from 2 to 2.5 kg/m. Therefore, by making a few simplifying assumptions it ispossible to estimate the fuel concentration where auto-igni-tion sites are subsequently located to approximately 2 to2.5 kg/m. A simple calculation of the corresponding fuel airequivalence ratio assuming that the oxygen and air concen-tration are equal to the ambient condition gives values of1/1.2. The latter values are unknown but are expected to belower in the mixing jet than in the ambient, so that the corre-sponding fuel air equivalence ratio based on local values isexpected to be even higher. This hypothesis, based on a number of simplificationsseems to indicate that auto-ignition occurs in rich areas of themixing zone of the jet. Further work needs to be performedin order to validate this information. However it can be notedthat one of the simplifications (i.e. neglecting the effect oftracer decomposition) leads to an underestimation of the fuelconcentration and it therefore has no consequence on thisconclusion (i.e. if tracer decomposition was significant, themixture would in fact be richer than estimated). 2.2.3 Effect of Higher Injection Pressure Sequences of LIF and combustion images were also acquiredat higher injection pressures in order to evaluate the effect ofan increase in injection pressure on the correlation betweenmixture and auto-ignition. Figure 14 displays two sequencesof 5-nonanone LIF and combustion images corresponding toan injection pressure,Pinj= 1500 bar. In general the imagesequences are similar to those obtained at the lower injectionpressure: auto-ignition appears in confined areas beforeextending to the rest of the vapour plume. However, a moredetailed examination reveals that the rate of the extensionprocess seems faster at higher pressure: the time intervalbetween the apparition of auto-ignition sites and the exten-sion of auto-ignition to the rest of the vapour plume is of theorder of ~100 us at Pmi=1500 bar, while the correspondingtimescale is approximately~200 us at Pinj=1000 bar asshown by the results of Figure 11. Also, ignition occurs inmultiple sites as a consequence of the faster extension ofauto-ignition. The effect of increasing the injection pressureon the auto-ignition extension rate was already observed inprevious work [9]. In order to confirm these tendencies, a more systematicinvestigation was carried out by image processing variousevents. Figure 15 displays LIF and contour images of severalevents carried out at an injection pressure of Pmj=1500 bar.Globally the same characteristics concerning the location ofauto-ignition sites are observed when compared with theresults obtained at Pimj=1000 bar: auto-ignition appears in Figure 14 Two time sequences of LIF and direct visualizations ofcombustion realized with the high speed camera. Pinj=1500 bar,image size 30×45 mm, time between images 50 us. Figure 15 Processed images of LIF and contours of auto-ignition sites.P=1500 bar,image size 34×54 mm. the upstream zone, slightly shifted from the axis of the jet.Also, the level of fluorescence intensity corresponding toauto-ignition sites is similar. However, in general the auto-igni-tion sites are located further downstream at Pini= 1500 barthan at Pmj= 1000 bar. Auto-ignition is even observed at thetip of the jet for one event with an auto-ignition of 0.95 ms. Alonger distance is observed between the nozzle exit and auto-ignition site and this can be explained by the fact that for asimilar time required for auto-ignition, the mixture travels agreater distance from the nozzle exit at higher pressure sincethe injection velocity increases with pressure. Also, the spacebetween the two auto-ignition contours is generally higherat Pmj=1500 bar than at Pmj=1000 bar (comparing imageswith similar time intervals between contour detection, i.e.50 us). This result confirms that the extension process isfaster at higher pressure. 2.2.4 Wall Jet A study of the correlation between the fuel mixture distribu-tion and auto-ignition was also conducted in the case of a jetimpinging against a flat wall. A sequence of LIF and combustion images in the wall jetconfiguration is presented in Figure 16. The LIF image is typi-cal of a jet impinging on a flat wall [5]: the vapour plume inter-action with the wall generates a vortex at the tip of the jetknow as the jet wall vortex. A distinctive feature can howeverbe observed: the 5-nonanone LIF image is significantly asym-metric. While the vortex can be easily observed on the left sideof the image, it is less distinct on the right side. Since there areno reason for the jet wall interaction to create such an asymme-try, the only reasonable explanation is that the laser sheet isabsorbed by the 5-nonanone. This absorption effect is espe-cially visible in the jet wall configuration because the lasersheet path through the jet is increased in the region where thejet propagates along the wall. Indeed, this absorption effect isnot significant in the free jet configuration images presentedearlier, probably because the laser sheet path through the jet isnot sufficient to cause significant absorption by 5-nonanone.Also, compared to jet wall LIEF images reported in Reference[5] performed using TMPD as the fuel tracer, this absorptionphenomenon appears to be more significant. This is very prob-ably due to the higher efficiency of the 5-nonanone absorptioncompared to TMPD. A second sequence of LIF and combustion images obtainedat a higher injection pressure (Pmi=1400 bar) is presented inFigure 17. The LIF image shows a more extended vapourplume than at the lower injection pressure. This result is typicaland is explained by the higher flow velocities. In this sequence,the auto-ignition site is located in the vicinity of the wall. Itthen extends firstly in a region restricted to the vicinity of thewall, before extending to regions more distant from the wall,upstream and downstream. Again, it seems that the presence ofthe wall is favourable to the propagation of auto-ignition. Figure 16 Figure 17 Time sequence of 5-nonanone LIF and direct visualizationsof combustion realized in the same event with the high speedcamera.P=1000 bar,dw=3.5 cm, image size 50×31.5 mm,time between images 20 us. Time sequence of 5-nonanone LIF and direct visualizationsof combustion realized in the same event with the high speedcamera. P.=1400 bar, dww=3.5 cm, image size 50×31.5 mm’,time between images 20 us. Figure 18 Processed images of LIF and contours of auto-ignition sites.Pmj=1000 bar, dmw=3.5 cm, image size 50×31.5 mm². Figure 19 Processed images of LIF and contours of auto-ignition sites.Pini=1400 bar, drw=3.5 cm, image size 50×31.5 mm. A more systematic investigation was carried out by imageprocessing various events. Figures 18-20 display LIF andcontour images of several events carried out at Pimj=1000 barand dnw=3.5 cm, Pinj= 1400 bar and dnw =3.5 cm, and Figure 20 Processed images of LIF and contours of auto-ignition sites.Pmj=1000 bar, dnw=2.5 cm, image size 50×27 mm. Pmj= 1000 bar and dmw=2.5 cm respectively. Globally thesame characteristics concerning the location of auto-ignitionsites are observed compared to the results presented previ-ously.Auto-ignition sites are located either in the upstreammixing zone or in the vicinity of the wall. The shape of thechemiluminescence contour that corresponds to the secondtiming (i.e. the more extended one) is more extended close tothe wall confirming that the wall is favourable to the propa-gation of auto-ignition. The effect of increasing the injectionpressure or decreasing the distance between the nozzle andthe wall seems to increase the number of cases where auto-ignition is located close to the wall surface. An explanation as to why the presence of the wallappears to be favourable to the propagation of auto-igni-tion is not straightforward. Indeed, the wall temperature isnot known in this experiment but it would be expected tobe lower than the ambient gas temperature, generating athermal layer at the vicinity of the wall. The factor promot-ing auto-ignition and its propagation at the vicinity of thewall is therefore not the temperature, but more probablythe mixture.Indeed, detailed visualizations [5] have shownthat a characteristic mixture structure is generated duringimpingement in the central part of the jet, close to the wall:fuel concentration tends to increase in his zone due to theformation of a stagnation point were the jet is confined.The rich zones located at the vicinity of the wall probablypromotes auto-ignition and its propagation. Finally, as shown by the strong asymmetry of the LIFimages in the near wall region, laser sheet absorption is verysignificant in this configuration, leading to complete disap-pearance of the fluorescence signal in some parts of the jet.This absorption effect cannot be corrected for. The LIFimages cannot therefore be used to obtain quantitative infor-mation, even approximate,concerning the local air fuel ratio.Only qualitative information in the zone of auto-ignition siteis provided. CONCLUSION The correlation between the mixing and auto-ignitionprocesses of high pressure Diesel jets was studied by simulta-neous fluorescence and chemiluminescence imaging, bothfor free jet and flat wall impinging jet configurations. First, a fuel visualization technique in the presence of oxy-gen was developed, showing that: 一despite the significant signal reduction due to quenchingeffects, TMPD LIF in the presence of oxygen is feasible ifgood conditions in terms of signal collection are provided; 一fluorescence of 5-nonanone also appears to suffer fromquenching effects, but its quantum yield remains suffi-ciently high to enable good conditions for visualizations inthe presence of oxygen; - the high quantum yields of 5-nonanone fluorescence alsoenables the visualization of fuel in the presence of oxygenwith global illumination and in conditions typical of anoptical engine. The 5-nonanone laser induced fluorescence technique wastherefore selected and combined with high speed chemilumi-nescence imaging to study the correlation between mixingand auto-ignition. In the free jet configuration it was found that: - auto-ignition appears in localized areas before extendingto the rest of the vapour plume, soot then appears in thecentre of this region before forming a dense, mushroom-like, soot region at the jet tip; - in the free jet configuration and for the parameter rangestudied, auto-ignition is preferentially located in richregions of the upstream mixing zone; following an increase of the injection pressure the auto-ignition sites are shifted downstream and the extensionprocess is faster. For the jet wall configuration: - in the parameter range studied, auto-ignition appears inthe centre of the jet and propagates towards the periphery,at the vicinity of the wall; 一auto-ignition sites are located either in the upstream mix-ing zone, either in the vicinity of the wall; - following an increase of the injection pressure or adecrease in the distance between the nozzle and the wall,auto-ignition appears to occur preferentially in zones closeto the wall surface. The combined techniques therefore provided detailedinformation on the correlation between the mixing and com-bustion processes. However, due to several uncertainties, theresults were limited to semi-quantitative analysis. The use ofa two dimensional diagnostic for the detection of auto-igni-tion sites, such as 355 nm LIF [6], could provide moredetailed and quantitative information in future work. ACKNOWLEDGMENTS The work has been conducted with the expert technical assis-tance of Laurent Hermant. Also, the help of Julian Kashdanfor improving the quality of the paper is greatly acknowl-edged. This work was supported by the GSM (GroupementScientifique Moteurs: IFP, PSA and Renault). REFERENCES ( 1 Espey C ., D ec J.E., L itzinger T.A., Santavicca D .A. (1994) Quantitative 2-D F uel Vapor Concentration I m aging in a FiringD.I. Diesel Engine Using P lanar L aser-Induced R ayleigh Scattering, SAE 940682. ) ( 2 Bruneaux G. (2001) Liquid and V apor S p ray S t ructure i n High Pressure Common Rail Di e sel In j ection, A t omization Spray. 11, 5.533-556. ) ( 3 Siebers D.L. (1998) L iquid Phase Fuel P e netration in D iesel Sprays, SAE 980809. ) ( 4 B runeaux G. (2005) Mixing Process in High Pressure Diesel Jets by Normalized Laser Induced Exciplex Fluorescence -Part I: RYee etsAE 2005-1-2100. ) ( 5 Bruneaux G. (2005)Mixing Process in High Pressure Diesel Jets by N ormalized L a s er I n duced Exciplex F l uorescence -Pa r t II: Wall I mpinging Versus Free Jet,SAE 2005-01-2097. ) ( 6 Aizawa T., Kosaka H. (2006) Investigation of the early soot for- mation process i n a transient s p ray flame vi a spectral me a sure- ments of l aser-induced e missions, Int.J.Engine Res.7,93-101. ) ( 7 Bruneaux G., Auge G., Lemenand C. (2004) A Study ofCombustion Structure i n High P ressure Single Hole Common Rail Direct Diesel Injection Using Laser Induced Fluorescence of Radicals, The Sixth International Symposium on Diagnostics and Modeling of Combustion in Internal Combustion Engines, Comodia 2 004, August 2-5, 2004, Yokohama,Japan, pp.551-559. ) ( 8 P ickett L . M., S iebers D.L. ( 2 006) Soot fo r mation in d iesel fu e l j ets near the lift-off length, Int. J. Engine Res.7, 103-130. ) ( 9 Verhoeven D., Vanhemelryck k J . .L., Baritaud T. ( 1998) M acroscopic a n d Ig n ition C h aracteristics o f High-PressureSprays of Single Component Fuels, SAE paper 981069. ) ( 10 Siebers D . ( 1985) Ignition Delay Characteristics of Alternative Diesel Fuels: Implications on Cetan e Number, SAE paper 852102. ) 11 Pickett L.M., Lopez J.J. (2005) Jet-Wall Interaction Effects onDiesel Combustion and Soot Formation. SAE 2005-01-0921. ( 12 Bruneaux G., Verhoeven D., B aritaud T . (1999) H igh Pressure Diesel Spray and Combustion V i sualization i n a T ransparent Model Diesel Engine, SAE paper 1999-01-3648. ) ( 13 Schulz C . , Sick V. (2005) T racer-LIF diagnostics: quantitativemeasurement of fuel concentration, temperature and fue l /air ratio in practica l combustion systems, Prog. Energ. Combust. 31,75- 121. ) ( 14 Schulz C., Gronki J.,Andersson S. ( 2004) Multi-Species Laser- Based I maging Measurements in a D i esel Spray, SAE 2004-01-1917. ) ( 15 Bruneaux G. (2008) Combustion S tructure of Free and Wall Impinging D iesel J ets b y S imultaneous Laser I nducedFluorescence of Formaldehyde, PAH and OH, Int. J. E n gine Res., to be published. ) ( 16 Kashdan J., Papagni J . F. (2005) L I F Im a ging of A uto-ignitionand C ombustion in a Direct I n jection Diesel-fuelled H CCIEngine,SAE paper 2005-01-3739. ) 17 Deschamps B., Ricordeau V., Depussay E., Mounaim-RousselleC. (1999) Combined Catalytic Hot Wires Probe and Fuel-Air-Ratio-Laser Induced-Exciplex Fluorescence Air/Fuel RatioMeasurements at the Spark Location Prior to Ignition in aStratified GDI Engine, SAE 1999-01-3536. 18 Koban W., Koch J.D., Hanson R.K., Schulz C. (2005) TolueneLIF at elevated temperatures: Implications for fuel/air ratio mea-surements,Appl. Phys. B 80,147-150. ( 19 D iscussions with U. Leidenberger, LTTT, Uni v ersitat Bayreuth,Germany, during the poster se s sion of the 31st In t ernational Symposium on Combustion,Heidelberg,2006. ) 20 Bruneaux G., Lemenand Ch. (2001) Internal IFP ReportNo.55879, February. Final manuscript received in March 2008 ( Permission t o make digital or hard copies ofpart or all of this work for personal or classroom use is granted without fee provided that copies are not madeor distributed for profit or commercial advantage and that copies bear this notice and the full citation on the first page. Copyrights for components of thiswork owned by others th a n IF P must be honored. Abstracting with credit is permitted. To copy otherwise, to republish, to post on servers, or to redistributeto lists, requires prior specific permission and/or a fee: Request permission from Documentation, Institut francais du petrole, fax. +33 1 4 7 52 7 0 7 8 ,or revueogst@ifp.fr. )
确定


还剩15页未读,是否继续阅读?

产品配置单


北京欧兰科技发展有限公司为您提供《发动机,燃烧,柴油,喷射中浓度场,空燃比检测方案(尾气检测)》,该方案主要用于汽车电子电器中其他检测,参考标准--,《发动机,燃烧,柴油,喷射中浓度场,空燃比检测方案(尾气检测)》用到的仪器有汽车发动机多参量测试系统、德国LaVision PIV/PLIF粒子成像测速场仪、PLIF平面激光诱导荧光火焰燃烧检测系统
推荐专场


相关方案
更多
该厂商其他方案
更多