


The current direction for Diesel combustion system
development is towards homogenization, in order to
reduce particulate and NOx emissions. However, a
strong increase of carbon monoxide emissions (CO) is
frequently noted in combination with enhanced
homogenization.
Therefore, the current investigation focuses on a
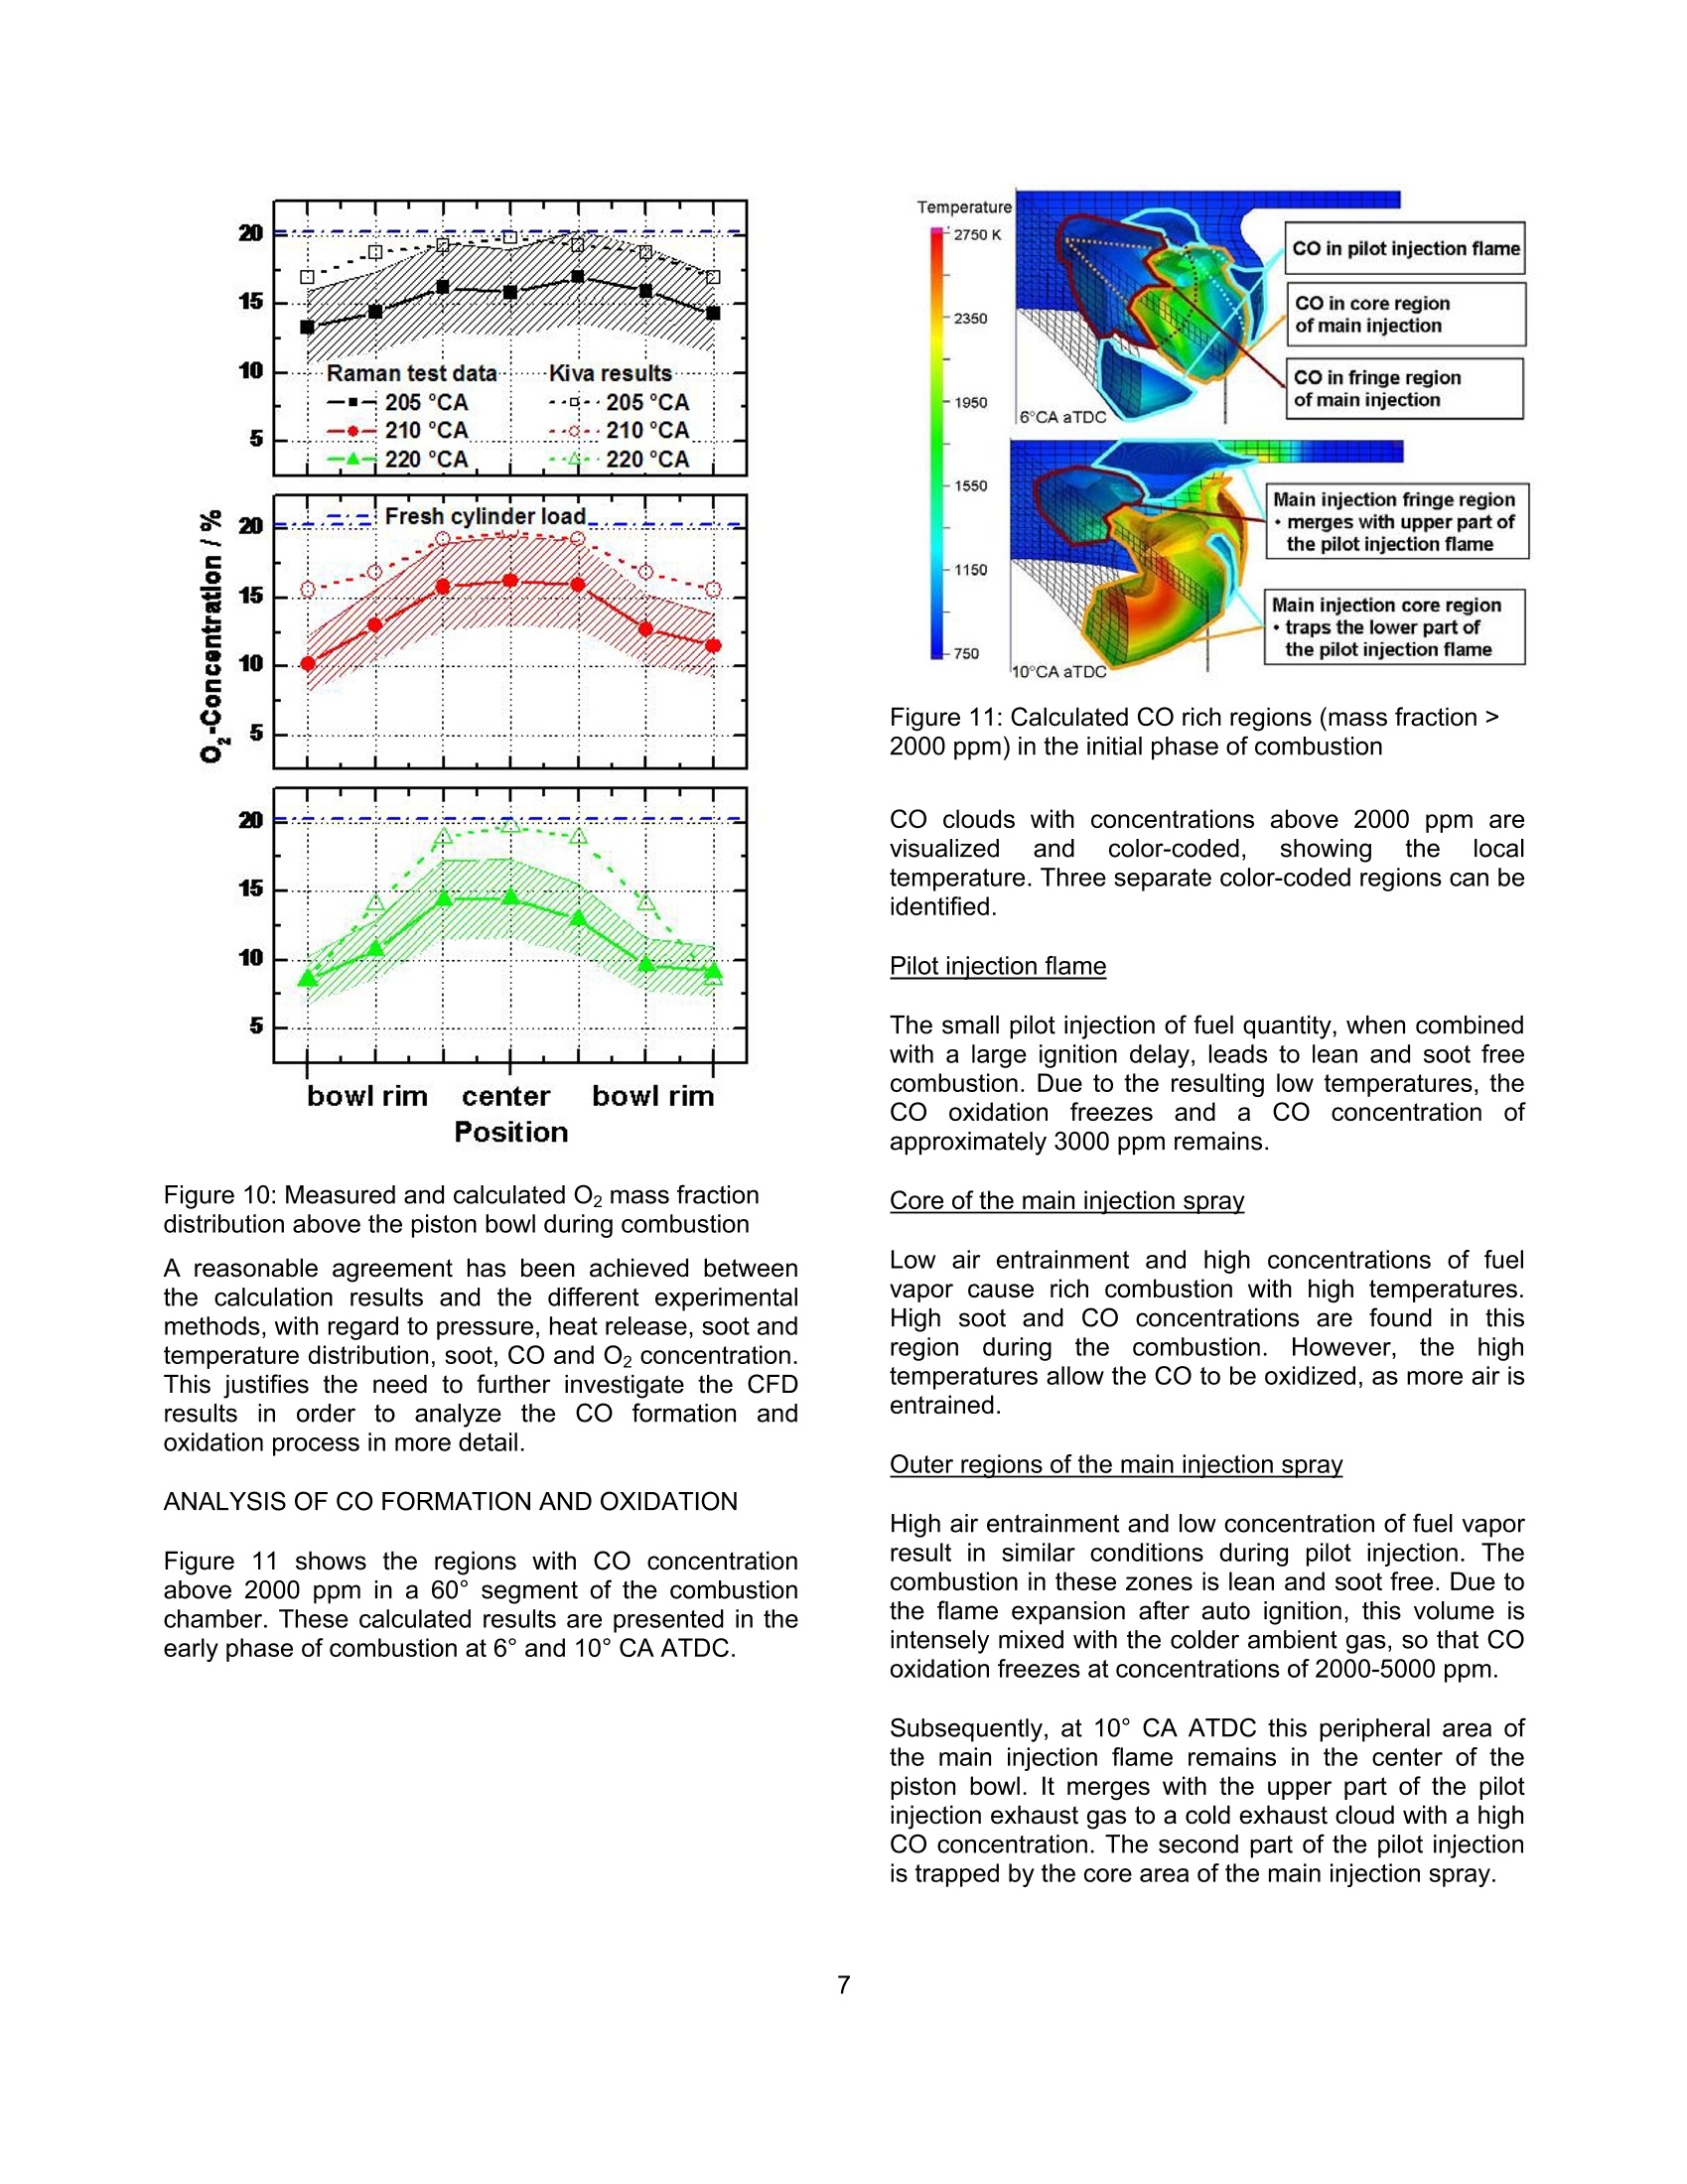
detailed analysis of the particulate - CO trade-off using a
laser-optical and multidimensional CFD investigation of
the combustion process of a swirl HSDI system. The
CFD methodology involves reduced kinetics for soot
formation and oxidation and a three-step CO model.
These models are validated by a detailed comparison to
optical measurements of flow, spray penetration and the
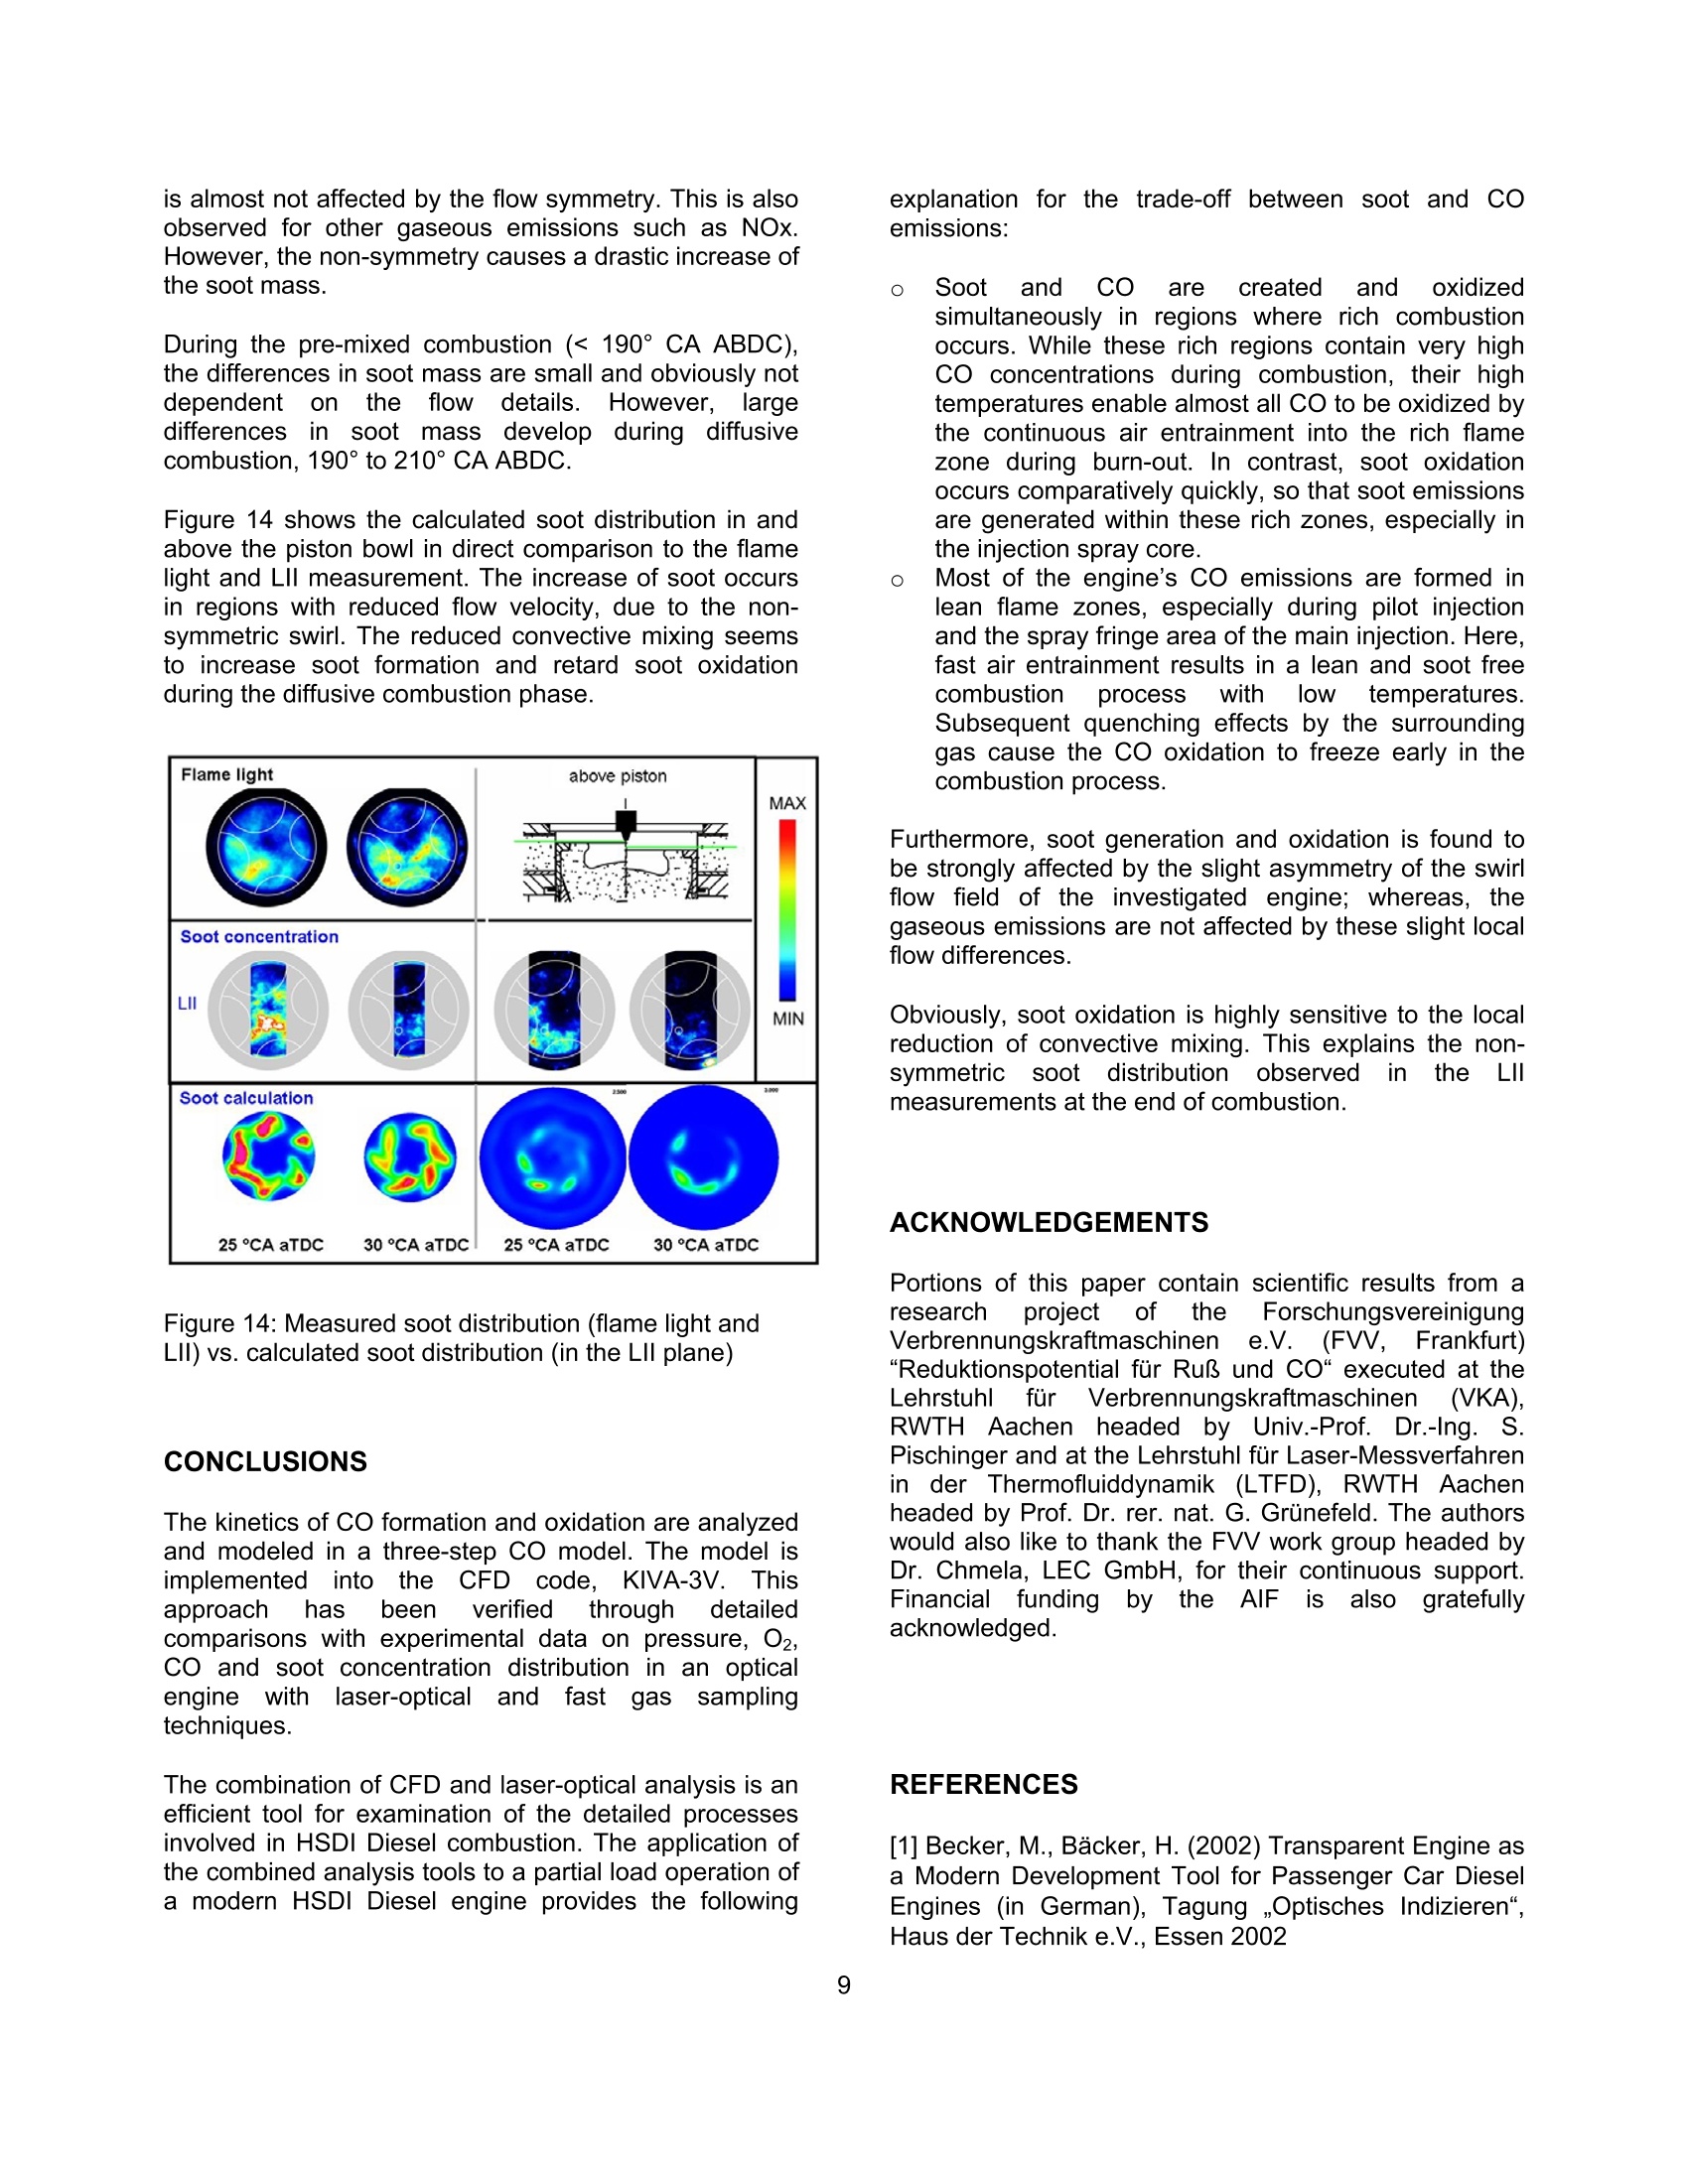
spatial distribution of soot, temperature and oxygen
concentration.
The results obtained show that high concentrations of
CO occur as an intermediate combustion reaction
product. Subsequently, CO and soot are oxidized in
large areas of the combustion chamber. In part load
operation, CO emissions are mainly caused by dilution
effects in the early phases of combustion. However, the
engine’s soot emissions are caused by insufficient
oxidization.
Soot generation and oxidation are found to be strongly
impacted by the slight non-homogeneity of the swirl
motion. The gaseous emissions are not affected by the
small differences in local flow, which are outlined further
in the text.
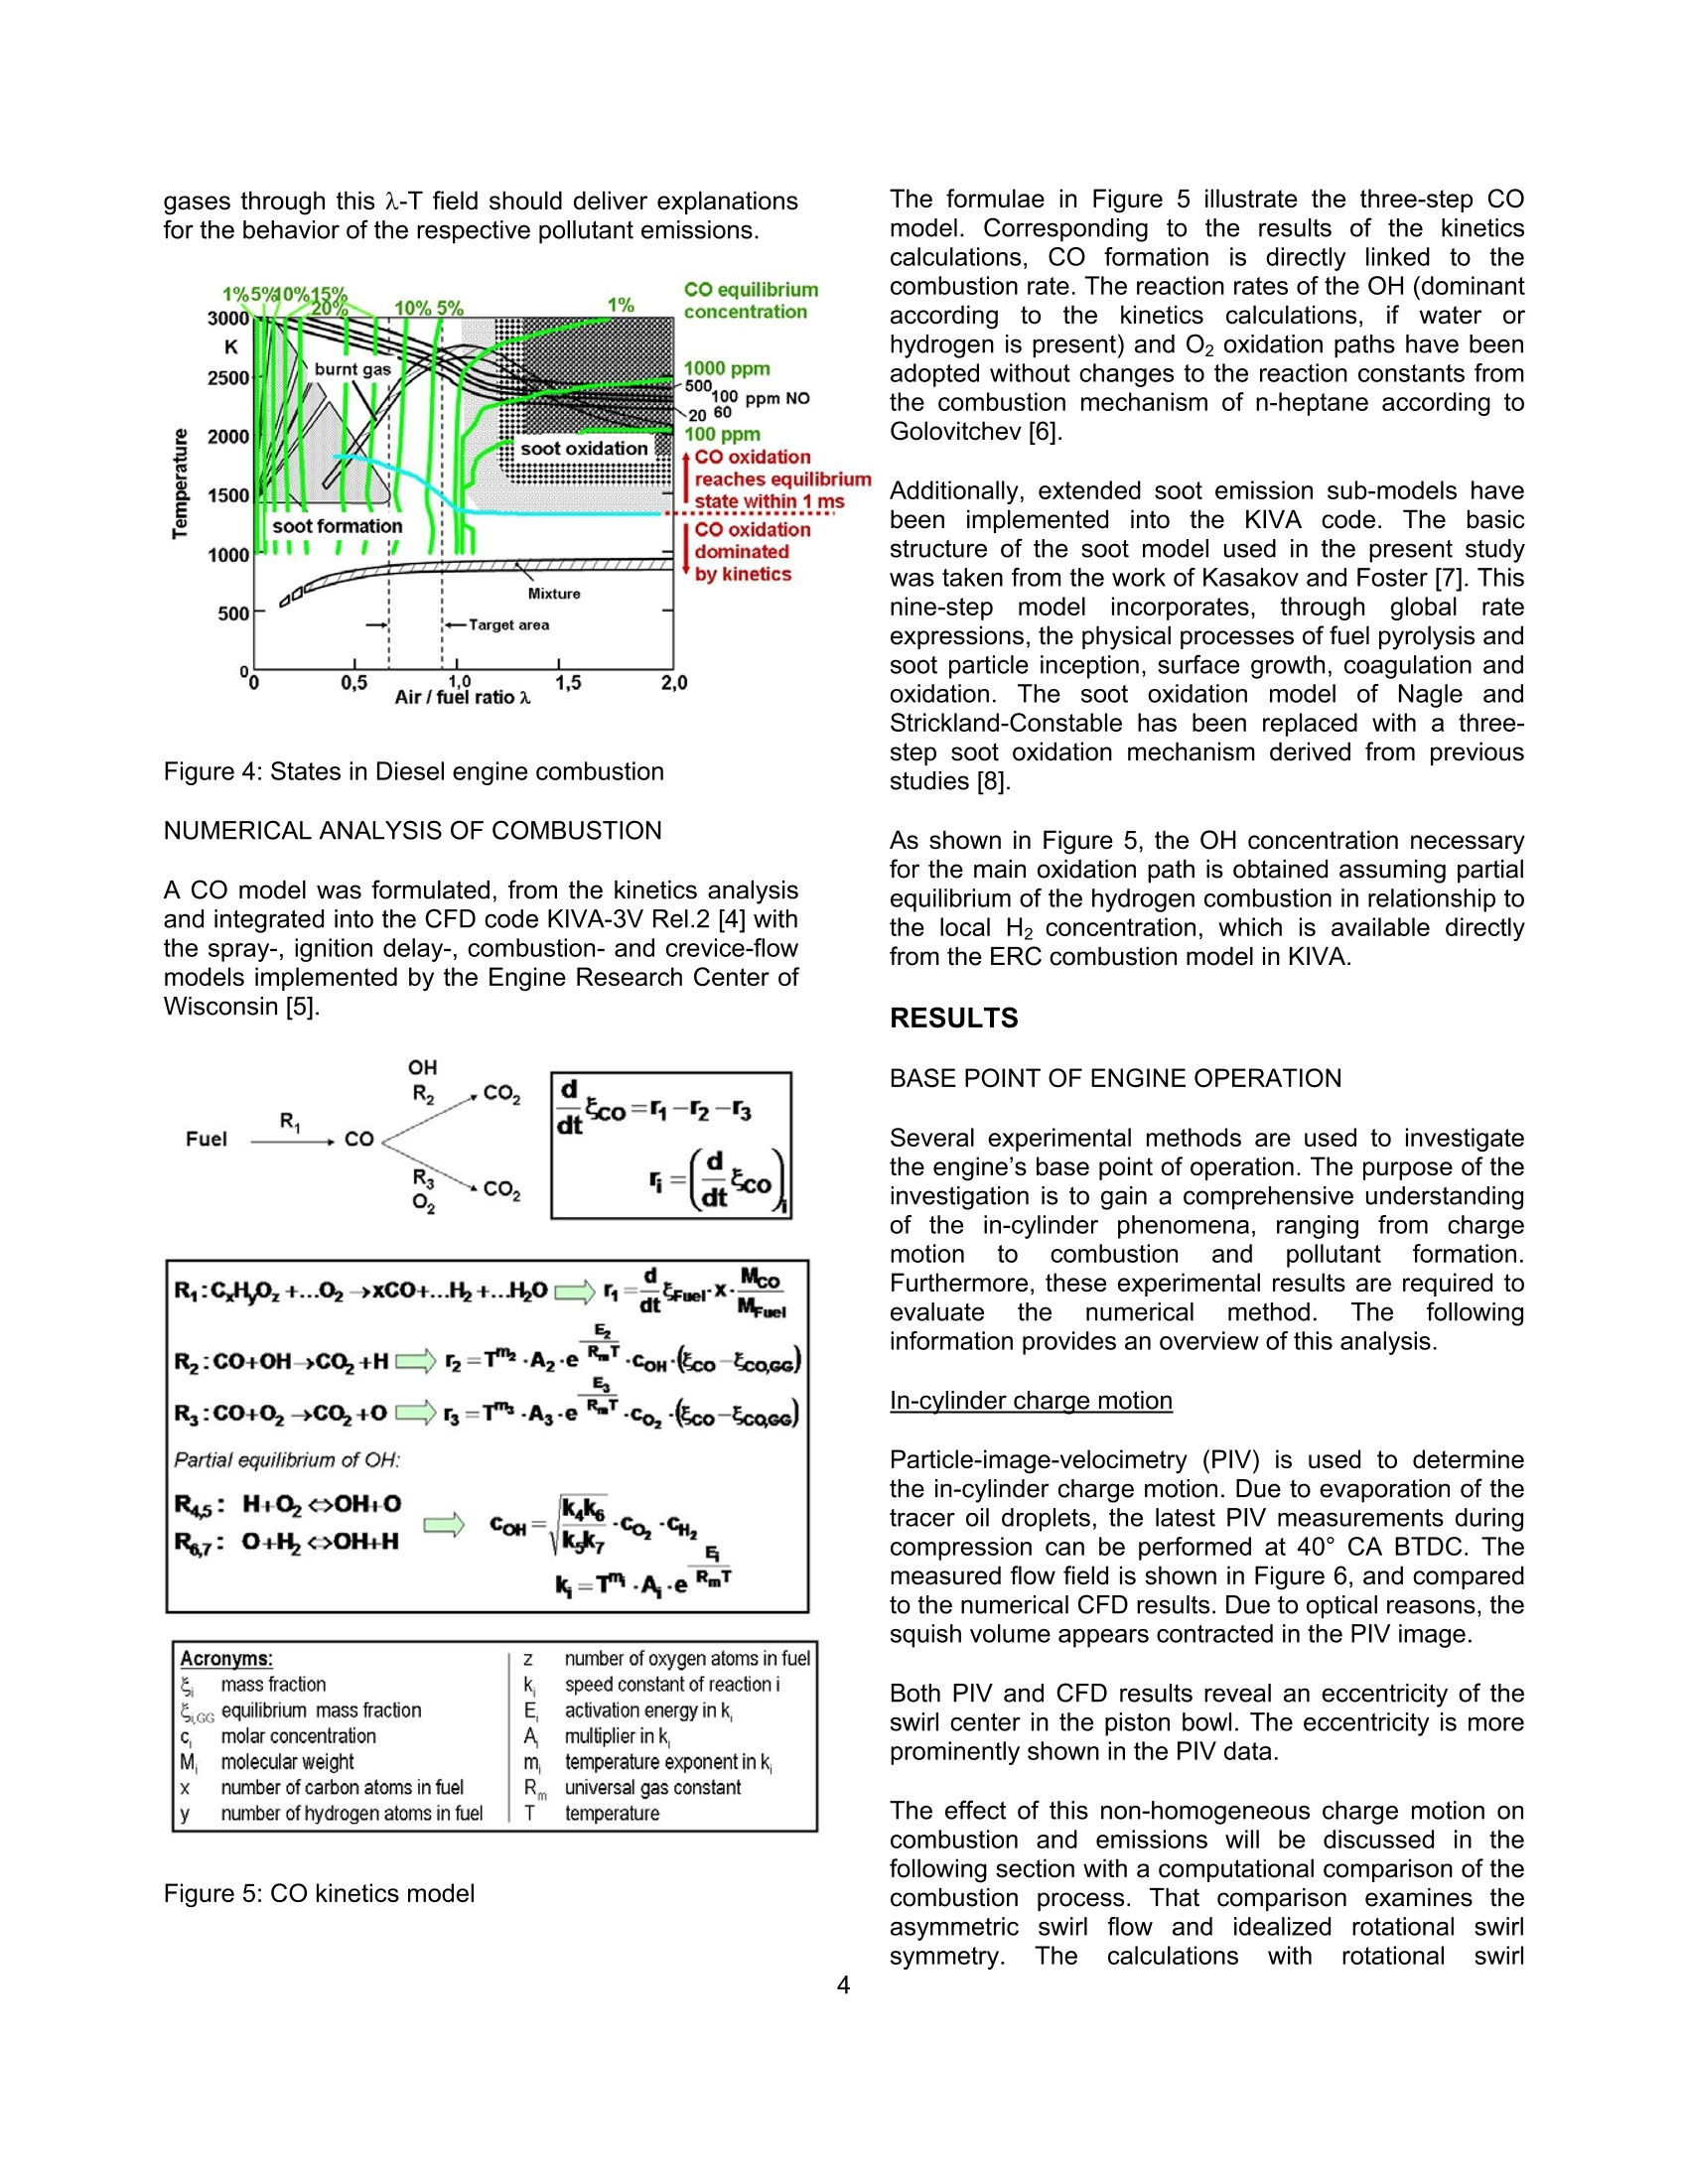
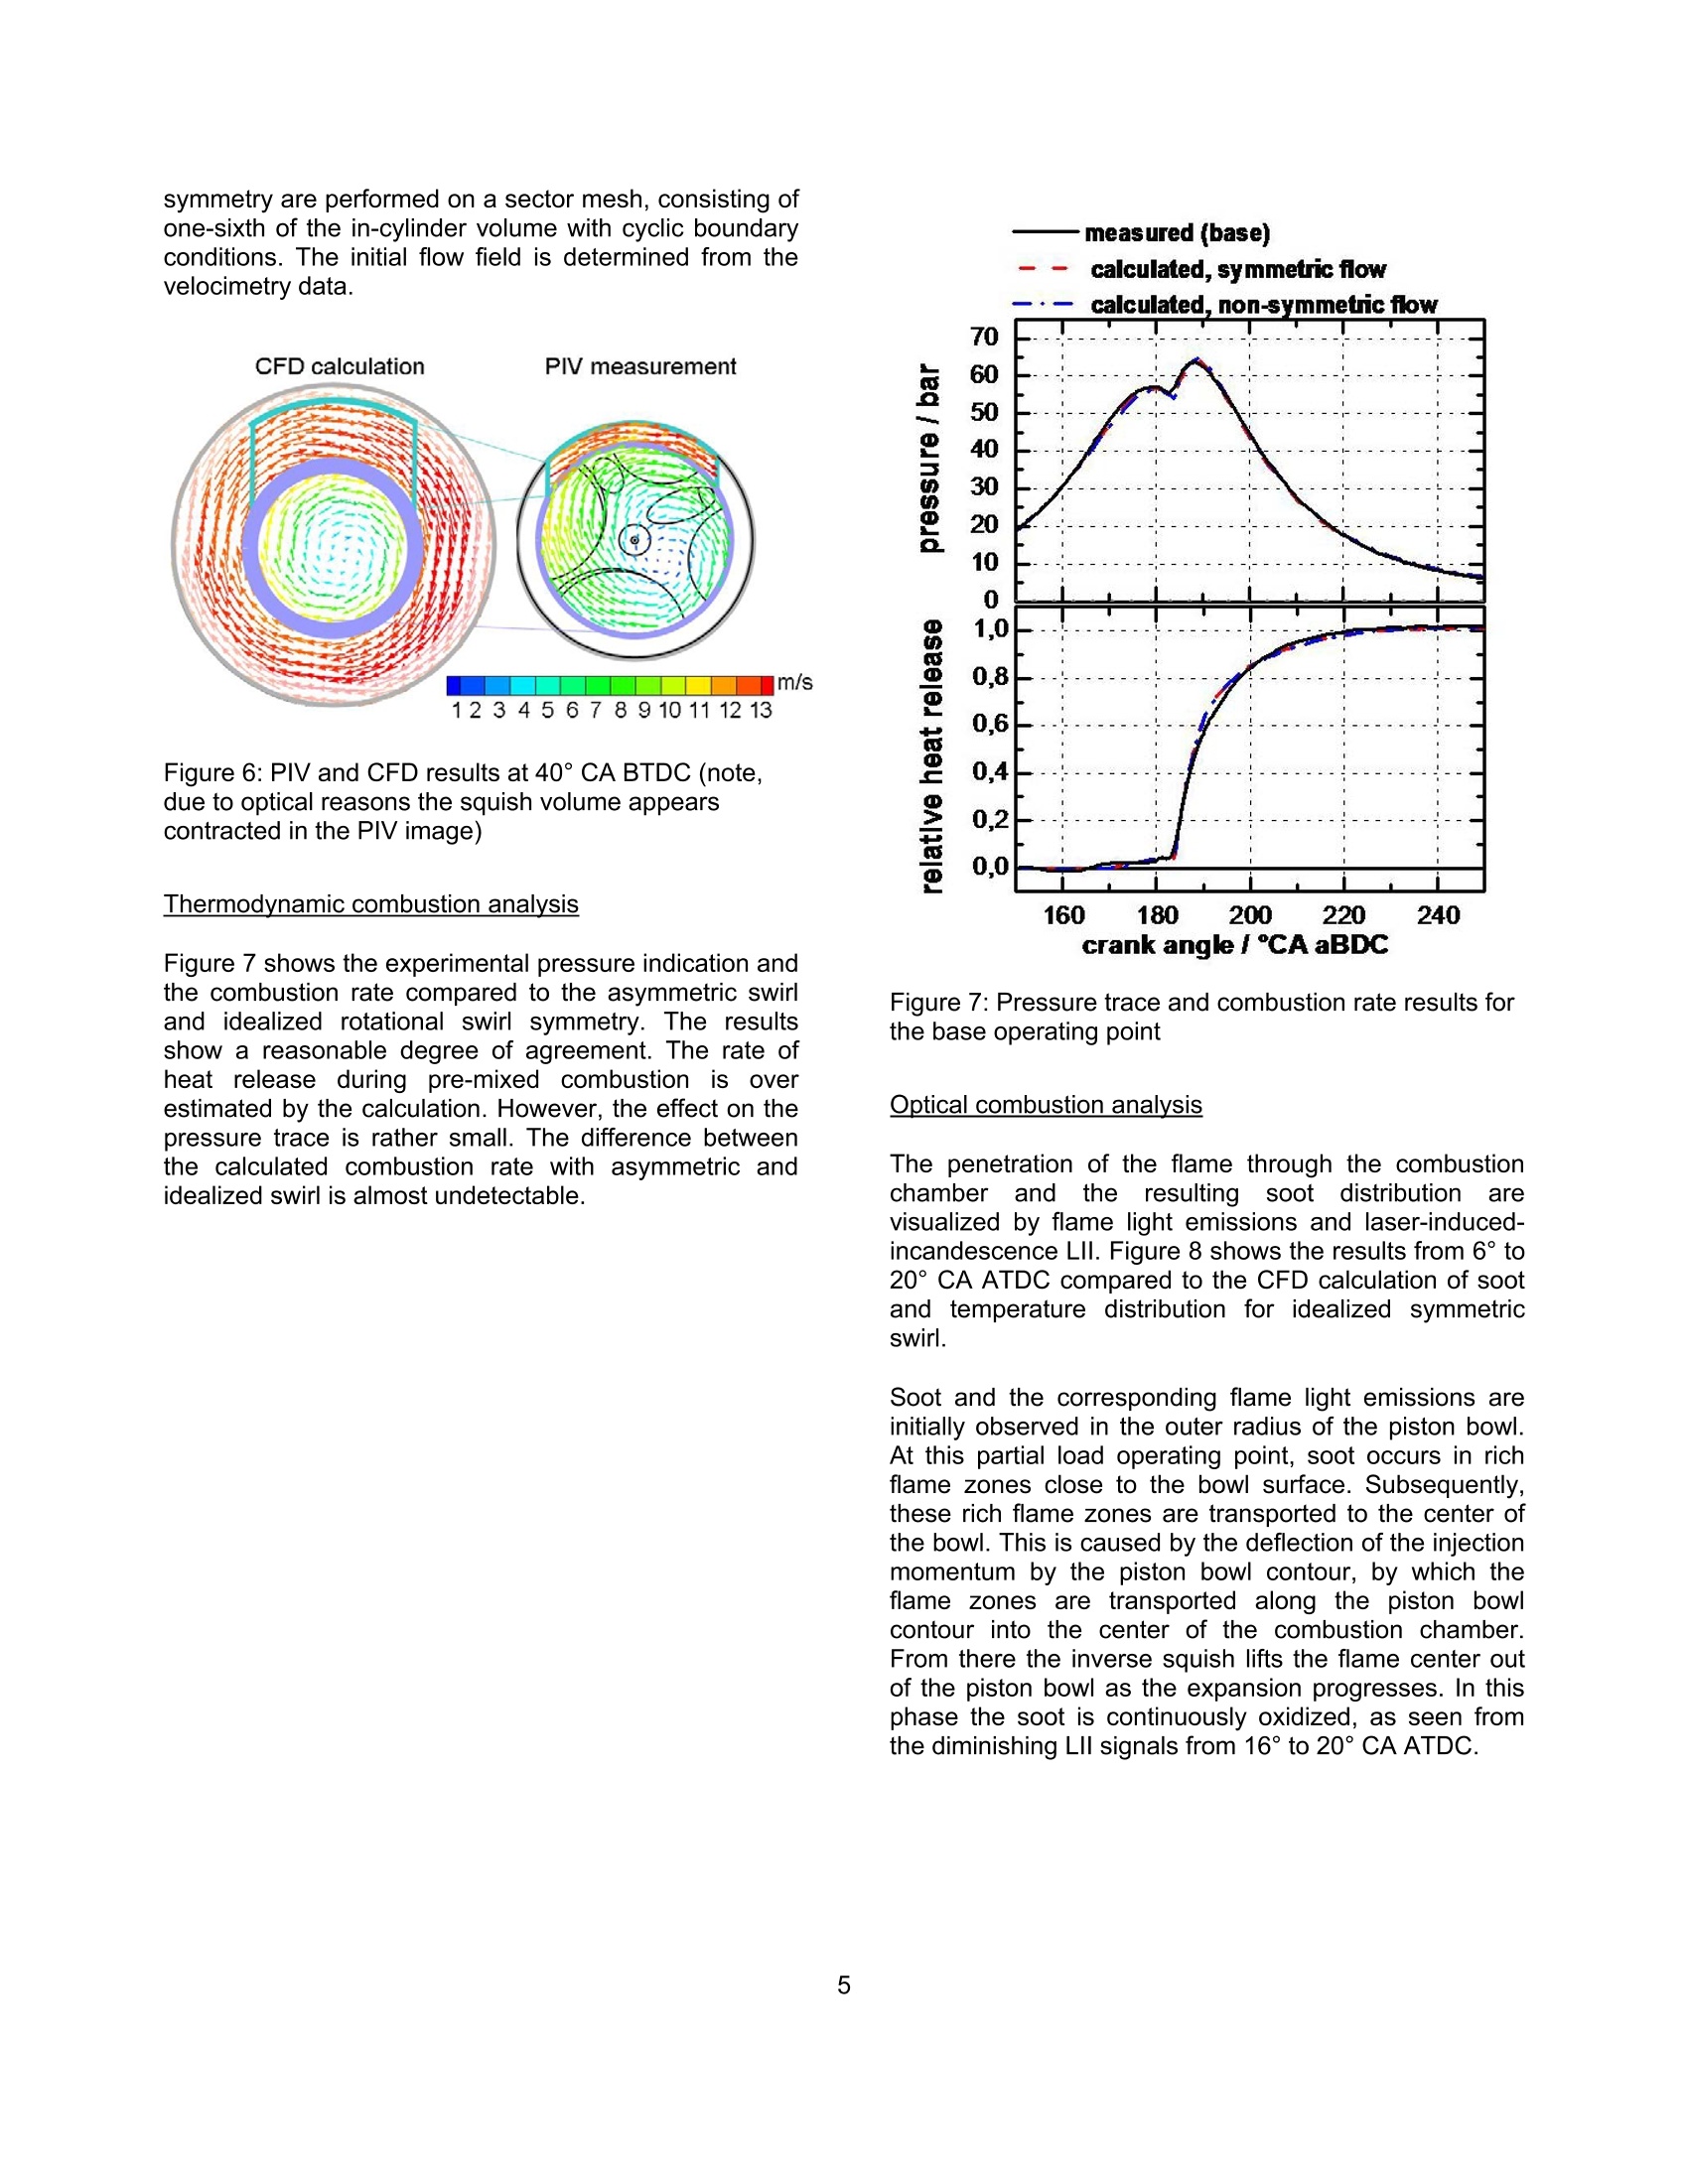
方案详情

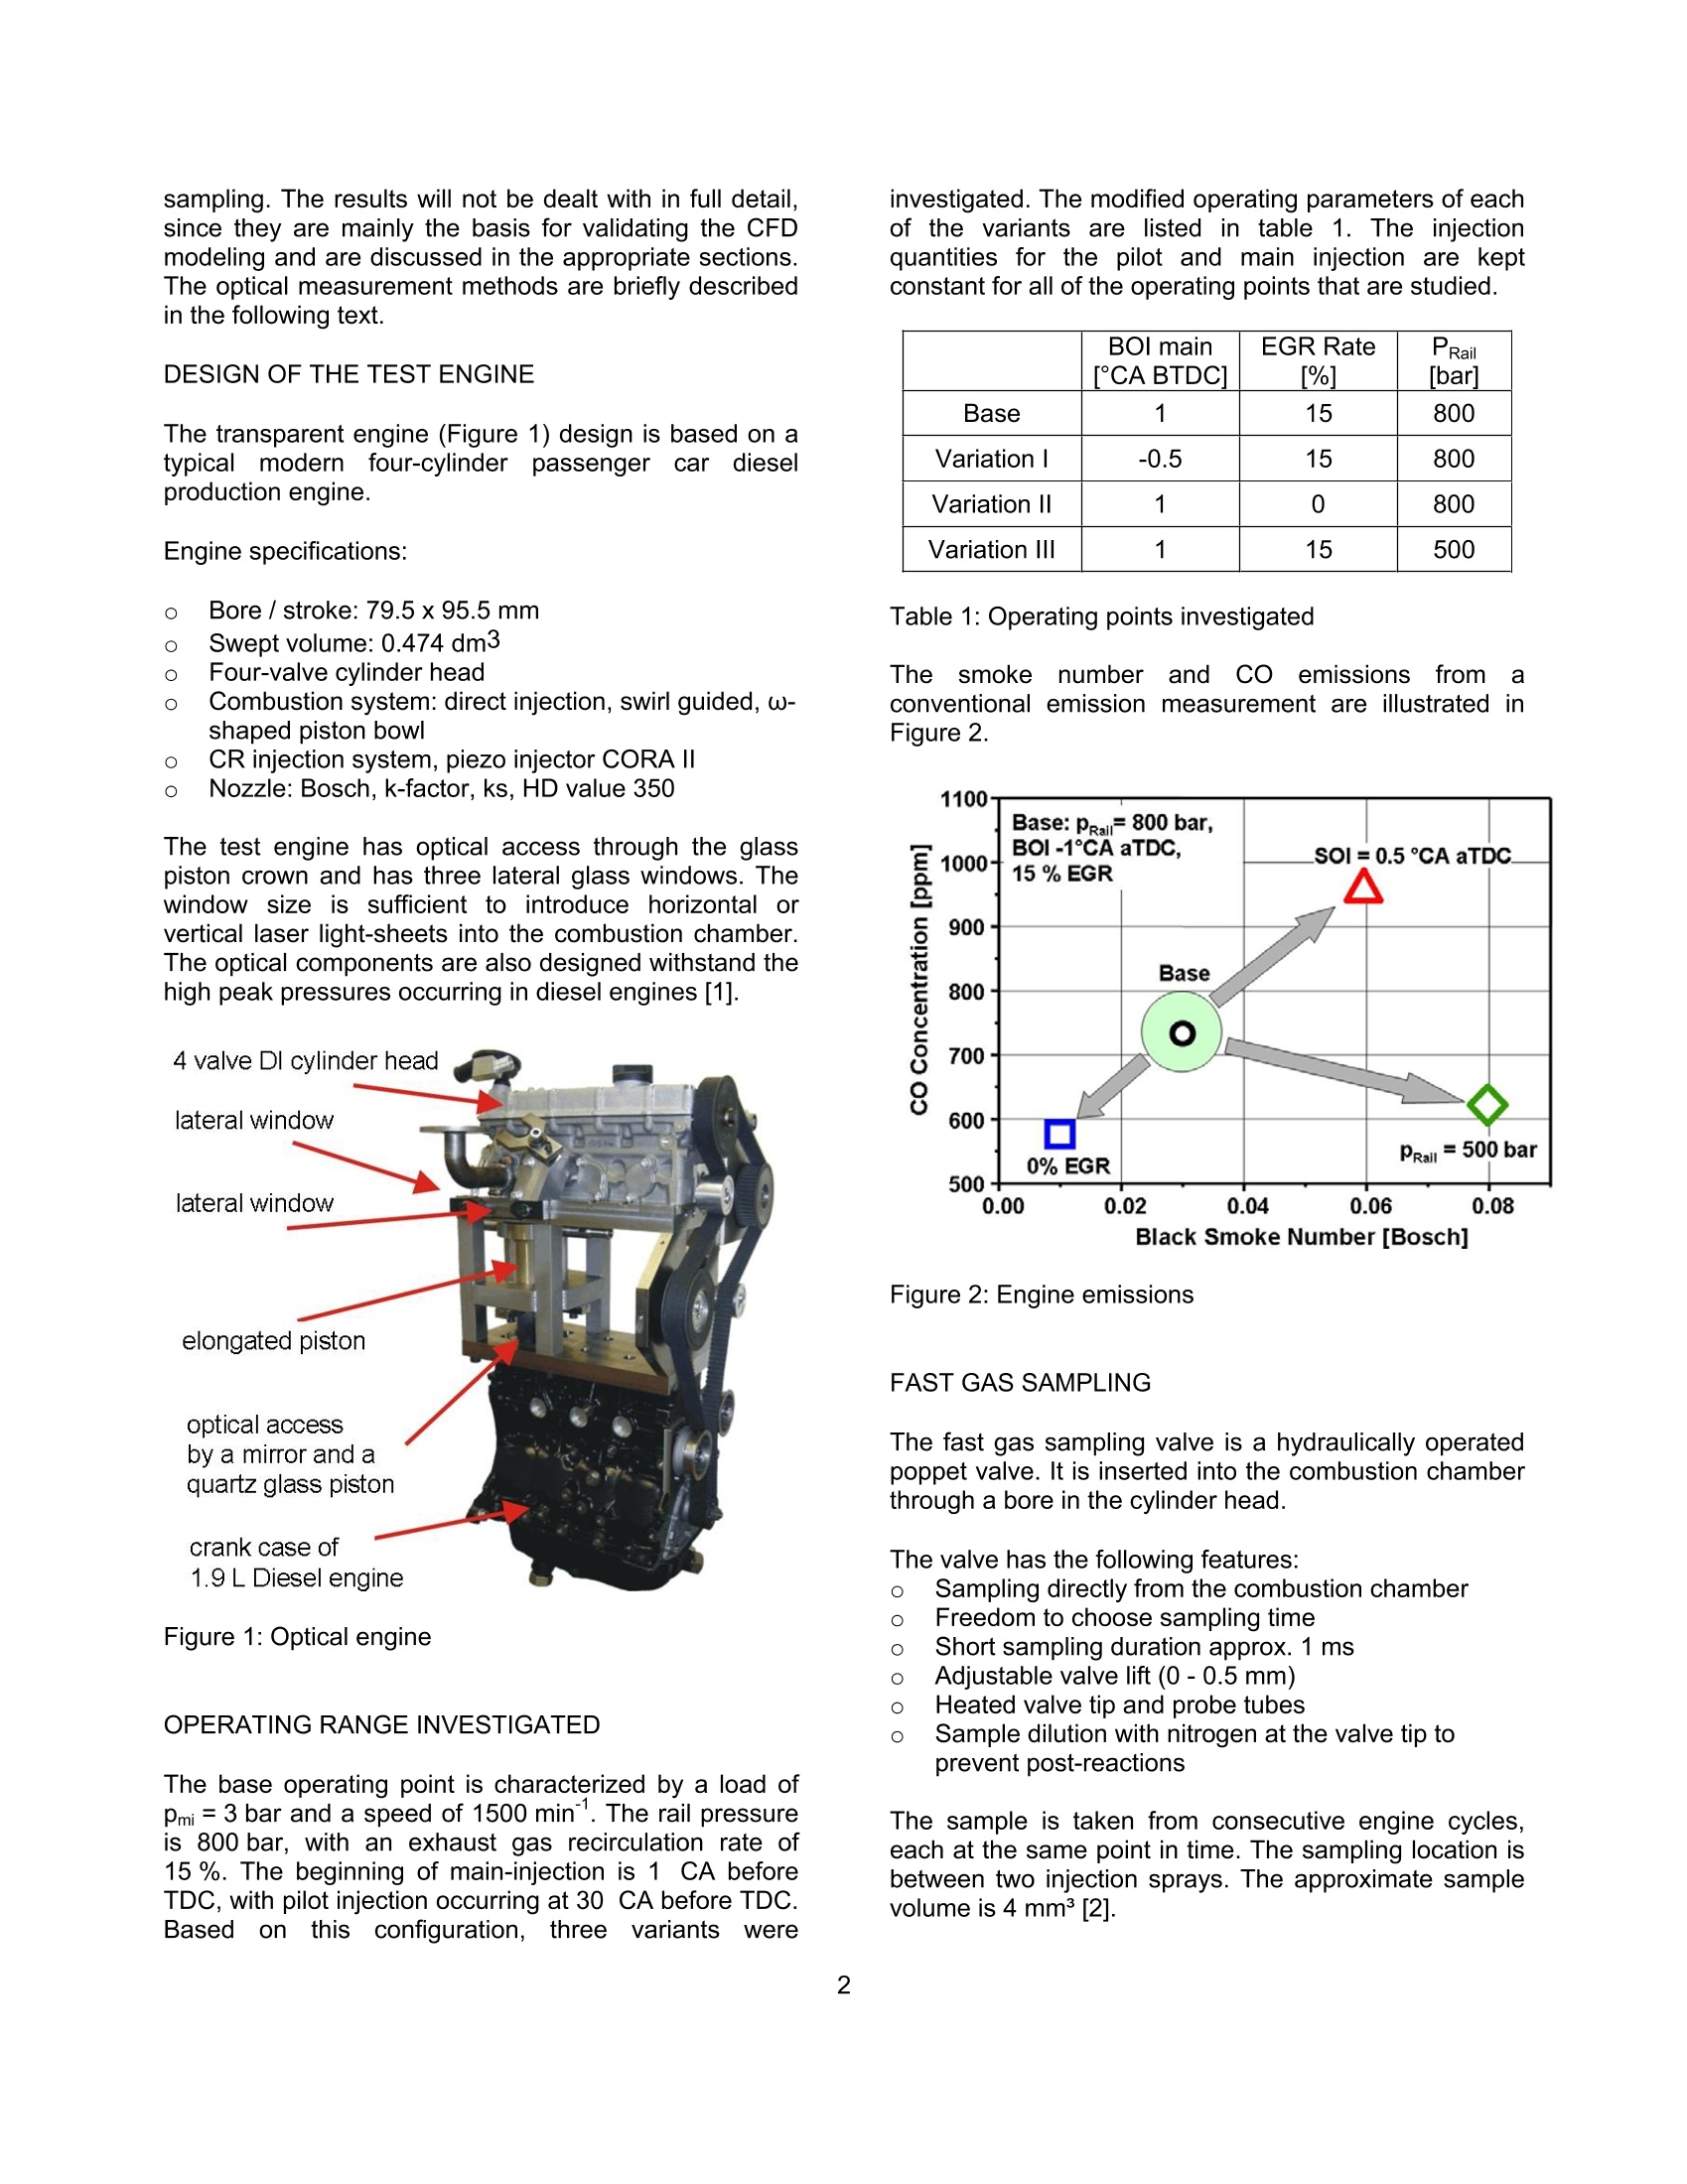
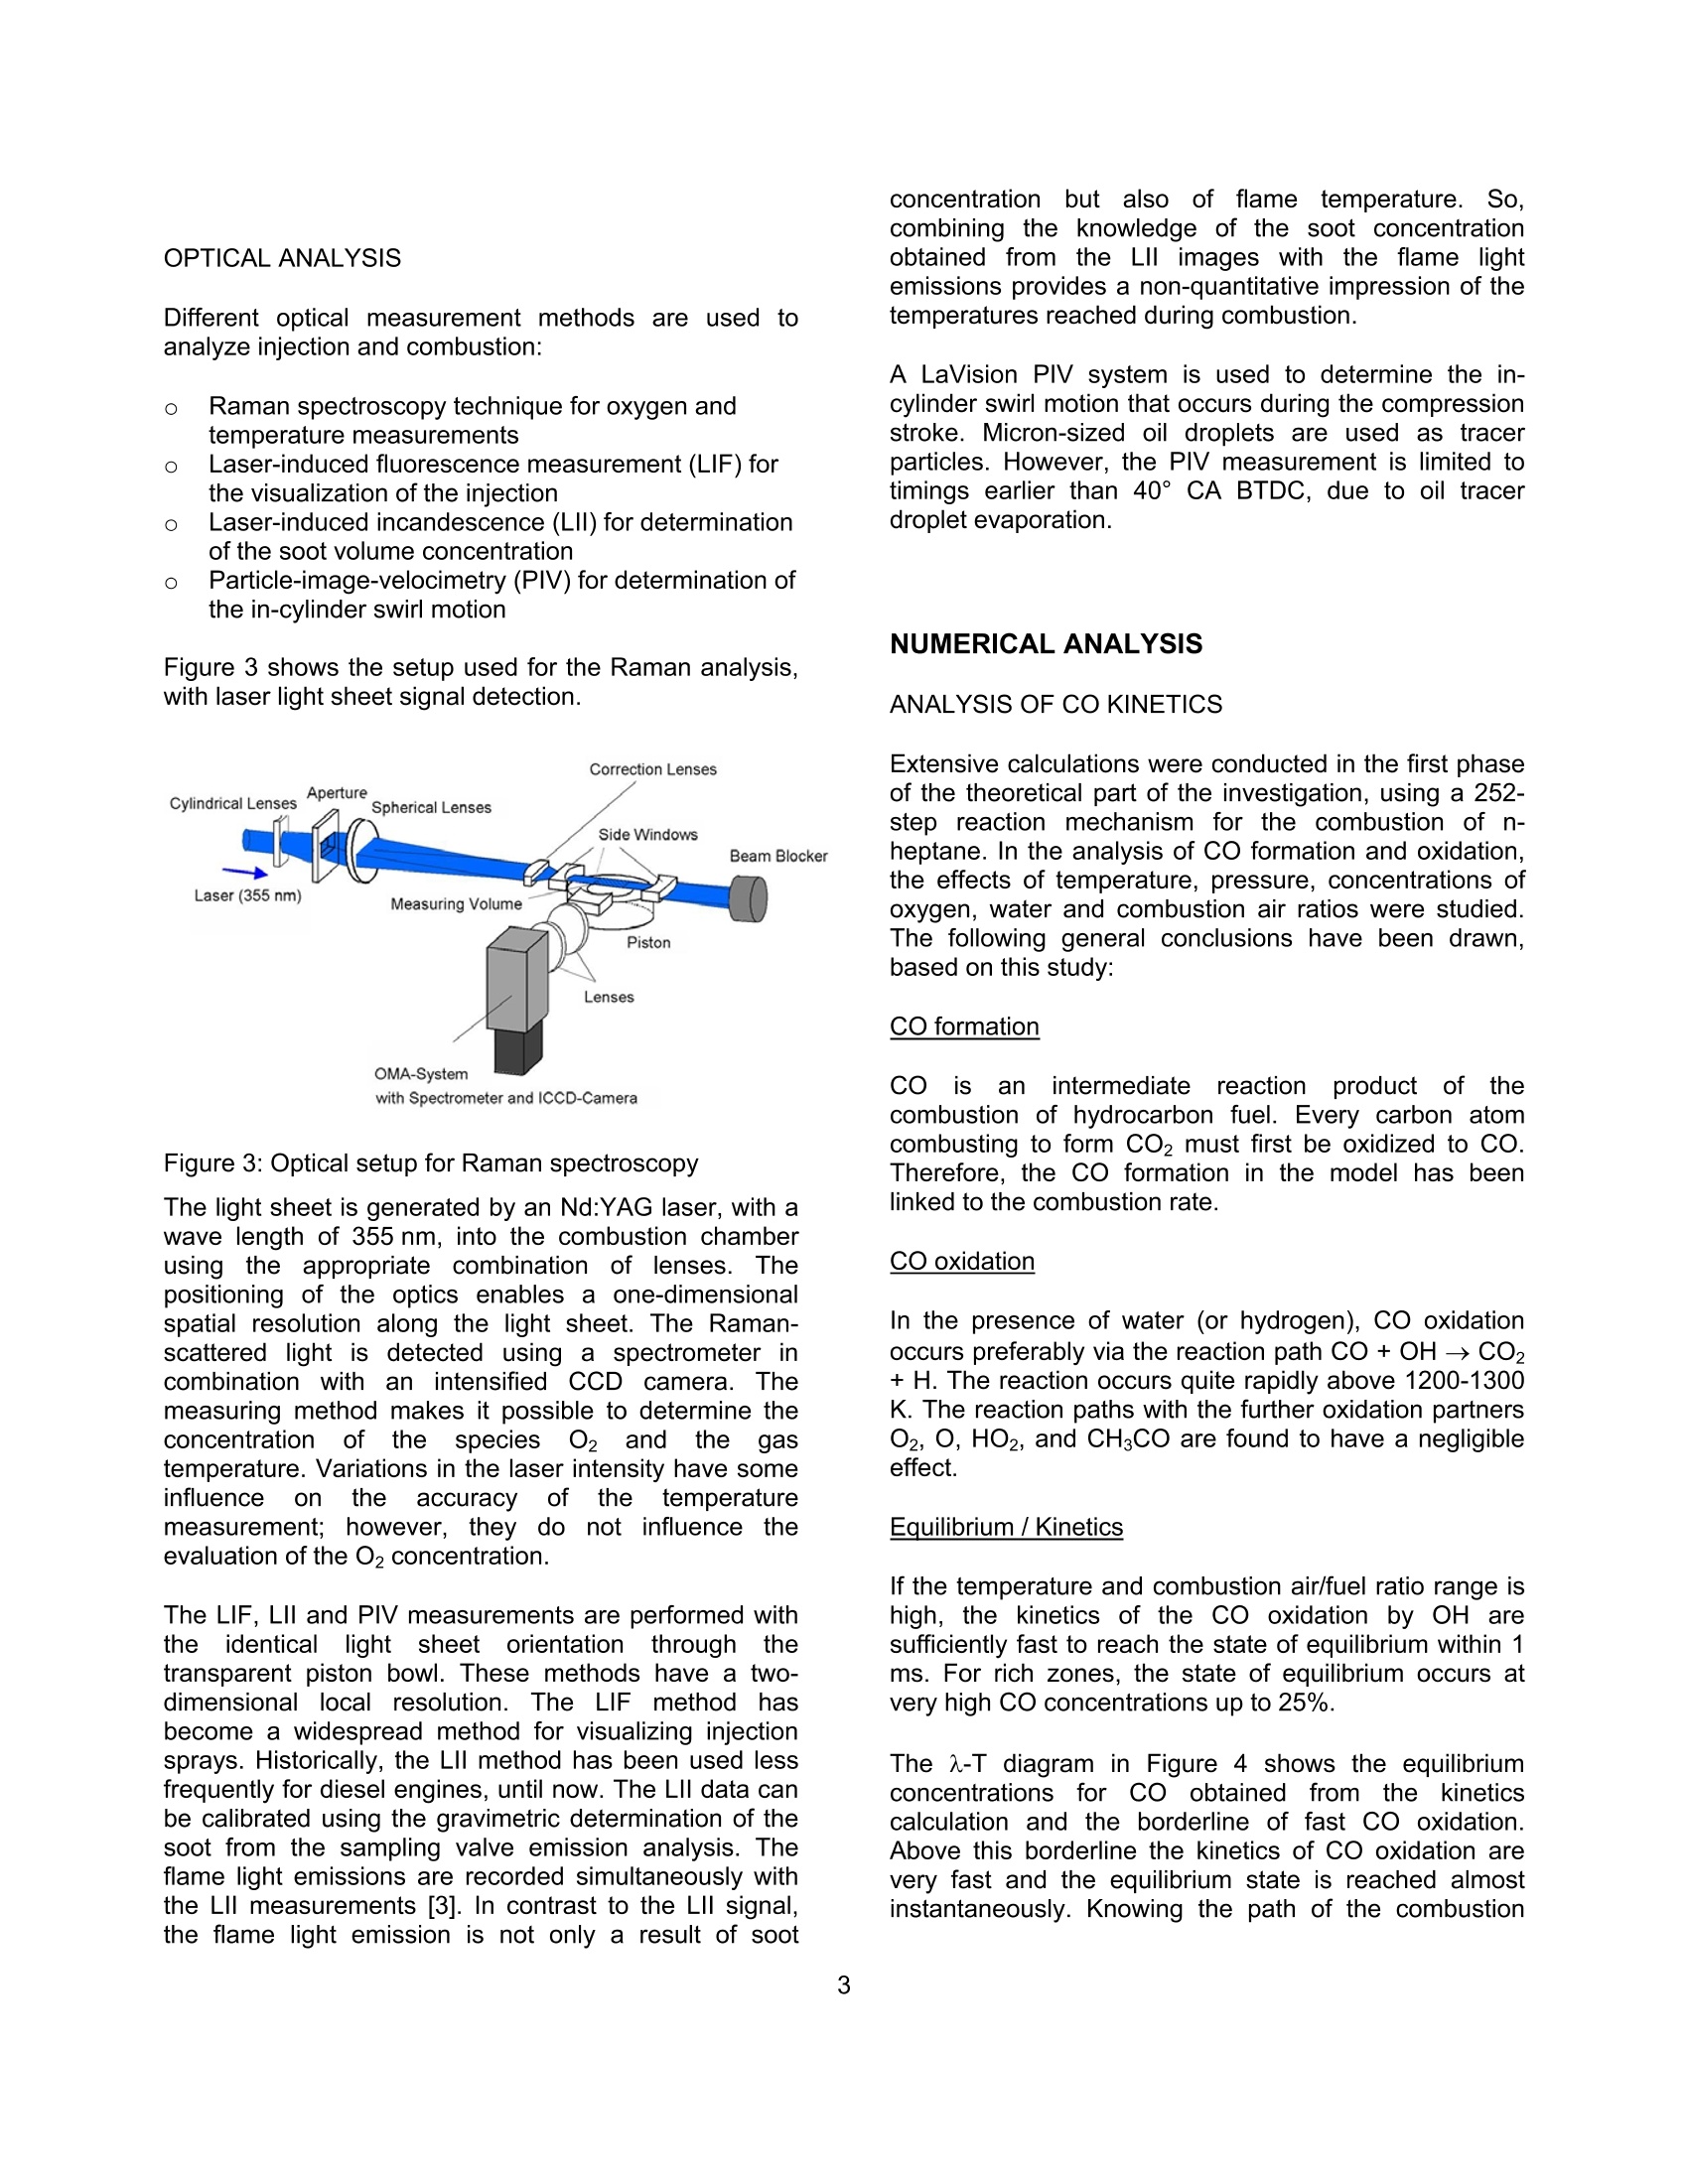
SAETECHNICALPAPER SERIES2006-01-1417 Potential Soot and CO Reduction forHSDI Diesel Combustion Systems Philipp Adomeit, Michael Becker and Hans Rohs FEV Motorentechnik Stefan Pischinger VKA,RWTH AachenAndreas Greis and Gerd Grunefeld LTFD, RWTH Aachen Reprinted From: In-Cylinder Diesel Particulate and NOx Control 2006 (SP-2002) 2006 SAE World Congress Detroit, Michigan April 3-6, 2006 The Engineering Meetings Board has approved this paper for publication. It has successfully completedSAE's peer review process under the supervision of the session organizer. This process requires aminimum of three (3) reviews by industry experts. All rights reserved. No part of this publication may be reproduced, stored in a retrieval system, ortransmitted, in any form or by any means, electronic, mechanical, photocopying, recording, or otherwise,without the prior written permission of SAE. For permission and licensing requests contact: SAE Permissions 400 Commonwealth Drive Warrendale, PA 15096-0001-USA Email:: permissions@sae.org Tel: 724-772-4028 Fax: 724-776-3036 Global Mobility Database@All SAE papers, standards, and selected books are abstracted and indexed in theGlobal Mobility Database. For multiple print copies contact: SAE Customer Service Tel: 877-606-7323 (inside USA and Canada) Tel: 724-776-4970 (outside USA) Fax: 724-776-0790 Email:CustomerService@sae.ora ISSN 0148-7191 Copyright @ 2006 SAE International Positions and opinions advanced in this paper are those of the author(s) and not necessarily those of SAE.The author is solely responsible for the content of the paper. A process is available by which discussionswill be printed with the paper if it is published in SAE Transactions. Persons wishing to submit papers to be considered for presentation or publication by SAE should send themanuscript or a 300 word abstract to Secretary, Engineering Meetings Board, SAE. Printed in USA 2006-01-1417 Potential Soot and CO Reduction for HSDIDiesel Combustion Systems Philipp Adomeit, Michael Becker and Hans Rohs FEV Motorentechnik Stefan PischingerVKA, RWTH AachenAndreas Greis and Gerd GrunefeldLTFD, RWTH Aachen Copyright C 2006 SAE International ABSTRACT The current direction for Diesel combustion systemdevelopment is towards homogenization, in order toreduce particulate and NOx emissions. However, astrong increase of carbon monoxide emissions (CO) isfrequently noted in combination with enhancedhomogenization. Therefore, the current investigation focuseson adetailed analysis of the particulate- CO trade-off using alaser-optical and multidimensional CFD investigation ofthe combustion process of a swirl HSDI system. TheCFD methodology involves reduced kinetics for sootformation and oxidation and a three-step CO model.These models are validated by a detailed comparison tooptical measurements of flow, spray penetration and thespatial distribution of soot, temperature and oxygenconcentration. The results obtained show that high concentrations ofCO occur as anintermediate combustion reactionproduct. Subsequently, CO and soot are oxidized inlarge areas of the combustion chamber. In part loadoperation, CO emissions are mainly caused by dilutioneffects in the early phases of combustion. However, theengine's soot emissions are caused by insufficientoxidization. Soot generation and oxidation are found to be stronglyimpacted by the slight non-homogeneity of the swirlmotion. The gaseous emissions are not affected by thesmall differences in local flow, which are outlined furtherin the text. lNTRODUCTION The demands for lower emissions and higher specificpower output of High Speed Direct Injection (HSDI)Diesel engines will increase significantly, due to futurelegislation and customer requirements. The:pNOxx-pparticulatetrade-offproduces loweremissions compared to conventional injection systems,due to the development of high-pressure injectiontechnology and the resulting higher degree of freedomfor the injection strategy. However, a strong increase ofcarbon monoxide (CO) emissions can often be noted.Until recently, the direct injection diesel engine's COemissionshave not been consideredcrucial., butchanges to the CO limits require current combustionconcepts to have an oxidation catalyst. It is for this reason that the current investigation focusesonthe soot,Coformation and coxidation. Theinvestigation takes intoaaccounttthelocallo,concentration and temperature in the cylinder usingoptical investigations in a transparent diesel engine andmulti-dimensional modeling.1The purpose of tthiscombined approachisto showtheepotential forimproving engine emissions and to provide inputvariables for the development of a kinetic CO model. EXPERIMENTAL ANALYSIS The test engine is a state-of-the-art diesel engine withoptical equipment and the option to add a fast gassampling valve. Optical analysis and fast gas samplingcomplement each other favorably, because the opticalresults can be calibrated with the gas sampling method.Furthermore, quantifying low concentrations of thespecies Co can only be accomplished through gas sampling. The results will not be dealt with in full detail,since they are mainly the basis for validating the CFDmodeling and are discussed in the appropriate sections.The optical measurement methods are briefly describedin the following text. DESIGN OF THE TEST ENGINE The transparent engine (Figure 1) design is based on atypical modern four-cylinder passenger car cdieselproduction engine. Engine specifications: Bore/ stroke: 79.5x95.5 mm 0 Swept volume: 0.474 dm3 Four-valve cylinder head Combustion system: direct injection, swirl guided, w-shaped piston bowl CR injection system, piezo injector CORA II 0 Nozzle: Bosch,k-factor,ks, HD value 350 The test engine has optical access through the glasspiston crown and has three lateral glass windows. Thewindow size is sufficient to introduce horizontal orvertical laser light-sheets into the combustion chamber.The optical components are also designed withstand thehigh peak pressures occurring in diesel engines [1]. Figure 1: Optical engine OPERATING RANGE INVESTIGATED The base operating point is characterized by a load ofpmi = 3 bar and a speed of 1500 min". The rail pressureis 800 bar, with an exhaust gas recirculation rate of15%. The beginning of main-injection is 1 CA beforeTDC, with pilot injection occurring at 30 CA before TDC.Basedl onthis configuration, threevariantsSwere investigated. The modified operating parameters of eachof the variants are listed in table 1. The injectionquantities for the pilot and main injection are keptconstant for all of the operating points that are studied. BOl main[CA BTDC1 EGR Rate%1 PRailbar1 Base 1 15 800 VariationI -0.5 15 800 Variation II 1 0 800 Variation III 1 15 500 Table 1:Operating points investigated Thesmoke numberandCOemissions fromaconventional emission measurement are illustrated inFigure 2. Figure 2: Engine emissions FAST GAS SAMPLING The fast gas sampling valve is a hydraulically operatedpoppet valve. It is inserted into the combustion chamberthrough a bore in the cylinder head. The valve has the following features: Sampling directly from the combustion chamber Freedom to choose sampling time Short sampling duration approx. 1 ms Adjustable valve lift (0-0.5 mm) Heated valve tip and probe tubes Sample dilution with nitrogen at the valve tip to prevent post-reactions The sample is taken from consecutive engine cycles,each at the same point in time. The sampling location isbetween two injection sprays. The approximate samplevolume is 4 mm³[2]. Different optical measurement methods are used toanalyze injection and combustion: Raman spectroscopy technique for oxygen andtemperature measurements Laser-induced fluorescence measurement (LIF) forthe visualization of the injection 0 Laser-induced incandescence (LII) for determinationof the soot volume concentration C Particle-image-velocimetry (PIV) for determination ofthe in-cylinder swirl motion Figure 3 shows the setup used for the Raman analysis,with laser light sheet signal detection. Figure 3: Optical setup for Raman spectroscopy The light sheet is generated by an Nd:YAG laser, with awave length of 355 nm, into the combustion chamberusing the appropriate combination of lenses. Thepositioning of the optics enables a one-dimensionalspatial resolution along the light sheet. The Raman-scattered light is detected using a spectrometer incombination with an intensified CCD camera. Themeasuring method makes it possible to determine theconcentration of the species02 andthe gastemperature. Variations in the laser intensity have someinfluenceonthe accuracy of theetemperaturemeasurement; however, they donot influence theevaluation of the O2 concentration. The LIF, Lll and PIV measurements are performed withtheidenticallight sheettorientationthroughttthetransparent piston bowl. These methods have a two-dimensional local resolution. The LIF method hasbecome a widespread method for visualizing injectionsprays. Historically, the Lll method has been used lessfrequently for diesel engines, until now. The Lll data canbe calibrated using the gravimetric determination of thesoot from the sampling valve emission analysis. Theflame light emissions are recorded simultaneously withthe Lll measurements [3]. In contrast to the LIl signal,the flame light emission is not only a result of soot concentrationbut also offlameetemperature. So,combining the knowledge of the soot concentrationobtained from the LIl images with the flame lightemissions provides a non-quantitative impression of thetemperatures reached during combustion. A LaVision PIV system is used to determine the in-cylinder swirl motion that occurs during the compressionstroke. Micron-sized oil droplets are used as tracerparticles. However, the PIV measurement is limited totimings earlier than 40°CA BTDC, due to oil tracerdroplet evaporation. NUMERICAL ANALYSIS ANALYSIS OF CO KINETICS Extensive calculations were conducted in the first phaseof the theoretical part of the investigation, using a 252-step reaction mechanism for the combustion of n-heptane. In the analysis of CO formation and oxidation,the effects of temperature, pressure, concentrations ofoxygen, water and combustion air ratios were studied.The following general conclusions have been drawn,based on this study: CO formation co iis anintermediate: reaction product offithecombustion of hydrocarbon fuel. Every carbon atomcombusting to form CO2 must first be oxidized to CO.Therefore, the CO formation in the model has beenlinked to the combustion rate. CO oxidation In the presence of water (or hydrogen), CO oxidationoccurs preferably via the reaction path CO+OH→ CO2+H. The reaction occurs quite rapidly above 1200-1300K. The reaction paths with the further oxidation partners02, O, HO2, and CHCO are found to have a negligibleeffect. Equilibrium/ Kinetics If the temperature and combustion air/fuel ratio range ishigh, the kinetics of the CO oxidation by OH aresufficiently fast to reach the state of equilibrium within 1ms. For rich zones, the state of equilibrium occurs atvery high CO concentrations up to 25%. The A-T diagram in Figure 4 shows the equilibriumconcentrations; for Co obtained from thekineticscalculation and the borderline of fast CO oxidation.Above this borderline the kinetics of CO oxidation arevery fast and the equilibrium state is reached almostinstantaneously. Knowing the path of the combustion gases through this a-T field should deliver explanationsfor the behavior of the respective pollutant emissions. Figure 4: States in Diesel engine combustion NUMERICAL ANALYSIS OF COMBUSTION A CO model was formulated, from the kinetics analysisand integrated into the CFD code KIVA-3V Rel.2 [4] withthe spray-, ignition delay-, combustion- and crevice-flowmodels implemented by the Engine Research Center ofWisconsin [5]. dMR:CHOz+...02-xCO+.c..H2+..H0Iodt MFuel R:CO+OH->CO+H2=T"2.AzeT.cow·(co-5cocc) R:C0+02→Co+0=>s=T"s.As·e,R.T.co,co-5cocc) Partial equilibrium of OH: R45: H+02→0H+0kkCoH=,R67:O+H2→OH+H kk77 k=T".A.e RmT Acronyms: mass fraction sicc equilibrium mass fraction molar concentration molecular weight number of carbon atoms in fuel y number of hydrogen atoms in fuel number of oxygen atoms in fuel speed constant of reactioni activation energy in k, multiplier in k m temperature exponent in k Runiversal gas constant T temperature Figure 5: CO kinetics model The formulae in Figure 5 illustrate the three-step COmodel. Corresponding to the results of the kineticscalculations, Co formation is directly linked to thecombustion rate. The reaction rates of the OH (dominantaccording to thekinetics calculations, if water orhydrogen is present) and O2 oxidation paths have beenadopted without changes to the reaction constants fromthe combustion mechanism of n-heptane according toGolovitchev [6]. Additionally, extended soot emission sub-models havebeen implemented into the KIVA code. The basicstructure of the soot model used in the present studywas taken from the work of Kasakov and Foster [7]. Thisnine-step modelincorporates,through globalrateexpressions, the physical processes of fuel pyrolysis andsoot particle inception, surface growth, coagulation andoxidation. The soot oxidation model of Nagle andStrickland-Constable has been replaced with a three-step soot oxidation mechanism derived from previousstudies [8]. As shown in Figure 5, the OH concentration necessaryfor the main oxidation path is obtained assuming partialequilibrium of the hydrogen combustion in relationship tothe local H2 concentration, which is available directlyfrom the ERC combustion model in KIVA. RESULTS BASE POINT OF ENGINE OPERATION Several experimental methods are used to investigatethe engine’s base point of operation. The purpose of theinvestigation is to gain a comprehensive understandingof the in-cylinder phenomena, ranging from chargemotiontocombustion andpollutantformation.Furthermore, these experimental results are required toevaluate the numericalmethod. Thefollowinginformation provides an overview of this analysis. In-cylinder charge motion Particle-image-velocimetry (PIV) is used to determinethe in-cylinder charge motion. Due to evaporation of thetracer oil droplets, the latest PlV measurements duringcompression can be performed at 40° CA BTDC. Themeasured flow field is shown in Figure 6, and comparedto the numerical CFD results. Due to optical reasons, thesquish volume appears contracted in the PIV image. Both PlV and CFD results reveal an eccentricity of theswirl center in the piston bowl. The eccentricity is moreprominently shown in the PIV data. The effect of this non-homogeneous charge motion oncombustion and emissions will be discussed in thefollowing section with a computational comparison of thecombustion process. That comparison examines theasymmetric swirl flow and idealized rotational swirlsymmetry.TTheCcalculationswith rotational swirl symmetry are performed on a sector mesh, consisting ofone-sixth of the in-cylinder volume with cyclic boundaryconditions. The initial flow field is determined from thevelocimetry data. Figure 6: PIV and CFD results at 40° CA BTDC (note,due to optical reasons the squish volume appearscontracted in the PIV image) Thermodynamic combustion analysis Figure 7 shows the experimental pressure indication andthe combustion rate compared to the asymmetric swirland idealized rotational swirl symmetry. The resultsshow a reasonable degree of agreement. The rate ofheat release during pre-mixed combustion is overestimated by the calculation. However, the effect on thepressure trace is rather small. The difference betweenthe calculated combustion rate with asymmetric andidealized swirl is almost undetectable. 一measured (base) Figure 7:Pressure trace and combustion rate results forthe base operating point Optical combustion analysis The penetration of the flame through the combustionchamber and the resulting soot distributionarevisualized by flame light emissions and laser-induced-incandescence LIl. Figure 8 shows the results from 6°to20° CA ATDC compared to the CFD calculation of sootand temperature distribution for idealized symmetricswirl. Soot and the corresponding flame light emissions areinitially observed in the outer radius of the piston bowl.At this partial load operating point, soot occurs in richflame zones close to the bowl surface. Subsequently,these rich flame zones are transported to the center ofthe bowl. This is caused by the deflection of the injectionmomentum by the piston bowl contour, by which theflame zones are transported along the piston bowlcontour into the center of the combustion chamber.From there the inverse squish lifts the flame center outof the piston bowl as the expansion progresses. In thisphase the soot is continuously oxidized, as seen fromthe diminishing LII signals from 16° to 20° CA ATDC. Experiment: Flame Light Figure 8: Comparison of flame light and Lll withcalculated temperature and soot distribution Overall, there is a good qualitative match betweencalculations andexperimentation,regarding thepenetration of the flame. The results of the soot andtemperature distribution are illustrated in Figure 8. The measured Lll and flame light distribution reveals acertainasymmetry. The correlation of this to theasymmetry of the flow field is explained later in this text. Fast gas sampling Quantitative information on the formation and oxidationof soot and CO is gained from the sampling of in-cylinder combustion gas with the fast gas samplingvalve. The composition of that sample is then analyzed.For a comparison, the results of the combustionsimulation evaluate a spherical volume at the tip of thegas sampling valve compared to the KIVA calculation.The temporal duration of the gas sampling event isemulated in the simulation. It accomplishes this byaveraging the species at the valve tip in a chronologicalmanner over the sampling event by evaluating radialgrowing shell volumes. Figure 9 shows the comparison between the measuredsoot and co concentrations and the results of thesimulation. Soot and co are oxidized duringthemeasurement from 10° to 60°CA ATDC. The maximumconcentrations of soot and CO formed during earlycombustion (10°CA ATDC) are significantly larger thanthe final values at 60° CA ATDC, which correspond tothe engine's emissions. The results show local concentrations, which depend onthe position of the flame relative to the measurementvolume. The relative CO minimum at 20 °CA ATDC canbe attributed to the in-cylinder swirl, which transports aCO cloud through the sampling volume. Figure 9: Comparison of calculated soot and CO massfraction and measurement by fast gas sampling Raman spectroscopy The temporal and spatial distribution of oxygen withinthe combustion chamber is measured by 1D Ramanspectroscopy. The Raman signals are integrated inseven volumes within the horizontal laser sheet, which ispositioned just above the piston bowl. Figure 10 showsthe results as a function of the radial position and acomparison to the calculated oxygen concentrations. Durinag the combustion process, theeoxygenconcentration notably decreases above the bowl rim.This corresponds to the visual observation of the flamelight in Figure 8.Obviously, the main combustion andoxygen consumption occurs in the area of the outer bowlradius. Raman measurementssanddcalculationsshow aconsistent match regarding the spatial and temporalgradients, with an approximately constant offset ofaround 3-4% in absolute values. Thus, the simulationresults are at the upper end of the accuracy range of thecurrent Raman spectroscopy application. Figure 10: Measured and calculated O2 mass fractiondistribution above the piston bowl during combustion A reasonable agreement has been achieved betweenthe calculation results and the different experimentalmethods, with regard to pressure, heat release, soot andtemperature distribution, soot, CO and O2 concentration.This justifies the need to further investigate the CFDresults in order to analyze the CO formation andoxidation process in more detail. ANALYSIS OF CO FORMATION AND OXIDATION Figure 11 shows the regions with CO concentrationabove 2000 ppm in a 60°segment of the combustionchamber. These calculated results are presented in theearly phase of combustion at 6° and 10° CA ATDC. Figure 11: Calculated CO rich regions (mass fraction >2000 ppm) in the initial phase of combustion CO clouds with concentrations above 2000 ppm arevisualizedandccolor-coded, showing itheelocaltemperature. Three separate color-coded regions can beidentified. Pilot iniection flame The small pilot injection of fuel quantity, when combinedwith a large ignition delay, leads to lean and soot freecombustion. Due to the resulting low temperatures, theCO oxidation freezesaandda co concentration ofapproximately 3000 ppm remains. Core of the main injection spray Low air entrainment and high concentrations of fuelvapor cause rich combustion with high temperatures.High soot and Co concentrations are found in thisregion during the combustion. However, the hightemperatures allow the CO to be oxidized, as more air isentrained. Outer regions of the main injection spray High air entrainment and low concentration of fuel vaporresult in similar conditions during pilot injection. Thecombustion in these zones is lean and soot free. Due tothe flame expansion after auto ignition, this volume isintensely mixed with the colder ambient gas, so that COoxidation freezes at concentrations of 2000-5000 ppm. Subsequently, at 10° CA ATDC this peripheral area ofthe main injection flame remains in the center of thepiston bowl. It merges with the upper part of the pilotinjection exhaust gas to a cold exhaust cloud with a highCO concentration. The second part of the pilot injectionis trapped by the core area of the main injection spray. During the expansion stroke, air is entrained graduallyinto this rich flame zone, which maintains a rhightemperature. Thus, the CO oxidation rate in the richflame core is controlled by air entrainment and not bykinetics. Even in the late phase of combustion, shown inFigure 12, the oxidation of CO in the core area of theinjection spray is continuously ongoing since the localtemperature is still sufficient for CO oxidation. Figure 12: Calculated CO clouds (mass fraction> 2000ppm) at the end of combustion CO originates from the lean and colder flame regions inthe combustion chamber at the end of expansion, whilethe remaining soot originates from the rich flame core ofthe main injection spray. These results offer anexplanation for the occurrence of the soot-CO tradeoff inDiesel engine combustion. VARIATION OF BOI, EGR AND RAIL PRESSURE Table 2 compares the CO emissions calculated andmeasured in the base point and the three variantsstudied (cf. Figure 2). In this numerical study, themodeling constants were kept identical to ensure directcomparability. CO emissions Measured[ppmj Calculated[ppmj Base 733 570 Retarded BOI (Var. I) 1956 1645 Reduced EGR (Var. II) 1577 417 Reduced pRail (Var. III) 617 372 ( Table 2: !: Engine Co emissions: c omparison of measurement and calculation ) Trends)Cand lleevel of CO emissions are predictedreasonably well with the CO model. The effect of BOI,EGR and rail pressure can be explained throughanalysis of the CO formation and oxidation process,which allow the following observations to be made: o Retarding BOl causes; a longer ignition delay,thereby enhancing homogenization. As a result, thecombustion in leanZzonesincreases,withasubsequent early freeze of CO oxidation. Thisexplains the increased CO emissions. The reductioni ofEGRincreasesthe oxygenconcentration in the complete combustion process.Accordingly, both CO and soot emissions decrease. The reduction of rail pressure deteriorates themixtureformationbbyyretarding vaporization.Consequently, the premixed lean burn at thebeginning of combustion is reduced and a loweramount of CO is formed.Simultaneously, the maincombustion becomes richer, leading to a significanttradeoff concerning increases in soot and decreasesin CO. EFFECT OF CHARGE MOTION ON COMBUSTIONAND EMISSIONS A numerical combustion analysis is performed for thenon-symmetric swirl flow situation of the base operatingpoint. The in-cylinder flow field at 40°CA BTDC isdeterminedbyCFD calculation with StarCD.Subsequently, the flow field is then mapped onto a fullmesh for further combustion analysis using KIVA. The non-symmetric swirl does not affect the calculatedthermodynamic data, such as heat release and in-cylinder pressure, as seen in Figure 7. Figure 13: CO and soot mass fraction during combustion The effect of a non-symmetric swirl on soot and COemissions is shown in Figure 13. The CO concentration is almost not affected by the flow symmetry. This is alsoobserved for other gaseous emissions such as NOx.However, the non-symmetry causes a drastic increase ofthe soot mass. During the pre-mixed combustion (< 190° CA ABDC),the differences in soot mass are small and obviously notdependent the flow details.. However,largedifferences n soot massdevelop durin】g diffusivecombustion, 190° to 210°CA ABDC. Figure 14 shows the calculated soot distribution in andabove the piston bowl in direct comparison to the flamelight and Lll measurement. The increase of soot occursin regions with reduced flow velocity, due to the non-symmetric swirl. The reduced convective mixing seemsto increase soot formation and retard soot oxidationduring the diffusive combustion phase. Figure 14: Measured soot distribution (flame light andLll) vs. calculated soot distribution (in the Lll plane) CONCLUSIONS The kinetics of CO formation and oxidation are analyzedand modeled in a three-step CO model. The model isimplementedinto the CCFD code, KIVA-3V. Thisapproach has beenverified throughdetailedcomparisons with experimental data on pressure, O2,CO and soot concentration distribution in an opticalengine9with laser-opticalandfast gas samplingtechniques. The combination of CFD and laser-optical analysis is anefficient tool for examination of the detailed processesinvolved in HSDI Diesel combustion.The application ofthe combined analysis tools to a partial load operation ofa modern HSDI Diesel engine provides the following explanation for the trade-off between soot and COemissions: Sootaanddco are created andoxidizedsimultaneously in regions where rich combustionoccurs. While these rich regions contain very highCO concentrations during combustion, their hightemperatures enable almost all CO to be oxidized bythe continuous air entrainment into the rich flamezone during burn-out. In contrast, soot oxidationoccurs comparatively quickly, so that soot emissionsare generated within these rich zones, especially inthe injection spray core. 0 Most of the engine’s CO emissions are formed inlean flame zones, especially during pilot injectionand the spray fringe area of the main injection. Here,fast air entrainment results in a lean and soot freecombustion processwithn low temperatures.Subsequent quenching effects by the surroundinggas cause the CO oxidation to freeze early in thecombustion process. Furthermore, soot generation and oxidation is found tobe strongly affected by the slight asymmetry of the swirlflow field of the investigated engine; whereas, thegaseous emissions are not affected by these slight localflow differences. Obviously, soot oxidation is highly sensitive to the localreduction of convective mixing. This explains the non-symmetric soot distribution observed in thee Lllmeasurements at the end of combustion. ACKNOWLEDGEMENTS Portions of this paper contain scientific results from aresearch projectof the ForschungsvereinigungVerbrennungskraftmaschinene.V. (FVV,Frankfurt)“Reduktionspotential fur RuB und CO"executed at theLehrstuhl furwVerbrennungskraftmaschinenn (VKA),RWTH Aachen Iheaded by Univ.-Prof. Dr.-Ing. S.Pischinger and at the Lehrstuhl fur Laser-Messverfahrenin der Thermofluiddynamik (LTFD), RWTH Aachenheaded by Prof. Dr. rer. nat. G. Grunefeld. The authorswould also like to thank the FVV work group headed byDr. Chmela, LEC GmbH, for their continuous support.Financialfunding by the AlF isalsogratefullyacknowledged. REFERENCES [1] Becker, M., Backer, H. (2002) Transparent Engine asa Modern Development Tool for Passenger Car DieselEngines (in German), Tagung ,,Optisches Indizieren",Haus der Technik e.V.,Essen 2002 ( [2] Wolfle, M. ( 1994) I n v estigation o f th e pol l utantformation in a direct injectio n passenger car Diesel engine (in German), , Dissertation RWTH Aachen, Aachen ) ( [3] Pischinger, S., Rohs, H., Becker, M., G runefeld, G .,Greis, A. (2002) A Soot F ormation M o del (in G e rman). Final Report o f the FVV Project Nr. 736 / Issue 515 ) ( [4] Amsden , A .A. ( 1999) KIVA-3V, RELEASE 2, Improvements to KIVA-3V , Los Alamos National Laboratory Report LA-13608-MS ) ( [5] Kong, S .-C., Han, Z., Reitz, R. D . ( 1 995) TheDevelopment a n d Application o f a Diesel Ignition a nd Combustion Modelfor Multidimensional EngineSimulations , SAE 950278 ) ( [6] Golovitchev, V.l . et . al . (2000 ) 3-D Diesel SpraySimulations Using a N ew D e tailed Chemistry T u rbulentCombustion Model, SAE paper 2000-01-1891 ) [7] Kasakov, A., Foster, D. (1998) Modeling of SootFormation during DI Diesel Combustion using a Multi-step Phenomenological Model. SAE paper 982463. [8] Backer, H., Hopp, M., Pungs, A. (1999) Developmentof a Simulation Tool for Modeling the Soot Oxidation inDiesel Engines (In German). Final Report of a FVVProject Nr.: 659 / FVV Heft 671 CONTACT P. Adomeit, FEV Motorentechnik GmbH, 52078 Aachen,Germany;++49 2415689-434; Email: Adomeit@fev.de SHEInternationalCommonwealth Drive,Warrendale, PA U.S.A. Tel:(Fax: (Web: www.sae.org
确定


还剩10页未读,是否继续阅读?

产品配置单


北京欧兰科技发展有限公司为您提供《高速直喷柴油燃烧系统,碳烟,一氧化碳,汽车发动机中减排方法,速度场检测方案(粒子图像测速)》,该方案主要用于整车安全中主动安全检测,参考标准--,《高速直喷柴油燃烧系统,碳烟,一氧化碳,汽车发动机中减排方法,速度场检测方案(粒子图像测速)》用到的仪器有德国LaVision PIV/PLIF粒子成像测速场仪、PLIF平面激光诱导荧光火焰燃烧检测系统、激光诱导白炽光烟雾粒子成像分析仪(LII)
推荐专场


该厂商其他方案
更多