


采用LaVision公司特色的以DaVis软件平台为基础构成汽车发动机时间分辨多参两成像测试系统,研究了确定火花辅助压缩点火过程中燃烧可变性原因所需要的实验度量指标。
方案详情

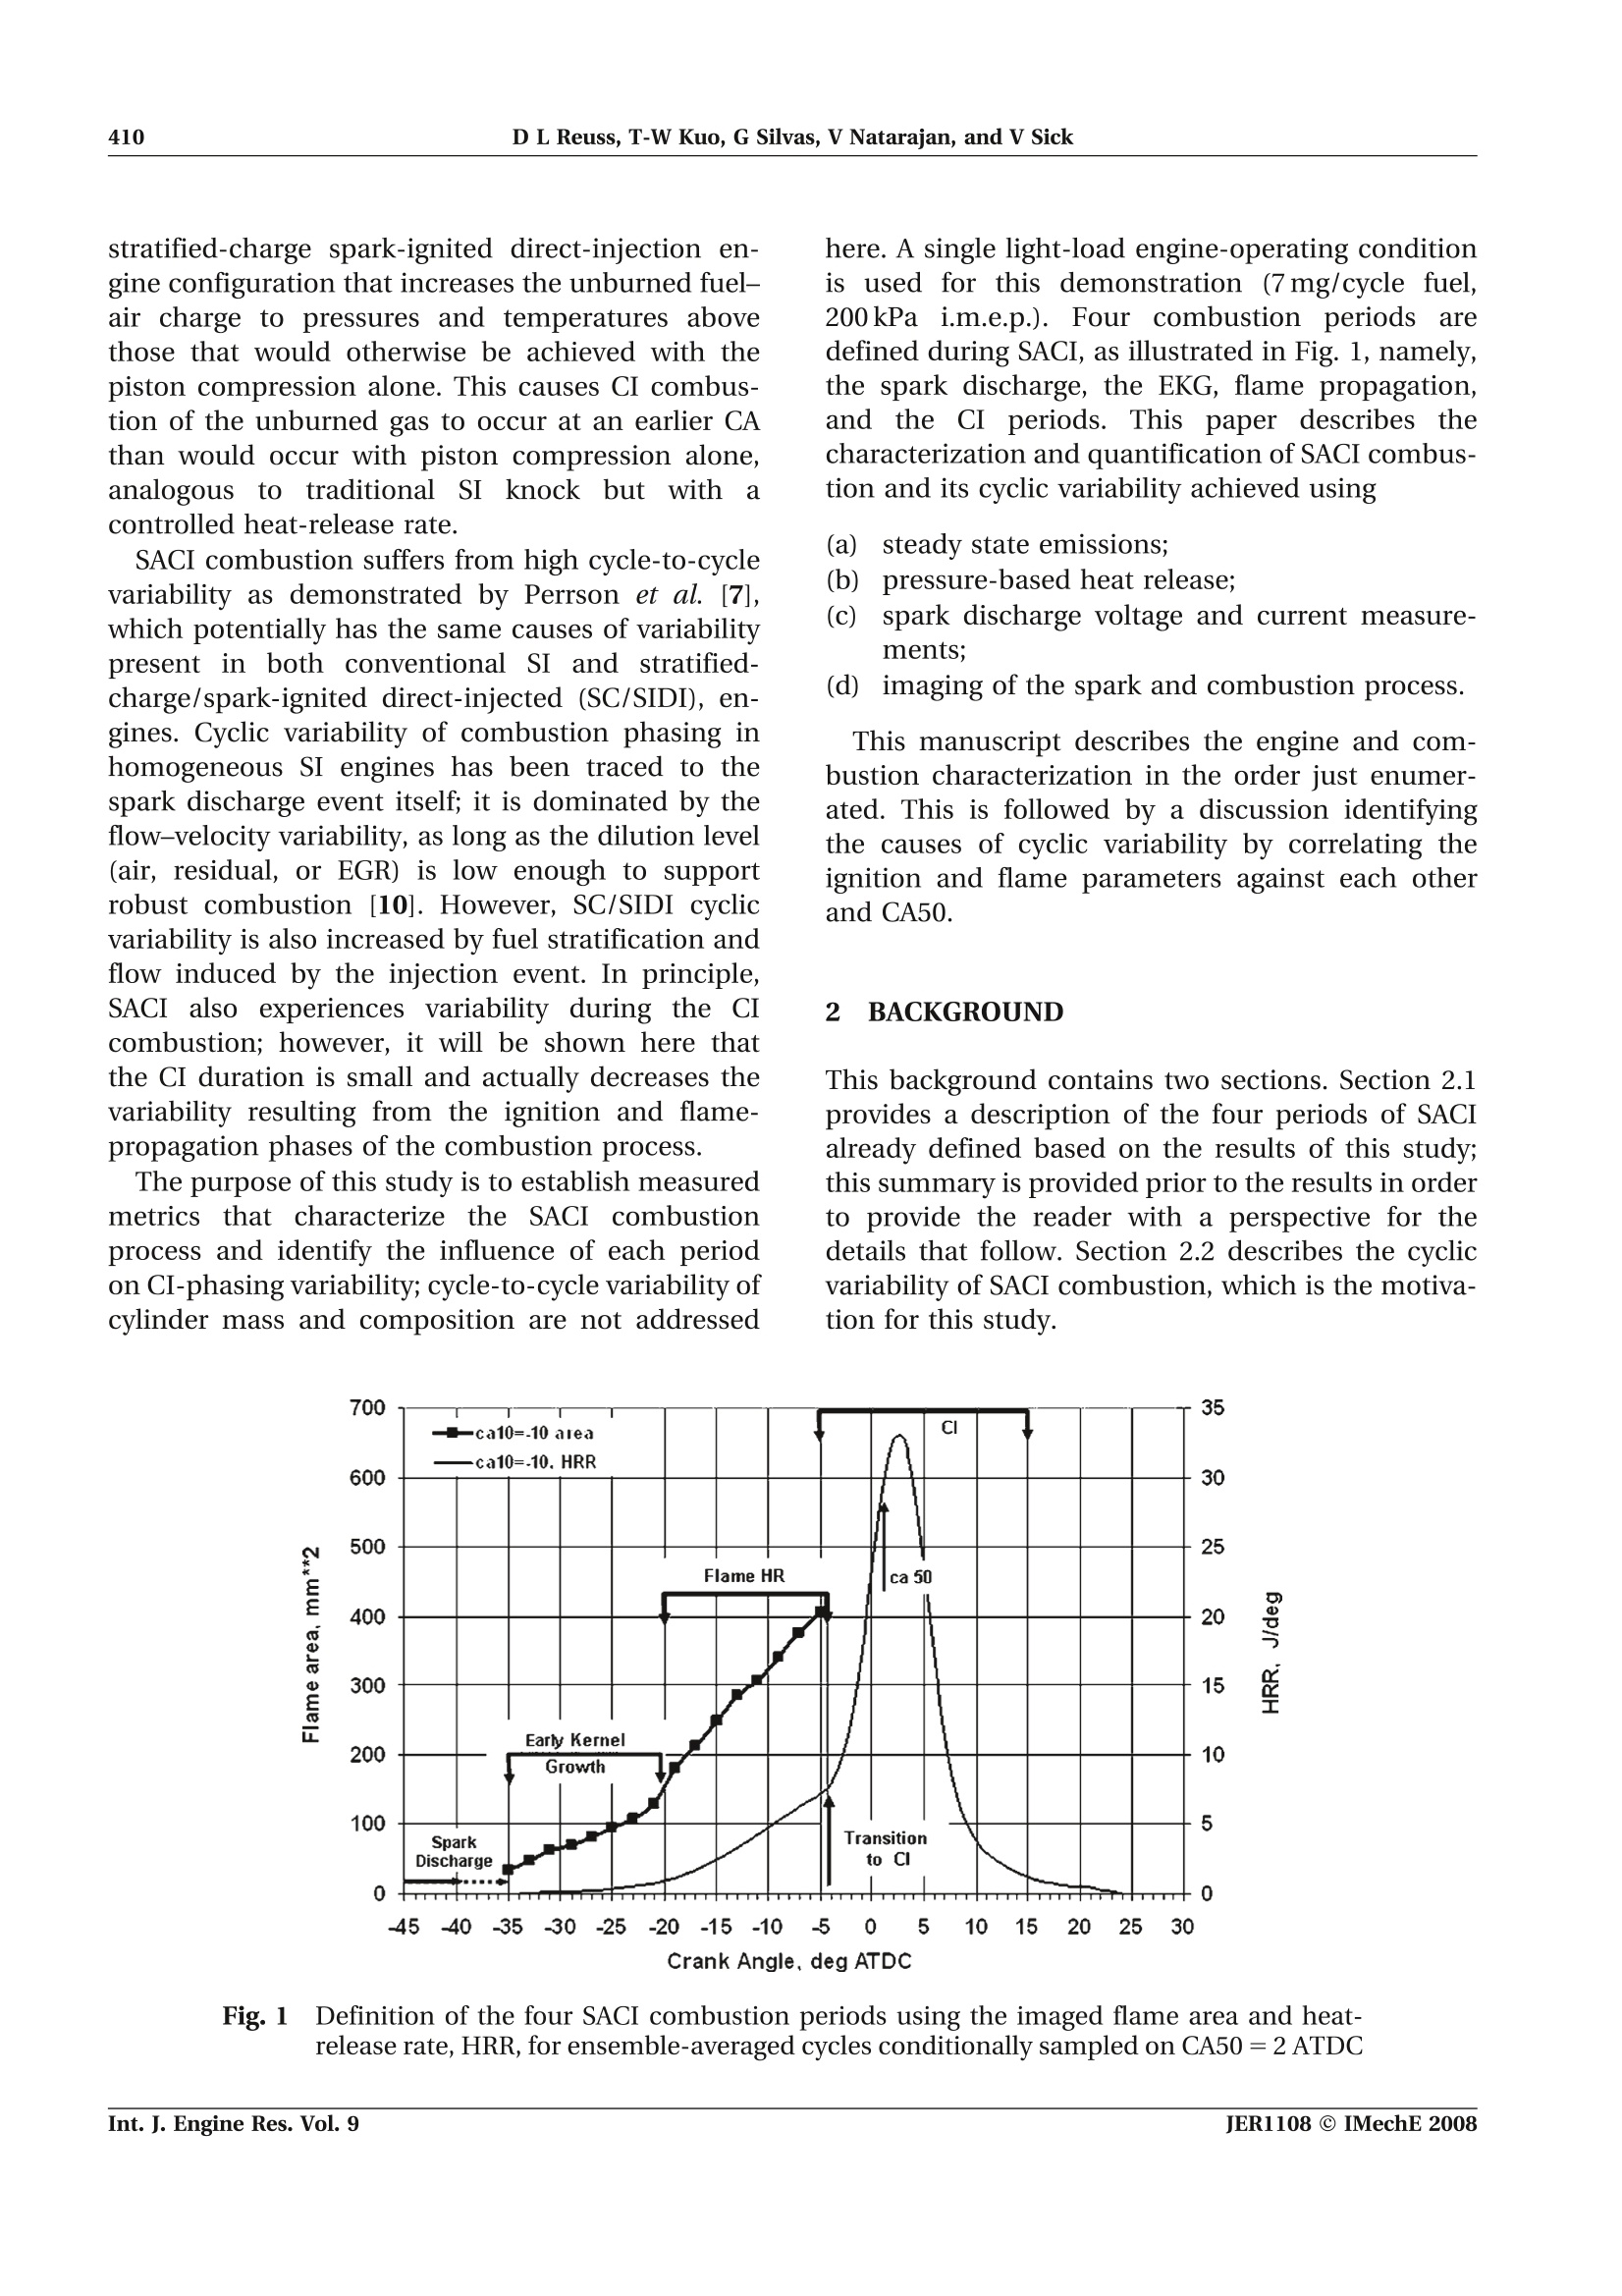
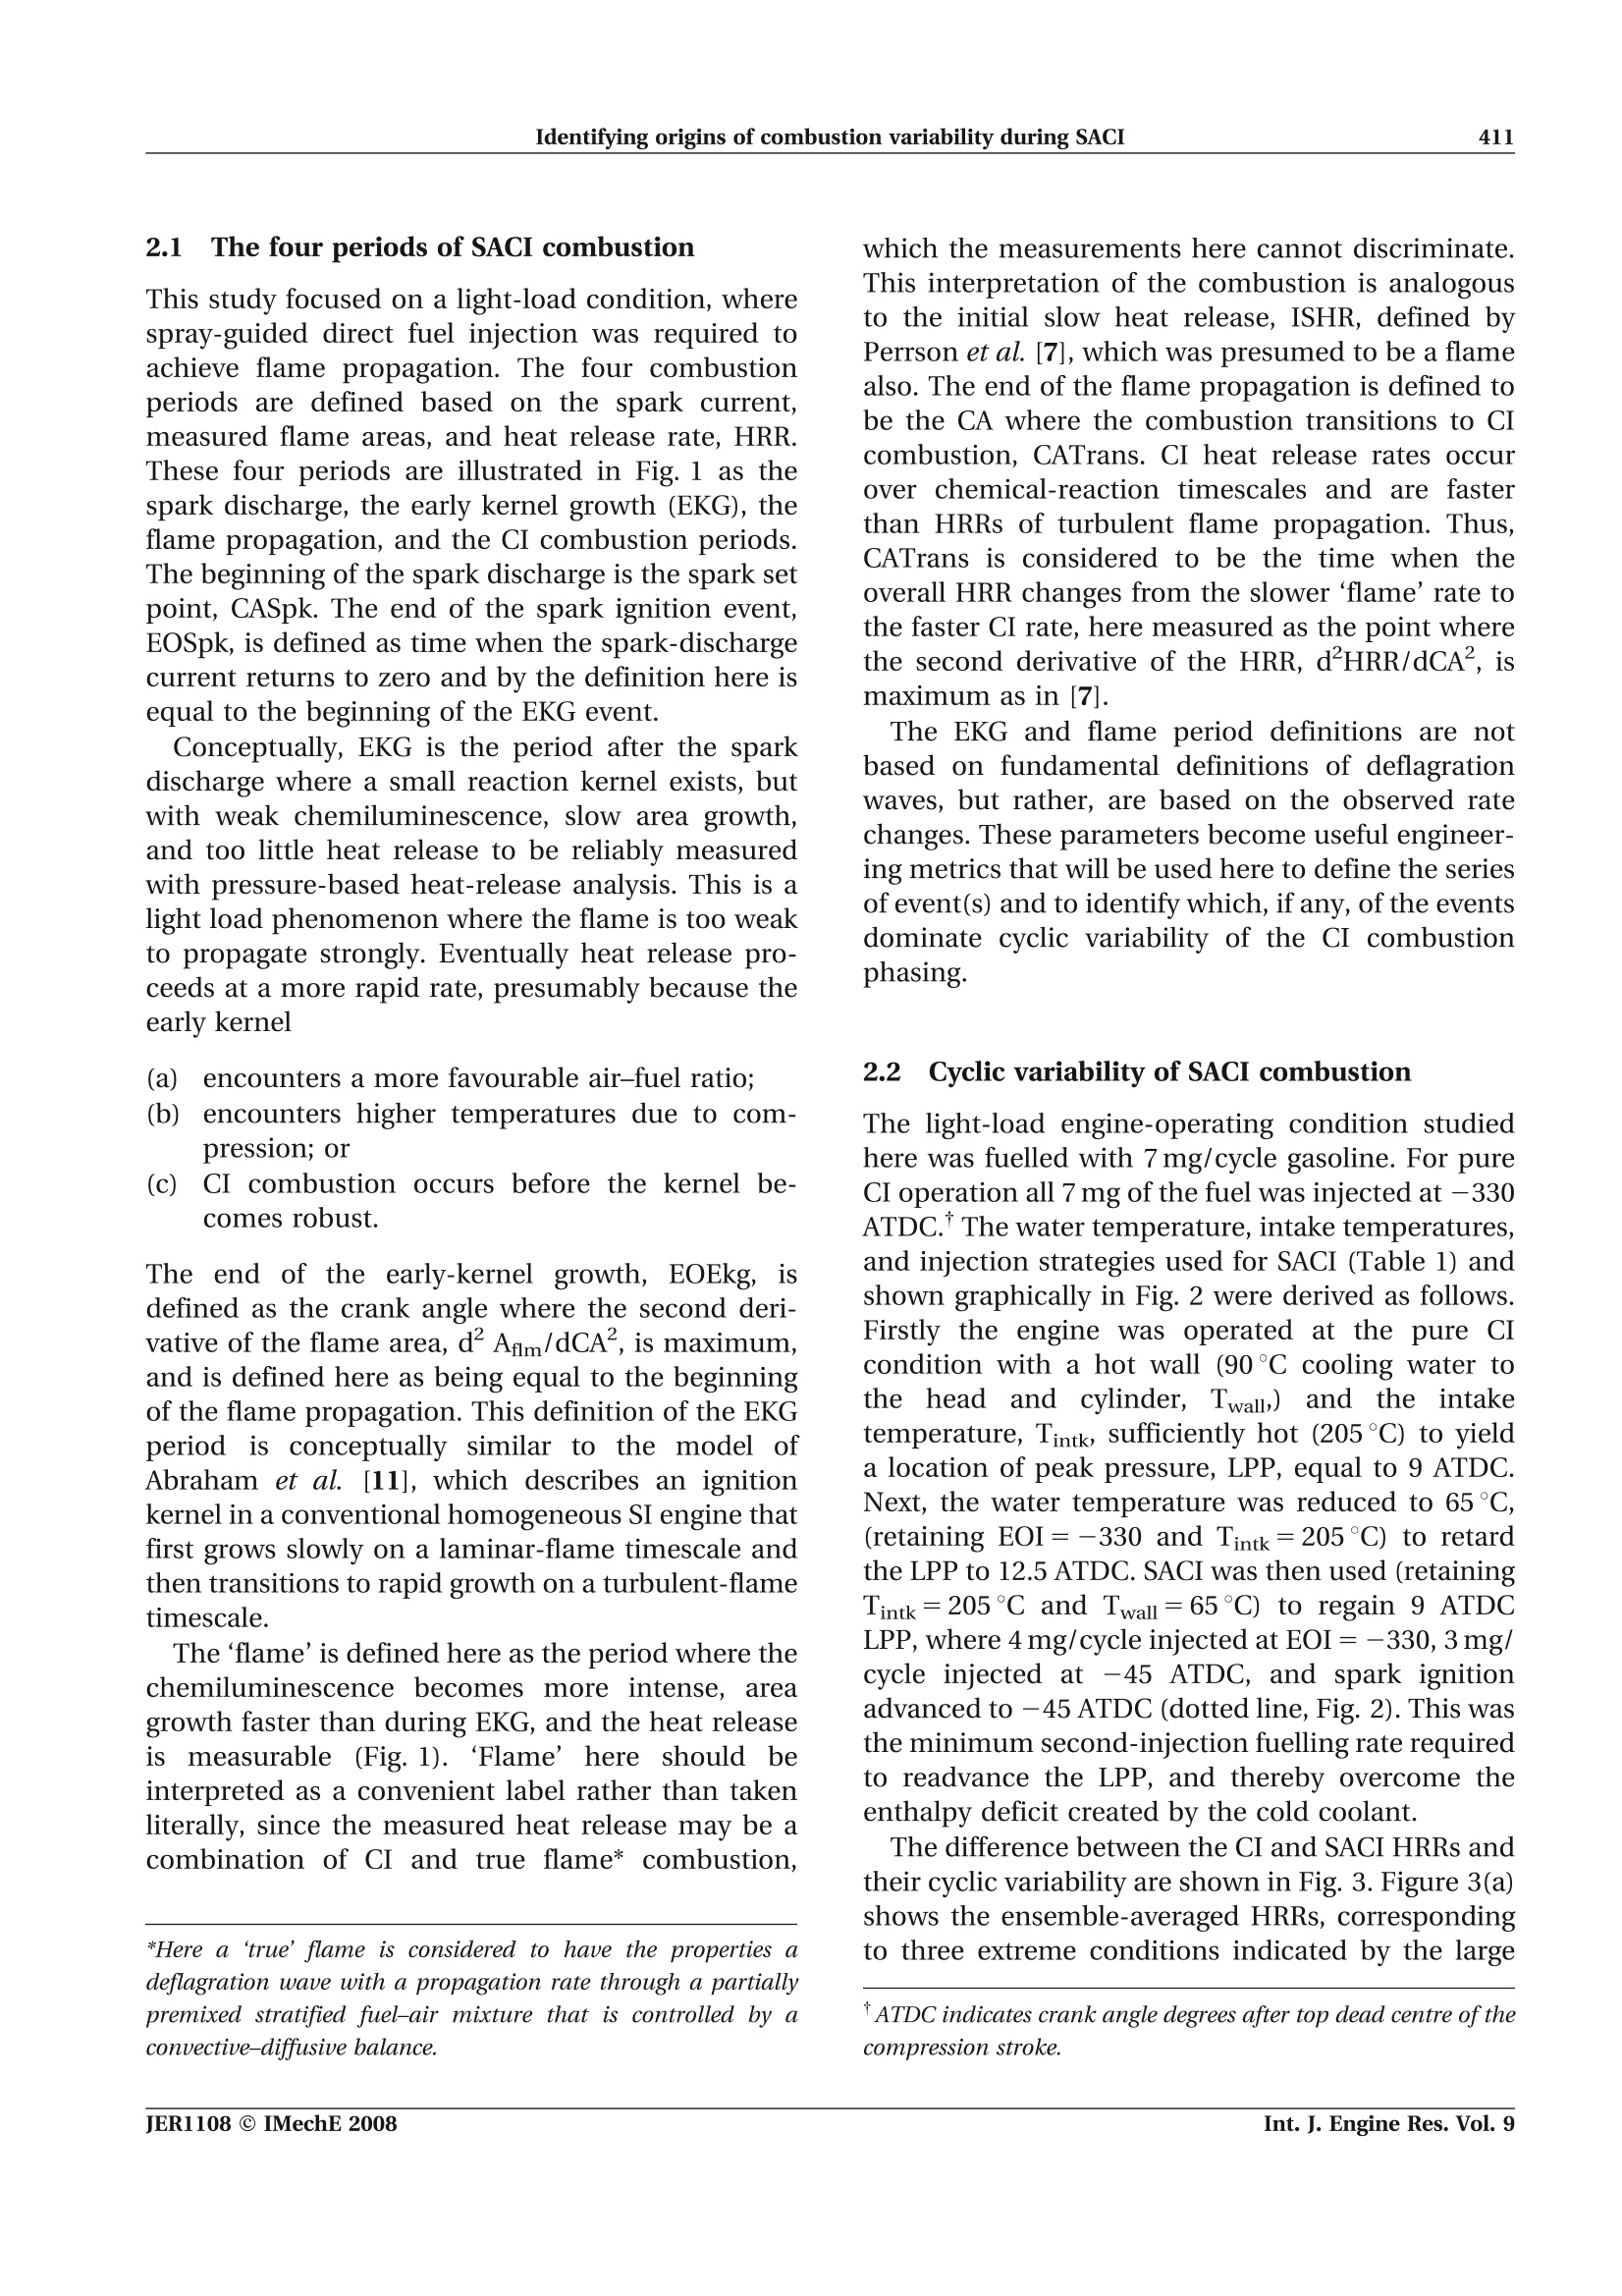
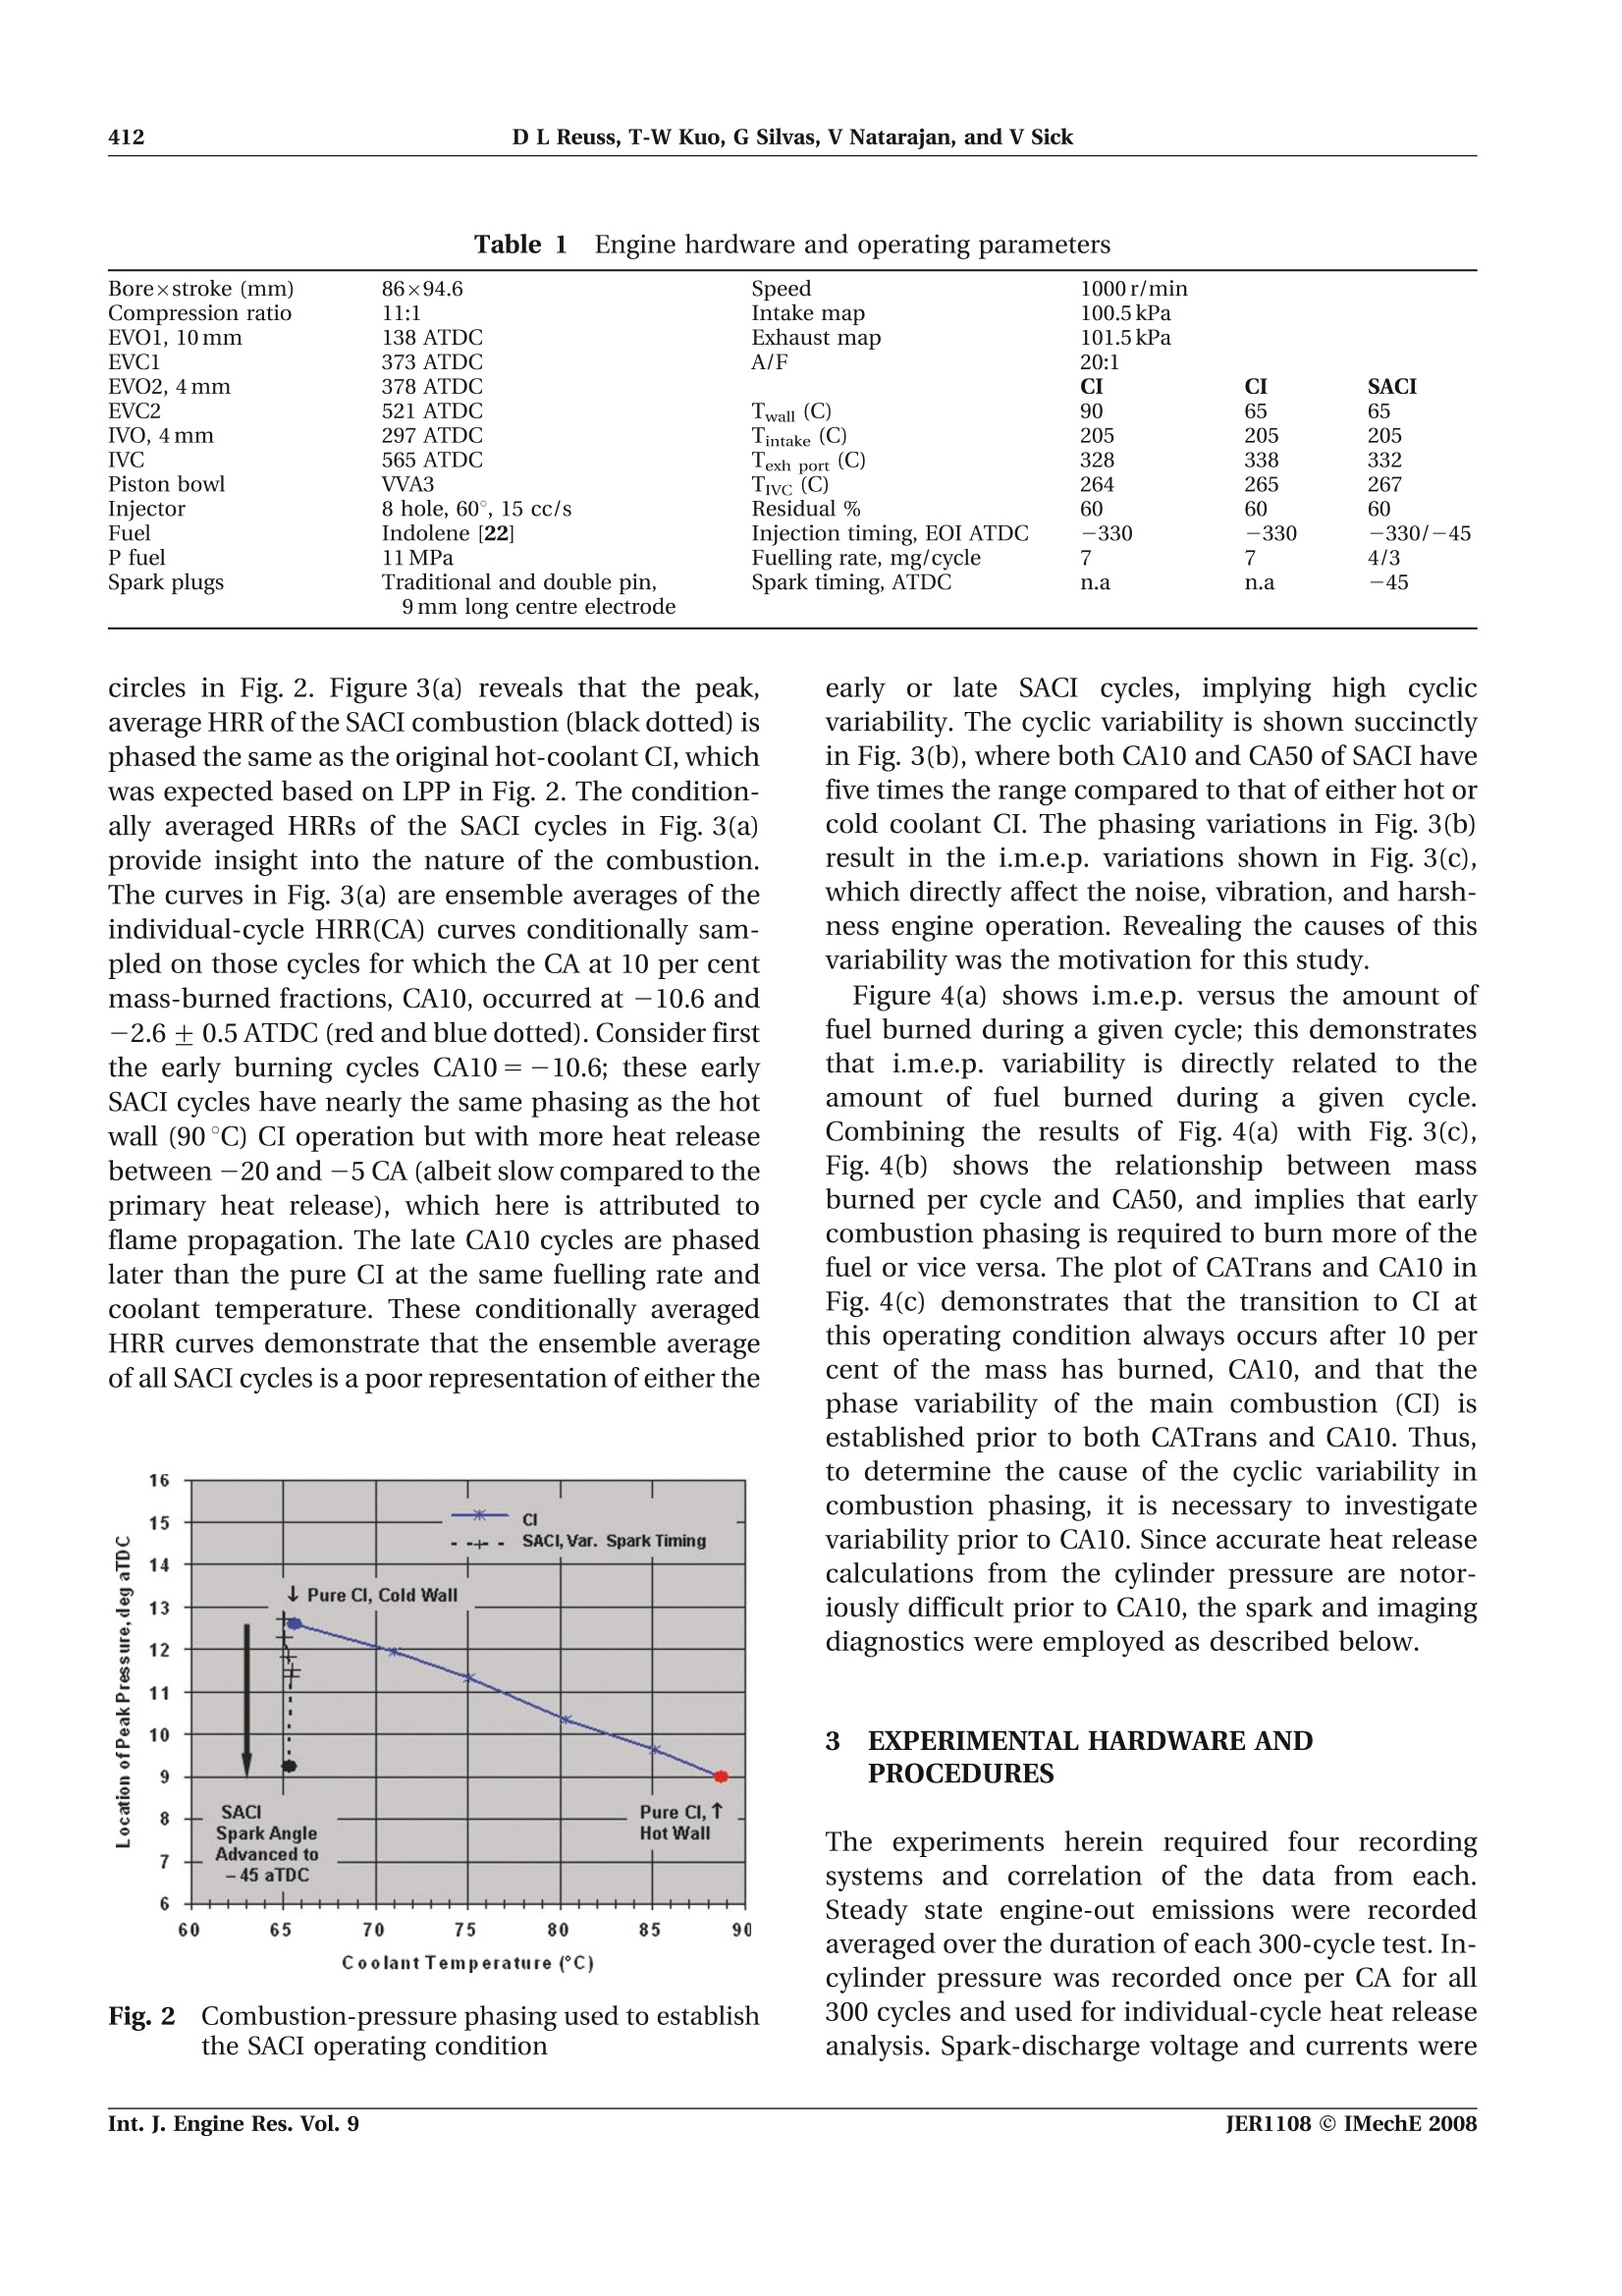
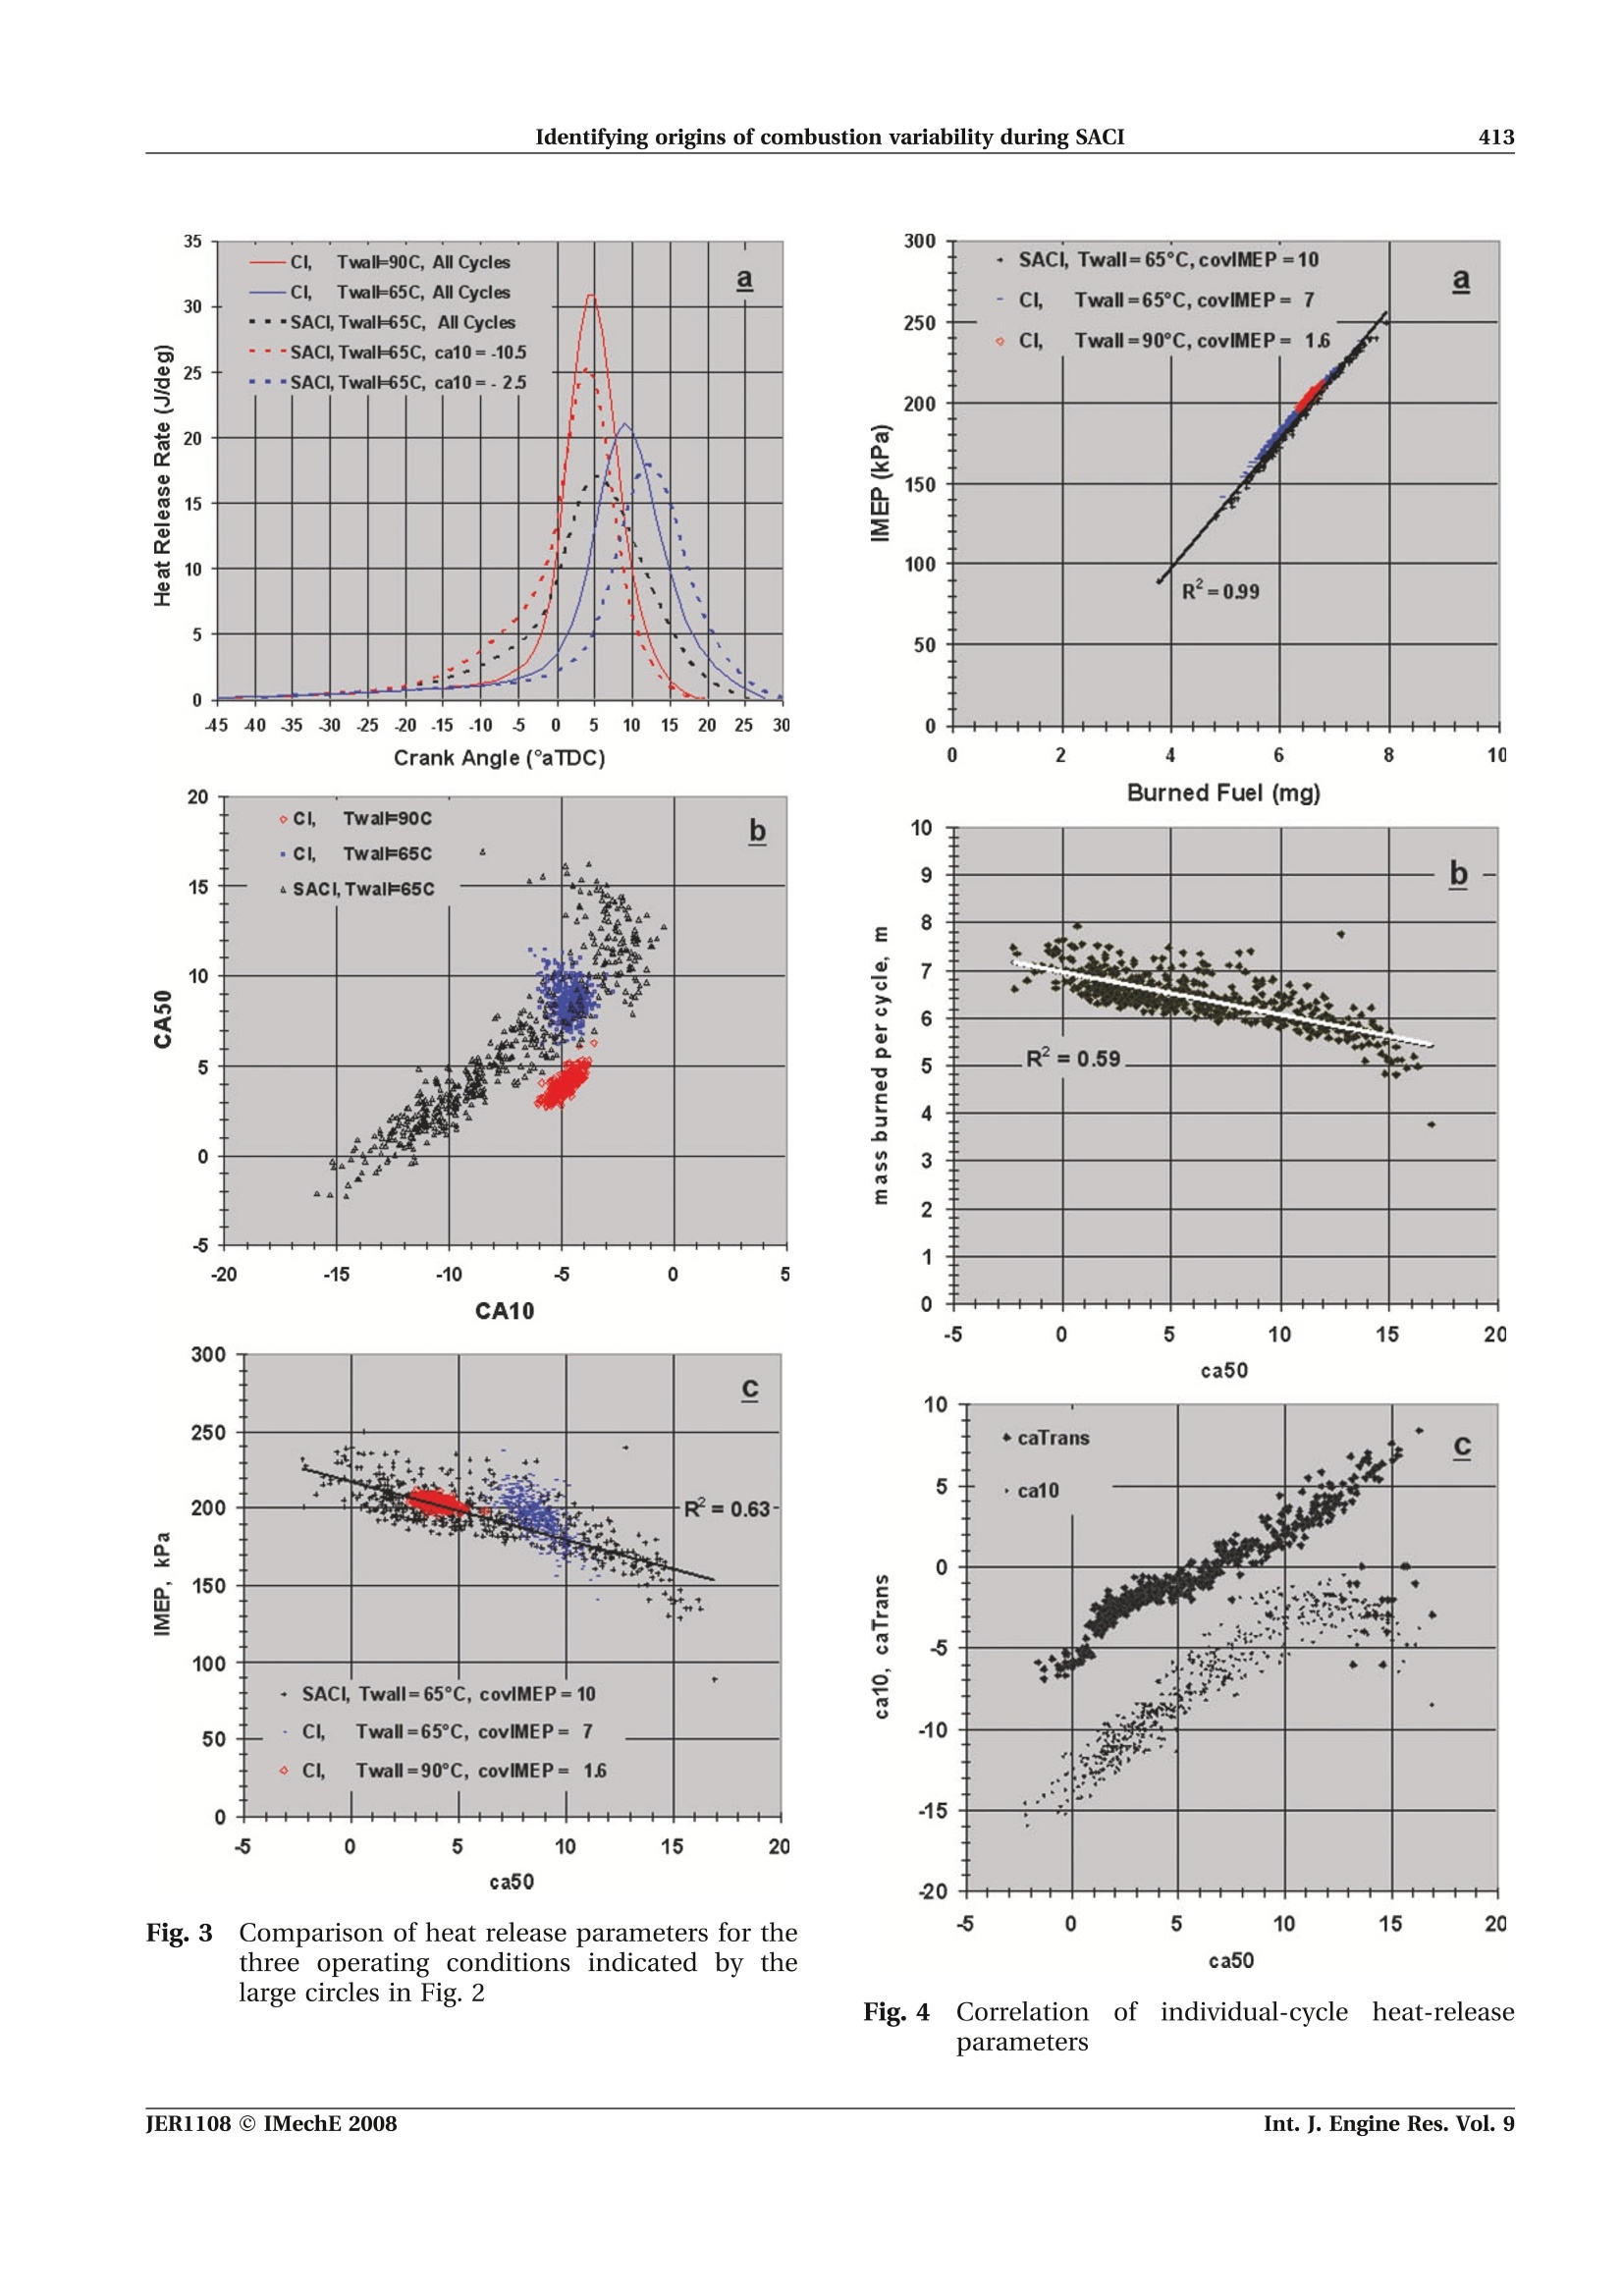
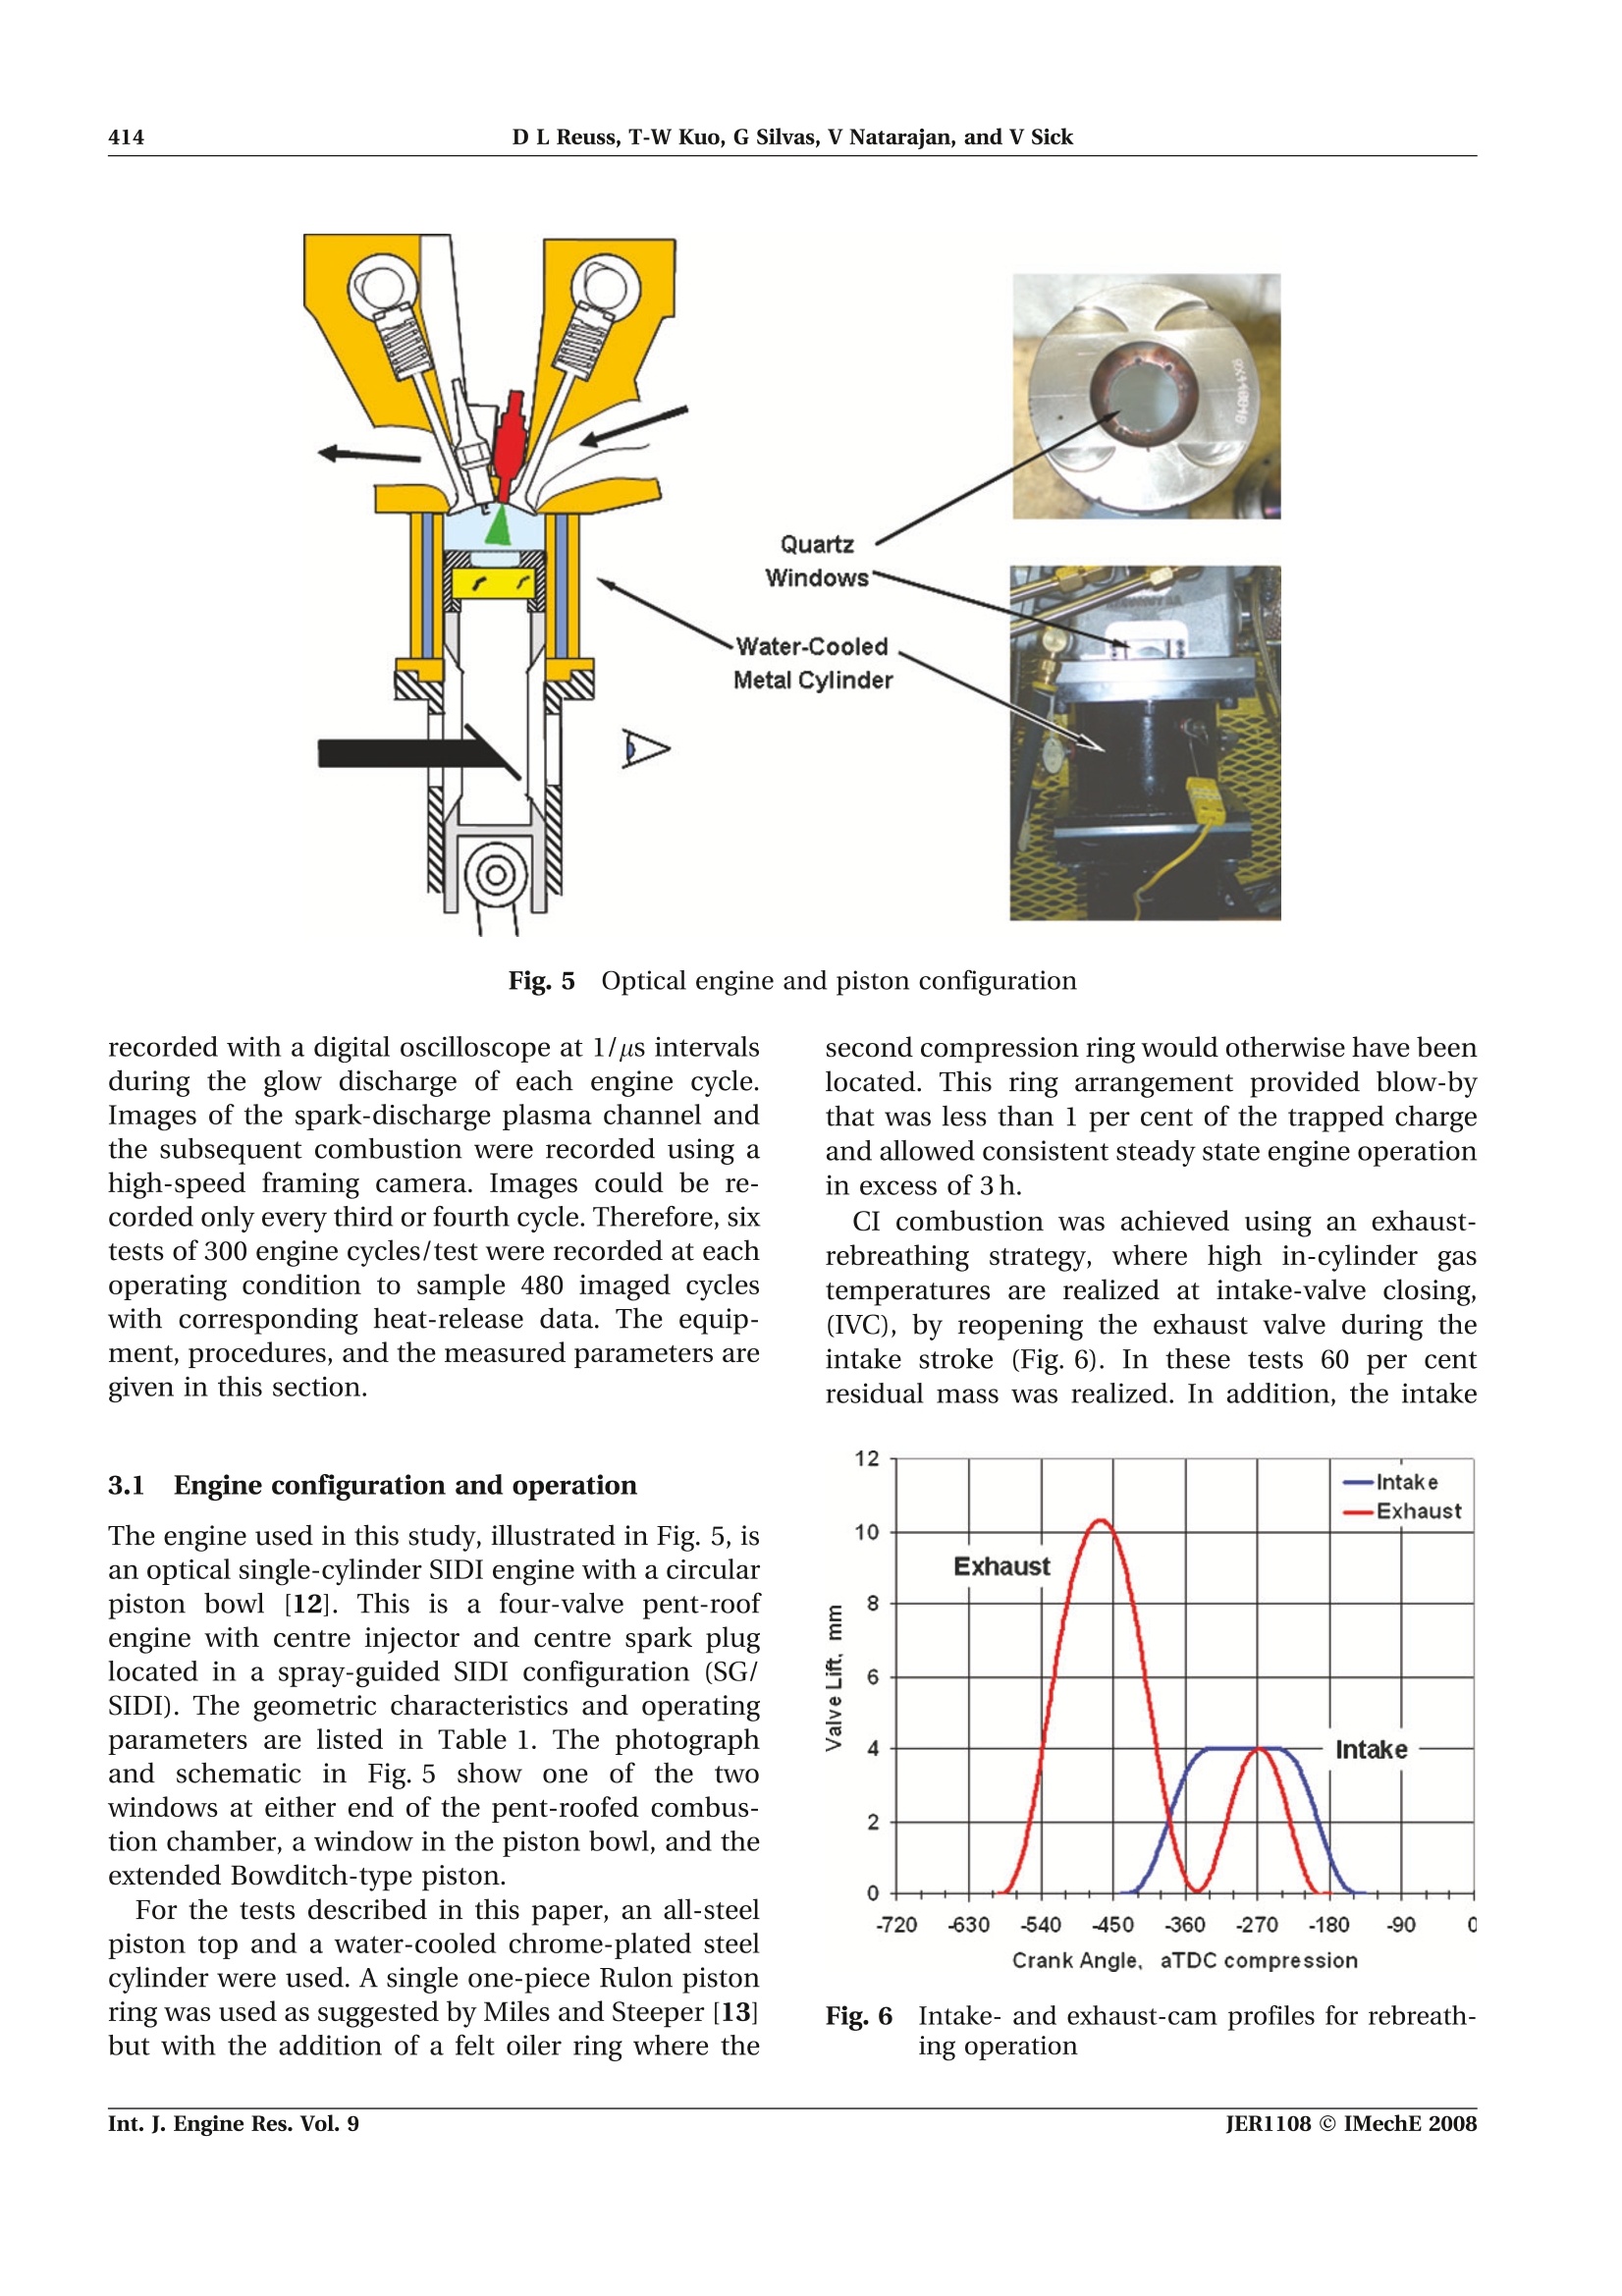
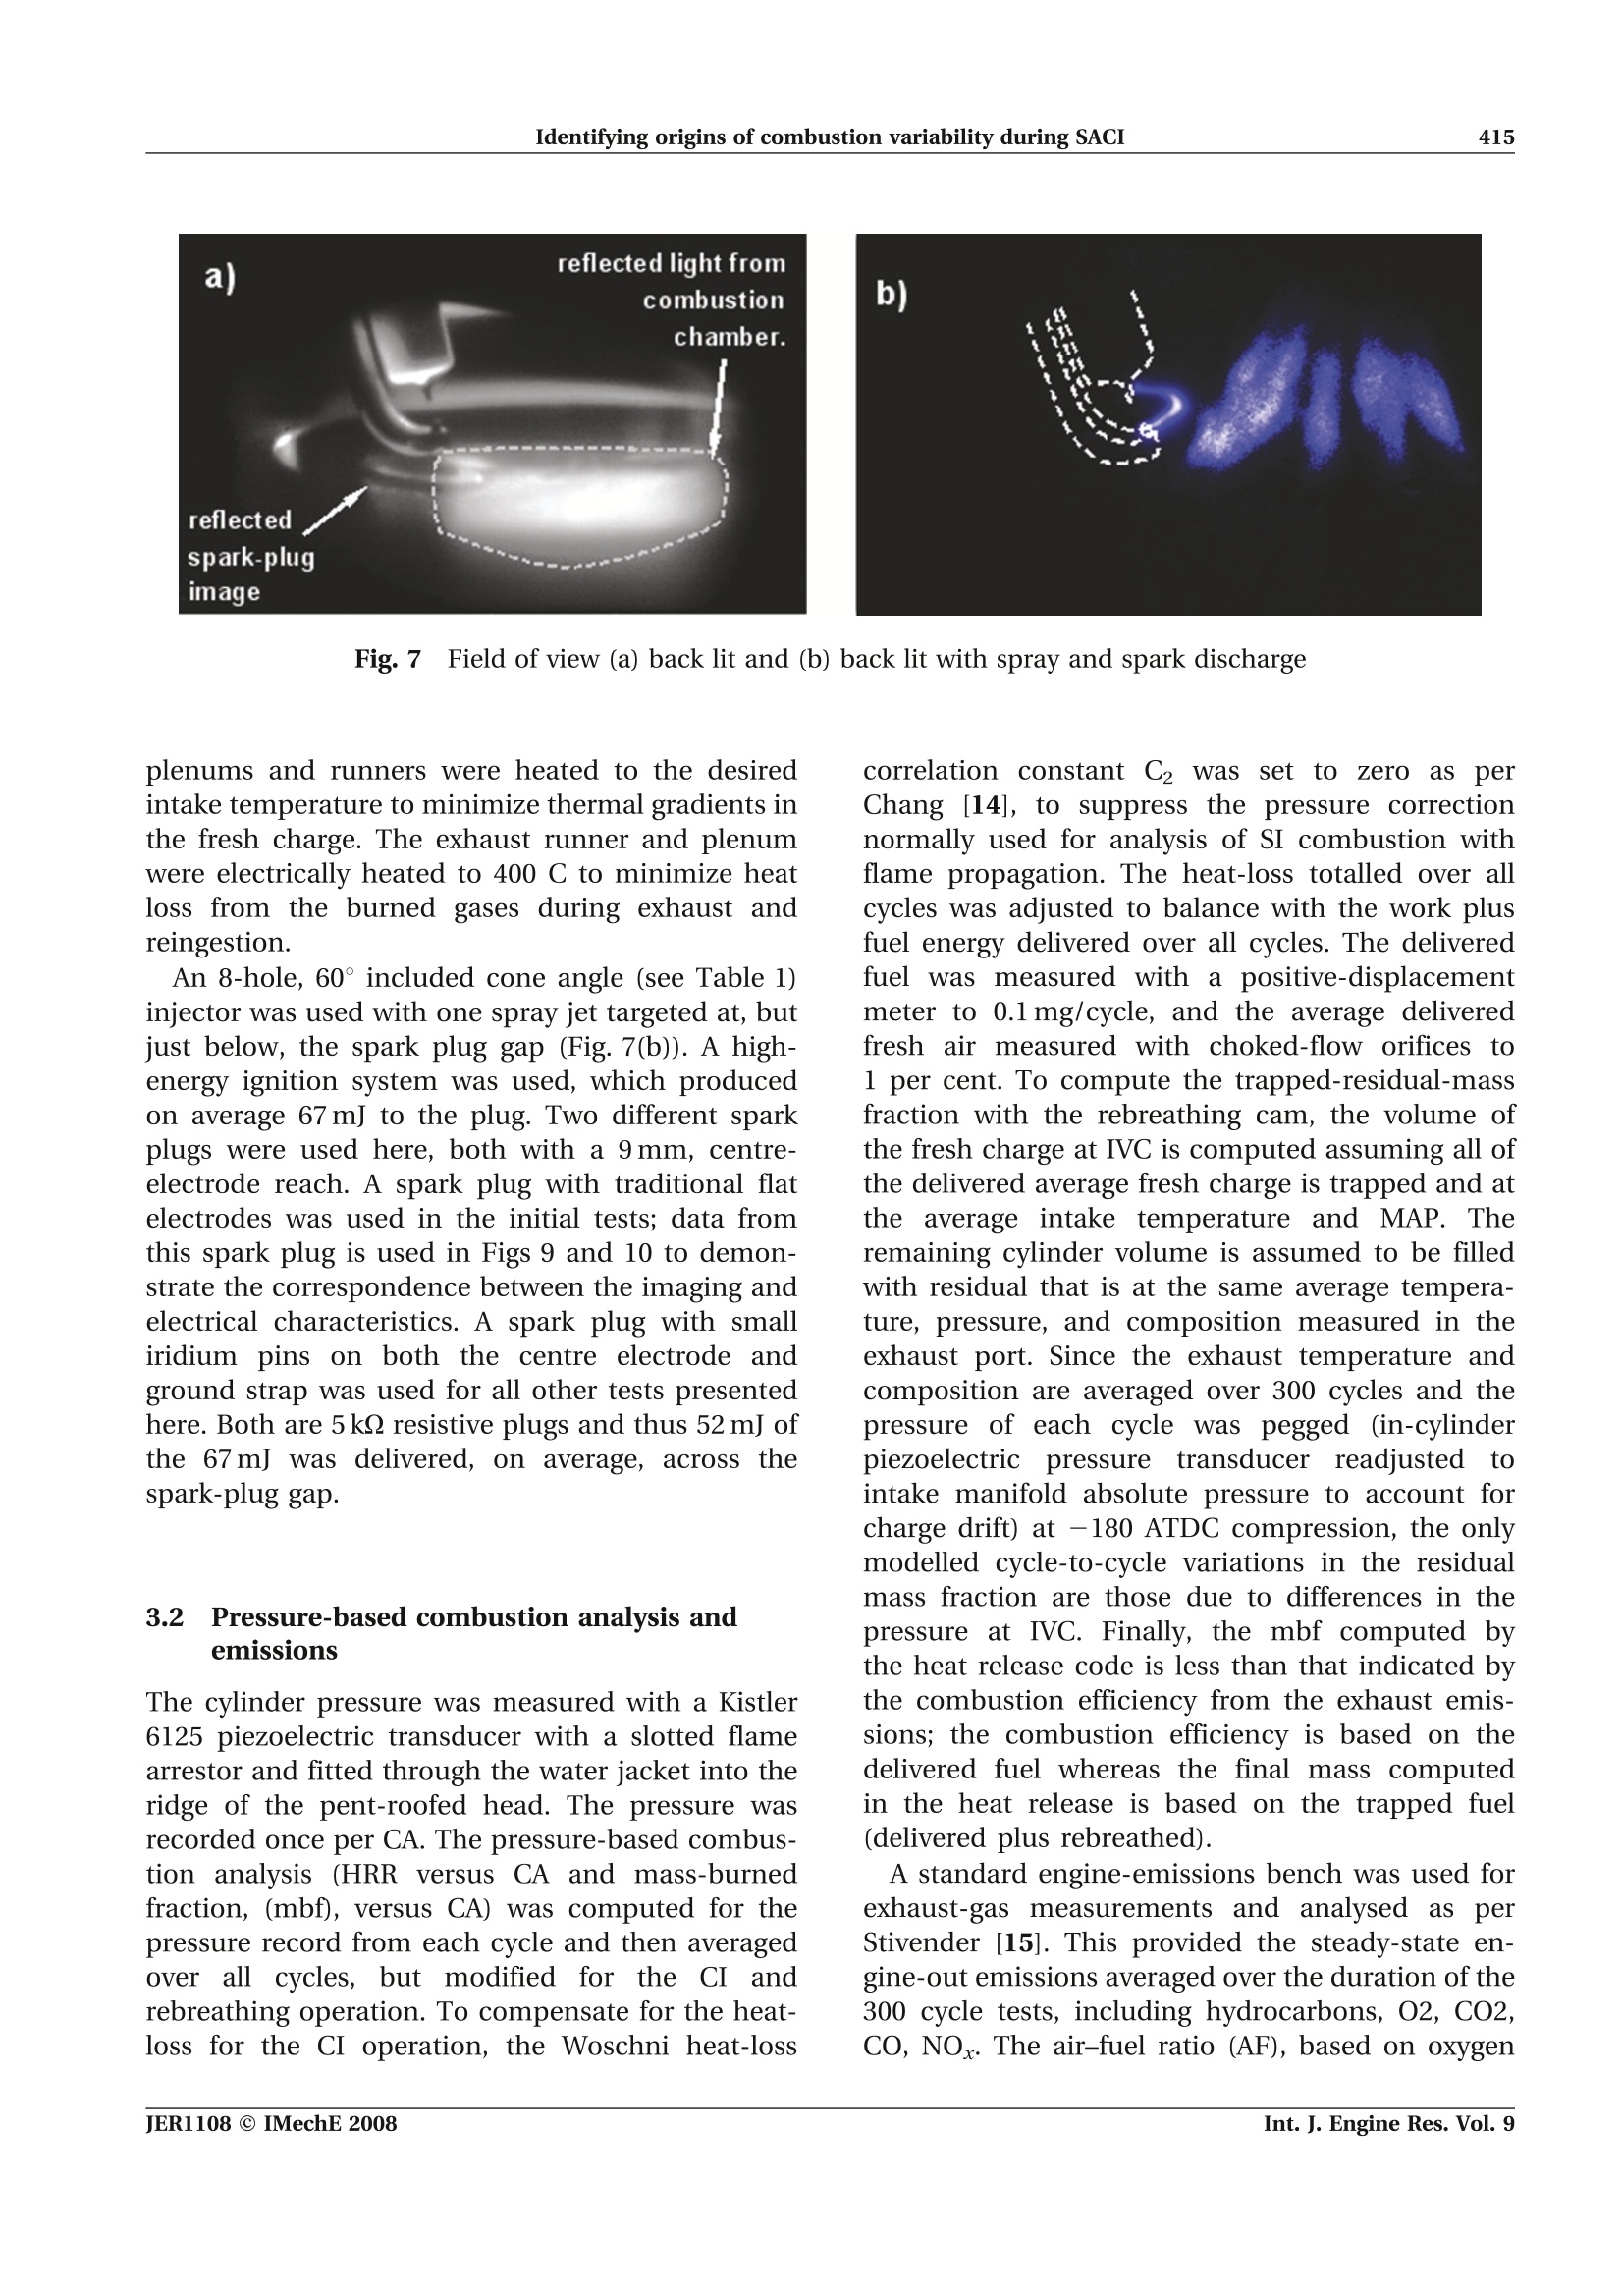
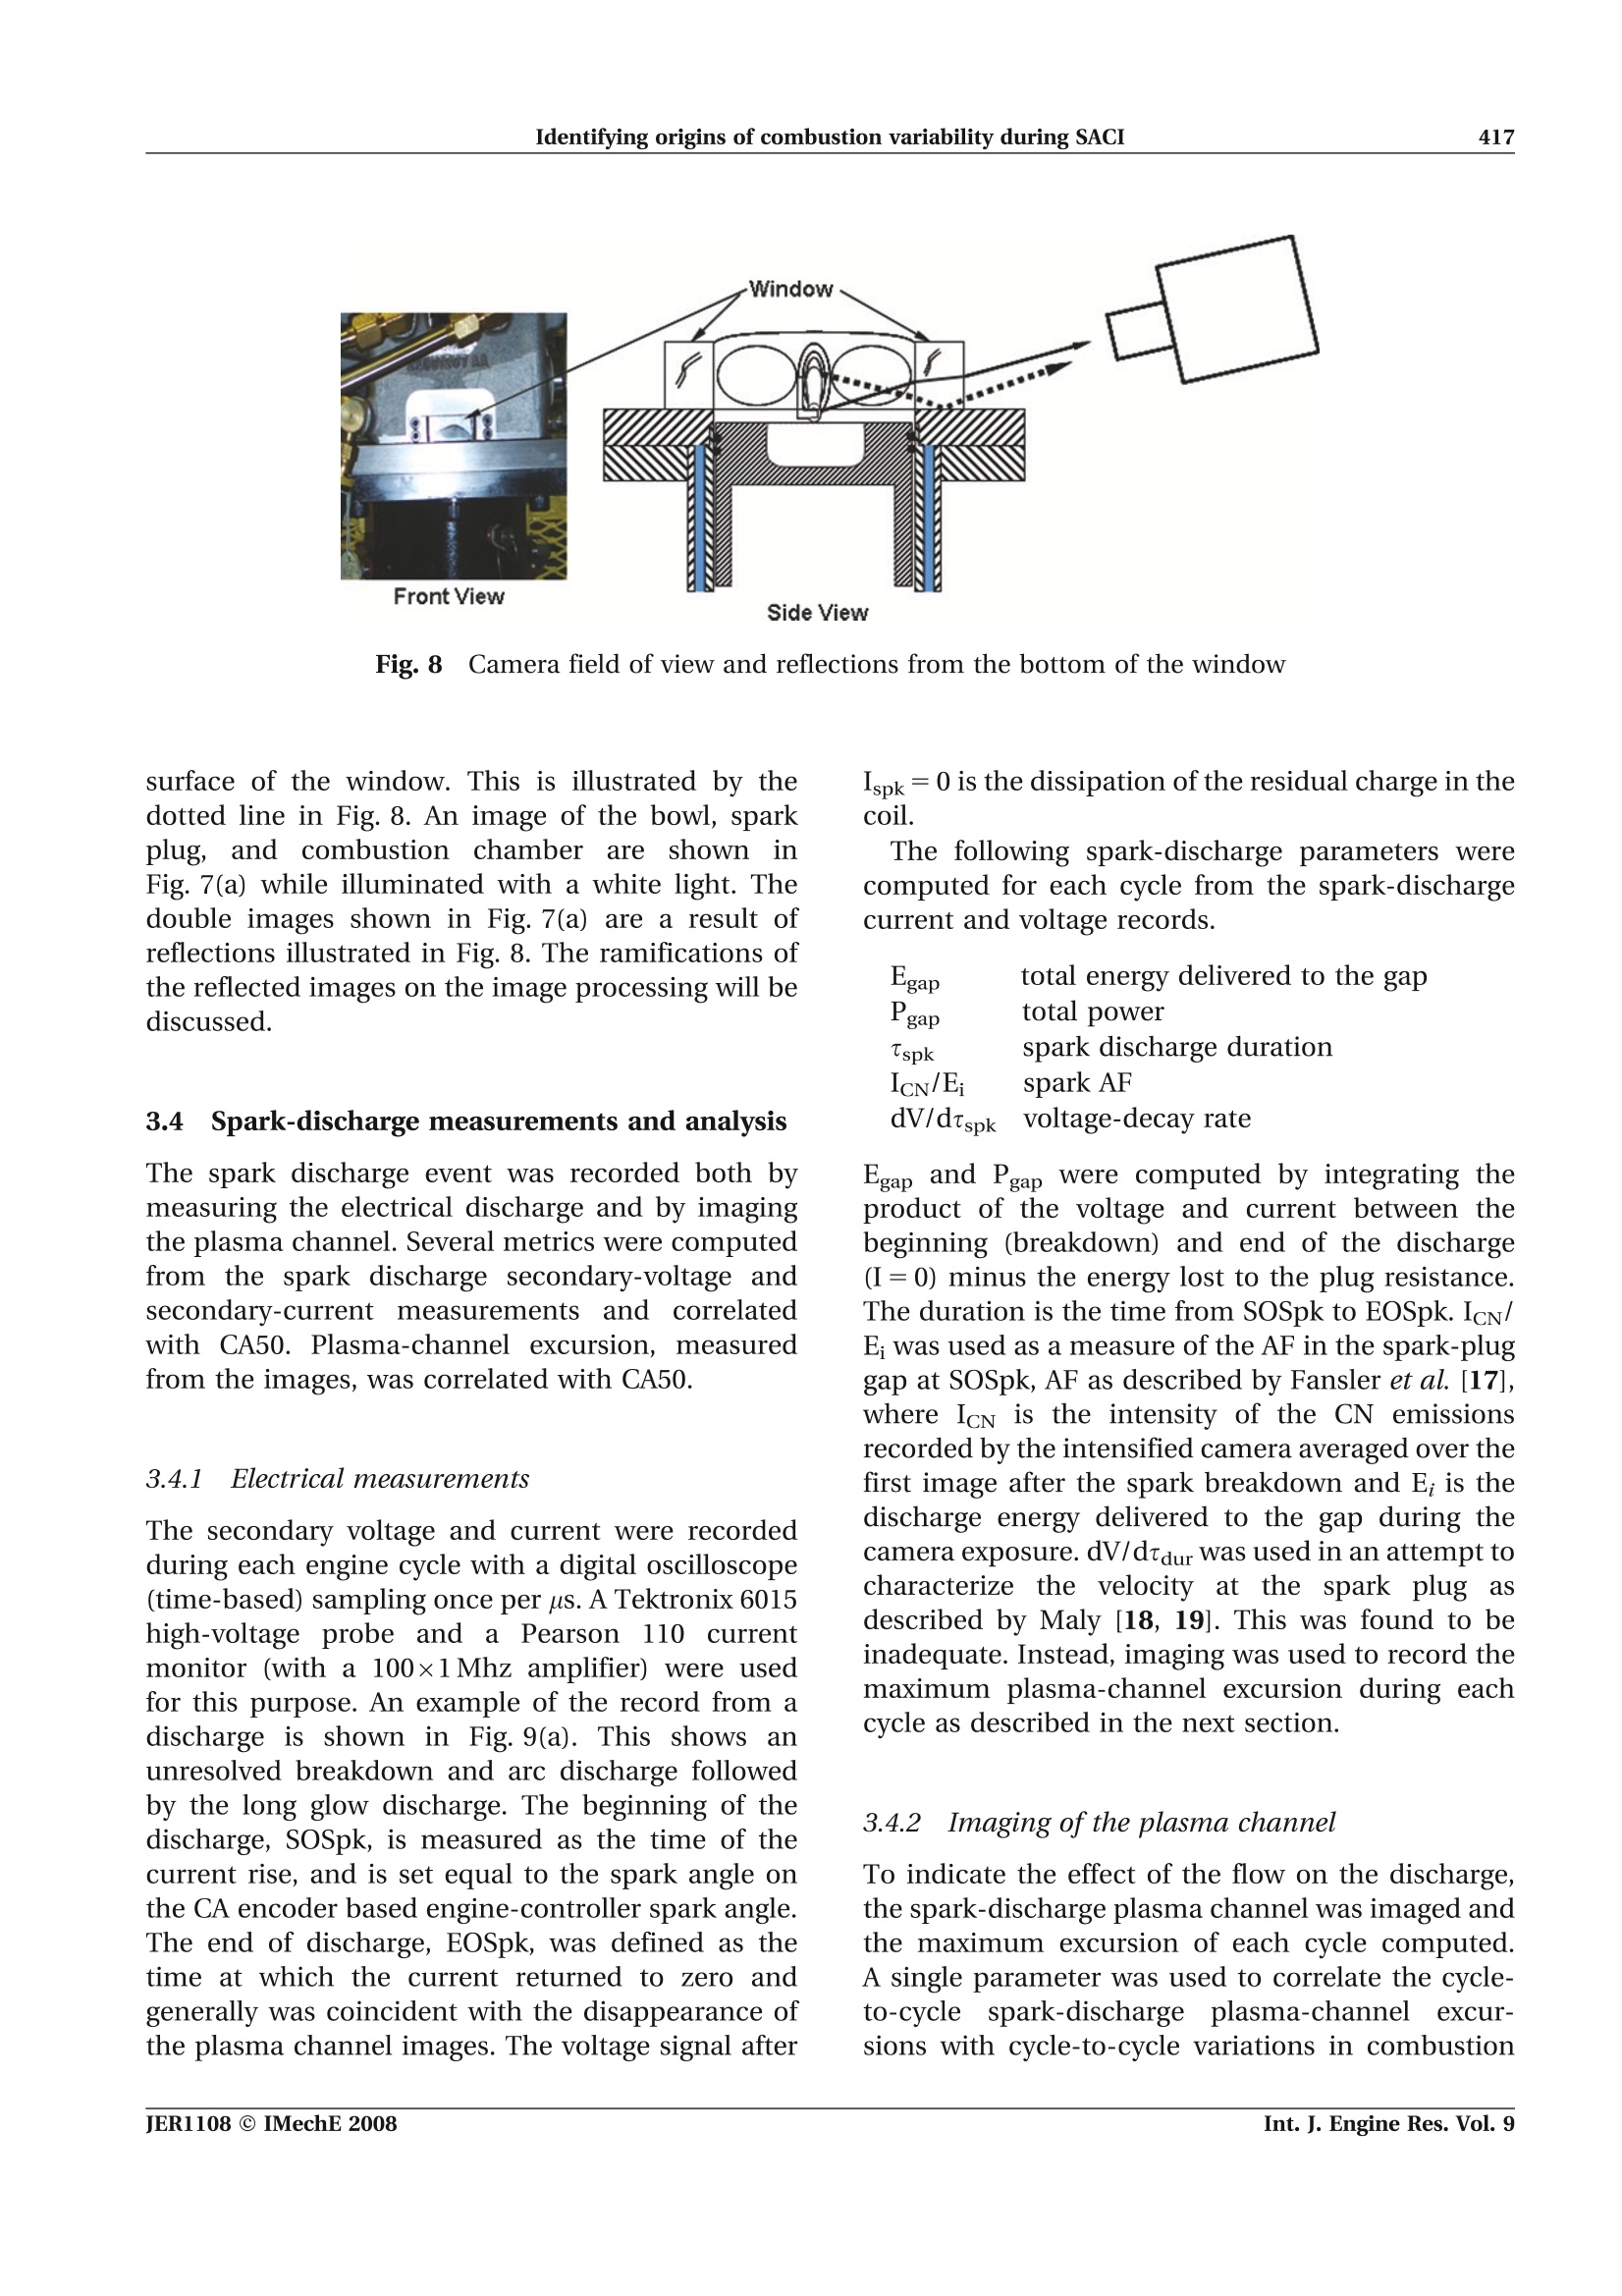
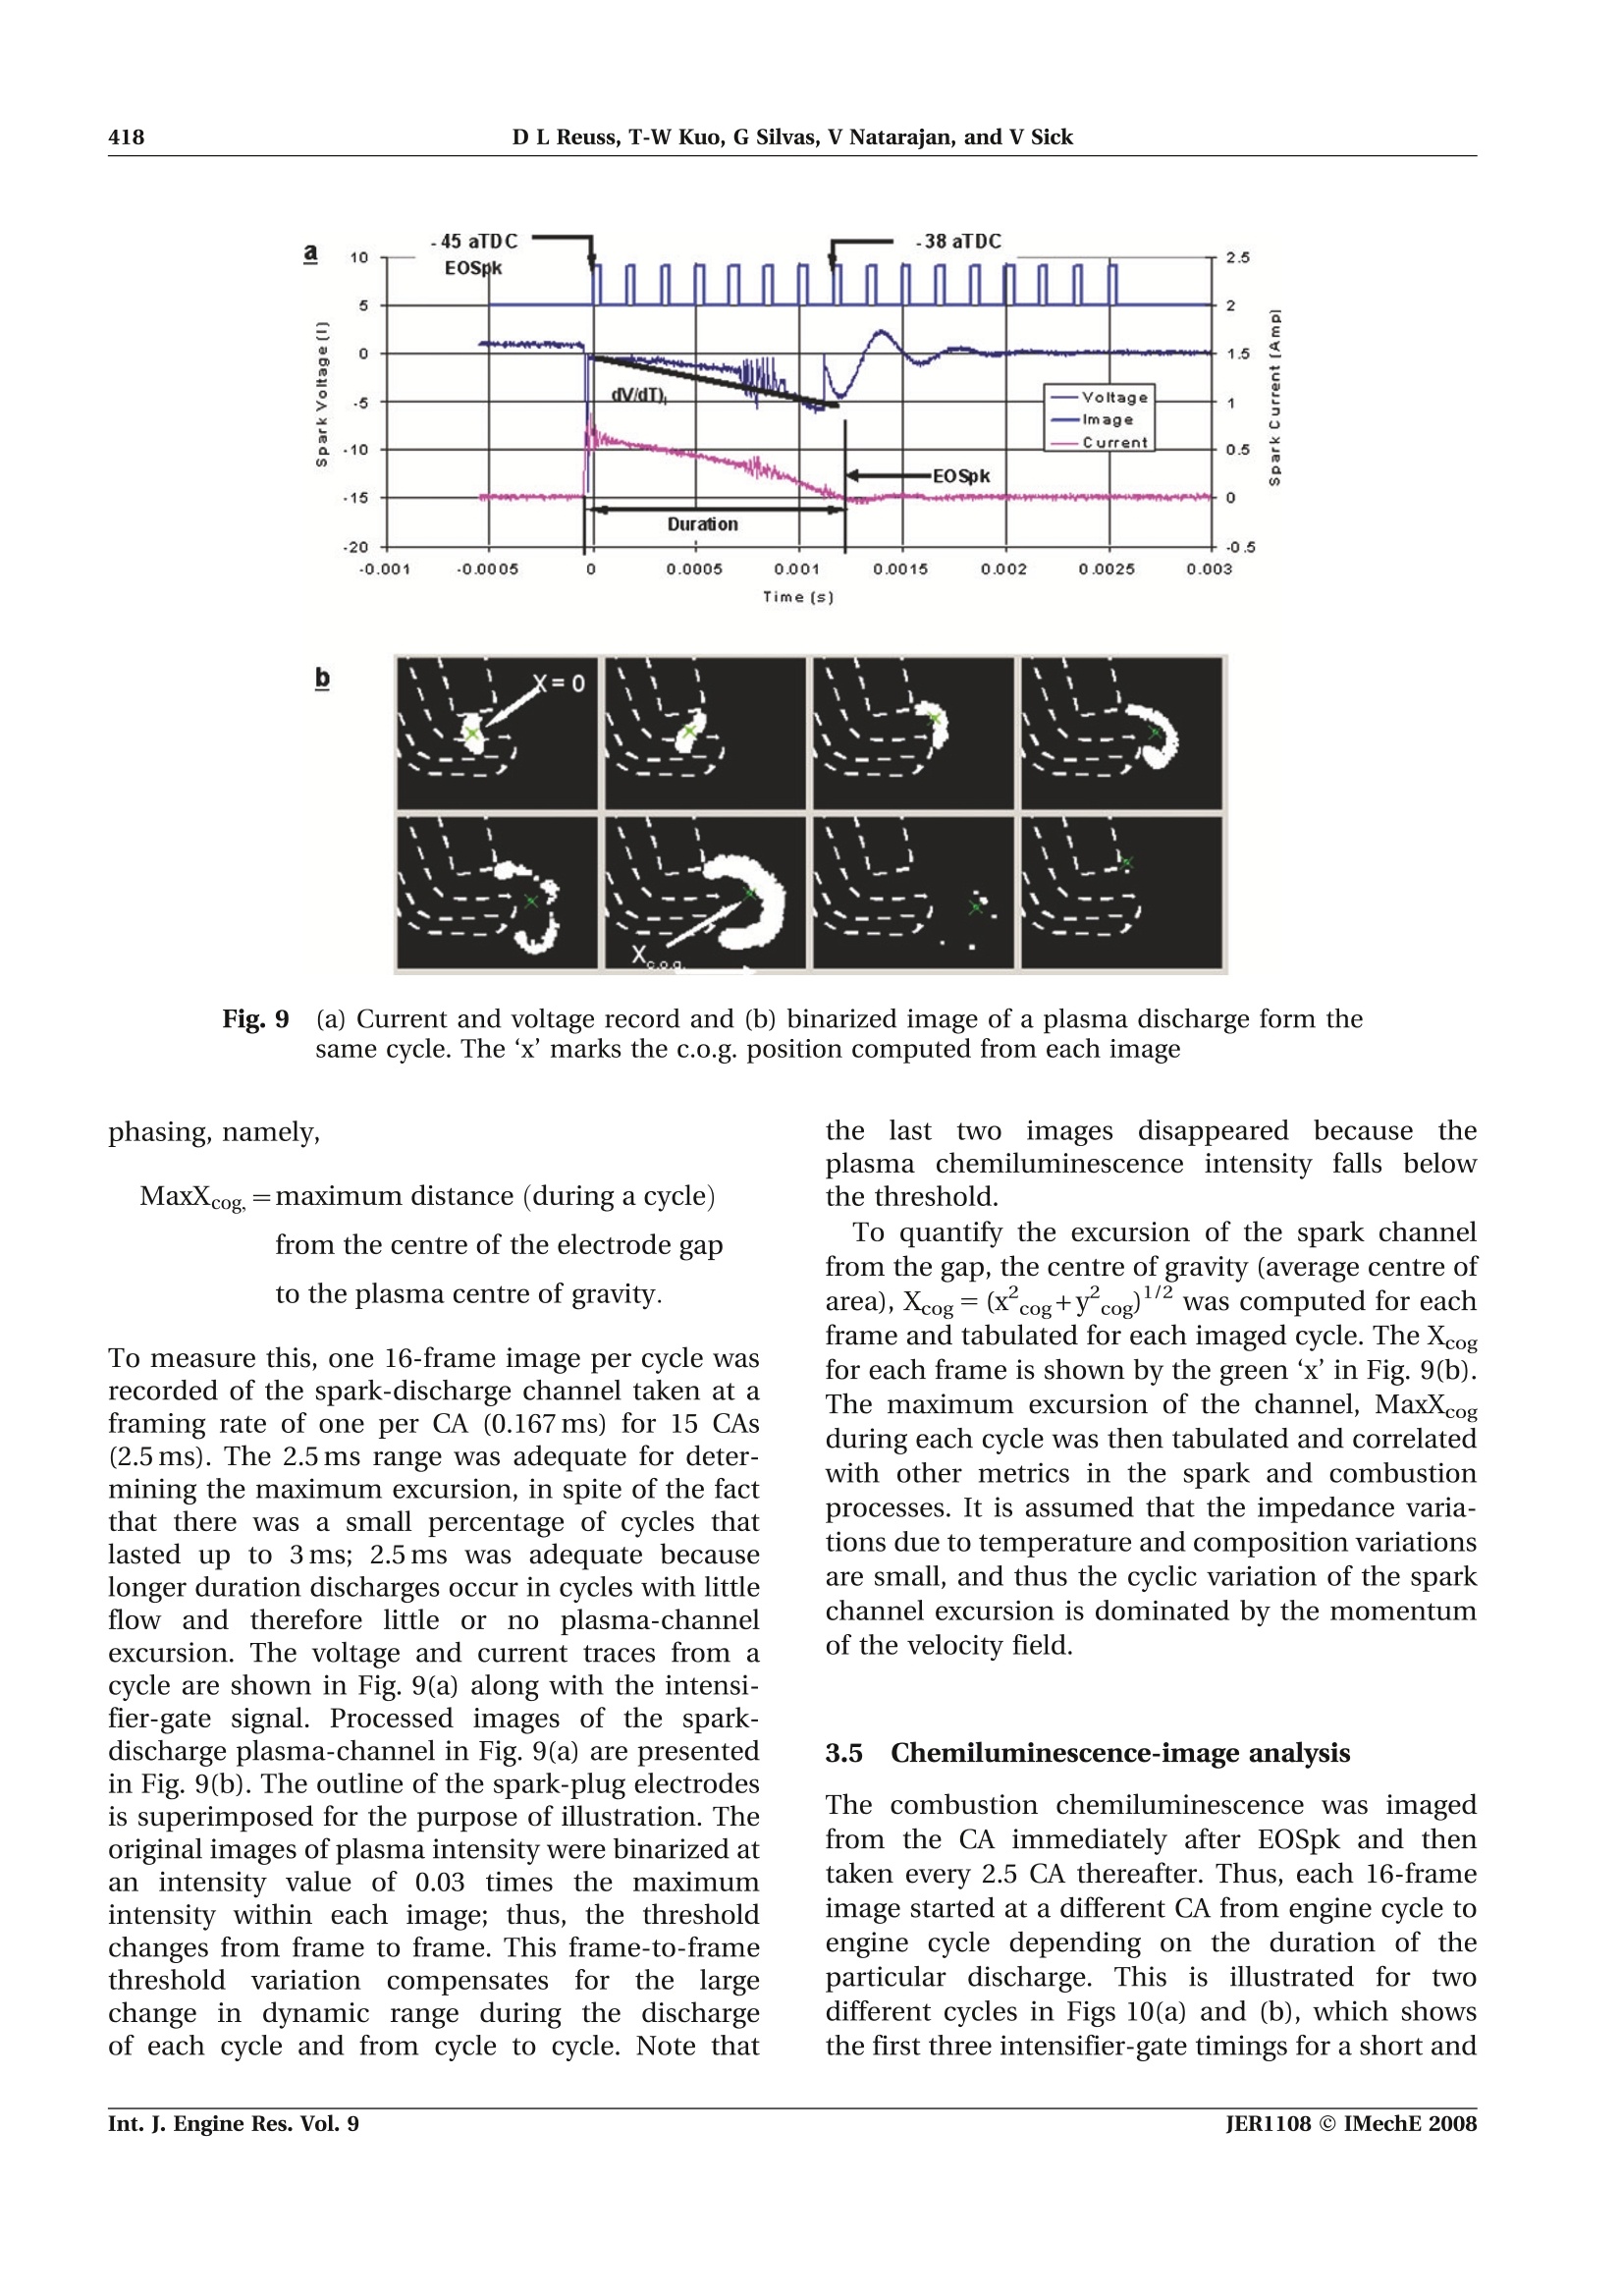
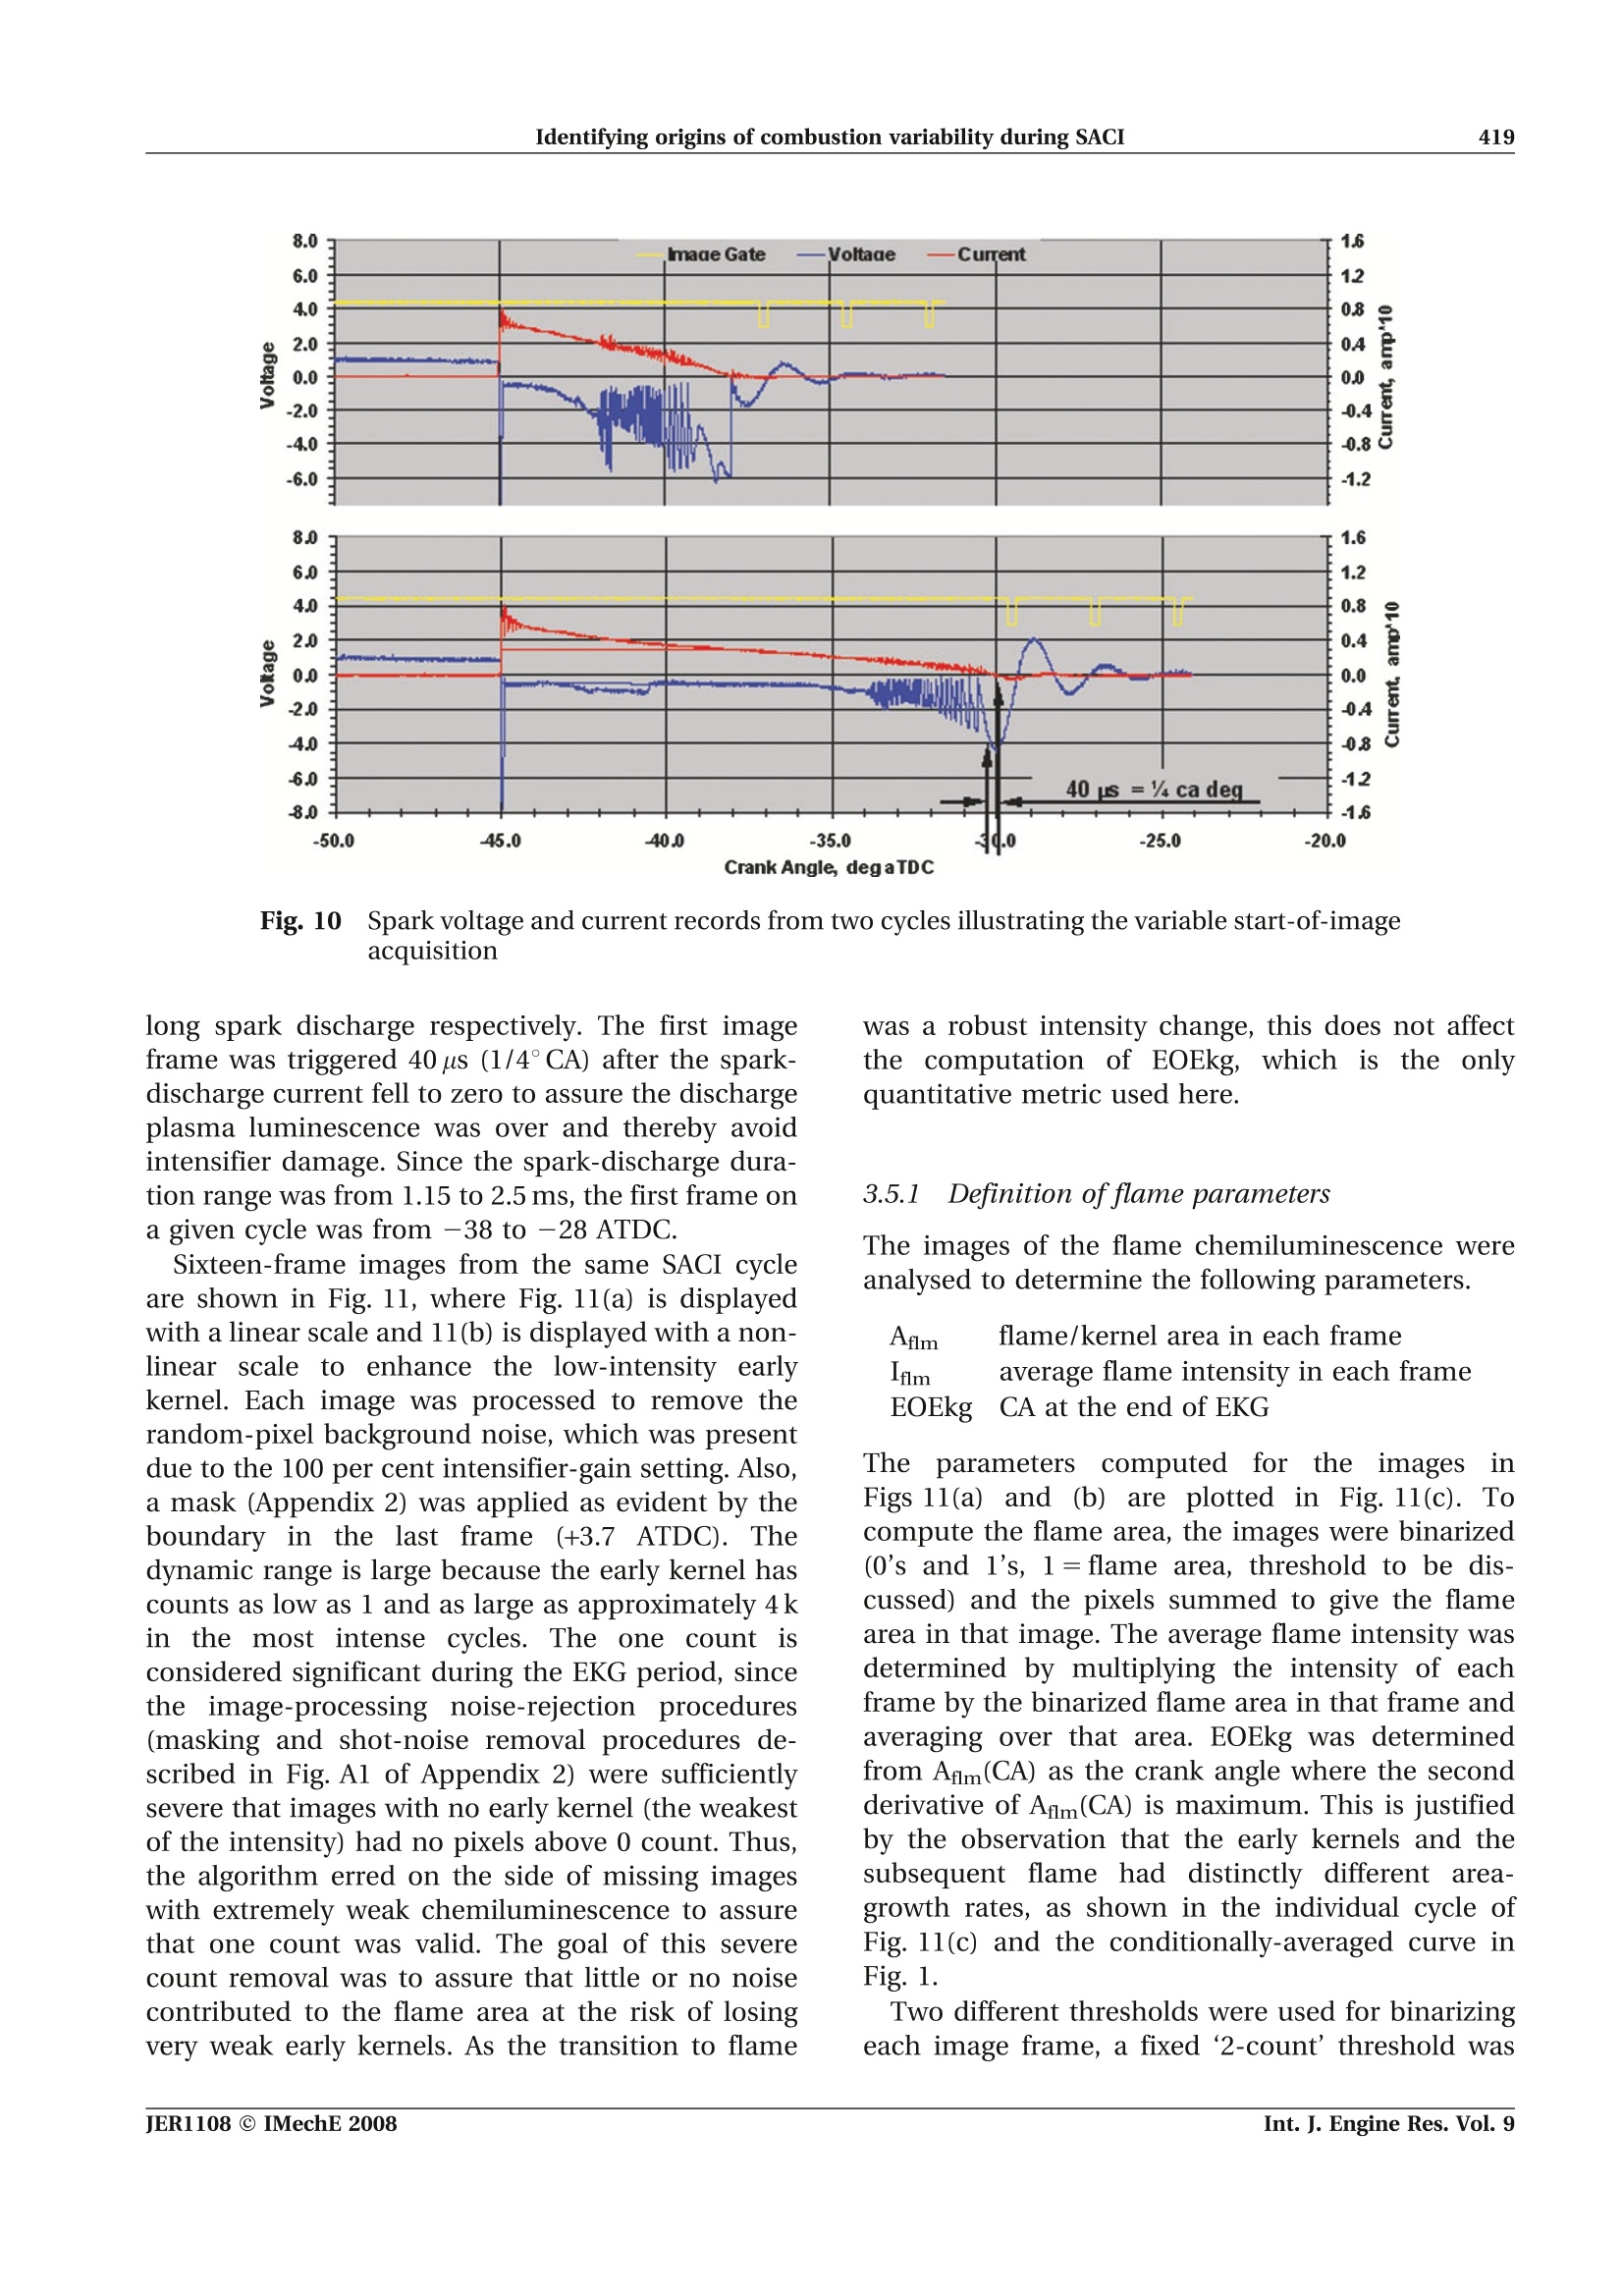
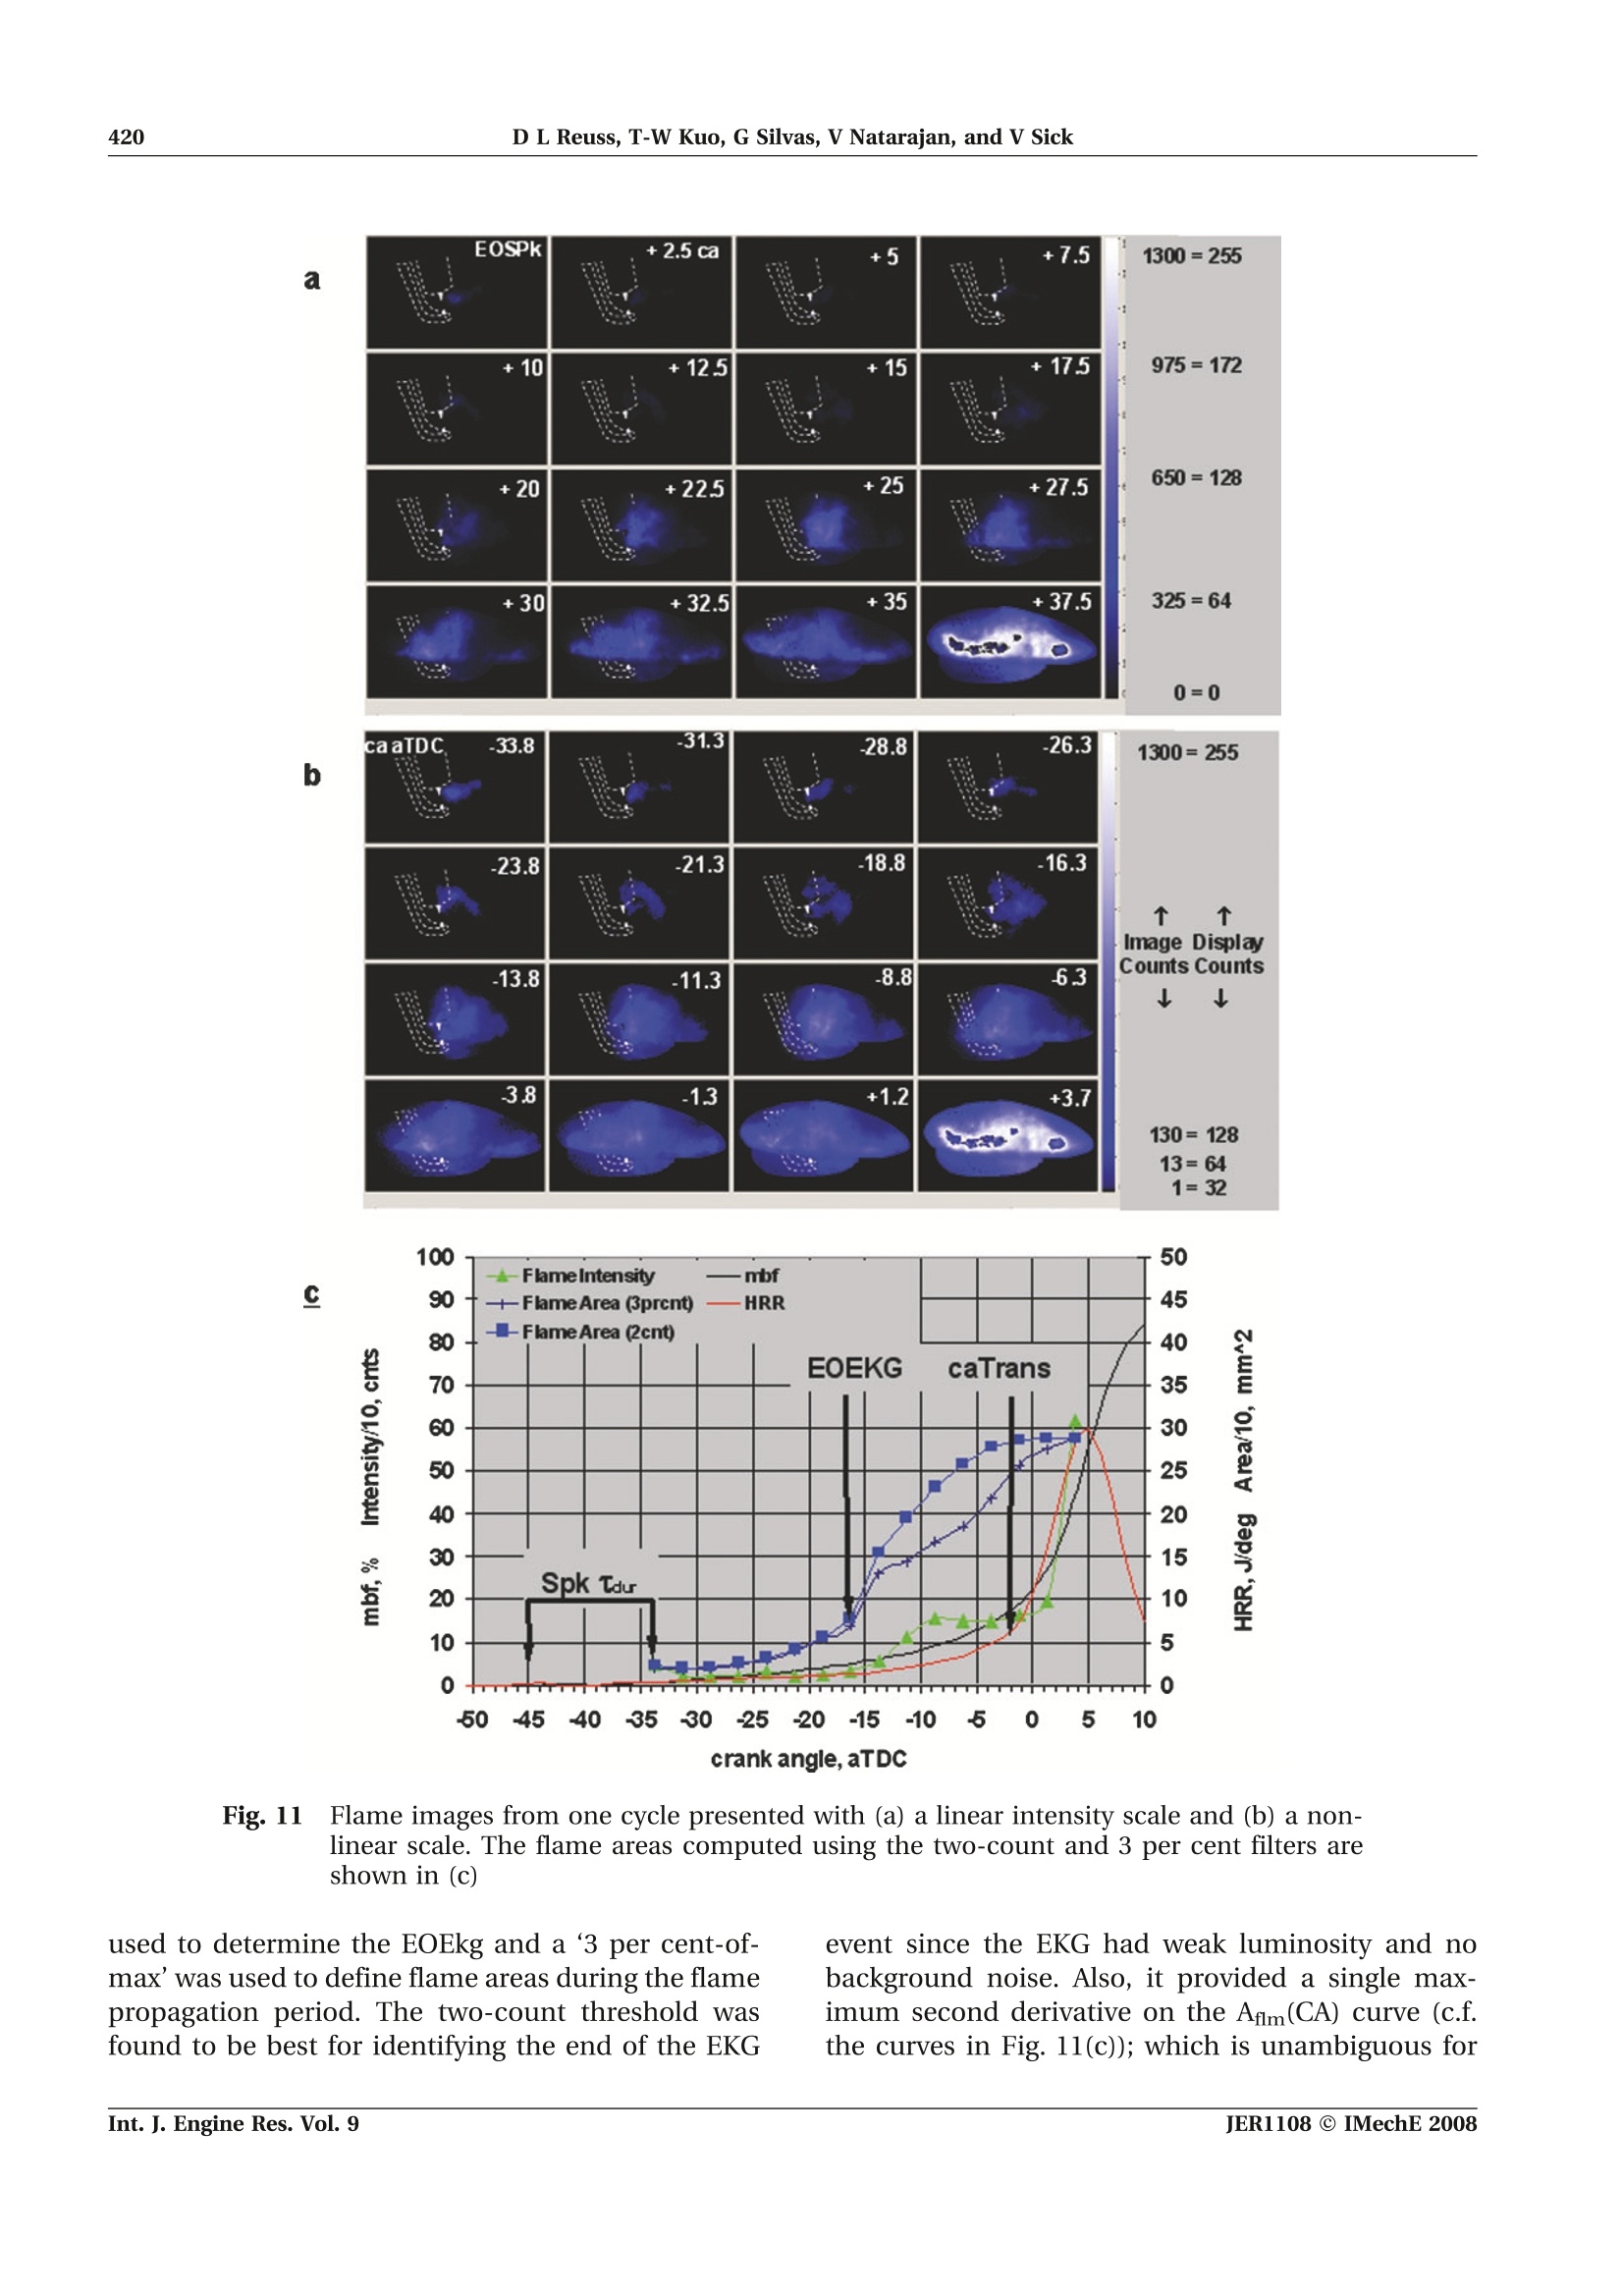
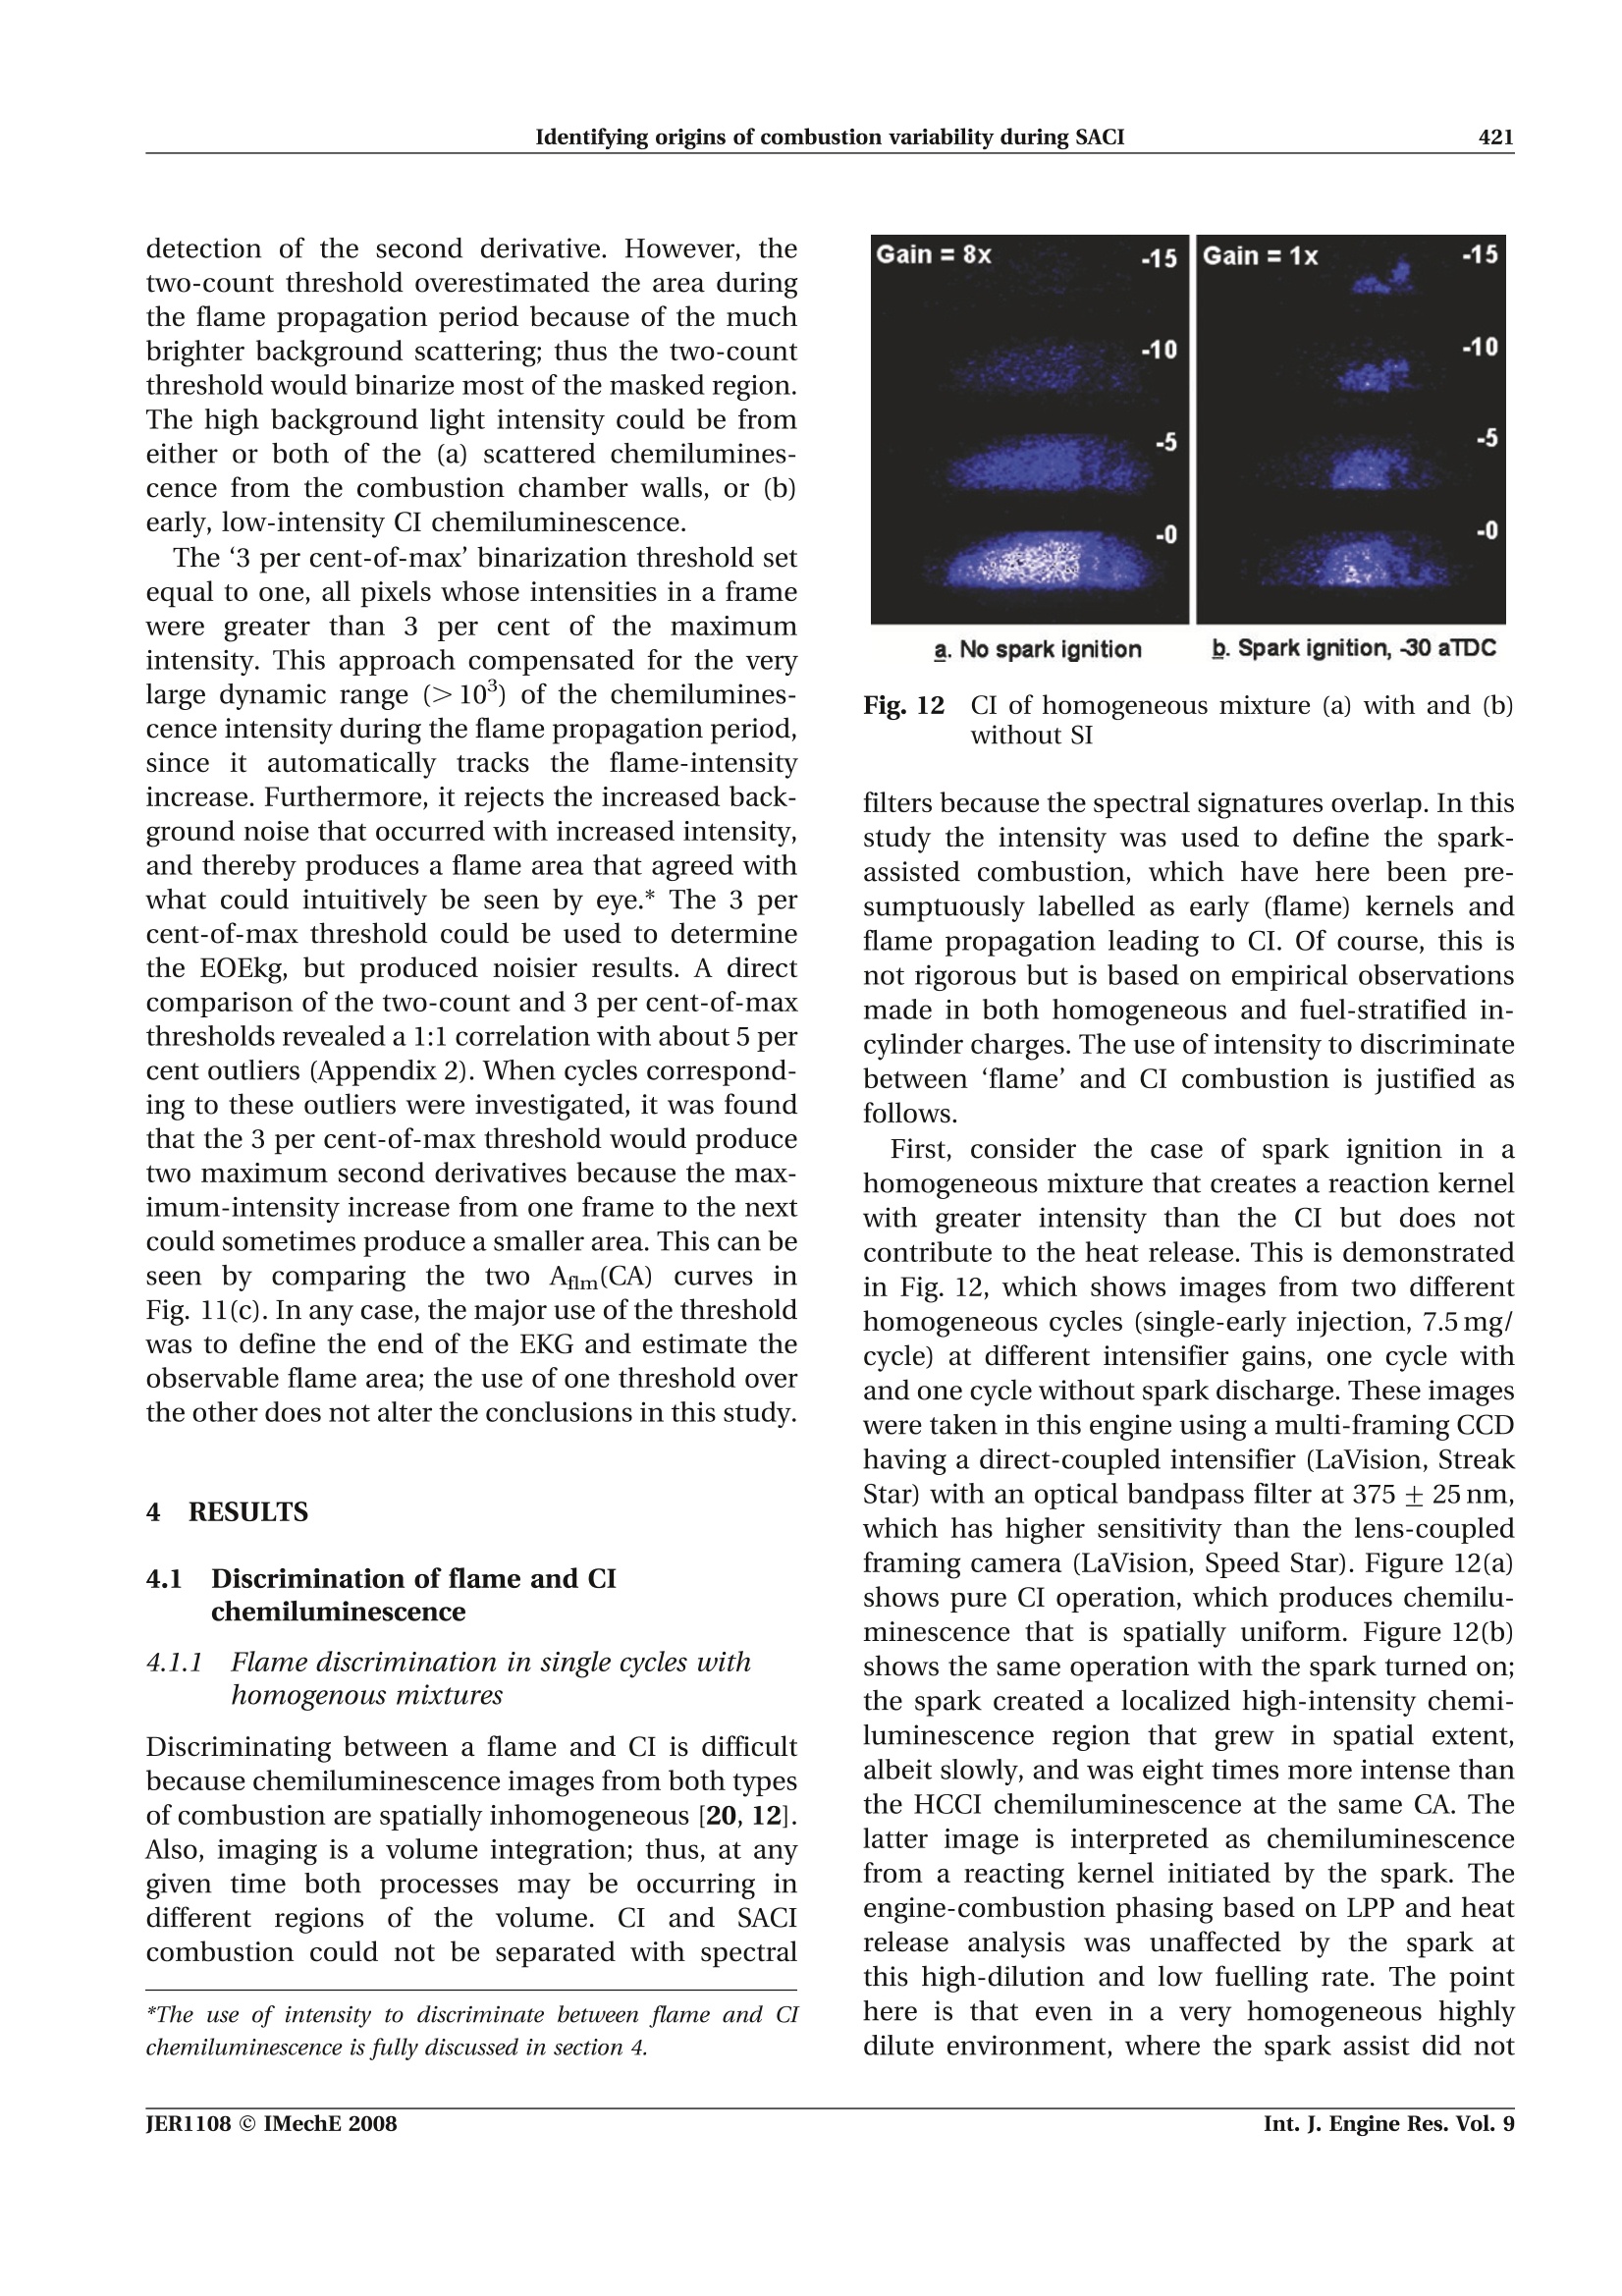
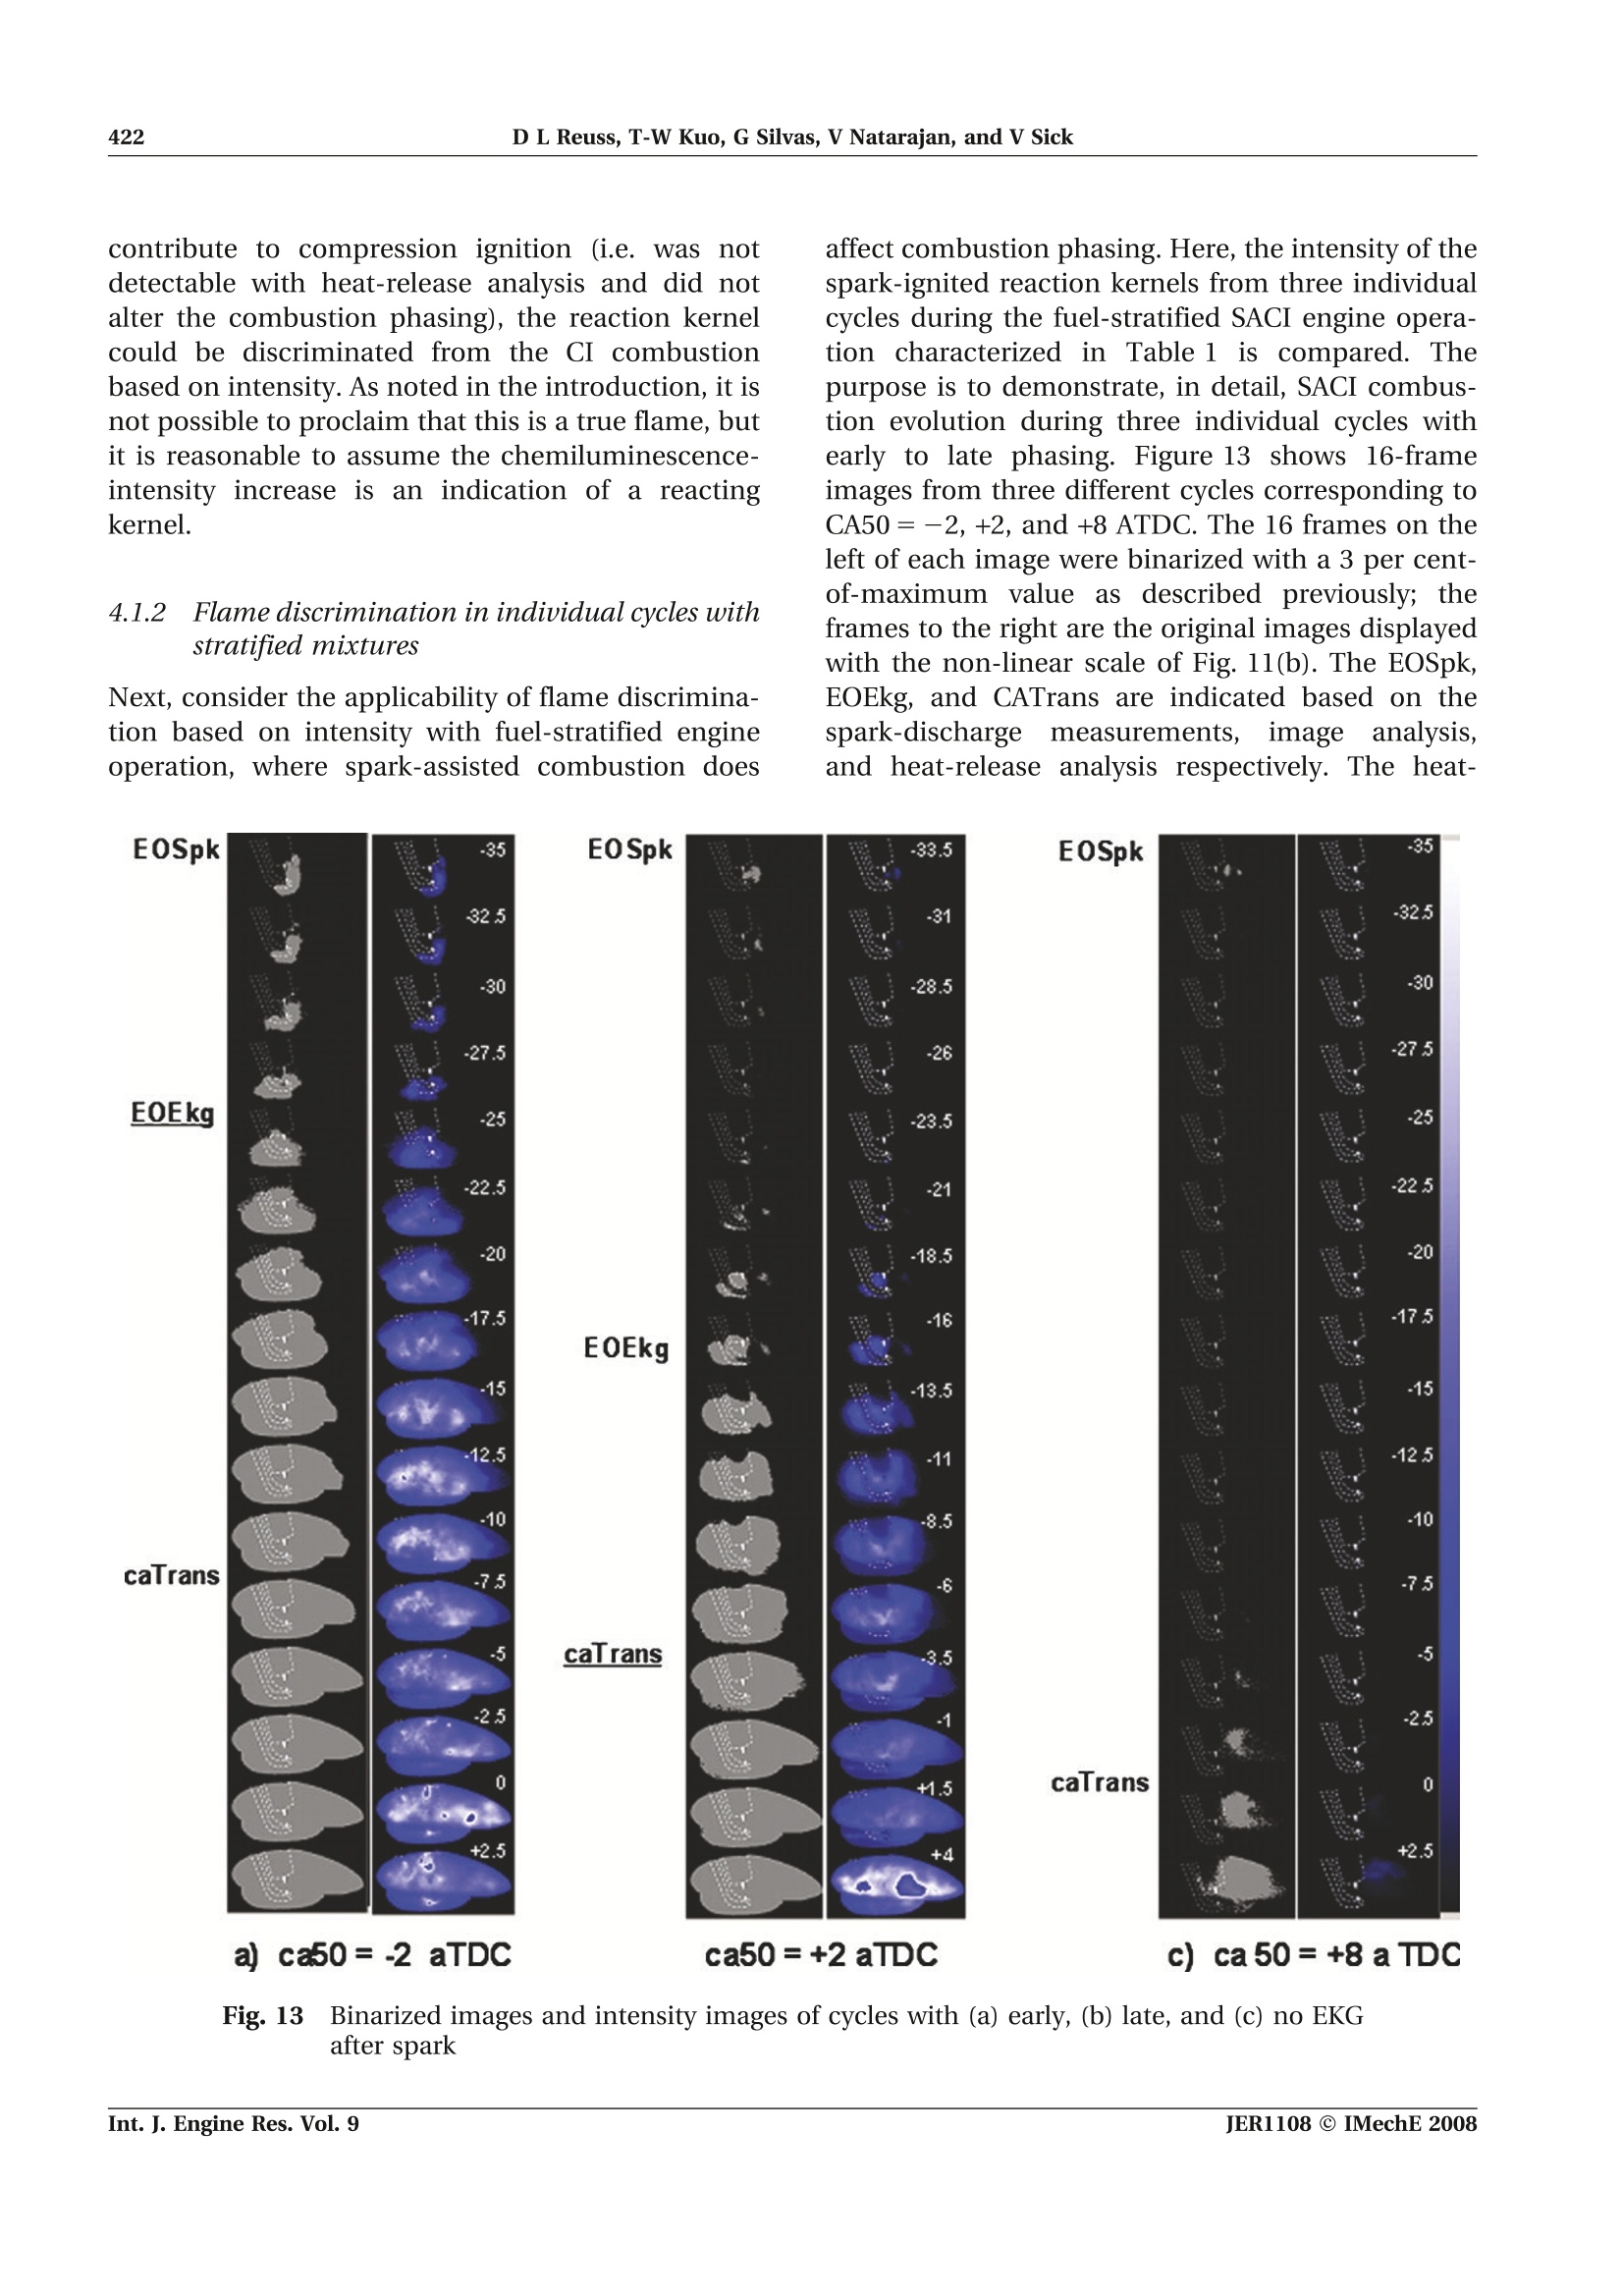
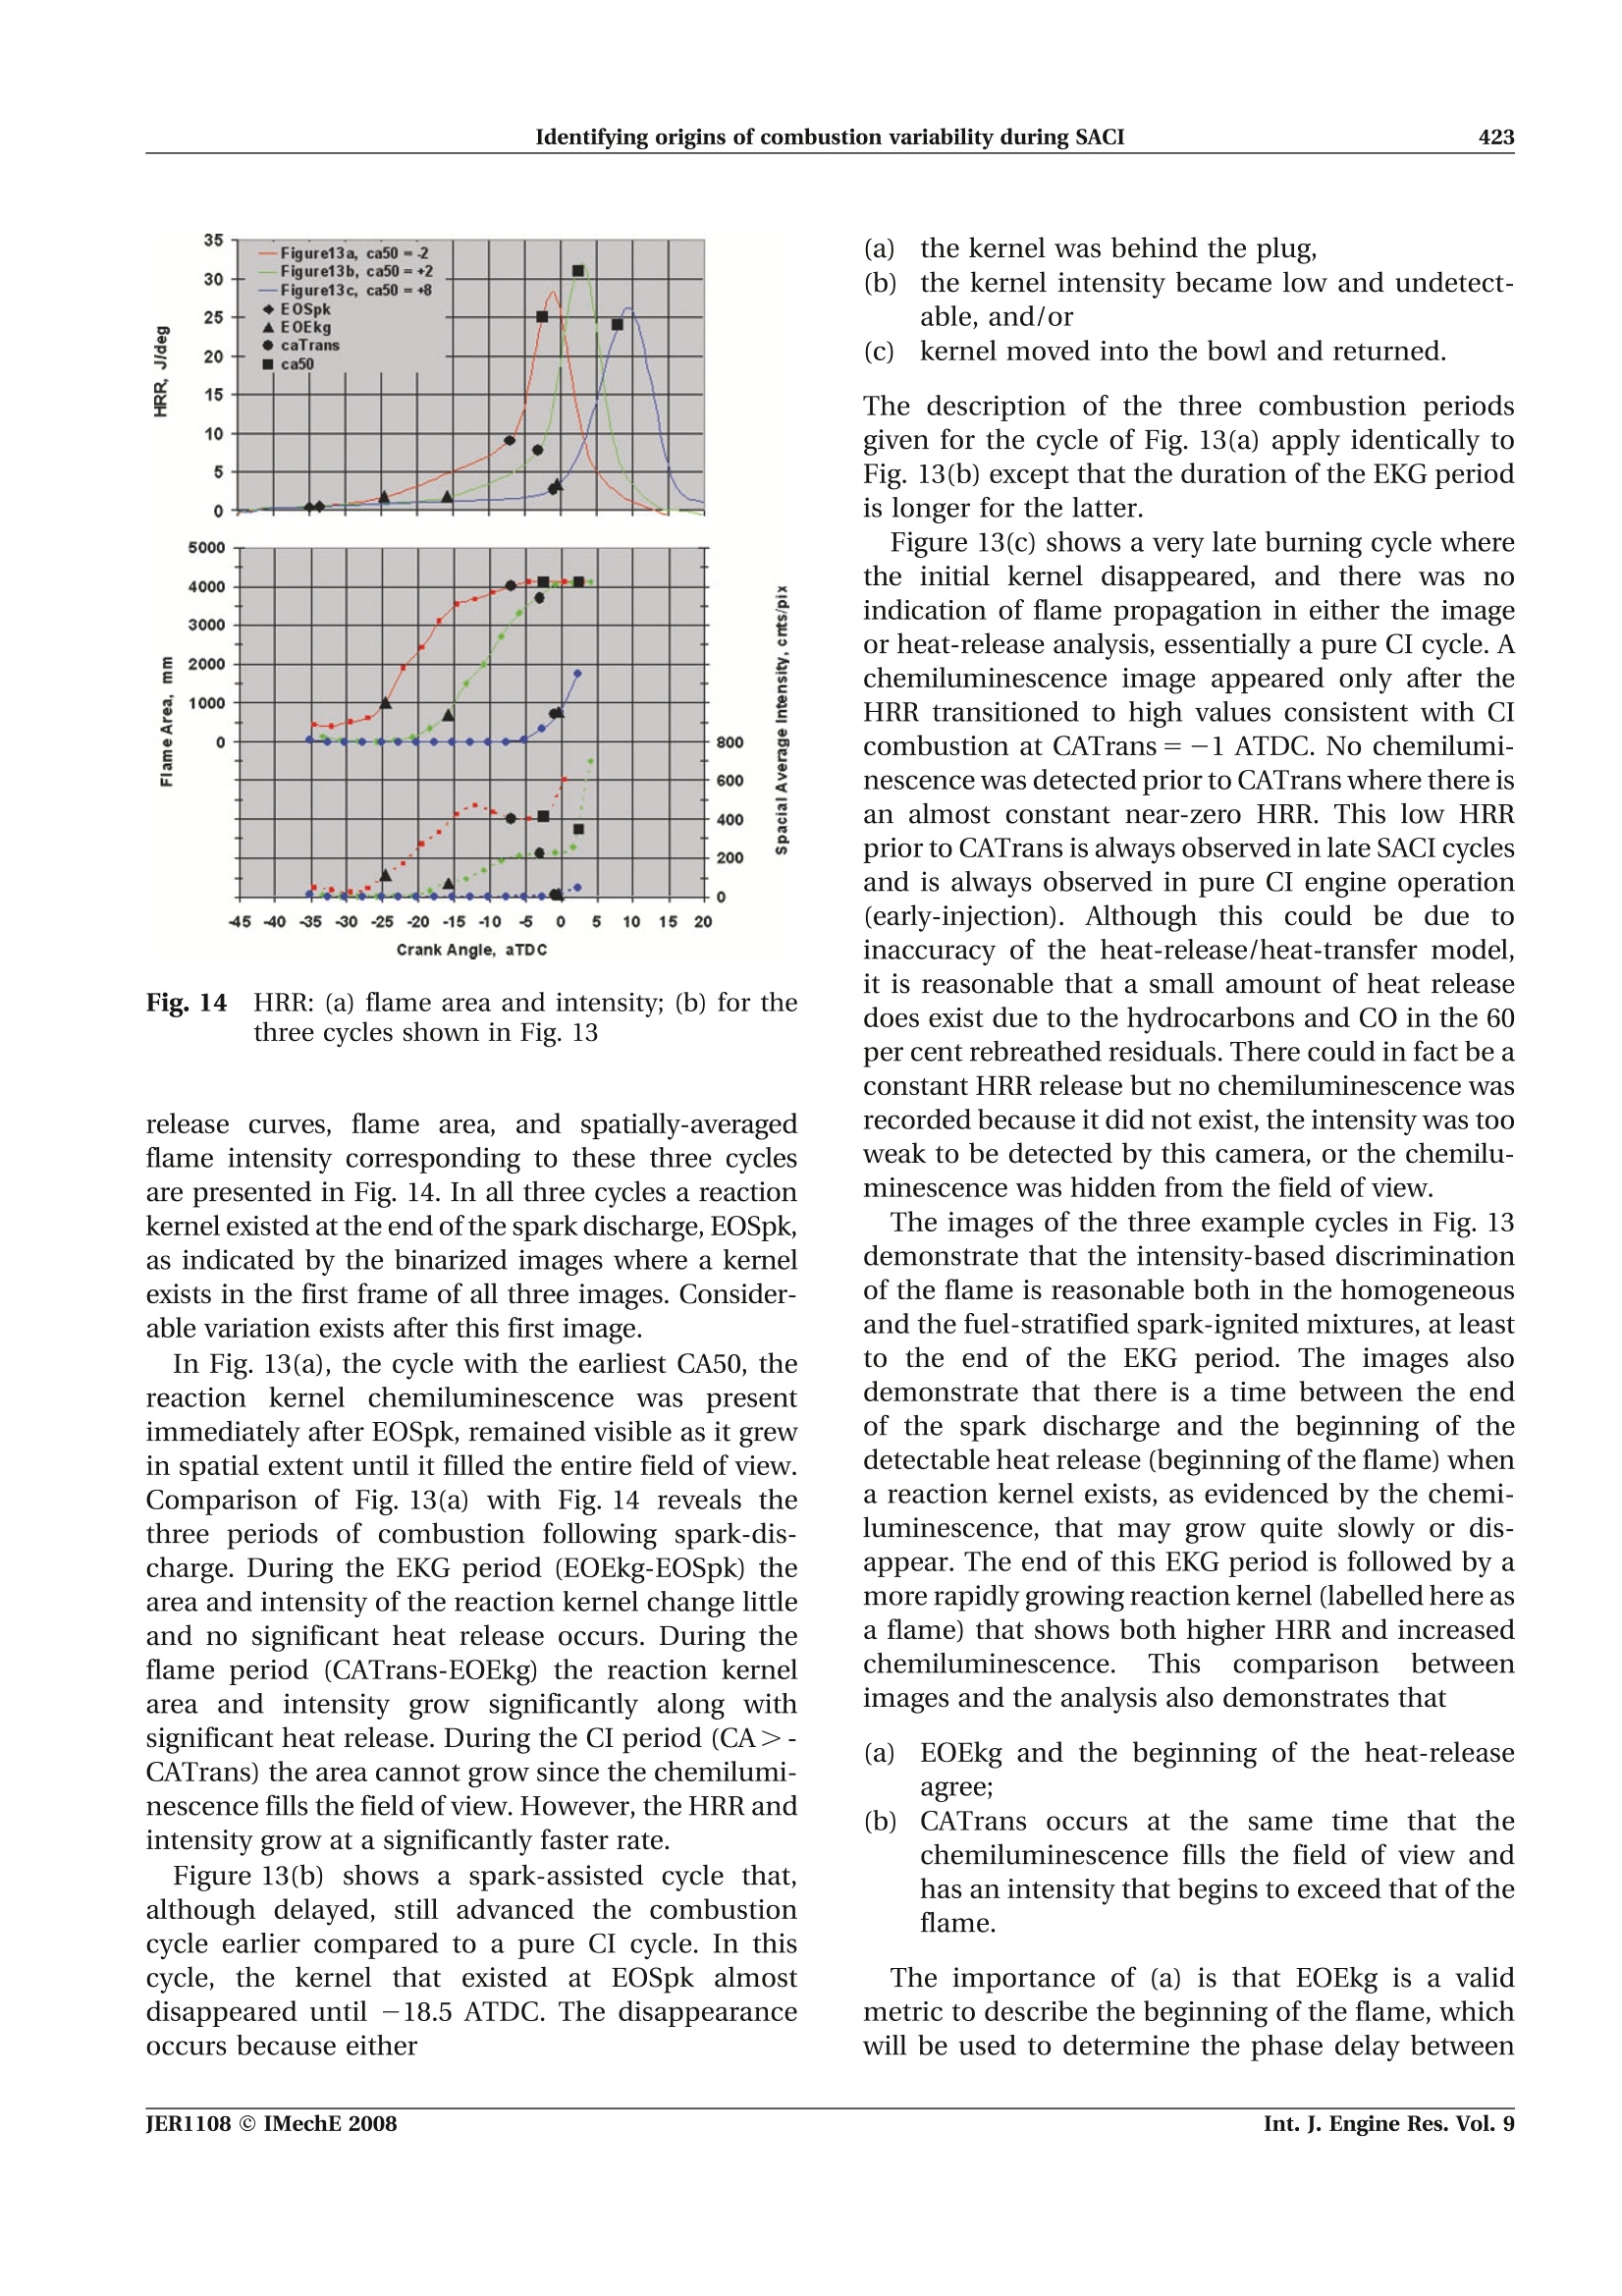
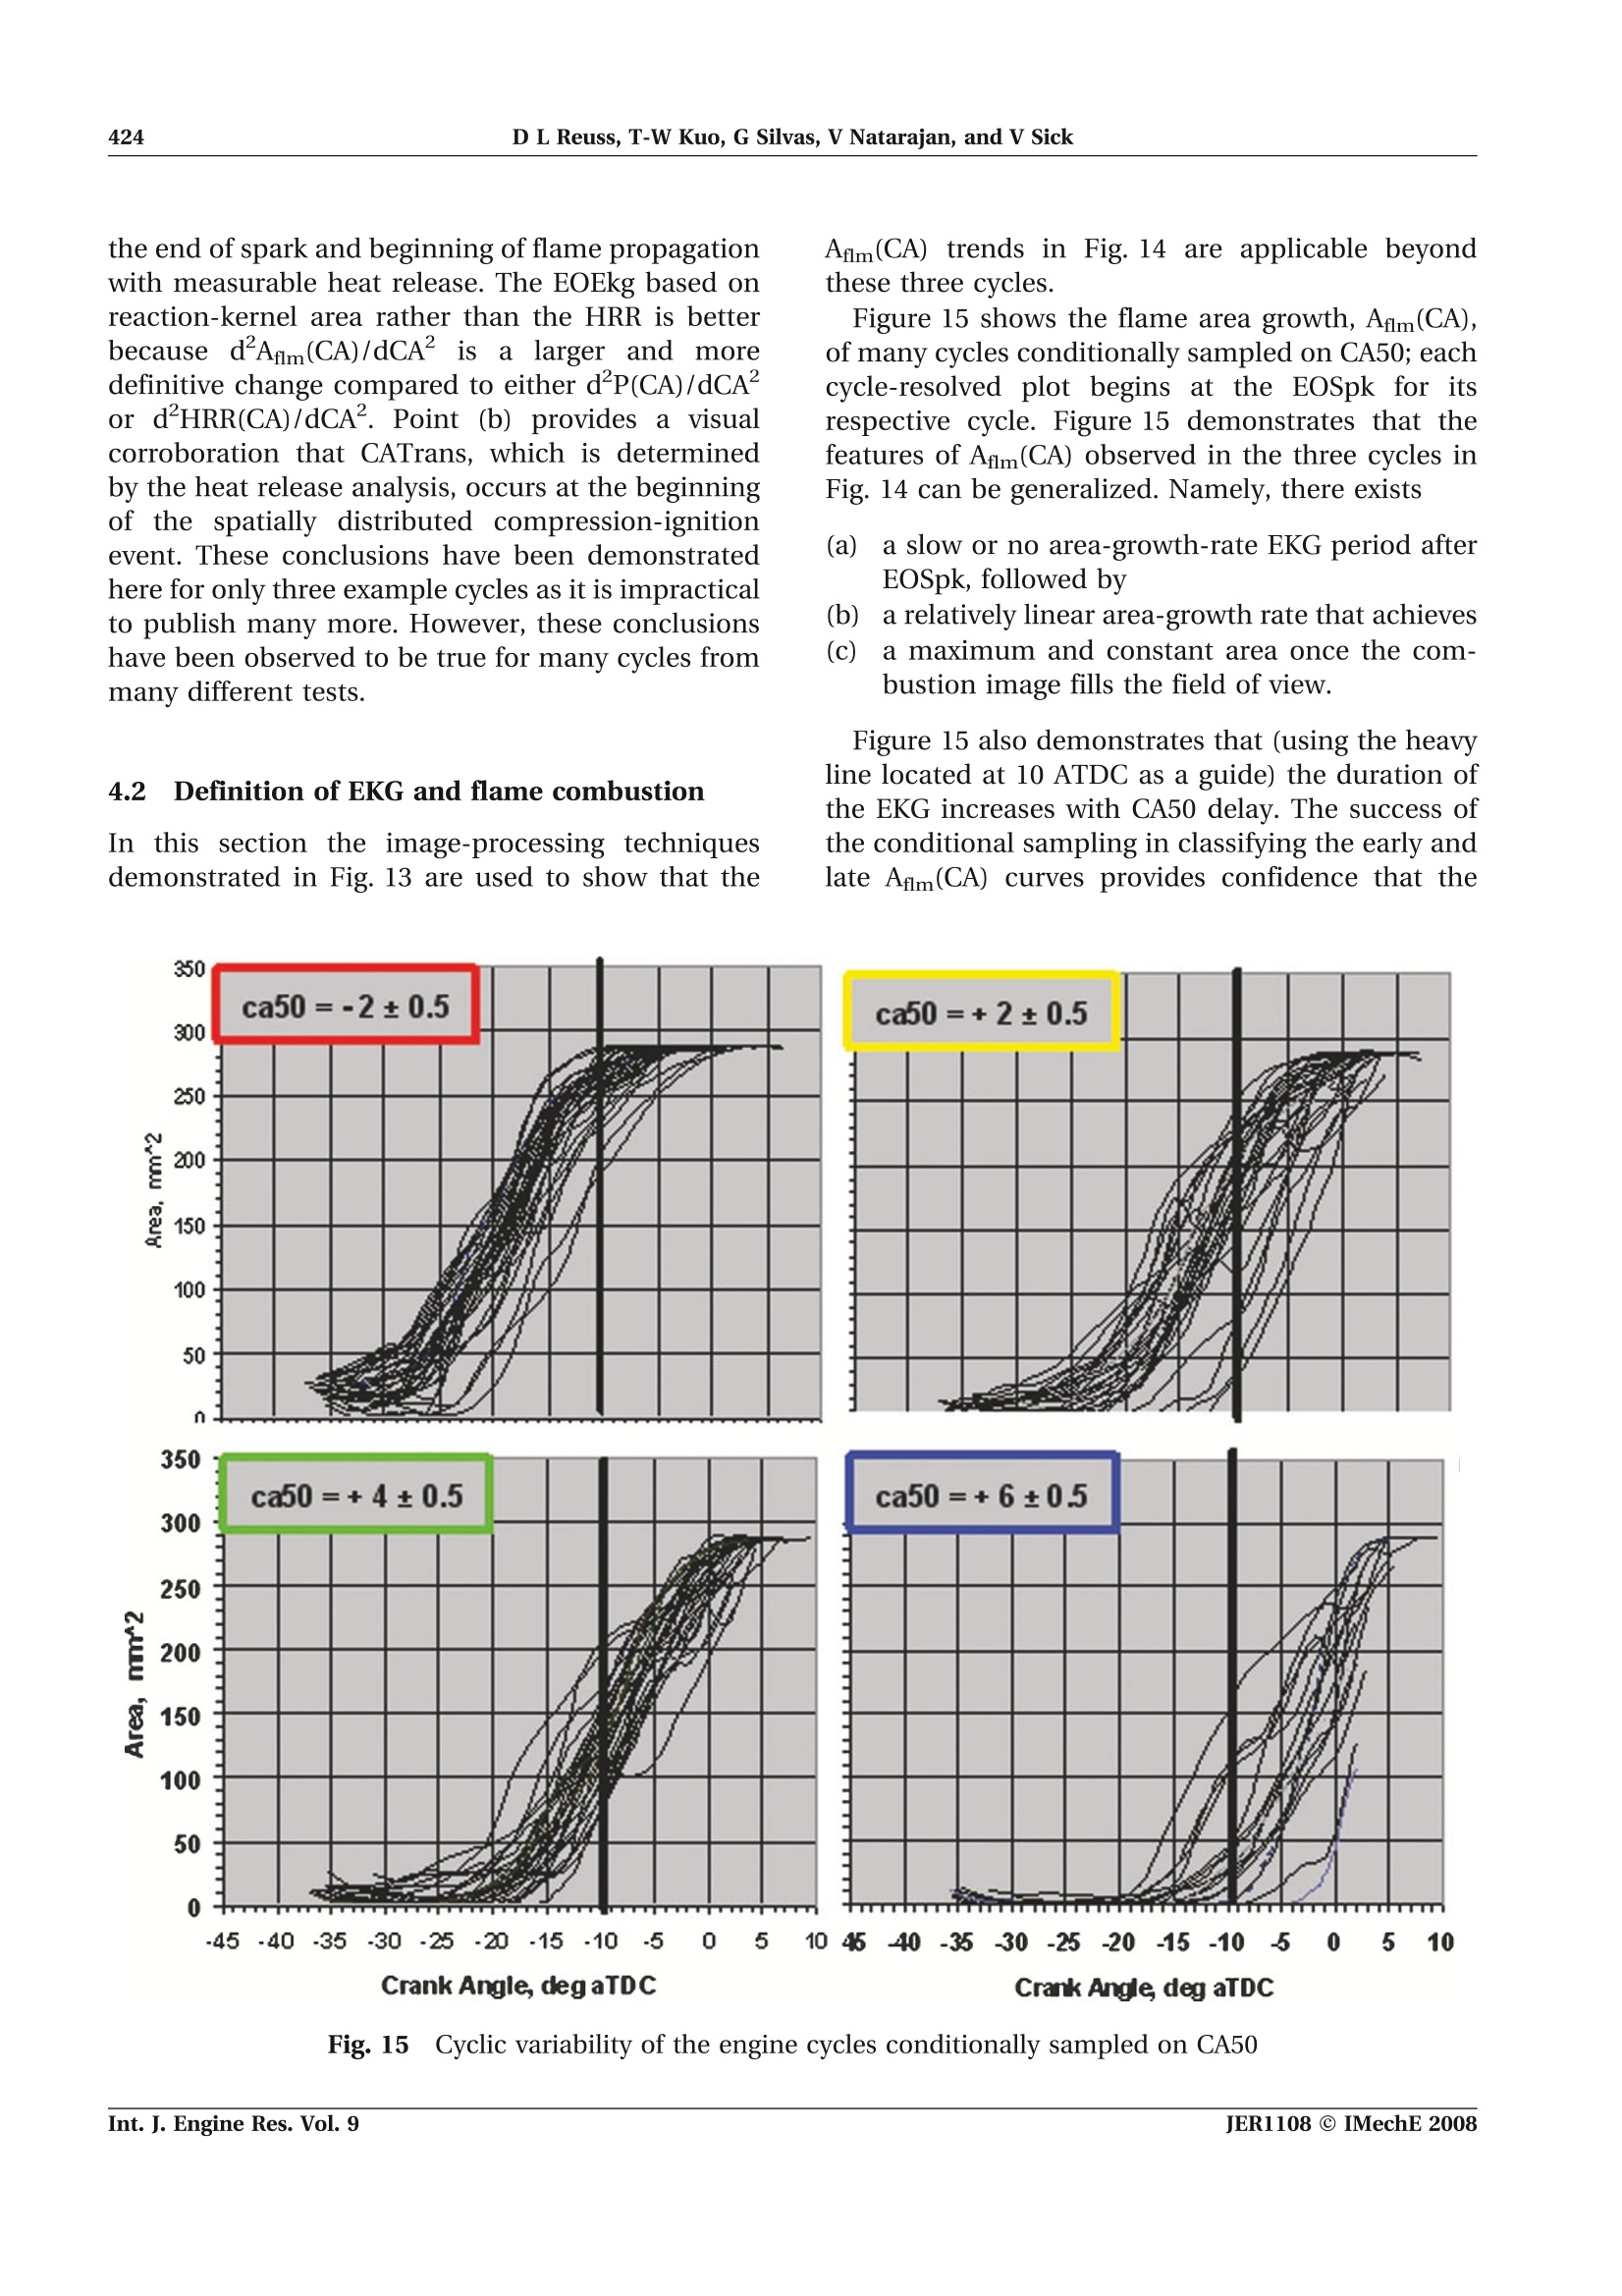
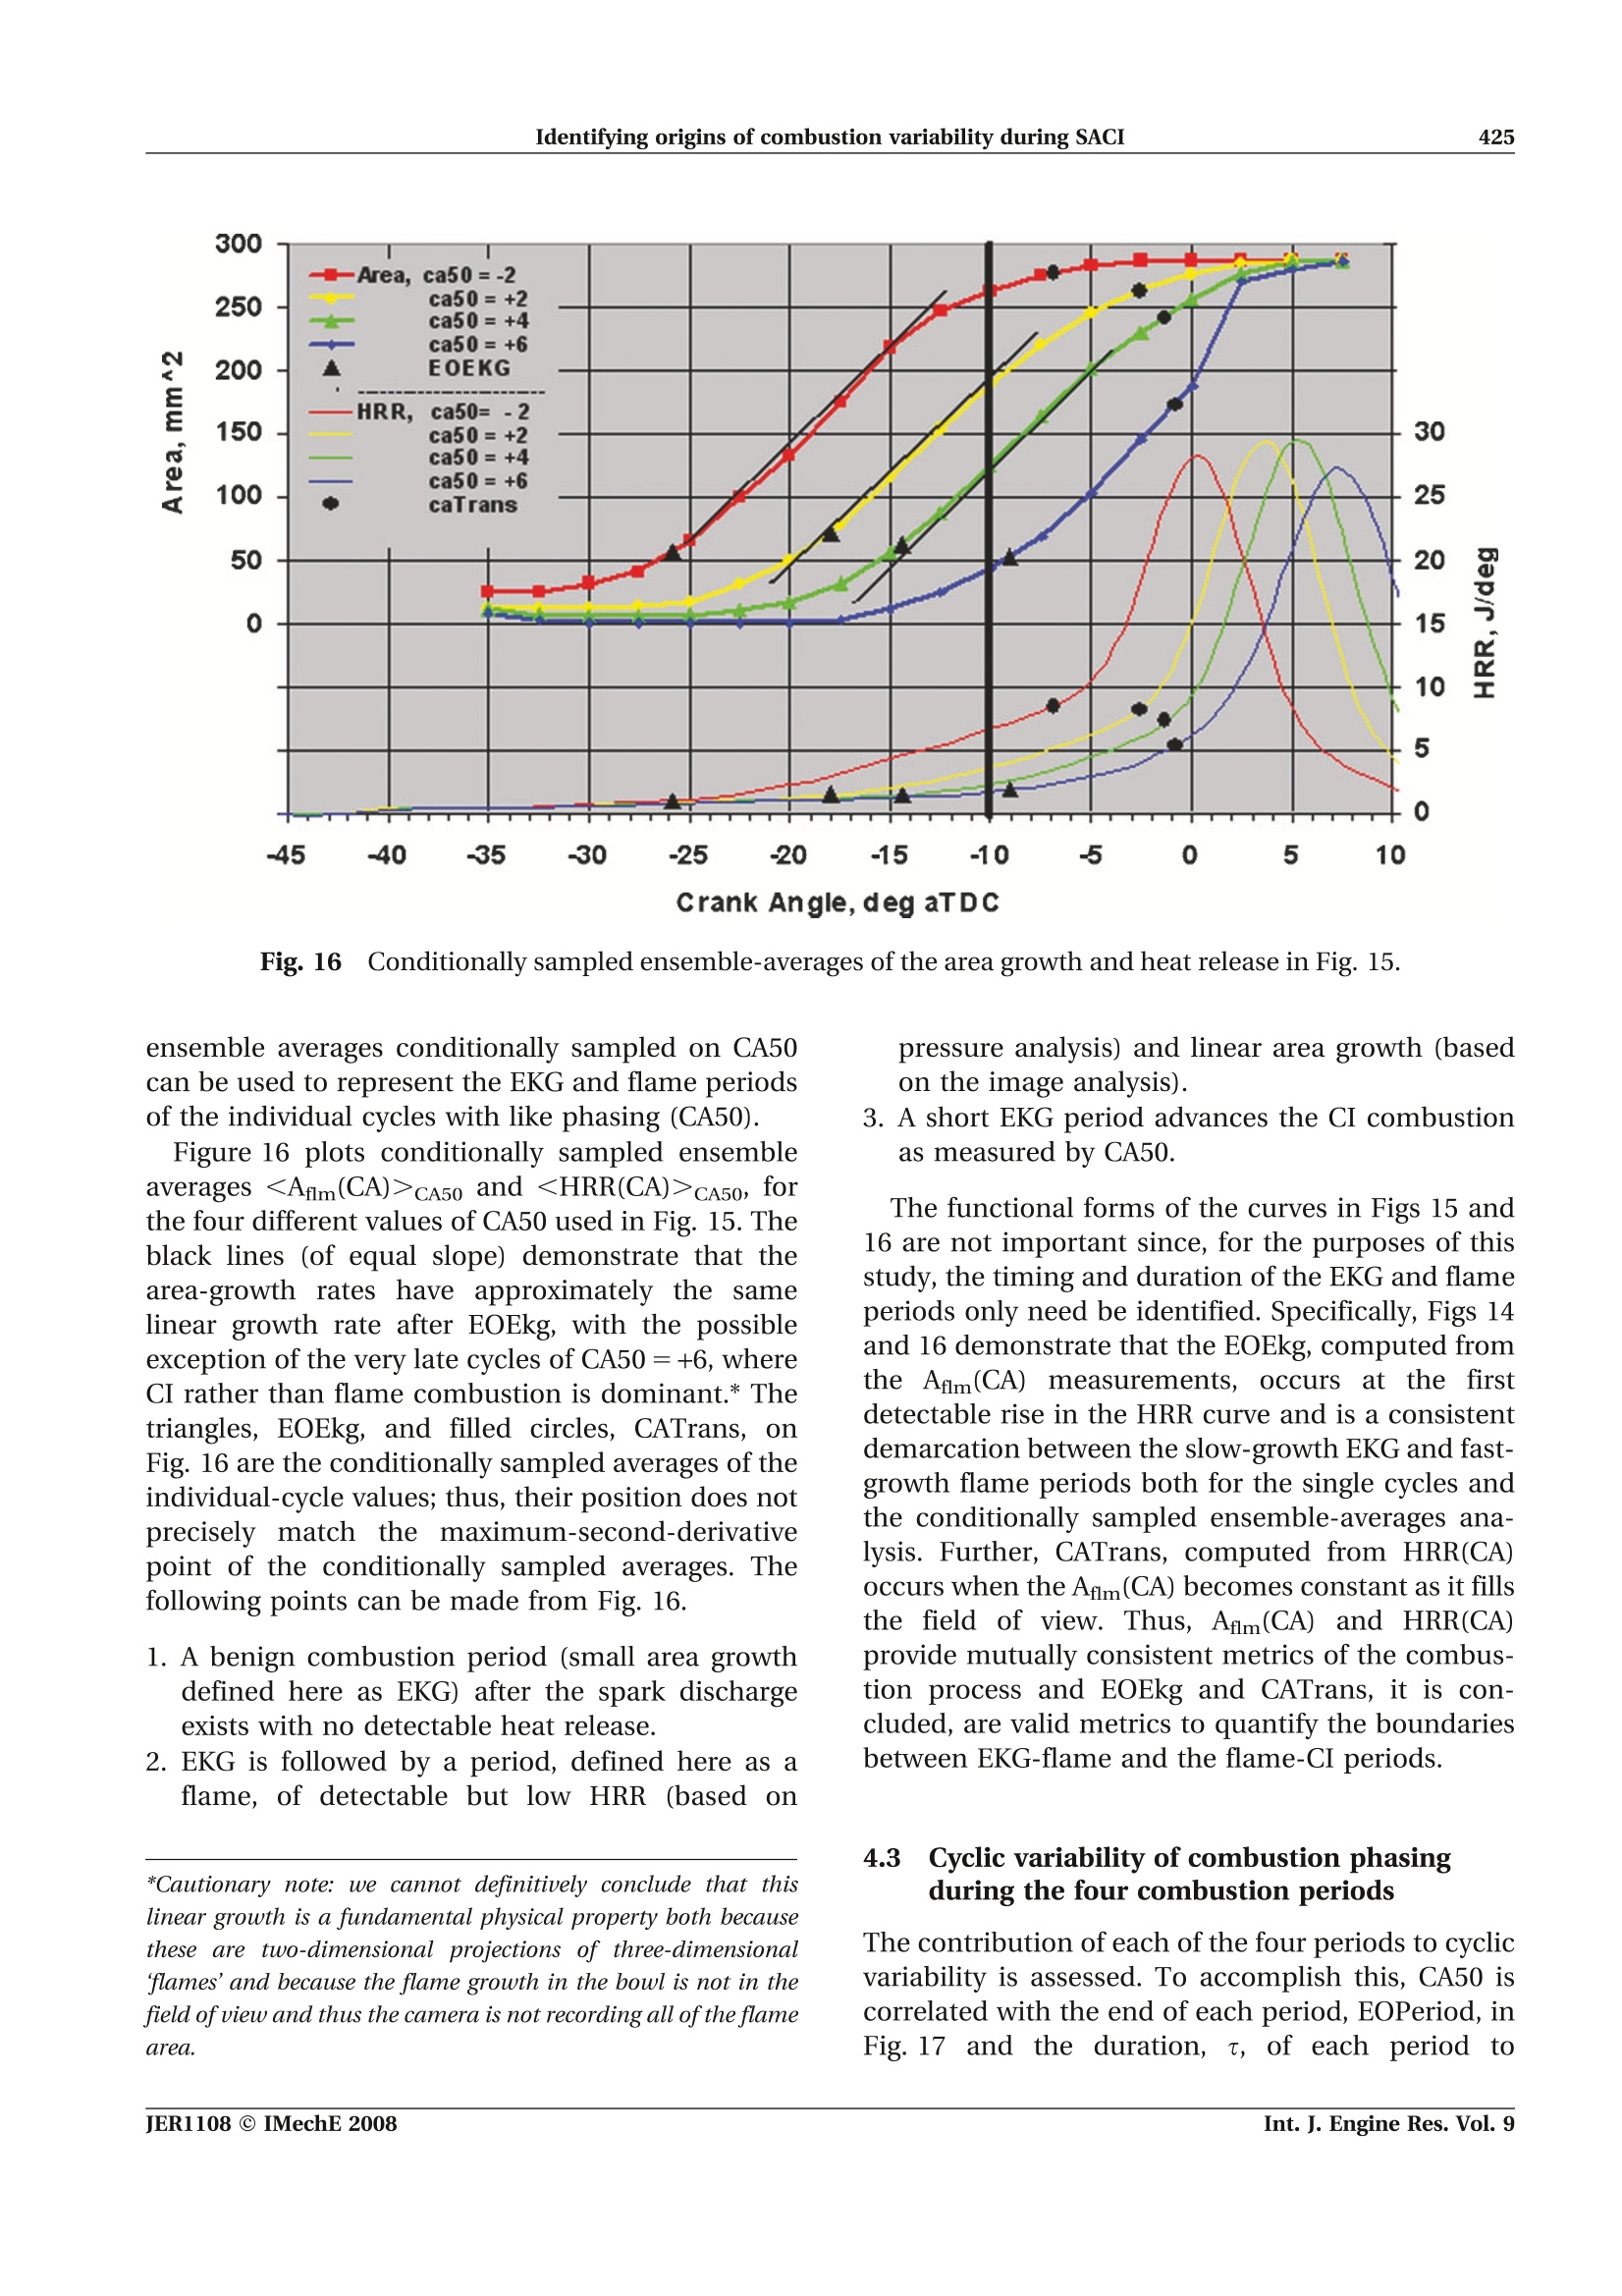
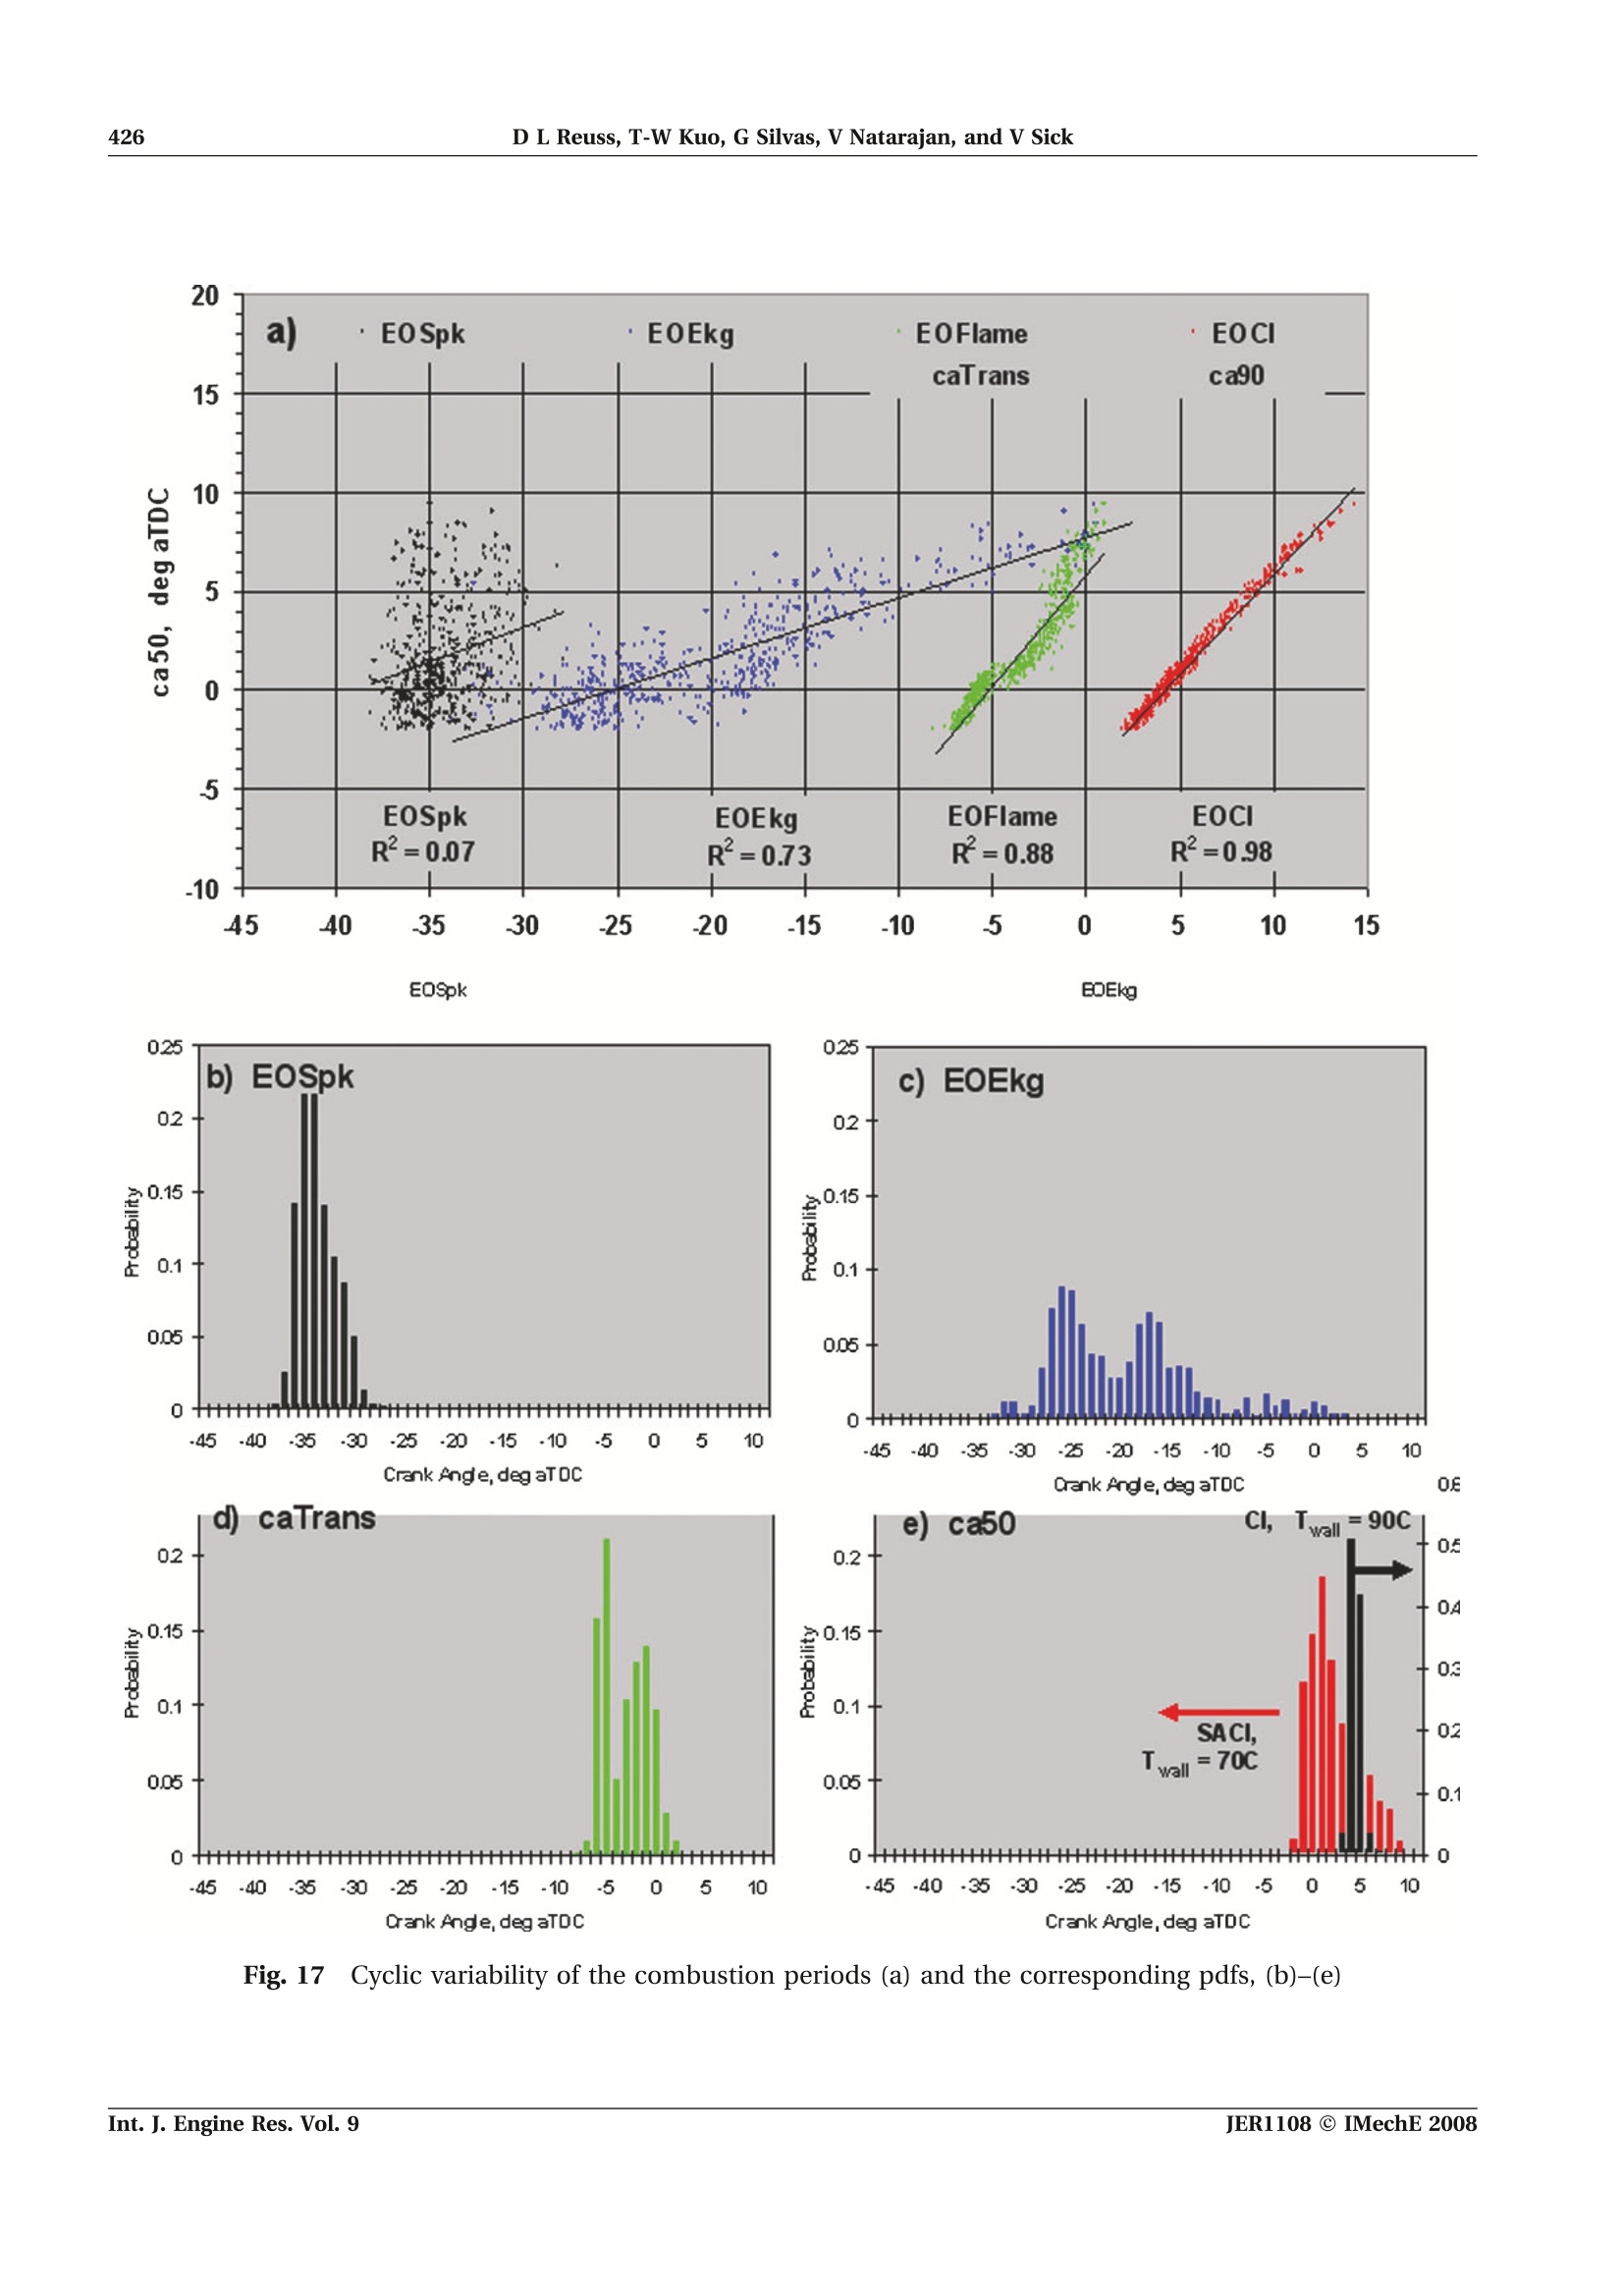
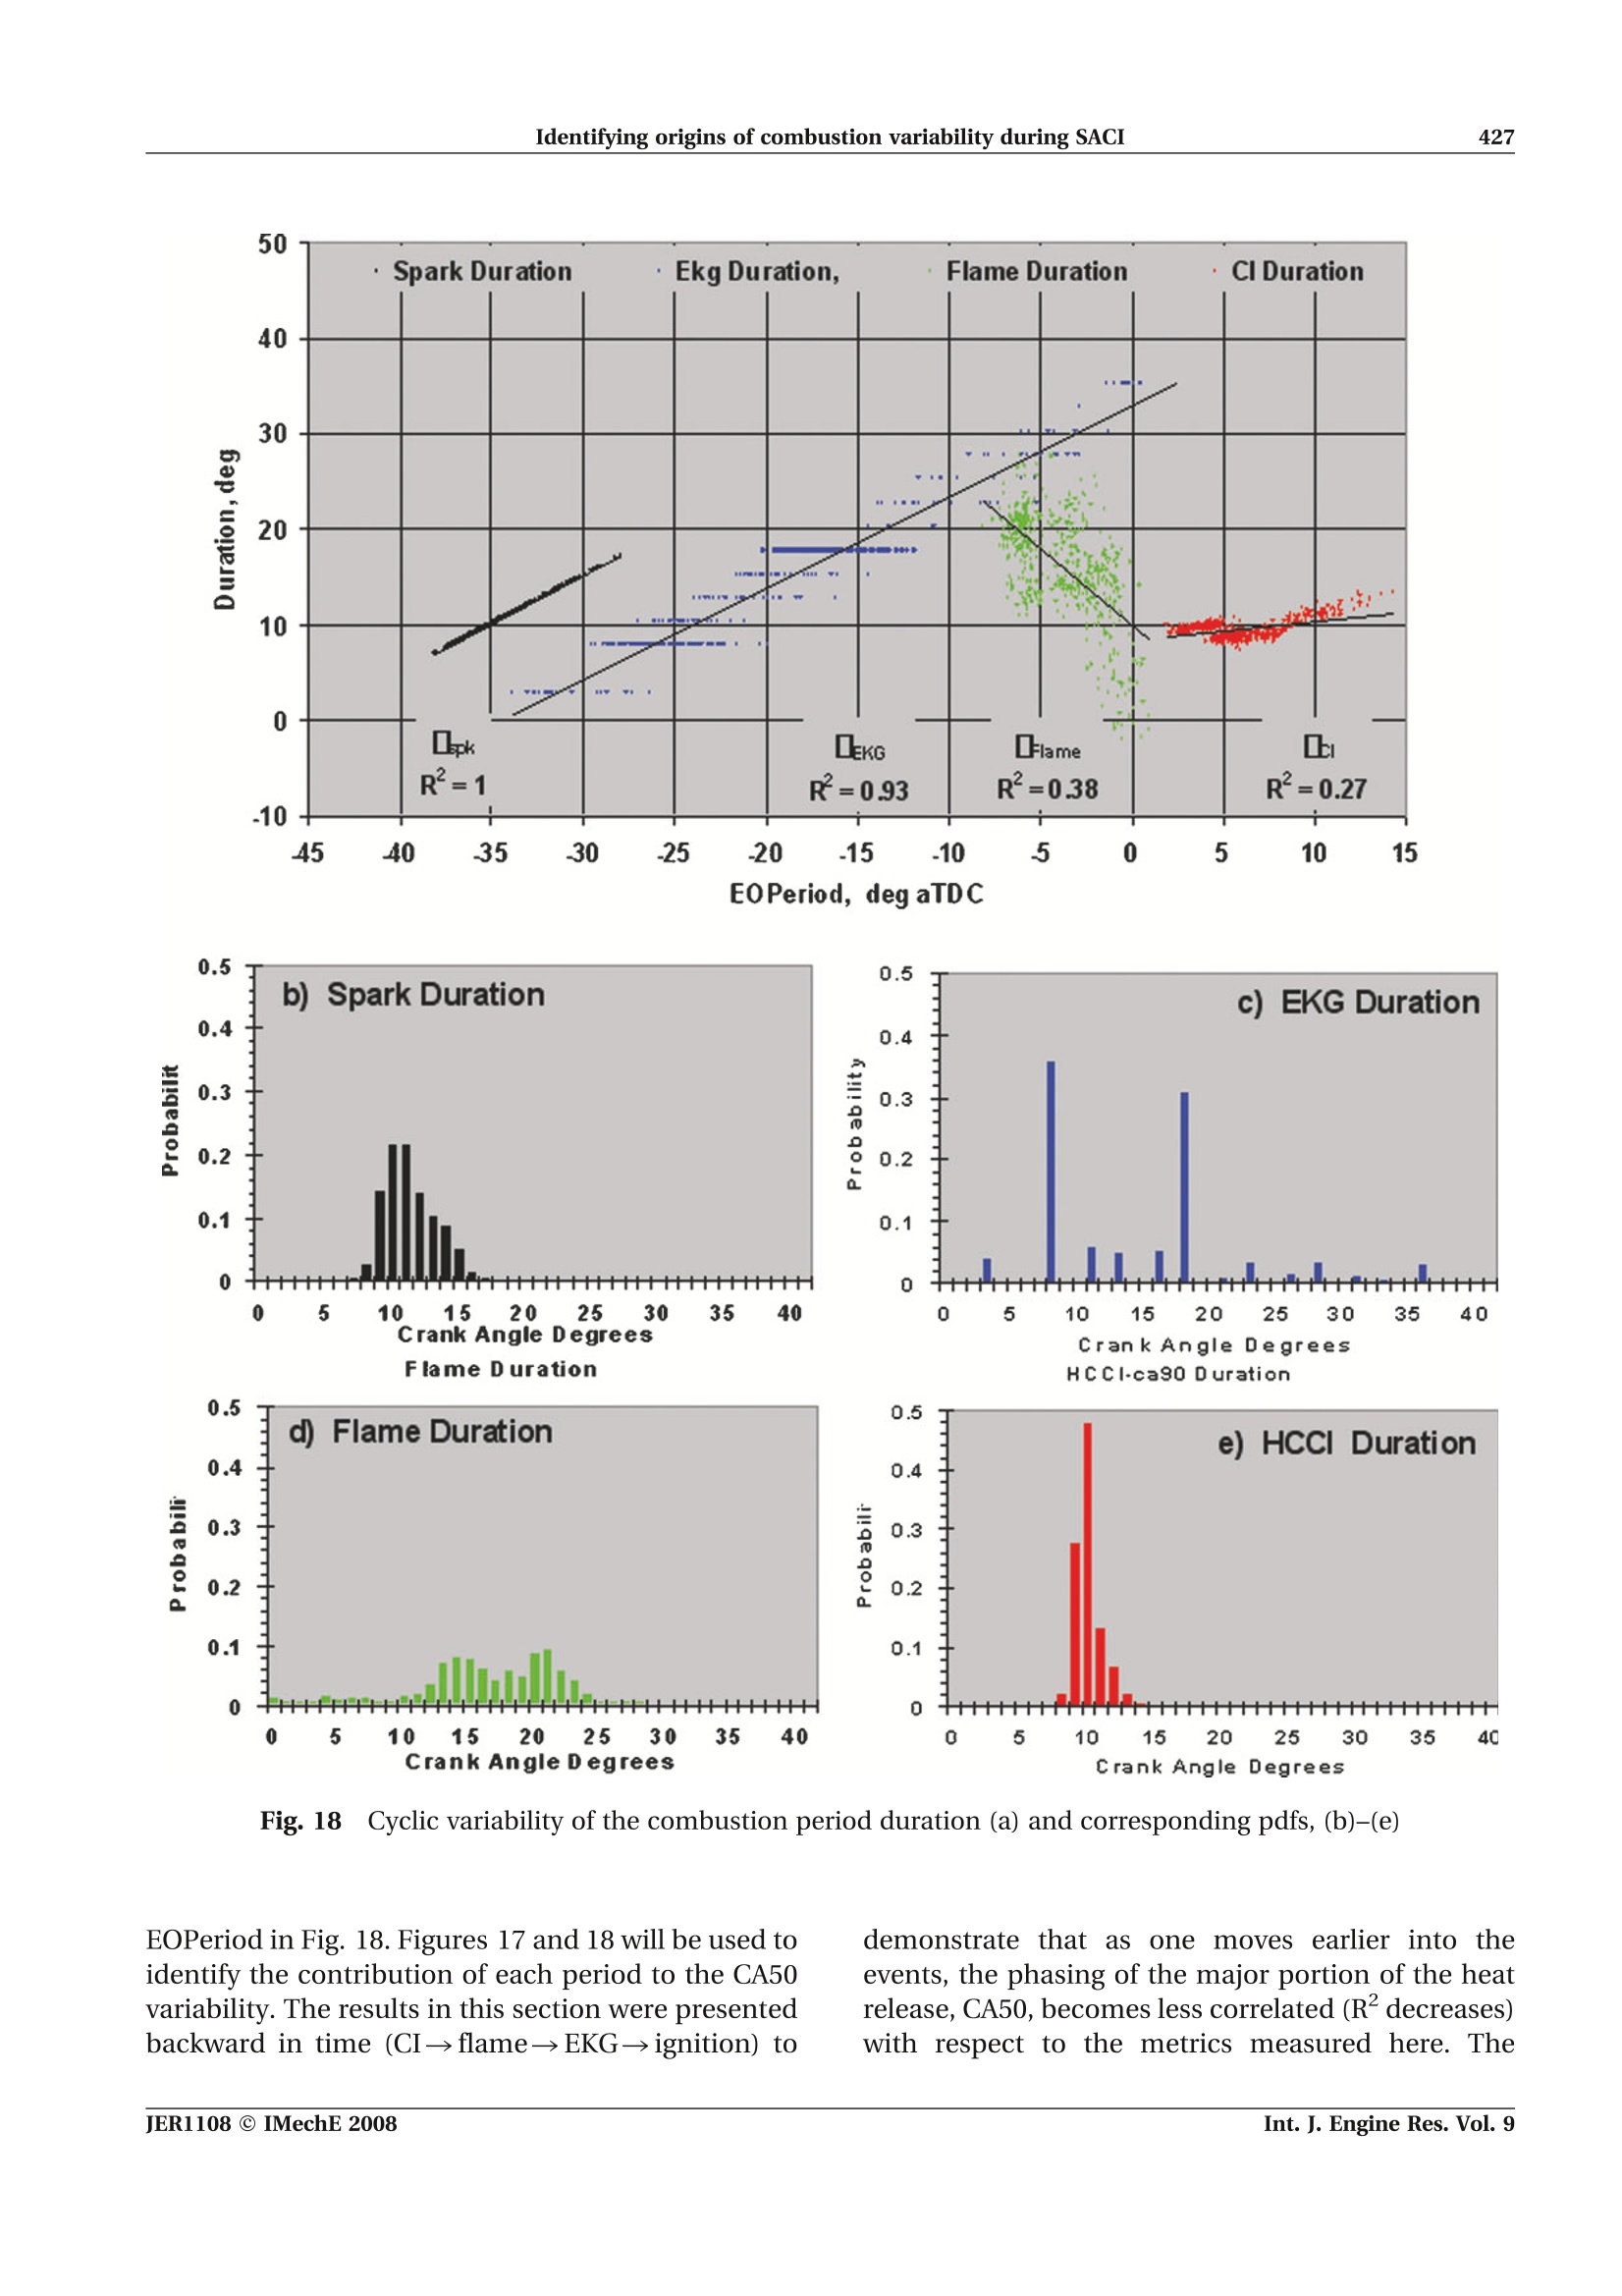
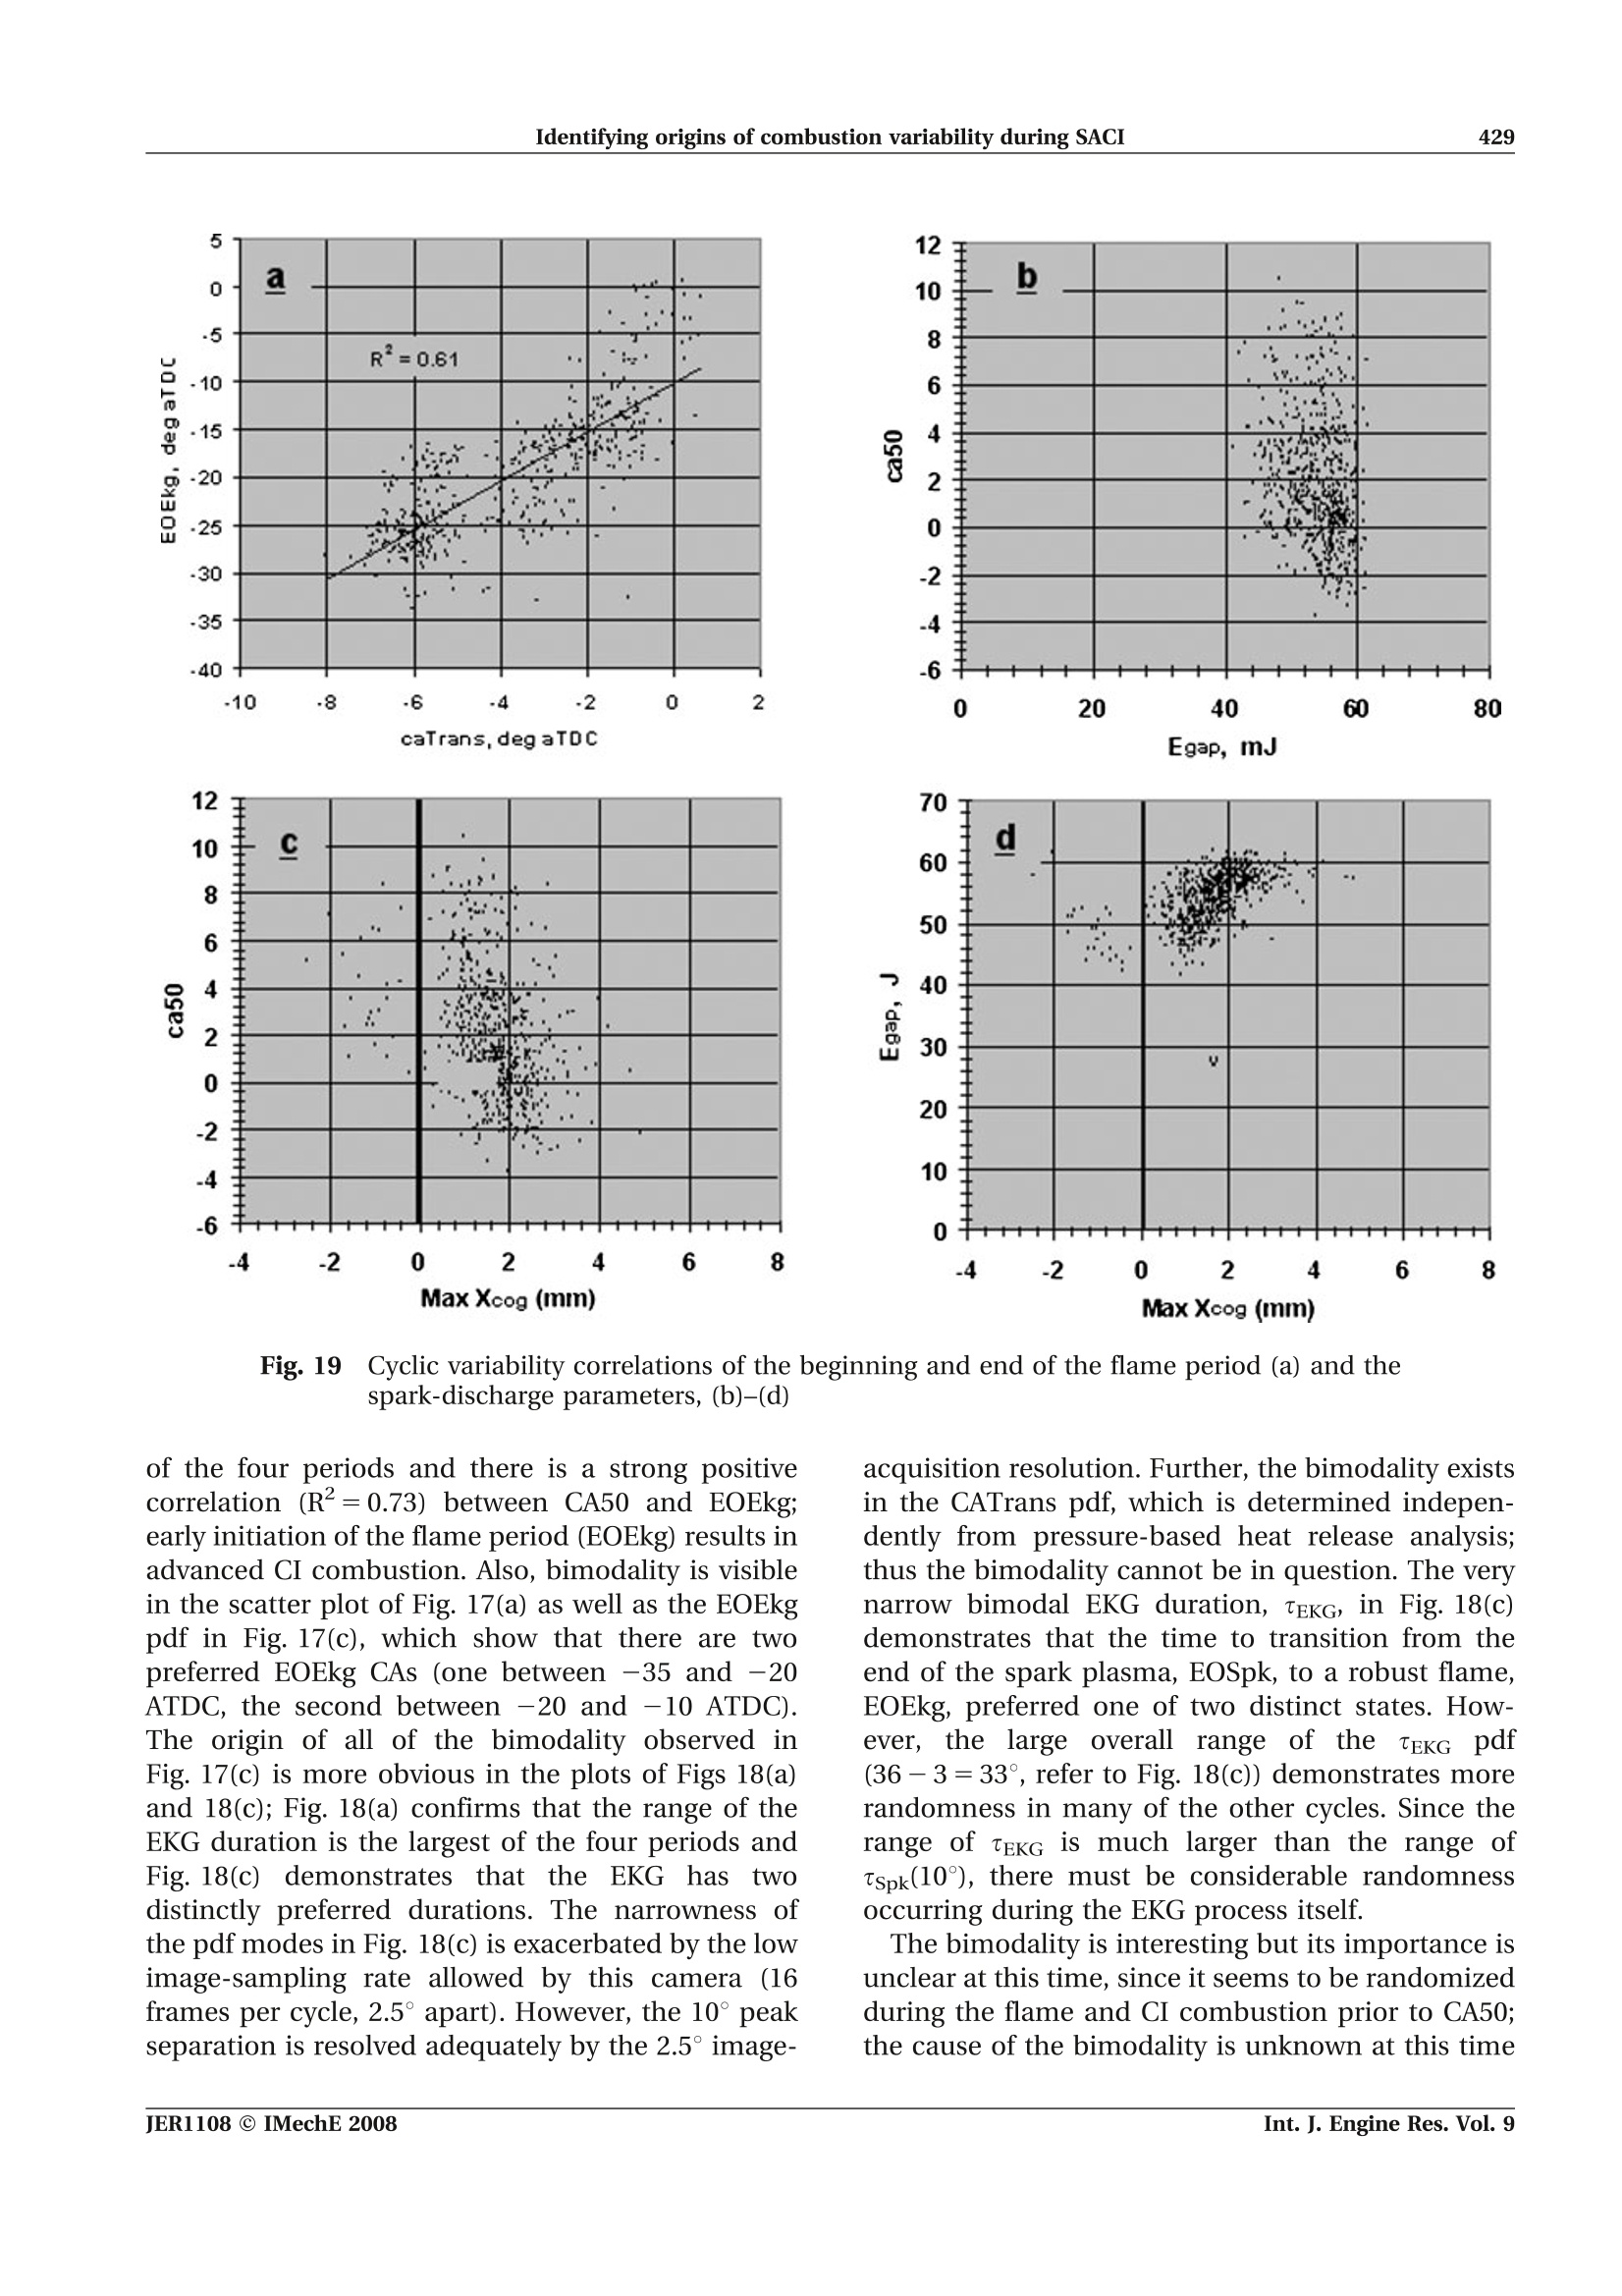
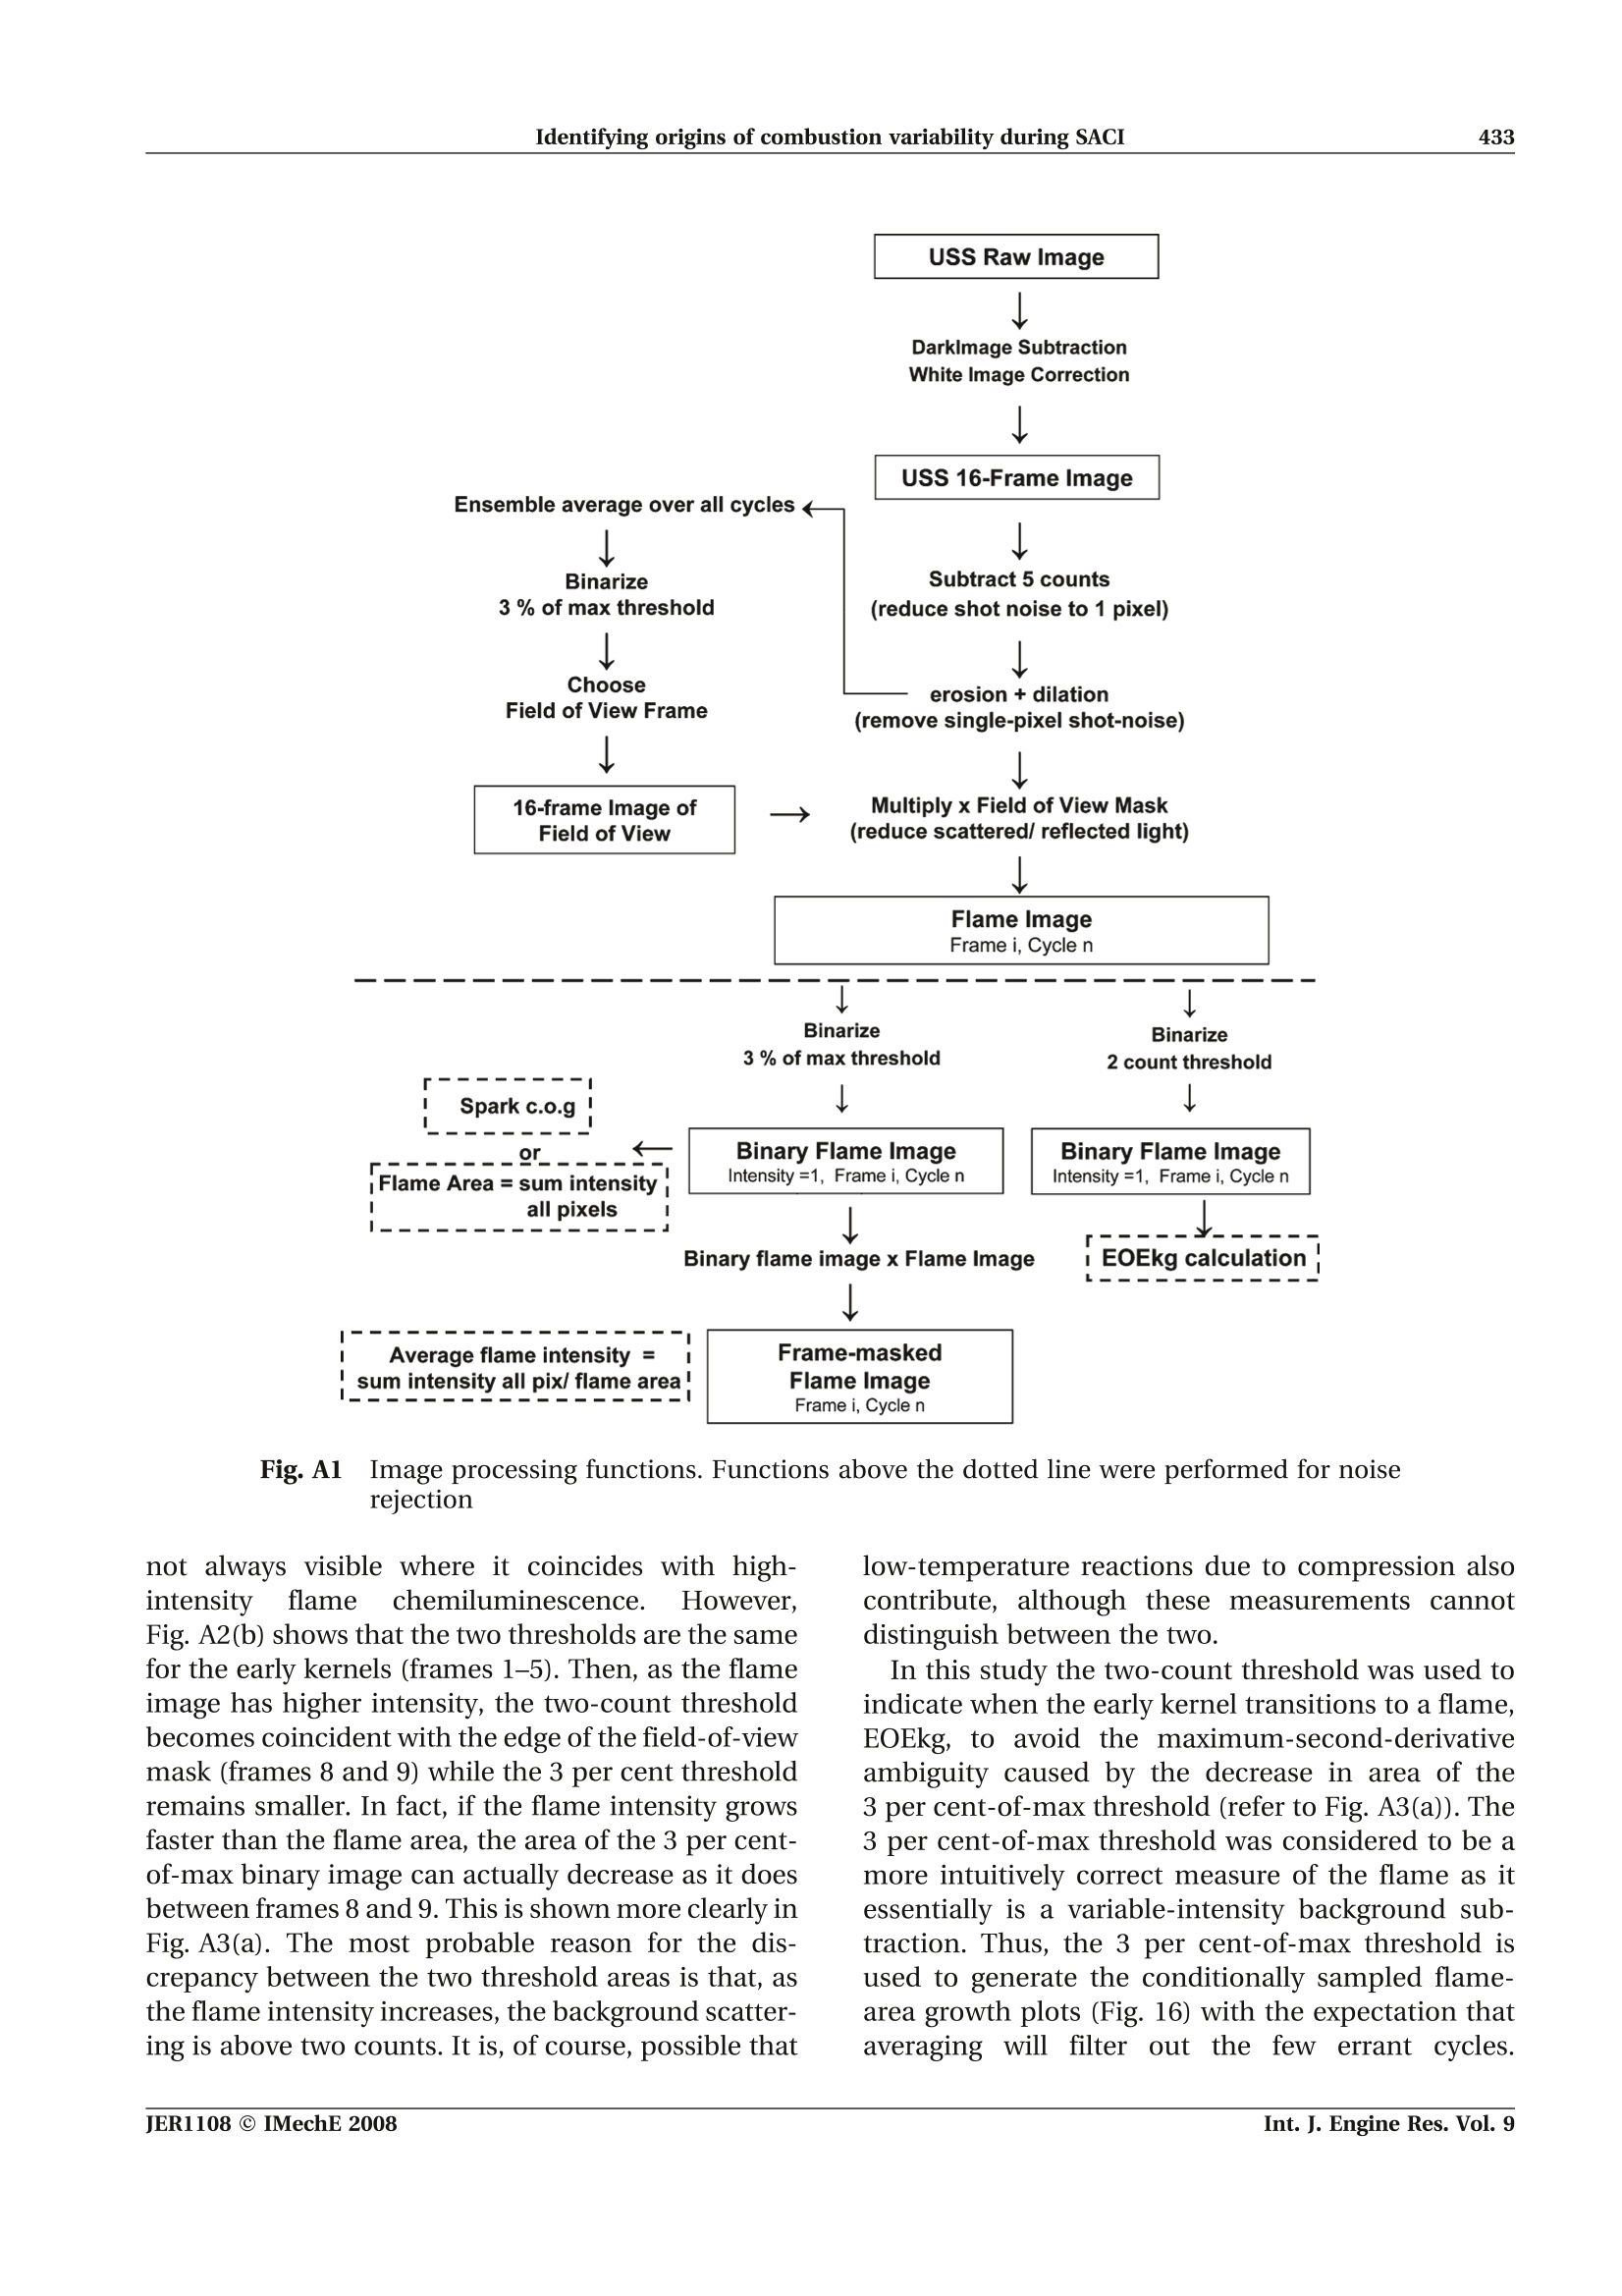
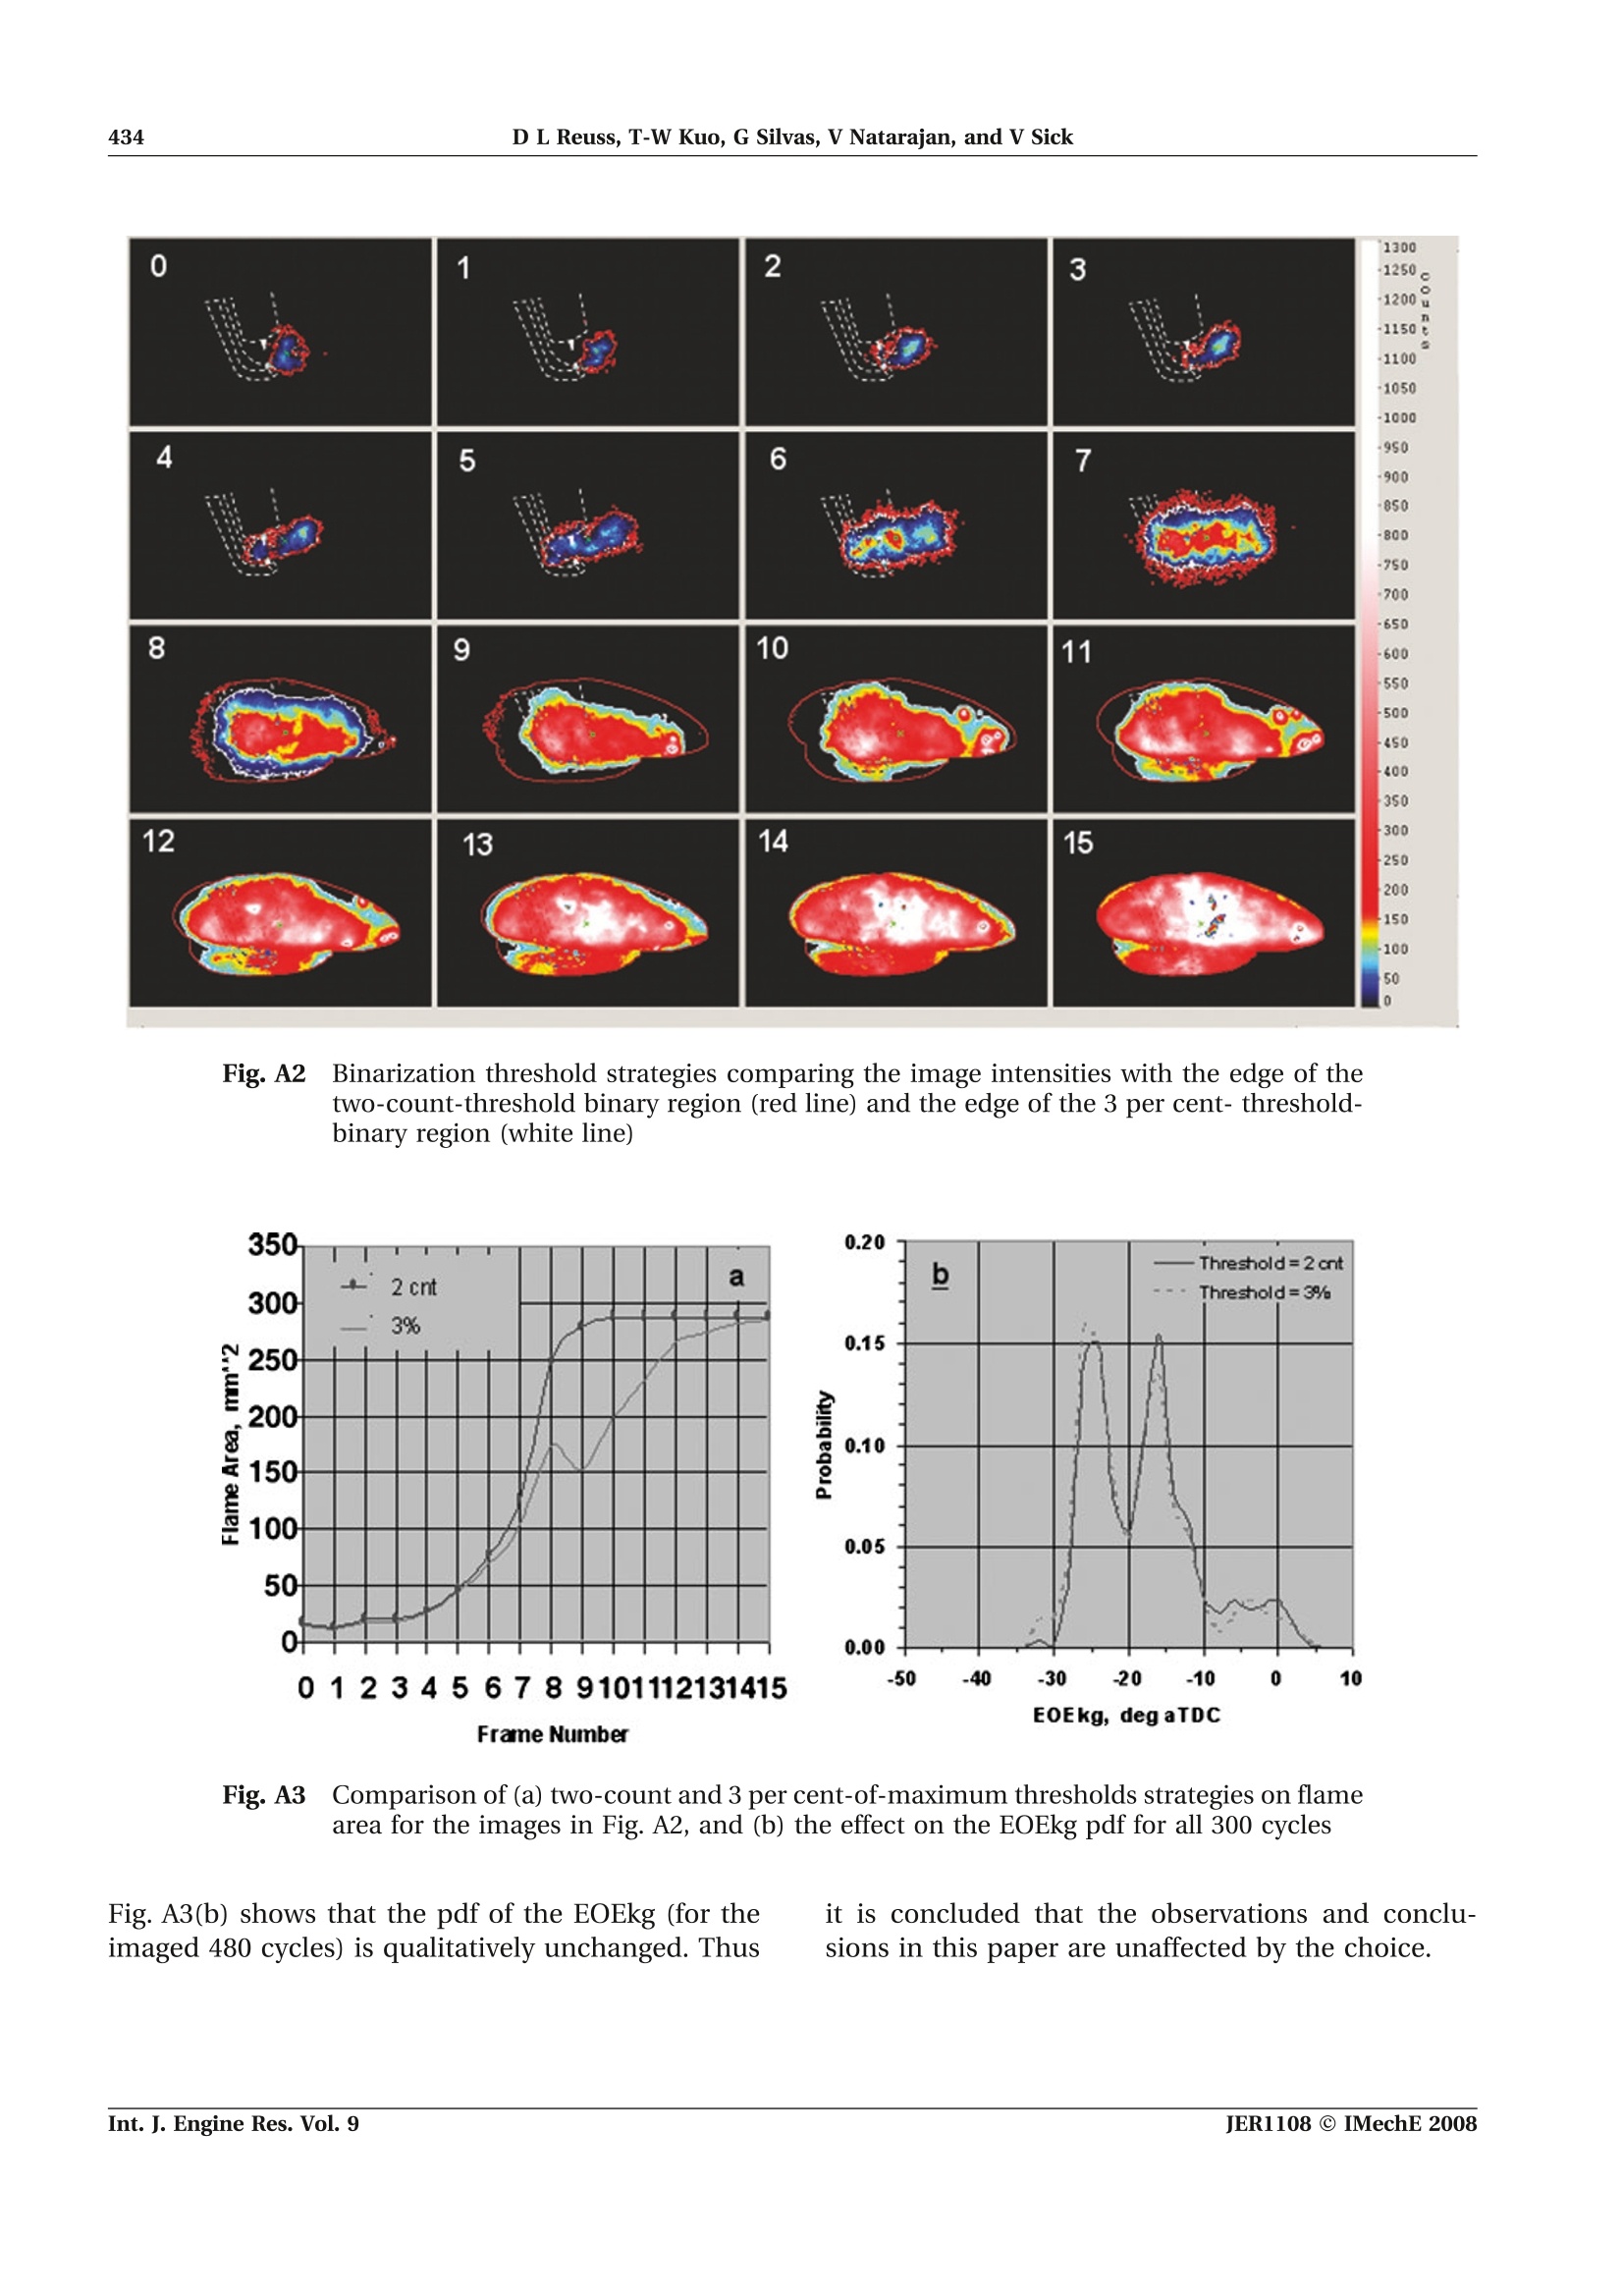
409 D L Reuss, T-W Kuo, G Silvas, V Natarajan, and V Sick410 Experimental metrics for identifying origins ofcombustion variability during spark-assistedcompression ignition D L Reuss*, T-W Kuol, G Silvas, V Natarajan, and V Sick Powertrain Systems Research Laboratory, General Motors R & D Center, Warren, Michigan, USA University of Michigan, Ann Arbor, Michigan, USA The manuscript was accepted after revision for publication on 2 June 2008.DOI: 10.1243/14680874JER01108 Abstract: Spark-assisted compression ignition, SACI, can be used to control the combustionphasing of compression-ignition gasoline engines. However, implementation of this techniquecan be confounded by cyclic variability. The purpose of this paper is to define experimentalmetrics that describe the SACI process and to demonstrate the use of these metrics foridentifying the source(s) of cyclic variability during the SACI process. This study focused on a light load condition (7 mg/cycle, 200 kPa i.m.e.p.), where spray-guideddirect fuel injection with spark ignition and an exhaust-rebreathing strategy was employed toachieve flame propagation, which led to compression ignition. This study employed acombination of measurements including pressure-based heat-release analysis, spark-dischargevoltage/current measurements, and cycle-resolved combustion imaging. Based on thesemeasurements, four distinct combustion periods were identified; namely, the spark discharge,the early kernel growth (EKG),flame propagation, and the compression ignition periods. Metricswere defined to characterize each period and used to identify the contribution of each period tothe cyclic variability of the main heat release. For the light load condition studied here, the EKGperiod had the largest effect on the crank angle (CA) position of 50 per cent mass burned, CA50.The spark-discharge event may affect CA50 indirectly through its influence on EKG. However,this could not be definitively assessed here since the camera was incapable of recording both thespark-discharge event and the flame images during cycles of the same tests. Keywords:homogeneous charge compression ignition (HCCI) engine, spark-assisted com-pression ignition, spark-assisted HCCI, cyclic variability INTRODUCTION Ignition and the burning rate of homogeneouscharge compression ignition (HCCI), engines arecontrolled by chemical reaction rates; therefore,phasing is dominated by the in-cylinder tempera-ture and composition. In practical gasoline com-pressionignition(CI) engines, the in-cylindermixture temperature varies from cylinder to cylin-der and during transients due to variations in ( *Corresponding author: G eneral Motors R&D, MS 480-106-252, 30500 Mound Road, Warren, MI 48090-9055, US A . email: david.l.reuss@gm.com ) ( H ere the combustion phasing is d e fined as the crank angle of 50 per cent mass fraction b urned, CA50. ) intake-charge ttemperature,residual-chargetem-perature and amount, and wall temperatures. Con-sequently, control methodologies are required [1, 2]. Spark-assisted compression ignition (SACI) com-bustion, is one method to achieve control of HCCI ingasoline engines. Where several studies have focusedon higher loads, especially transition from HCCI tospark ignition (SI) operation [3-9], this study focuseson phasing control at low load. As implemented withstratified-charge direct-injection in this study, SACIis achieved by injecting a portion of the fuel early inthe intake stroke to create a nearly homogeneousfuel, air, and residual mixture;;then aasecondinjection, late in the compression stroke, creates astratified charge that is spark ignited. Thus, SACIcombustionbeginsasflameepropagation ina stratified-charge spark-ignited direct-injection en-gine configuration that increases the unburned fuel-air charge to pressures and temperatures abovethose that would otherwise be achieved with thepiston compression alone. This causes CI combus-tion of the unburned gas to occur at an earlier CAthan would occur with piston compression alone,analogoustoJ6traditionalSI knock butt withacontrolled heat-release rate. SACI combustion suffers from high cycle-to-cyclevariability as demonstrated by Perrson et al. [7],which potentially has the same causes of variabilitypresent in both conventional SI and stratified-charge/spark-ignited direct-injected (SC/SIDI), en-gines. Cyclic variability of combustion phasing inhomogeneous SI engines has been traced to thespark discharge event itself; it is dominated by theflow-velocity variability, as long as the dilution level(air, residual, or EGR) is low enough to supportrobust combustion [10]. However, SC/SIDI cyclicvariability is also increased by fuel stratification andflow induced by the injection event. In principle,SACI also experiences variability during the CIcombustion; however, it will be shown here thatthe CI duration is small and actually decreases thevariability resulting from the ignition and flame-propagation phases of the combustion process. The purpose of this study is to establish measuredmetrics that characterize the SACI combustionprocess and identify the influence of each periodon CI-phasing variability; cycle-to-cycle variability ofcylinder mass and composition are not addressed here. A single light-load engine-operating conditioniss used for this demonstration (7mg/cycle fuel,200kPaai.m.e.p.). Four combustion periodsaredefined during SACI, as illustrated in Fig. 1, namely,the spark discharge, the EKG, flame propagation,and the CI periods. Thispaper describesthecharacterization and quantification of SACI combus-tion and its cyclic variability achieved using steady state emissions; pressure-based heat release; spark discharge voltage and current measure-ments: (d)imaging of the spark and combustion process. This manuscript describes the engine and com-bustion characterization in the order just enumer-ated. This is followed by a discussion identifyingthe causes of cyclic variability by correlating theignition and flame parameters against each otherand CA50. 2 BACKGROUND This background contains two sections. Section 2.1provides a description of the four periods of SACIalready defined based on the results of this study;this summary is provided prior to the results in orderto provide the reader with a perspective for thedetails that follow. Section 2.2 describes the cyclicvariability of SACI combustion, which is the motiva-tion for this study. Fig.1 Definition of the four SACI combustion periods using the imaged flame area and heat-release rate, HRR, for ensemble-averaged cycles conditionally sampled on CA50=2 ATDC 2.1 The four periods of SACI combustion This study focused on a light-load condition, wherespray-guided direct fuel injection was required toachieve flame propagation. The four combustionperiods are defined based on the spark current,measured flame areas, and heat release rate, HRR.These four periods are illustrated in Fig. 1 as thespark discharge, the early kernel growth (EKG), theflame propagation, and the CI combustion periods.The beginning of the spark discharge is the spark setpoint, CASpk. The end of the spark ignition event,EOSpk, is defined as time when the spark-dischargecurrent returns to zero and by the definition here isequal to the beginning of the EKG event. Conceptually, EKG is the period after the sparkdischarge where a small reaction kernel exists, butwith weak chemiluminescence, slow area growth,and too little heat release to be reliably measuredwith pressure-based heat-release analysis. This is alight load phenomenon where the flame is too weakto propagate strongly. Eventually heat release pro-ceeds at a more rapid rate, presumably because theearly kernel encounters a more favourable air-fuel ratio; encounters higher temperatures due to com-pression; or (c)CI combustion occurs before the kernel be-comes robust. The end of the early-kernel growth, EOEkg, isdefined as the crank angle where the second deri-vative of the flame area, dAilm/dCA, is maximum,and is defined here as being equal to the beginningof the flame propagation. This definition of the EKGperiod is conceptually similar to the model ofAbraham et al. [11], which describes an ignitionkernel in a conventional homogeneous SI engine thatfirst grows slowly on a laminar-flame timescale andthen transitions to rapid growth on a turbulent-flametimescale. The ‘flame'is defined here as the period where thechemiluminescence becomes more intense, areagrowth faster than during EKG, and the heat releaseismeasurable (Fig.1). ‘Flame’ here should beinterpreted as a convenient label rather than takenliterally, since the measured heat release may be acombination of CI and true flame* combustion, ( *Here a true’ f lame is considered t o h a ve th e properties a deflagration wave with a propagation rate t hrough a partially premixed s t ratified f uel-air m ixture t h at is co n trolled by aconvective-diffusive balance. ) which the measurements here cannot discriminate.This interpretation of the combustion is analogousto the initial slow heat release, ISHR, defined byPerrson et al. [7], which was presumed to be a flamealso.The end of the flame propagation is defined tobe the CA where the combustion transitions to CIcombustion, CATrans. CI heat release rates occurover chemical-reaction timescales and are fasterthan HRRs of turbulent flame propagation. Thus,CATrans is considered to be the time when theoverall HRR changes from the slower ‘flame’rate tothe faster CI rate, here measured as the point wherethe second derivative of the HRR, dHRR/dCA, ismaximum as in [7]. The EKG and flame period definitions are notbased on fundamental definitions of deflagrationwaves, but rather, are based on the observed ratechanges. These parameters become useful engineer-ing metrics that will be used here to define the seriesof event(s) and to identify which, if any, of the eventsdominate cyclic variability of the CI combustionphasing. 2.2CCyclic variability of SACI combustion The light-load engine-operating condition studiedhere was fuelled with 7 mg/cycle gasoline. For pureCI operation all 7 mg of the fuel was injected at -330ATDC.t The water temperature, intake temperatures,and injection strategies used for SACI (Table 1) andshown graphically in Fig. 2 were derived as follows.Firstly the engine was operated at the pure CIcondition with a hot wall (90℃ cooling water tothe head and cylinder, Twall) and the intaketemperature, Tintk, sufficiently hot (205C) to yielda location of peak pressure, LPP, equal to 9 ATDC.Next, the water temperature was reduced to 65℃,(retaining EOI=-330 and Tintk=205℃) to retardthe LPP to 12.5 ATDC. SACI was then used (retainingTintk=205°℃ and Twall=65°C) to regain 9 ATDCLPP, where 4 mg/cycle injected at EOI=-330, 3 mg/cycle injected at -45 ATDC, and spark ignitionadvanced to -45 ATDC (dotted line, Fig. 2). This wasthe minimum second-injection fuelling rate requiredto readvance the LPP, and thereby overcome theenthalpy deficit created by the cold coolant. The difference between the CI and SACI HRRs andtheir cyclic variability are shown in Fig. 3. Figure 3(a)shows the ensemble-averaged HRRs, correspondingto three extreme conditions indicated by the large ( ATDC indicates crank angle degrees after top dead centre of th e compression stroke. ) Table 1Engine hardware and operating parameters Borexstroke (mm) 86×94.6 Speed 1000r/min Compression ratio 11:1 Intake map 100.5kPa EVO1,10 mm 138 ATDC Exhaust map 101.5kPa EVC1 373 ATDC A/F 20:1 EVO2, 4 mm 378 ATDC cI SACI EVC2 521 ATDC Twall (C) 90 65 65 IVO,4mm 297 ATDC Tintake (C) 205 205 205 IVC 565 ATDC Texh port (C) 328 338 332 Piston bowl VVA3 TIvc (C) 264 265 267 Injector 8 hole, 60°, 15 cc/s Residual% 60 60 60 Fuel Indolene [22] Injection timing, EOI ATDC -330 -330 -330/-45 P fuel 11MPa Fuelling rate, mg/cycle 7 7 4/3 Spark plugs Traditional and double pin,9 mm long centre electrode Spark timing, ATDC n.a n.a -45 circles in Fig. 2. Figure 3(a) reveals that the peak,average HRR of the SACI combustion (black dotted) isphased the same as the original hot-coolant CI, whichwas expected based on LPP in Fig. 2. The condition-ally averaged HRRs of the SACI cycles in Fig.3(a)provide insight into the nature of the combustion.The curves in Fig. 3(a) are ensemble averages of theindividual-cycle HRR(CA) curves conditionally sam-pled on those cycles for which the CA at 10 per centmass-burned fractions, CA10, occurred at -10.6 and-2.6± 0.5 ATDC (red and blue dotted). Consider firstthe early burning cycles CA10=-10.6; these earlySACI cycles have nearly the same phasing as the hotwall (90°℃) CI operation but with more heat releasebetween -20 and-5 CA (albeit slow compared to theprimary heat release), which here is attributed toflame propagation. The late CA10 cycles are phasedlater than the pure CI at the same fuelling rate andcoolant temperature. These conditionally averagedHRR curves demonstrate that the ensemble averageof all SACI cycles is a poor representation of either the Fig. 2Combustion-pressure phasing used to establishthe SACI operating condition early or late SACI cycles, implying high cyclicvariability. The cyclic variability is shown succinctlyin Fig. 3(b), where both CA10 and CA50 of SACI havefive times the range compared to that of either hot orcold coolant CI. The phasing variations in Fig. 3(b)result in the i.m.e.p. variations shown in Fig.3(C),which directly affect the noise, vibration, and harsh-ness engine operation. Revealing the causes of thisvariability was the motivation for this study. Figure 4(a) shows i.m.e.p. versus the amount offuel burned during a given cycle; this demonstratesthat i.m.e.p. variability is directly related to theamount of fuel burned during a given cycle.Combining the results of Fig.4(a) with Fig. 3(c),Fig. 4(b) shows the relationship between massburned per cycle and CA50, and implies that earlycombustion phasing is required to burn more of thefuel or vice versa. The plot of CATrans and CA10 inFig. 4(c) demonstrates that the transition to CI atthis operating condition always occurs after 10 percent of the mass has burned, CA10, and that thephase variability of the main combustion (CI) isestablished prior to both CATrans and CA10. Thus,to determine the cause of the cyclic variability incombustion phasing, it is necessary to investigatevariability prior to CA10. Since accurate heat releasecalculations from the cylinder pressure are notor-iously difficult prior to CA10, the spark and imagingdiagnostics were employed as described below. 3EXPERIMENTAL HARDWARE ANDPROCEDURES The experiments herein required four recordingsystems and correlation of the data from each.Steady state engine-out emissions were recordedaveraged over the duration of each 300-cycle test. In-cylinder pressure was recorded once per CA for all300 cycles and used for individual-cycle heat releaseanalysis. Spark-discharge voltage and currents were 35 CI, Twall-90C, All Cycles CI, a 30 Twall=65C, All Cycles ··SACI, Twall-65C, All Cycles ·SACI,Twall-65C, ca10=-10.5 25 ·SACI,Twall-65C, ca10=-25 · SACI, Twall=65°C, covlMEP=10 50 · Cl, Twall=65°C, covlMEP= 7 CI, Twall=90°C, covIMEP= 1.6 0· -5 0 5 10 15 20 ca50 Fig. 3 Comparison of heat release parameters for thethree operating conditions indicated by thelarge circles in Fig. 2 - Cl, ·SACI, Twall=65°C,covlMEP=10 Twall=65°C, covlMEP= 7 a , R2=0.99 Burned Fuel (mg) b Fig.4 Correlation. oCf individual-cycle heat-releaseparameters Fig.5Optical engine and piston configuration recorded with a digital oscilloscope at 1/us intervalsduring the glow discharge of each engine cycle.Images of the spark-discharge plasma channel andthe subsequent combustion were recorded using ahigh-speed framing camera. Images could be re-corded only every third or fourth cycle. Therefore, sixtests of 300 engine cycles/test were recorded at eachoperating condition to sample 480 imaged cycleswith corresponding heat-release data. The equip-ment, procedures, and the measured parameters aregiven in this section. 3.1 Engine configuration and operation The engine used in this study, illustrated in Fig. 5, isan optical single-cylinder SIDI engine with a circularpiston bowl [12]. This is5Ca four-valve pent-roofengine with centre injector and centre spark pluglocated in a spray-guided SIDI configuration (SG/SIDI). The geometric characteristics and operatingparameters are listed in Table 1. The photographand schematic in Fig.5 show one of the twowindows at either end of the pent-roofed combus-tion chamber, a window in the piston bowl, and theextended Bowditch-type piston. For the tests described in this paper, an all-steelpiston top and a water-cooled chrome-plated steelcylinder were used. A single one-piece Rulon pistonring was used as suggested by Miles and Steeper [13]but with the addition of a felt oiler ring where the second compression ring would otherwise have beenlocated. This ring arrangement provided blow-bythat was less than 1 per cent of the trapped chargeand allowed consistent steady state engine operationin excess of 3 h. CI combustion was achieved using an exhaust-rebreathing strategy, where high in-cylinder gastemperatures are realized at intake-valve closing,(IVC), by reopening the exhaust valve during theintake stroke (Fig. 6). In these tests 60 per centresidual mass was realized. In addition, the intake Fig.6 Intake- and exhaust-cam profiles for rebreath-ing operation Fig.7 Field of view (a) back lit and (b) back lit with spray and spark discharge plenums and runners were heated to the desiredintake temperature to minimize thermal gradients inthe fresh charge. The exhaust runner and plenumwere electrically heated to 400 C to minimize heatloss from the burned gases during exhaust andreingestion. An 8-hole, 60° included cone angle (see Table 1)injector was used with one spray jet targeted at, butjust below, the spark plug gap (Fig.7(b)). A high-energy ignition system was used, which producedon average 67 mJ to the plug. Two different sparkplugs were used here, both with a 9 mm, centre-electrode reach. A spark plug with traditional flatelectrodes was used in the initial tests; data fromthis spark plug is used in Figs 9 and 10 to demon-strate the correspondence between the imaging andelectrical characteristics. A spark plug with smalliridium pins on both the centre electrode andground strap was used for all other tests presentedhere. Both are 5 k resistive plugs and thus 52 mJ ofthe 67 mJ was delivered, on average, across thespark-plug gap. 3.2 Pressure-based combustion analysis andemissions The cylinder pressure was measured with a Kistler6125 piezoelectric transducer with a slotted flamearrestor and fitted through the water jacket into theridge of the pent-roofed head. The pressure wasrecorded once per CA. The pressure-based combus-tion analysisis(HRR versus CA and mass-burnedfraction, (mbf), versus CA) was computed for thepressure record from each cycle and then averagedover alll cycles, but modified for the CI andrebreathing operation. To compensate for the heat-loss for the CI operation, the Woschni heat-loss correlation constant C2 was set to zero assrperChang [14], to suppress the pressure correctionnormally used for analysis of SI combustion withflame propagation. The heat-loss totalled over allcycles was adjusted to balance with the work plusfuel energy delivered over all cycles. The deliveredfuel was measured with a positive-displacementmeter to 0.1 mg/cycle, and the average deliveredfresh air measured with choked-flow orifices to1 per cent. To compute the trapped-residual-massfraction with the rebreathing cam, the volume ofthe fresh charge at IVC is computed assuming all ofthe delivered average fresh charge is trapped and atthe average intake temperature and MAP. Theremaining cylinder volume is assumed to be filledwith residual that is at the same average tempera-ture, pressure, and composition measured in theexhaust port. Since the exhaust temperature andcomposition are averaged over 300 cycles and thepressure of each cycle waspegged(in-cylinderpiezoelectricpressuree:transducerreadjustedttointake manifold absolute pressure to account forcharge drift) at -180 ATDC compression, the onlymodelled cycle-to-cycle variations in the residualmass fraction are those due to differences in thepressure at IVC. Finally, the mbf computed bythe heat release code is less than that indicated bythe combustion efficiency from the exhaust emis-sions; the combustion efficiency is based on thedelivered fuel whereas the final mass computedin the heat release is based on the trapped fuel(delivered plus rebreathed). A standard engine-emissions bench was used for..exhaust-gasmeasurements and analysed asperStivender [15]. This provided the steady-state en-gine-out emissions averaged over the duration of the300 cycle tests, including hydrocarbons, O2, CO2,CO, NO. The air-fuel ratio (AF), based on oxygen and carbon balance were computed. All three valuesof AF (based on emissions oxygen balance, emis-sions fuel balance, and the previously describedmeasured fuel and air flowrates)s)were 20:1 andagreed to within a 0.5 ratio. The single-cycleheat-release analysis was used tocompute five one-per-cycle parameters for charac-terizing cyclic variability. In particular, CA10 crank angle ATDC of 10 per cent mass-burned fractionCA50 crank angle ATDC of 50 per cent mass-burned fractionCA90 crank angle ATDC of90 per cent mass-burned fractionFmbf the final mass-burned fractionCATrans crank angle the combustion transi-tioned to CI CATrans was computed as the CA of maximumsecondderivative ofthe.eHRR(d²HRR/dCA2:justified based on the arguments given in section2. These parameters were tabulated and cross-correlated with the image and spark-dischargeparameters discussed in the following sections.CA50 is used to quantify the combustion phasingof the main portion (CI) of the heat release. It isalso used conditionally to sample cycles withinthe heat-release analysisIstoDiaverage data fromcycles with like phasing. Conditionally sampledensemble averages of the cycle-resolved measuresHRR(CA), mbf(CA), and flamee area,Aflm(CA)were computed for the SACI operation also (e.g.Fig. 1). The heat release code was modified to identifycycles that had image and spark-discharge recordsand to register these cycles withi the pressurerecords. Cycle identification was necessary becauseimages and spark-discharge records were not avail-able every engine cycle. Specifically, each engine testrecorded 300 cycles of pressure data; however, thefirst image did not occur on the first recordedpressure cycle and images could be recorded onlyevery third or fourth engine cycle, randomly.Furthermore, although the oscilloscope could recordspark-discharge data on every cycle, it experiencedrandom drop-out also. Thus, cycle identification wasrequired and accomplished by recording the oscillo-scope-time-base gate and the image-intensifier gatealong with the in-cylinder pressure. The conditional-sampling algorithm was used to compile a table thatrelated the pressure-data-cycle number with theimage-record number, and spark-discharge-recordnumber. 3.3 Imaging A high-speed framing camera (LaVision Speed Star)with a lens-coupled intensifier (LaVision IRO) wasused for recording both the spark-discharge plasmachannel and the combustion chemiluminescence.The camera has a dynamic range of 12 bits with anoverall gain of approximately 6. The spatial resolu-tion here was 1.9 pixel/mm. For these tests theframes were recorded at up to 1 per CA (167 us)per image with 40 us gated-intensifier exposuretimes. The camera records one 16-frame image percycle at approximately 3/s; this was imposed by thetransfer time of the images to the random-accessmemory (RAM) of the host computer. The limitationof 80 images per test, noted in the previous section,was imposed by the 2 Gbyte RAM on the hostcomputer. A Halle 50mm f/2.5 UV lens with a 375 +25nmoptical bandpass filter was used to image either thespark-discharge or the combustion chemilumines-cence. This filter was used for imaging the spark-discharge as it is centred about the cyanide (CN)emission wavelength; this was used for spark-discharge AF measurements as described in the nextsection. The same filter was used for imaging the CIcombustion chemiluminescence, as it removed Cchemiluminescence from rich burning as well asincandescence. The filter resulted in imaging of boththe flame-kernel and HCCI combustion chemilumi-nescence; this filter is presumed to capture chemi-luminescence from both HCO* and the CO+0→CO2+hv continuum during combustion [16]. The spark discharge and flame propagation couldnot be imaged during the same tests for two reasons.Firstly, all 16 frames were required to resolveadequately either the spark-discharge (1 image/CAfor 15°) or the flame propagation (1 image/2.5 CA for35°) but were insufficient to do both. Secondly, theearly kernel imaging required 100 per cent gain toassure that the earliest kernels were detected. Thehigh intensity of the spark discharge would havedamaged the intensifier. For both reasons, the sparkdischarge and early kernel development had to berecorded during separate tests. Because the spark plug gap was in the bowl atTDC, it was not possible to image perpendicular tothe window in the head. Instead, the camera wasangled down 14±1° as shown in Fig. 8. Thisprovided a view of the spark-plug electrodes albeitdistorted. It caused a further complication; lightemitted or scattered from the top of the combustionchamber and above the direct field of view wasreflected into the imaged field of view via the bottom Fig.8Camera field of view and reflections from the bottom of the window surface of the window. This is illustrated by thedotted line in Fig. 8. An image of the bowl, sparkparflug, and combustion chamber are showninFig. 7(a) while illuminated with a white light. Thedouble images shown in Fig.7(a) are a result ofreflections illustrated in Fig. 8. The ramifications ofthe reflected images on the image processing will bediscussed. 3.4 Spark-discharge measurements and analysis The spark discharge event was recorded both bymeasuring the electrical discharge and by imagingthe plasma channel. Several metrics were computedfrom the spark discharge secondary-voltage andsecondary-current measurements and correlatedwith CA50. Plasma-channel excursion, measuredfrom the images, was correlated with CA50. 3.4.1 Electrical measurements The secondary voltage and current were recordedduring each engine cycle with a digital oscilloscope(time-based) sampling once per us. A Tektronix 60151high-voltage probe and a IPearson1100 currentmonitor (with a 100×1Mhz amplifier) were usedfor this purpose. An example of the record from adischarge is shown in Fig. 9(a). This shows anunresolved breakdown and arc discharge followedby the long glow discharge. The beginning of thedischarge, SOSpk, is measured as the time of thecurrent rise, and is set equal to the spark angle onthe CA encoder based engine-controller spark angle.The end of discharge, EOSpk, was defined as thetime at which the current returned to zero andgenerally was coincident with the disappearance ofthe plasma channel images. The voltage signal after Ispk=0 is the dissipation of the residual charge in thecoil. The following spark-discharge parameters werecomputed for each cycle from the spark-dischargecurrent and voltage records. Egap total energy delivered to the gap Pgap total powertspk spark discharge durationIcN/E; spark AF dV/dtspk voltage-decay rate Egap and Pgap were computed by integrating theproduct of the voltage and current between thebeginning (breakdown) and end of the discharge(I=0) minus the energy lost to the plug resistance.The duration is the time from SOSpk to EOSpk. Icn/E; was used as a measure of the AF in the spark-pluggap at SOSpk, AF as described by Fansler et al. [17],where Icn is the intensity of the CN emissionsrecorded by the intensified camera averaged over thefirst image after the spark breakdown and E; is thedischarge energy delivered to the gap during thecamera exposure.dV/dtdur was used in an attempt tocharacterize the velocity attheie spark plugasdescribed by Maly [18, 19]. This was found to beinadequate. Instead, imaging was used to record themaximum plasma-channel excursion during eachcycle as described in the next section. 3.4.2Imaging of the plasma channel To indicate the effect of the flow on the discharge,the spark-discharge plasma channel was imaged andthe maximum excursion of each cycle computed.A single parameter was used to correlate the cycle-to-cycle spark-dischargeplasma-channel excur-sions with cycle-to-cycle variations in combustion Fig. 9 (a) Current and voltage record and (b) binarized image of a plasma discharge form thesame cycle. The x’marks the c.o.g. position computed from each image phasing, namely, MaxXcog,=maximum distance (during a cycle)from the centre of the electrode gapto the plasma centre of gravity. To measure this, one 16-frame image per cycle wasrecorded of the spark-discharge channel taken at aframing rate of one per CA (0.167 ms) for 15 CAs(2.5ms). The 2.5 ms range was adequate for deter-mining the maximum excursion, in spite of the factthat there was a small percentage of cycles thatlasted up to 3 ms; 2.5ms was adequate becauselonger duration discharges occur in cycles with littleflow and therefore little or no plasma-channelexcursion. The voltage and current traces from acycle are shown in Fig. 9(a) along with the intensi-fier-gate signal. Processed images of the spark-discharge plasma-channel in Fig. 9(a) are presentedin Fig. 9(b). The outline of the spark-plug electrodesis superimposed for the purpose of illustration. Theoriginal images of plasma intensity were binarized atan intensity value of 0.03 times the maximumintensity within each image; thus, the thresholdchanges from frame to frame. This frame-to-framethreshold variation1 compensatesfor thelargechange in dynamic range during the dischargeof each cycle and from cycle to cycle. Note that the lastt two imagesdisappeared becausetheplasma chemiluminescence intensity falls belowthe threshold. To quantify the excursion of the spark channelfrom the gap, the centre of gravity (average centre ofarea), Xcog=(x"cog+y cog)1/2 was computed for eachframe and tabulated for each imaged cycle. The Xcogfor each frame is shown by the green ‘x'in Fig. 9(b).The maximum excursion of the channel, MaxXcogduring each cycle was then tabulated and correlatedwith other metrics in the spark and combustionprocesses. It is assumed that the impedance varia-tions due to temperature and composition variationsare small, and thus the cyclic variation of the sparkchannel excursion is dominated by the momentumof the velocity field. 3.5 Chemiluminescence-image analysis The combustion chemiluminescence was imagedfrom the CA immediately after EOSpk and thentaken every 2.5 CA thereafter. Thus, each 16-frameimage started at a different CA from engine cycle toengine cycle depending on the duration of theparticular discharge. Thiss is illustrated for twodifferent cycles in Figs 10(a) and (b), which showsthe first three intensifier-gate timings for a short and Fig. 10Spark voltage and current records from two cycles illustrating the variable start-of-imageacquisition long spark discharge respectively. The first imageframe was triggered 40 us (1/4°CA) after the spark-discharge current fell to zero to assure the dischargeplasma luminescence was over and thereby avoidintensifier damage. Since the spark-discharge dura-tion range was from 1.15 to 2.5 ms, the first frame ona given cycle was from -38 to -28 ATDC. Sixteen-frame images from the same SACI cycleare shown in Fig. 11, where Fig. 11(a) is displayedwith a linear scaleand 11(b) is displayed with a non-linear scale to enhance the low-intensity earlykernel. Each image was processed to remove therandom-pixel background noise, which was presentdue to the 100 per cent intensifier-gain setting. Also,a mask (Appendix 2) was applied as evident by theboundary in the last frame((+3.7ATDC). Thedynamic range is large because the early kernel hascounts as low as 1 and as large as approximately 4kin the most intense cycles. The one count isconsidered significant during the EKG period, sincethe image-processing noise-rejection procedures(masking and shot-noise removal procedures de-scribed in Fig. Al of Appendix 2) were sufficientlysevere that images with no early kernel (the weakestof the intensity) had no pixels above 0 count. Thus,the algorithm erred on the side of missing imageswith extremely weak chemiluminescence to assurethat one count was valid. The goal of this severecount removal was to assure that little or no noisecontributed to the flame area at the risk of losingvery weak early kernels. As the transition to flame was a robust intensity change, this does not affectthe computation of EOEkg,which isthe onlvquantitative metric used here. 3.5.1 Definition offlame parameters The images of the flame chemiluminescence wereanalysed to determine the following parameters. Aflm flame/kernel area in each frame 1flm average flame intensity in each frame EOEkg CA at the end of EKG Theparameterscomputeddffor the imagesinFigs 11(a)and (b)aare plotted in Fig. 11(C). Tocompute the flame area, the images were binarized(O's and l's,1=flame area, threshold to be dis-cussed) and the pixels summed to give the flamearea in that image. The average flame intensity wasdetermined by multiplying the intensity of eachframe by the binarized flame area in that frame andaveraging over that area. EOEkg was determinedfrom Aim(CA) as the crank angle where the secondderivative of Aflm(CA) is maximum. This is justifiedby the observation that the early kernels and thesubsequent iflame had distinctly different area-growth rates, as shown in the individual cycle ofFig. 11(c) and the conditionally-averaged curve inFig.1. Two different thresholds were used for binarizingeach image frame, a fixed ‘2-count’threshold was crank angle,aTDC Fig.11 Flame images from one cycle presented with (a) a linear intensity scale and (b) a non-linear scale. The flame areas computed using the two-count and 3 per cent filters areshown in (c) used to determine the EOEkg and a‘3 per cent-of-max’was used to define flame areas during the flamepropagation period. The two-count threshold wasfound to be best for identifying the end of the EKG event since the EKG had weak luminosity and nobackground noise. Also, it provided a single max-imum second derivative on the Aflm(CA) curve (c.f.the curves in Fig. 11(c)); which is unambiguous for detection of the second derivative. However, thetwo-count threshold overestimated the area duringthe flame propagation period because of the muchbrighter background scattering; thus the two-countthreshold would binarize most of the masked region.The high background light intensity could be fromeither or both of the (a) scattered chemilumines-cence from the combustion chamber walls, or (b)early, low-intensity CI chemiluminescence. The ‘3 per cent-of-max'binarization threshold setequal to one, all pixels whose intensities in a framewere greater than 3 per cent of the maximumintensity. This approach compensated for the verylarge dynamic range (>10’) of the chemilumines-cence intensity during the flame propagation period,since it automatically tracks the flame-intensityincrease. Furthermore, it rejects the increased back-ground noise that occurred with increased intensity,and thereby produces a flame area that agreed withwhat could intuitively be seen by eye.* The 3 percent-of-max threshold could be used to determinethe EOEkg, but produced noisier results. A directcomparison of the two-count and 3 per cent-of-maxthresholds revealed a 1:1 correlation with about 5 percent outliers (Appendix2). When cycles correspond-ing to these outliers were investigated, it was foundthat the 3 per cent-of-max threshold would producetwo maximum second derivatives because the max-imum-intensity increase from one frame to the nextcould sometimes produce a smaller area. This can beseen by comparing the two Anm(CA) curves inFig. 11(C). In any case, the major use of the thresholdwas to define the end of the EKG and estimate theobservable flame area; the use of one threshold overthe other does not alter the conclusions in this study. 4 RESULTS 4.1 Discrimination of flame and CIchemiluminescence 4.1.1 Flame discrimination in single cycles withhomogenous mixtures Discriminating between a flame and CI is difficultbecause chemiluminescence images from both typesof combustion are spatially inhomogeneous [20, 12].Also, imaging is a volume integration; thus, at anygiven time both processes may be occurring indifferent regions of the volume. CI and SACIcombustion could not be separated with spectral ( *The u se of intensity t o d iscriminate b etween f l ame and CI chemiluminescence is fully discussed in section 4. ) Fig.12(CI of homogeneous mixture (a) with and (b)without SI filters because the spectral signatures overlap. In thisstudy the intensity was used to define the spark-assisted combustion, which have here been pre-sumptuously labelled as early (flame) kernels andflame propagation leading to CI. Of course, this isnot rigorous but is based on empirical observationsmade in both homogeneous and fuel-stratified in-cylinder charges. The use of intensity to discriminatebetween ‘flame’and CI combustion is justified asfollows. First, consider the case of spark ignition in ahomogeneous mixture that creates a reaction kernelwith greater intensity than the CI but does notcontribute to the heat release. This is demonstratedin Fig. 12, which shows images from two differenthomogeneous cycles (single-early injection, 7.5 mg/cycle) at different intensifier gains, one cycle withand one cycle without spark discharge. These imageswere taken in this engine using a multi-framing CCDhaving a direct-coupled intensifier (LaVision, StreakStar) with an optical bandpass filter at 375 ±25 nm,which has higher sensitivity than the lens-coupledframing camera (LaVision, Speed Star). Figure 12(a)shows pure CI operation, which produces chemilu-minescence that is spatially uniform. Figure 12(b)shows the same operation with the spark turned on;the spark created a localized high-intensity chemi-luminescence region that grew in spatial extent,albeit slowly, and was eight times more intense thanthe HCCI chemiluminescence at the same CA. Thelatter image is interpreted as chemiluminescencefrom a reacting kernel initiated by the spark. Theengine-combustion phasing based on LPP and heatrelease analysis was unaffected by the spark atthis high-dilution and low fuelling rate. The pointhere is that even in a very homogeneous highlydilute environment, where the spark assist did not contribute to compression ignition (i.e. was notdetectable with heat-release analysis and did notalter the combustion phasing), the reaction kernelcould be discriminated from the CI combustionbased on intensity. As noted in the introduction, it isnot possible to proclaim that this is a true flame, butit is reasonable to assume the chemiluminescence-intensity increase isaan indication of a reactingkernel. 4.1.2 Flame discrimination in individual cycles withstratified mixtures Next, consider the applicability of flame discrimina-tion based on intensity with fuel-stratified engineoperation, where spark-assisted combustion does affect combustion phasing. Here, the intensity of thespark-ignited reaction kernels from three individualcycles during the fuel-stratified SACI engine opera-tion characterized in Table 1 is compared. Thepurpose is to demonstrate, in detail, SACI combus-tion evolution during three individual cycles withearly to late phasing. Figure 13 showss116-frameimages from three different cycles corresponding toCA50=-2,+2, and +8 ATDC. The 16 frames on theleft of each image were binarized with a 3 per cent-of-maximum value as described previously; theframes to the right are the original images displayedwith the non-linear scale of Fig. 11(b). The EOSpk,EOEkg, and CATrans are indicated based on thespark-dischargemeasurements,, image analysis,and heat-release analysis respectively. The heat- Fig. 13Binarized images and intensity images of cycles with (a) early, (b) late, and (c) no EKGafter spark xc Fig.14HRR: (a) flame area and intensity; (b) for thethree cycles shown in Fig. 13 release curves, flame area, and spatially-averagedflame intensity corresponding to these three cyclesare presented in Fig. 14. In all three cycles a reactionkernel existed at the end of the spark discharge, EOSpk,as indicated by the binarized images where a kernelexists in the first frame of all three images. Consider-able variation exists after this first image. In Fig. 13(a), the cycle with the earliest CA50, thereaction kernel chemiluminescence waspresentimmediately after EOSpk, remained visible as it grewin spatial extent until it filled the entire field of view.Comparison of Fig. 13(a) with Fig. 14 reveals thethree periods of combustion following spark-dis-charge. During the EKG period (EOEkg-EOSpk) thearea and intensity of the reaction kernel change littleand no significant heat release occurs. During theflame period (CATrans-EOEkg) the reaction kernelarea and intensity grow significantly along withsignificant heat release. During the CI period (CA>-CATrans) the area cannot grow since the chemilumi-nescence fills the field of view. However,the HRR andintensity grow at a significantly faster rate. Figure 13(b) shows a spark-assisted cycle that,although delayed, still advanced the combustioncycle earlier compared to a pure CI cycle. In thiscycle, the kernel that existed at EOSpk almostdisappeared until -18.5 ATDC. The disappearanceoccurs because either the kernel was behind the plug, )the kernel intensity became low and undetect-able, and/or (c)kernel moved into the bowl and returned The description of the three combustion periodsgiven for the cycle of Fig. 13(a) apply identically toFig. 13(b) except that the duration of the EKG periodis longer for the latter. Figure 13(C) shows a very late burning cycle wherethe initial kernel disappeared, and there was noindication of flame propagation in either the imageor heat-release analysis, essentially a pure CI cycle. Achemiluminescence image appeared only after theHRR transitioned to high values consistent with CIcombustion at CATrans=-1ATDC. No chemilumi-nescence was detected prior to CATrans where there isan almost constant near-zero HRR. This low HRRprior to CATrans is always observed in late SACI cyclesand is always observed in pure CI engine operation(early-injection). Although this could be due toinaccuracy of the heat-release/heat-transfer model,it is reasonable that a small amount of heat releasedoes exist due to the hydrocarbons and CO in the 60per cent rebreathed residuals. There could in fact be aconstant HRR release but no chemiluminescence wasrecorded because it did not exist, the intensity was tooweak to be detected by this camera, or the chemilu-minescence was hidden from the field of view. The images of the three example cycles in Fig. 13demonstrate that the intensity-based discriminationof the flame is reasonable both in the homogeneousand the fuel-stratified spark-ignited mixtures, at leastto the end of the EKG period. The images alsodemonstrate that there is a time between the endof the spark discharge and the beginning of thedetectable heat release (beginning of the flame) whena reaction kernel exists, as evidenced by the chemi-luminescence, that may grow quite slowly or dis-appear. The end of this EKG period is followed by amore rapidly growing reaction kernel (labelled here asa flame) that shows both higher HRR and increasedchemiluminescence.Thiscomparisonbetweenimages and the analysis also demonstrates that (a) EOEkg and the beginning of the heat-releaseagree; (b)CATrans occurs at the same time that thechemiluminescence fills the field of view andhas an intensity that begins to exceed that of theflame.0. The importance of (a) is that EOEkg is a validmetric to describe the beginning of the flame, whichwill be used to determine the phase delay between the end of spark and beginning of flame propagationwith measurable heat release. The EOEkg based onreaction-kernel area rather than the HRR is betterbecause dAfm(CA)/dCA is a larger and moredefinitive change compared to either dP(CA)/dCAor dHRR(CA)/dCA. Point (b) provides a visualcorroboration that CATrans, which is determinedby the heat release analysis, occurs at the beginningof the spatially distributed compression-ignitionevent. These conclusions have been demonstratedhere for only three example cycles as it is impracticalto publish many more. However, these conclusionshave been observed to be true for many cycles frommany different tests. 4.2Definition of EKG and flame combustion In this section the image-processing techniquesdemonstrated in Fig. 13 are used to show that the Alm(CA) trends in Fig. 14 are applicable beyondthese three cycles. Figure 15 shows the flame area growth, Aflm(CA),of many cycles conditionally sampled on CA50; eachcycle-resolved plot begins at the EOSpk for itsrespective cycle. Figure 15 demonstrates that thefeatures of Aflm(CA) observed in the three cycles inFig. 14 can be generalized. Namely, there exists (a)a slow or no area-growth-rate EKG period afterEOSpk, followed by (b)a relatively linear area-growth rate that achieves(c)a maximum and constant area once the com-bustion image fills the field of view. Figure 15 also demonstrates that (using the heavyline located at 10 ATDC as a guide) the duration ofthe EKG increases with CA50 delay. The success ofthe conditional sampling in classifying the early andlate Aflm(CA) curves provides confidence that the Crank Angle deg aTDC Fig. 15Cyclic variability of the engine cycles conditionally sampled on CA50 NEE 之工 ensemble averages conditionally sampled on CA50can be used to represent the EKG and flame periodsof the individual cycles with like phasing (CA50). Figure 16 plots conditionally sampled ensembleaverages cA50 and CA50, forthe four different values of CA50 used in Fig. 15. Theblack lines (of equal slope) demonstrate that thearea-growth rates have approximately the samelinear growth rate after EOEkg, with the possibleexception of the very late cycles of CA50=+6, whereCI rather than flame combustion is dominant.* Thetriangles, EOEkg, and filled circles, CATrans, onFig. 16 are the conditionally sampled averages of theindividual-cycle values; thus, their position does notprecisely match the maximum-second-derivativepoint of the conditionally sampled averages. Thefollowing points can be made from Fig. 16. 1. A benign combustion period (small area growthdefined here as EKG) after the spark dischargeexists with no detectable heat release. 2. EKG is followed by a period, defined here as aflame, of detectable but low HRR (based on ( *Cautionary note: w e c a nnot de f initively c o nclude that th i s linear growth i s a fundamental physical property both b e cause these are two-dimensional projections o f t hree-dimensional flames'and b e cause t h e flame growth in t h e bowl is not in t hefield ofview and thus t he camera is not r ecording all ofthe flame area. ) pressure analysis) and linear area growth (basedon the image analysis). 3. A short EKG period advances the CI combustionas measured by CA50. The functional forms of the curves in Figs 15 and16 are not important since, for the purposes of thisstudy, the timing and duration of the EKG and flameperiods only need be identified. Specifically, Figs 14and 16 demonstrate that the EOEkg, computed fromthe Aflm(CA) measurements, occurs at the firstdetectable rise in the HRR curve and is a consistentdemarcation between the slow-growth EKG and fast-growth flame periods both for the single cycles andthe conditionally sampled ensemble-averages ana-lysis. Further, CATrans, computed from HRR(CA)occurs when the Aflm(CA) becomes constant as it fillsthe field of view. Thus, Aflm(CA)and HRR(CA)provide mutually consistent metrics of the combus-tion process and EOEkg and CATrans, it is con-cluded, are valid metrics to quantify the boundariesbetween EKG-flame and the flame-CI periods. 4.3 Cyclic variability of combustion phasingduring the four combustion periods The contribution of each of the four periods to cyclicvariability is assessed. To accomplish this, CA50 iscorrelated with the end of each period, EOPeriod, inFig. 17 and the duration,i, t, of each period to a) EOSpkR?=0.07 EOEkg R²=0.73 EOFlameR=0.88 EOCIR2=0.98 EOSpk EOEkg Fig.177 Cyclic variability of the combustion periods (a) and the corresponding pdfs, (b)-(e) 0.5 -d) Flame Duration 0.4 0.3 0.2 0.1 小0·++++++++ +++ F+++++++++++++++ 0 5 10 15 20 25 30 35 40 Crank Angle Degrees Fig.18Cyclic variability of the combustion period duration (a) and corresponding pdfs, (b)-(e) EOPeriod in Fig. 18. Figures 17 and 18 will be used toidentify the contribution of each period to the CA50variability. The results in this section were presentedbackward in time (CI→flame→EKG→ignition) to demonstrate that as one moves earlier into theevents, the phasing of the major portion of the heatrelease, CA50, becomes less correlated (R2 decreases)with respect to the metrics measured here. The decrease in correlation is presumed to be due toeither imprecision of the EOEkg and CATransmeasurements (maximum second derivatives) orrandomness in the physical processes. The source(s)of the randomness could include intercycle varia-bility of the trapped charge (mass and composition)as well asintracycle velocity and compositiondistribution variations, none of which are measuredhere. 4.3.1 CI period The CI period is characterized in Fig. 17(a)a) bbyplotting EOCI versus CA50 for 480 cycles, whereEOCI was chosen as CA90. The very high correlationwith CA50 demonstrates that once the combustionhas reached 50 per cent mass burned, the secondhalf of the combustion burns quite well at thisoperating set point. However, the roll-off from thelinear fit at EOCI > 10 suggests that cycles with a lateCA50 will have a longer second-half of the burn. Theroll-off is conjectured to be caused by the slowing ofthe CO→CO2 reactions in late cycles due to lowertemperatures during expansion as suggested bySjoberg [21]. Figure 17(e) compares the CA50 probability den-sity function (pdf),* for SACI with that of similarlyphased pure CI (i.e. no spark, early injection, andincreased wall temperature to create a comparableaverage CA50, cf. Fig. 3(b)). Figure 17(e) reveals thelarge range of the SACI CA50 (10°), which is themotivation for this study. The skewness of the SACIpdf towards late cycles reveals those cycles that hadpoor spark assist and therefore relied on CI (c.f.Fig. 15, CA50=+6). The duration variation of the CIperiod,tcr=CA90-CATrans, is shown in Figs 18(a)and (e) to be small compared to the range of theCA50 variation (refer to ordinate range of Fig. 17(a)).Thus, once the SACI CI event has begun, its overallburning rate is about the same, regardless of phasingvariations in CATrans, which accounts for the low R‘value for the duration in Fig. 18(a). This leads to theconclusion that the CA50variations have beenestablished prior to CATrans. This is not a universalconclusion, but must be qualified with the under-standing that this operating condition resulted in allof the cycles being phased sufficiently early that highcombustion efficiency (finalmasstburned) wasachieved for all cycles. 4.3.2 Flame period phasing variability Figure 17(a) demonstrates that the EOFlame has astrong correlation (R²=0.88) with CA50. This sug-gests that the major randomness in the CA50variability must occur prior to the EOFlame, startingwith the flame period. The unexpected shift in thevery early and very late EOFlame cycles is assumedto be due to a complex relationship between thebimodal EOEkg and tFlm pdfs, which are discussed inthis and the next sections. Figure 16 demonstrated that the flame growth wasapproximately the same for flames started early orlate. This suggests that the flame growth contributeslittle to the randomness but just passes on thephasing variations of the EKG period. This hypothesisis supported by two observations. First, that the twopreferred EOEkg CAs in Fig. 17(a) (-35 to -20 ATDCand -20 to -10 ATDC) are manifest as two preferredEOFlm CAs in Fig. 18(a) (-8 to -5 ATDC and -5 to-1 ATDC), although the tFlm of these two EOFlamecrank angle preferences overlap. Secondly, the pdf oftFlm in Fig.18(d) shows a bimodal distribution whichwas established during EKG as shown in Fig. 18(C).The two preferred tFlm pdf modes are wider than thetwo very narrow modes of the teKG pdf, indicating thatrandomness was introduced by the EOEkg. Sinceneither the phasing (CA50) nor the duration of the CIcombustion show this bimodal distribution, thebimodality is apparently overcome by the main heatrelease during the CI period. Figure 18(a) shows that the duration of the flameperiod,tFlm = CATrans-EOEkg, has a negative corre-lation, albeit weak (R²=0.38); that is, the longestduration flames actually end earlier, thereby advan-cing the start of CI combustion (CATrans). Since theflame-area growth rates are approximately the same,regardless of when the flame begins (Figs 15 and 16),flames that start early create a longer duration flametending to advance CI phasing (CA50). This point isbetter made in Fig. 19(a), which shows a strongercorrelation between the EOEkg (start of the robustflame) and CATrans. Recalling that (a) the flameduration is the time between the start of a robustflame (EOEkg) and the onset of CI (CATrans), and (b)the early and late flames grow at the same rate, itfollows that randomness in the start of the flame(EOEkg) is responsible for the flame duration variation. 4.3.3EKG period phasing variability Now consider the EKG period. Figure 17(a) demon-strates that the EOEkg has the largest range ofvalues Fig.19Cyclic variability correlations of the beginning and end of the flame period (a) and thespark-discharge parameters, (b)-(d) of the four periods and there is a strong positivecorrelation (R²=0.73) between CA50 and EOEkg;early initiation of the flame period (EOEkg) results inadvanced CI combustion. Also, bimodality is visiblein the scatter plot of Fig.17(a) as well as the EOEkgpdf in Fig. 17(c), which show that there are twopreferred EOEkg CAs (one between -35 and -20ATDC, the second between -20 and -10 ATDC).The origin of all of the bimodality observed inFig. 17(C) is more obvious in the plots of Figs 18(a)and 18(c); Fig. 18(a) confirms that the range of theEKG duration is the largest of the four periods andFig. 18(c) demonstratesthat the EKG ]ha1sStwodistinctly preferred durations. The narrowness ofthe pdf modes in Fig. 18(c) is exacerbated by the lowimage-sampling rate allowed by this camera (16frames per cycle, 2.5° apart). However, the 10°peakseparation is resolved adequately by the 2.5° image- acquisition resolution. Further, the bimodality existsin the CATrans pdf, which is determined indepen-dently from pressure-based heat release analysis;thus the bimodality cannot be in question. The verynarrow bimodal EKG duration, TEKG, in Fig. 18(c)demonstrates that the time to transition from theend of the spark plasma, EOSpk, to a robust flame,EOEkg, preferred one of two distinct states. How-ever, the large overall range of the tEkG pdf(36-3=33°,refer to Fig. 18(c)) demonstrates morerandomness in many of the other cycles. Since therange of tEk is much larger than the range oftspk(10°), there must be considerable randomnessoccurring during the EKG process itself. The bimodality is interesting but its importance isunclear at this time, since it seems to be randomizedduring the flame and CI combustion prior to CA50;the cause of the bimodality is unknown at this time and left for future study. Notwithstanding, the largerange in the EKG period has a major impact on thevariability and the CI combustion phasing as theEOEkg is highly correlated with CA50. 4.3.4Spark-discharge period Firstly, consider the sparkikperiod1 iin Fig. 17(a)(EOSpk=tspk since all spark discharges start at-45 ATDC, cf. Fig. 18(a)). Here the EOSpk is seento correlate poorly with CA50, as the range of CA50sis about the same at each EOSpk. There are manypoints about EOSpk, CA50=-35, however, the pdfin Fig. 17(b) shows that EOSpk has a nearly normaldistribution with but a slight skewness toward longerdurations. The conclusion is that either the sparkduration does not have an effect on the phasing ofthe CI combustion period or at least that any effect israndomized after the EOSpk. Of the five spark discharge parameters, Pgap, IcN/E, and dV/dtdur demonstrated no correlation withCA50 (e.g. tspk in Fig.17(a)). Egap and MaxXcog exhi-bited a weak correlation with CA50. In particular,Fig. 19(C) demonstrates that a large excursion in thepositive direction (toward the spray) is necessary,but not sufficient, to produce an early CA50. Anadvance in combustion phasing is expected withlarger plasma-channel excursions based on work inhomogeneous fuel-air mixtures [10]. This very weakcorrelation suggests that events after EOSpk ran-domly delay CA50. Figure 19(b) shows a similarlyweak correlation between Egap and CA50, but this isredundant with the Xcog correlation as shown by thestrong correlation between Egap and MaxXcog inFig. 19(d). The correlation between Egap and MaxXcogis expected because the velocity is expected to be thedominant cause of the plasma-channel excursion*and higher flow velocities are known to result inhigher Egap [10]. The weak correlation of MaxXcog with CA50 andthe strong correlation of EOEkg with CA50 suggeststhat the plasma excursion may have an importantinfluence on the EKG duration. However, it will benecessary to correlate the spark parameters with theEOEkg to reveal any interactions. This was notpossible here because the camera could not recordboth the spark event and the EKG event owing to the ( *It is, ofcourse, possible that the discharge plasma might follow low-impedance paths c r eated b y gas o r l i quid fuel n ear theelectrodes. However, i t has ye t to be demonstrated that fuelgradients or droplets can dominate the effect of the velocity. ) low number of images per cycle. This correlation willbe reported in a future study. 5 CONCLUSION This study demonstrates that stratified-charge SACIisa mechanism to provide combustion-phasingcontrol in gasoline HCCI engines, even at the lightload condition (7 mg/cycle, 200 kPa i.m.e.p.), wherespray-guided direct fuel injection was required toachieve flame propagation. This study employed acombination of pressure-based heat-release analy-sis, spark-discharge voltage and current measure-ments, and cycle-resolved combustion imaging todefine four periods of this combustion process,namely, (a) the spark discharge, (b) the EKG, (C)flame propagation, and (d) the CI periods. Metricswere defined to characterize each period and wereused to identify the contribution of each of the fourperiods to the cycle-to-cycle phasing variability ofthe main CI heat release. The following conclusions can be drawn for theengine operation studied here. l. The entrainment of the spark-discharge plasmademonstrated a very weak correlation with thecombustion phasing, CA50. It is hypothesizedthat the entrainment can affect CA50 throughinteractions with the EKG period. However, thiscould not be assessed here due to cameralimitations. 2. The EKG period was the primary cause of CA50cyclic variability. In particular, the EKG-periodduration had the longest delay between spark andCA50, the largest range ofcyclic variability, and abimodal pdf (at this operating configuration).Shorter EKG periods resulted in longer flamedurations, and earlier CA50 phasing. 3. The flame period exhibited flame-area-growthrates that were both linear and equal regardlessof the CA at which the transition from EKG toflame (end of EKG, EOEkg) occurred. Thus, oncestrong flame propagation begins, variability dur-ing flame propagation does not contribute sig-nificantly to CA50 cyclic variability. 4. The CI combustion period was comparativelyshort, and the correlation between the transitionto CI, CATrans, and CA50 was very high. Thus, theCI period did not contribute markedly to cyclicvariability. The cyclic variability of CA50 isestablished prior to the start of CI combustion(CATrans). Since the flame growth rate and HRRare about the same and EOEkg is highly correlated with CA50, it is the variability during the EKGperiod that has the biggest effect on the CA50cyclic variability. ACKNOWLEDGEMENTS The authors thank Jim Eng for his observations andconsultations, as well as modifications to the HCCIheat-release analysis. REFERENCES ( 1 Najt, P., Kuo, T .-W., Cleary, D. , E n g, J., a n d Brown, B. Auto-ignition gasoline e ngine c ombus- tion chamber and method, U S Patent US 6,971,365 B1,2005. ) 2 Kuo,T.-W., Brown, B., Eng, J., and Najt, P. Methodfor mid load operation of auto-ignition combus-tion, US Patent US 6,994,072 B2, 2006. 3 IHyvonen, J., Haraldson, G., and Johansson, B.Operating conditions using spark assisted HCCIcombustion mode transfer to SI in a multi-cylinderVCR-HCCI engine, SAE paper 2005-01-0109, 2005. 4Weinrotter, M., Wintner, E.,Iskra, K., Neger, T.,Olofsson, J., Seyfried, H., Alden, M., Lackner, M.,Wintner, F., Vressner, A., Hultqvist, A., andJohansson,B. Optical diagnostics of laser-inducedand spark plug-assisted HCCI combustion, SAEpaper 2005-01-0129, 2005. 5 [Urushihara, T., Yamaguchi, K., Yoshizawa, K.,andItoh, T. A study of a gasoline-fueled compressionignition engine- expansion of the HCCI operationrange using SI combustion as a trigger of compres-sion ignition, SAE paper2005-01-0180,2005. 6Wang, Z., Wang, J.-X., Sjuai, S.-J., and Ma, Q.-J.Effects of spark ignition and stratified charge ongasoline HCCI combustion with direct injection,SAE paper 2005-01-0137,2005. 7 Perrson, H., Hultqvist, A., Johansson, B., andRemon, A. Investigation of the early flame devel-opment in spark assisted HCCI combustion usinghigh speed chemiluminescence imaging, SAE pa-per 2007-01-0212,2007. 8IPerrson, H. A., Johansson, B., and Remon, A. Theeffect of swirl on spark assist compression ignition(SACI), SAE paper 2007-01-1856,2007. 9 Berntsson, A. W. and Denbratt, I. Optical study ofHCCI combustion using NVO and an SI stratifiedcharge, SAE paper 2007-01-012,2007. 10 Pischinger, S. and Heywood, J. B. How heat losesto the spark plug electrodes affect flame kerneldevelopment in an SI-engine, SAE paper 900021,1990. ll /Abraham, J., Bracco, F. V., and Reitz, R. D.Comparisons of computed and measured pre-mixed charge engine combustion. Combust. andFlame, Vol.60,1985,309-3223. 12 Reuss, D. and Sick, V. Spatial mixing, ignition andcombustion inhomogeneities in HCCI combustion:An imaging study, SAE paper 2005-01-2122,2005. 13 1Miles, P. and Steeper, R. Private communication,Sandia National Laboratories, Combustion Re-search Facility, Livermore California, 2004. 14 (Chang, J., Gralp, O., Filipi, Z., Assanis, D., Kuo,T.-W., Najt, P., and Rask, R. New heat transfercorrelation for an HCCI engine derived frommeasurements of instantaneous surface heat flux,SAE paper 2004-01-2996, SP-1896, 2004. 15 Stivender, D. Development of a fuel-based massemission measurement procedure, SAE technicalpaper 710604, 1971. 16 Gaydon, G. G. A. The spectroscopy of flames, 2ndedition, 1974 (Chapman and Hall Ltd, London). 17 Fansler, T. D., Drake, M. C., Stojkovic, B., andRosalik, M. E. Local fuel concentration, ignitionand combustion inastratified-charge spark-ignited direct-injection engine: Spectroscopic, ima-ging and pressure-based measurements, Int. J.Engine Res., 2003,4(2), 61. l8 M1aly, R. and Meinel, H. Determination of flowvelocity, turbulence intensity, and length and timescales from gas discharge parameters, Proceedingsof the Fifth International Symposium on PlasmaChemistry, Vol. ISSPC-5, pp.552-557, 1981. 19 NMaly, R., Meinel, H., and Wagner, E. Novel methodfor determining general flow parameters fromconventional spark discharges, IMechE, Vol C67/83, pp. 27-32,1983. 20 Hultqvist, A., Christensen, M., Johansson, B.,Franke, A., Richter, M., and Alden, M. A study ofthe homogeneous charge compression ignitioncombustion process by chemiluminecence ima-ging, SAE paper 199-01-3680,1999. 21sSjoberg, M. and Dec,J. E. Combined effects of fuel-type and engine speed on intake temperaturerequirements and completeness of bulk-gas reac-tions for HCCI combustion, SAE paper 2003-01-3173, 2003. 22 Farrell, J. T. and Bunting, B. G. Fuel compositioneffects at constant RON and MON in an HCCIengine operated with negative valve overlap, SAEpaper 2006-01-3275,2006. APPENDIX 1 Notation Aflm flame/kernel area in each frame AF air-fuel ratio, mass of air / mass of fuelATDC after top dead-centre compressionCA crank angle CATrans crank angle the combustion transi-tioned to CI, where dHRR/dCA’ ismax APPENDIX 2 Processing of EKG and flame images The image-processing performed on the combus-tion-chemiluminescence images was performed ac-cording to the flow chart in Fig. A1. The processingabove the dotted line was performed for noiserejection, and creates one 16-frame image for eachof the 80 cycles recorded during a single 300-cycletest. The main purpose of the mask is to reject lightfrom noise outside the window field of view thatwould otherwise corrupt the flame area and sparkc.o.g. measurements. It is also intended to minimizethe reflected light, although achievement of thispurpose is minimal and imperfect. The image-processing functions below the dottedline in Fig. Al are applied to each frame of eachcycle and the tabulated results used to compute theflame parameters noted in the main body of thismanuscript. The first step is to binarize the pre-viously discussed flame images using either a two-count threshold for computing EOEkg or a 3 percent-of-max threshold for flame-area measurements(refer to the main text). The reason for and theimplications of the two choices are demonstrated inFigs A2 and A3. Figure A2(a) shows the complete flame image,with the red outline indicating the edge of the two-count binarized image; that is, every pixel inside thered outline would be given a value of 1 and countedas the flame area. In spite of the non-linear displayscale used to enhance the low-intensity regions,there is a large black region in the early kernels(Fig. A2(a), frames 0-10) between the two-countedge and the blue contour (≈25 counts). This is anartefact of the display. In later frames (Fig. A2(a),frames 12-15), the chemiluminescence has highcounts at the edge of the mask, and thus thebinarized edge and flame edge appear the same.Figure A2(b) shows each flame image masked bythe 3 per cent-of-max threshold, with the whiteline indicating the edge of the 3 per cent-of-maxbinarized region and the red line indicating the edgeof the two-count binarized region. The white line is Fig. Al Image processing functions. Functions above the dotted line were performed for noiserejection not always visible where it coincides with high-intensity flame chemiluminescence. However,Fig. A2(b) shows that the two thresholds are the samefor the early kernels (frames 1-5). Then, as the flameimage has higher intensity, the two-count thresholdbecomes coincident with the edge of the field-of-viewmask (frames 8 and 9) while the 3 per cent thresholdremains smaller. In fact, if the flame intensity growsfaster than the flame area, the area of the 3 per cent-of-max binary image can actually decrease as it doesbetween frames 8 and 9. This is shown more clearly inFig. A3(a). The most probable reason for the dis-crepancy between the two threshold areas is that, asthe flame intensity increases, the background scatter-ing is above two counts. It is, of course, possible that low-temperature reactions due to compression alsocontribute, although these measurements cannotdistinguish between the two. In this study the two-count threshold was used toindicate when the early kernel transitions to a flame,EOEkg, to avoid the maximum-second-derivativeambiguity caused by the decrease in area of the3 per cent-of-max threshold (refer to Fig.A3(a)). The3 per cent-of-max threshold was considered to be amore intuitively correct measure of the flame as itessentially is a variable-intensity background sub-traction. Thus, the 3 per cent-of-max threshold isused to generate the conditionally sampled flame-area growth plots (Fig.16) with the expectation thataveraging will filter out the few errant cycles. Fig. A2Binarization threshold strategies comparing the image intensities with the edge of thetwo-count-threshold binary region (red line) and the edge of the 3 per cent- threshold-binary region (white line) Fig. A3Comparison of (a) two-count and 3 per cent-of-maximum thresholds strategies on flamearea for the images in Fig. A2, and (b) the effect on the EOEkg pdf for all 300 cycles Fig. A3(b) shows that the pdf of the EOEkg (for theimaged 480 cycles) is qualitatively unchanged. Thus it is concluded that the observations and conclu-sions in this paper are unaffected by the choice. JERC IMechE nt. J. Engine Res. Vol. Int. J. Engine Res. Vol. JERC IMechE Spark-assisted compression ignition, SACI, can be used to control the combustionphasing of compression-ignition gasoline engines. However, implementation of this techniquecan be confounded by cyclic variability. The purpose of this paper is to define experimentalmetrics that describe the SACI process and to demonstrate the use of these metrics foridentifying the source(s) of cyclic variability during the SACI process.This study focused on a light load condition (7 mg/cycle, 200 kPa i.m.e.p.), where spray-guideddirect fuel injection with spark ignition and an exhaust-rebreathing strategy was employed toachieve flame propagation, which led to compression ignition. This study employed acombination of measurements including pressure-based heat-release analysis, spark-dischargevoltage/current measurements, and cycle-resolved combustion imaging. Based on thesemeasurements, four distinct combustion periods were identified; namely, the spark discharge,the early kernel growth (EKG), flame propagation, and the compression ignition periods. Metricswere defined to characterize each period and used to identify the contribution of each period tothe cyclic variability of the main heat release. For the light load condition studied here, the EKGperiod had the largest effect on the crank angle (CA) position of 50 per cent mass burned, CA50.The spark-discharge event may affect CA50 indirectly through its influence on EKG. However,this could not be definitively assessed here since the camera was incapable of recording both thespark-discharge event and the flame images during cycles of the same tests.
确定
还剩24页未读,是否继续阅读?

产品配置单


北京欧兰科技发展有限公司为您提供《火花塞中点火过程中燃烧可变性检测方案(粒子图像测速)》,该方案主要用于汽车电子电器中电学性能检测,参考标准--,《火花塞中点火过程中燃烧可变性检测方案(粒子图像测速)》用到的仪器有德国LaVision PIV/PLIF粒子成像测速场仪、PLIF平面激光诱导荧光火焰燃烧检测系统、汽车发动机多参量测试系统、LaVision SprayMaster 喷雾成像测量系统、LaVision HighSpeedStar 高帧频相机
推荐专场


汽车尾气分析仪
更多


该厂商其他方案
更多