


方案详情
文
We report on spatially resolved simultaneous measurements of temperature and majority species
concentrations along a line segment in a premixed laminar H2-air flame. The results are obtained from
Raman and Rayleigh scattering by using a narrow-band KrF excimer laser and a spectrally and spatially
resolving detector system that consists of a high-throughput spectrometer and a gated, intensified,
two-dimensional CCD camera. The data presented here are integrated over 100 laser shots. Absolute
density profiles of N2, 02, H20, and H2, as well as temperature profiles at various heights through the
flame, are presented. A discussion of the required calibration procedures and a summary of the
necessary spectroscopic background are also included in this paper.
方案详情

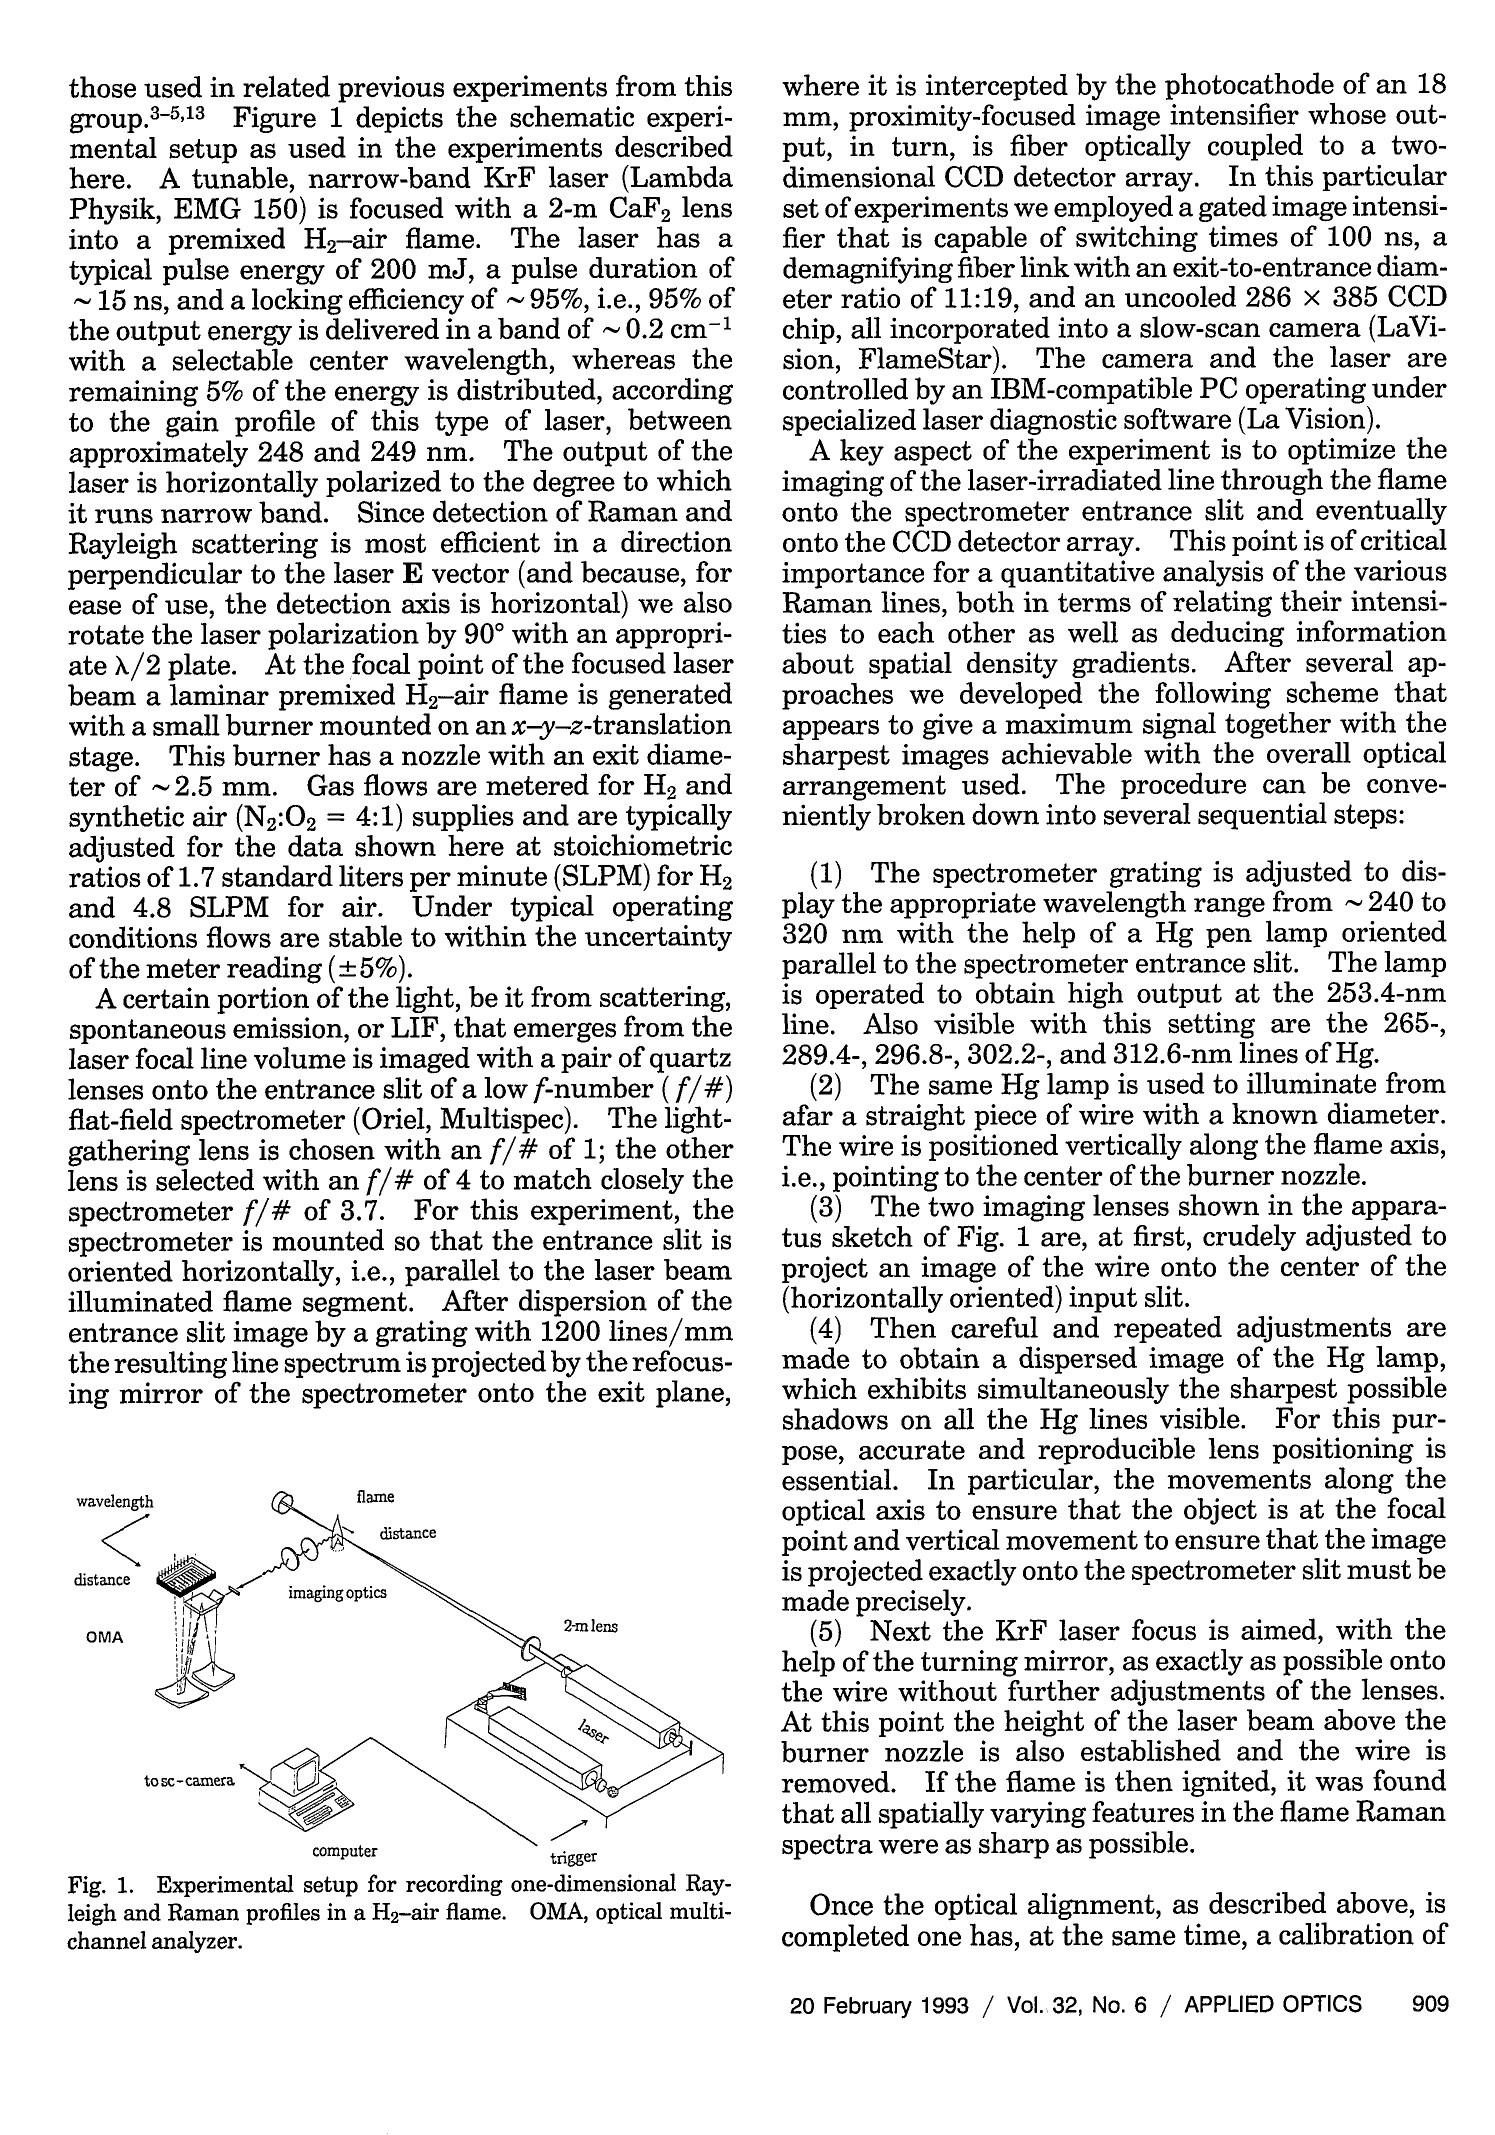
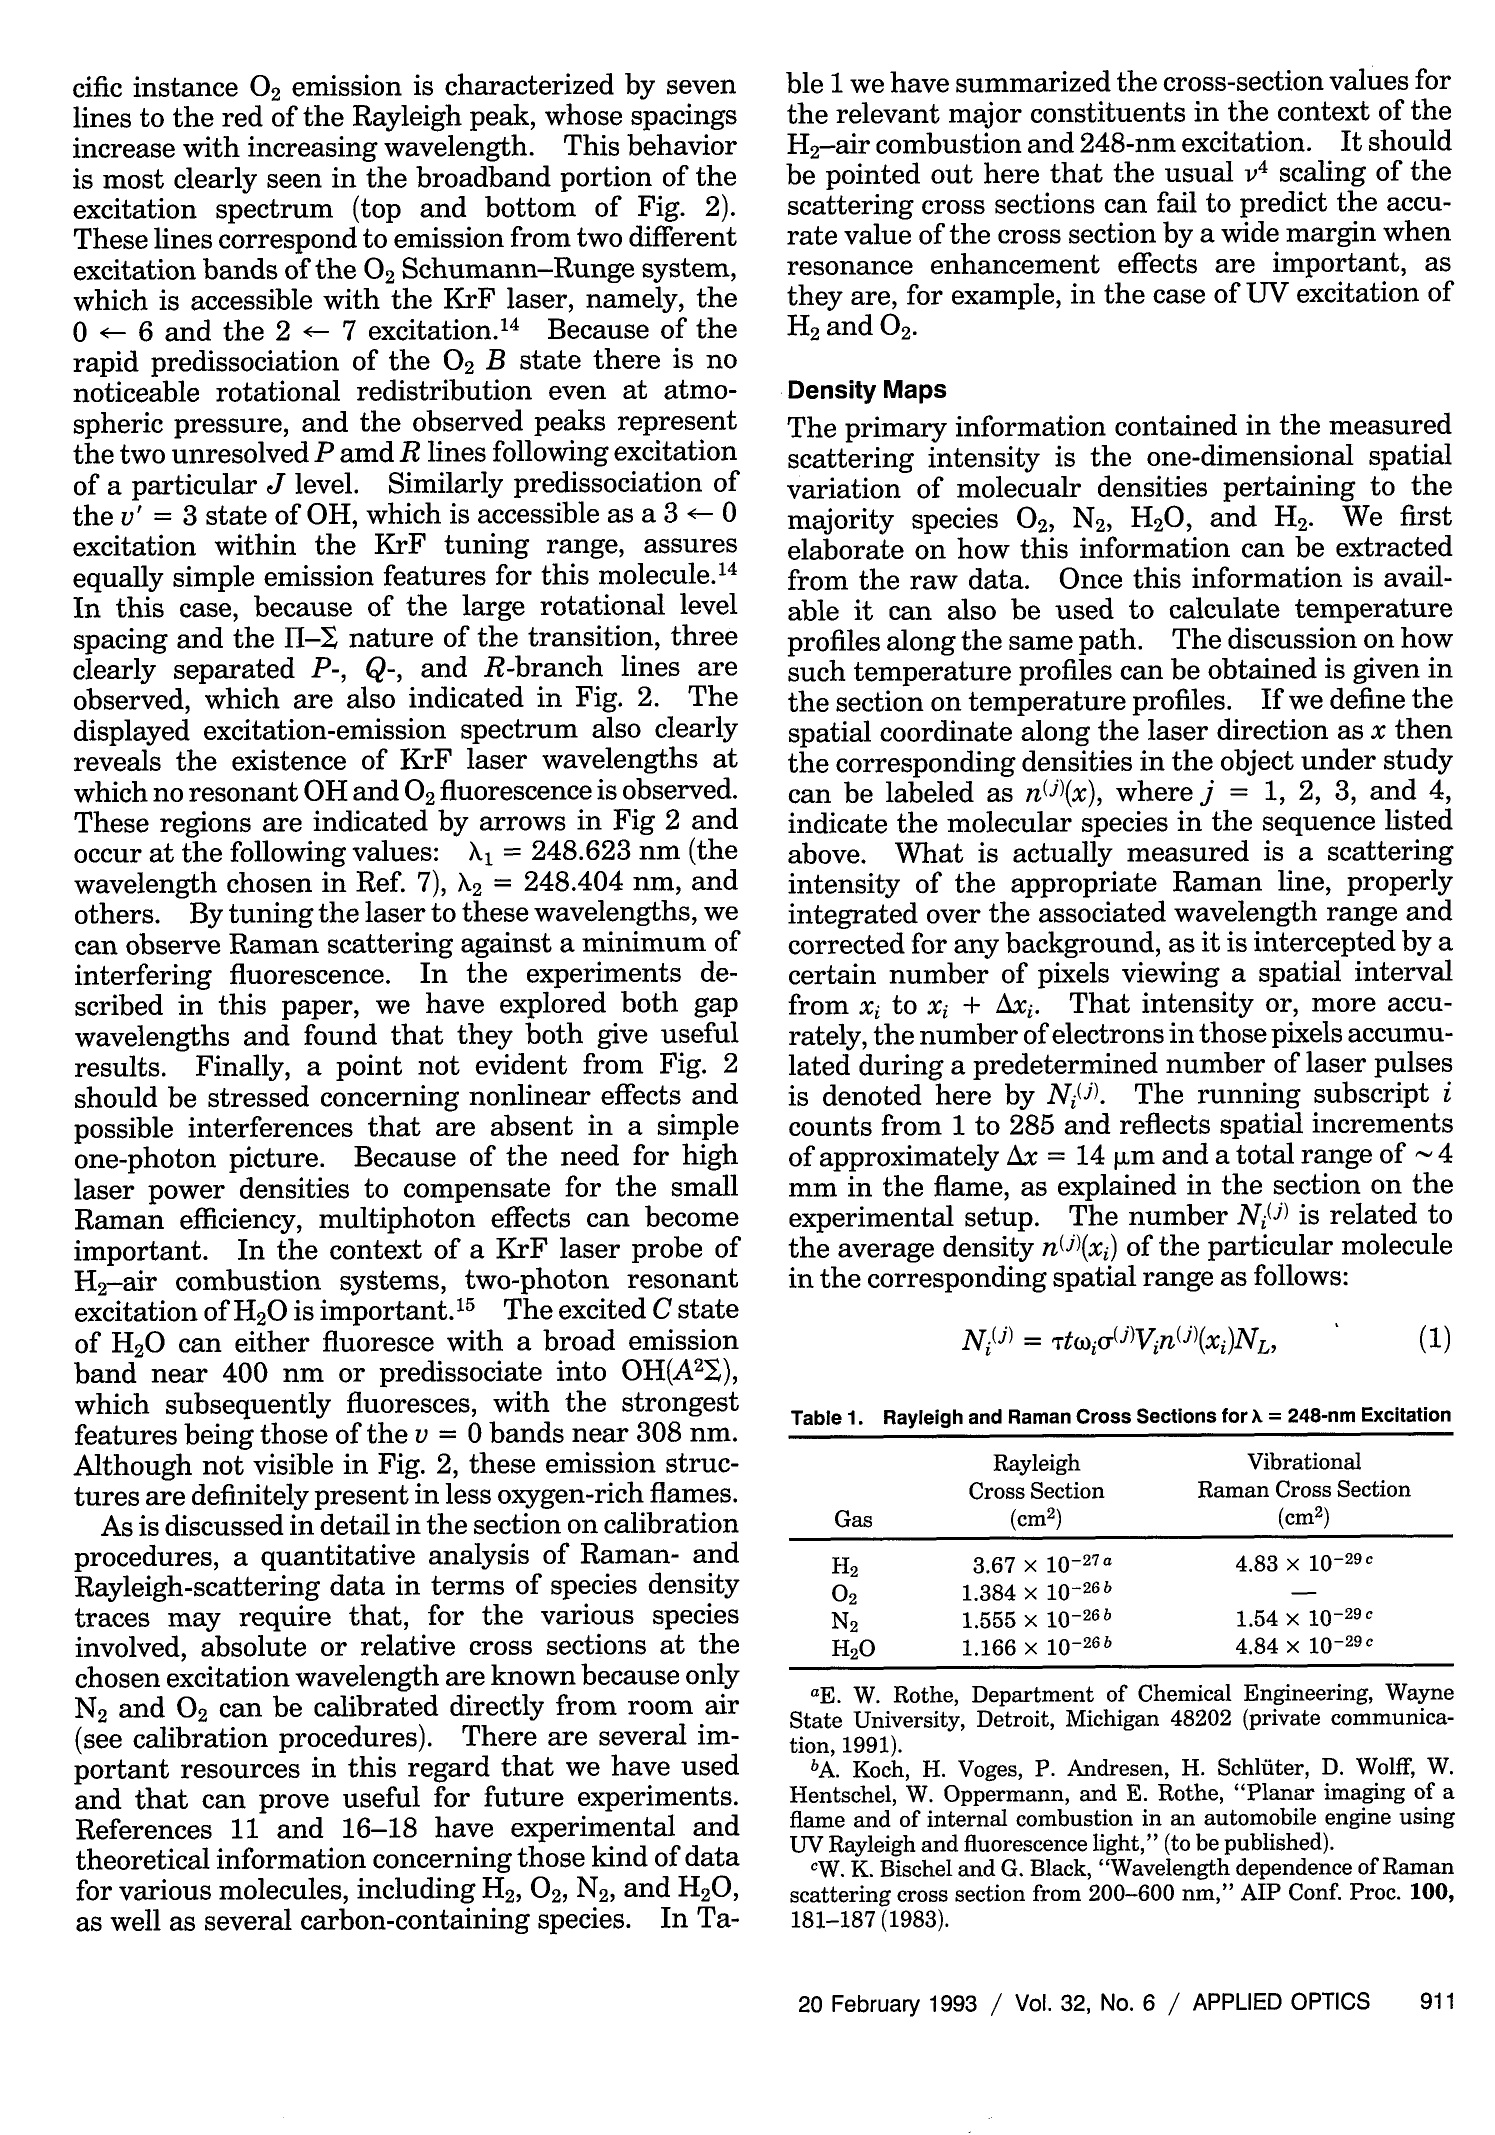
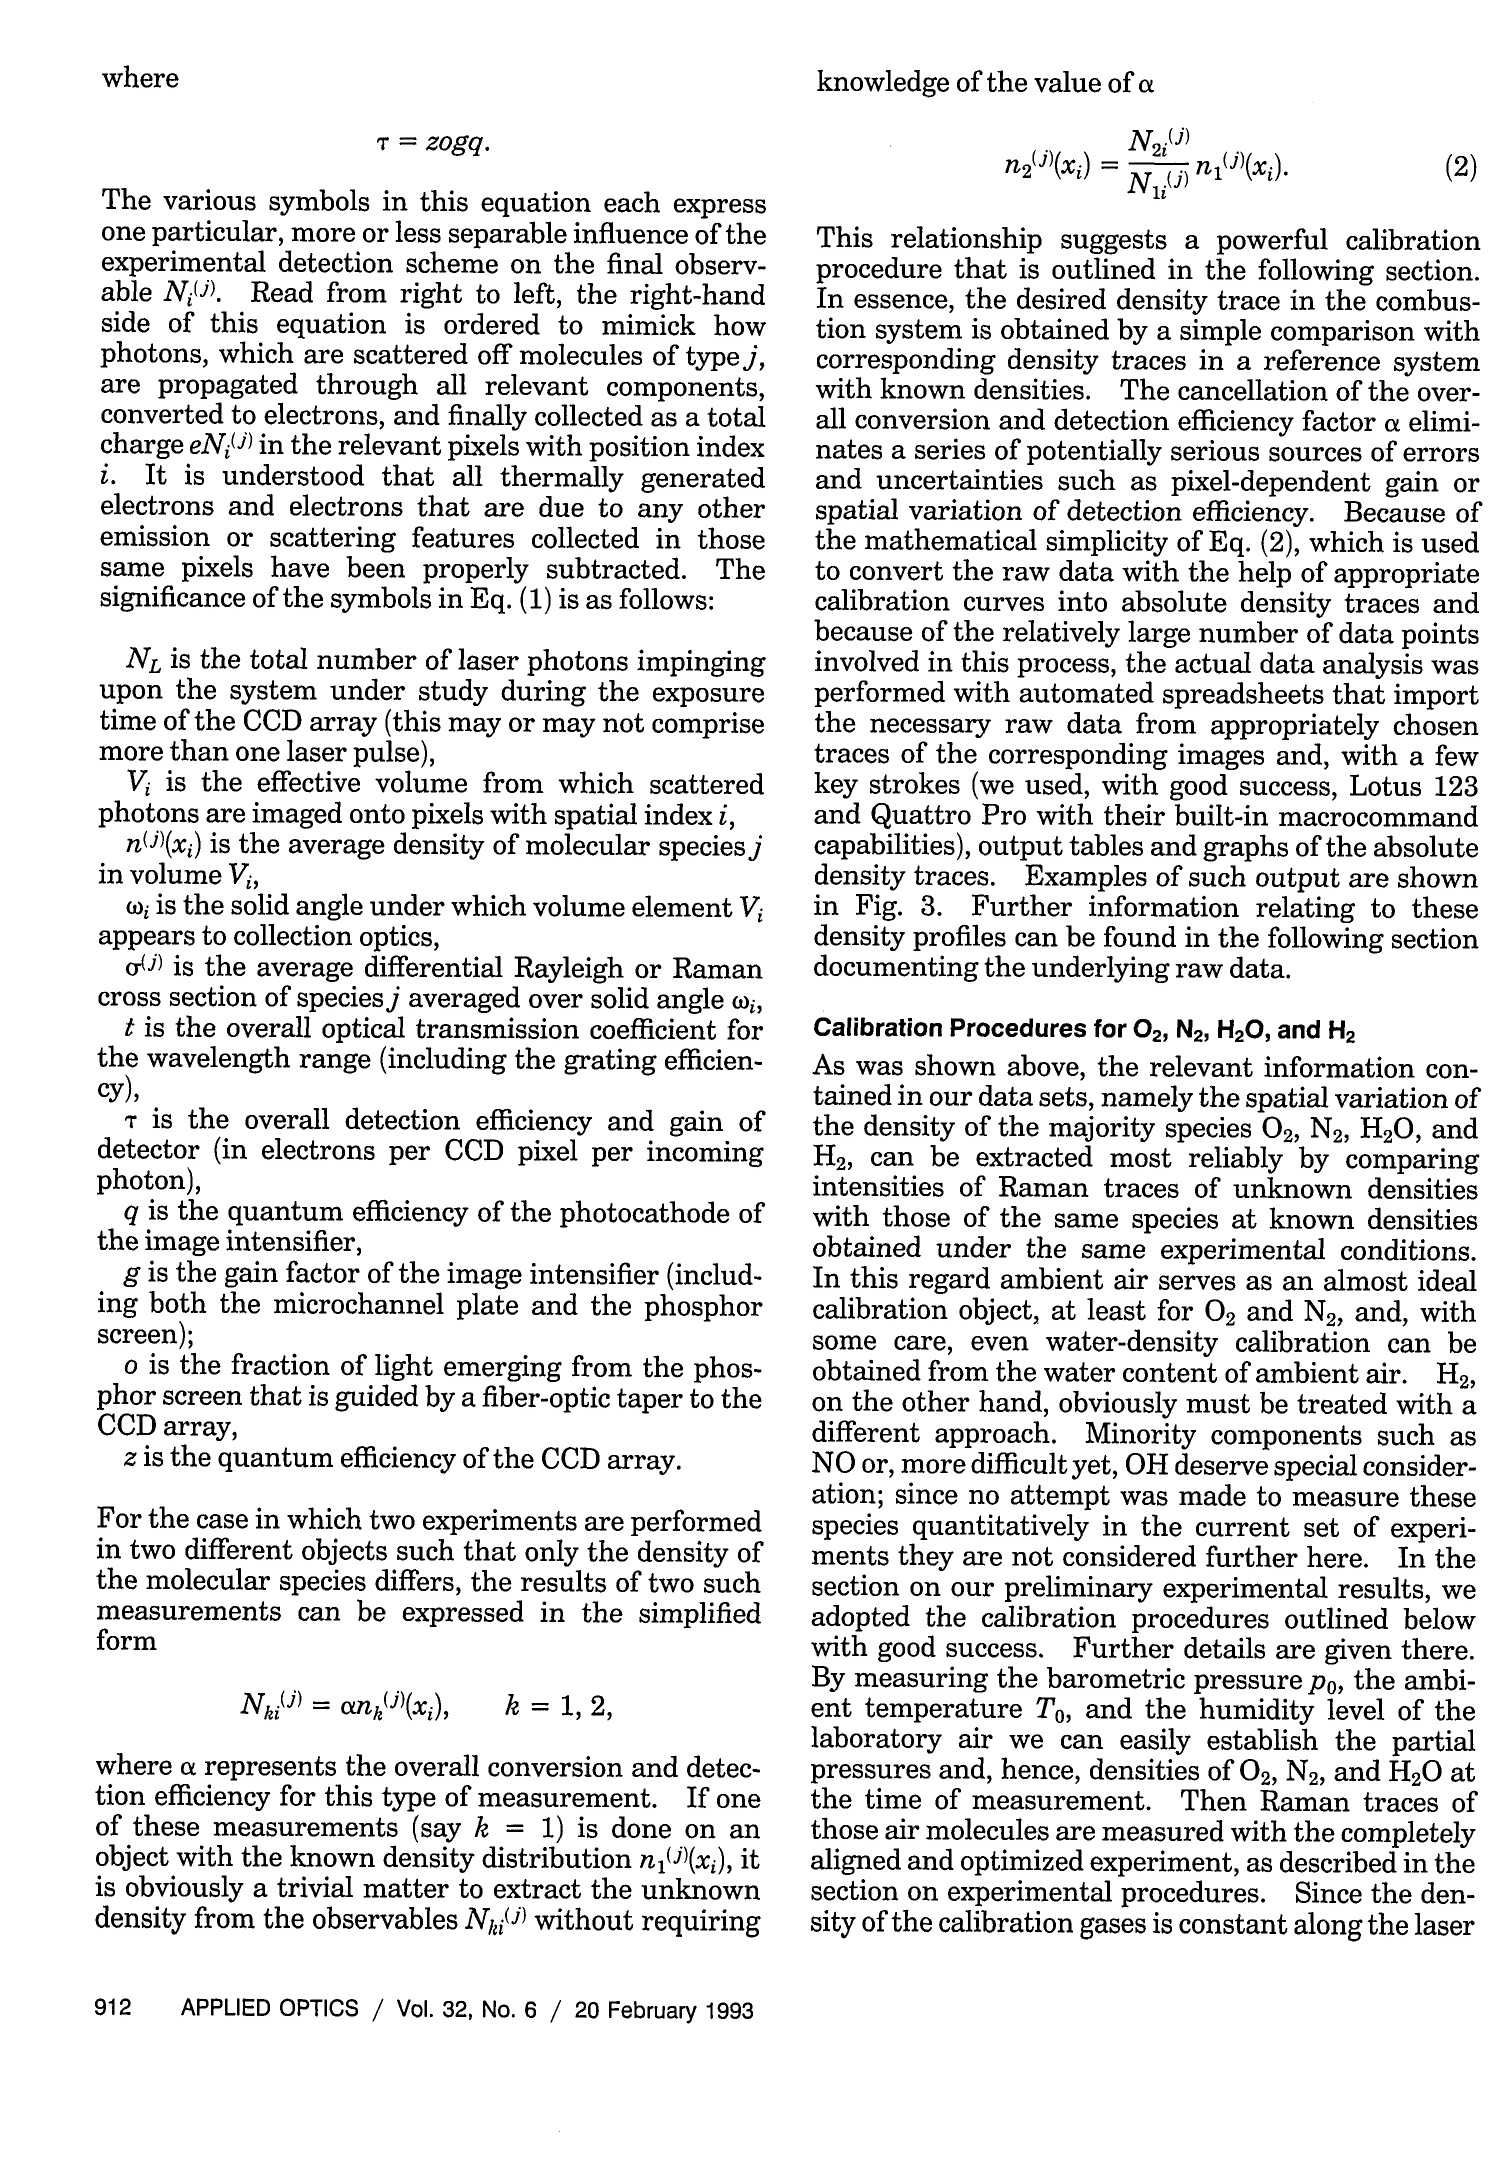
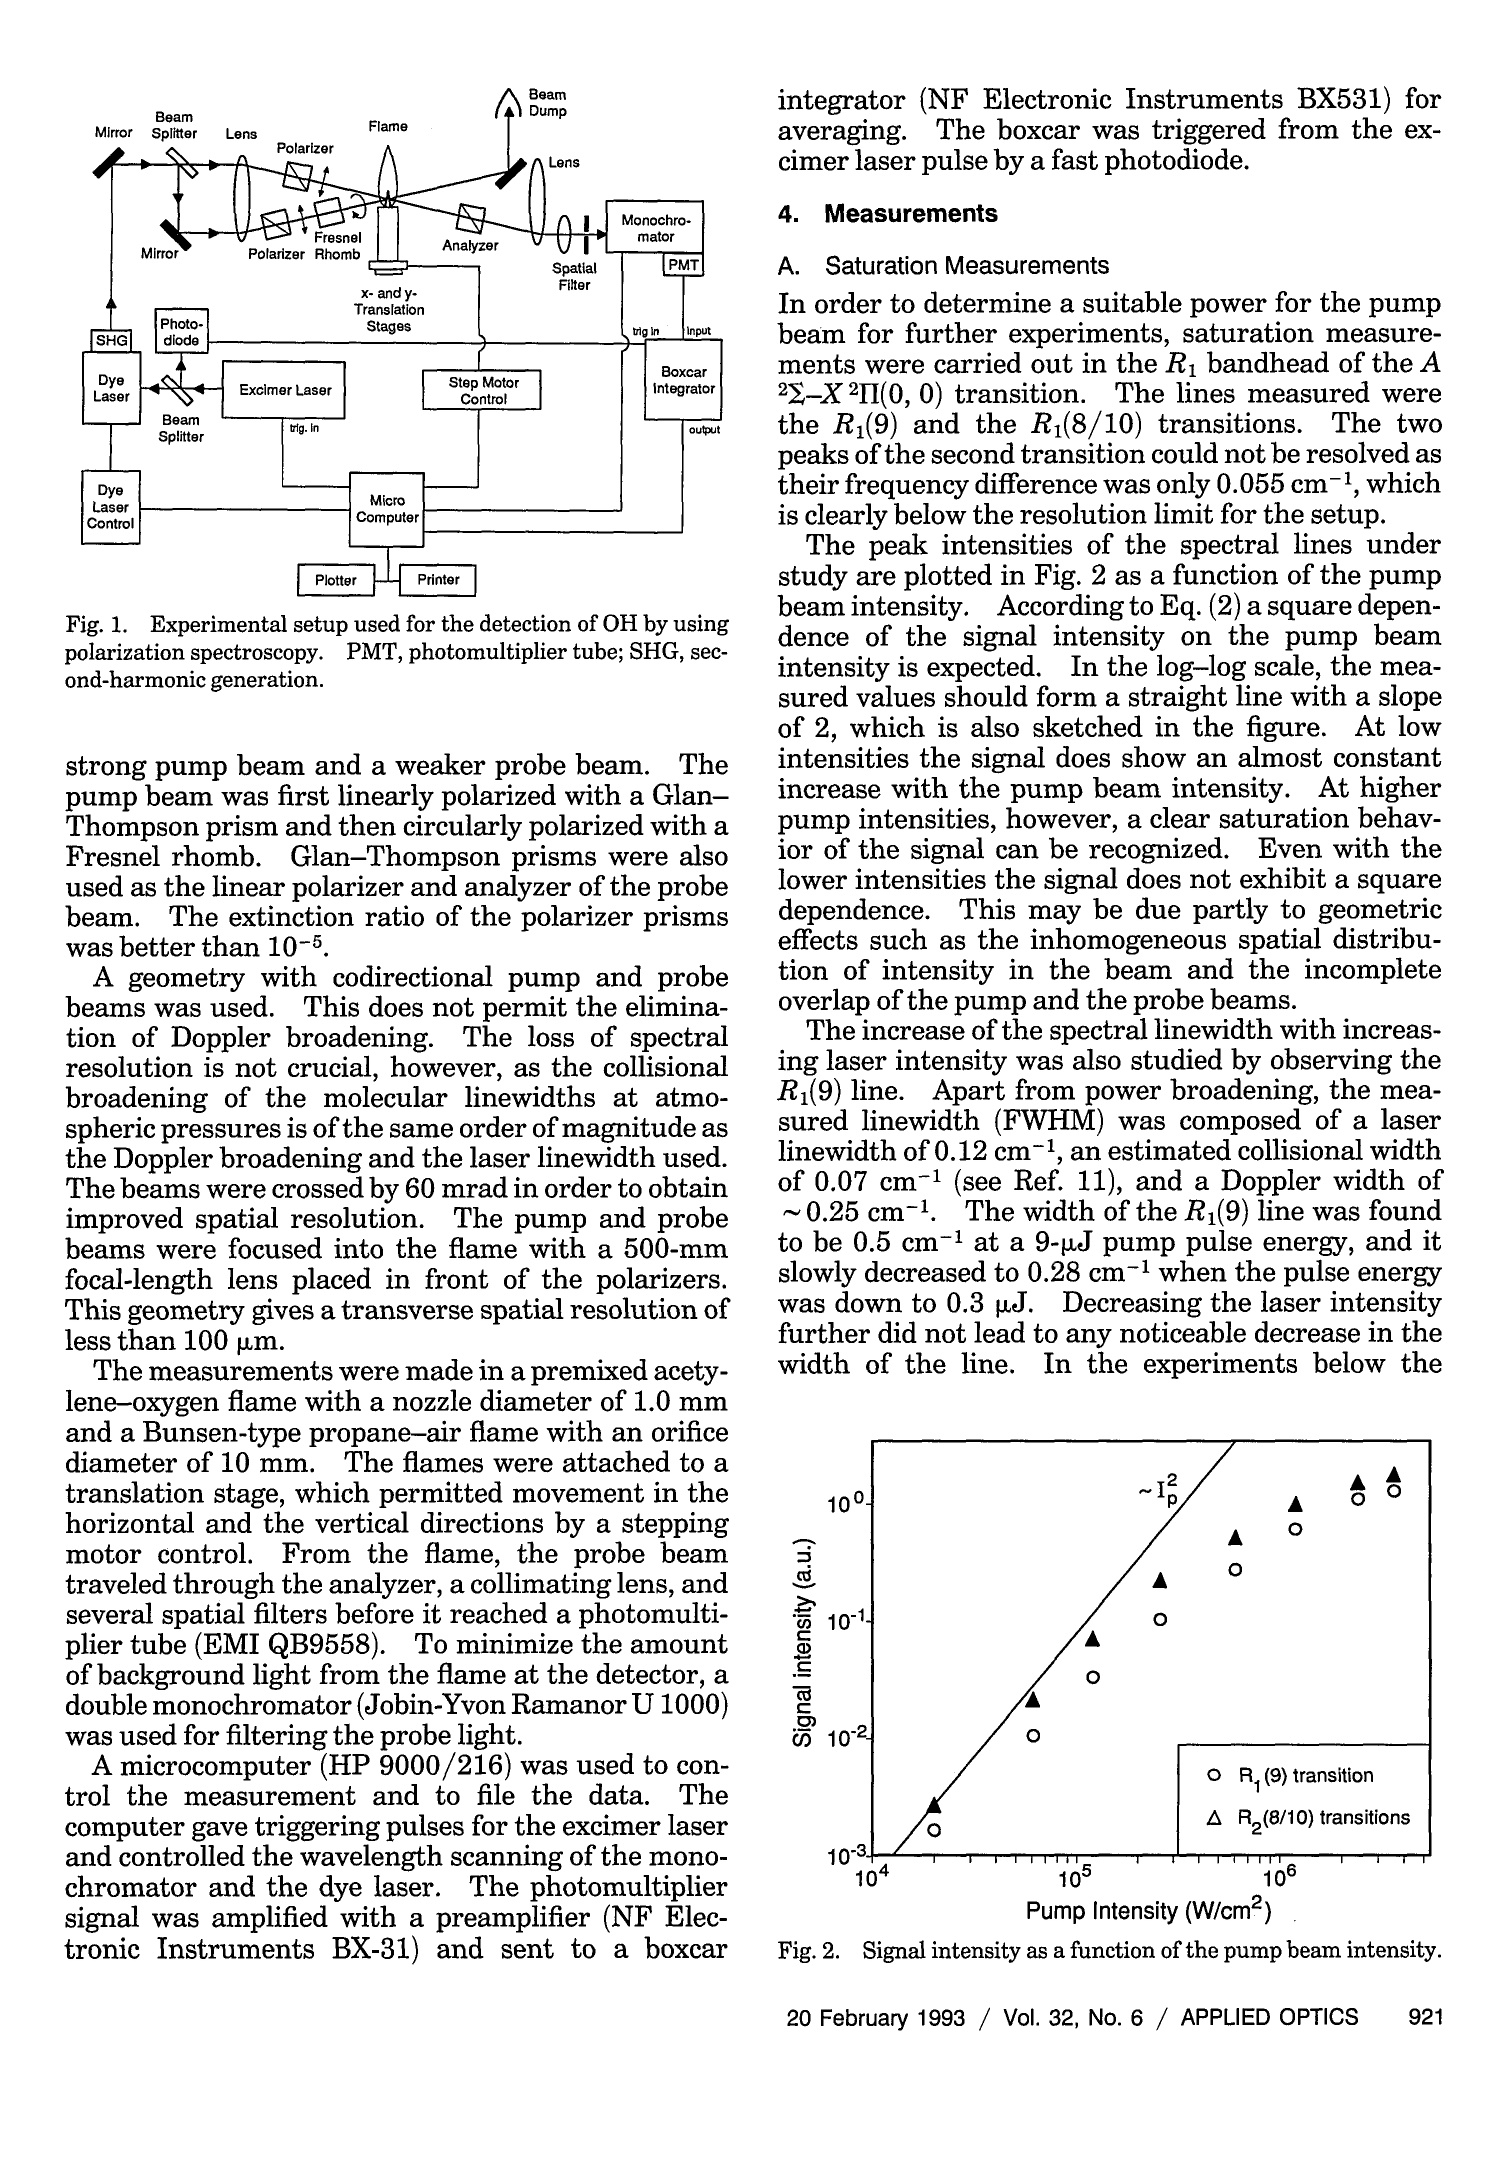
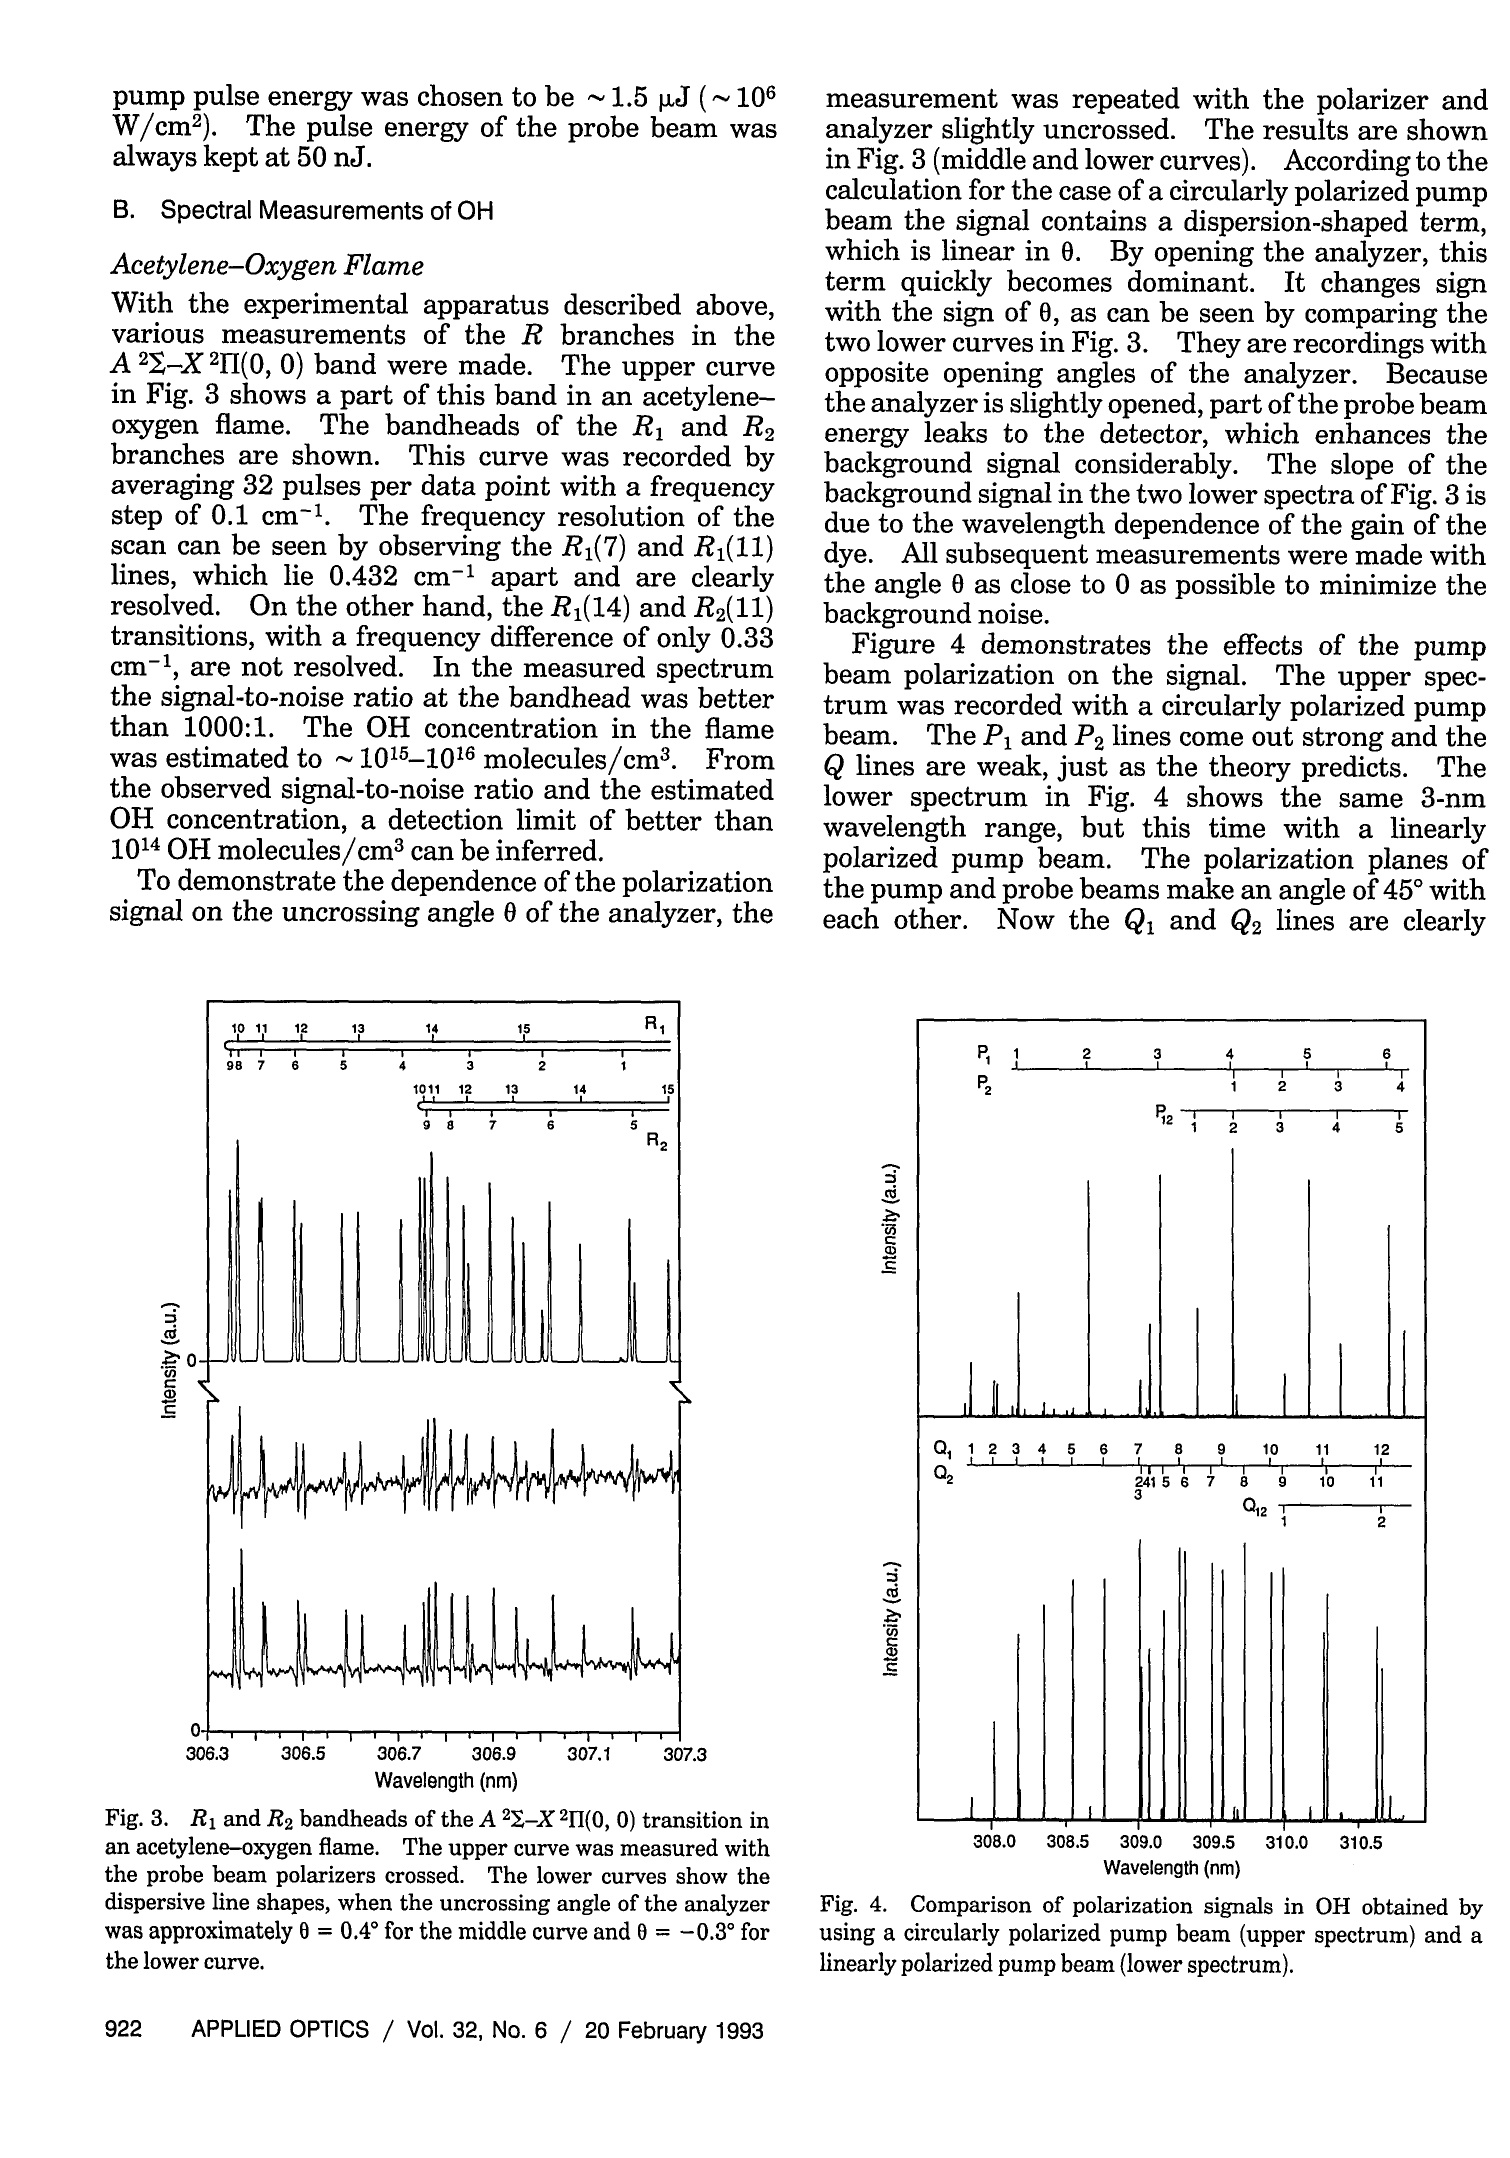
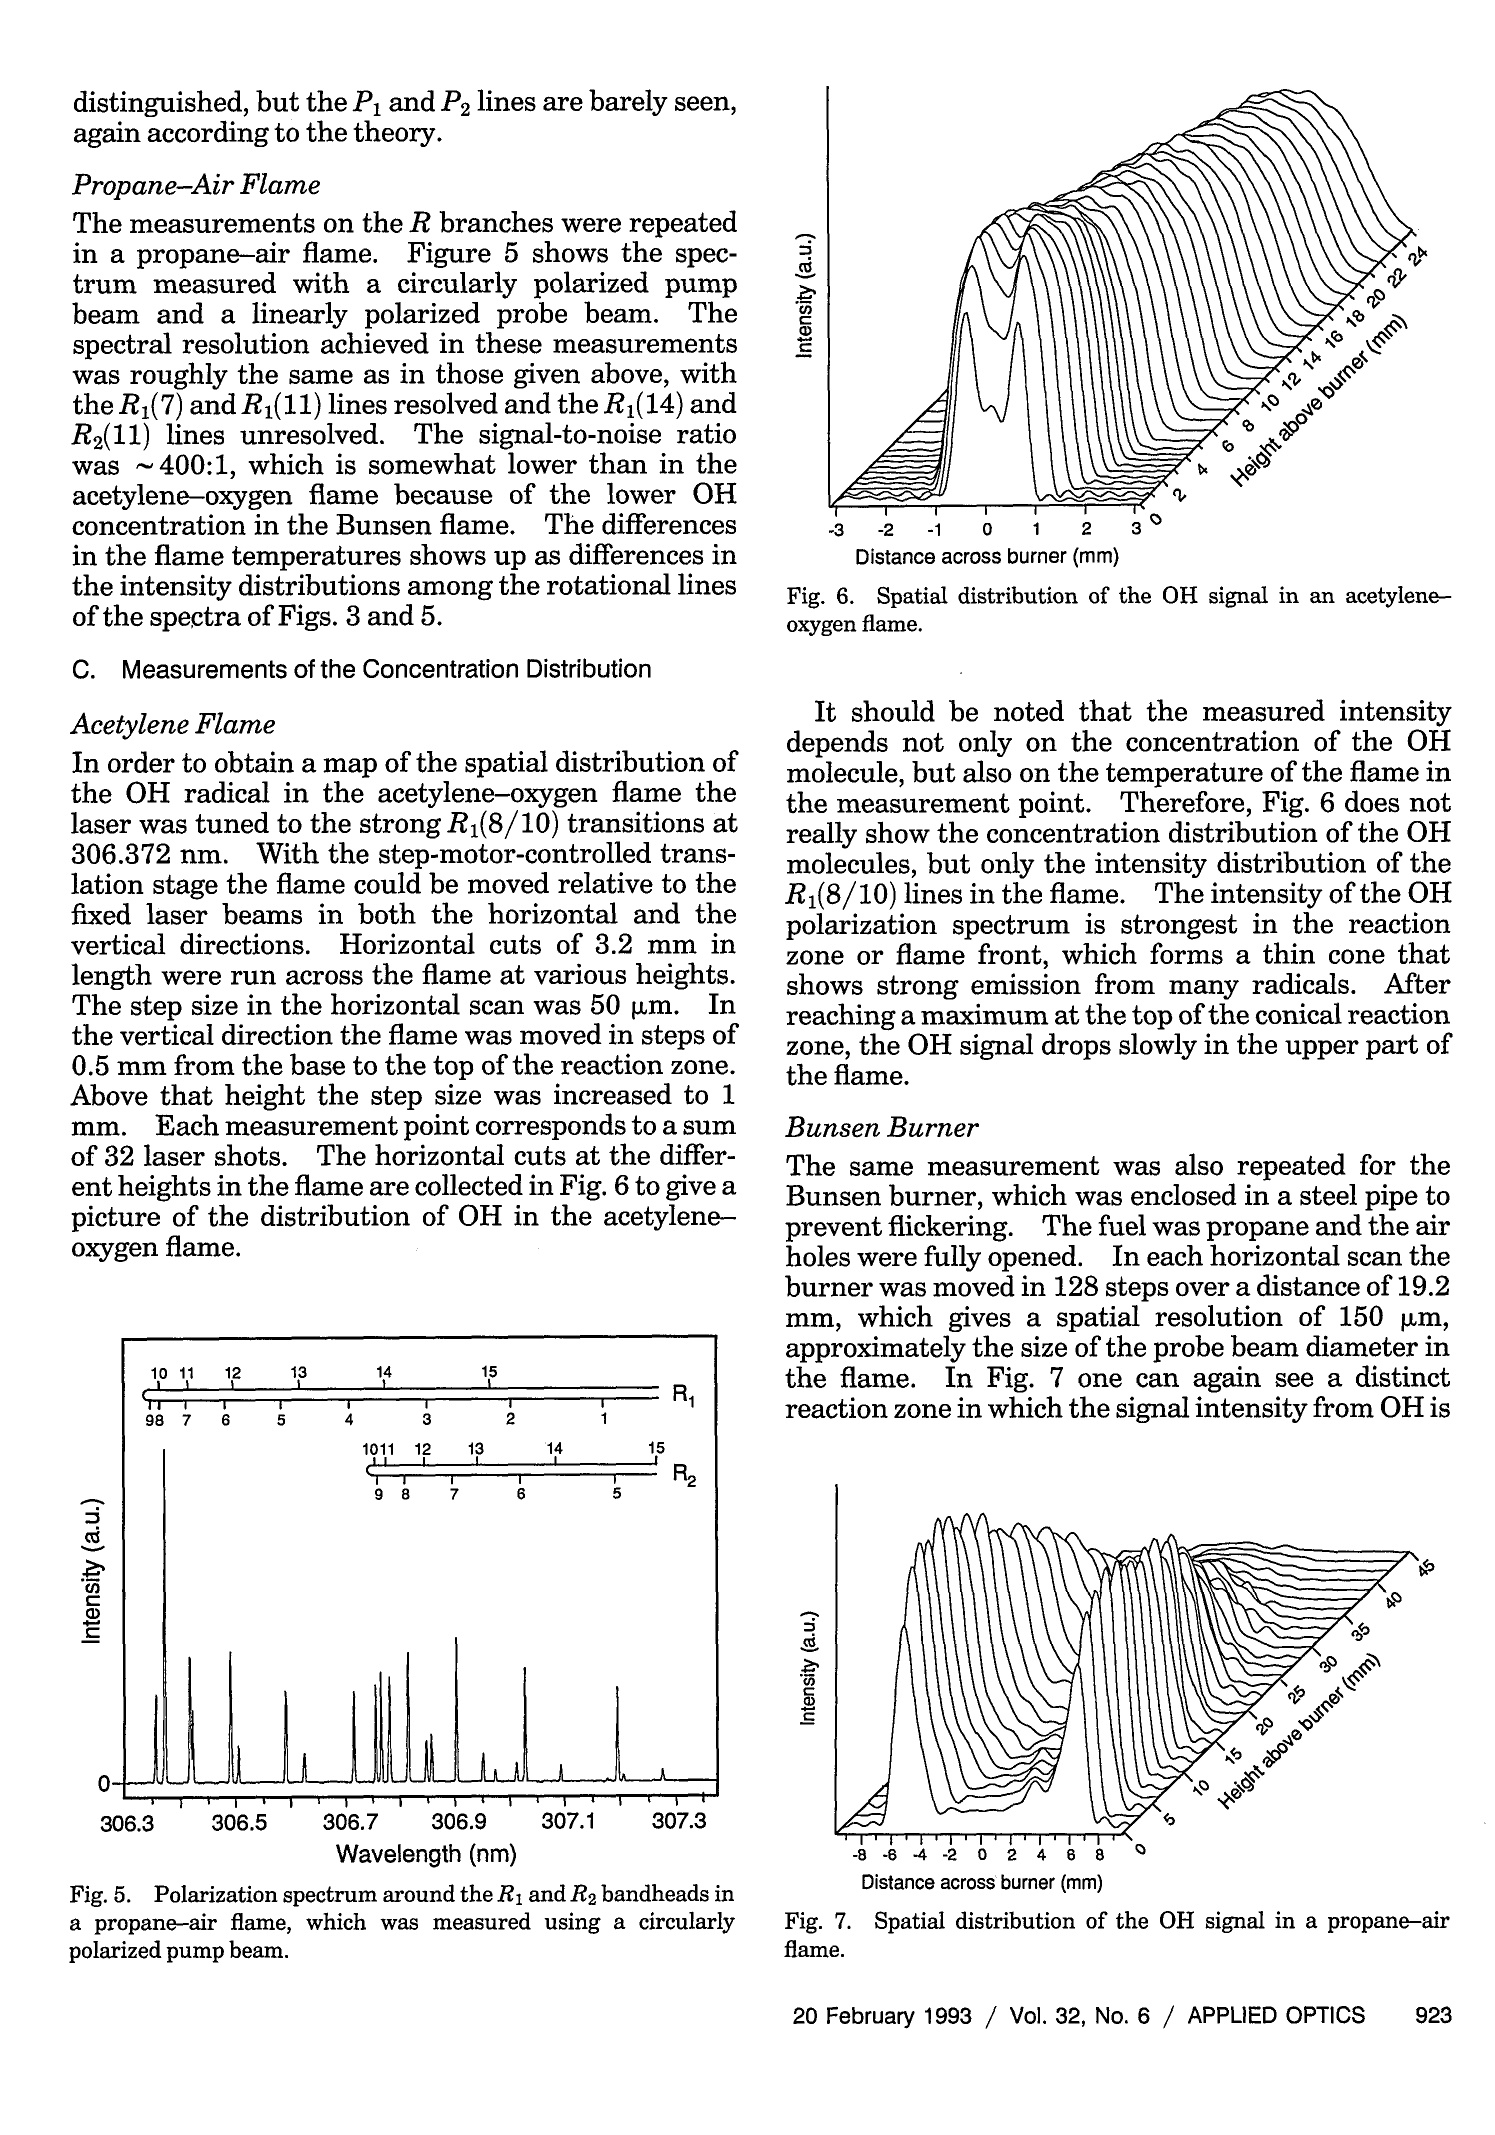
where Spatially resolved multispecies and temperatureanalysis in hydrogen flames Wolfgang Reckers, Lutz Huwel, Gerd Grunefeld, and Peter Andresen We report on spatially resolved simultaneous measurements of temperature and majority speciesconcentrations along a line segment in a premixed laminar Ha-air flame. The results are obtained fromRaman and Rayleigh seattering by using a narrow-band KrF excimer laser and a spectrally and spatiallyresolving detector system that consists of a high-throughput spectrometer and a gated, intensified,two-dimensional CCD camera. The data presented here are integrated over 100 laser shots. Absolutedensity profiles of N2, 02, HzO, and H2, as well as temperature profiles at various heights through theflame, are presented. A discussion of the required calibration procedures and a summary of thenecessary spectroscopic background are also included in this paper. Introduction During the past decade or so it has been shown by thecombined efforts of many research groups that laser-based diagnostic methods can bae appelied :to a largevariety of combustion systems with exceptional suc-cess. This success, and the potential for even morepenetrating and more powerful applications, has itsorigin in the basic nonintrusiveness, high sensitivity,and spatial and temporal resolution that can beachieved with laser methods. A large number ofspecialized approaches have been developed and char-acterized, and are being applied in many differentsituations..Scattering methods such as Rayleigh,spontaneous, and coherent Raman (such as coherentanti-Stokes Raman spectroscopy), as well as absorp-tion and fluorescence techniques have been shown togive useful information. In particular, there hasbeen much progress in obtaining several independentdata simultaneously, e.g., one- or two-dimensionaldetection of specific combustion constituents or localmultispecies density measurements. ]In the first case,variants of laser-induced fluorescence (LIF) tech-niques have proven to be particularly useful.Forexample, two-dimensional probing by LIF1-33(so- ( W. Reckers a nd P. Andresen are with Max-Planck-Institut fur Stromungsforschung, Gottingen, Germany; P . A ndresen is also with t he Fakultat fur Ph y sik, Universitat Bie l efeld, Bielefeld, Germany. L. Huwel is with the Department of Physics, Wesleyan University, Middletown, C onnecticut; G. Grunefeld is w i th the Laser Laboratorium Gottingen, e.V.,G o ttingen, Germany. ) ( Received 1 July 1992. ) ( 0003-6935/93/060907-12$05.00/0. ) ( o1 9 93 Optical Society of America. ) called planar LIF) and its quench-free counterpart ofLIF by predissociative states4,5 have been developed,and merits and limitations of their applications haveee described. Besides Lir 6 Raan scattering.1..has also been used in Recentlythe second case.some progress has been reported in measuring theone-dimensional distribution of several combustionspecies simultaneously.’ Certain advantages and lim-itations are associated with pointwise, and one- andtwo-dimensional measurements in general. In point-wise techniques, several species can be detected simul-taneously by means of efficient spectral filtering.However, spatial resolution and accuracy are usuallylimited by interfering radiation from neighboringeas. In contrast,two-dimensional methods canyield superior spatial information that is, however, ingeneral, constrained to a single species. In thisregard, one-dimensional imaging offers a favorablecompromise, combining good spatial resolution, atleast along a line, with the capability of excellentspectroscopic filtering and thereby the capability ofsimultaneously detecting several different species.Here we describe experiments in which Raman scat-tering from all majority species in a H-air combus-tion system was quantitatively measured along anarbitraryline.The analysis of these experimentsyields spatially and spectroscopically well-resolvedinformation about the number density variation ofthese species along the chosen line. Because of thecomplex nature of even a relatively simplecase suchas stationary H2-air combustion and because of theeven more challenging demands of other potentialapplications an improved understanding of such sys-tems will come only from measurement techniques that provide simultaneous information on as manydifferent aspects as possible. In particular, of ut-most importance are both the instantaneous and thetime-averaged spatial distribution of the various ma-jor (02,N2,H2,H20) and minor (mainly OH, NO, etc.)constituents in relation to geometric parameters andoperation conditions of a given combustion device.The experimental method chosen here permits theextraction of one-dimensional density maps of allmajority species and relies on recording wavelength-dispersed images of Rayleigh and Raman scatteringoff those molecules along the path of a focusedtunable excimer laser...The current work was stimu-lated, in part, by recent papers on excimer-laser-based Raman scattering in combustion that clearlydemonstrate the strength and some of the problemsofthis method.7.8 This paper is organized to give asomewhat comprehensive review of this new tech-nique, starting with a survey of the theoretical back-ground needed to use Rayleigh and Raman scatteringas combustion diagnostic tools.Next, aspects of theexperimental setup and experimental procedures areexplained.The discussion is then continued with asection on the relevant spectroscopy, including alisting of pertinent cross sections. Then a shortdescription is offered on how to extract the desiredinformation from the raw data in terms of one-dimensional density and temperature maps.In thiscontext, the importance of proper calibration proce-dures is stressed, and ways of implementation areoutlined. Finally, examples of analyzed sets of scat-tering images are presented with the aim of definingthe performance parameters of our particular ap-proach and the method in general. Rayleigh and Raman Scattering as Combustion Probes It is well known that spontaneous elastic and inelasticscattering of light can be used as a potentially power-ful probe of combustion systems.I1 Oneof the advan-tages of light scattering over, e.g., fluorescence detec-tion is the reduction in complications that are due toquenching; since the scattering is instantaneous thereis negligible collisional interastionon. Therefore spa-tially resolved detection of such scattered light carriesdirect information about the spatial distribution ofthe pertinent molecules. There are, however, sev-eral aspects that make it difficult to use Rayleigh orRaman scattering as combustion diagnostic tools.Chief among them are the small cross sections forRayleigh scattering and even more so for Ramanscattering, a typical value for Raman cross sectionsbeing 10-30 cm²/sr for N2 at 488 nm.The well-known u4 scaling of both Rayleigh and Raman scatter-ing suggests the usage of powerful UV lasers. It isindeed possible to take meaningful Raman spectrawith a single laser pulseN.evertheless, even underthose optimized excitation conditions, data averagingover more than one laser pulse may be inevitable.Obviously this makes true instantaneous imaging ofdensity traces impossible, which may appear to be anecessity in turbulent systems.However, it has been demonstrated that averaged measurements, evenin systems with highly turbulent behavior, can supplyuseful information.12Another problem associatedwith both scattering processes is the possible interfer-ence at the fundamental wavelength (Rayleigh) orshifted wavelength (Raman) by mechanisms otherthan the ones of interest.. In the case of Ramanscattering, the displacement of the Raman lines isobviously characteristic for the specific molecule and,given a sufficiently high-resolution spectrometer, onecan, in principle,discriminate against light emissionor scattering from most other sources. However,two practical points stand in the way of a straightfor-ward utilization of a Raman-based diagnostic. First,the intrinsic weakness of Raman scattering, evenwhen UV light is used, suggests the use of high-throughput spectrometers. For a given detectionsetup, the throughput can be increased by using wideentrance slits. Obviously, wide entrance slits implypoorer resolution with the concomitant possibility ofinterference by neighboring spectral features. Sec-ond, and this makes the aforementioned problemmore severe, under conditions of UV excitation ofRaman signals with excimer lasers their less-than-perfect bandwidth (~0.5 cm-1 or 15 GHz) and resid-ual broadband contribution make it a real challengeto avoid resonantly exciting some of the many constit-uent molecules in such a complex environment ascombustion. Furthermore, in ArF-laser-based diag-nostics of combustion systems involving hydrocar-bons, broadban11d emission may be present at allexcitation wavelengths.4 Fortunately such broad-band interference problems are less significant in thecontext of 248-nm probing of H combustion. Greatcare in the experimental approach and subsequentdata analysis is, nevertheless, required for extractingthe desired information from measured data.1.Inparticular, since resonance fluorescence is usuallyseveral orders of magnitude stronger than Ramanscattering, the intensity in a given Raman line may besignificantly influenced by line emission featureseven if they are relatively far away.The practicalusefulness and problems stemming from this interfer-ence have been partially addressed. In particular, itwas found that for the KrF laser at 248.623 nm aminimum in O2 and OH fluorescence excitation existethat, under certain conditions, permits the recordingof interference-free Raman-scattering signals from02, N2, H2, and HO. These scattering measure-ments were obtained from a small volume elementthat corresponds to a linear spatial resolution of ~0.4mm.We used a two-dimensional camera as a detec-tion device, and we report here an extension of thisapproach to simultaneous measurement of theseRaman signals along a line segment of~4 mm in thefocal region of a tightly focused KrF laser...The nextsection describes the experimental arrangement. Experimental Setup and Procedures In principle, the experimental approach to obtain thedesired spatially resolved information is similar to those used in related previous experiments from thisgroup.3-5,13 Figure 1 depicts the schematic experi-mental setup as used in the experiments describedhere. A tunable, narrow-band KrF laser (LambdaPhysik, EMG 150) is focused with a 2-m CaF, lensinto a premixed H2-air flame.The laser has atypical pulse energy of 200 mJ, a pulse duration of~15 ns, and a locking efficiency of~95%, i.e., 95% ofthe output energy is delivered in a band of ~0.2 cm-with a selectable center wavelength, whereas theremaining 5% of the energy is distributed, accordingto the gain profile of this type of laser, betweenapproximately 248 and 249 nm. The output of thelaser is horizontally polarized to the degree to whichit runs narrow band. Since detection of Raman andRayleigh scattering is most efficient in a directionperpendicular to the laser E vector (and because, forease of use, the detection axis is horizontal) we alsorotate the laser polarization by 90° with an appropri-ate 入/2 plate.. At the focal point of the focused laserbeam a laminar premixed H2-air flame is generatedwith a small burner mounted on an x-y-z-translationstage. This burner has a nozzle with an exit diame-ter of~2.5 mm. Gas flows are metered for H andsynthetic air (N2:02=4:1) supplies and are typicallyadjusted for the data shown here at stoichiometricratios of 1.7 standard liters per minute(SLPM) for H2and 4.8 SLPM for air. Under typical operaconditions flows are stable to within the uncertaintyofthe meter reading (±5%). A certain portion of the light, be it from scattering,spontaneous emission, or LIF, that emerges from thelaser focal line volume is imaged with a pair of quartzlenses onto the entrance slit of a low f-number (f/#)flat-field spectrometer (Oriel, Multispec). The light-gathering lens is chosen with an f/# of 1; the otherlens is selected with an f/# of 4 to match closely thespectrometer f/# ooff 33..77.. For this experiment,thespectrometer is mounted so that the entrance slit isoriented horizontally, i.e., parallel to the laser beamilluminated flame segment.. After dispersion of theentrance slit image by a grating with 1200 lines/mmthe resulting line spectrum is projected by the refocus-ing mirror ofthe spectrometer onto the exit plane, Fig. 1. Experimental setup for recording one-dimensional Ray-leigh and Raman profiles in a Hz-air flame. OMA, optical multi-channel analyzer. where it is intercepted by the photocathode of an 18mm, proximity-focused image intensifier whose out-put, in turn, is fiber optically coupled to a two-dimensional CCD detector array. In this particularset of experiments we employed a gated image intensi-fier that is capable of switching times of 100 ns, ademagnifying fiber link with an exit-to-entrance diam-eter ratio of 11:19, and an uncooled 286 ×385 CCDchip, all incorporated into a slow-scan camera (LaVi-sion, FlameStar). The camera and the laser arecontrolled by an IBM-compatible PC operating underspecialized laser diagnostic software (La Vision). A key aspect of the experiment is to optimize theimaging of the laser-irradiated line through the flameonto the spectrometer entrance slit and eventuallyonto the CCD detectorarray.This point is of criticalimportance for a quantitative analysis ofthe variousRaman lines, both in terms of relating their intensi-ties to each other as well as deducing informationabout spatial density gradients. After several ap-proaches we developed the following scheme thatappears to give a maximum signal together with thesharpest images achievable with the overall opticalarrangement used. The procedure can be conve-niently broken down into several sequential steps: (1) The spectrometer grating is adjusted to dis-play the appropriate wavelength range from ~240 to320 nm with the help of a Hg pen lamp orientedparallel to the spectrometer entrance slit.The lampis operated to obtain high output at the 253.4-nmline.Also visible with this setting are the 265-,289.4-,296.8-,302.2-, and 312.6-nm lines of Hg. (2) The same Hg lamp is used to illuminate fromafar a straight piece of wire with a known diameter.The wire is positioned vertically along the flame axis,i.e., pointing to the center of the burner nozzle. (3)The two imaging lenses shown in the appara-tus sketch of Fig. 1 are, at first, crudely adjusted toproject an image of the wire onto the center of the(horizontally oriented) input slit. (4Then careful and repeated adjustments aremade to obtain a dispersed image of the Hg lamp,which exhibits simultaneously the sharpest possibleshadows on all the Hg lines visible. For this pur-pose, accurate and reproducible lens positioning isessential. In particular, the movements along theoptical axis to ensure that the object is at the focalpoint and vertical movement to ensure that the imageis projected exactly onto the spectrometer slit must bemade precisely. (5) Next the KrF laser focus is aimed, with thehelp of the turning mirror, as exactly as possible ontothe wire without further adjustments of the lenses.At this point the height of the laser beam above theburner nozzle is also established and the wire isremoved. If the flame is then ignited, it was foundthat all spatially varying features in the flame Ramanspectra were as sharp as possible. Once the optical alignment, as described above, iscompleted one has, at the same time, a calibration of the spatial resolution and magnification of the overallsystem. The latter is simply obtained from a compar-ison of the actual width of the shadow-casting wire tothe full width at half-maximum of the correspondingimages at the various Hg lines. TWith the two lenseschosen for this series of experiments (f=5 cm, fe=20 cm) the observed overall magnification, i.e., theratio of final image size on the CCD chip to the objectsize, was m = 1.8, which also reflects the scale changeintroduced by the tapered fiber link between theimage intensifier and the CCD array. This magnifi-cation corresponds to a total length of ~4 mm beingimaged along the short side of the CCD array, whichcomprises 286 pixels or, in other words, a nominalspatial resolution of14 um per pixel. However, theactual spatial resolution is limited by the modulartransfer function of the image intensifier and theimaging quality of all other components (in particu-lar, that of the imaging lens with an f/# of 1).Empirically a minimum spatial resolution of~150um along the laser beam was found by analyzing theintensity change along this direction associated witha shadow-casting object in the focal plane. Measure-ments of the laser focal spot size, with the help of theUV-objective-equipped CCD camera, reveal dimen-sions of 750 pm in the vertical (parallel to the shortside of the monochromator entrance slit) and 200 wmin the remaining direction (parallel to the optical axisof the imaging system). Because the imaging lensesused in this experiment have an actual magnificationof 3.1[=1.8/(11:19); see above]the actual observedvolume is 150 p.m×200 pm × 90 um, the latter valuealong the vertical dimension being the portion of theimage passing through the 280-um-wide entranceslit. Spectroscopic Details One of the many advantages of the above-mentionedsetup is its versatility in obtaining various types ofdata that are relevant for diagnostic purposes and theease with which a large quantity of such data can beobtained.. To be sure, the ease refers to a situation inwhich the experimental setup has already beenaligned, tested, and optimized. Examples of thekinds of diagnostic data obtainable are the laser beamprofile in the vicinity of the focal zone, excitation-emission spectra of the combustion system at hand,and one- and two-dimensional density maps of thesystem based on scattering and emission techniques.Because of the overriding importance of interferenceproblems between fluorescence and Raman signals,this section is devoted to discussing the issue in detailfor the case of a H-air flame and focused KrF laserexcitation. For the purpose of establishing condi-tions that minimize interferences we recorded excita-tion-emission spectra like the one shown in Fig. 2.Shown in this figure is the dispersed emission andscattering intensity of an oxygen-rich H-air flame asa function of the exciting UV laser wavelength.Along the vertical axis, the wavelength of the scan-ning KrF laser is displaced as it goes from one end of the tuning range (248nm, top) to the other end (249nm, bottom). At any given wavelength of the laser,the resulting emission and scattering spectrum of theflame is recorded and displayed along the horizontalaxis.. The span of the horizontal line, 245 to 310 nm,includes the Rayleigh line (leftmost vertical trace)and O2 and N, Raman lines, as well as several O2 andOH LIF features. ]Intensities are incorporated inFig. 2 as false colors; the figure can thus be viewed asa contour map showing at each point the intensity oflight reemitted by the flame at Nemission (horizontalaxis) following excitation by the laser at 入laser (verticalaxis). The procedure that we used to obtain thisexcitation-emission spectrum is as follows: (1).)Wwith the experimental setup described in theprevious section, we focus the KrF laser with a 2-mlens into a line that passes through the top section ofan oxygen-rich H-air flame; (2)) The spectrometer-gated CCD camera detec-tion system is optimized and aligned to record emis-sion from 245 to 310 nm with a slit width of 280 umand a 1200-line/mm grating; (3)The data acquisition software is set to inte-grate each image along a certain interval along thespatial direction (the entrance slit direction) and toaverage over a predetermined number of laser pulses.This software control effectively uses the two-dimensional CCD camera as a one-dimensional opti-cal multichannel analyzer with high sensitivity; (4)As the CCD camera-software collect emissionspectra (horizontal cuts through Fig.2) the laser istuned at a scan speed of 0.3 cm-1/s from 248 to 249nm At either end of the tuning range, the laser runsbroadband with the resultant emission spectra beingthe sum of all individual features seen in the narrow-band portion of the scan. Eventually, once the laserruns completely broadband, the emission spectra donot change anymore along the vertical directiontoward the top and bottom ends of Fig. 2.The totalaccumulation time of the spectra shown in this figurewas ~15 min. iSeveral features of this excitation-emission spectrum are worth mentioning..The first,and obvious one, is that an enormous amount ofspectroscopic observations can be accomplished withsuch an experimental setup in a short time. Oncemeasured,such plots allow us to obtain, from verticalslices, excitation spectra of the system under studywith a variable bandwidth of detection and an arbi-trary center emission wavelength. Likewise horizon-tal profiles reveal the emission spectra of the systemin response to any excitation wavelength (or combina-tion of wavelengths). Second, Raman emission andresonantly induced fluorescence are easily discerniblein the narrow-band portion of the spectrum as contin-uous vertical bands in the first instance and isolatedisland-like features in the latter. Third, from spec-troscopic pecularities one can rapidly identify whichmolecular species is resonantly excited. In thithis spe- cific instance O2 emission is characterized by sevenlines to the red of the Rayleigh peak, whose spacingsincrease with increasing wavelength. This behavioris most clearly seen in the broadband portion of theexcitation spectrum (top and bottom of Fig. 2).These lines correspond to emission from two differentexcitation bands of theO Schumann-Runge system,which is accessible with the KrF laser, namely, the0<6 and the 2 ← 7 excitation.144Because of therapid predissociation of the OB state there is nonoticeable rotational redistribution even at atmo-spheric pressure, and the observed peaks representthe two unresolved P amd R lines followingexcitationof a particular J level. Similarly predissociation ofthe u’=3 state of OH, which is accessible as a 3←0excitation within the KrF tuning range, assuresequally simple emission features for this molecule.4In this case, because of the large rotational levelspacing and the II-2 nature of the transition, threeclearly separated P-, Q-, and R-brhawer which are alsnindicateda nichn lFiinpes 2a rTehedisplayed excitation-emission spectrum also clearlyreveals the existence of KrF laser wavelengths atwhich no resonant OH and O, fluorescence is observed.These regions are indicated by arrows in Fig 2 andoccur at the following values: 入1=248.623 nm (thewavelength chosen in Ref. 7), x2=248.404 nm, andothers. By tuning the laser to these wavelengths, wecan observe Raman scattering against a minimum ofinterfering fluorescence. In the experiments de-scribed in this paper, we have explored both gapwavelengths and found that they both give usefulresults. Finally, a point not evident from Fig. 2should be stressed concerning nonlinear effects andpossible interferences that are absent in a simpleone-photon picture.Because of the need for highlaser power densities to compensate for the smallRaman efficiency, multiphoton effects can becomeimportant. In the context of a KrF laser probe ofH-air combustion systems, two-photon resonantexcitation ofH20 is important.15The excited C stateof H20 can either fluoresce with a broad emissionband near 400 nm or predissociate into OH(A2),which subsequently fluoresces, with the strongestfeatures being those of the u =0 bands near 308 nm.Although not visible in Fig. 2, these emission struc-tures are definitely present in less oxygen-rich flames.As is discussed in detail in the section on calibration procedures, a quantitative analysis of Raman- andRayleigh-scattering data in terms of species densitytraces may require that, for the various speciesinvolved, absolute or relative cross sections at thechosen excitation wavelength are known because onlyN and O2 can be calibrated directly from room air(see calibration procedures).There are several im-portant resources in this regard that we have usedand that can prove useful for future experiments.References 11 and 16-18 have experimental andtheoretical information concerning those kind of datafor various molecules, including H2, 02, N2, and H O,as well as several carbon-containing species.In Ta- ble 1 we have summarized the cross-section values forthe relevant major constituents in the context of theH-air combustion and 248-nm excitation.It shouldbe pointed out here that the usual v4 scaling of thescattering cross sections can fail to predict the accu-rate value of the cross section by a wide margin whenresonance enhancement effects are important, asthey are, for example, in the case of UV excitation ofH and O2. Density Maps The primary information contained in the measuredscattering intensity is the one-dimensional spatialvariation of molecualr densities pertaining to themajority species O2, N2, H20, and H2.We firstelaborate on how this information can be extractedfrom the raw data. Once this information is avail-able it can also be used to calculate temperatureprofiles along the same path. The discussion on howsuch temperature profiles can be obtained is given inthe section on temperature profiles. If we define thespatial coordinate along the laser direction as x thenthe corresponding densities in the object under studycan be labeled as n(J)(x), where j = 1, 2, 3, and 4,indicate the molecular species in the sequence listedabove. What is actually measured is a scatteringintensity of the appropriate Raman line, properlyintegrated over the associated wavelength range andcorrected for any background, as it is intercepted by acertain number of pixels viewing a spatial intervalfrom x; to x; +Ax;. That intensity or, more accu-rately, the number ofelectrons in those pixels accumu-lated during a predetermined number oflaser pulsesis denoted here by N.(. The running subscript icounts from 1 to 285 and reflects spatial incrementsofapproximately Ax=14 um and a total range of ~4mm in the flame,as explained in the section on theexperimental setup. The number N.() is related tothe average density n(j)(x;) of the particular moleculein the corresponding spatial range as follows: Table 1. Rayleigh and Raman Cross Sections for入=248-nm Excitation Rayleigh Vibrational Cross Section Raman Cross Section Gas (cm’) (cm2) H2 3.67×10⁻²⁷a 4.83×10⁻²⁹c 02 1.384×10-266 N2 1.555×10-266 1.54×10⁻²⁹c H2O 1.166×10-266 4.84×10⁻²⁹c aE. W. Rothe, Department of Chemical Engineering, WayneState University, Detroit, Michigan 48202 (private communica-tion,1991). bA. Koch, H. Voges, P. Andresen, H. Schluter, D. Wolff, W.Hentschel, W. Oppermann, and E. Rothe,“Planar imaging of aflame and of internal combustion in an automobile engine usingUV Rayleigh and fluorescence light,” (to be published). W.K. Bischel and G. Black,“Wavelength dependence of Ramanscattering cross section from 200-600 nm,”AIP Conf. Proc. 100,181-187(1983). The various symbols in this equation each expressone particular, more or less separable influence of theexperimental detection scheme on the final observ-able N()). Read from right to left, the right-handside of this equation is ordered to mimick howphotons, which are scattered off molecules of type j,are propagated through all relevant components,converted to electrons, and finally collected as a totalcharge eN in the relevant pixels with position indexi.It is understood that all thermally generatedelectrons and electrons that are due to any otheremission or scattering features collected in thosesame pixels have been properly subtracted.. Thesignificance of the symbols in Eq. (1) is as follows: Nz is the total number of laser photons impingingupon the system under study during the exposuretime of the CCD array (this may or may not comprisemore than one laser pulse), V. is the effective volume from which scattered photons are imaged onto pixels with spatial index i,n()(x;) is the average density of molecular species jin volume Vi,ω; is the solid angle under which volume element V.appears to collection optics,ol) is the average differential Rayleigh or Ramancross section of species j averaged over solid angle ωi,t is the overall optical transmission coefficient forthe wavelength range (including the grating efficien-cy),)fdetectornanoveratrodetection icieneyand gain.ophoton),q is the quantum efficiency of the photocathode ofthe image intensiferg is the gain factor of the image intensifier (includ.ing both the microchannel plate and the phosphor screen); o is the fraction of light emerging from the phos-phor screen that is guided by a fiber-optic taper to theCCDarray, z is the quantum efficiency of the CCD array. For the case in which two experiments are performedin two different objects such that only the density ofthe molecular species differs, the results of two suchmeasurements can be expressed in the simplifiedform where a represents the overall conversion and detec-tion efficiency for this type of measurement.If oneof these measurements (say k = 1) is done on anobject with the known density distributionnj(j)(x;),itis obviously a trivial matter to extract the unknowndensity from the observables N() without requiring This relationship suggests a powerful calibrationprocedure that is outlined in the following section.In essence, the desired density trace in the combus-tion system is obtained by a simple comparison withcorresponding density traces in a reference systemwith known densities. The cancellation of the overall conversion and detection efficiency factor o elimi-nates a series of potentially serious sources of errorsand uncertainties such as pixel-dependent gain orspatial variation of detection efficiency. Because ofthe mathematical simplicity of Eq. (2), which is usedto convert the raw data with the help of appropriatecalibration curves into absolute density traces andbecause of the relatively large number of data pointsinvolved in this process, the actual data analysis wasperformed with automated spreadsheets that importthe necessary raw data from appropriately chosentraces of the corresponding images and, with a fewkey strokes (we used, with good success, Lotus 123and Quattro Pro with their built-in macrocommandcapabilities), output tables and graphs of the absolutedensity traces. Examples of such output are shownin Fig. 3. Further information relating to thesedensity profiles can be found in the following sectiondocumenting the underlying raw data Calibration Procedures for O2 N2, H20,and H2 As was shown above, the relevant information con-tained in our data sets, namely the spatial variation ofthe density of the majority species 02, N2, HO, andH2, can be extracted most reliably by comparingintensities of Raman traces of unknown densitieswith those of the same species at known densitiesobtained under the same experimental conditions.In this regard ambient air serves as an almost idealcalibration object, at least for O and N, and, withsome care, even water-density calibration can beobtained from the water content of ambient air. Hon the other hand, obviously must be treated with adifferent approach. Minority components such asNO or, more difficult yet, OH deserve special consider-ation; since no attempt was made to measure thesespecies quantitatively in the current set of experi-ments they are not considered further here. In thesection on our preliminary experimental results, weadopted the calibration procedures outlined belowwith good success. Further details are given there.By measuring the barometric pressure po,the ambi-ent temperature To, and the humidity level of thelaboratory air we can easily establish the partialpressures and, hence, densities of O2, N2, and H,O at. the time of measurement.Then Raman traces ofthose air molecules are measured with the completelyaligned and optimized experiment, as described in thesection on experimental procedurreess.. Since the den-sity of the calibration gases is constant along the laser Rayleigh Fig.2.Excitation-emission spectrum of oxygen-rich He-air flame that was obtained by using a tunable KrF laser excimer laser. Density, Height z=2mm Density, Height z= 8mm (a) (b) Fig.3..(a) Measured density profiles of all majority species at a height of z =2 mm above the burner nozzle.(b) Measured density profilesof all majority species at a height ofz =8 mm above the burner nozzle polarized components, experiences this anisotropy.The components see different refraction indices and,therefore,experience different dispersions in the sam-ple.Their absorption in the molecules is also differ-ent. Consequently the linear polarization of theprobe beam is slightly rotated, and it acquires a smallamount ofellipticity. The signal detected in polariza-tion spectroscopy arises from analyzing these changesin the polarization state of the probe beam. A simple model calculation of the polarizationsignal in the limit of weak saturation is made in Refs.8 and 10. This calculation ignores the effects ofrepopulation of the ground state that are due tofluorescence and collisions.5.It also assumes that thelength of the pump pulse is short compared with theground-state relaxation time and that the upper stateis short-lived enough not to contribute to the inducedanisotropy. When the differences in the refraction indices andabsorption coefficients experienced by the two circu-lar components making up the linearly polarizedprobe beam are small, i.e., An = n+- n- <1 andAc=α+-α-<1, the intensity of the probe beamtransmitted through a nearly crossed analyzing polar-izer is where I is the incoming probe intensity, ω is the laserfrequency,L is the absorption path length, b (withb<1) is an extra ellipticity that is due to a smallbackground birefringence, caused, for example, byimperfect cell windows, and Io is a small backgroundterm that is added to account for the finite extinctionratio of the crossed polarizers. The angle0 corre-sponds to the amount that the polarization axis of theanalyzing polarizer deviates from the exact crossedposition. For a homogeneously broadened medium the fre-quency dependence of the absorption difference Ao isLorentzian. With the help of the Kramers-Kronigrelations one obtains a dispersion-shaped profile forthe difference in the refractive indices, An. Insert-ing these line shapes into Eq. (1), we can write theformula for the signal intensity as where x =(wo-w)/Y, y is the half-width of theabsorption profile, and Aao is the absorption differ-ence at the line center ω=ωo.Equation (2) includesa constant background term (5+02+b2)Io, a disper-sion-shaped term linear in Aog and 0, and Lorentzianterms that are proportional to bAog and (Aco).. A proper selection of the uncrossing angle 0 and thewindow birefringence b makes either the Lorentzianor the dispersion term dominant. The difference in the absorption of the two circularpolarization components of the probe beam dependson the effect of the saturating beam on the orienta-tion of the molecules. For the case of a circularlypolarized pump beam the absorption difference at linecenter for aJ;→Jtransition is8 where s are polarization-dependent numericalfactors, which are given in Ref. 8. The cross sectiond eris a sum over ofthe absorption cross sectmoJJM* and thus does nt depmIt is proportional to the square of the reduced matrixelement and depends on the Franck-Condon andHonl-London factors for the transition. I, is theintensity and t the duration of the pump pulse, andN is the total number density of the molecules on thelower state, which depends on the temperature. Under the same assumptions as above, the signalintensity can also be calculated for the case in whichthe pump beam is linearly polarized in a plane that isinclined by 45° against that of the probe beam. Theonly difference when compared with the result for thecircularly polarized pump light is that the dispersiveand the Lorentzian line-shape terms are interchanged.For a pump beam polarized in the z direction theabsorption difference Aoo'for the orthogonal polariza-tion components of the probe beam will be8 The polarization-dependent numerical factorsJare given in Ref. 8. For the case of a circularly polarized pump beam thefactors 'jj approach the value of %for large J valuesand AJ=±1, while for AJ=0 they decrease rapidlywith increasing J. For a linearly polarized pumpbeam the factors 'sj.approach the limit ofor largeJ and AJ 0 and the limit % for AJ=0. Con-sequently, saturation by a circularly polarized pumpwave produces a larger absorption difference for Pand R lines than for Q lines.Linearly polarized lightfavors the Q branch lines instead. 3.1Experimental Setup A schematic diagram of the experimental system ispresented in Fig. 1. A tunable dye laser (LambdaPhysik FL 2002) was pumped with an excimer laser(Lambda Physik EMG 103; pulse duration, 14 ns).To reach the 306-nm wavelength needed for theoptical pumping of OH molecules the output of thesulforhodamine B dye laser was frequency doubled ina BBO crystal (Lambda Physik FL37).The line-width of the frequency-doubled dye laser was 0.12cm-1. The output of the dye laser was divided into a Fig. 1. Experimental setup used for the detection of OH by usingpolarization spectroscopy. PMT,photomultiplier tube; SHG, sec-ond-harmonic generation. strong pump beam and a weaker probe beam.Thepump beam was first linearly polarized with a Glan-Thompson prism and then circularly polarized with aFresnel rhomb. Glan-Thompson prisms were alsoused as the linear polarizer and analyzer of the probebeam. The extinction ratio of the polarizer prismswas better than 10-5, A geometry with codirectional pump and probebeams was used. This does not permit the elimina-tion of Doppler broadeningThe loss of spectralresolution is not crucial, however, as the collisionalbroadening of the molecular linewidths at atmo-spheric pressures is of the same order of magnitude asthe Doppler broadening and the laser linewidth used.The beams were crossed by 60 mrad in order to obtainimproved spatial resolution. The pump and probebeams were focused into the flame with a 500-mmfocal-length lens placed in front of the polarizers.This geometry gives a transverse spatial resolution ofless than 100 um. The measurements were made in a premixed acety-lene-oxygen flame with a nozzle diameter of 1.0 mmand a Bunsen-type propane-air flame with an orificediameter of 10 mm. The flames were attached to atranslation stage, which permitted movement in thehorizontal and the vertical directions by a steppingmotor control. From the flame, the probe beamtraveled through the analyzer, a collimating lens, andseveral spatial filters before it reached a photomulti-plier tube (EMI QB9558). To minimize the amountof background light from the flame at the detector, adouble monochromator (Jobin-Yvon Ramanor U1000)was used for filtering the probe light. A microcomputer (HP 9000/216) was used to con-trol the measurement and to file the data.Thecomputer gave triggering pulses for the excimer laserand controlled the wavelength scanning of the mono-chromator and the dye laser. The photomultipliersignal was amplified with a preamplifier (NF Elec-tronic Instruments BX-31) and sent to a boxcar integrator (NF Electronic Instruments BX531) foraveraging.The boxcar was triggered from the ex-cimer laser pulse by a fast photodiode. 4. Measurements A. Saturation Measurements In order to determine a suitable power for the pumpbeam for further experiments, saturation measure-ments were carried out in the R bandhead of the A22-X2II(0,0) transition. The lines measured werethe R(9) and the R1(8/10) transitions.rThe twopeaks ofthe second transition could not be resolved astheir frequency difference was only 0.055cm-1, whichis clearly below the resolution limit for the setup. The peak intensities of the spectral lines understudy are plotted in Fig. 2 as a function of the pumpbeam intensity. According to Eq. (2) a square depen-dence of the signal intensity on the pump beamintensity is expected. In the log-log scale, the mea-sured values should form a straight line with a slopeof 2, which is also sketched in the figure. .At lowintensities the signal does show an almost constantincrease with the pump beam intensity. At higherpump intensities, however, a clear saturation behav-ior of the signal can be recognized.Even with thelower intensities the signal does not exhibit a squaredependence.This may be due partly to geometriceffects such as the inhomogeneous spatial distribu-tion of intensity in the beam and the incompleteoverlap of the pump and the probe beams. The increase of the spectral linewidth with increas-ing laser intensity was also studied by observing theR(9) line. Apart from power broadening, the mea-sured linewidth (FWHM) was composed of a laserlinewidth of 0.12 cm-1, an estimated collisional widthof 0.07 cm-1(see Ref. 11), and a Doppler width of~0.25 cm-1. The width of the R(9) line was foundto be 0.5 cm-1 at a 9-uJ pump pulse energy, and itslowly decreased to 0.28 cm-1 when the pulse energywas down to 0.3 pJ. Decreasing the laser intensityfurther did not lead to any noticeable decrease in thewidth of the line. In the experiments below the Fig. 2. Scignal intensity as a function of the pump beam intensity. B.Spectral Measurements of OH Acetylene-Oxygen Flame With the experimental apparatus described above,various measurements of the R branches in the42S-X21(0.0) band were made. TThhee upper curvein Fig. 3 shows a part of this band in an acetylene-oxygen flame. The bandheads of the Ri and R,branches are shown.This curve was recorded byaveraging 32 pulses per data point with a frequencystep of 0.1 cm-1. The frequency resolution of thescan can be seen by observing the R(7) and R(11)lines,which lie 0.432 cm-1 apart and are clearlyresolved. On the other hand, the R(14) and R(11)transitions, with a frequency difference of only 0.33cm-1, are not resolved. In the measured spectrumthe signal-to-noise ratio at the bandhead was betterthan 1000:1... The OH concentration in the flamewas estimated to ~1015-1016molecules/cm’. Fromthe observed signal-to-noise ratio and the estimatedOH concentration, a detection limit of better than1014 OH molecules/cmcan be inferred. To demonstrate the dependence of the polarizationsignal on the uncrossing angle 0 of the analyzer, the Fig. 3. Ri and R2 bandheads of theA22-X2II(0,0) transition inan acetylene-oxygen flame.TThe upper curve was measured withthe probe beam polarizers crossed.The lower curves show thedispersive line shapes, when the uncrossing angle of the analyzerwas approximately 0= 0.4° for the middle curve and 0 =-0.3°forthe lower curve. measurement was repeated with the polarizer andanalyzer slightly uncrossed..The results are shownin Fig. 3 (middle and lower curves). According to thecalculation for the case of a circularly polarized pumpbeam the signal contains a dispersion-shaped term,which is linear in 0. By opening the analyzer, thisterm quickly becomes dominant. It changes signwith the sign of 0, as can be seen by comparing thetwo lower curves in Fig. 3. They arerecordings withopposite opening angles of the analyzer. Becausethe analyzer is slightly opened, part of the probe beamenergy leaks to the detector, which enhances thebackground signal considerably, The slore of thebackground signal in the two lower spectra of Fig. 3 isdue to the wavelength dependence of the gain of thedye. All subsequent measurements were made withthe angle 0 as close to 0 as possible to minimize thebackground noise. Figure 4 demonstrates the effects of the pumpbeam polarization on the signal. The upper spec-trum was recorded with a circularly polarized pumpbeam.LT.he Piand Po lines come out strongand theQ lines are weak, just as the theory predicts.5.Thelower spectrum in Fig. 4 shows the same 3-nmwavelength range, but this time with a linearlypolarized pump beam. The polarization planes ofthe pump and probe beams make an angle of 45° witheach other.Now the @i and Q2 lines are clearly Fig. 4. Comparison of polarization signals in OH obtained byusing a circularly polarized pump beam (upper spectrum) and alinearly polarized pump beam (lower spectrum). distinguished,but the Pi and P, lines are barely seen,again according to the theory. Propane-Air Flame The measurements on the R branches were repeatedin a propane-air flameF.igure 5 shows the spec-trum measured with a circularly polarized pumpbeam and a linearly polarized probe beam.Thespectral resolution achieved in these measurementswas roughly the same as in those given above, withthe Ri(7) and R (11) lines resolved and the Ri(14) andR2(11) lines unresolved. The signal-to-noise ratiowas ~400:1, which is somewhat lower than in theacetylene-oxygen flame because of the lower OHconcentration in the Bunsen flame.The differencesin the flame temperatures shows up as differences inthe intensity distributions among the rotational linesof the spectra of Figs. 3 and 5. iC. |Measurements of the Concentration Distribution Acetylene Flame In order to obtain a map of the spatial distribution ofthe OH radical in the acetylene-oxygen flame thelaser was tuned to the strong Ri(8/10) transitions at306.372 nm.With the step-motor-controlled trans-lation stage the flame could be moved relative to thefixed laser beams in both the horizontal and thevertical directions.Horizontal cuts of 3.2 mm inlength were run across the flame at various heights.The step size in the horizontal scan was 50 um.Inthe vertical direction the flame was moved in steps of0.5 mm from the base to the top of the reaction zone.Above that height the step size was increased to 1mm. Each measurement point corresponds to a sumof 32 laser shots.The horizontal cuts at the differ-ent heights in the flame are collected in Fig. 6 to give apicture of the distribution of OH in the acetylene-oxygen flame. Fig.5...Polarization spectrum around the R and R2 bandheads ina propane-air flame, which was measured using a circularlypolarized pump beam. ig. 6. SpSaptsial distribution of the OH signal in an acetylene-oxygen flame. It should be noted that the measured intensitydepends not only on the concentration of the OHmolecule, but also on the temperature of the flame inthe measurement point. Therefore, Fig. 6 does notreally show the concentration distribution of the OHmolecules, but only the intensity distribution of theRj(8/10) lines in the flame. The intensity of the OHpolarization spectrum is strongest in the reactionzone or flame front, which forms a thin cone thatshows strong emission from many radicals..Afterreaching a maximum at the top of the conical reactionzone, the OH signal drops slowly in the upper part ofthe flame. Bunsen Burner The same measurement was also repeated for theBunsen burner, which was enclosed in a steel pipe toprevent flickering.The fuel was propane and the airholes were fully opened.. In each horizontal scan theburner was moved in 128 steps over a distance of 19.2mm, which gives a spatial resolution of 150 pm,approximately the size of the probe beam diameter inthe flame.In Fig. 7 one can again see a distinctreaction zone in which the signal intensity from OH is Fig. 7.Spatial distribution of the OH signal in a propane-airflame. highest. In contrast to the acetylene-oxygen e.however, here the signal intensity reaches a maxi-mum before the top of the reaction zone and goesdown quickly in the outer reaction zone. 5. Conclusions In this paper, the potentials of the use ofpolarizationspectroscopy for combustion diagnostics have beeninvestigated. In particular, this well-establishedtechnique of nonlinear laser spectroscopy was appliedto the detection of OH molecules in an acetylene--oxygen and a propane-air flame.The study of OHwas largely motivated by the important role thisradical plays as a transient reaction product in allhydrocarbon flames. Polarization spectroscopy is based on the interac-tion of two polarized laser fields in a sample.Thefields are tuned into resonance with electronic transi-tions in the molecules under study. Because of theresonant nature of the interaction, high detectionsensitivities can be achieved. The overall sensitivityof the method is improved further by the fact that thesignal propagates as a coherent laser beam, which caneasily be collected onto a detector. From the ob-served signal-to-noise ratio and the estimated concen-tration of OH in the flames, a detection limit of betterthan 1014 OH molecules/cm could be inferred. Byusing higher-quality optics and longer averaging timesor higher pulse repetition rates, we can expect furtherimprovement of the detection sensitivity. The measurement point in polarization spectros-copy is defined by the overlap volume of the twoteracting laser beams. PProrboeb volumes of less than1 mm can be achieved easily with crossed probe andpump beams. In this paper, the spatial resolutioncapability of the method was demonstrated by measur-ing the spatial distribution of the OH signal in thetwo flames. In the optical pumping process the behavior of theelectronic transitions of the molecule depends criti-cally on the polarization of the pump beam. Thepossibility of distinguishing between R, Q, and Plinesin the spectra by varying the pump beam polarizationwas demonstrated by measurements that were madewith linearly and circularly polarized beams. Thisfeature has a particular advantage in the assignmentof complex molecular spectra The polarization signal reflects the distribution ofthe molecular population on the lower electronic levelof the transition and, therefore, also permits thetemperature of the measurement point to be ex-tracted from the spectra. This aspect of the methodwill be elaborated further. An important problem in the use of polarizationspectroscopy in flame studies of a more quantitativenature is collisional relaxation. Measurements ofabsolute concentrations of radicals would require aknowledge of the collisional depolarization of themagnetic sublevels. Also, when strong saturation of the optical transition is present, the relaxation ratesof two electronic levels as well as of the optical. coherence need to be known. Furthermore, an accu-rate prediction of the spectra would require a moreelaborate theory that would include saturation ef-fects. The use of polarization spectroscopy in combustiondiagnostics offers the possibility of achieving a highspatial resolution paired with a high detection sensi-tivity. The measurement signal is, however, sensi-tive to changes in the polarization of the probe beamcaused, for example, by imperfections in the opticalcomponents or by particles in the flame.Polarization spectroscopy makes use of only two laser beamsof the same frequency and needs no phase matchingof the beams, in contrast to some other nonlinearspectroscopic methods.. Also, the use of a broadbandlaser and optical multichannel detection would per-mit single-shot measurements to be made in turbu-lent environments. Polarization spectroscopy maythus provide a useful and simple alternative to otherlaser techniques in combustion analysis. Financial support from the Jenny and Antti WihuriFoundation is gratefully acknowledged. References 1. D. R. Crosley and G. P. Smith,“Laser-induced fluorescencespectroscopy for combustion diagnostics,”Opt. Eng. 22,545-553(1983). 2. A. C. Eckbreth, Laser Diagnostics for Combustion Tempera-ture and Species (Abacus, Tunbridge Wells, England, 1988). 3. B. Attal, D. Debarre, K. Muller-Dethlefs, and J. P. E. Taran,“Resonance enhanced coherent anti-Stokes Raman scatteringin C2,” Rev. Phys.Appl.18,39-50(1983). 4. C. G. Aminoff, M. Kaivola, and T. Virtanen, “Investigations ofelectronically resonant CARS,”in Laser Spectroscopy VIII, W.Persson and S. Svanberg, eds. (Springer-Verlag, Berlin, 1987),p. 330. 5. K. Kohse-Hoinghaus, U. Meier, and B. Attal-Tretout,“Laser-induced fluorescence study of OH in flat flames of 1-10 barscompared with resonance CARS experiments," Appl. Opt. 29,1560-1569(1990). 6. P. Ewart and S. V. O'Leary,“Detection of OH in a flame bydegenerate four-wave mixing,"Opt. Lett. 11,279-281 (1986). 7. C. G. Aminoff, M. Kaivola, and K. Nyholm,“Degeneratefour-wave mixing applied to radical detection in a flame," inProceedings ofthe Eleuenth International Conference ofAtomicPhysics, C. Fabre and D. Delande, eds. (Ecole Normale Su-perieure, Paris, 1988), p. VII-7. 8. R. E. Teets, F. V. Kowalski, W. T. Hill, N. Carlson, and T. W.Hansch,“Laser polarization spectroscopy,”in Aduances inLaser Spectroscopy I, A. H. Zewail, ed., Proc. Soc. Photo-Opt.Instrum. Eng. 113,80-87(1977). 9. G. Zizak, J. Lanauze, and J. D. Winefordner,“Cross-beampolarization in flames with a pulsed dye laser," Appl.Opt. 25,3242-3246(1986). 10. W. Demtroder, Laser Spectroscopy (Springer-Verlag, NewYork, 1982), Chap.10,p.505. 11. T. Dreier and D. J. Rakestraw,“Measurement of OH rota-tional temperatures in a flame using degenerate four-wavemixing,"Opt. Lett. 15,72-74(1990). February / Vol. No. / APPLIED OPTICS PPLIED OPTICS /Vol. No. / February
确定

还剩10页未读,是否继续阅读?

产品配置单


北京欧兰科技发展有限公司为您提供《火焰,氢燃料中组分,温度,自由基,羟基检测方案 》,该方案主要用于其他中组分,温度,自由基,羟基检测,参考标准--,《火焰,氢燃料中组分,温度,自由基,羟基检测方案 》用到的仪器有德国LaVision PIV/PLIF粒子成像测速场仪、PLIF平面激光诱导荧光火焰燃烧检测系统
推荐专场


相关方案
更多
该厂商其他方案
更多