


采用美国Artium公司的相位多普勒粒子干涉仪(PDI)和德国LaVision公司的喷雾测试系统SprayMaster对多注入角度喷雾进行了实验和计算模拟研究。
方案详情

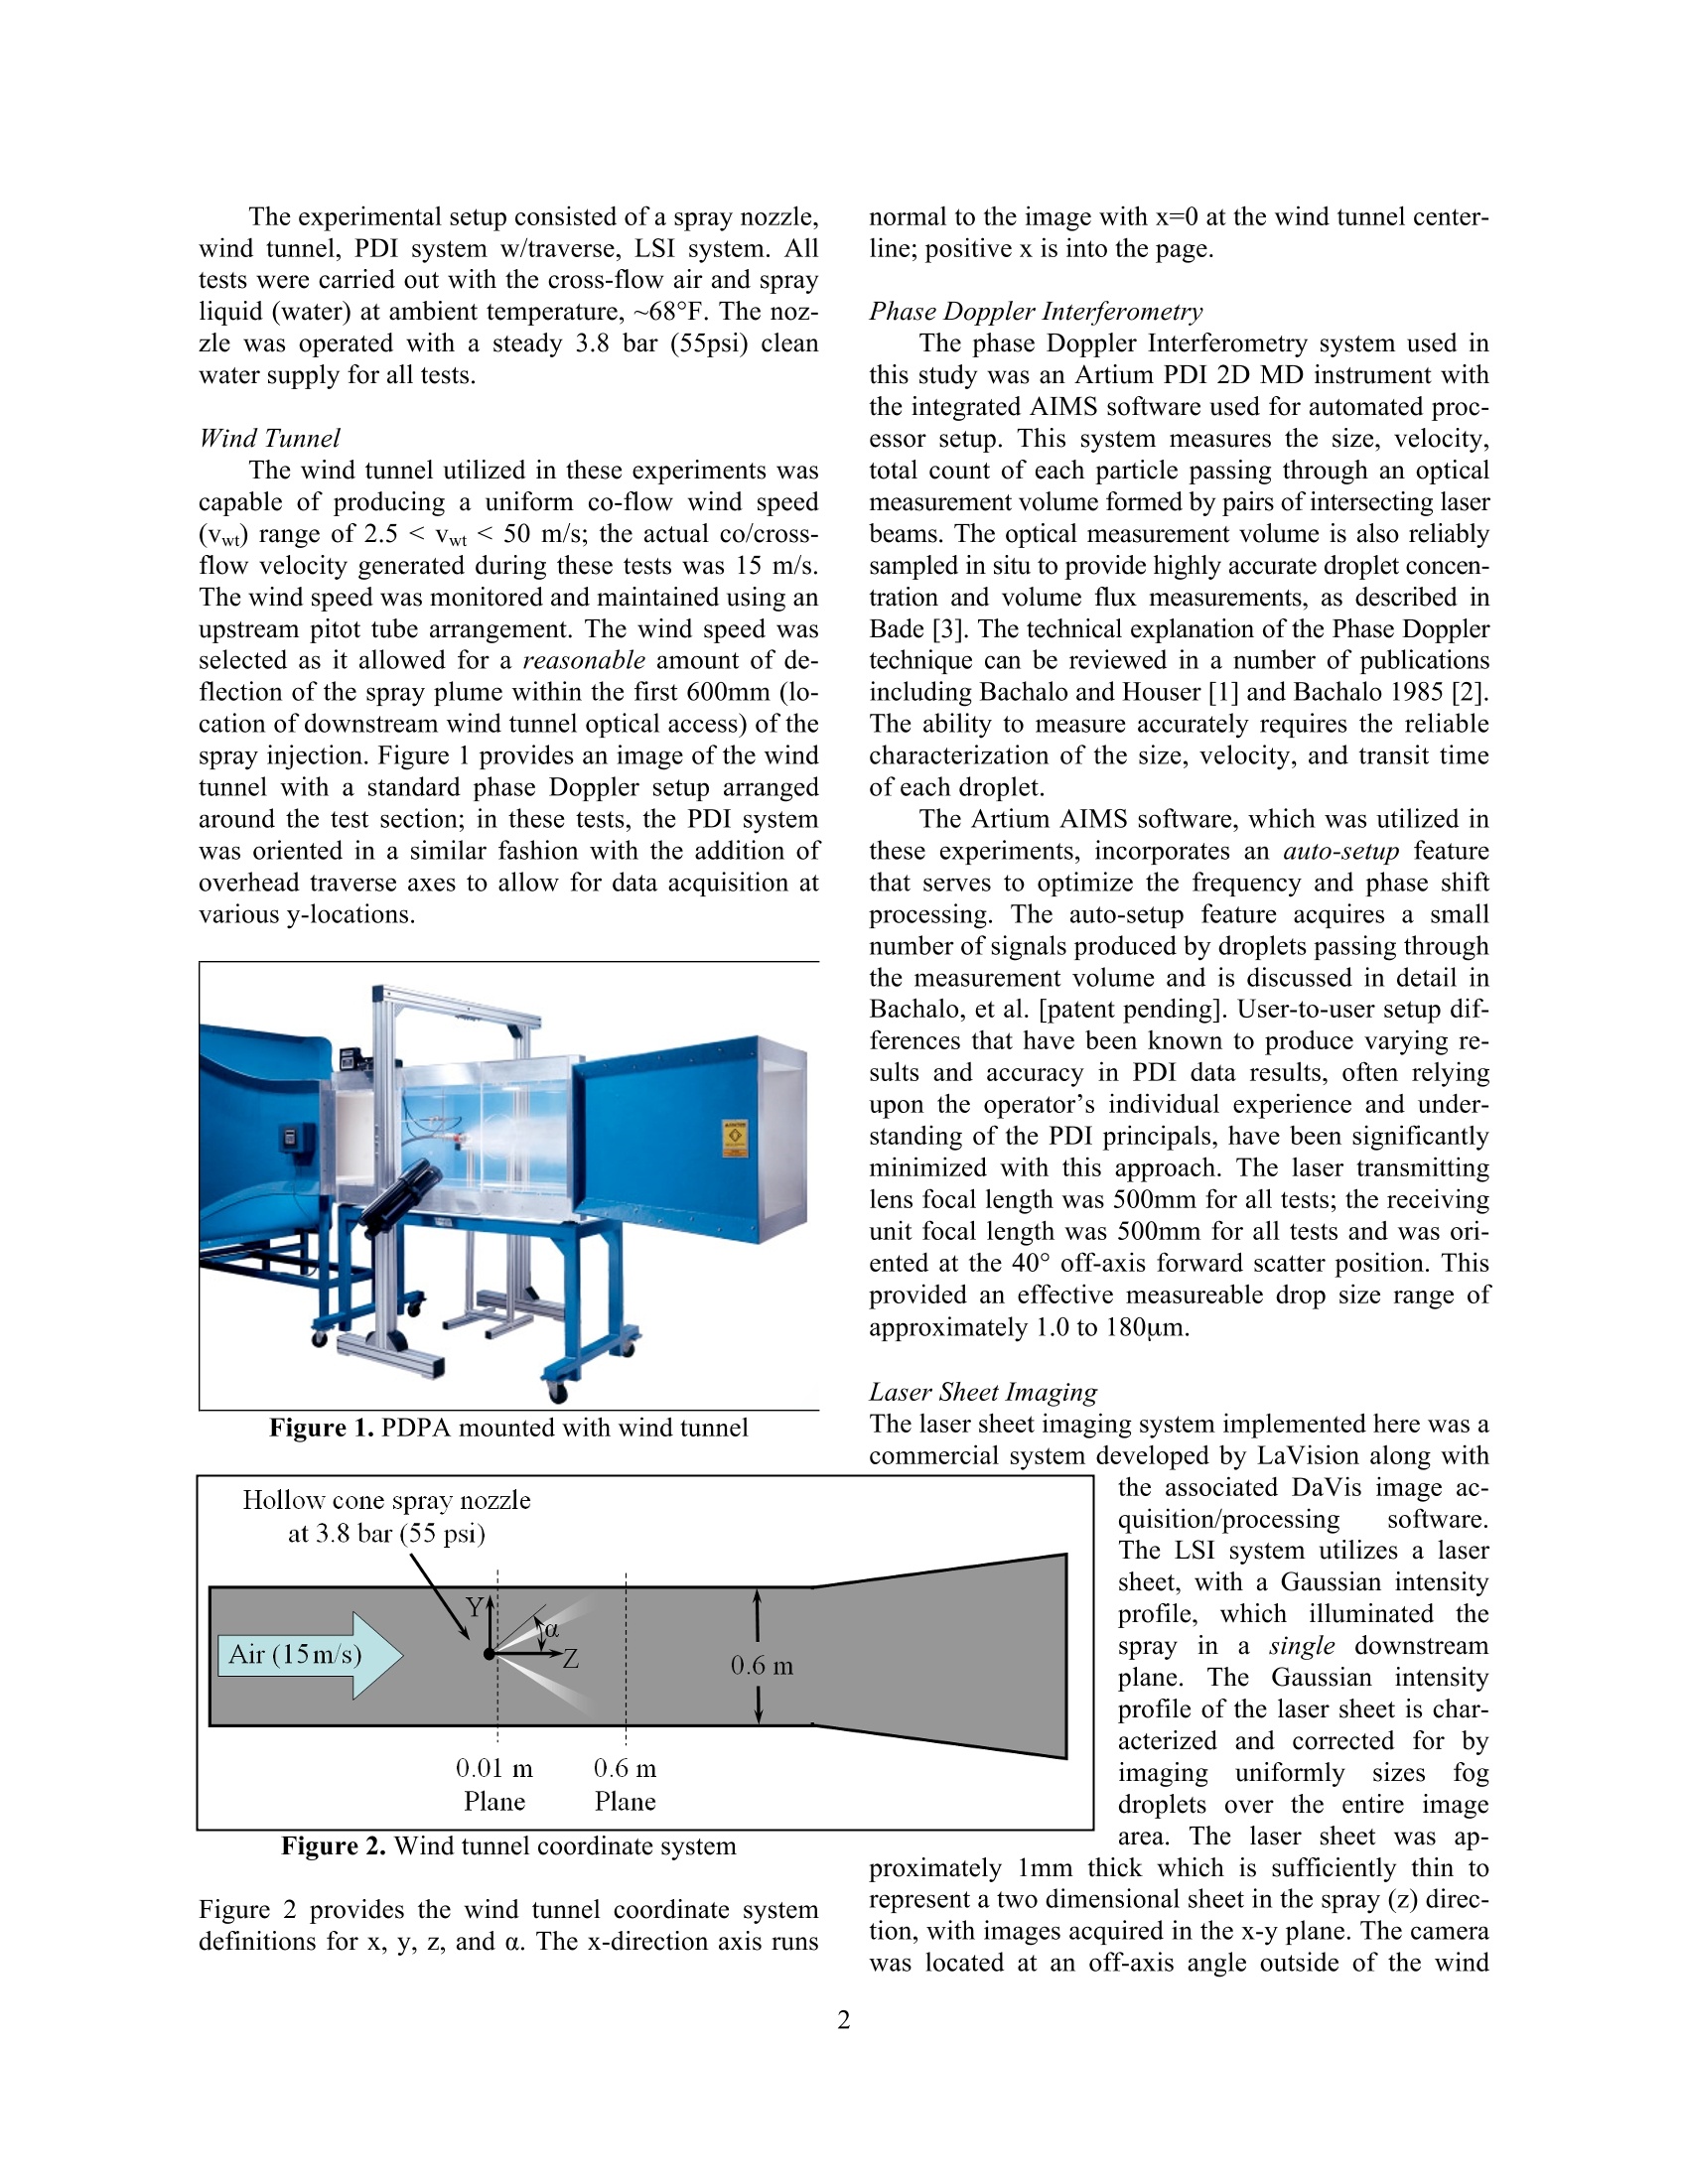
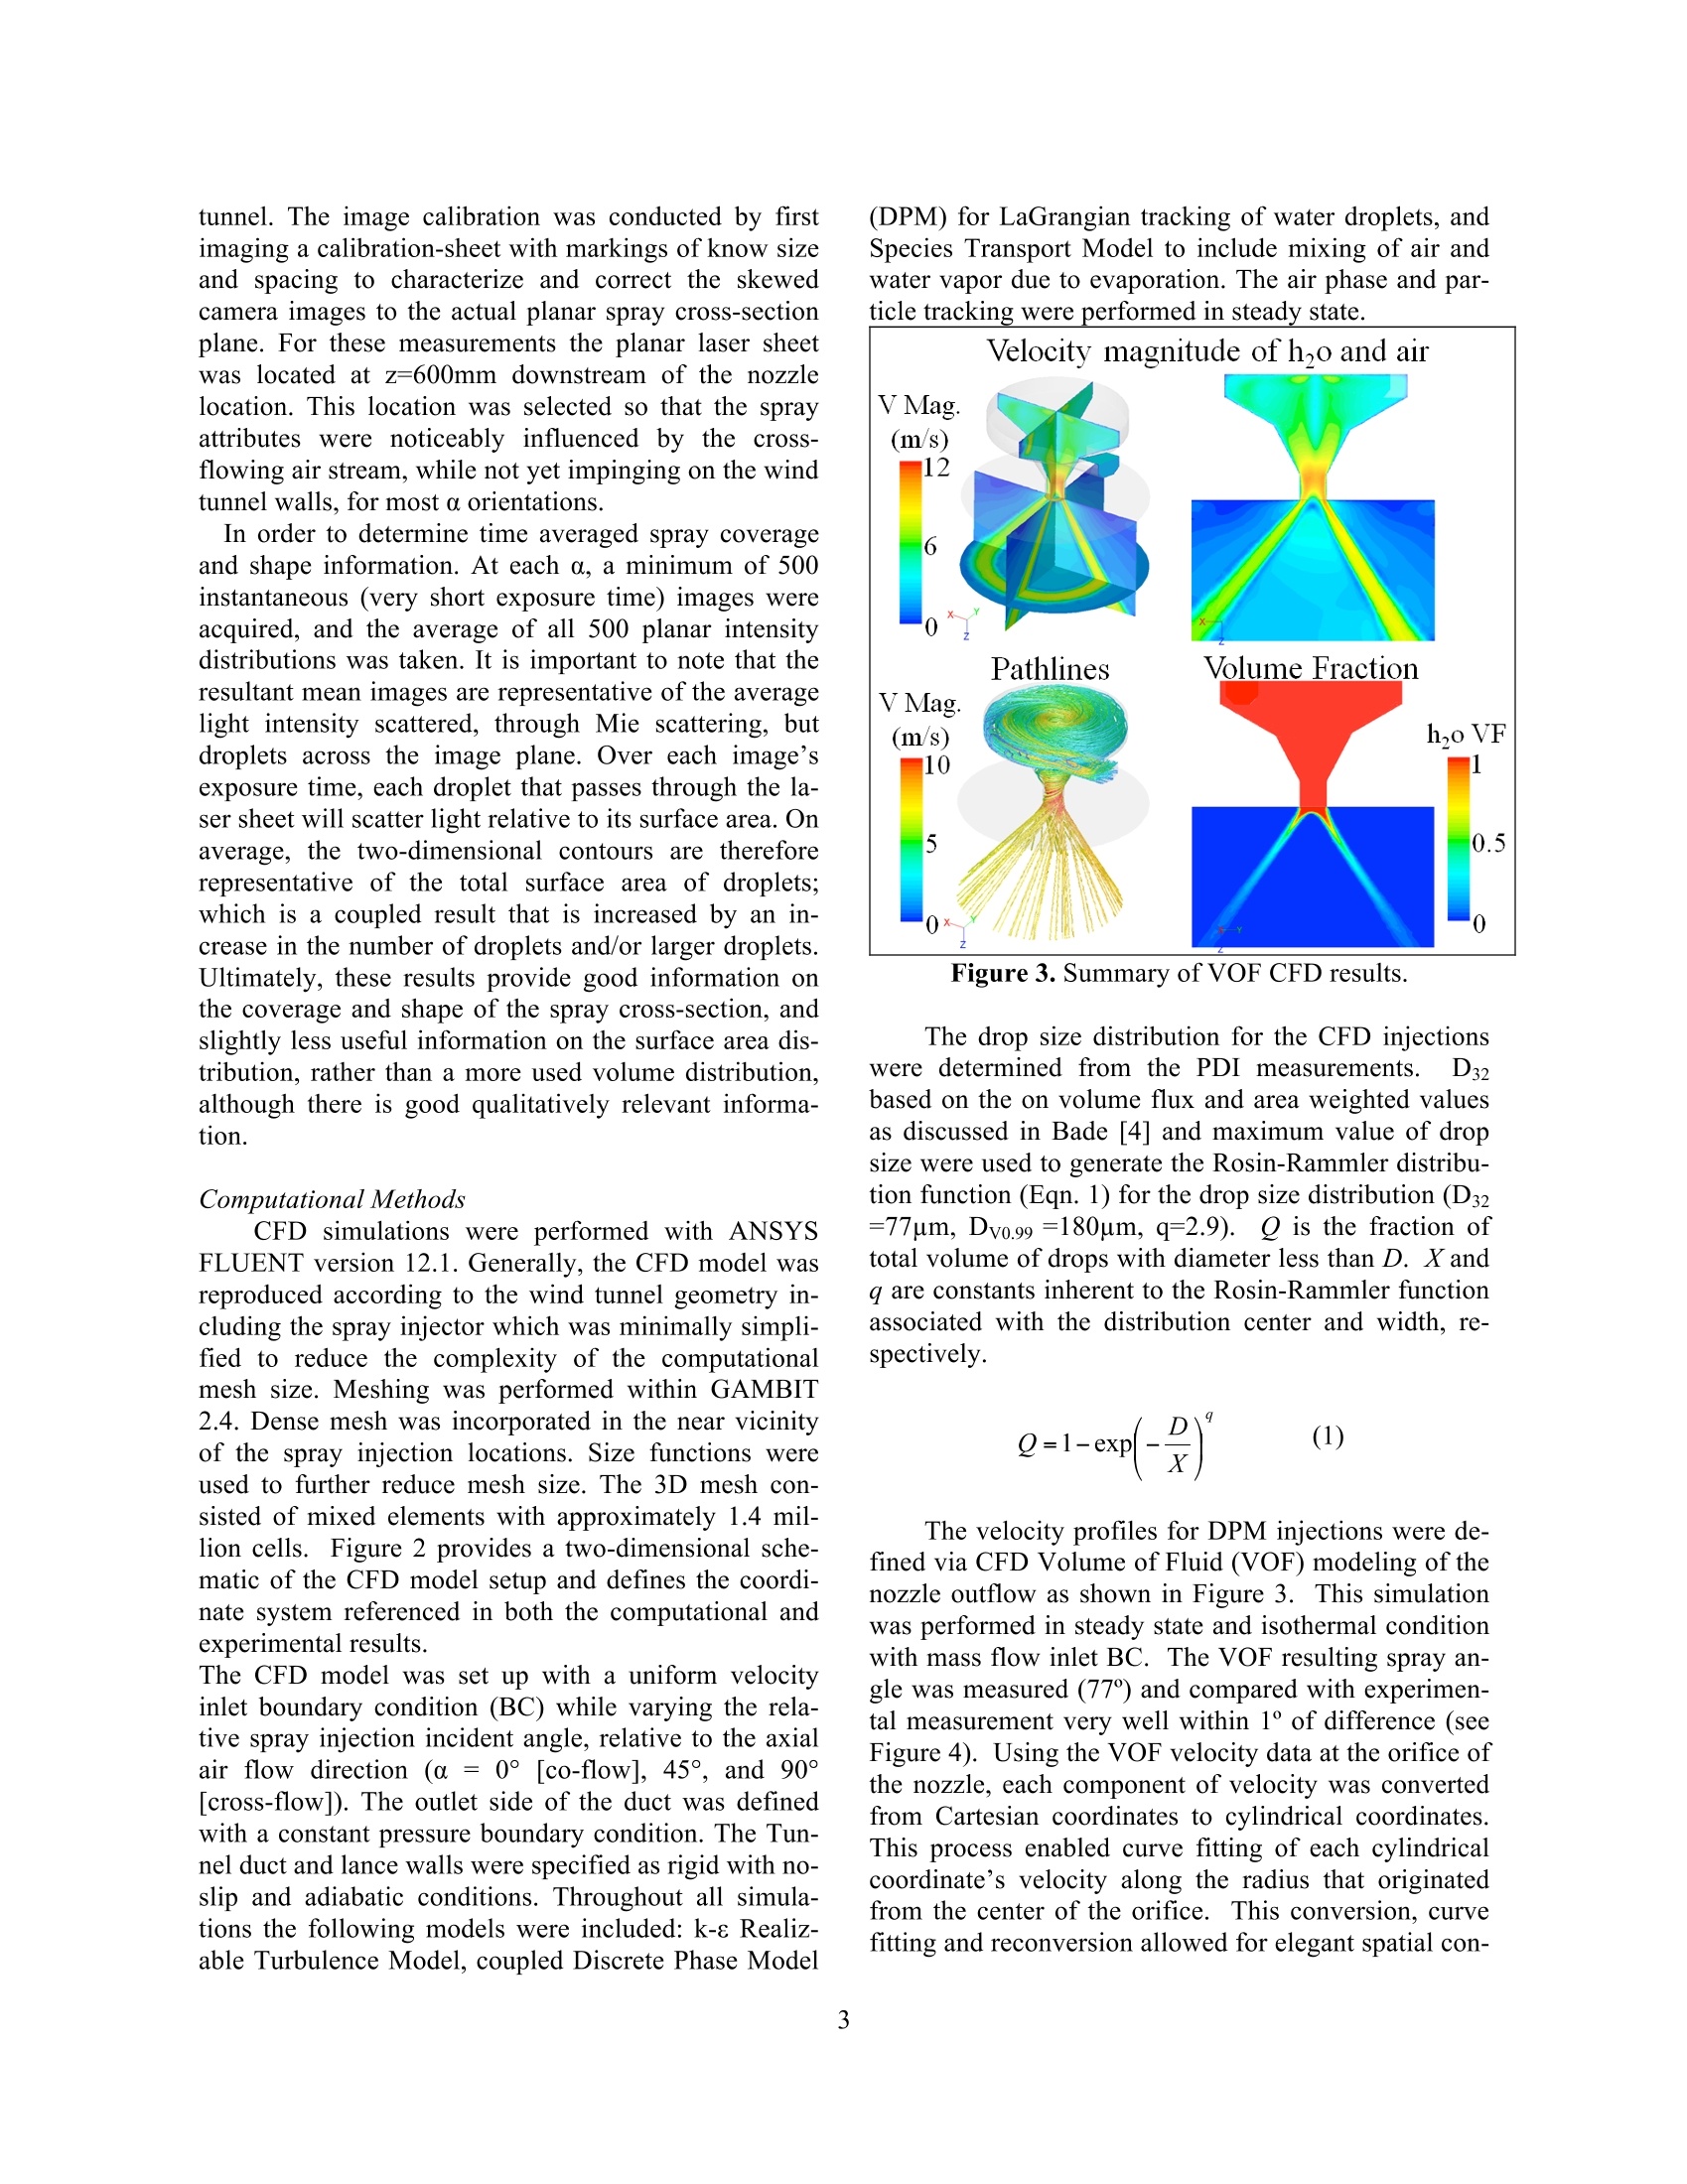
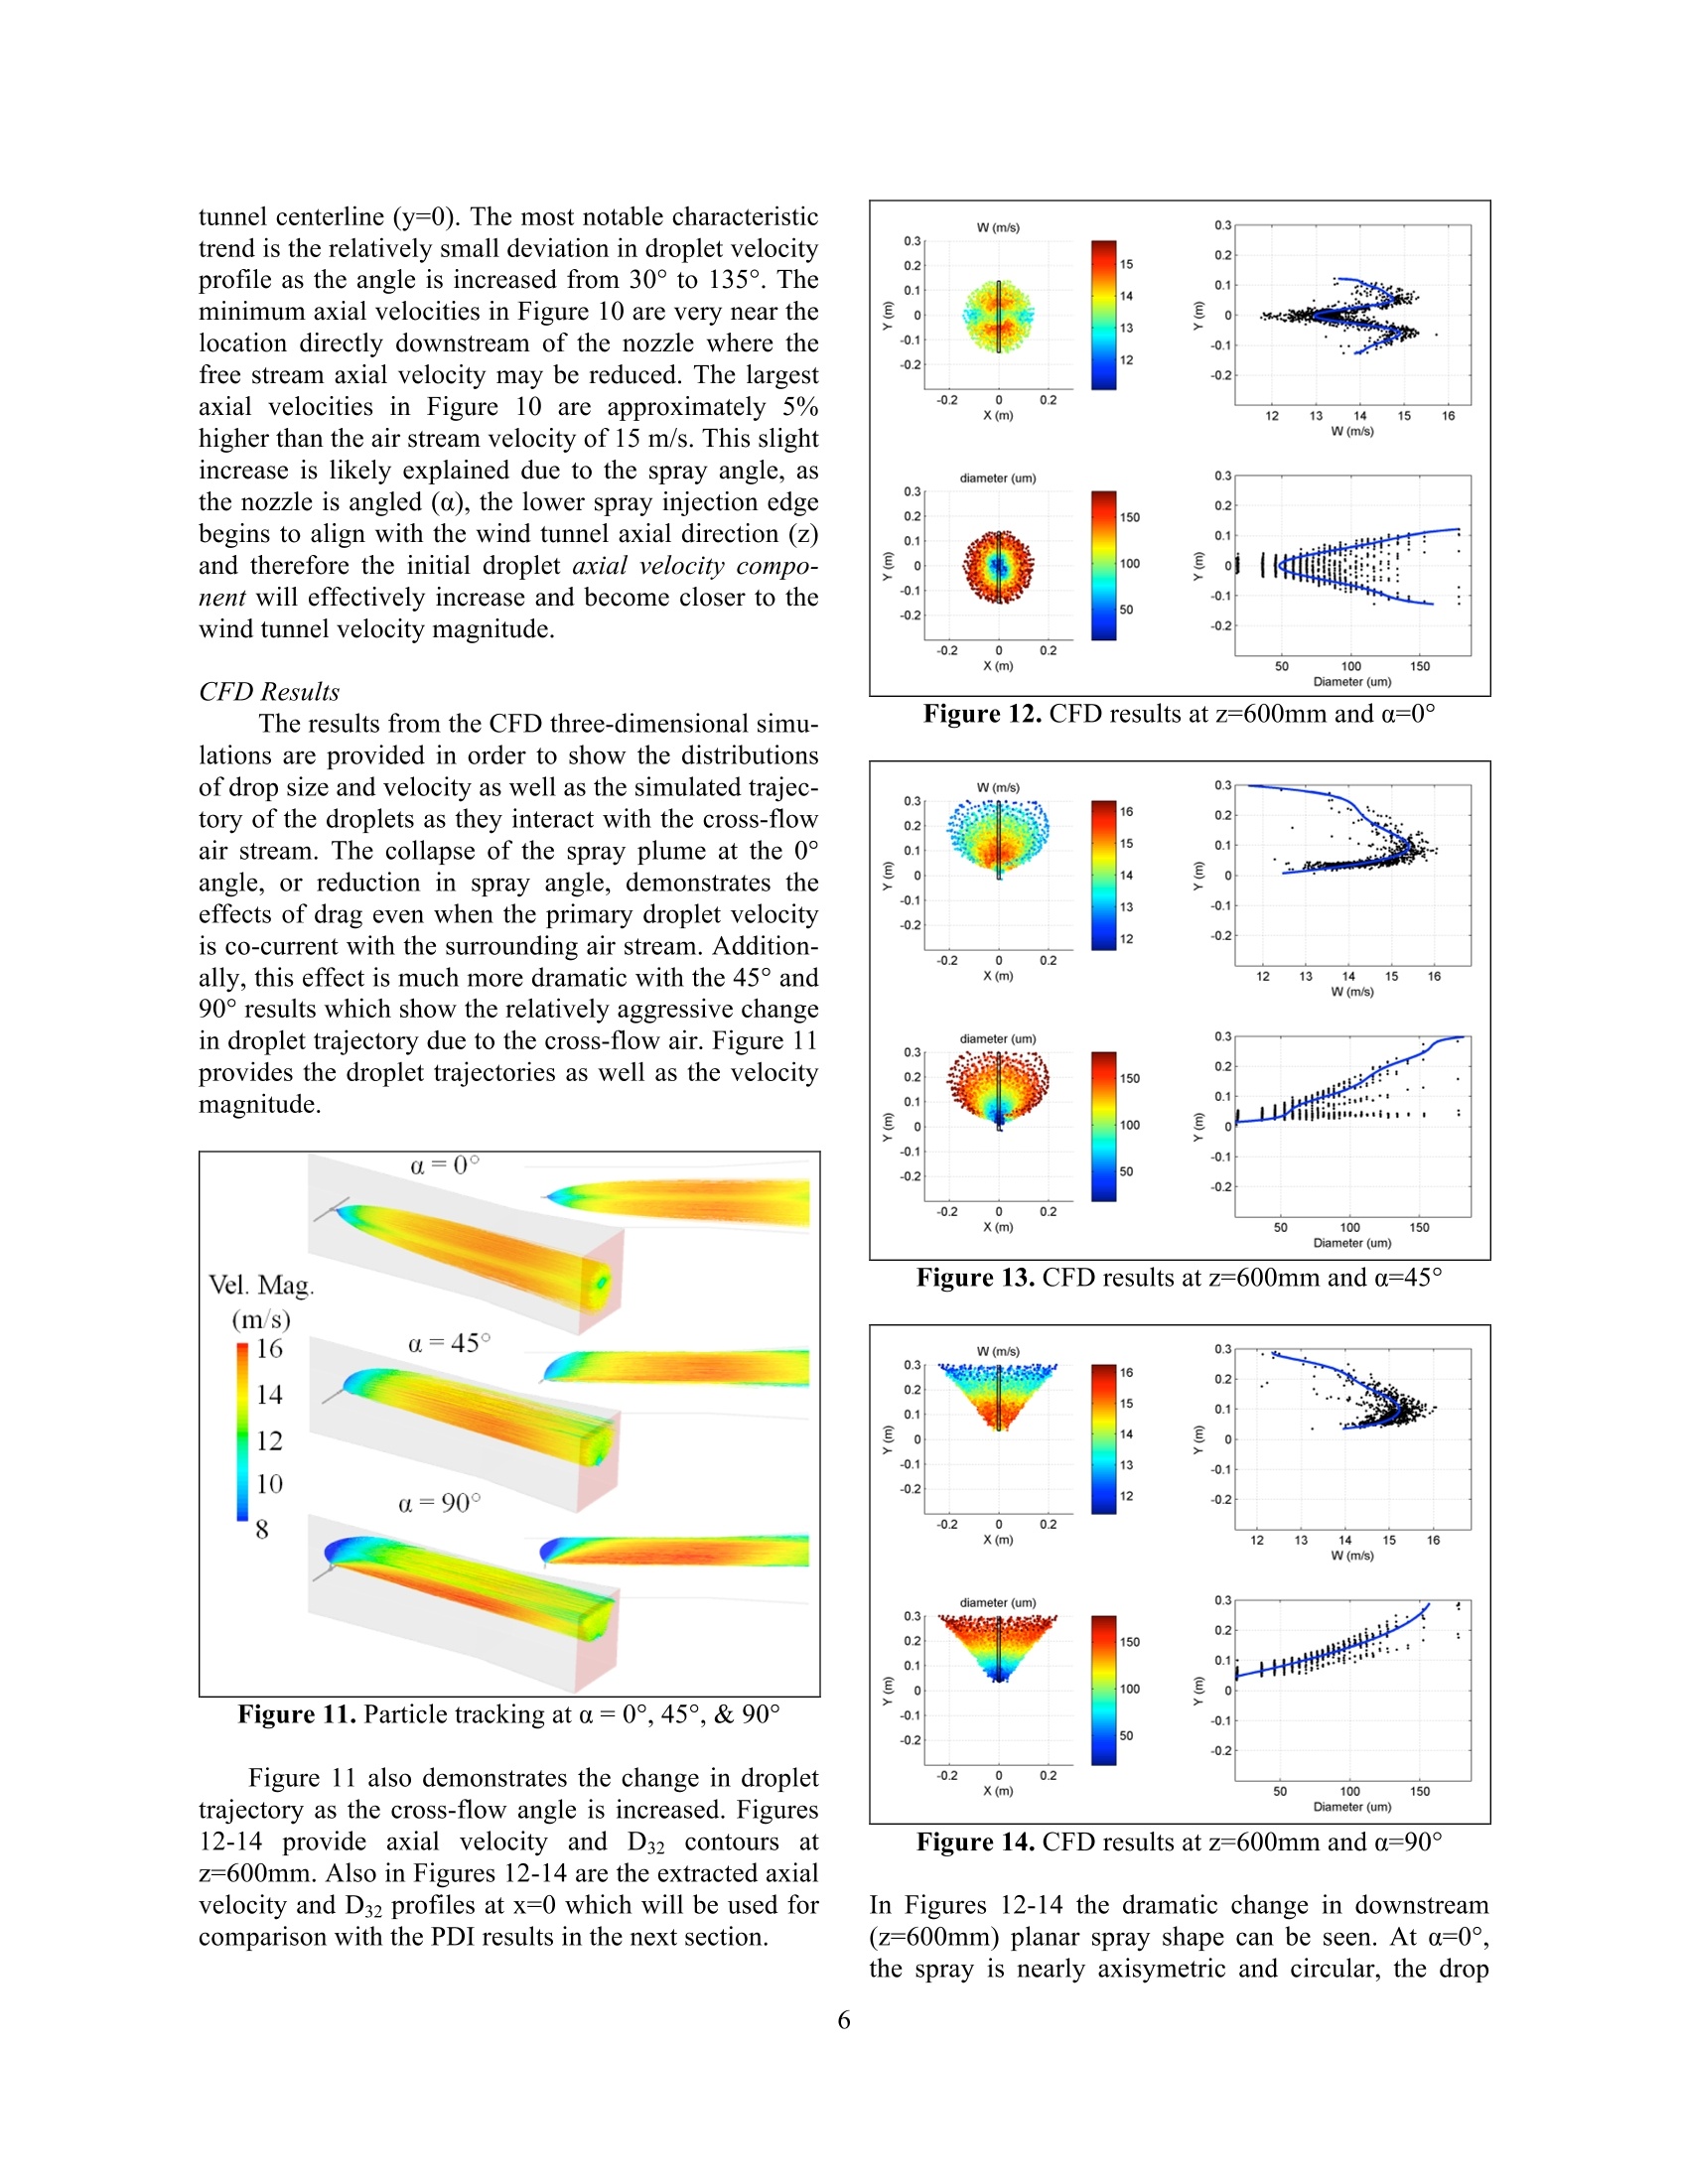
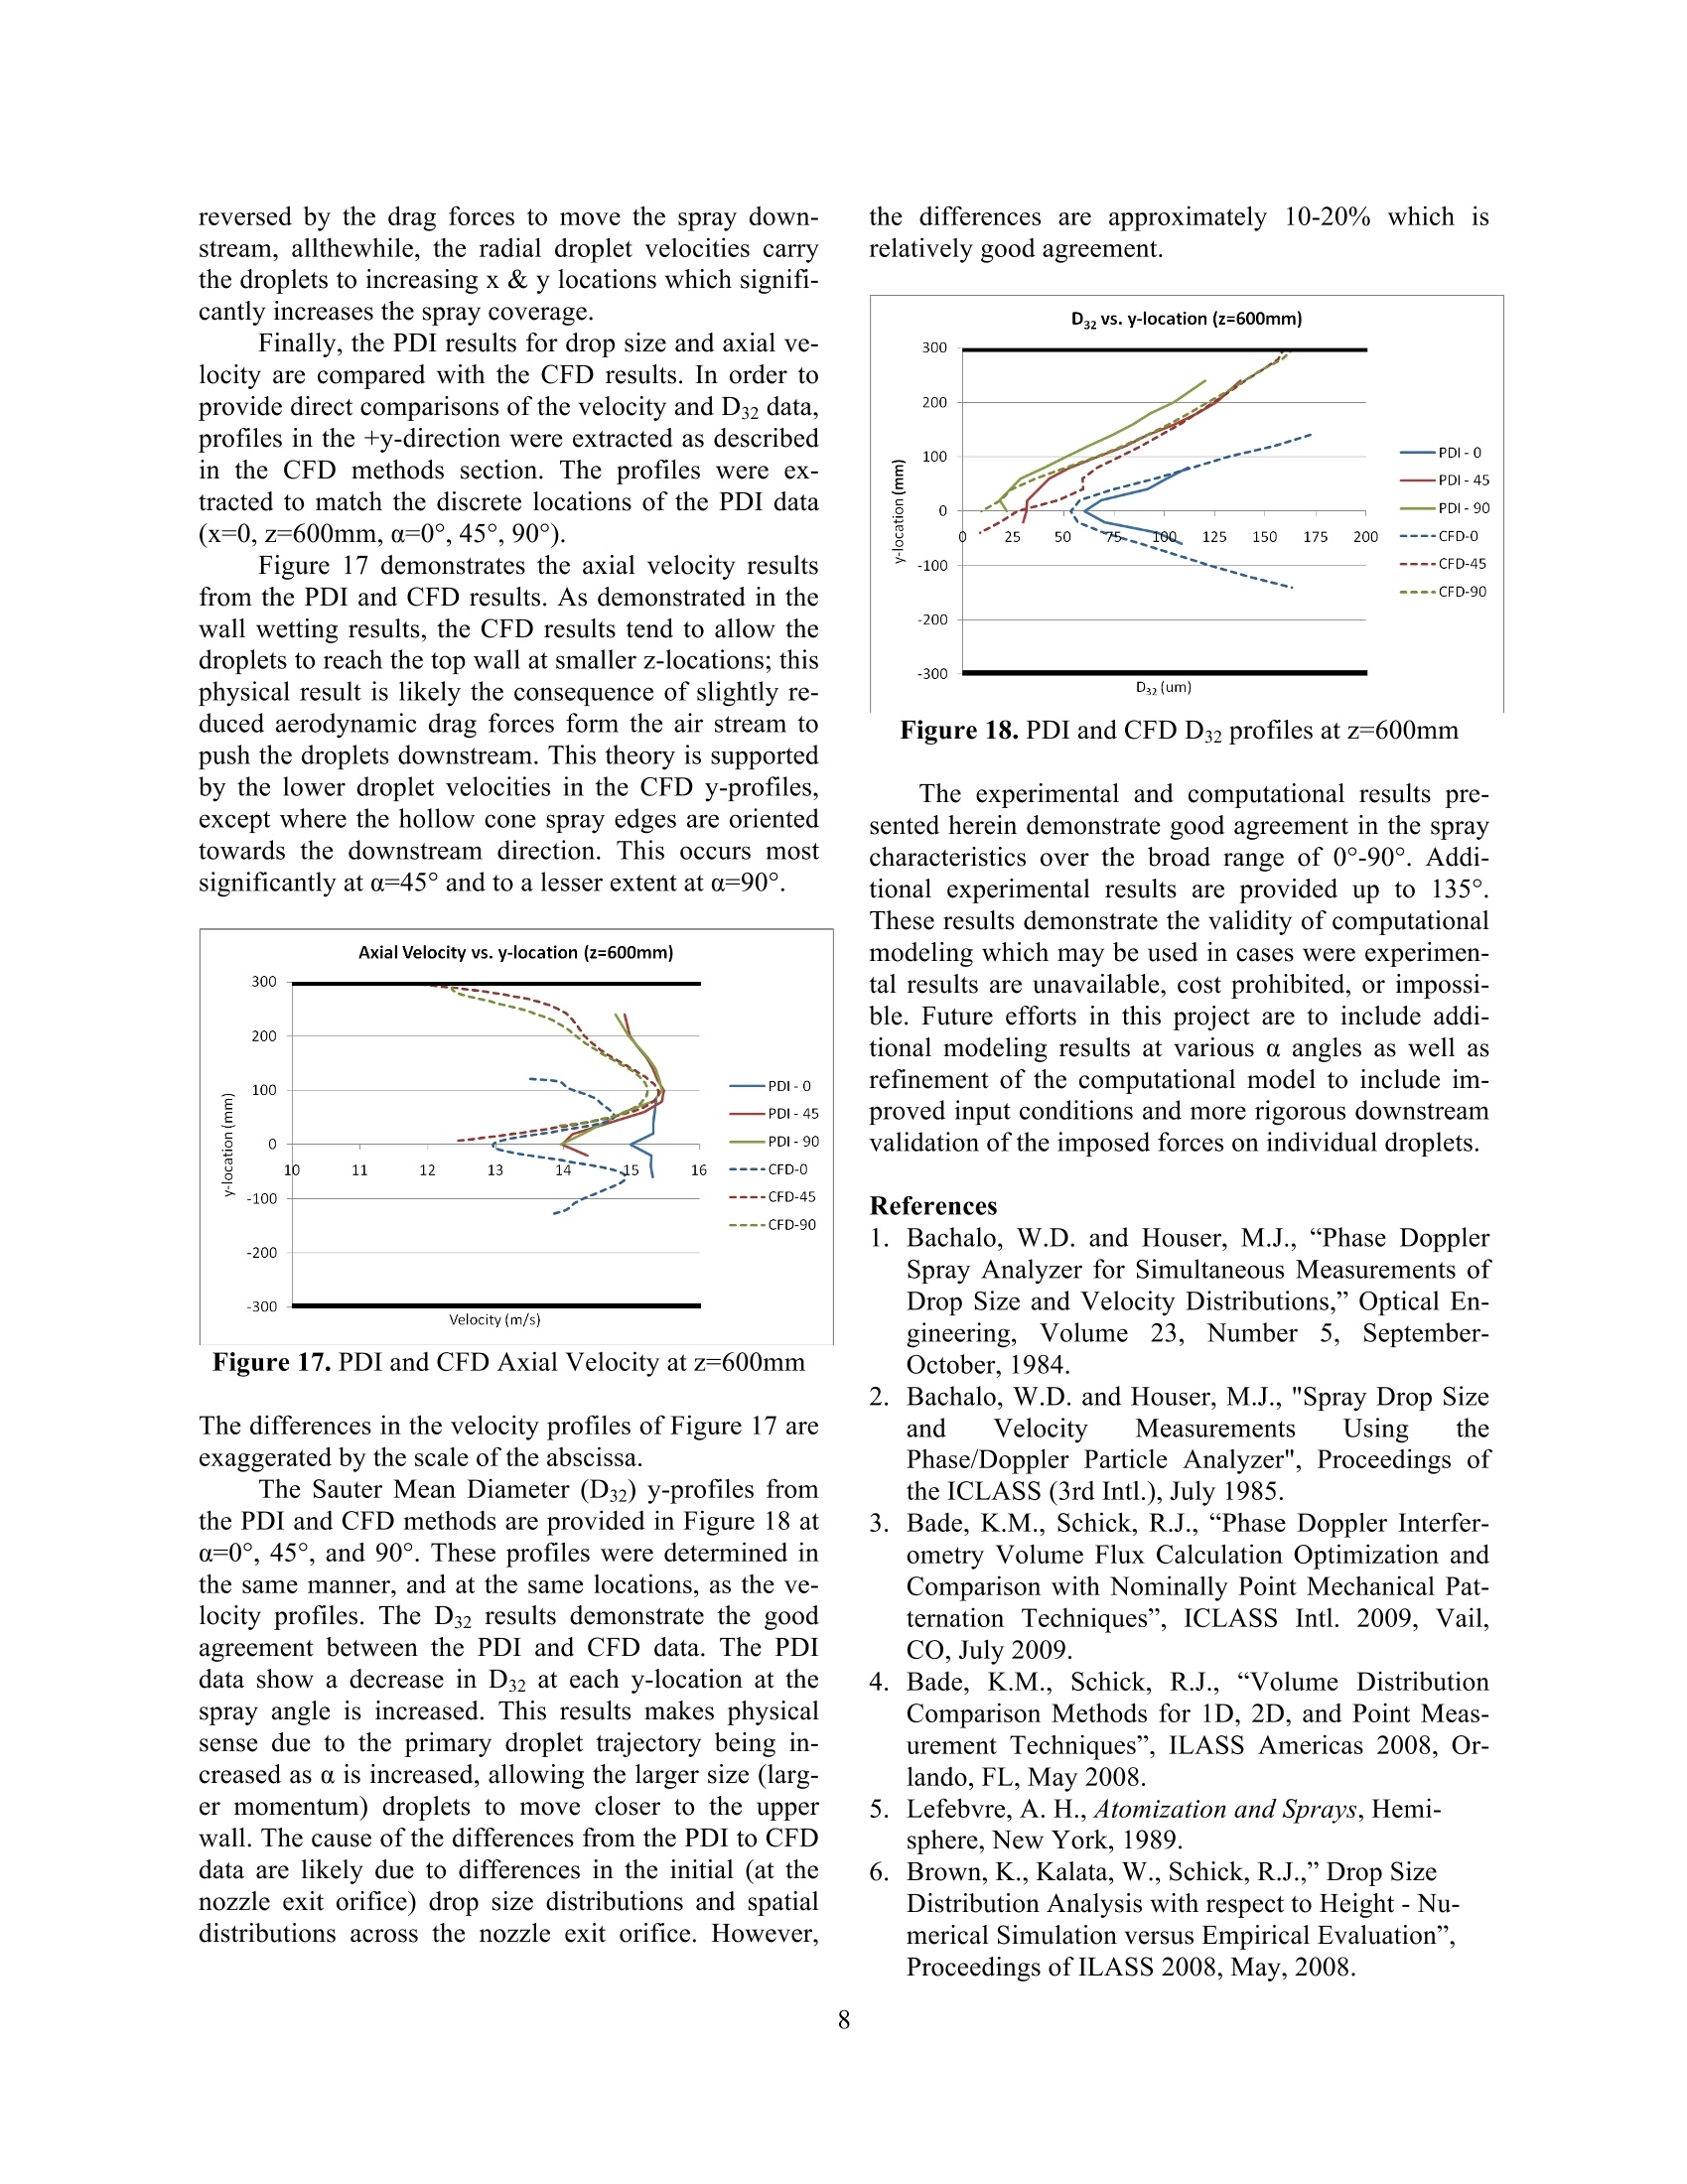
ResearchGate ILASS Americas, 22"d Annual Conferenceon Liquid Atomization and Spray Systems, Cincinnati, OH, May 2010 See discussions,stats, and author profiles for this publication at: https://www.researchgate.net/publication/268400237 Experimental and Computational Study ofaSpray at Multiple Injection Angles Article CITATIONS READS 2 45 3 authors,including: Kyle Bade Wojciech Kalata Spraying Systems Co. Spraying Systems Co. 21 PUBLICATIONS 46 CITATIONS 18 PUBLICATIONS 225 CITATIONS SEE PROFILE SEE PROFILE Experimental and Computational Study of a Spray at Multiple Injection Angles K. M. Bade, W. Kalata, and R. J. Schick Spray Analysis and Research Services Spraying Systems Co. P.O. Box 7900 Wheaton, IL 60187 USA Abstract The interaction of a spray plume within a confined cross-flow environment represents a common spray applicationenvironment, most notably in gas conditioning applications. Characterization and modeling of the downstream dropsize and velocity distributions, as well as spray coverage & shape, was conducted within a controlled wind tunnelenvironment. The primary focus ofthis study is the effect of various incident angle cross-flows on the characteristicsof a spray distribution. While the spray characteristics immediately downstream ofthe nozzle will govern the magnitude of the effect of thecross-flow, this study aims to provide a reference case in order to guide and compare future work. A low flow rate,hydraulic, hollow cone spray was investigated with a nominally uniform cross-flow air speed of 15 m/s. These re-sults demonstrate the trajectory change as well as the change in spray plume characteristics over a range of sprayangles defined relative to the co-flow air stream direction. The experimental results were acquired with a LaVision Laser Sheet Imaging (LSI) and an Artium Phase DopplerInterferometer (PDI), to measure the spray shape, size, distribution characteristics as well as droplet size and veloc-ity. The spray simulations were conducted using ANSYS FLUENT computational fluid dynamics (CFD) package inconjunction with custom spray injection methods developed in-house. The computational model's agreement, anddisagreement, with the experimentally acquired results provides insight for the appropriate considerations when con-structing cross-flow models. Process improvement and optimization in the gasconditioning industry is a constantly ongoing effort.The improvements made in nozzle design and liquidatomization in recent years have provided the possibil-ity of process optimization like never before. While on-site experimental testing provides the most direct as-sessment of a spray’s characteristics in a gas condition-ing tower, often the cost and availability of testing islimited or impossible. Therefore, computational fluiddynamics (CFD) projects for this type of applicationhave become very useful. Using CFD methods, gasconditioning process engineers are able to, for the firsttime, assess the spray quality within the actual sprayprocess region. The increased use of CFD to modelthese processes requires in-depth validation of the me-thods used to model these applications and the resultsprovided by these types of models. Spraying Systems Co. has the unique combinationof testing and modeling expertise which allow for arigorous validation of these modeling techniques oftenused to simulate un-testable situations. This validationof CFD results is wide reaching in applicable variables;the focus of the present study is on the relative angle ofthe spray nozzletooaasteady, nominally uniformco/cross-flow air stream. Orientation angles of the spraynozzle axis (α) varied from 0°(in-line with the co-flowair) to 135° at A15°intervals for the experimental re-sults; while the CFD results are provided at 0°, 45°, and90°. Comparisons of the agreement and disagreement athe common angles show that while the modelingmatches the experimental results fairly well, there areadditional factors which are causing notable discrepan-cies. Equipment and Methods Experimental Setup and Methods The experimental setup consisted of a spray nozzle,wind tunnel, PDI system w/traverse, LSI system. Alltests were carried out with the cross-flow air and sprayliquid (water) at ambient temperature, ~68°F. The noz-zle was operated with a steady 3.8 bar (55psi) cleanwater supply for all tests. Wind Tunnel The wind tunnel utilized in these experiments wascapable of producing a uniform co-flow wind speed(vwt) range of 2.5 200mm region. It will bedemonstrated that for the 45°case as well as many ofthe other large a cases, there is in fact a small concen-tration of very large droplets in the y>200mm region atz=600mm. The existence, but very sparse concentrationof droplets in this region does not allow for adequateLSI measurements. This region represents a limitationof the current LSI setup, not necessarily the systemitself. However, these very low concentration locationsdo not represent a significant portion of the spray vol-ume and are appropriately represented (on average)with nearly zero contribution. the effects of various cross-flow angles. Figures 9 and10 provide the PDI results at the downstream location. Figure 6. Average LSI result at a=45° In Figure 9, the effect of various nozzle angles(relative to the purely axial cross stream air flow) on theD32 distribution results are demonstrated. As the nozzleorientation angle is increased, the D32 values decreaseat each positive y-location from the wind tunnel center-line (y=0). For each incident angle, the D32 values in-crease as the distance from the nozzle (and wind tunnel)centerline is increased. This trend follows the expectedresults due to the larger (higher momentum) dropletsbeing sprayed at increasingly larger incident angles(relative to the cross-flow). The extents of the data (-6090°.This was not necessarily expected, but does make senseas α=90° represents the position where the nozzle ispointed directly at the upper wall. However, at thea=90° orientation, neither edge of the hollow conespray was directed vertically and therefore this resultswas not expected a priori. Additionally, Figure 15 provides the wall wettingdistance for the 45° and 90°CFD cases. In order to ap-proximate the trend of the CFD results, an exponentialfit was applied to the 2 data points; the exponentialcurve can be seen to fit very well from 45° to 90° in theexperimental results and was therefore deemed appro-priate. Good agreement is to be expected from the wallwetting results since, as discussed in the CFD methodssection, the droplet drag forces were adjusted in theCFD model a posteriori to more closely match thesedata. The wall wetting results provide a very directmeasurement for both methods (experimental and com-putational) and therefore serve well as a baseline com-parison. A comparison of the distribution values from theLSI testing and the CFD results was not appropriategiven the surface area/volume difference in fundamen-tal information. The LSI results provide a distributionof droplet surface area, while the CFD simulations pro-vide distribution of droplets concentration or volume.The CFD results could be computed for surface areadistribution; however, the surface area distribution doesnot provide a useful metric in many applications andwould therefore not be helpful. It will suffice to use thisinformation to assess the overall spray coverage fromeach method. Figure 16 provides the spray coverageresults from the LSI and CFD results. These resultswere obtained in a binary method where if there wasspray at any point in the x-y plane, then that region wasincluded in the overall coverage area. In other words,Figure 16 provides the average coverage area,with noregard to the concentration within that area. Figure 16. LSI and CFD Spray Coverage Area The coverage results demonstrate very good agreementat the common data points that are available. The cov-erage area varies by less than 20% over the a=0 to90°,and this variability is consistent with both the LSI andCFD results. The LSI results, which extend up to 135,demonstrate that in a counter-flow orientation (a>90)the spray coverage widens rapidly. This is likely due tothe axial velocity component which essentially must be reversed by the drag forces to move the spray down-stream, allthewhile, the radial droplet velocities carrythe droplets to increasing x& y locations which signifi-cantly increases the spray coverage. Finally, the PDI results for drop size and axial ve-locity are compared with the CFD results. In order toprovide direct comparisons of the velocity and D32 data,profiles in the +y-direction were extracted as describedin the CFD methods section. The profiles were ex-tracted to match the discrete locations of the PDI data(x=0,z=600mm,α=0,45°,90°). Figure 17 demonstrates the axial velocity resultsfrom the PDI and CFD results. As demonstrated in thewall wetting results, the CFD results tend to allow thedroplets to reach the top wall at smaller z-locations; thisphysical result is likely the consequence of slightly re-duced aerodynamic drag forces form the air stream topush the droplets downstream. This theory is supportedby the lower droplet velocities in the CFD y-profiles,except where the hollow cone spray edges are orientedtowards the downstream direction. This occurs mostsignificantly at o=45° and to a lesser extent at a=90°. Figure 17. PDI and CFD Axial Velocity at z=600mm The differences in the velocity profiles of Figure 17 areexaggerated by the scale of the abscissa. The Sauter Mean Diameter (D32) y-profiles fromthe PDI and CFD methods are provided in Figure 18 atα=0°,45°, and 90°. These profiles were determined inthe same manner, and at the same locations, as the ve-locity profiles. The D32 results demonstrate the goodagreement between the PDI and CFD data. The PDIdata show a decrease in D32 at each y-location at thespray angle is increased. This results makes physicalsense due to the primary droplet trajectory being in-creased as a is increased, allowing the larger size (larg-er momentum) droplets to move closer to the upperwall. The cause of the differences from the PDI to CFDdata are likely due to differences in the initial (at thenozzle exit orifice) drop size distributions and spatialdistributions across the nozzle exit orifice. However, the differences are approximately 10-20% which isrelatively good agreement. Figure 18.PDI and CFD D32 profiles at z=600mm The experimental and computational results pre-sented herein demonstrate good agreement in the spraycharacteristics over the broad range of 0°-90°. Addi-tional experimental results are provided up to 135°.These results demonstrate the validity of computationalmodeling which may be used in cases were experimen-tal results are unavailable, cost prohibited, or impossi-ble. Future efforts in this project are to include addi-tional modeling results at various a angles as well asrefinement of the computational model to include im-proved input conditions and more rigorous downstreamvalidation of the imposed forces on individual droplets. References 1. Bachalo, W.D. and Houser, M.J.,“Phase DopplerSpray Analyzer for Simultaneous Measurements ofDrop Size and Velocity Distributions,”Optical En-gineering, Volume 23, Number 5, September-October,1984. 2. Bachalo, W.D. and Houser, M.J., "Spray Drop Sizeand Velocity Measurements Using thePhase/Doppler Particle Analyzer", Proceedings ofthe ICLASS (3rd Intl.), July 1985. 3. B1ade, K.M., Schick, R.J.,“Phase Doppler Interfer-ometry Volume Flux Calculation Optimization andComparison with Nominally Point Mechanical Pat-ternation Techniques”, ICLASS Intl. 2009, Vail,CO, July 2009. 4.1Bade, K.M., Schick, R.J.,“Volume DistributionComparison Methods for 1D, 2D, and Point Meas-urement Techniques”, ILASS Americas 2008, Or-lando, FL,May 2008. 5. Llefebvre, A. H.,Atomization and Sprays,Hemi-sphere, New York, 1989. 6.B1rown, K., Kalata, W.,Schick, R.J.,”Drop SizeDistribution Analysis with respect to Height-Nu-merical Simulation versus Empirical Evaluation”,Proceedings of ILASS 2008, May, 2008. Laser Sheet Imaging results from o=0°-135°,A15° a=0° a=15° 0=30° a=45° 0=60° 0=75° a=90° a=105° a=120° a=135° All content following this page was uploaded by Wojciech Kalata on February The user has requested enhancement of the downloaded file. The interaction of a spray plume within a confined cross-flow environment represents a common spray applicationenvironment, most notably in gas conditioning applications. Characterization and modeling of the downstream dropsize and velocity distributions, as well as spray coverage & shape, was conducted within a controlled wind tunnelenvironment. The primary focus of this study is the effect of various incident angle cross-flows on the characteristicsof a spray distribution.While the spray characteristics immediately downstream of the nozzle will govern the magnitude of the effect of thecross-flow, this study aims to provide a reference case in order to guide and compare future work. A low flow rate,hydraulic, hollow cone spray was investigated with a nominally uniform cross-flow air speed of 15 m/s. These resultsdemonstrate the trajectory change as well as the change in spray plume characteristics over a range of sprayangles defined relative to the co-flow air stream direction.The experimental results were acquired with a LaVision Laser Sheet Imaging (LSI) and an Artium Phase DopplerInterferometer (PDI), to measure the spray shape, size, distribution characteristics as well as droplet size and velocity.The spray simulations were conducted using ANSYS FLUENT computational fluid dynamics (CFD) package inconjunction with custom spray injection methods developed in-house. The computational model’s agreement, anddisagreement, with the experimentally acquired results provides insight for the appropriate considerations when constructingcross-flow models.
确定


还剩8页未读,是否继续阅读?

产品配置单


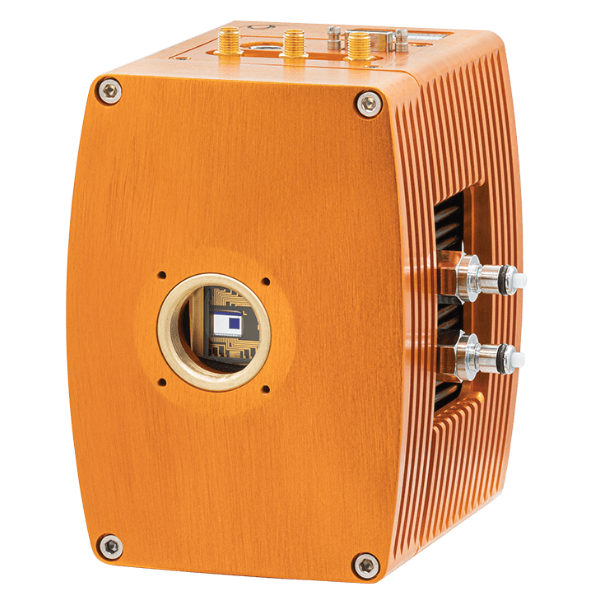
北京欧兰科技发展有限公司为您提供《喷嘴,喷雾中注入角度的实验和计算模拟研究检测方案(激光干涉仪)》,该方案主要用于其他中注入角度的实验和计算模拟研究检测,参考标准--,《喷嘴,喷雾中注入角度的实验和计算模拟研究检测方案(激光干涉仪)》用到的仪器有激光相位多普勒干涉仪LDV,PDI,PDPA,PDA、LaVision SprayMaster 喷雾成像测量系统、Imager sCMOS PIV相机、德国LaVision PIV/PLIF粒子成像测速场仪、LaVision DaVis 智能成像软件平台
推荐专场


相关方案
更多
该厂商其他方案
更多