


Microscopic particle image velocimetry (microPIV) experiments were performed on a polydimethylsiloxane (PDMS) microchannel
with a cross-section measuring 320 lm · 330 lm for Reynolds numbers between 272 and 2853. Care was taken to ensure that the
seed particle density was great enough that accurate instantaneous velocity vector fields could be obtained for all the Reynolds numbers
investigated. Velocity fluctuations were calculated from ensembles of microPIV velocity fields. The hu0i/umax fluctuation showed
an increase at Re = 1535 and a further increase as Reynolds numbers were increased, suggesting that transition to turbulence began
near Re = 1535, a Reynolds number lower than predicted by classical theory. The hu0i/umax data also suggest the flow was fullydeveloped
at a Reynolds number between 2630 and 2853, also lower than classical results. This finding was confirmed in plots of
the mean velocity profile. For the fully developed flow, the measured hu0 i/umax fluctuation agreed well with classical results for turbulent
duct flow, but the hv0 i/umax fluctuation was 25–40% lower than turbulent duct flow results. Finally, spatial correlations of
velocity fluctuations were calculated to lend some insights into the characteristics of the large-scale turbulent structures observed
in the turbulent microchannel flow.
方案详情

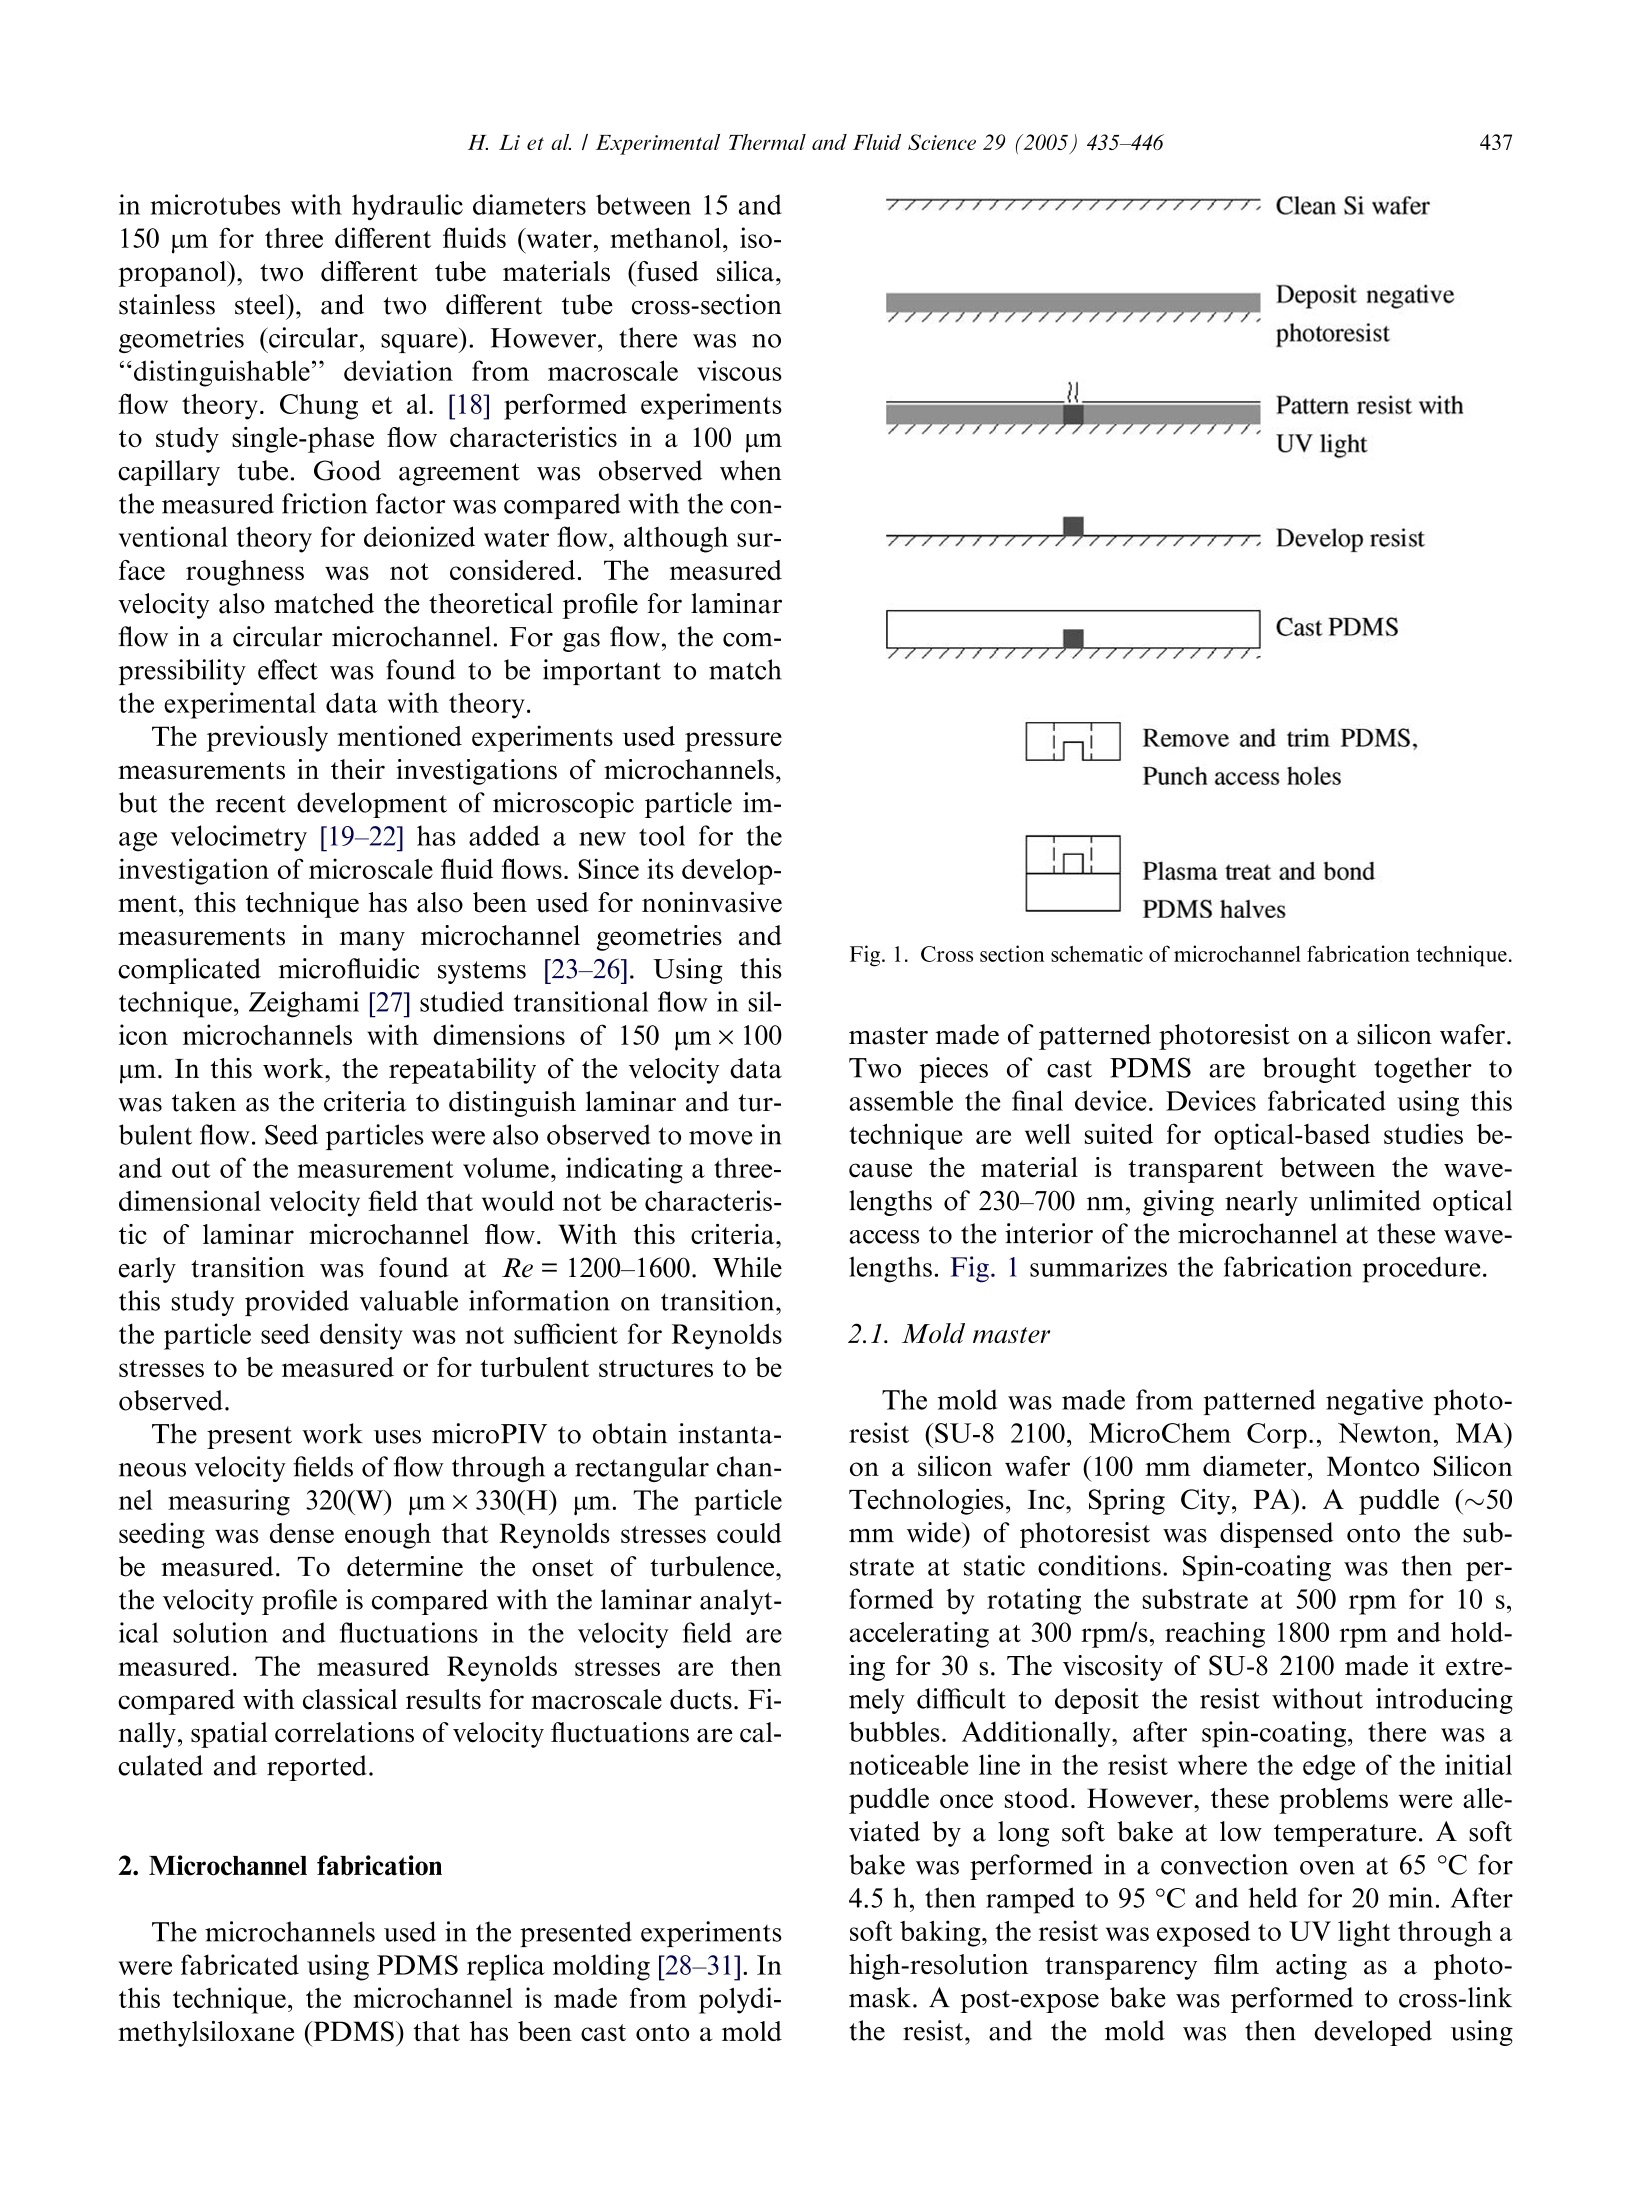
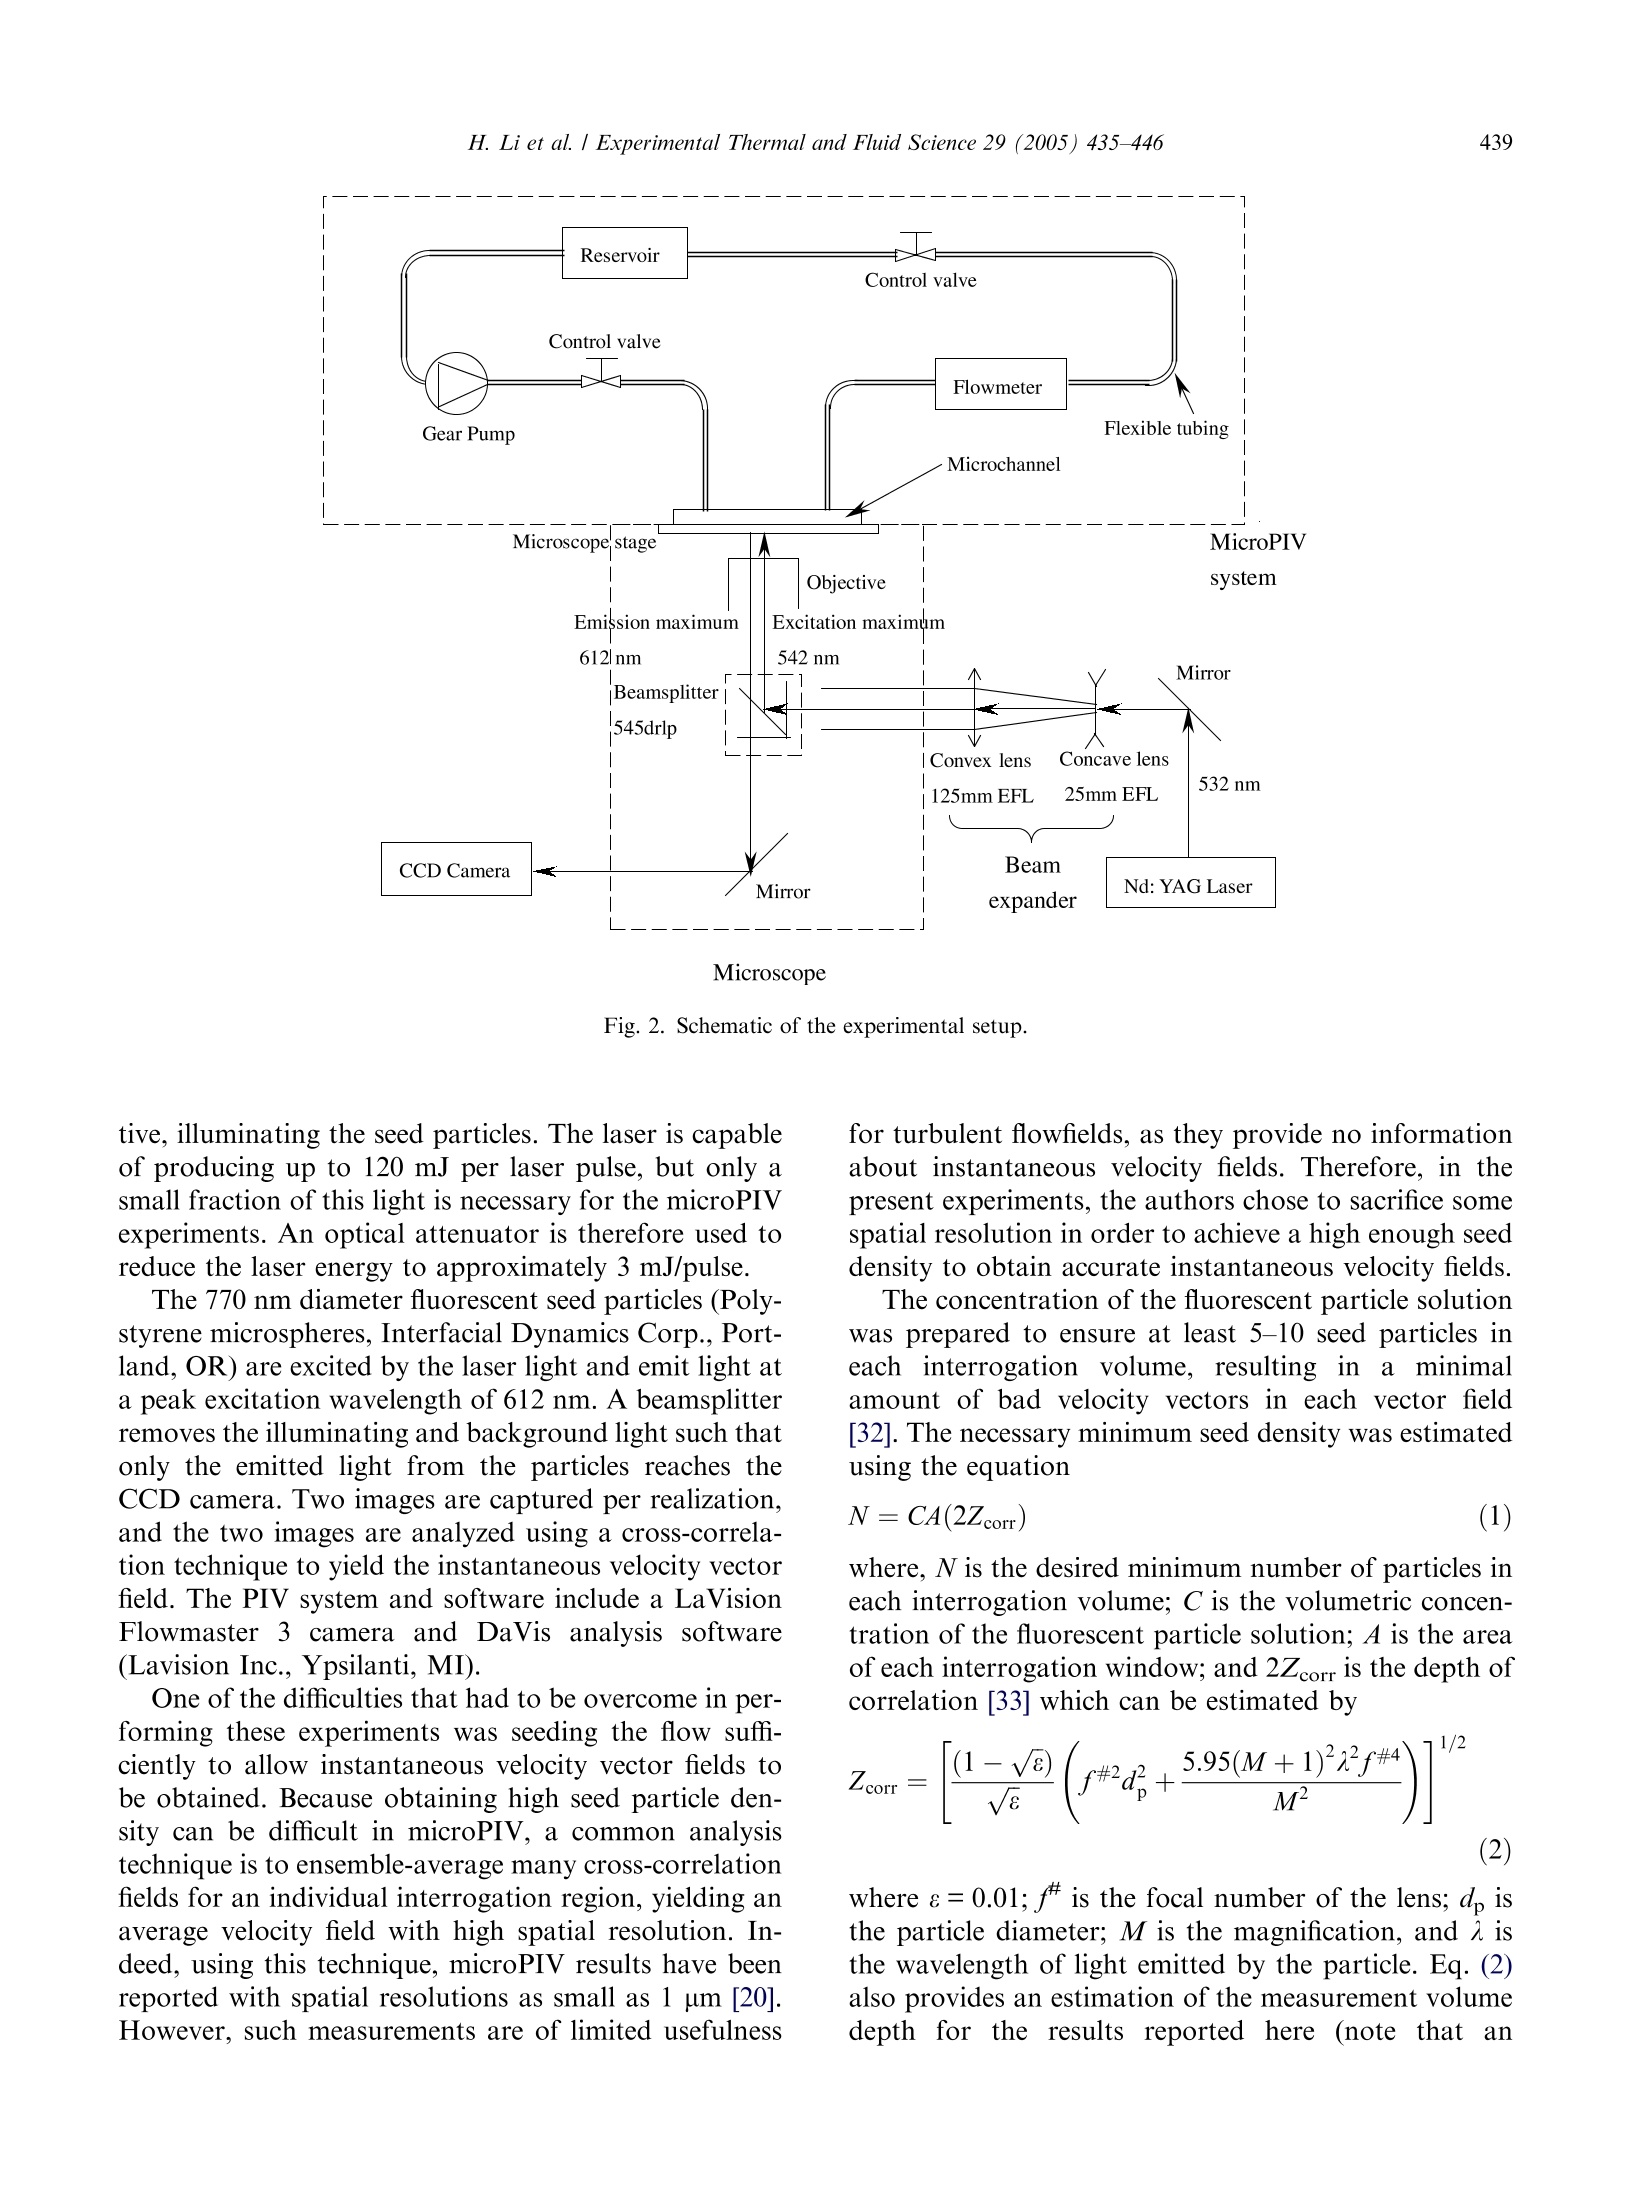
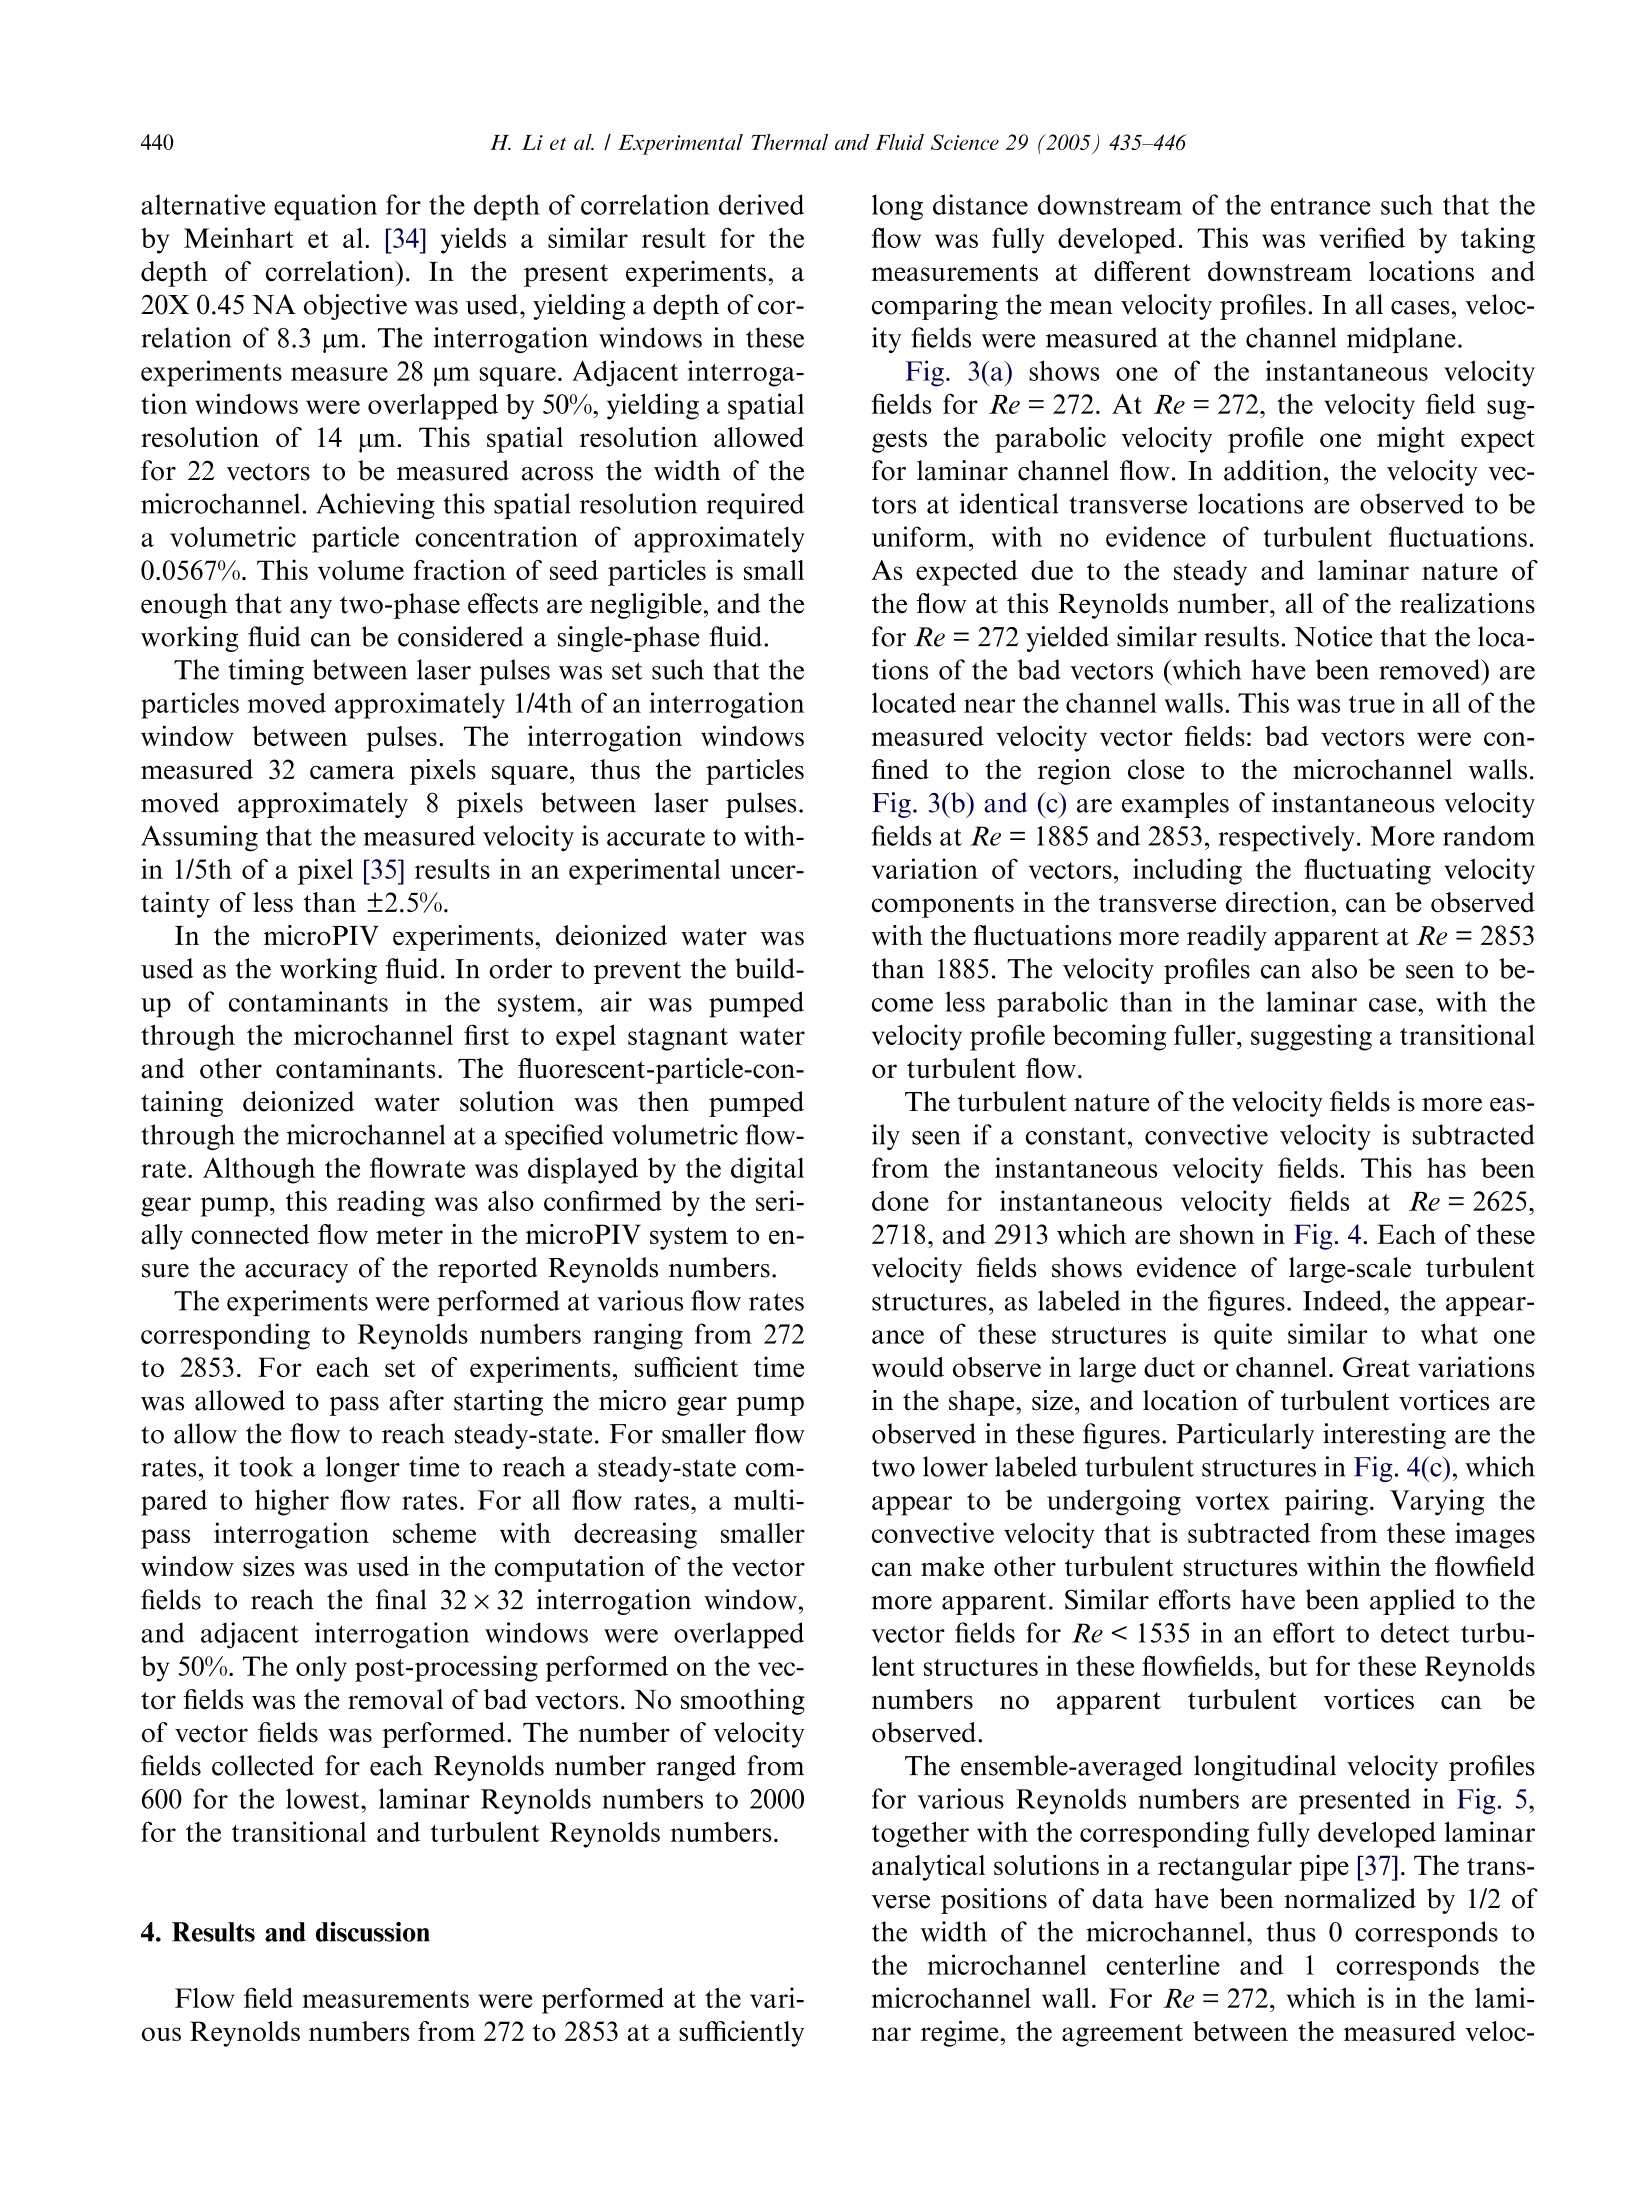
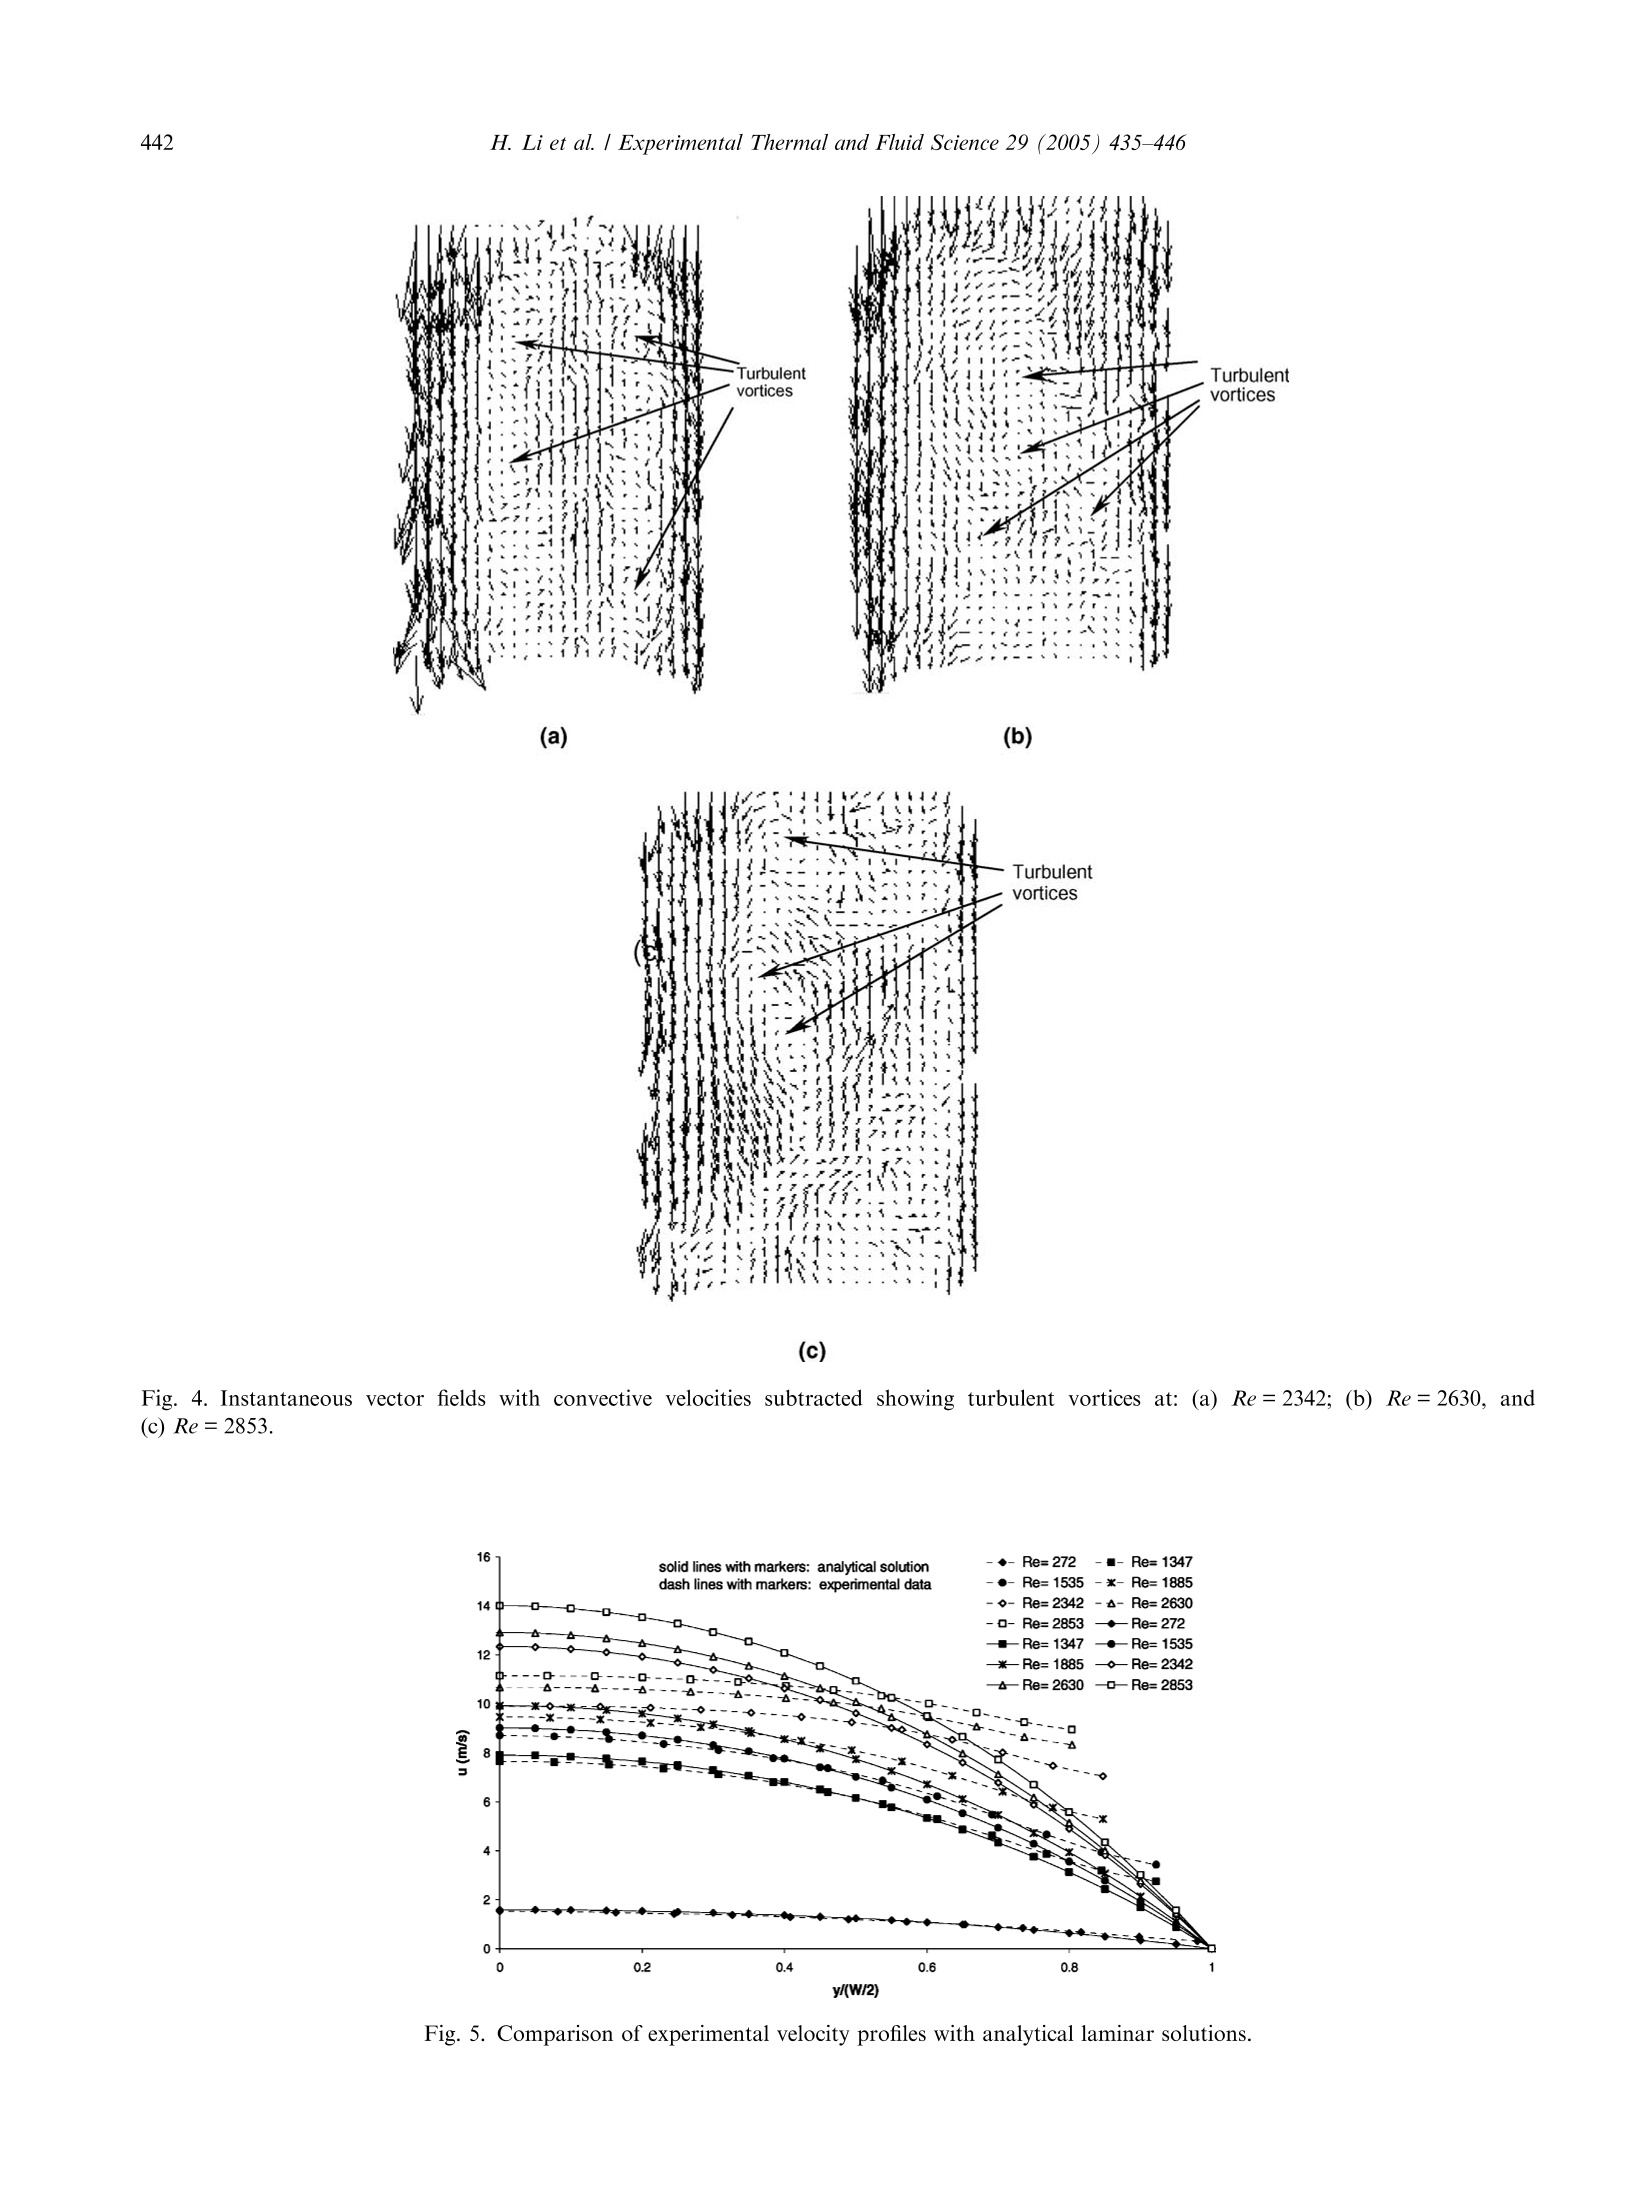
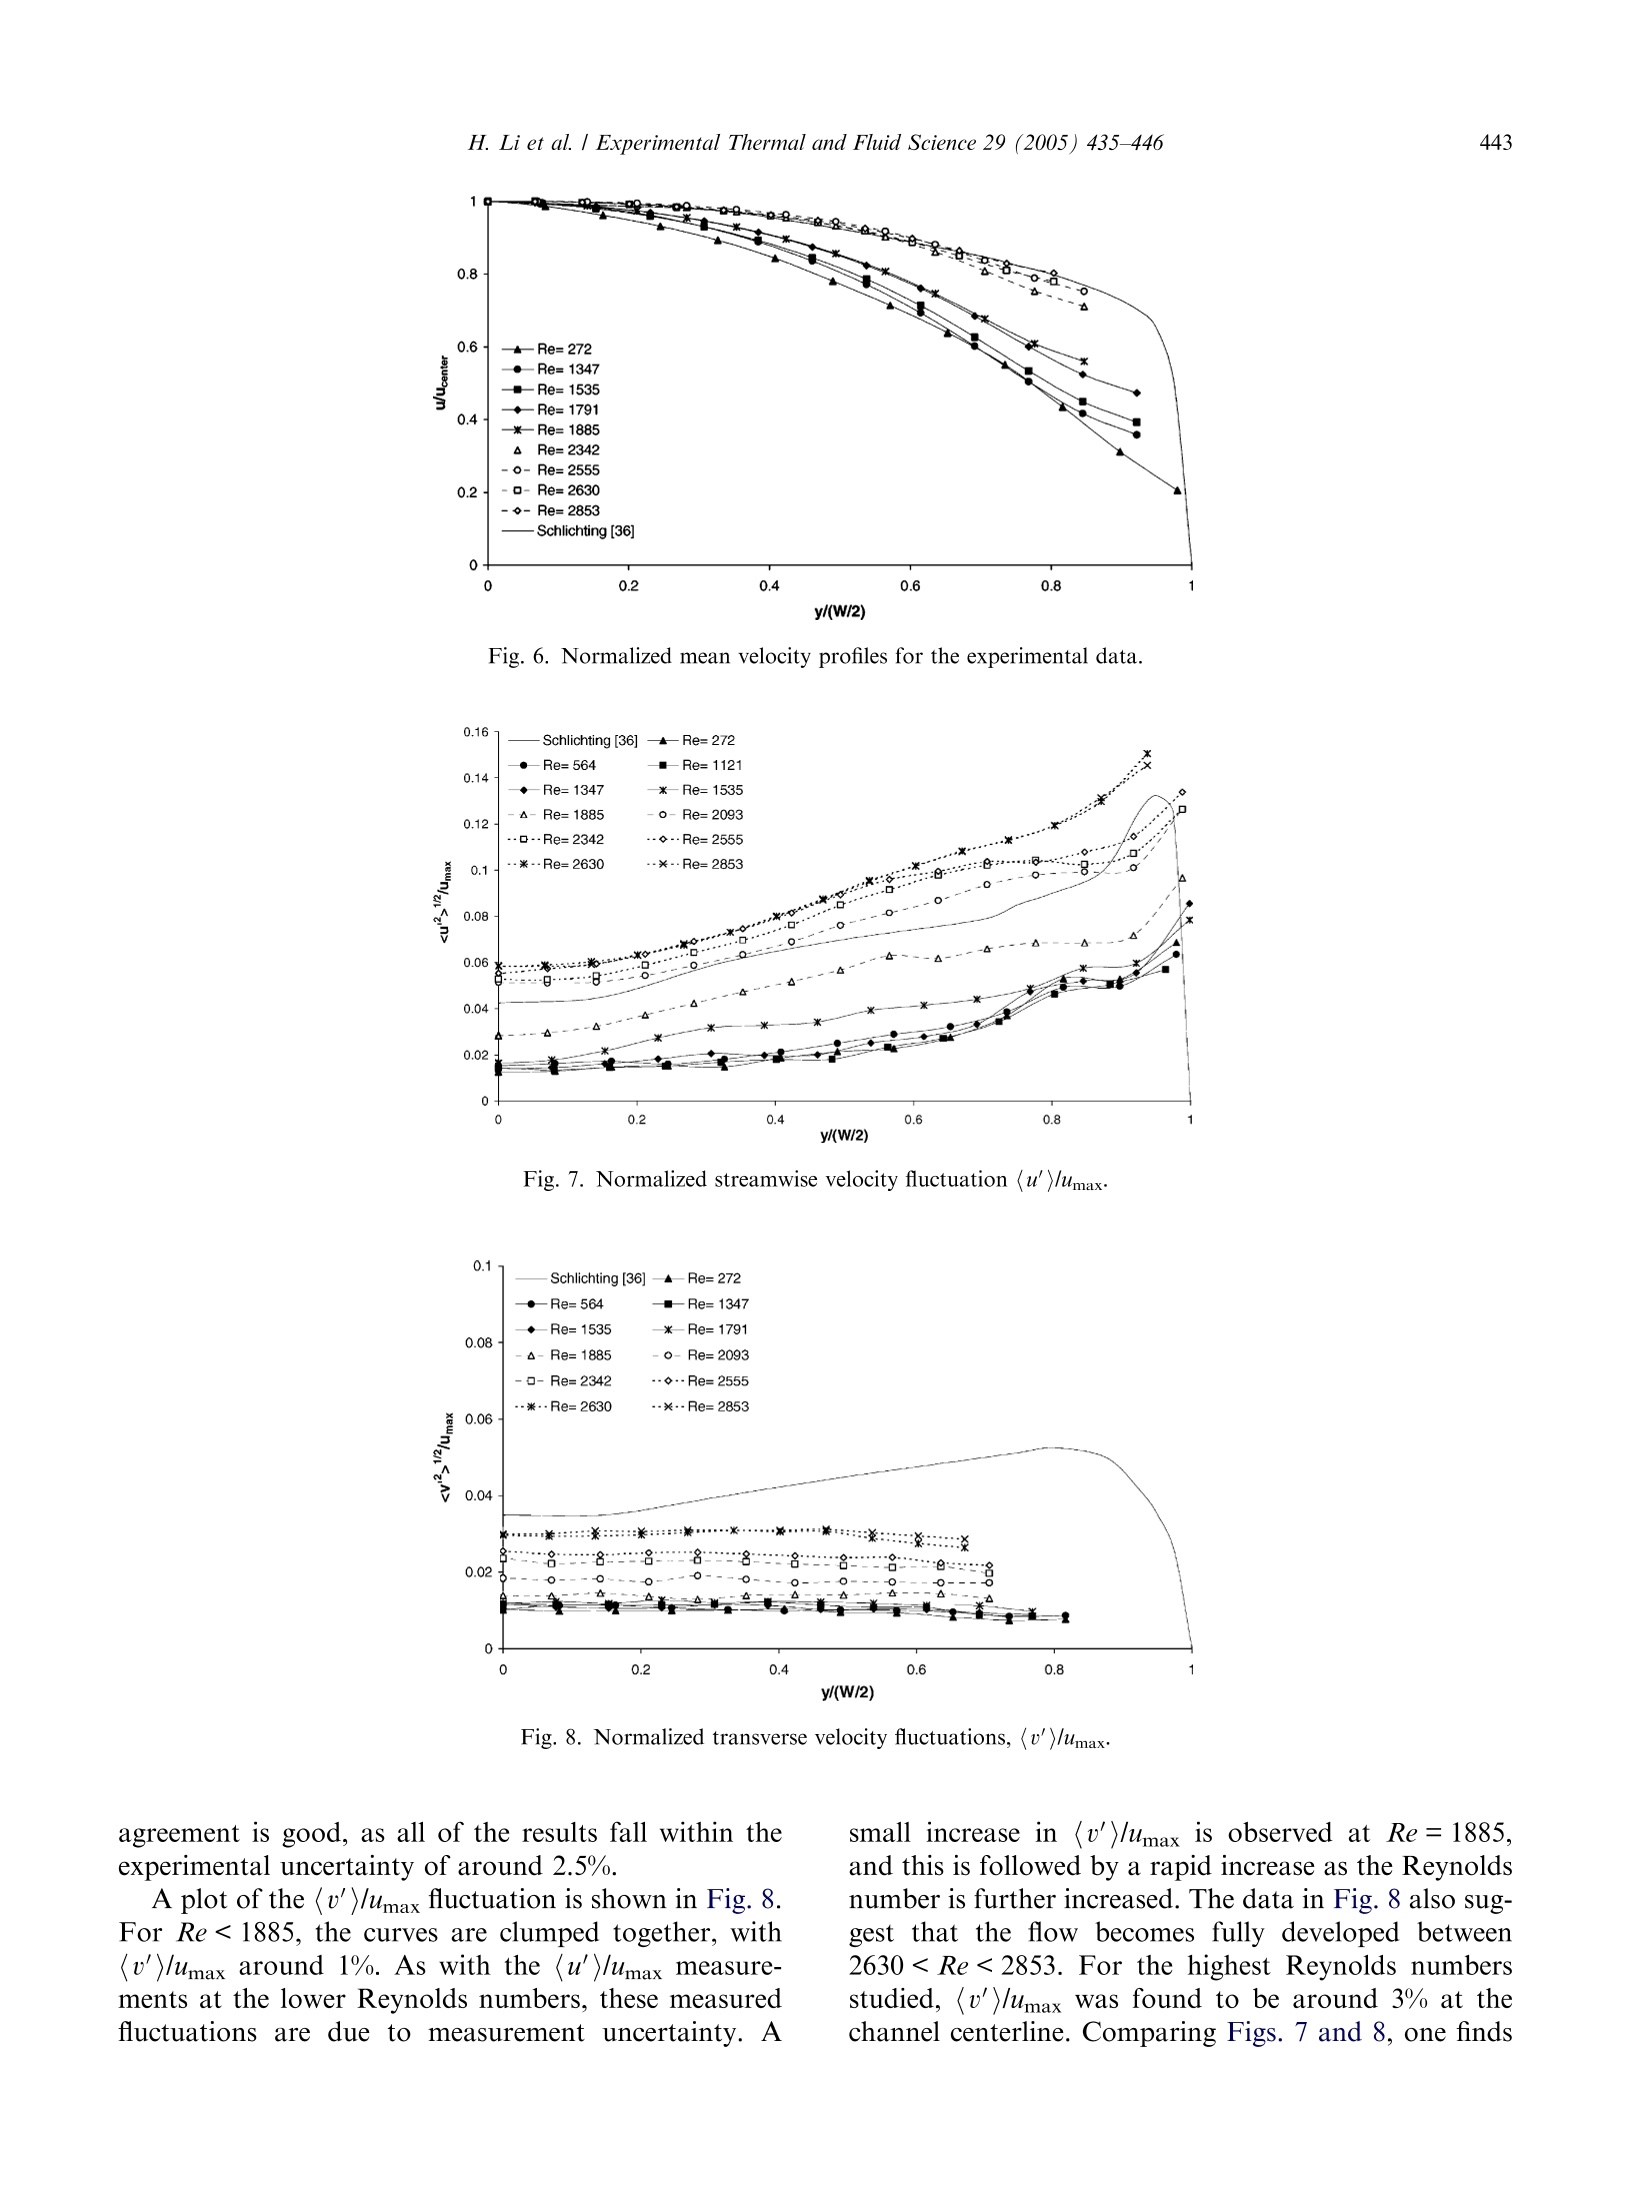
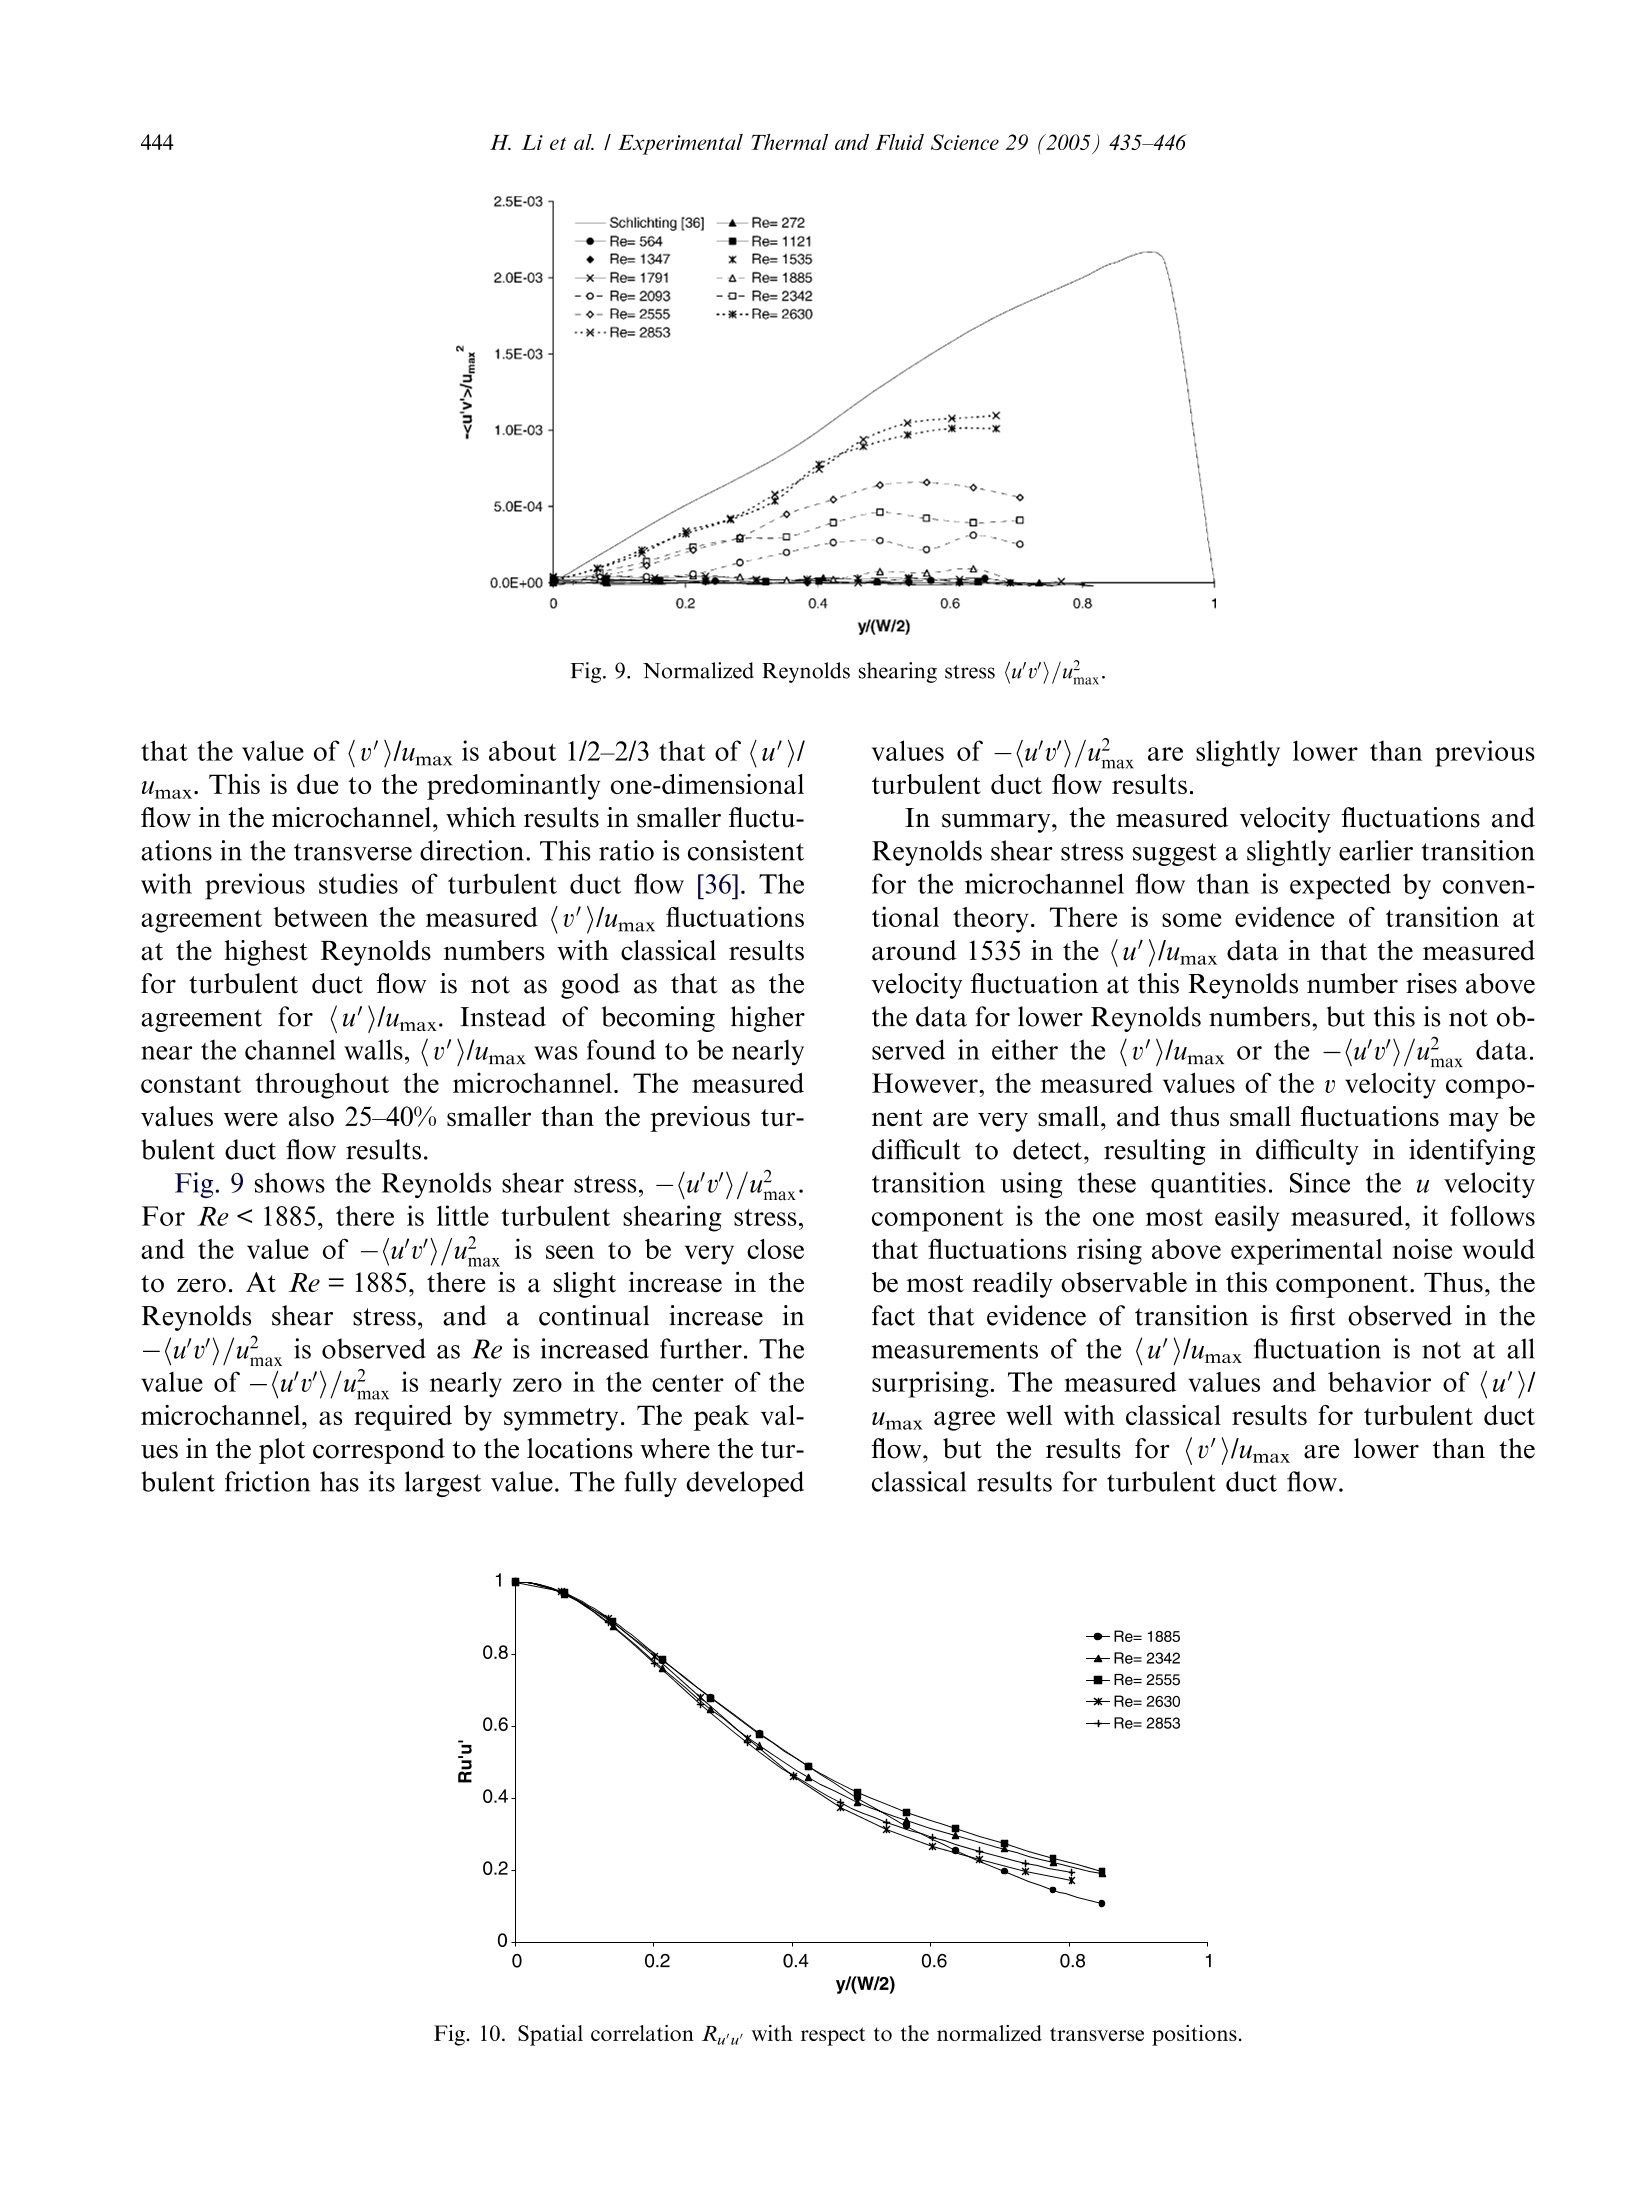
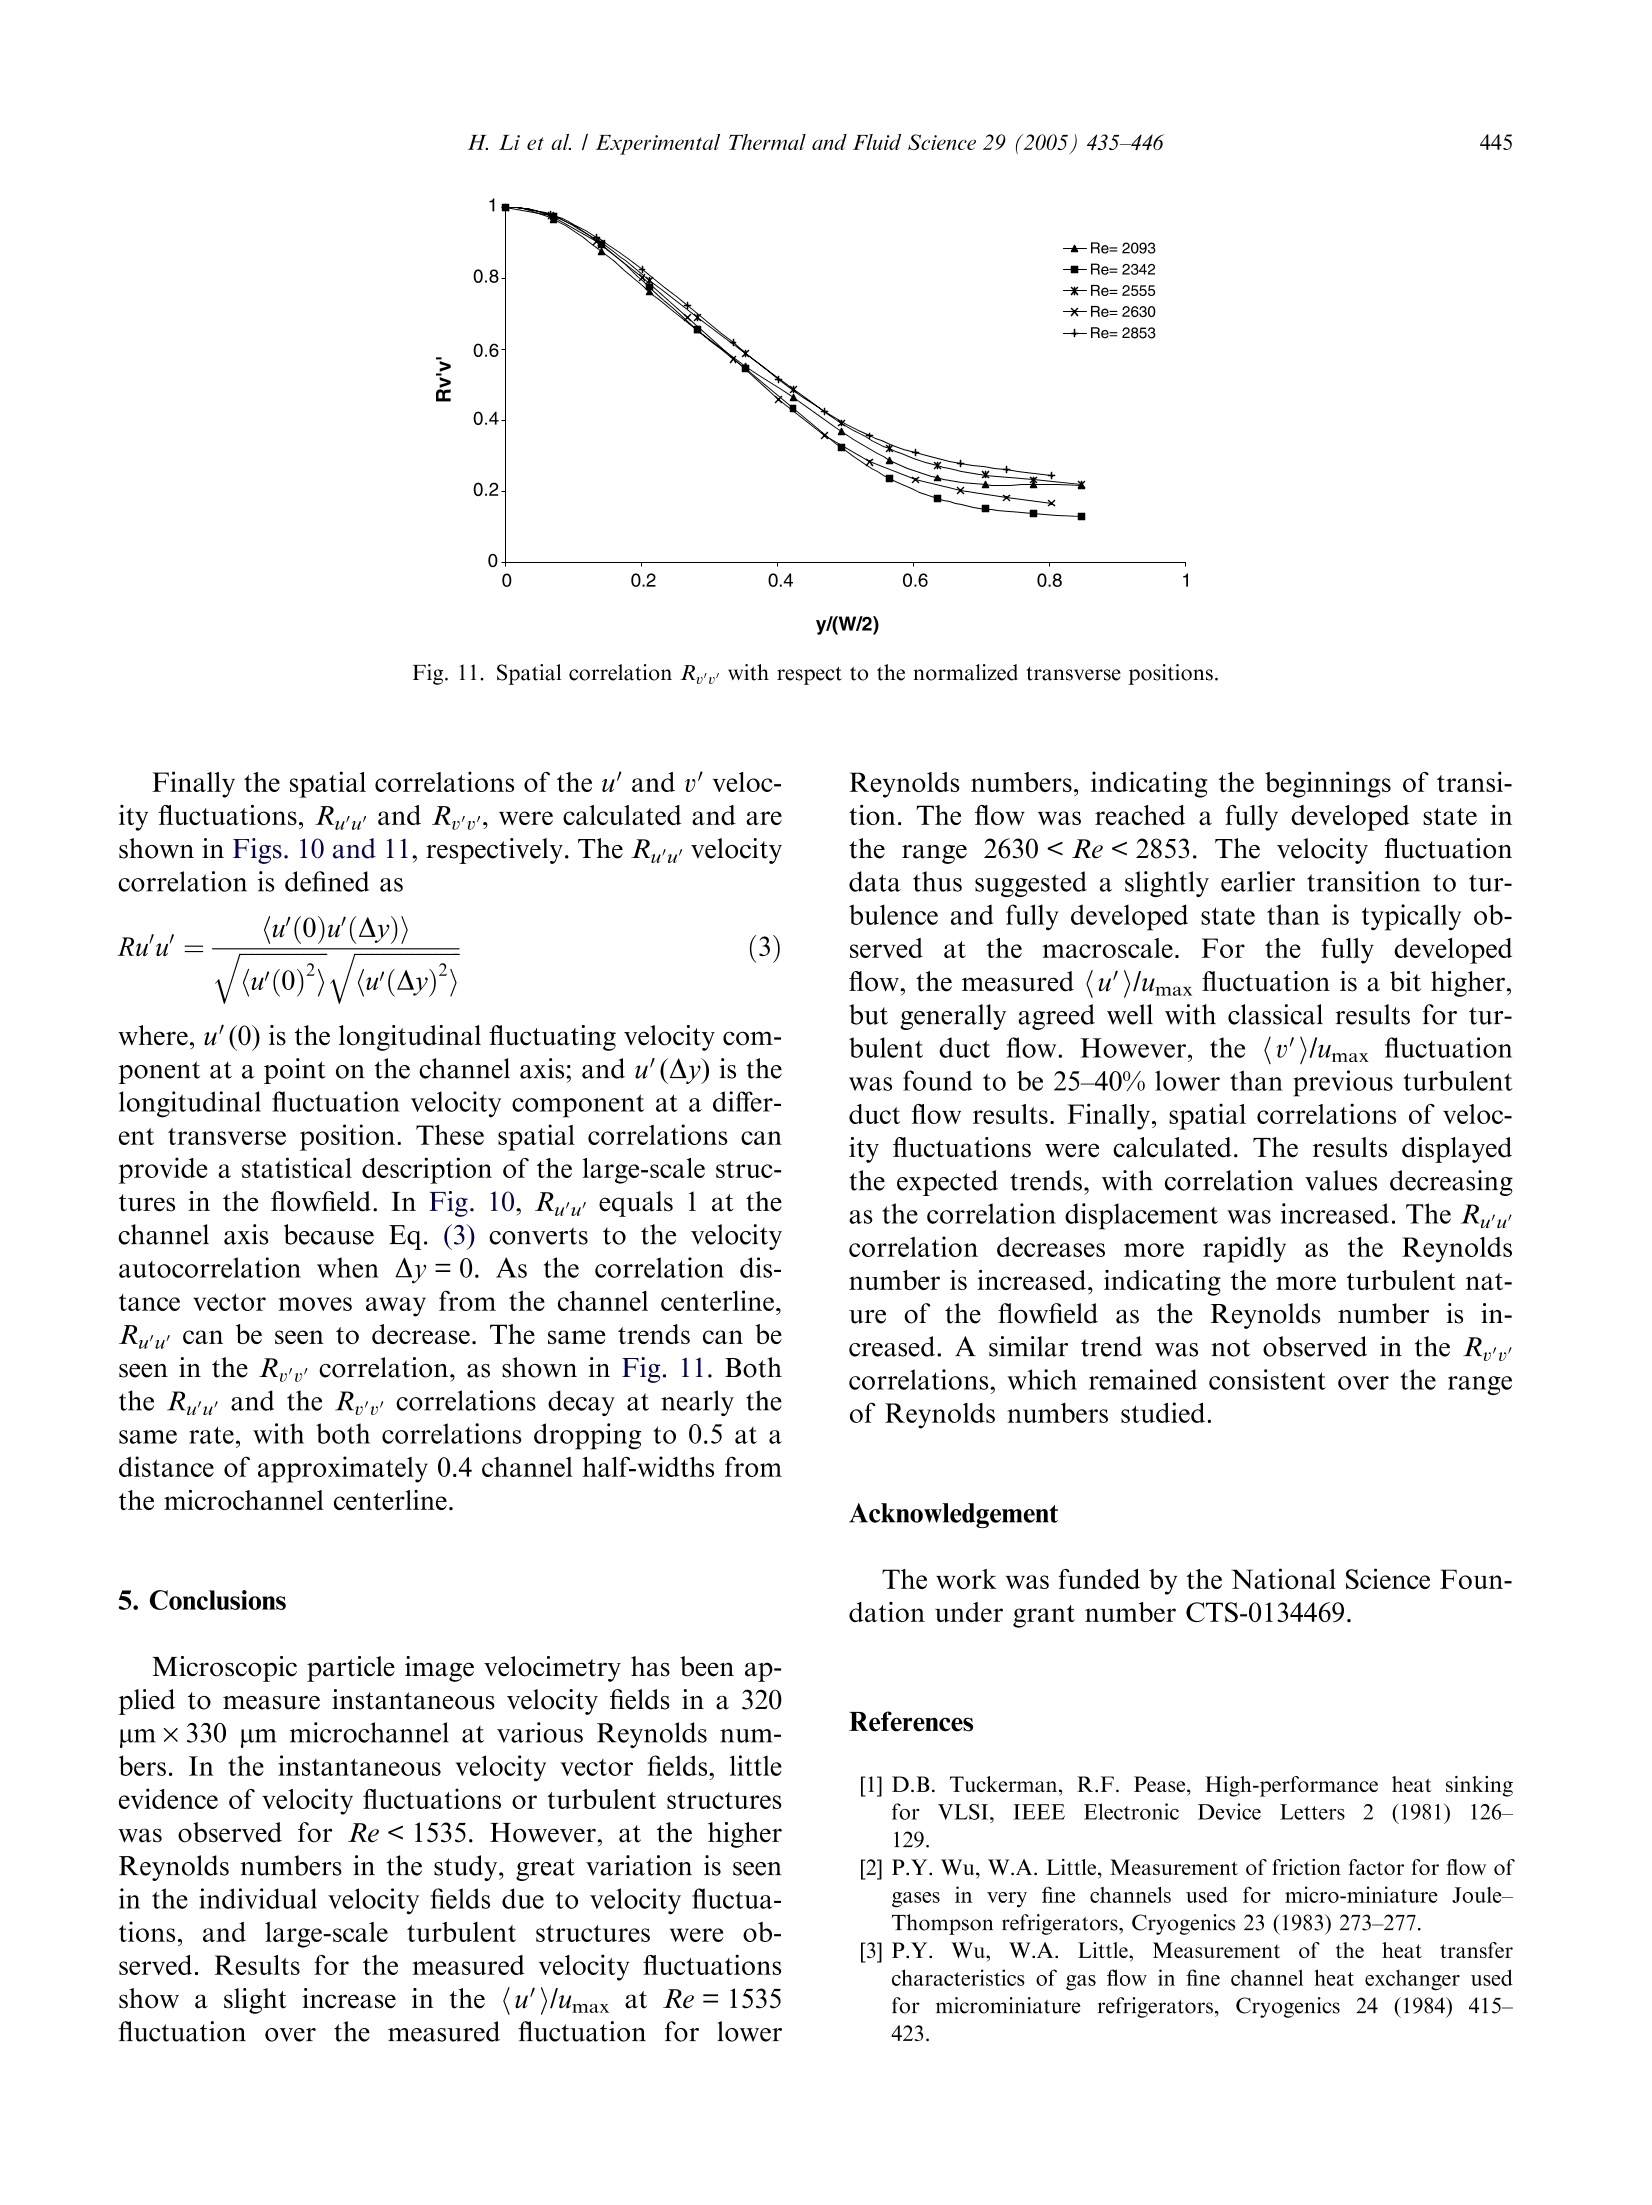
Available online at www.sciencedirect.comExperimentalETFThermal andFluid ScienceExperimental Thermal and Fluid Science 29 (2005) 435-446 436H. Li et al./ Experimental Thermal and Fluid Science 29 (2005)435-446 www.elsevier.com/locate/etfs Turbulent and transitional velocity measurements in a rectangularmicrochannel using microscopic particle image velocimetry Hao Li, Randy Ewoldt, Michael G.Olsen * Department of Mechanical Engineering, Iowa State University, 3025 H. M. Black Engineering Building, Ames, IA 50011, USA Received 30 August 2003; received in revised form 15 May 2004; accepted 5 June 2004 Abstract Microscopic particle image velocimetry (microPIV) experiments were performed on a polydimethylsiloxane (PDMS) microchan-nel with a cross-section measuring 320 um×330 um for Reynolds numbers between 272 and 2853. Care was taken to ensure that theseed particle density was great enough that accurate instantaneous velocity vector fields could be obtained for all the Reynolds num-bers investigated. Velocity fluctuations were calculated from ensembles of microPIV velocity fields.The (u’)/umax fluctuation showedan increase at Re = 1535 and a further increase as Reynolds numbers were increased, suggesting that transition to turbulence begannear Re = 1535, a Reynolds number lower than predicted by classical theory. The (u')/umax data also suggest the flow was fully-developed at a Reynolds number between 2630 and 2853, also lower than classical results. This finding was confirmed in plots ofthe mean velocity profile. For the fully developed flow, the measured (u’)/umax fluctuation agreed well with classical results for tur-bulent duct flow, but the (u')/umax fluctuation was 25-40% lower than turbulent duct flow results. Finally, spatial correlations ofvelocity fluctuations were calculated to lend some insights into the characteristics of the large-scale turbulent structures observedin the turbulent microchannel flow. @ 2004 Elsevier Inc. All rights reserved. Keywords: Turbulence; Transition; Microchannel; MicroPIV 1. Introduction Over the past two decades, microelectromechanicalsystems (MEMS) have become a rapidly developingtechnology, finding applications in many areas of engi-neering and science. Microfluidic MEMS devices involvethe flow of liquid or gas to accomplish their designpurpose. While many microfluidic MEMS devices,including such microscale analysis systems as gas chro-matographs and blood and DNA analyzers, are charac-terized by low Reynolds number flow, there are someapplication areas where the Reynolds numbers can bemuch higher, such as the development of microscale ( Cor r esponding au t hor. Tel.: +1 5 1 5 2 9 4 0073; f a x: +1 5 1 5 2 9 4 3261. ) ( E-mail address: mgolsen@i a state.ed u (M.G. Olsen). ) ( 0894-1777/$-see f r ont matter O 2004 Elsevier I n c. All rights reserved.doi:10.1016/j.expthermflusci.2004.06.001 ) heat exchangers for heat sinking applications, such asmicroelectronics cooling [1]. Because of its importancein this crucial area, the characteristics of fluid flow inmicrochannels, in both the laminar and turbulent re-gimes, have attracted a great deal of attention fromresearchers. However, despite the efforts of manyresearchers in this area, there exist some discrepanciesin the results of previous studies. Wu and Little [2,3], performed some of the firstexperiments in turbulent microchannel flow, measuringthe friction factors and heat transfer characteristics ofgas flow in etched glass and silicon microchannels withhydraulic diameters between 45.46 and 83.08 um. Theirresults showed that the friction factors and Nusseltnumbers for both the laminar and turbulent flow re-gimes were larger than predictions using traditionalmacroscale correlations. They also found evidence of early transition to turbulence, with transition observedat Reynolds numbers as low as 400. Peng et al. [4-7]studied the laminar-turbulent transition by measuringthe friction factors and heat transfer coefficients of waterflow in rectangular stainless steel microchannels withhydraulic diameters of 0.133-0.367 mm. They foundthat laminar flow ceased at a Reynolds number of200-700, and fully turbulent flow was achieved atRe =400-1500. Also, the experimental friction factorsand Nusselt numbers were different from conventiona]theory. The measured frictional resistance was greaterthan the classical prediction while the Nusselt numberwas smaller. Gui and Scaringe [8] studied single-phaseflow and heat transfer in chemical etched microchannelswith hydraulic diameters up to 388 um and found earlytransition with the critical Re =1400. However, goodagreement was found between the experimental frictionfactors in both the laminar and transitional regimes withclassical solutions, while the experimental Nusselt num-bers were higher than analytical solutions in the laminarflow zone. Harms et al. [9] found an early transition inthe plot ofthe experimental friction factor at a criticalReynolds number of 1500, which is lower than the valueof 2400 reported for conventional channels. Mala and Li[10] reported a higher friction factor for fully developedturbulent flow in fused silica and steel microtubes thanpredicted by conventional theory and attributed it tothe early occurrence of the laminar-turbulent transitionTheir data suggested early transition from Re > 300 to900 and fully developed turbulent flow at Re>1000-1500. Pfund et al. [11] studied pressure drop of waterflowing in high aspect ratio channels with depths rang-ing from 128 to 521 um for Reynolds numbers between60 and 3450 and detected transition from both friction Nomenclature Latin and Greek characters fluctuation of instantaneous transverse veloc- A area of each interrogation window (mm) ity (m/s) C the volumetric concentration of the fluores- X transverse position (um) cent particle solution (1/mm’) Ax displacement in transverse direction (um) D hydraulic diameter (m) constant = 0.01 M magnification of objective Es surface roughness (m) N quantity of particles in each interrogation wavelength of light emitted by the particles window (um) W width of the microchannel (um) p density (kg/m) R correlation coefficient (-) Re Reynolds number (-) Mathematical symbol Zcorr the depth of correlation (um) ensemble averaging value particle diameter (um) focal number of the lens Subscripts u longitudinal velocity in microchannel (m/s) center velocity at the center region of the channel u fluctuation of instantaneous velocity u (m/s) max maximum value factors and flow visualization experiments with a dyestream. They, too, found that the transitional Reynoldsnumber was lower than the critical Reynolds number formacroscopic ducts, and the transitional Reynolds num-ber decreased further with decreasing channel depth.Wu and Cheng [12] measured the friction factor forlaminar flow of deionized water in smooth silicon micro-channels of trapezoidal cross-section with hydraulicdiameters in the range of 25.9-291.0 um. A slightly earlytransition was found at Re=1500-2000 with goodagreement between experimental data and the analyticalsolution for incompressible, fully developed, laminarflow under a no-slip boundary condition. Most of theseresearchers attributed the early transition to the rela-tivelyyhighsurfaceroughness in microchannels[2,3,10,13,14]. . Although early transition has been observed by someresearchers, it is very interesting to note that, in theworks of other researchers, there is no evidence of earlytransition occurring at all. For example, Hegab et al.[15] investigated the fluid flow and heat transfer charac-teristics of single-phase flows of R134a in aluminummicrochannels with hydraulic diameters ranging from112 to 210 um and aspect ratios from 1.0 to 1.5. Thetransition from laminar to turbulent flow was found tooccur in the range of 2000-4000 in Reynolds number,which is the same as conventional theory. Qu andMudawar [16] reported no evidence of early transitionin their experiments on the fluid flow characteristics ofa microchannel heat sinkwith dimensions of 231um×713 um. The Reynolds number in their experi-ments ranged from 39 to 1672, which is within the rangeof the early transition reported in previous works. Judyet al. [17] measured frictional pressure drop of fluid flow in microtubes with hydraulic diameters between 15 and150 um for three different fluids (water, methanol, iso-propanol), two different tube materials (fused silica,stainless steel), and two different tube cross-sectiongeometries (circular, square). However, there was no"distinguishable” deviation from macroscale viscousflow theory. Chung et al. [18] performed experimentsto study single-phase flow characteristics in a 100 umcapillary tube. Good agreement was observed whenthe measured friction factor was compared with the con-ventional theory for deionized water flow, although sur-face roughness wwas not considered. The measuredvelocity also matched the theoretical profile for laminarflow in a circular microchannel. For gas flow, the com-pressibility effect was found to be important to matchthe experimental data with theory. The previously mentioned experiments used pressuremeasurements in their investigations of microchannels,but the recent development of microscopic particle im-age velocimetry [19-22] has added a new tool for theinvestigation of microscale fluid flows. Since its develop-ment, this technique has also been used for noninvasivemeasurements in many microchannel geometries andcomplicated microfluidic systems [23-26]. Using thistechnique, Zeighami [27] studied transitional flow in sil-icon microchannels with dimensions of 150 um×100um. In this work, the repeatability of the velocity datawas taken as the criteria to distinguish laminar and tur-bulent flow. Seed particles were also observed to move inand out of the measurement volume,indicating a three-dimensional velocity field that would not be characteris-tic of laminar microchannel flow. With this criteria.early transition was found at Re=1200-1600. Whilethis study provided valuable information on transition,the particle seed density was not sufficient for Reynoldsstresses to be measured or for turbulent structures to beobserved. The present work uses microPIV to obtain instanta-neous velocity fields of flow through a rectangular chan-nel measuring 320(W) umx330(H) um. The particleseeding was dense enough that Reynolds stresses couldbe measured. To determine the onset of turbulence,the velocity profile is compared with the laminar analyt-ical solution and fluctuations in the velocity field aremeasured. The measured Reynolds stresses are thencompared with classical results for macroscale ducts. Fi-nally, spatial correlations of velocity fluctuations are cal-culated and reported. 2. Microchannel fabrication The microchannels used in the presented experimentswere fabricated using PDMS replica molding [28-31]. Inthis technique, the microchannel is made from polydi-methylsiloxane (PDMS) that has been cast onto a mold Fig. 1. Cross section schematic of microchannel fabrication technique. master made of patterned photoresist on a silicon wafer.Two pieces of cast PDMS are brought together toassemble the final device. Devices fabricated using thistechnique are well suited for optical-based studies be-cause the material is transparent between the wave-lengths of 230-700 nm, giving nearly unlimited opticalaccess to the interior of the microchannel at these wave-lengths. Fig. 1 summarizes the fabrication procedure. 2.1. Mold master The mold was made from patterned negative photo-resist (SU-8 2100, MicroChem Corp., Newton, MA)on a silicon wafer (100 mm diameter, Montco SiliconTechnologies, Inc, Spring City, PA). A puddle (~50mm wide) of photoresist was dispensed onto the sub-strate at static conditions. Spin-coating was then per-formed by rotating the substrate at 500 rpm for 10 s,accelerating at 300 rpm/s, reaching 1800 rpm and hold-ing for 30 s. The viscosity of SU-8 2100 made it extre-mely difficult to deposit the resist without introducingbubbles. Additionally, after spin-coating, there was anoticeable line in the resist where the edge of the initialpuddle once stood. However, these problems were alle-viated by a long soft bake at low temperature. A softbake was performed in a convection oven at 65 °C for4.5 h, then ramped to 95 °C and held for 20 min. Aftersoft baking, the resist was exposed to UV light through ahigh-resolution transparency film actin8ga ass a photo-mask. A post-expose bake was performed to cross-linkthe resist, and the mold was then developed using 1-methoxy-2-propanol acetate (PMA) to remove theunexposed resist, leaving a mold in high relief for thechannel. The resulting mold was 330 um high. 2.2. Casting PDMS Polydimethylsiloxane (PDMS) elastomer (Sylgard(R)184 Silicone Elastomer Kit, Dow Corning, Midland,MI) was used as the bulk material of the channel. ThePDMS prepolymer was mixed with the curing agent ina 10:1 ratio and exposed to low pressure in a desiccatorto remove bubbles formed during mixing. The prepoly-mer mixture was poured over the mold and again placedin the desiccator to remove bubbles. The PDMS castingwas then cured in a convection oven at 60 °C for a min-imum of 2 h. 2.3. Microchannel assembly The final product consisted of two PDMS pieces: atop portion that was cast against the photoresist moldcontaining three walls of the channel and a bottom por-tion that had been cast against a blank silicon waferAssembly of the channel began with the removal ofPDMS from the mold. The PDMS was then trimmed,and access holes were punched through the top portionof PDMS. The two halves were placed in an ethanolbath in an ultrasonic cleaner for 5 min to clean the sur-faces, and subsequently dehydrated in a convection ovenat 60 °C for 10 min. The two halves were then exposedto oxygen plasma (20 W, 1 Torr, 1 min) and immediatelybrought into conformal contact. The channel was keptin a convection oven at 60 °C for ~30 min to ensurecomplete adhesion at the PDMS/PDMS interface. Flex-ible tubing was coated with RTV sealant and insertedinto the access holes in the PDMS. Additional sealantwas applied to ensure a complete seal. The sealant wasallowed to cure for 2 days. This method for bondingthe connecting tubing to the PDMS was strong enoughto withstand even the highest flowrates studied in themicroPIV experiments. Alternative methods of connect-ing tubing to the channel resulted in failure at the tub-ing/PDMS interface for flow rates near 45 ml/min. 2.4. Resulting deuice The resulting microchannel was 5 cm long and had across-section of 320 um×330 um, yielding a hydraulicdiameter of 325 um. Surface roughness inside the chan-nel was measured with a Dektak IIA surface profilemeasuring system (Veeco Instruments Inc., Santa Barb-ara, CA). Linear surface profiles were taken of the castPDMS. These measurements were limited, as the profi-lometer stylus could only be used on the top and bottomsurfaces of the channel.The arithmetic average rough-ness was calculated by the Dektak IIA software and was determined to be approximately 24 nm. This resultsin a relative roughness :,/D≈ 0.000074. The microchannel experienced repeated catastrophicfailure at flow rates near 60 ml/min, thus the maximumReynolds number that could be investigated in the pre-sent study was 2853 This failure occurred at the PDMS/PDMS interface indicating that the failure was due to alimitation in the plasma bonding of the two surfaces.Multiple microchannel prototypes were fabricated usingthe previously described technique, but all failed at thismaximum flowrate. The authors are currently investigat-ing modifications to the fabrication technique in orderto produce stronger PDMS/PDMS surface bonding inorder to obtain higher maximum flow rates, but thusfar all efforts in this area have failed. 3. Experimental apparatus and methodology . The experimental apparatus, schematically shown inFig. 2, consisted of two parts: (i) the flow delivery sys-tem; and (ii) the microPIV system. The flow was drivenby a microgear pump and pump head (115 VAC consoledigital dispensing drive and 0.084 ml/rev suction shoegear pump head, Cole-Parmer Instrument Co., VernonHills, IL). This system was chosen over the more com-monly used syringe pump for a number of reasons.First, the micro gear pump was found to provide verysteady flowrates with an accuracy of around 0.3%. Fur-thermore, collecting the large ensembles of microPIVimages used in the present study required a far longerrun time than the syringe pump could provide. Usingthe microgear pump allowed the system to be run atessentiallsyteady-statarfe, allowing large numbersofmicroPIV images to be taken during each run. Flow rateand temperature were monitored using a digital flowme-ter (0-100 ml/min volumetric water flow meter, Cole-Parmer Instrument Co., Vernon Hills, IL) with anaccuracy of ±2% full scale. The temperature was care-fully monitored during each run, as viscous dissipationcould potentially increase the temperature and thus varythe fluid viscosity. A fluid reservoir was also added tothe system to increase the thermal mass of fluid, andthus allow for longer run times before any viscous heat-ing was discernable. The microchannel was connected tothe flow delivery system with flexible tubing. The microPIV system is shown in the lower portionof Fig. 2. The microchannel is placed on the stage ofan inverted biological microscope [Nikon model T-300Inverted Microscope], and fluid containing fluorescentmicrospheres is allowed to flow through the microchan-nel. The light beam from a New Wave Research GeminiNd:YAG PIV laser is expanded before entering themicroscope through an aperture in the back. The laserlight is then directed towards the microchannel by adichroic mirror and passes through a microscope objec- Microscope Fig. 2. Schematic of the experimental setup. tive, illuminating the seed particles. The laser is capableof producing up to 120 mJ per laser pulse, but only asmall fraction of this light is necessary for the microPIVexperiments. An optical attenuator is therefore used toreduce the laser energy to approximately 3 mJ/pulse. The 770 nm diameter fluorescent seed particles (Poly-styrene microspheres, Interfacial Dynamics Corp., Port-land, OR) are excited by the laser light and emit light ata peak excitation wavelength of 612 nm. A beamsplitterremoves the illuminating and background light such thatonly the emitted light from the particles reaches theCCD camera. Two images are captured per realization,and the two images are analyzed using a cross-correla-tion technique to yield the instantaneous velocity vectorfield. The PIV system and software include a LaVisionFlowmaster 3 camera and DaVis analysis software(Lavision Inc., Ypsilanti,MI). One of the difficulties that had to be overcome in per-forming these experiments was seeding the flow suffi-ciently to allow instantaneous velocity vector fields tobe obtained. Because obtaining high seed particle den-sity can be difficult in microPIV, a common analysistechnique is to ensemble-average many cross-correlationfields for an individual interrogation region, yielding anaverage velocity field with high spatial resolution. In-deed, using this technique, microPIV results have beenreported with spatial resolutions as small as 1 um [20].However. such measurements are of limited usefulness for turbulent flowfields, as they provide no informationabout instantaneous velocity fields. Therefore, in thepresent experiments, the authors chose to sacrifice somespatial resolution in order to achieve a high enough seeddensity to obtain accurate instantaneous velocity fields The concentration of the fluorescent particle solutionwas prepared to ensure at least 5-10 seed particles ineach interrogation volume, resulting inaminimalamount of bad velocity vectors in each vector field[32]. The necessary minimum seed density was estimatedusing the equation .where, N is the desired minimum number of particles ineach interrogation volume; C is the volumetric concen-tration of the fluorescent particle solution; A is the areaof each interrogation window; and 2Zcorr is the depth ofcorrelation [33] which can be estimated by (2) where :=0.01; j is the focal number of the lens; d, isthe particle diameter; M is the magnification, and 2 isthe wavelength of light emitted by the particle. Eq. (2)also provides an estimation of the measurement volumedepth for the resultsreported here (note thatl an alternative equation for the depth of correlation derivedby Meinhart et al. [34] yields a similar result for thedepth of correlation). In the present experiments, a20X 0.45 NA objective was used, yielding a depth of cor-relation of 8.3 um. The interrogation windows in theseexperiments measure 28 pm square. Adjacent interroga-tion windows were overlapped by 50%, yielding a spatialresolution of 14 um. This spatial resolution allowedfor 22 vectors to be measured across the width of themicrochannel. Achieving this spatial resolution requireda volumetric particle concentration of approximately0.0567%. This volume fraction of seed particles is smallenough that any two-phase effects are negligible, and theworking fluid can be considered a single-phase fluid. The timing between laser pulses was set such that theparticles moved approximately 1/4th of an interrogationwindow between 1pulses. The interrogation windowsmeasured 32 camera pixels square, thus the particlesmoved approximately 8 pixels between laser pulses.Assuming that the measured velocity is accurate to with-in 1/5th of a pixel [35] results in an experimental uncer-tainty of less than ±2.5%. In the microPIV experiments, deionized water wasused as the working fluid. In order to prevent the build-up of contaminants in the system, air was pumpedthrough the microchannel first to expel stagnant waterand other contaminants. The fluorescent-particle-con-taining deionized water solution was then pumpedthrough the microchannel at a specified volumetric flow-rate. Although the flowrate was displayed by the digitalgear pump, this reading was also confirmed by the seri-ally connected flow meter in the microPIV system to en-sure the accuracy of the reported Reynolds numbers. The experiments were performed at various flow ratescorresponding to Reynolds numbers ranging from 272to 2853. For each set of experiments, sufficient timewas allowed to pass after starting the micro gear pumpto allow the flow to reach steady-state. For smaller flowrates, it took a longer time to reach a steady-state com-pared to higher flow rates. For all flow rates, a multi-passs interrogation scheme with decreasing smallerwindow sizes was used in the computation of the vectorfields to reach the final 32×32 interrogation window,and adjacent interrogation windows were overlappedby 50%. The only post-processing performed on the vec-tor fields was the removal of bad vectors. No smoothingof vector fields was performed.The number of velocityfields collected for each Reynolds number ranged from600 for the lowest, laminar Reynolds numbers to 2000for the transitional and turbulent Reynolds numbers. 4. Results and discussion Flow field measurements were performed at the vari-ous Reynolds numbers from 272 to 2853 at a sufficiently long distance downstream of the entrance such that theflow was fully developed. This was verified by takingmeasurements at different downstream locations andcomparing the mean velocity profiles. In all cases, veloc-ity fields were measured at the channel midplane. Fig. 3(a) shows one of the instantaneous velocityfields for Re =272. At Re =272, the velocity field sug-gests the parabolic velocity profile one might expectfor laminar channel flow. In addition, the velocity vec-tors at identical transverse locations are observed to beuniform, with no evidence of turbulent fluctuations.As expected due to the steady and laminar nature ofthe flow at this Reynolds number, all of the realizationsfor Re =272 yielded similar results. Notice that the loca-tions of the bad vectors (which have been removed) arelocated near the channel walls. This was true in all of themeasured velocity vector fields: bad vectors were con-fined to the region close to the microchannel walls.Fig. 3(b) and (c) are examples of instantaneous velocityfields at Re = 1885 and 2853, respectively. More randomvariation of vectors, including the fluctuating velocitycomponents in the transverse direction, can be observedwith the fluctuations more readily apparent at Re = 2853than 1885. The velocity profiles can also be seen to be-come less parabolic than in the laminar case, with thevelocity profile becoming fuller, suggesting a transitionalor turbulent flow. The turbulent nature of the velocity fields is more eas-ily seen if a constant, convective velocity is subtractedfrom the instantaneous velocity fields. This has beendone for instantaneous velocity fields at Re=2625,2718, and 2913 which are shown in Fig. 4. Each of thesevelocity fields shows evidence of large-scale turbulentstructures, as labeled in the figures. Indeed, the appear-ance of these structures is quite similar to what onewould observe in large duct or channel. Great variationsin the shape, size, and location of turbulent vortices areobserved in these figures. Particularly interesting are thetwo lower labeled turbulent structures in Fig. 4(c), whichappear to be undergoing vortex pairing. Varying theconvective velocity that is subtracted from these imagescan make other turbulent structures within the flowfieldmore apparent. Similar efforts have been applied to thevector fields for Re < 1535 in an effort to detect turbu-lent structures in these flowfields, but for these ReynoldsnumbersrSno apparenttturbulentit vorticescan beobserved. The ensemble-averaged longitudinal velocity profilesfor various Reynolds numbers are presented in Fig. 5,together with the corresponding fully developed laminaranalytical solutions in a rectangular pipe [37].The trans-verse positions of data have been normalized by 1/2 ofthe width of the microchannel, thus 0 corresponds tothe microchannel centerline and 1 corresponds themicrochannel wall. For Re=272, which is in the lami-nar regime, the agreement between the measured veloc- (c) Fig. 3. Instantaneous velocity fields at: (a) Re=272; (b) Re=1885 and (c) Re=2853. ity profiles and the laminar flow solution is quite good,as one would expect. The good agreement between themeasured velocity and the laminar solutions continuesuntil a Reynolds number of 1347. At this Reynoldsnumber, some deviation is noticed, as the velocity profilebecomes a bit less parabolic, as one would observe intransitional or turbulent flow. This deviation is a bitpuzzling since turbulent velocity fluctuations were notobserved at this Reynolds number and the measuredvelocity fluctuations and Reynolds stresses showed noevidence oftransition. As Reynolds number is increasedbeyond 1347, the deviation from the laminar solutionbecomes greater, with the measured velocity near thechannel axis much lower than the laminar flow predic-tion, and the velocity near the channel walls muchhigher until at the highest Reynolds numbers measured,the measured velocity profiles begin to resemble fullydeveloped turbulent flow. The changing shape of themean velocity profiles with increasing Reynolds numbercan be easily seen in Fig.6, in which the velocity profileshave been normalized by the centerline velocity. Fig.6also suggests thatat the flow isISfully developed atRe =2853, since at this Reynolds number the measured velocity profile almost exactly matches that of fullydeveloped turbulent duct flow. In order to analyze the variation of the velocity fieldsquantitatively, velocity fluctuations and Reynolds shearstress were computed from the microPIV data. Figs. 7-9show the dimensionless profiles of (u')/umax; (u')/umax,and -(u’u’)/umax, respectively. In Fig. 7, for Reynoldsnumbers below 1535, the measured centerline values of(u')/umax exhibit a nearly uniform value of around1.5%. The measured fluctuations at these low Reynoldsnumbers is not evidence of turbulence, but is instead dueto measurement uncertainty. Indeed, the measuredvelocity fluctuations at these Reynolds numbers arecomparable to the experimental error described earlierAt Re= 1535, a dramatic increase in (u’)/umax is ob-served, indicating that the flow is beginning to transitionat a Reynolds number slightly lower than that predictedby classical theory. The profiles for Re=2630 andRe=2853 are nearly identical, indicating that some-where in this range of Reynolds number, the flow hasreached a fully-developed state. These fully-developedvalues for (u')/umax are slightly higher than classical re-sults for turbulent duct flow [20], but in general, the (a) (b) (c) Fig. 4. Instantaneous vector fields with convective velocities subtracted showing turbulent vortices at: (a) Re=2342;(b) Re=2630, and(c) Re=2853. Fig. 5. Comparison of experimental velocity profiles with analytical laminar solutions. Fig.6. Normalized mean velocity profiles for the experimental data. 0.16 Fig. 7. Normalized streamwise velocity fluctuation (u')/umax. Fig. 8. Normalized transverse velocity fluctuations, (u’)/umax. agreement is good, as all of the results fall within theexperimental uncertainty of around 2.5%. A plot ofthe (u’)/umax fluctuation is shown in Fig. 8.For Re <1885, the curves are clumped together, with(u’)/umax around 1%. As with the (u’)/umax measure-ments at the lower Reynolds numbers, these measuredfluctuations are due to measurement uncertainty. A small increase in (u’)/umax is observed at Re=1885,and this is followed by a rapid increase as the Reynoldsnumber is further increased. The data in Fig. 8 also sug-gest that the flow becomes fully developed between2630
确定
还剩10页未读,是否继续阅读?

产品配置单


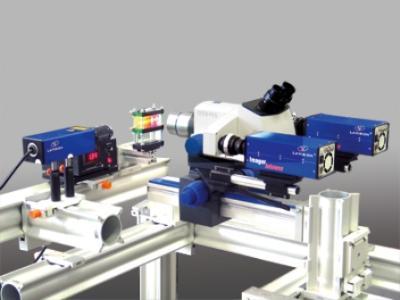
北京欧兰科技发展有限公司为您提供《微尺度流体中流场检测方案(粒子图像测速)》,该方案主要用于其他中流场检测,参考标准--,《微尺度流体中流场检测方案(粒子图像测速)》用到的仪器有显微粒子成像测速系统(Micro PIV)、Imager sCMOS PIV相机
推荐专场


相关方案
更多
该厂商其他方案
更多