


方案详情
文
分析比较了对喷雾速度分布和粒径分布评价测量的三种方法:PDI-相位多普勒粒子干涉仪;ParticleMaster-Shadow 阴影法测量粒径,以及ParticleMaster-IMI干涉米氏成像的特点和适用范围。
方案详情

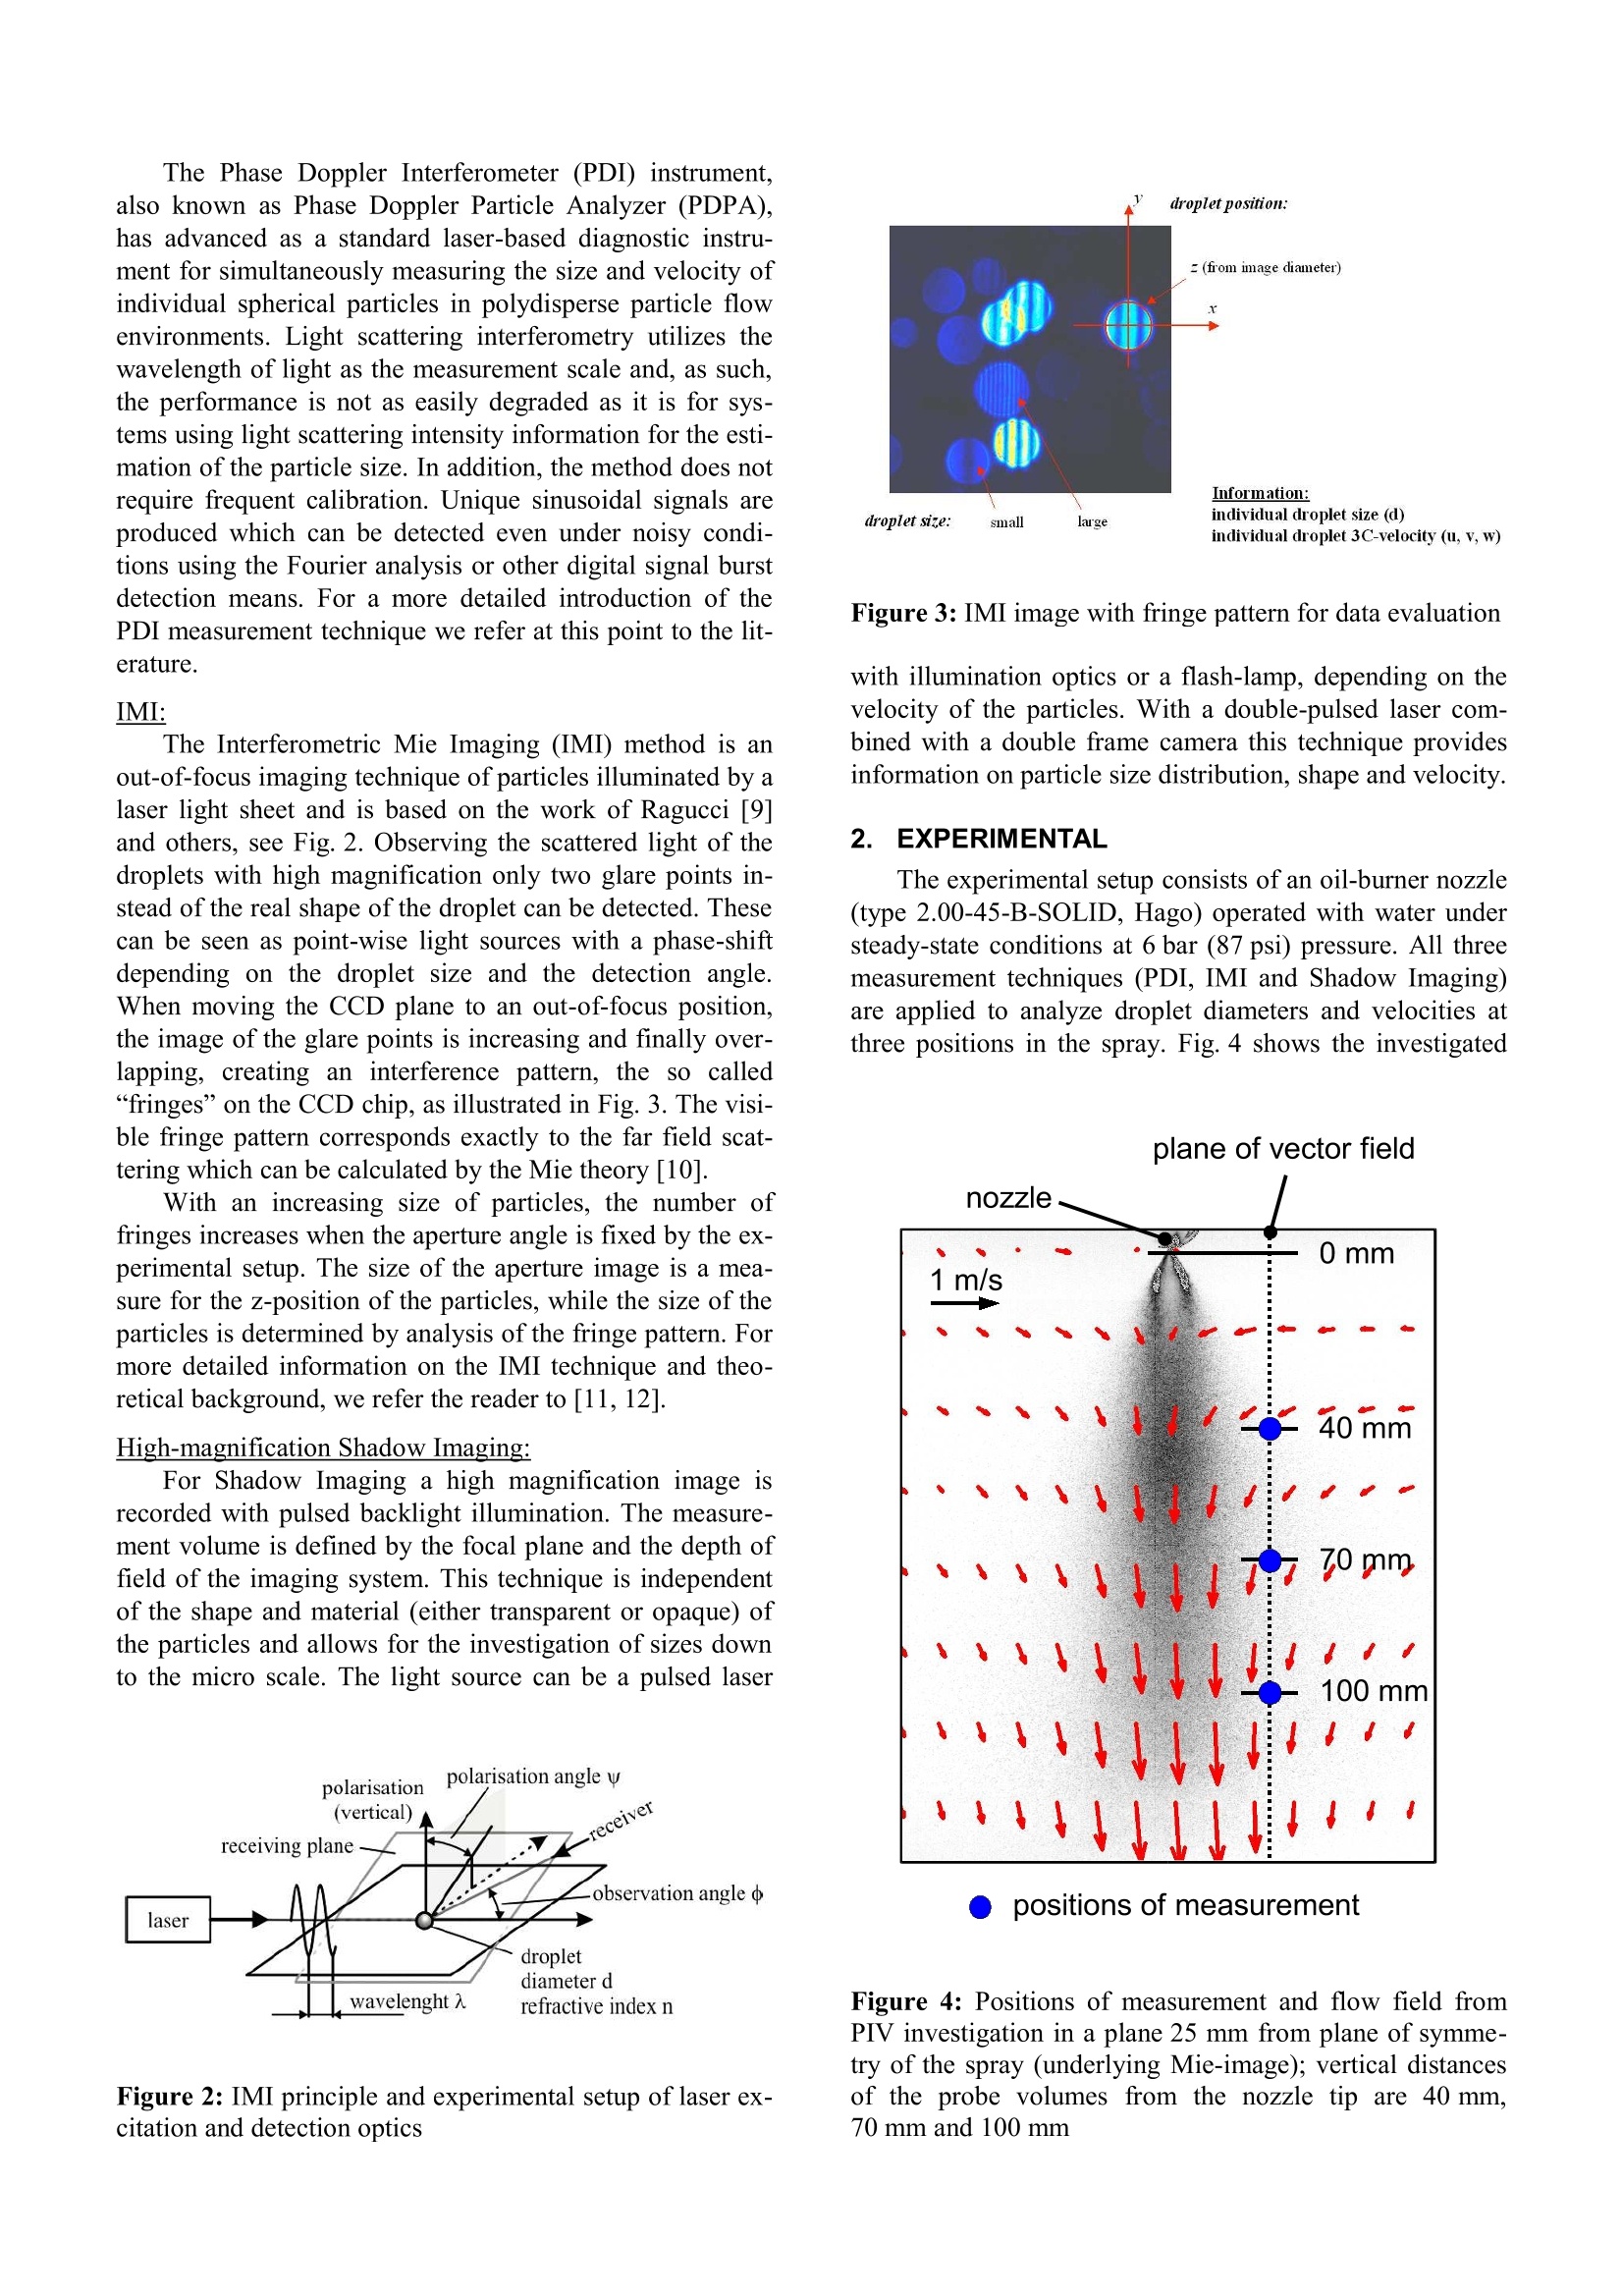
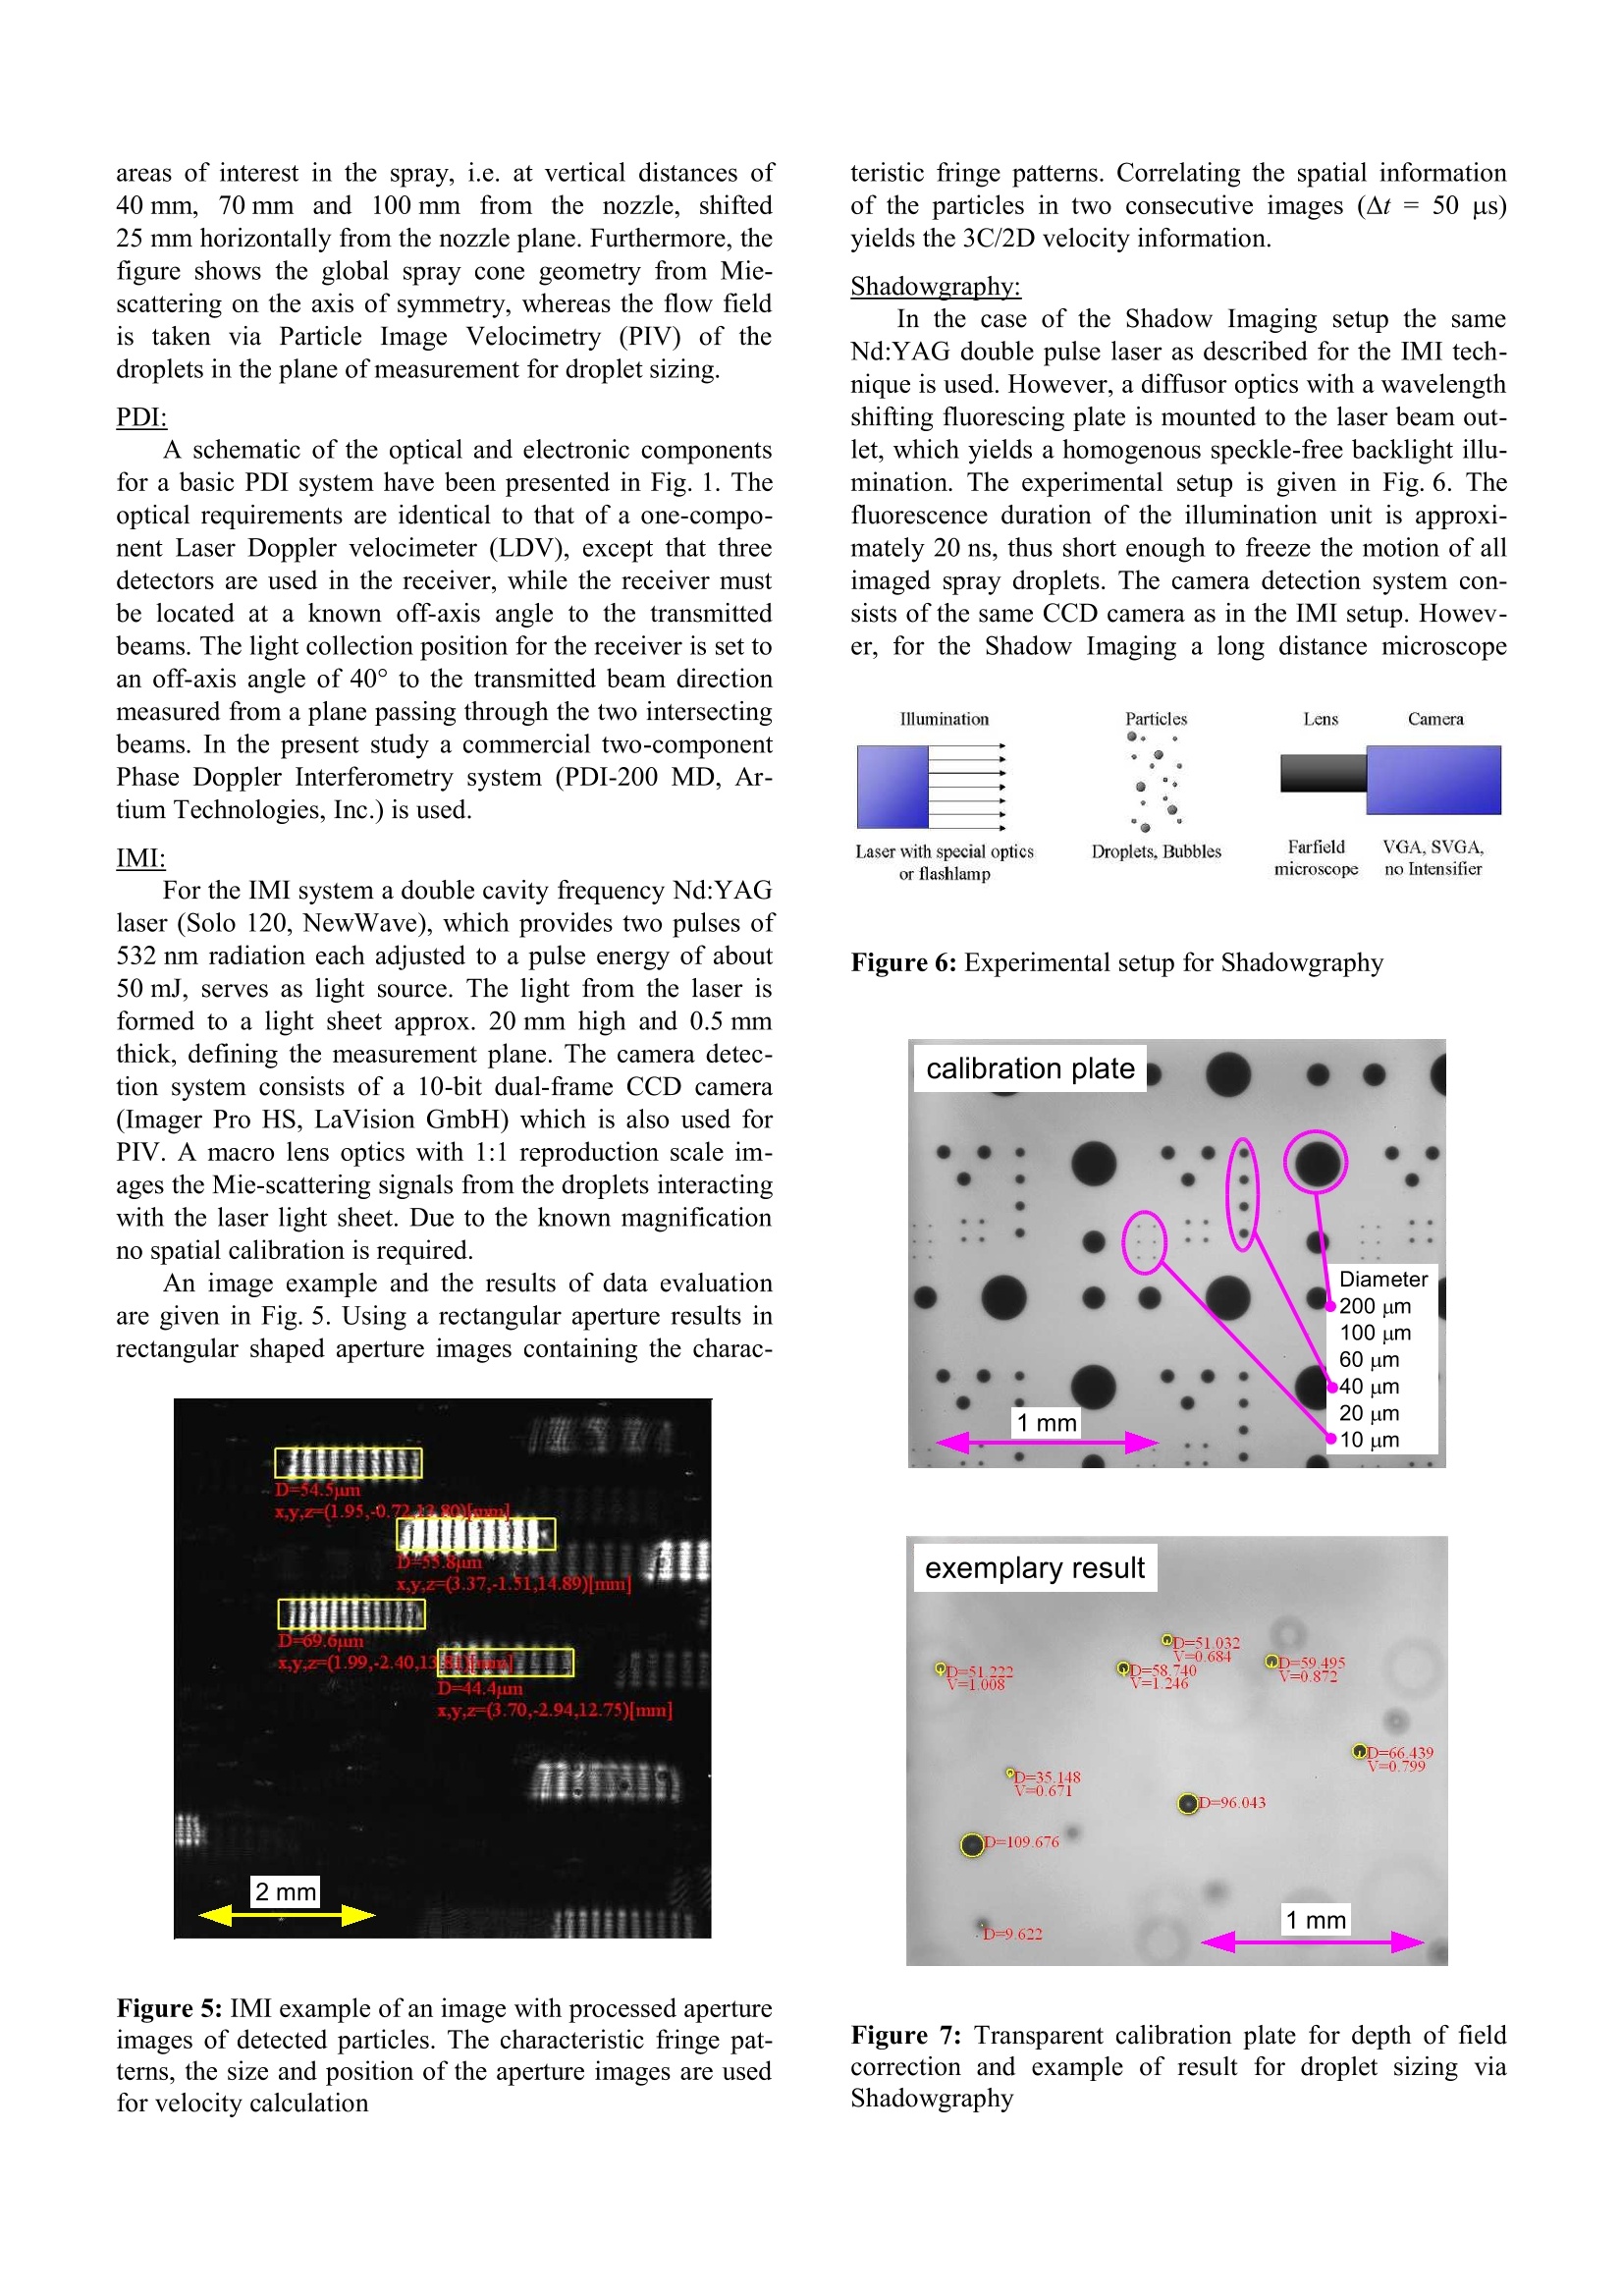
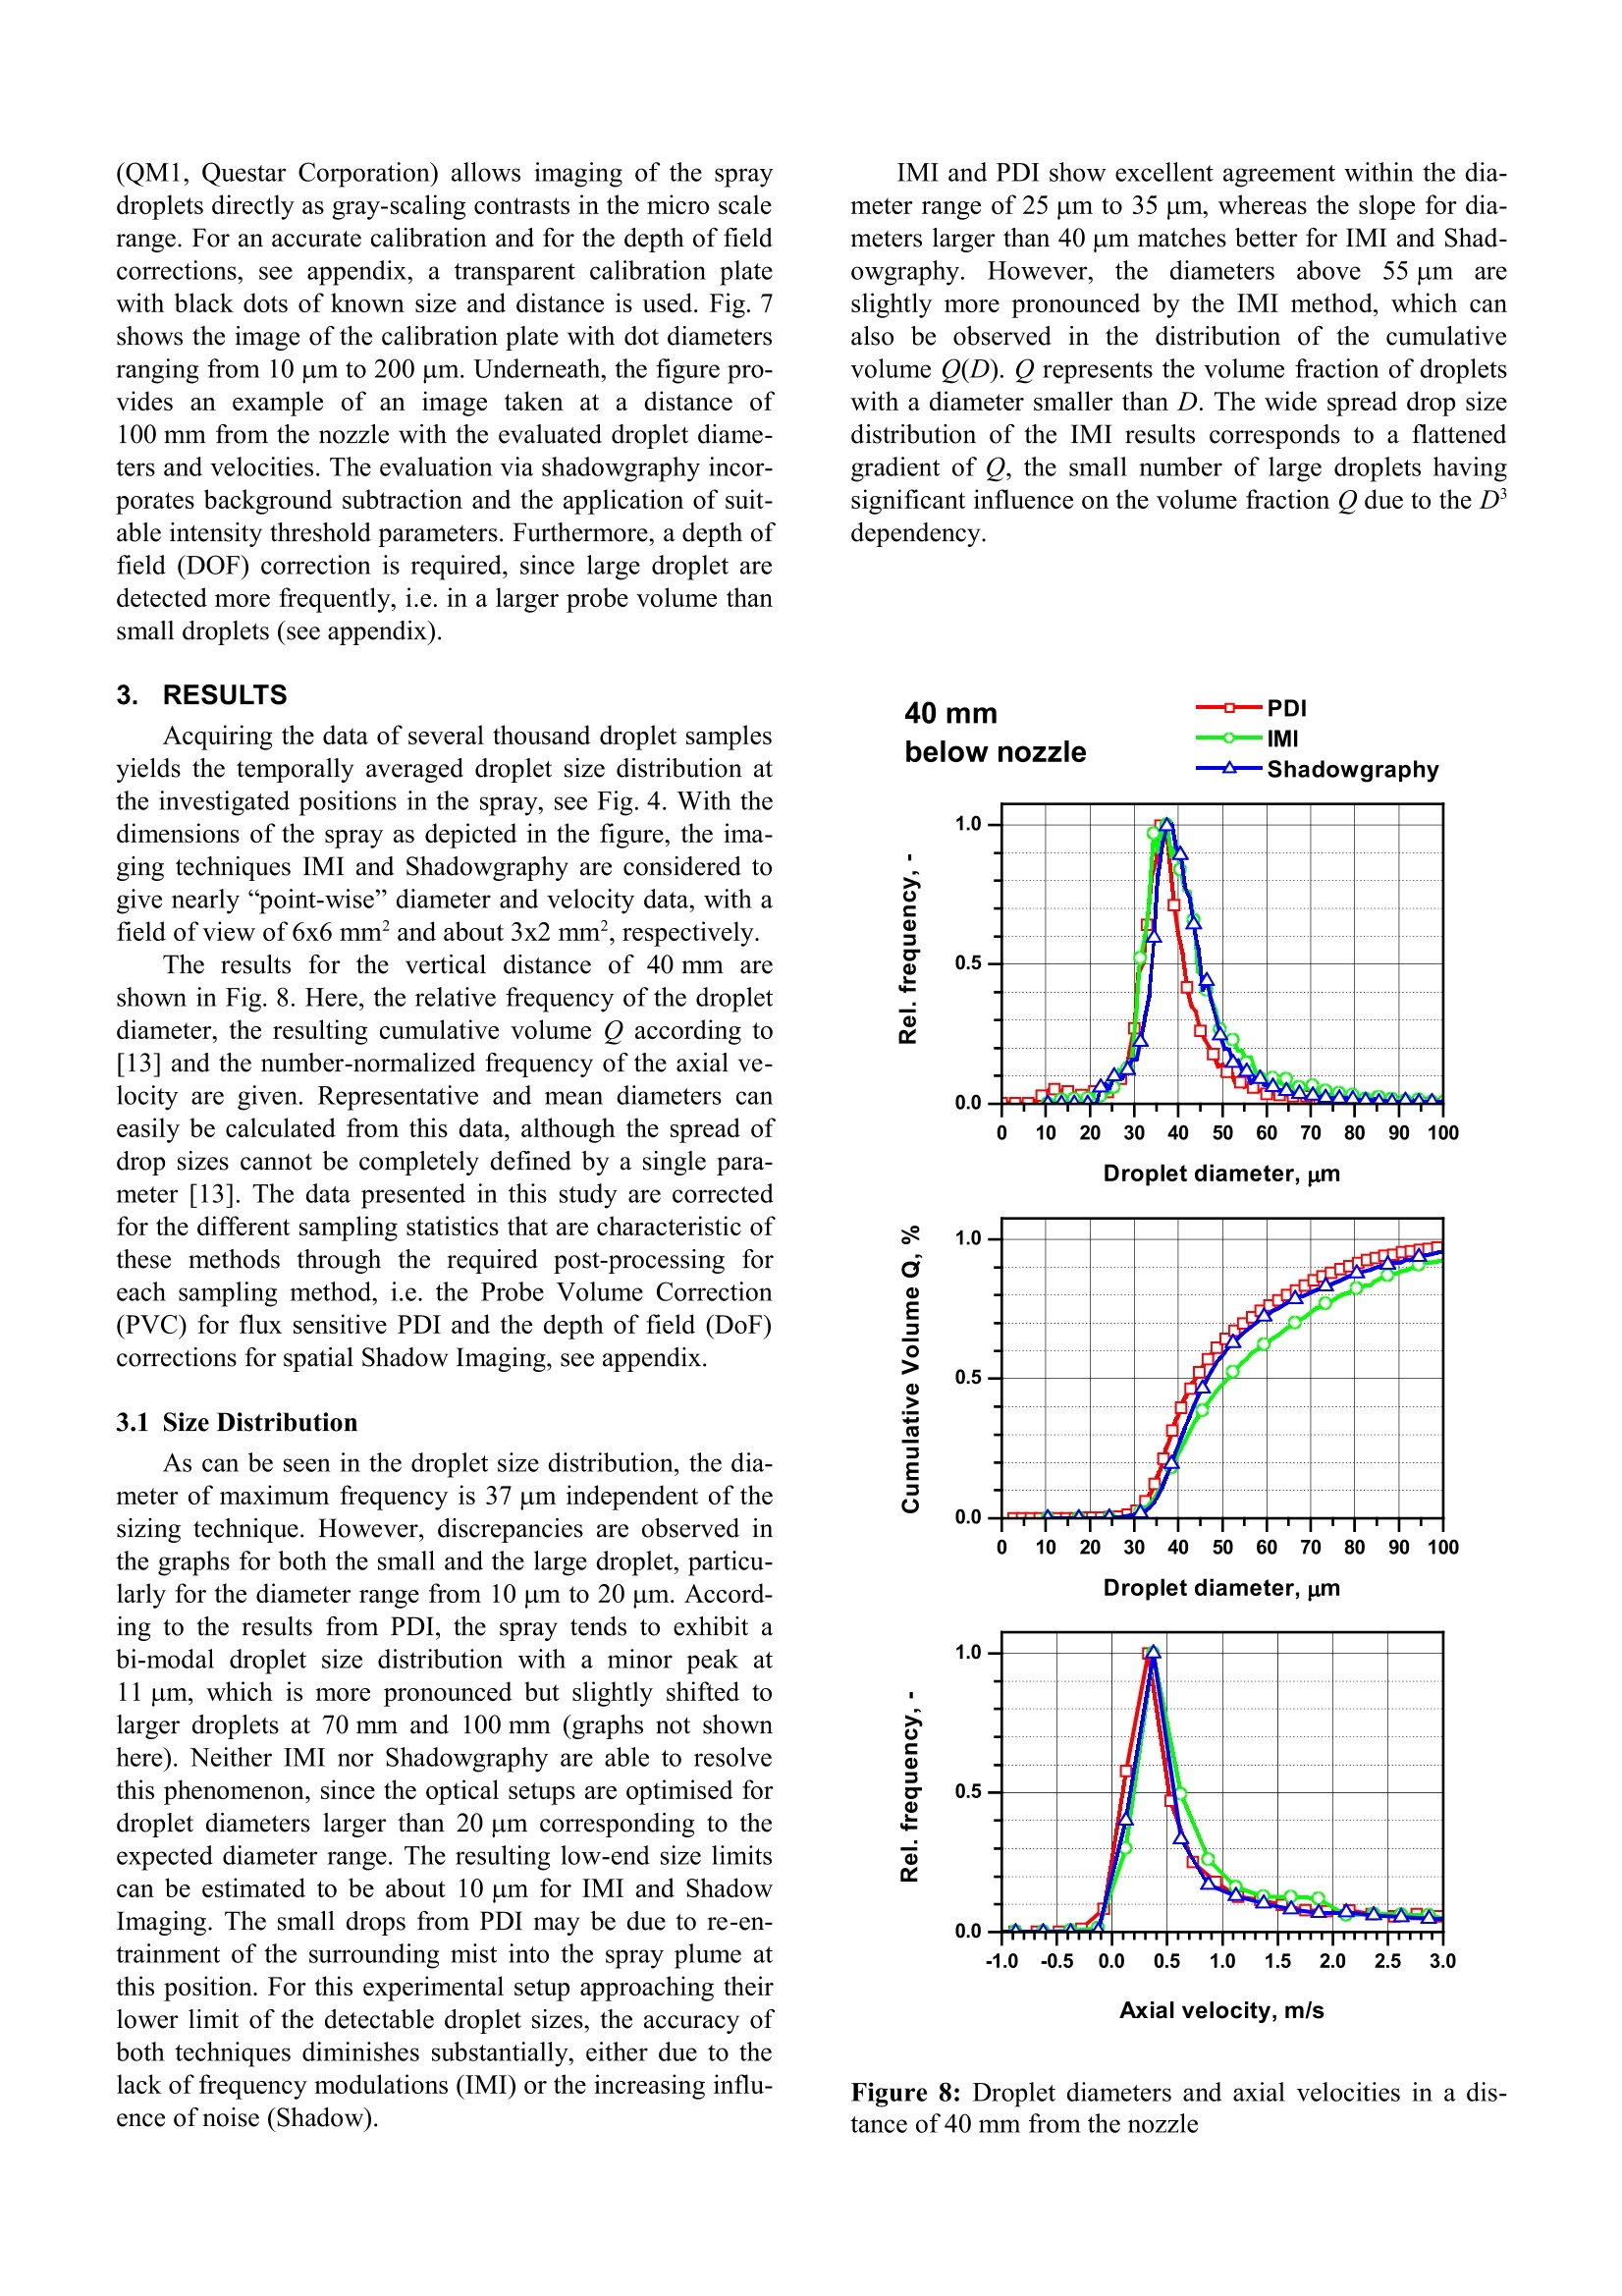
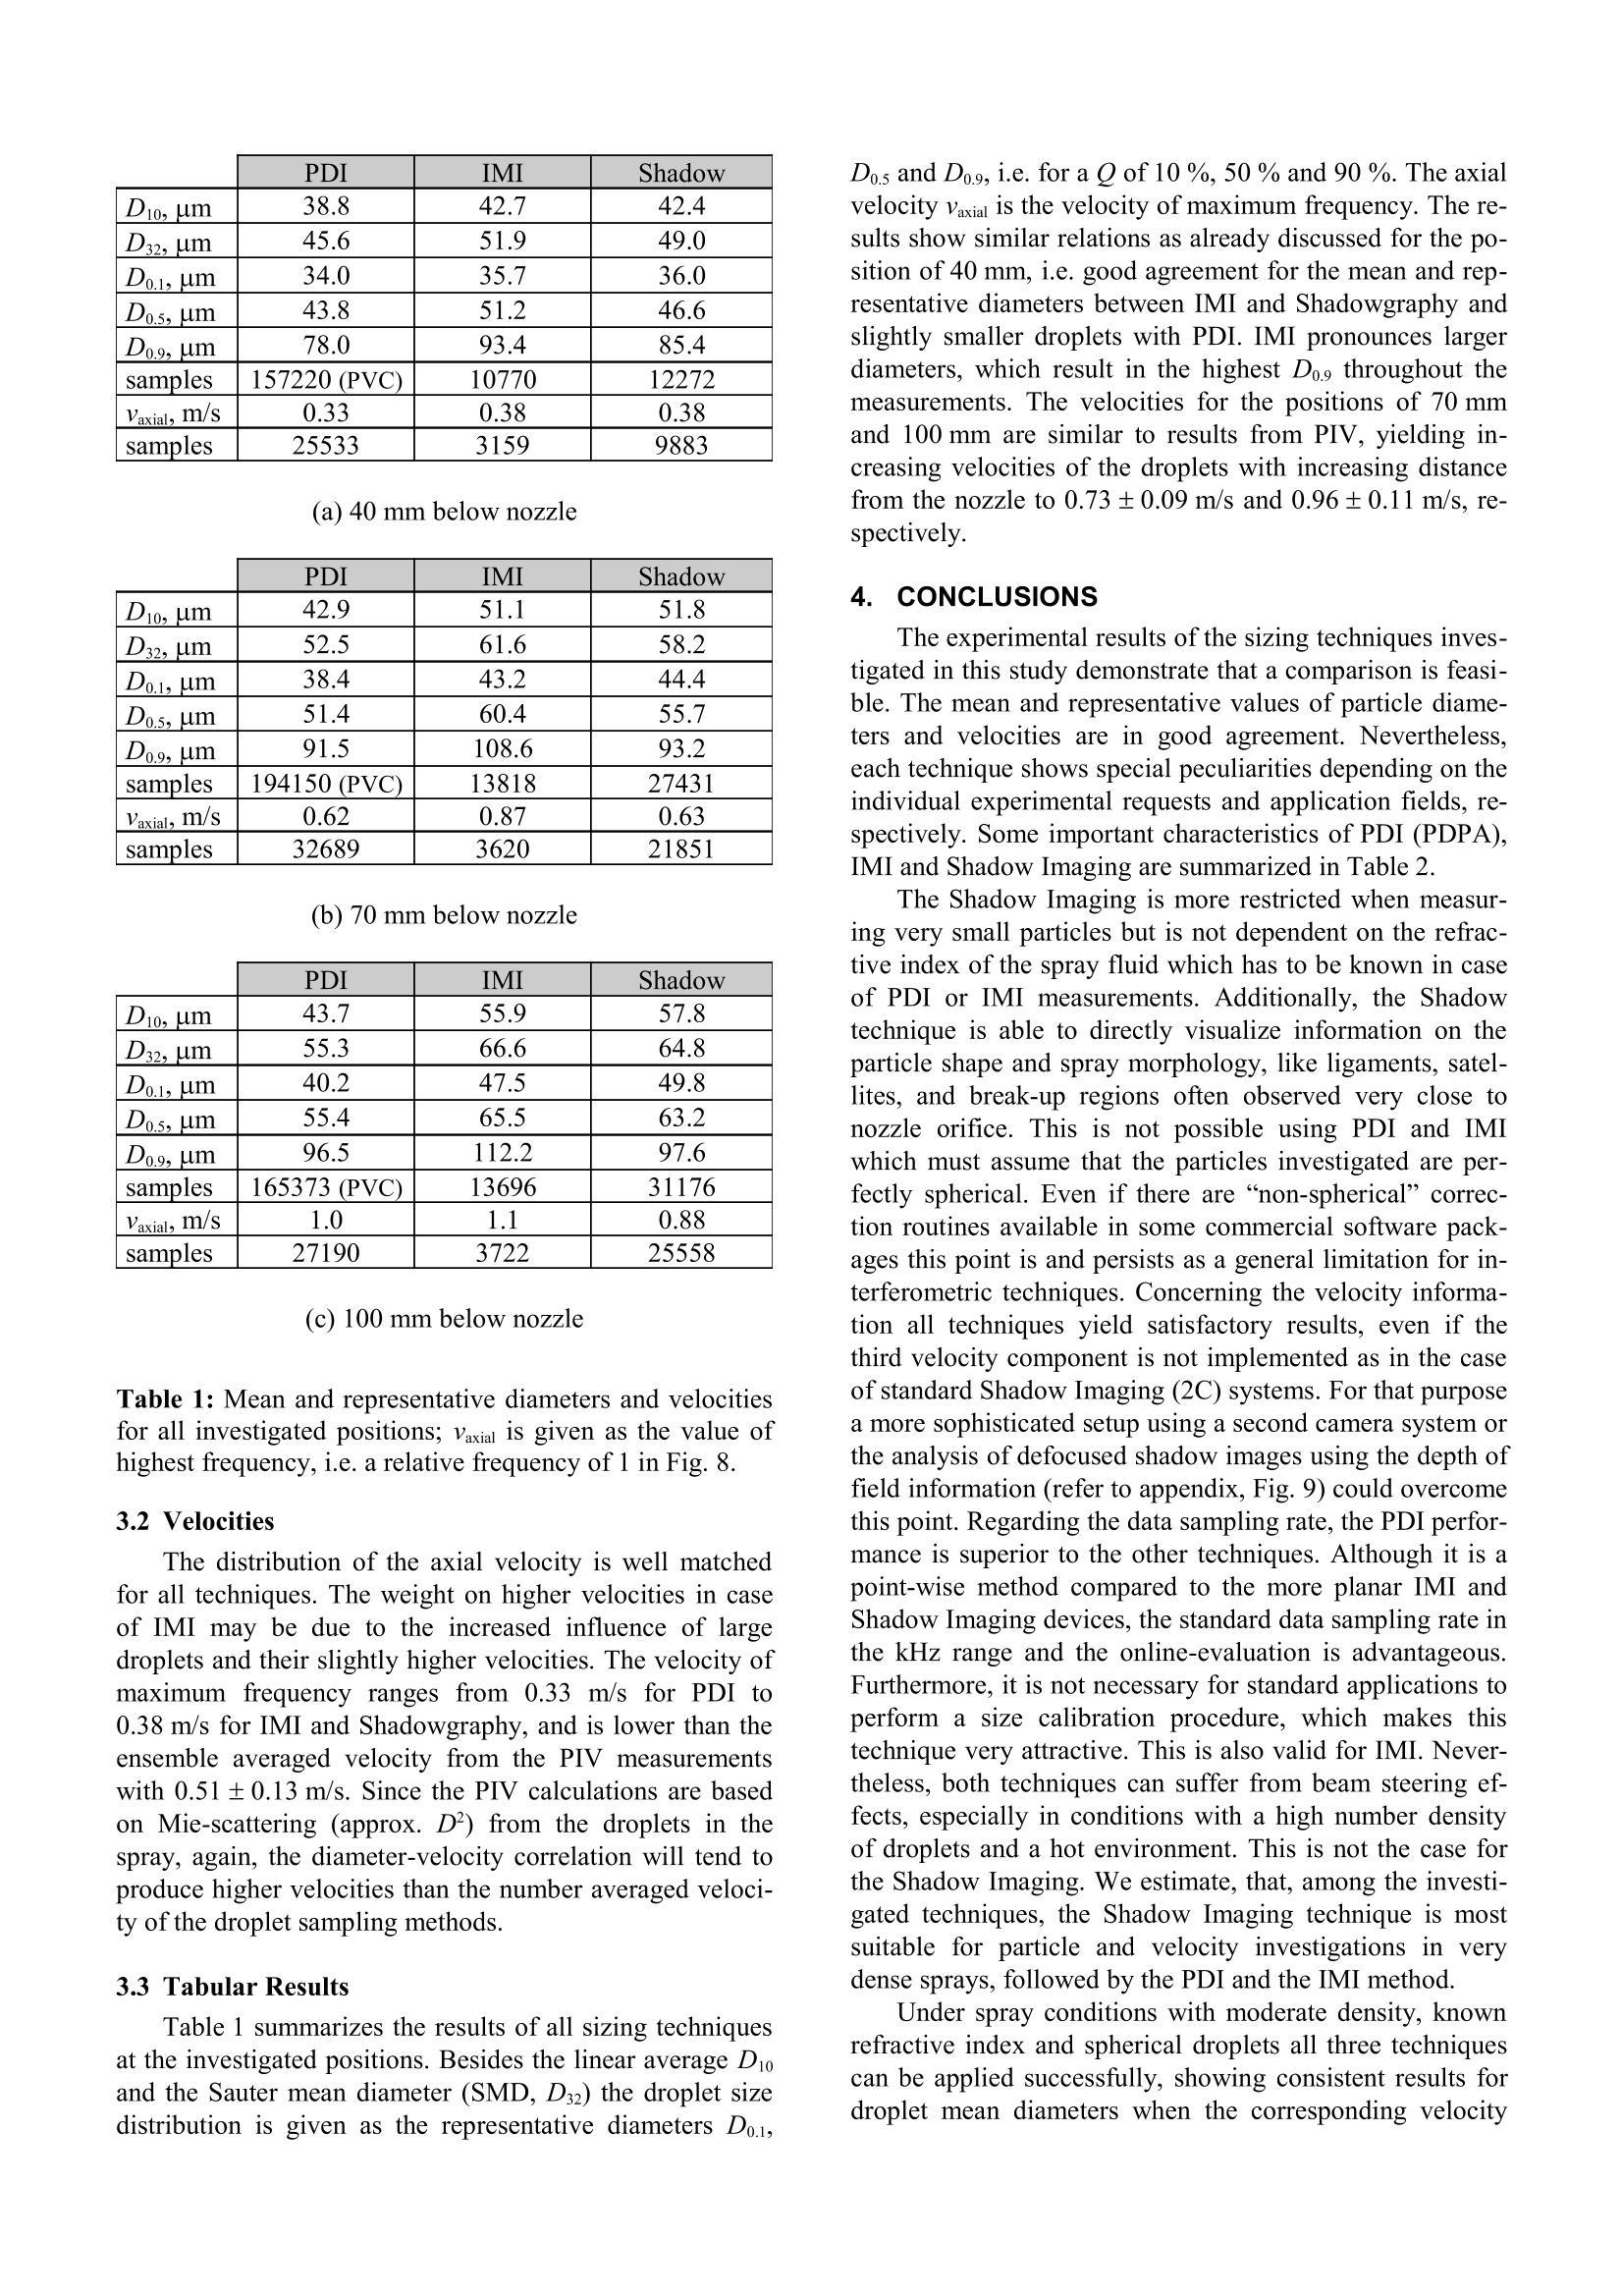
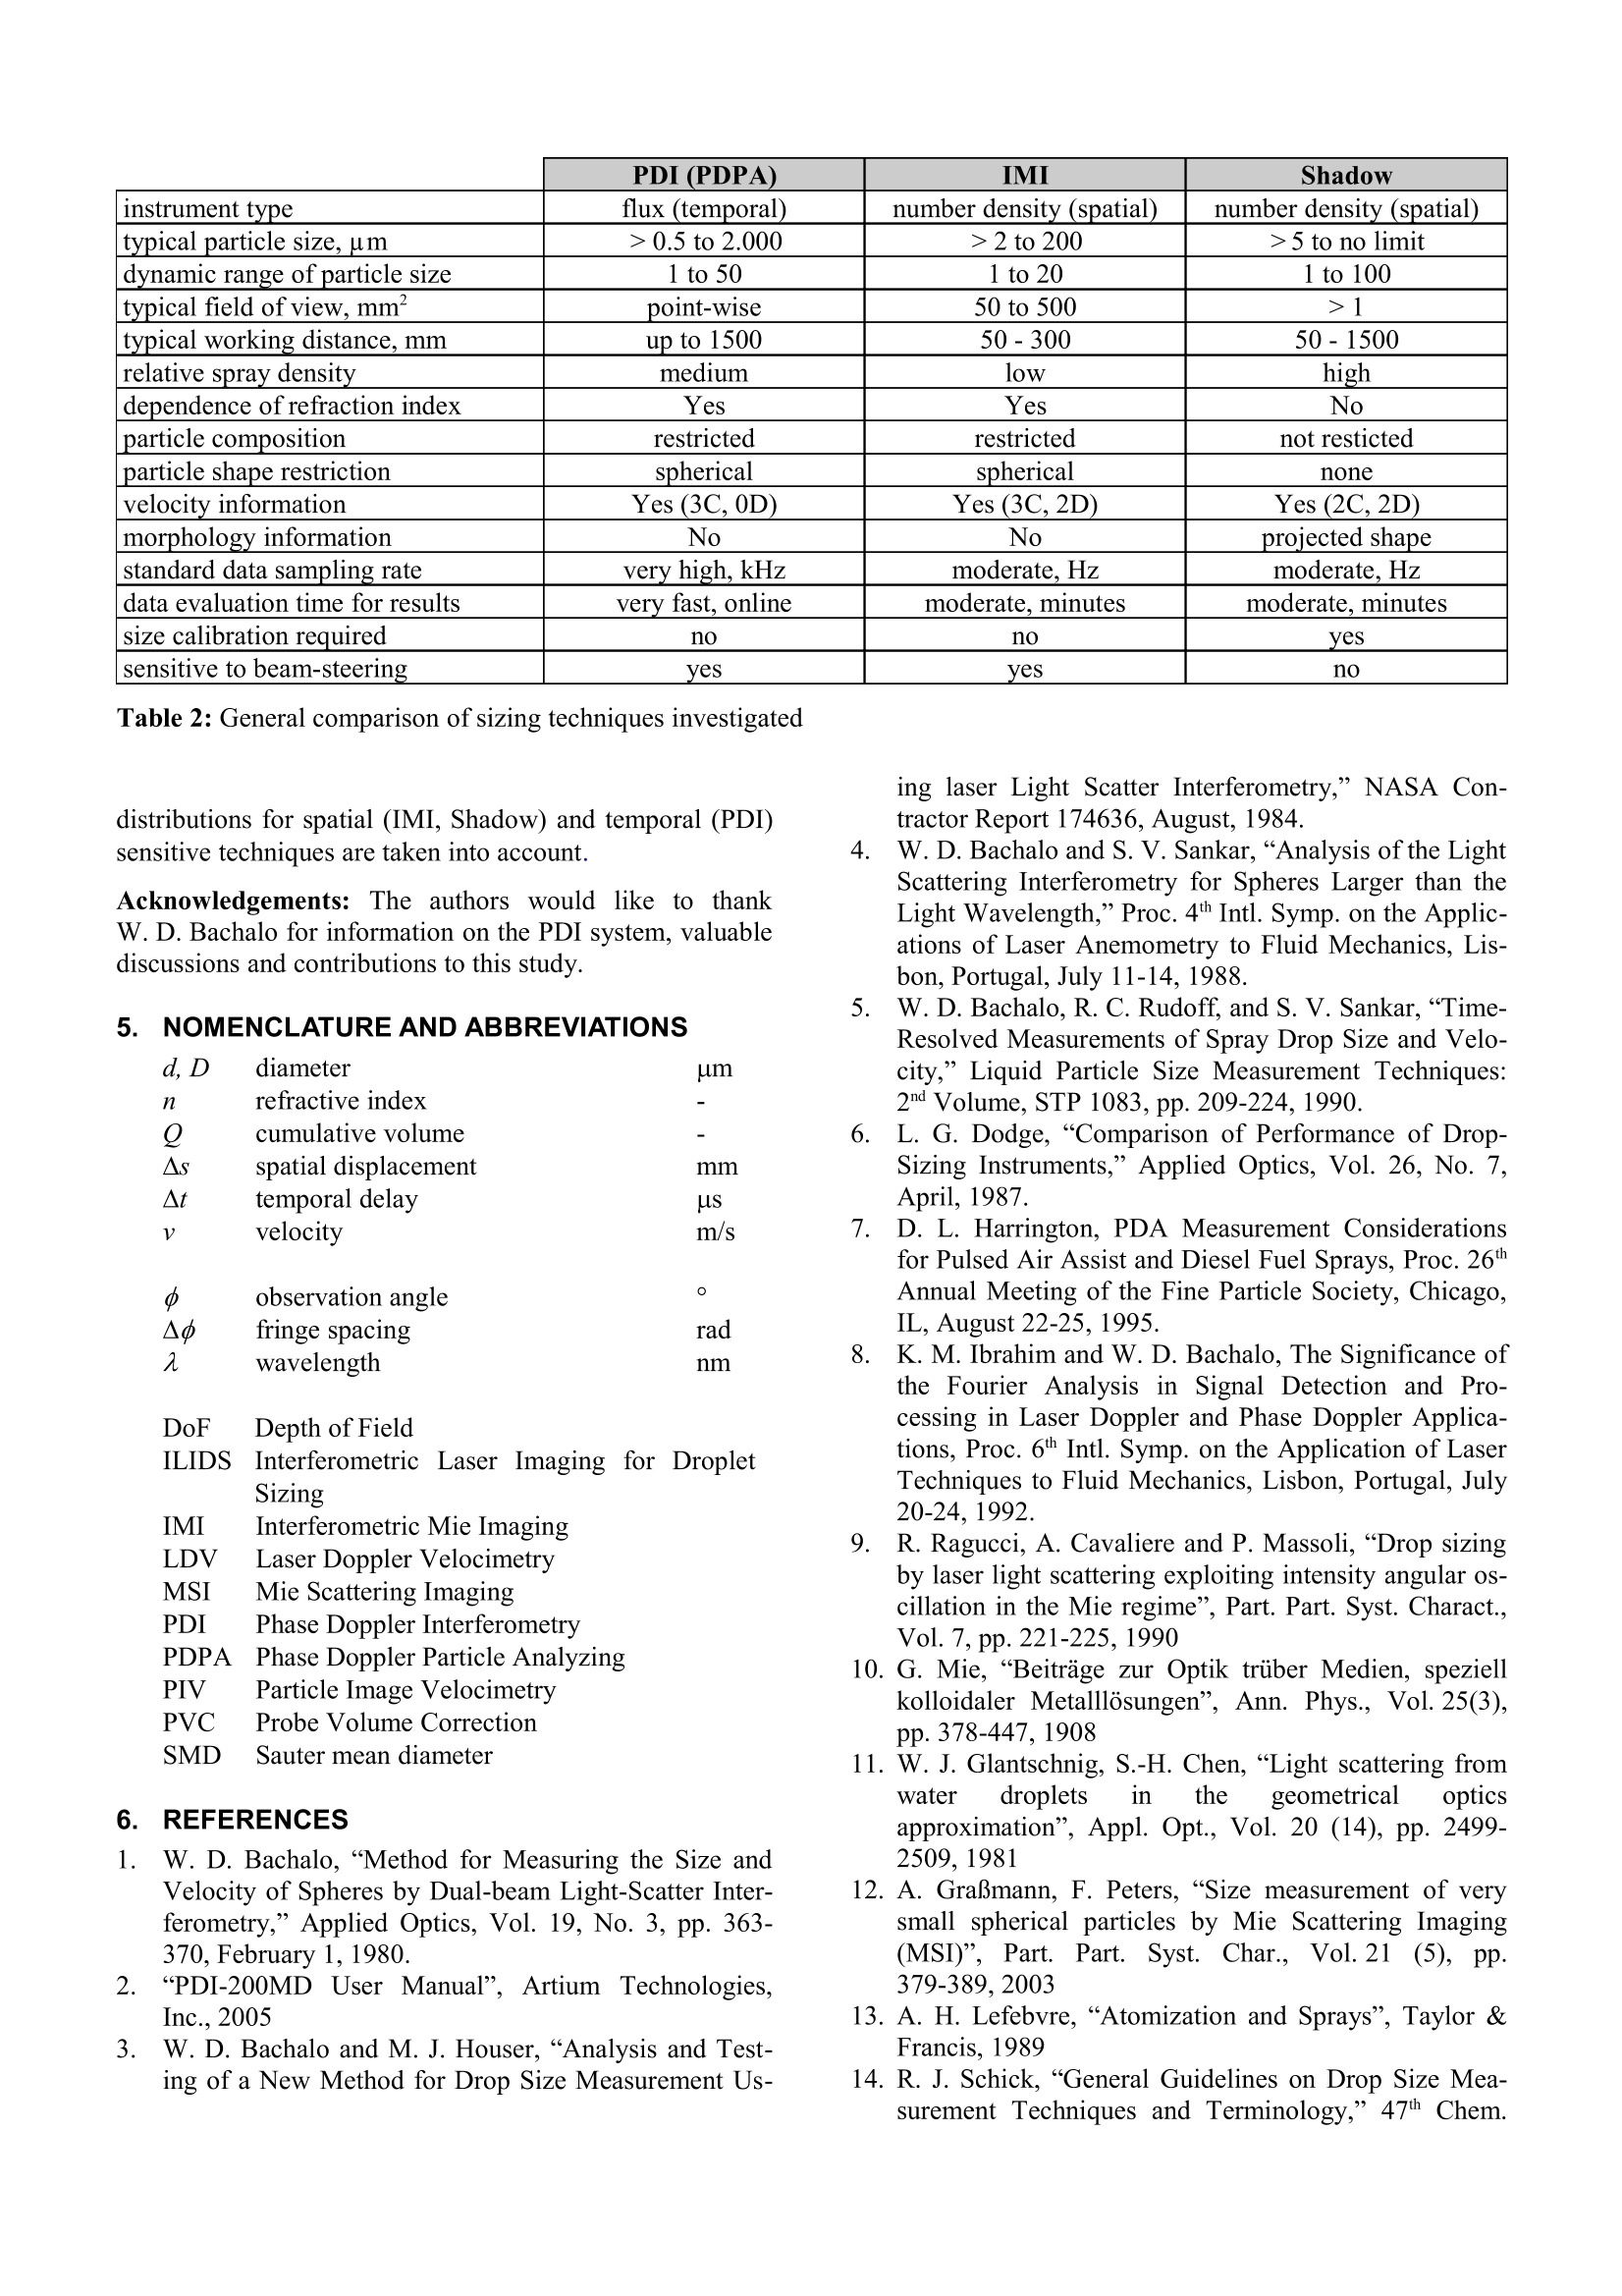
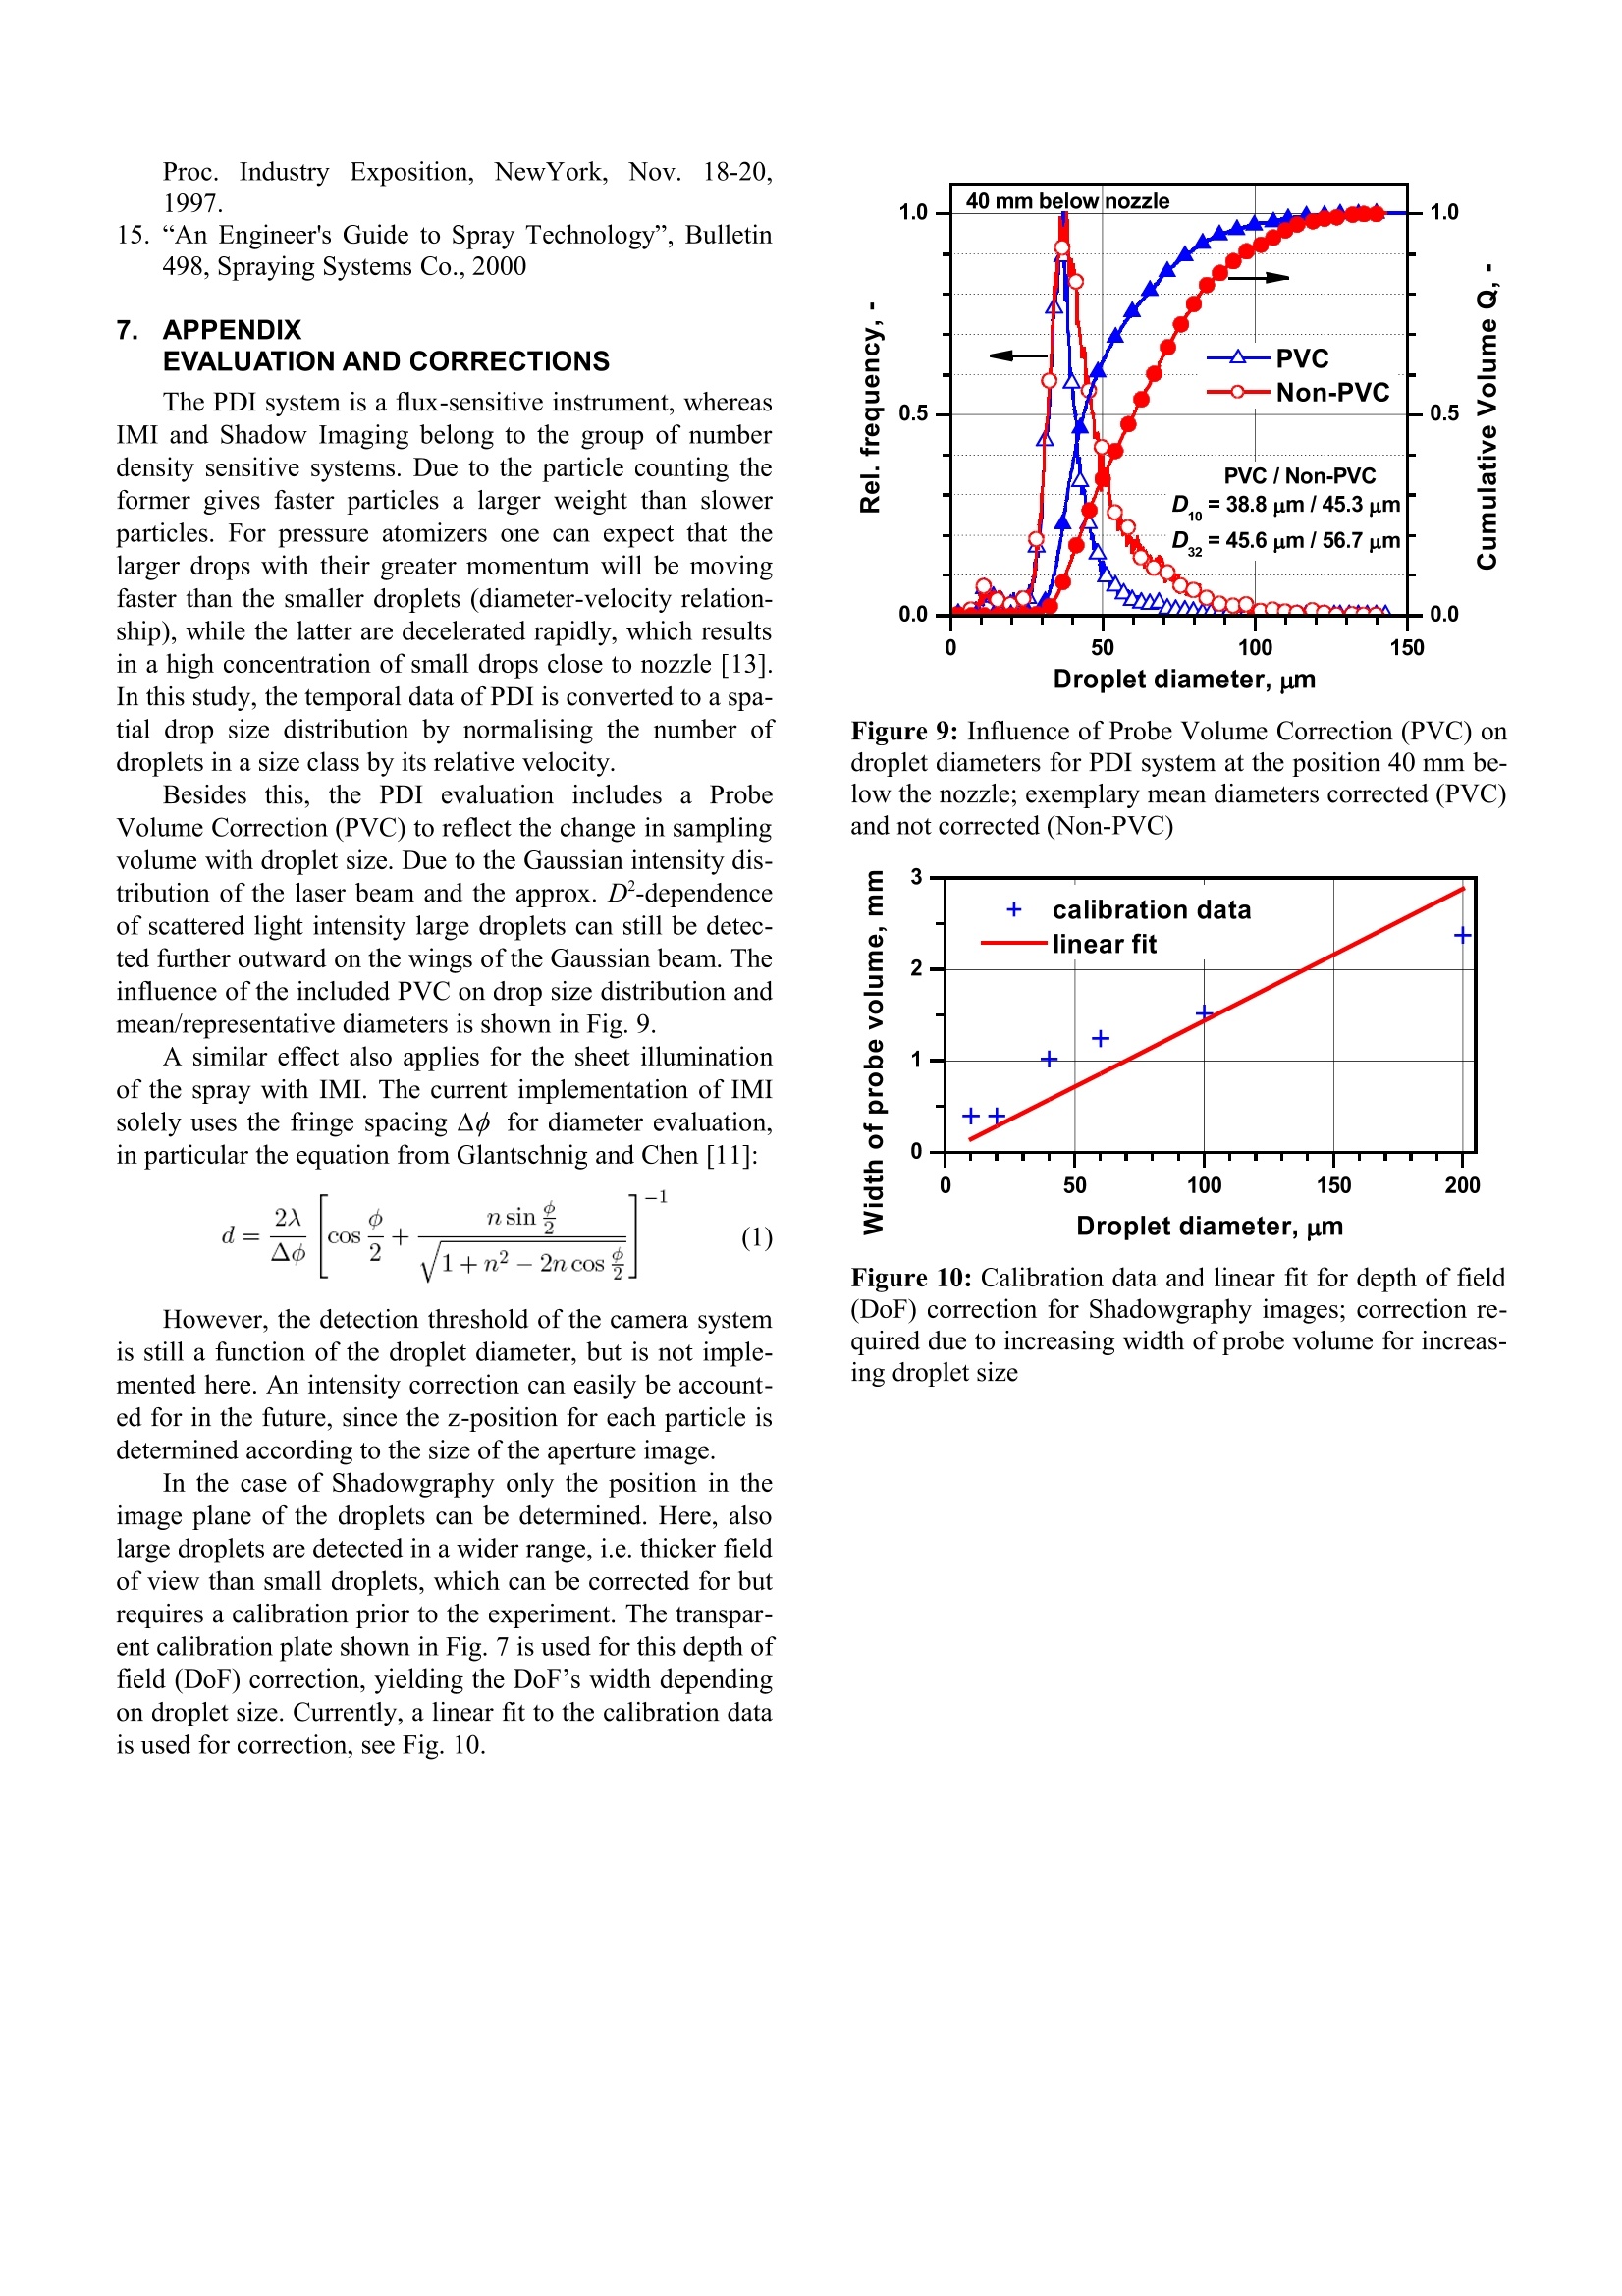
ICLASS-2006AUG.27-SEPT.1,2006,KYOTO, JAPAN PAPER ID ICLASS06-151 COMPARISON OF PARTICLE SIZE AND VELOCITY INVESTIGATIONS IN SPRAYSCARRIED OUT BY MEANS OF DIFFERENT MEASUREMENT TECHNIQUES T. Berg, J. Deppe, D. Michaelis1, H. Voges and S. Wissel? LaVision GmbH, Goettingen, info@lavision.de 'LTFD, Aachen University of Technology,wissel@ltfd.rwth-aachen.de ABSTRACT: Measurement techniques for simultaneousdroplet sizing and velocimetry are compared in respect oftheir applicability and inherent limitations. A detailed dis-cussion of the results requires specific corrections of thedata to compensate for the inherent effects of the differentsampling methods, i.e. flux-sensitive and concentration de-pendent. Among others, these incorporate a correction ofthe diameter-velocity relationship for the flux-dependentPhase Doppler Interferometry (PDI) and a depth of fieldcorrection for Shadow Imaging. It is demonstrated, that flux-dependent methods like PDIand the concentration imaging techniques InterferometricMie Imaging (IMI) and Shadowgraphy yield consistent re-sults at various positions in a dilute spray. While PDI isable to resolve a bi-modal droplet size distribution, IMItends to pronounce larger droplets. With respect to the ap-plication in the dense sprays for automotive applicationsand high-pressure and elevated temperature conditions,Shadowgraphy is considered to be least sensitivetobeam-steering and multiple light scattering. Keywords: particle sizing, droplet velocity, sprays, IMI,PDI, PDPA, Shadow Imaging, flux, number density 1.IINTRODUCTION Most publications describing droplet sizing and velo-city measurements are based on PDI. Applying thiswell-known aand establishedinterferometric technique,single particle diameter and velocity information can be ob-tained locally with high spatial and temporal resolution athigh data rates. Additionally, an imaging technique herecalled Interferometric Mie Imaging (IMI), also known asInterferometric Laser Imaging for Droplet Sizing (ILIDS)or Mie Scattering Imaging (MSI), utilizes light scatteringand interference for a 2D spray characterization. Next tothese, Shadow Imaging of particles using high-magnifica-tion optics can be applied, using gray-scaling informationfor particle recognition and separation. The goal of thiswork is to compare the mentioned sizing and velocimetrytechniques. There is currently a lack of information andpublications in the literature describing such comparativeevaluations. Droplet sizing techniques can be classified as flux-de-pendent and concentration-dependent, or as temporal andspatial sampling methods, respectively. The Phase Doppler technique belongs to the former group, referred to as singleparticle counters. The particles passing a defined area form-ing the probe volume are analyzed and attributed to the cor-responding particle diameters and velocity classes over themeasuring time. The IMI and Shadow Imaging systems arespatial techniques. An ensemble of droplet/particles in theimaged volume are detected instantaneously. With a dou-ble-pulsed recording similar to Particle Imaging Velocime-try(PIV), these techniques enable to extract the velocity in-formation for each individual droplet. In order to compareflux-sensitive and number density sensitive techniques onemust take into account that for the flux-based PDI systemdroplets of higher velocity are passing the probe volumemore frequently than slow droplets. Thus, spatial measuringsystems show the tendency to report smaller averaged parti-cle diameters than flux-based techniques [14, 15]. As willbe discussed below for Shadow Imaging, the detectionrange and probe volume, respectively, are proportional tothe droplet size and must be calibrated and corrected for. PDI: Bachalo [1] theoretically described the light scatteringfrom spherical particles and showed that the phase shift ofthe light scattered from two intersecting beams can be usedto accurately measure the diameter of spherical particles.Following the initial development of the phase Doppler in-terferometry method, significant research and developmenthas been devoted to the improvement of this instrument andnumerous publications have been written on this subject[3-8]. Figure 1: Typical PDI setup (Artium Technologies, Inc.[21) The Phase Doppler Interferometer (PDI) instrument,also known as Phase Doppler Particle Analyzer (PDPA),has advanced as a standard laser-based diagnostic instru-ment for simultaneously measuring the size and velocity ofindividual spherical particles in polydisperse particle flowenvironments. Light scattering interferometry utilizes thewavelength of light as the measurement scale and, as such,the performance is not as easily degraded as it is for sys-tems using light scattering intensity information for the esti-mation of the particle size. In addition, the method does notrequire frequent calibration. Unique sinusoidal signals areproduced which can be detected even under noisy condi-tions using the Fourier analysis or other digital signal burstdetection means. For a more detailed introduction of thePDI measurement technique we refer at this point to the lit-erature. IMI: The Interferometric Mie Imaging (IMI) method is anout-of-focus imaging technique of particles illuminated by alaser light sheet and is based on the work of Ragucci [9]and others, see Fig. 2. Observing the scattered light of thedroplets with high magnification only two glare points in-stead of the real shape of the droplet can be detected. Thesecan be seen as point-wise light sources with a phase-shiftdepending on the droplet size and the detection angle.When moving the CCD plane to an out-of-focus position,the image of the glare points is increasing and finally over-lapping, creating an interference pattern, the so called“fringes"on the CCD chip, as illustrated in Fig. 3. The visi-ble fringe pattern corresponds exactly to the far field scat-tering which can be calculated by the Mie theory [10]. With an increasing size of particles, the number offringes increases when the aperture angle is fixed by the ex-perimental setup. The size of the aperture image is a mea-sure for the z-position of the particles, while the size of theparticles is determined by analysis of the fringe pattern. Formore detailed information on the IMI technique and theo-retical background, we refer the reader to [11, 12]. High-magnification Shadow Imaging: For Shadow Imaging a high magnification image isrecorded with pulsed backlight illumination. The measure-ment volume is defined by the focal plane and the depth offield of the imaging system. This technique is independentof the shape and material (either transparent or opaque) ofthe particles and allows for the investigation of sizes downto the micro scale. The light source can be a pulsed laser Figure 2: IMI principle and experimental setup of laser ex-citation and detection optics Figure 3: IMI image with fringe pattern for data evaluation with illumination optics or a flash-lamp, depending on thevelocity of the particles. With a double-pulsed laser com-bined with a double frame camera this technique providesinformation on particle size distribution, shape and velocity. 2. EEXPERIMENTAL The experimental setup consists of an oil-burner nozzle(type 2.00-45-B-SOLID, Hago) operated with water understeady-state conditions at 6 bar (87 psi) pressure. All threemeasurement techniques (PDI, IMI and Shadow Imaging)are applied to analyze droplet diameters and velocities atthree positions in the spray. Fig. 4 shows the investigated plane of vector field positions of measurement Figure 4: Positions of measurement and flow field fromPIV investigation in a plane 25 mm from plane of symme-try of the spray (underlying Mie-image); vertical distancesof the probe volumes from the nozzle tip are 40 mm,70 mm and 100 mm areas of interest in the spray, i.e. at vertical distances of40 mm, 70mm and 100 mm from the nozzle, shifted25 mm horizontally from the nozzle plane. Furthermore, thefigure shows the global spray cone geometry from Mie-scattering on the axis of symmetry, whereas the flow fieldis taken via Particle Image Velocimetry (PIV) of thedroplets in the plane of measurement for droplet sizing. PDI: A schematic of the optical and electronic componentsfor a basic PDI system have been presented in Fig. 1. Theoptical requirements are identical to that of a one-compo-nent Laser Doppler velocimeter (LDV), except that threedetectors are used in the receiver, while the receiver mustbe located at a known off-axis angle to the transmittedbeams. The light collection position for the receiver is set toan off-axis angle of 40° to the transmitted beam directionmeasured from a plane passing through the two intersectingbeams. In the present study a commercial two-componentPhase Doppler Interferometry system (PDI-200 MD, Ar-tium Technologies, Inc.) is used. IMI: For the IMI system a double cavity frequency Nd:YAGlaser (Solo 120, NewWave), which provides two pulses of532 nm radiation each adjusted to a pulse energy of about50 mJ, serves as light source. The light from the laser isformed to a light sheet approx. 20 mm high and 0.5 mmthick, defining the measurement plane. The camera detec-tion system consists of a 10-bit dual-frame CCD camera(Imager Pro HS, LaVision GmbH) which is also used forPIV. A macro lens optics with 1:1 reproduction scale im-ages the Mie-scattering signals from the droplets interactingwith the laser light sheet. Due to the known magnificationno spatial calibration is required. An image example and the results of data evaluationare given in Fig. 5. Using a rectangular aperture results inrectangular shaped aperture images containing the charac- Figure 5:IMI example of an image with processed apertureimages of detected particles. The characteristic fringe pat-terns, the size and position of the aperture images are usedfor velocity calculation teristic fringe patterns. Correlating the spatial informationof the particles in two consecutive images (At = 50 us)yields the 3C/2D velocity information. Shadowgraphy: In the case of the Shadow Imaging setup the sameNd:YAG double pulse laser as described for the IMI tech-nique is used. However, a diffusor optics with a wavelengthshifting fluorescing plate is mounted to the laser beam out-let, which yields a homogenous speckle-free backlight illu-mination. The experimental setup is given in Fig. 6. Thefluorescence duration of the illumination unit is approxi-mately 20 ns, thus short enough to freeze the motion of allimaged spray droplets. The camera detection system con-sists of the same CCD camera as in the IMI setup. Howev-er, for the Shadow Imaging a long distance microscope Figure 6: Experimental setup for Shadowgraphy Figure 7: Transparent calibration plate for depth of fieldcorrection and example of result for droplet sizing viaShadowgraphy (QM1, Questar Corporation) allows imaging of the spraydroplets directly as gray-scaling contrasts in the micro scalerange. For an accurate calibration and for the depth of fieldcorrections, see appendix, a transparent calibration platewith black dots of known size and distance is used. Fig. 7shows the image of the calibration plate with dot diametersranging from 10 um to 200 pm. Underneath, the figure pro-vides an example of an image taken at a distance of100 mm from the nozzle with the evaluated droplet diame-ters and velocities. The evaluation via shadowgraphy incor-porates background subtraction and the application of suit-able intensity threshold parameters. Furthermore, a depth offield (DOF) correction is required, since large droplet aredetected more frequently, i.e. in a larger probe volume thansmall droplets (see appendix). 3..RESULTS Acquiring the data of several thousand droplet samplesyields the temporally averaged droplet size distribution atthe investigated positions in the spray, see Fig. 4. With thedimensions of the spray as depicted in the figure, the ima-ging techniques IMI and Shadowgraphy are considered togive nearly “point-wise”diameter and velocity data, with afield of view of 6x6 mm’and about 3x2 mm, respectively. The results for the vertical distance of 40 mm areshown in Fig. 8. Here, the relative frequency of the dropletdiameter, the resulting cumulative volume Q according to[13] and the number-normalized frequency of the axial ve-locity are given. Representative and mean diameters caneasily be calculated from this data, although the spread ofdrop sizes cannot be completely defined by a single para-meter [13]. The data presented in this study are correctedfor the different sampling statistics that are characteristic ofthese methods through the required post-processing foreach sampling method, i.e. the Probe Volume Correction(PVC) for flux sensitive PDI and the depth of field (DoF)corrections for spatial Shadow Imaging, see appendix. 3.1 Size Distribution As can be seen in the droplet size distribution, the dia-meter of maximum frequency is 37 um independent of thesizing technique. However, discrepancies are observed inthe graphs for both the small and the large droplet, particu-larly for the diameter range from 10 pm to 20 um. Accord-ing to the results from PDI, the spray tends to exhibit abi-modal droplet size distribution with a minor peak at11 um, which is more pronounced but slightly shifted tolarger droplets at 70 mm and 100 mm (graphs not shownhere). Neither IMI nor Shadowgraphy are able to resolvethis phenomenon, since the optical setups are optimised fordroplet diameters larger than 20 um corresponding to theexpected diameter range. The resulting low-end size limitscan be estimated to be about 10 um for IMI and ShadowImaging. The small drops from PDI may be due to re-en-trainment of the surrounding mist into the spray plume atthis position. For this experimental setup approaching theirlower limit of the detectable droplet sizes, the accuracy ofboth techniques diminishes substantially, either due to thelack of frequency modulations (IMI) or the increasing influ-ence of noise (Shadow). IMI and PDI show excellent agreement within the dia-meter range of 25 um to 35 um, whereas the slope for dia-meters larger than 40 um matches better for IMI and Shad-owgraphy. However, the diameters above 55 um areslightly more pronounced by the IMI method, which canalso be observed in the distribution of the cumulativevolume Q(D). O represents the volume fraction of dropletswith a diameter smaller than D. The wide spread drop sizedistribution of the IMI results corresponds to a flattenedgradient of Q, the small number of large droplets havingsignificant influence on the volume fraction O due to the D’dependency. 40 mm -PDI Axial velocity, m/s Figure 8: Droplet diameters and axial velocities in a dis-tance of 40 mm from the nozzle PDI IMI Shadow D10, um 38.8 42.7 42.4 D32, um 45.6 51.9 49.0 Do.1, um 34.0 35.7 36.0 Do.5, um 43.8 51.2 46.6 Do.9, um 78.0 93.4 85.4 samples 157220 (PVC) 10770 12272 Vaxial, m/s 0.33 0.38 0.38 samples 25533 3159 9883 (a) 40 mm below nozzle PDI IMI Shadow Dio, um 42.9 51.1 51.8 D32, um 52.5 61.6 58.2 Do.1, um 38.4 43.2 44.4 Do.5, um 51.4 60.4 55.7 D0.9, um 91.5 108.6 93.2 samples 194150 (PVC) 13818 27431 Vaxial, m/s 0.62 0.87 0.63 samples 32689 3620 21851 (b) 70 mm below nozzle PDI IMI Shadow Di0, um 43.7 55.9 57.8 D32, um 55.3 66.6 64.8 Do.i, um 40.2 47.5 49.8 Do.5, um 55.4 65.5 63.2 Do.9, um 96.5 112.2 97.6 samples 165373 (PVC) 13696 31176 Vaxial, m/s 1.0 1.1 0.88 samples 27190 3722 25558 (c) 100 mm below nozzle Table 1: Mean and representative diameters and velocitiesfor all investigated positions; Vaxial is given as the value ofhighest frequency, i.e. a relative frequency of 1 in Fig. 8. 3.2 Velocities The distribution of the axial velocity is well matchedfor all techniques. The weight on higher velocities in caseof IMI may be due to the increased influence of largedroplets and their slightly higher velocities. The velocity ofmaximum frequency ranges from 0.33 m/s for PDI to0.38 m/s for IMI and Shadowgraphy, and is lower than theensemble averaged velocity from the PIV measurementswith 0.51±0.13 m/s. Since the PIV calculations are basedon Mie-scattering (approx. D’) from the droplets in thespray, again, the diameter-velocity correlation will tend toproduce higher velocities than the number averaged veloci-ty of the droplet sampling methods. 3.3 Tabular Results Table 1 summarizes the results of all sizing techniquesat the investigated positions. Besides the linear average Dioand the Sauter mean diameter (SMD, D32) the droplet sizedistribution is given as the representative diameters Do., Do.5 and D0.9, i.e. for a Q of 10 %, 50 % and 90 %. The axialvelocity Vaxia is the velocity of maximum frequency. The re-sults show similar relations as already discussed for the po-sition of 40 mm, i.e. good agreement for the mean and rep-resentative diameters between IMI and Shadowgraphy andslightly smaller droplets with PDI. IMI pronounces largerdiameters, which result in the highest Do9 throughout themeasurements. The velocities for the positions of 70 mmand 100 mm are similar to results from PIV, yielding in-creasing velocities of the droplets with increasing distancefrom the nozzle to 0.73±0.09 m/s and 0.96 ±0.11 m/s, re-spectively. 4. (CONCLUSIONS The experimental results of the sizing techniques inves-tigated in this study demonstrate that a comparison is feasi-ble. The mean and representative values of particle diame-ters and velocities are in good agreement. Nevertheless,each technique shows special peculiarities depending on theindividual experimental requests and application fields, re-spectively. Some important characteristics of PDI (PDPA),IMI and Shadow Imaging are summarized in Table 2. The Shadow Imaging is more restricted when measur-ing very small particles but is not dependent on the refrac-tive index of the spray fluid which has to be known in caseof PDI or IMI measurements. Additionally, the Shadowtechnique is able to directly visualize information on theparticle shape and spray morphology, like ligaments, satel-lites, and break-up regions often observed very close tonozzle orifice. This is not possible using PDI and IMIwhich must assume that the particles investigated are per-fectly spherical. Even if there are“non-spherical”correc-tion routines available in some commercial software pack-ages this point is and persists as a general limitation for in-terferometric techniques. Concerning the velocity informa-tion all techniques yield satisfactory results, even if thethird velocity component is not implemented as in the caseofstandard Shadow Imaging (2C)systems. For that purposea more sophisticated setup using a second camera system orthe analysis of defocused shadow images using the depth offield information (refer to appendix, Fig. 9) could overcomethis point. Regarding the data sampling rate, the PDI perfor-mance is superior to the other techniques. Although it is apoint-wise method compared to the more planar IMI andShadow Imaging devices, the standard data sampling rate inthe kHz range and the online-evaluation is advantageous.Furthermore, it is not necessary for standard applications toperform a size calibration procedure, which makes thistechnique very attractive. This is also valid for IMI. Never-theless, both techniques can suffer from beam steering ef-fects, especially in conditions with a high number densityof droplets and a hot environment. This is not the case forthe Shadow Imaging. We estimate, that, among the investi-gated techniques, the Shadow Imaging technique is mostsuitable for particle and velocity investigations in verydense sprays, followed by the PDI and the IMI method. Under spray conditions with moderate density, knownrefractive index and spherical droplets all three techniquescan be applied successfully, showing consistent results fordroplet mean diameters when the corresponding velocity PDI(PDPA) IMI Shadow instrument type flux (temporal) number density (spatial) number density (spatial) typical particle size, um >0.5 to 2.000 > 2 to 200 > 5 to no limit dynamic range ofparticle size 1 to 50 1 to 20 1 to 100 typical field of view, mm point-wise 50 to 500 > 1 typical working distance, mm up to 1500 50-300 50-1500 relative spray density medium Iow high dependence of refraction index Yes Yes No particle composition restricted restricted not resticted particle shape restriction spherical spherical none velocity information Yes (3C,0D) Yes (3C, 2D) Yes (2C,2D) morphology information No No projected shape standard data sampling rate very high,kHz moderate, Hz moderate, Hz data evaluation time for results very fast, online moderate, minutes moderate. minutes size calibration required no no yes sensitive to beam-steering yes yes no Table 2: General comparison of sizing techniques investigated distributions for spatial (IMI, Shadow) and temporal (PDI)sensitive techniques are taken into account. Acknowledgements: The authors would like to thankW. D. Bachalo for information on the PDI system, valuablediscussions and contributions to this study. 5. INOMENCLATURE AND ABBREVIATIONS d, D diameter um DoF Depth of Field ILIDSInterferometric Laser Imaging for DropletSizing IMI Interferometric Mie Imaging LDV Laser Doppler Velocimetry MSI Mie Scattering Imaging PDI Phase Doppler Interferometry PDPAPhase Doppler Particle Analyzing PIV Particle Image Velocimetry PVC Probe Volume Correction SMD Sauter mean diameter 6.REFERENCES 1.W. D. Bachalo,“Method for Measuring the Size andVelocity of Spheres by Dual-beam Light-Scatter Inter-ferometry,”Applied Optics, Vol. 19, No. 3, pp. 363-370, February 1,1980. 2. “PDI-200MD User Manual”, Artium Technologies,Inc., 2005 3. W. D. Bachalo and M. J. Houser,“Analysis and Test-ing of a New Method for Drop Size Measurement Us- ing laser Light Scatter Interferometry,”NASA Con-tractor Report 174636, August, 1984. 4. W.D. Bachalo and S. V. Sankar,“Analysis of the LightScattering Interferometry for Spheres Larger than theLight Wavelength,”Proc. 4thIntl. Symp. on the Applic-ations of Laser Anemometry to Fluid Mechanics, Lis-bon, Portugal, July 11-14, 1988. 5. W. D. Bachalo, R. C. Rudoff, and S. V. Sankar,“Time-Resolved Measurements of Spray Drop Size and Velo-city," Liquid Particle Size Measurement Techniques:2ndVolume, STP 1083, pp. 209-224,1990. 6. L. G. Dodge,“Comparison of Performance of Drop-Sizing Instruments,” Applied Optics, Vol. 26, No. 7,April, 1987. 7. D. L. Harrington, PDA Measurement Considerationsfor Pulsed Air Assist and Diesel Fuel Sprays, Proc. 26"Annual Meeting of the Fine Particle Society, Chicago,IL, August 22-25, 1995. 8 K. M. Ibrahim and W. D. Bachalo, The Significance ofthe Fourier Analysis in Signal Detection and Pro-cessing in Laser Doppler and Phase Doppler Applica-tions, Proc. 6" Intl. Symp. on the Application of LaserTechniques to Fluid Mechanics, Lisbon, Portugal, July20-24, 1992. 9. R. Ragucci, A. Cavaliere and P. Massoli,“Drop sizingby laser light scattering exploiting intensity angular os-cillation in the Mie regime”, Part. Part. Syst. Charact.,Vol. 7, pp.221-225, 1990 10. G. Mie,“Beitrage zur Optik truber Medien, speziellkolloidaler Metalllosungen”,Ann. Phys., Vol.25(3),pp. 378-447, 1908 11. W. J. Glantschnig, S.-H. Chen,“Light scattering fromwater droplets in the geometrical opticsapproximation”, Appl. Opt., Vol. 20 (14), pp. 2499-2509, 1981 12. A. GraBmann, F. Peters,“Size measurement of verysmall spherical particles by Mie Scattering Imaging(MSI)”, Part. Part. Syst. Char., Vol.21 (:(5), pp.379-389, 2003 13. A. H. Lefebvre,“Atomization and Sprays”, Taylor &Francis, 1989 14. R. J. Schick, “General Guidelines on Drop Size Mea-surement Techniques and Terminology,”47h Chem. Proc.Industry Exposition, NewYork, Nov..18-20.1997. 15.“An Engineer’s Guide to Spray Technology”, Bulletin498, Spraying Systems Co.,2000 7.APPENDIXEVALUATION AND CORRECTIONS The PDI system is a flux-sensitive instrument, whereasIMI and Shadow Imaging belong to the group of numberdensity sensitive systems. Due to the particle counting theformer gives faster particles a larger weight than slowerparticles. For pressure atomizers one can expect that thelarger drops with their greater momentum will be movingfaster than the smaller droplets (diameter-velocity relation-ship), while the latter are decelerated rapidly, which resultsin a high concentration of small drops close to nozzle [13].In this study, the temporal data of PDI is converted to a spa-tial drop size distribution by normalising the number ofdroplets in a size class by its relative velocity. Besides this, the PDI evaluation includes a ProbeVolume Correction (PVC) to reflect the change in samplingvolume with droplet size. Due to the Gaussian intensity dis-tribution of the laser beam and the approx. D-dependenceof scattered light intensity large droplets can still be detec-ted further outward on the wings of the Gaussian beam. Theinfluence of the included PVC on drop size distribution andmean/representative diameters is shown in Fig. 9. A similar effect also applies for the sheet illuminationof the spray with IMI. The current implementation of IMIsolely uses the fringe spacing Ao for diameter evaluation,in particular the equation from Glantschnig and Chen [11]: However, the detection threshold of the camera systemis still a function of the droplet diameter, but is not imple-mented here. An intensity correction can easily be account-ed for in the future, since the z-position for each particle isdetermined according to the size of the aperture image. In the case of Shadowgraphy only the position in theimage plane of the droplets can be determined. Here, alsolarge droplets are detected in a wider range, i.e. thicker fieldof view than small droplets, which can be corrected for butrequires a calibration prior to the experiment. The transpar-ent calibration plate shown in Fig. 7 is used for this depth offield (DoF) correction, yielding the DoF’s width dependingon droplet size. Currently, a linear fit to the calibration datais used for correction, see Fig. 10. Figure 9: Influence of Probe Volume Correction (PVC) ondroplet diameters for PDI system at the position 40 mm be-low the nozzle; exemplary mean diameters corrected (PVC)and not corrected (Non-PVC) Figure 10: Calibration data and linear fit for depth of field(DoF) correction for Shadowgraphy images; correction re-quired due to increasing width of probe volume for increas-ing droplet size Measurement techniques for simultaneous droplet sizing and velocimetry are compared in respect of their applicability and inherent limitations. A detailed discussion of the results requires specific corrections of the data to compensate for the inherent effects of the differentsampling methods, i.e. flux-sensitive and concentration dependent. Among others, these incorporate a correction of the diameter-velocity relationship for the flux-dependentPhase Doppler Interferometry (PDI) and a depth of field correction for Shadow Imaging.It is demonstrated, that flux-dependent methods like PDI and the concentration imaging techniques Interferometric Mie Imaging (IMI) and Shadowgraphy yield consistent resultsat various positions in a dilute spray. While PDI is able to resolve a bi-modal droplet size distribution, IMI tends to pronounce larger droplets. With respect to the applicationin the dense sprays for automotive applications and high-pressure and elevated temperature conditions, Shadowgraphy is considered to be least sensitive to beam-steering and multiple light scattering.
确定
还剩5页未读,是否继续阅读?

产品配置单
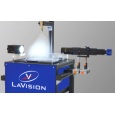
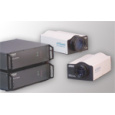

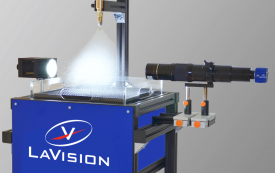
北京欧兰科技发展有限公司为您提供《喷雾中速度和粒径检测方案(激光粒度仪)》,该方案主要用于其他中速度和粒径检测,参考标准--,《喷雾中速度和粒径检测方案(激光粒度仪)》用到的仪器有LaVision ParticleMaster-Shadow 粒径测量系统、激光相位多普勒干涉仪LDV,PDI,PDPA,PDA、LaVision DaVis 智能成像软件平台
推荐专场


相关方案
更多
该厂商其他方案
更多