


方案详情
文
采用LaVision公司特色的以图像增强器为核心部件构成的平面激光诱导荧光(PLIF)测试系统对甲醛在压缩引燃发动机燃烧过程中的作用进行了研究和分析
方案详情

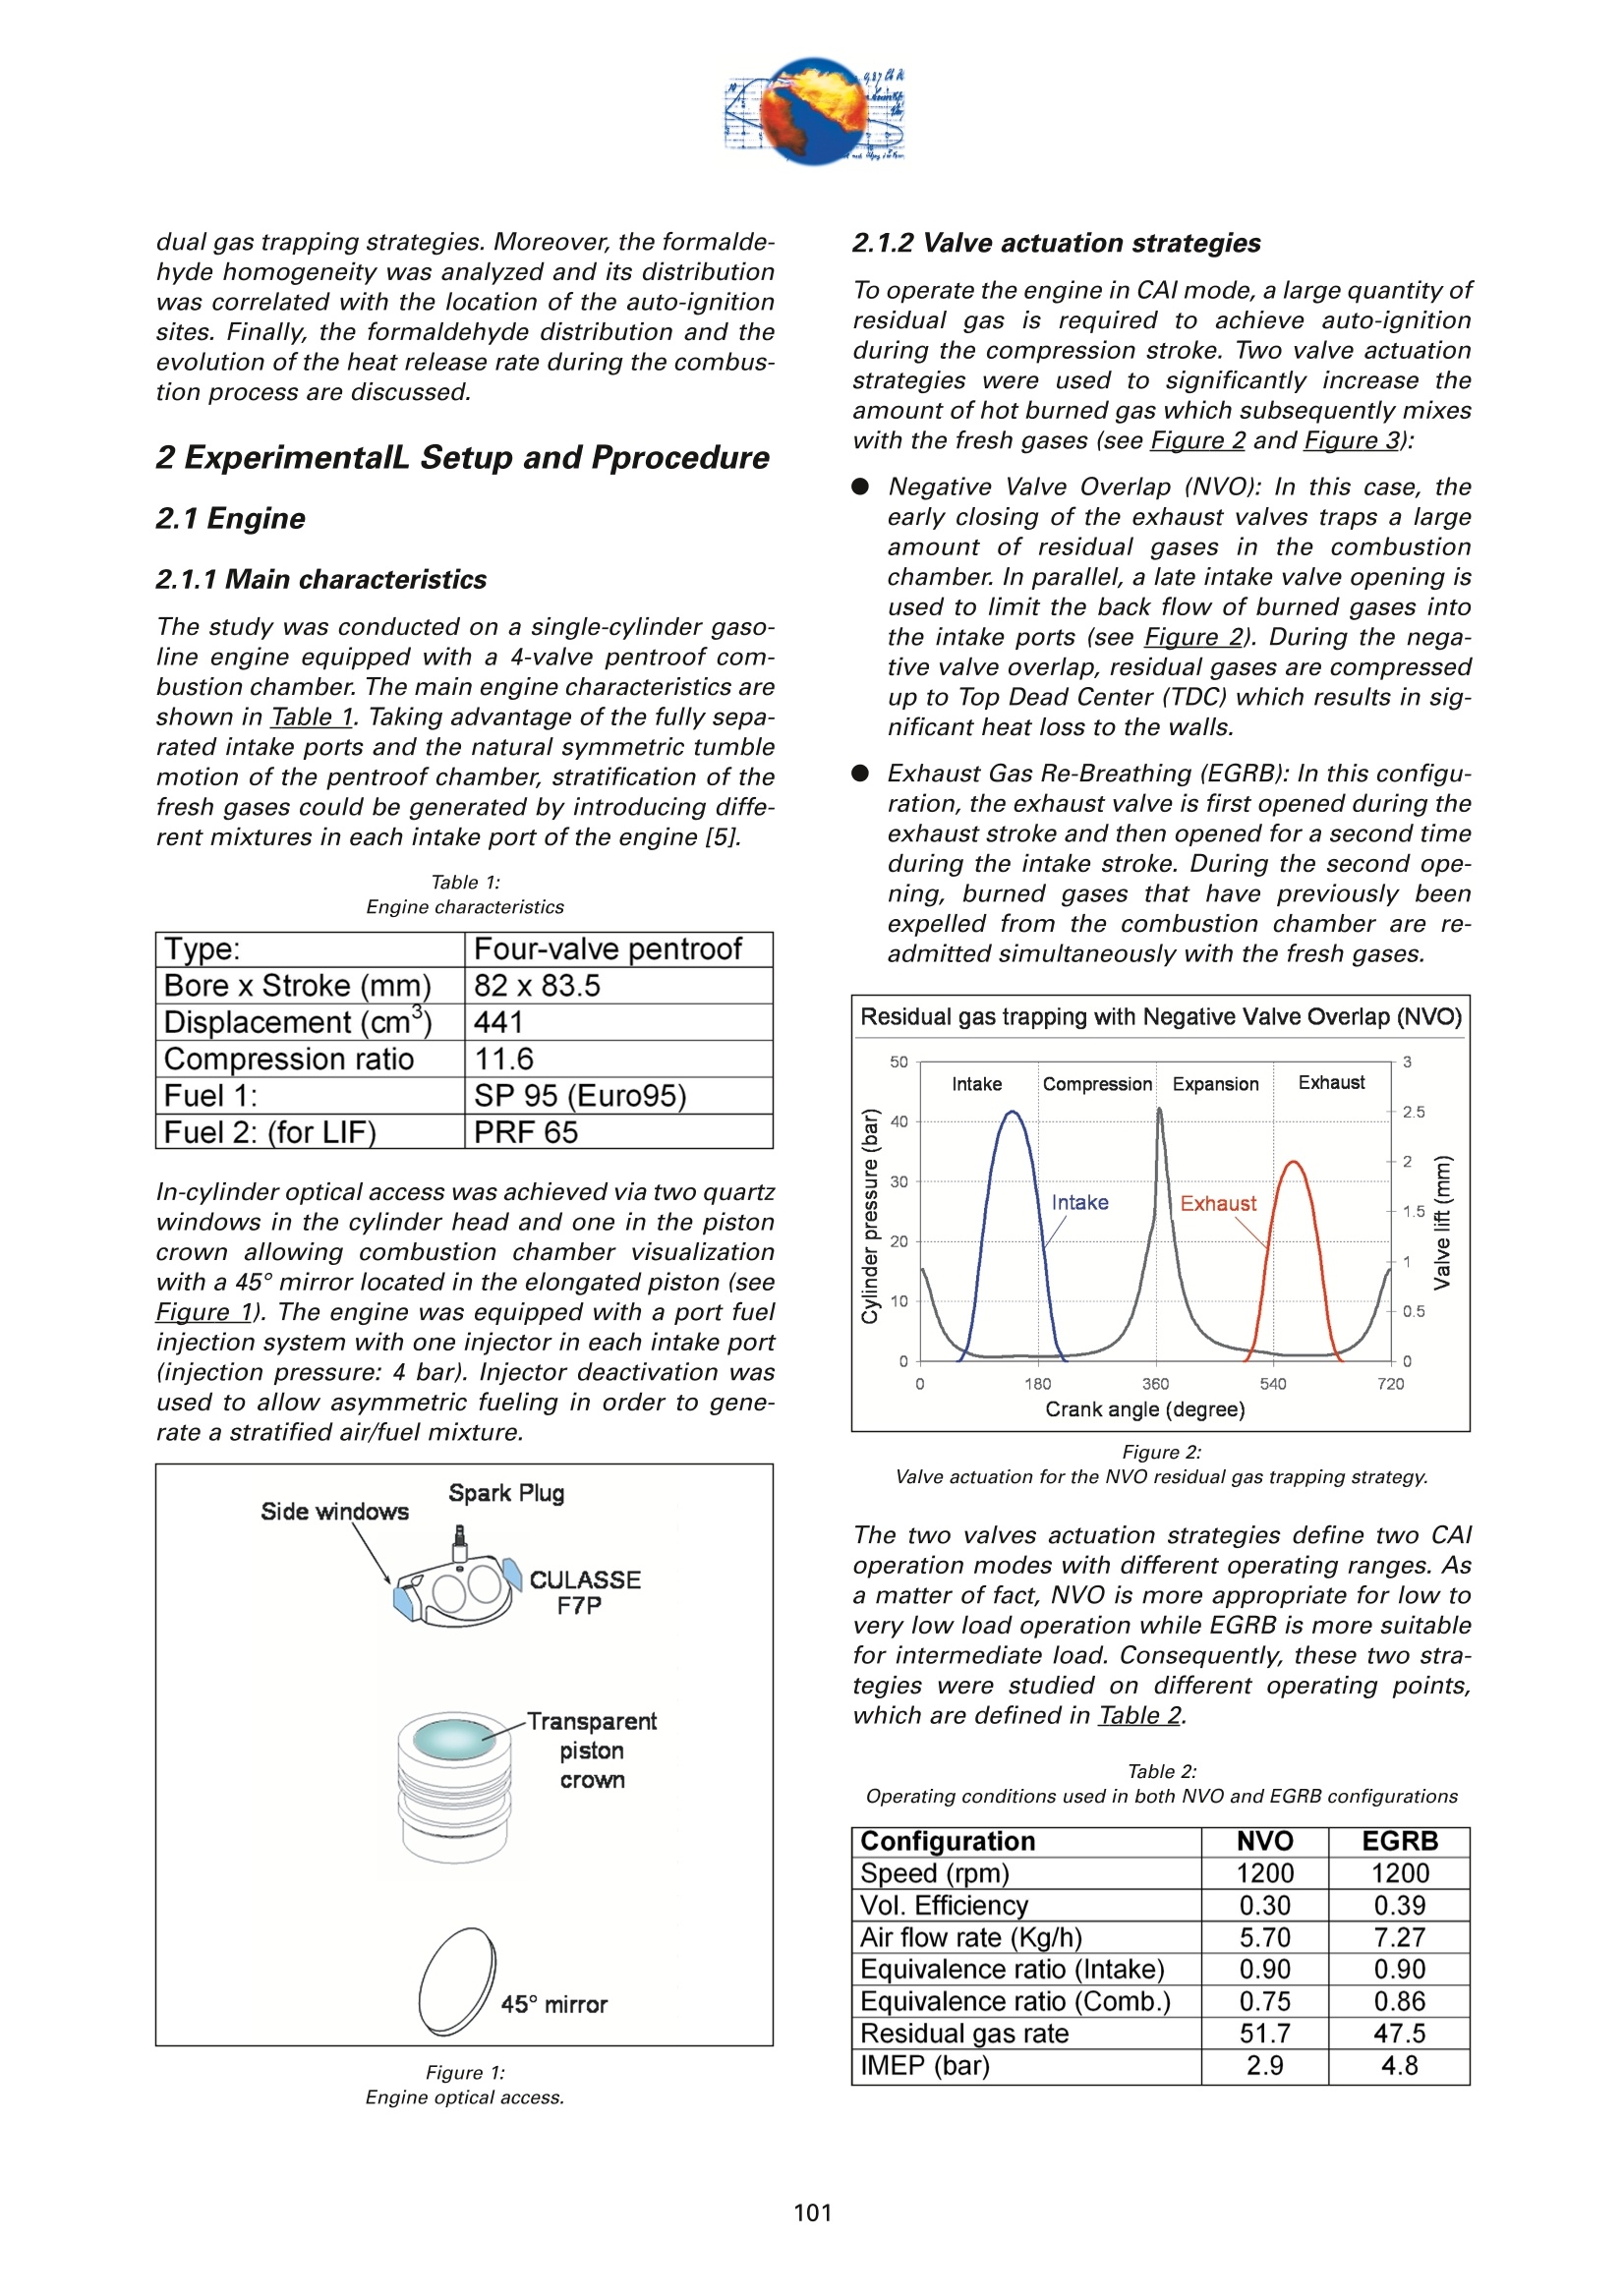
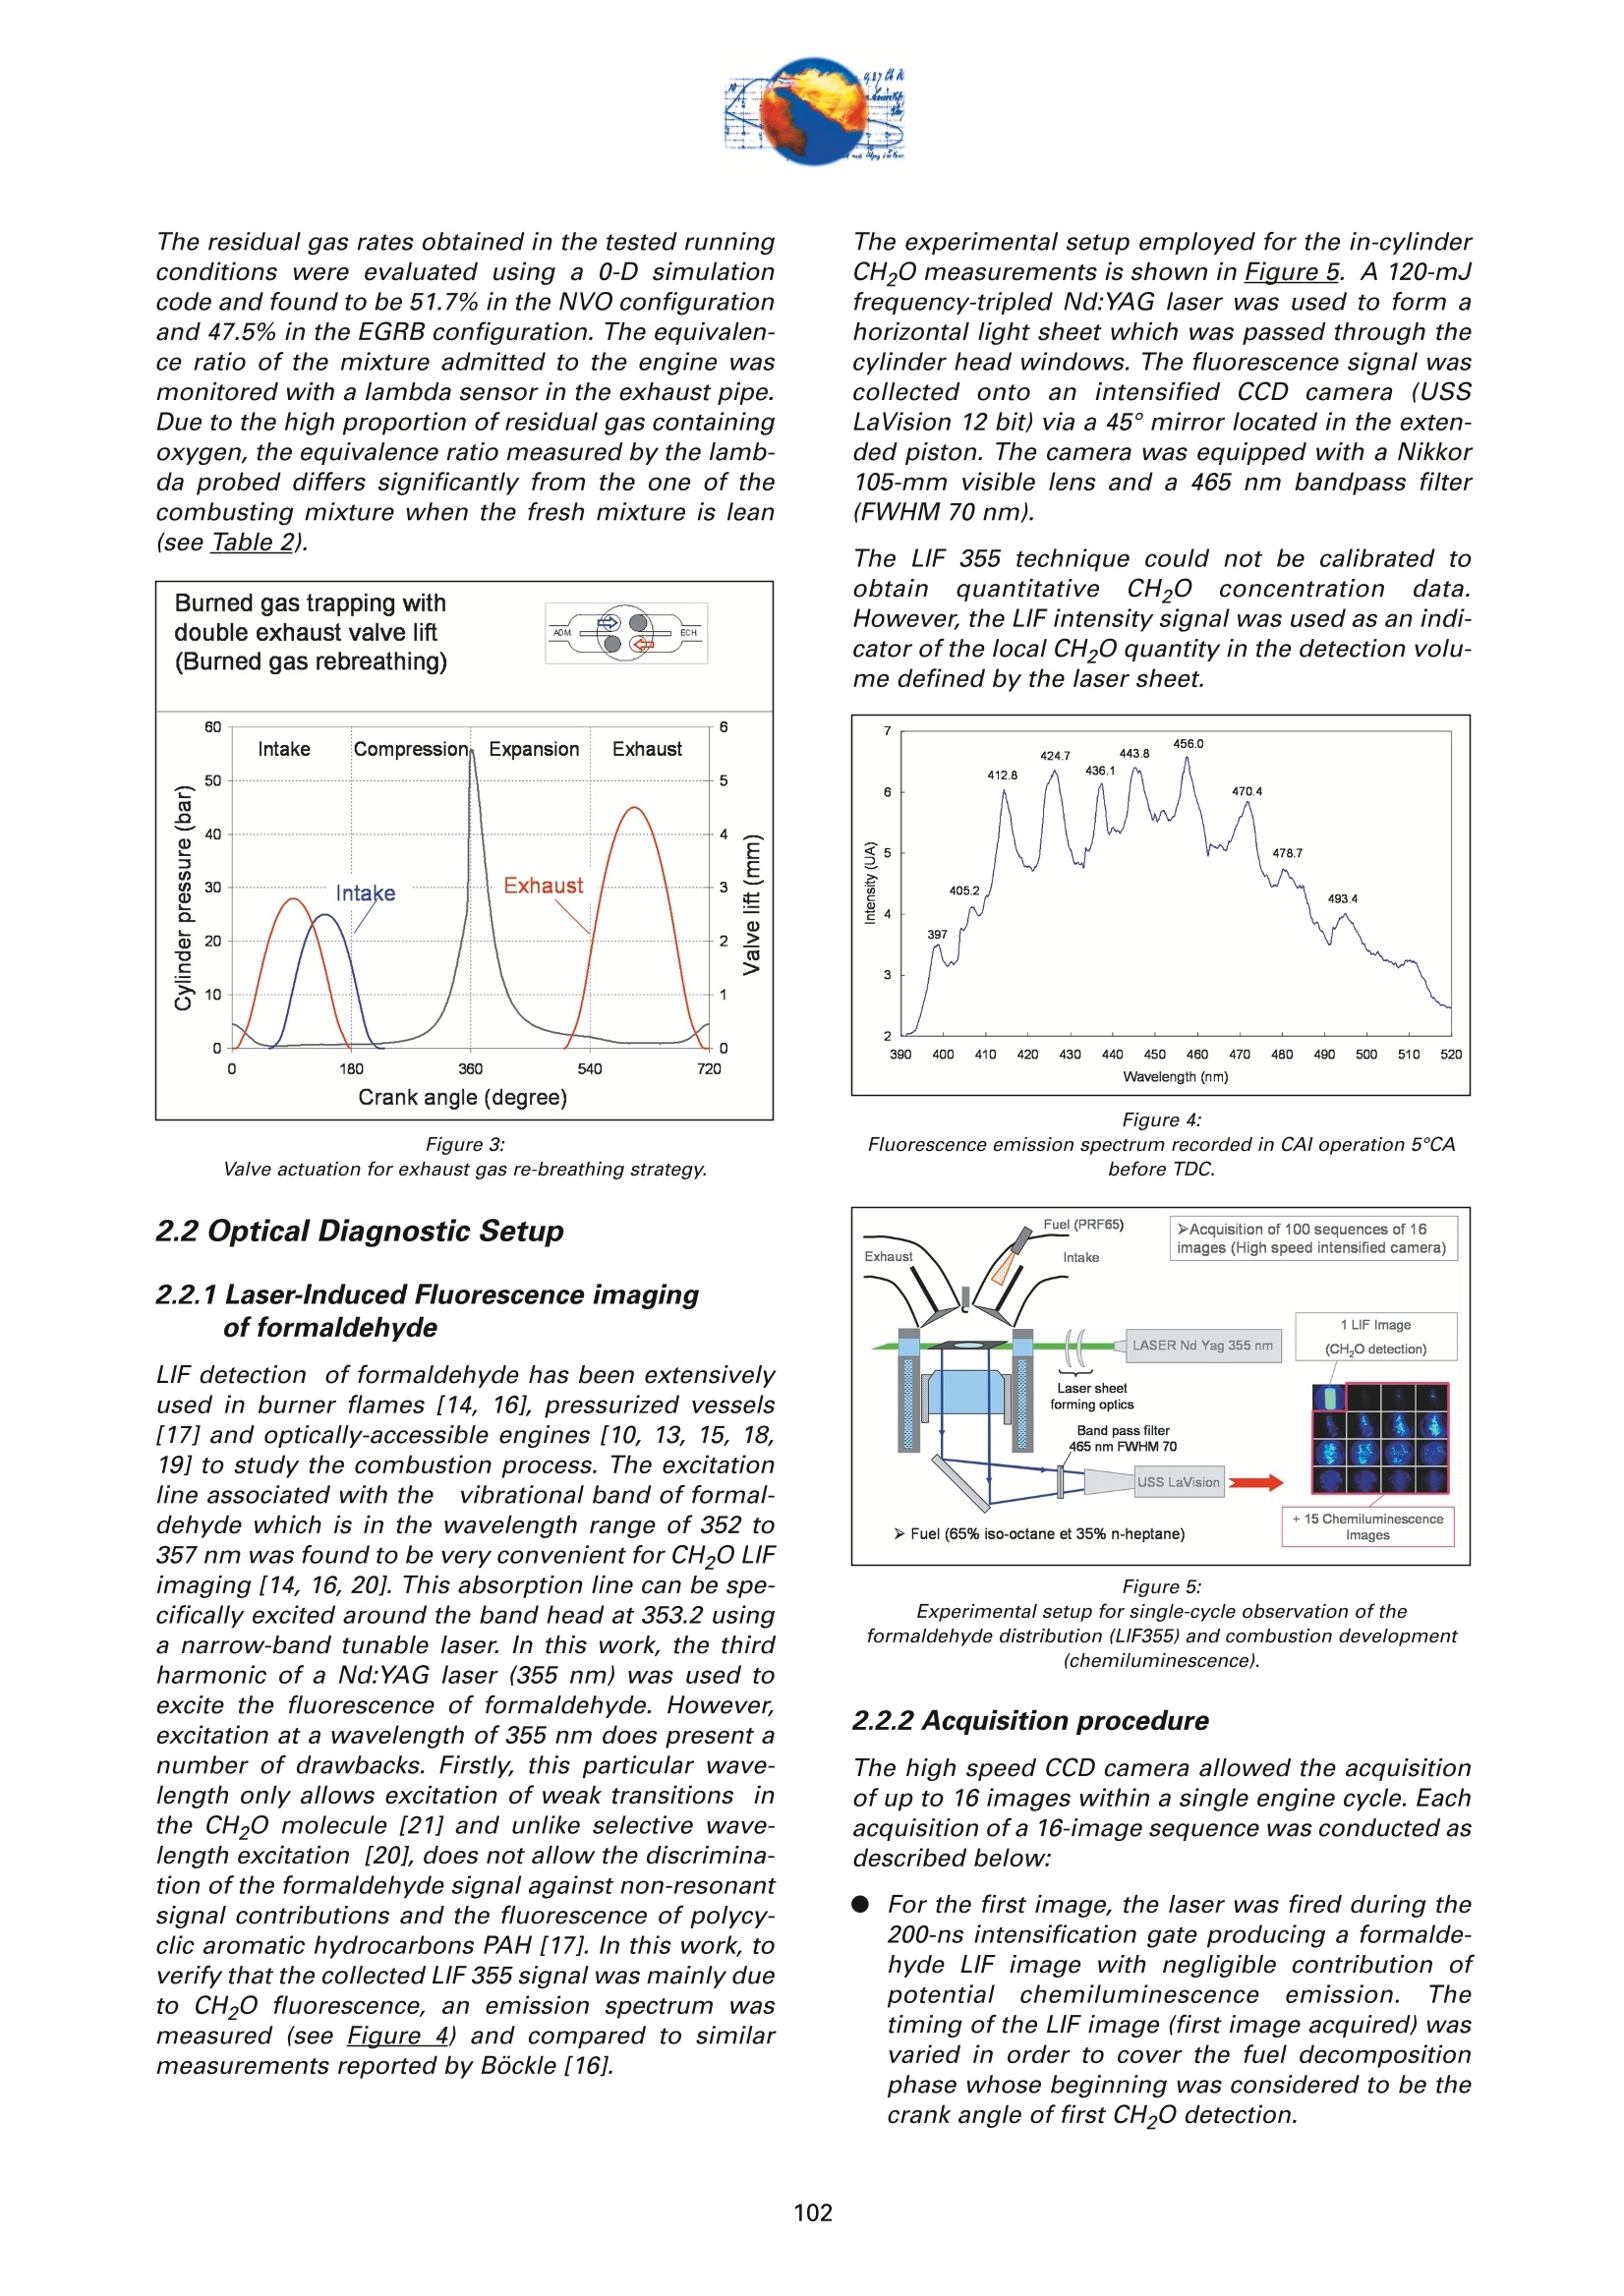
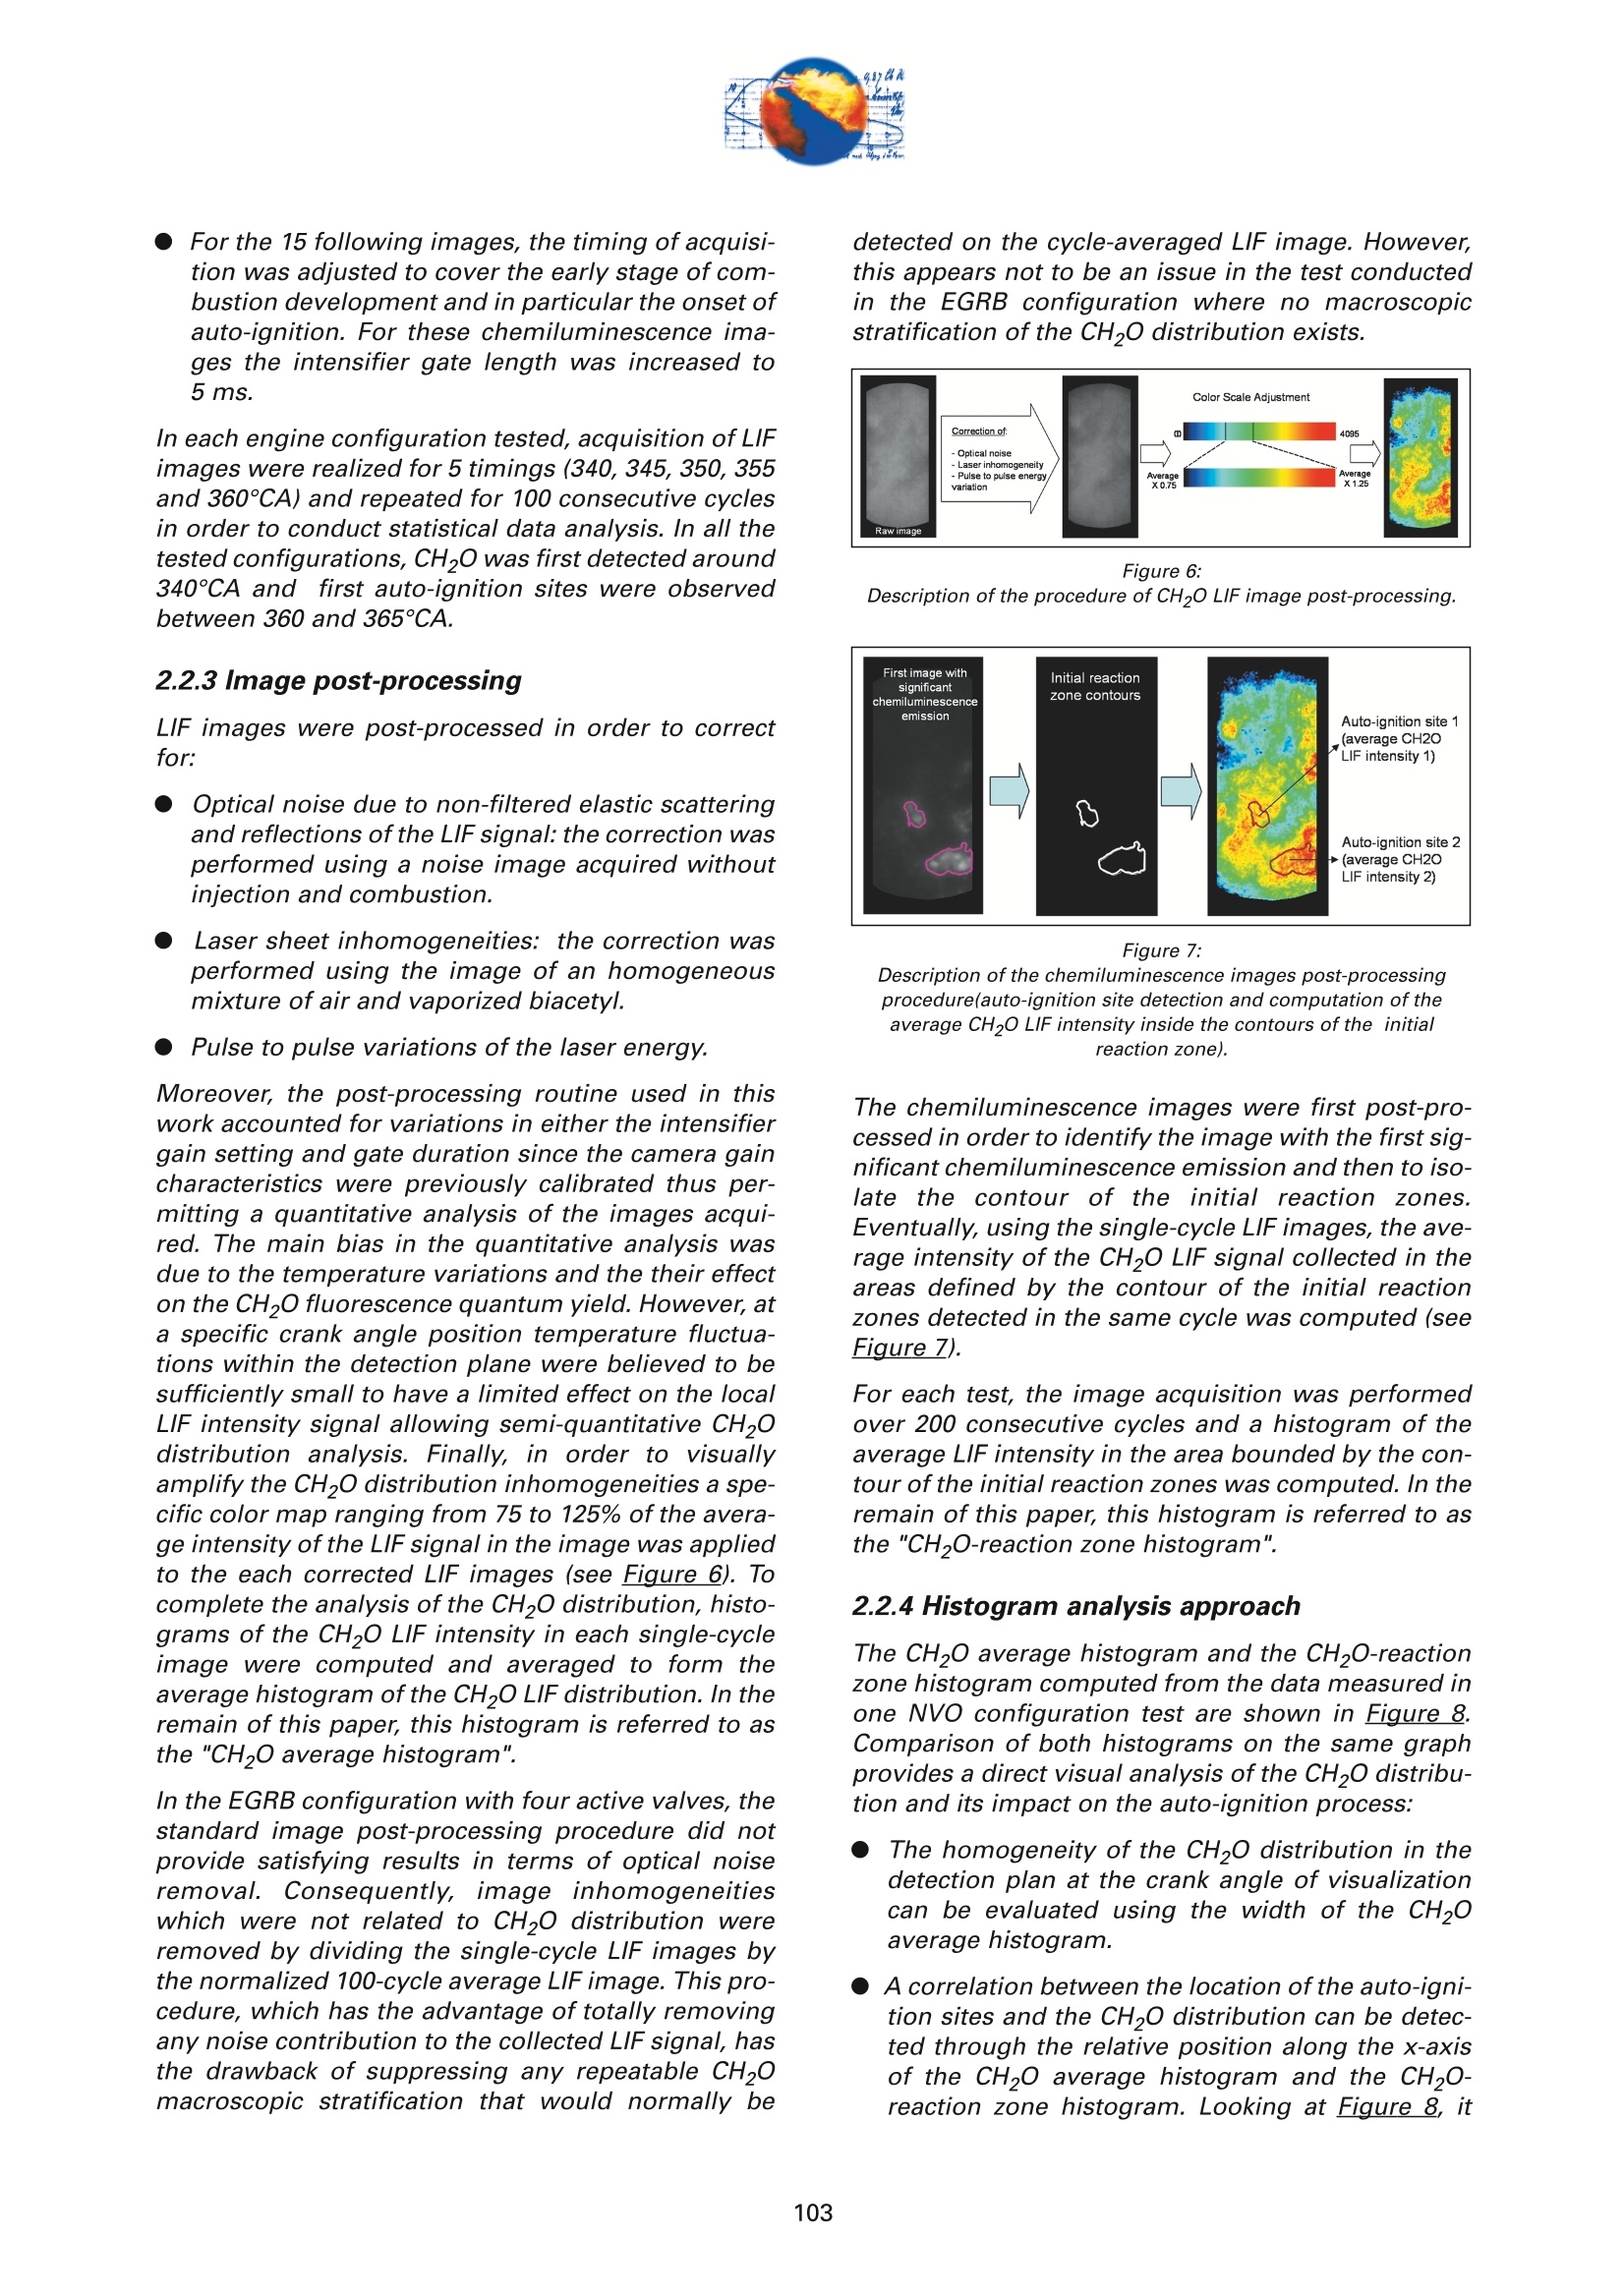
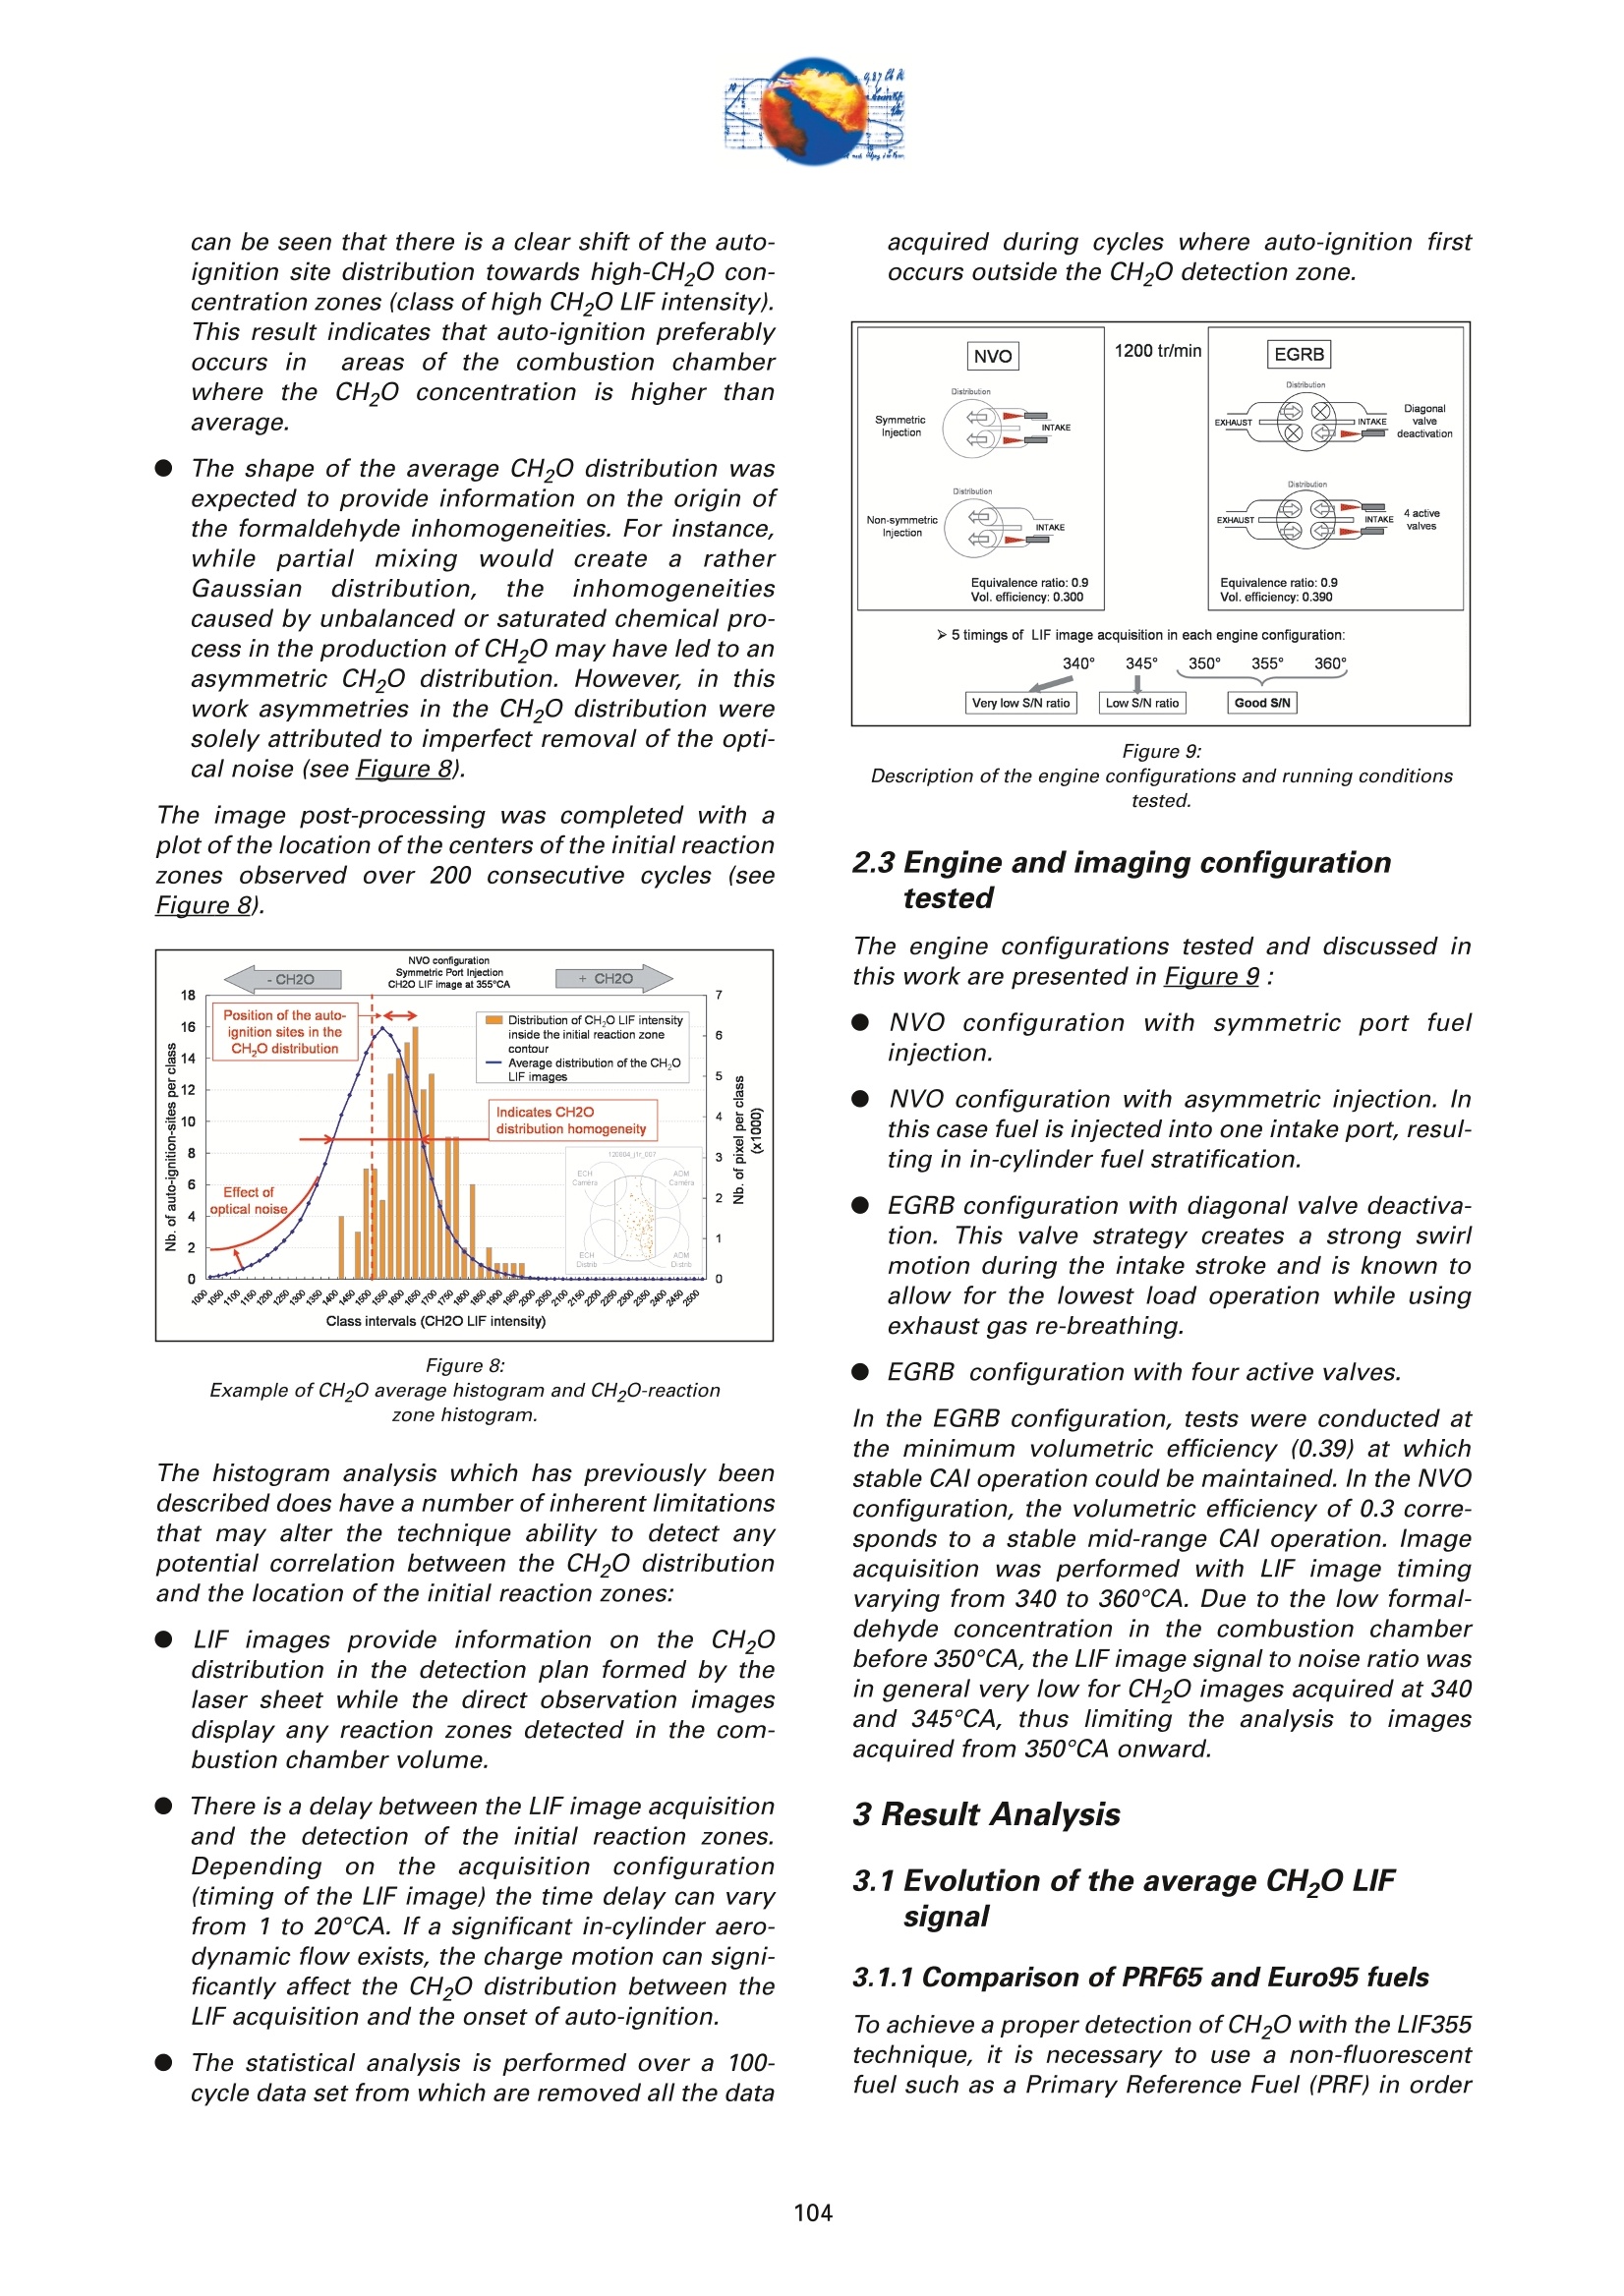
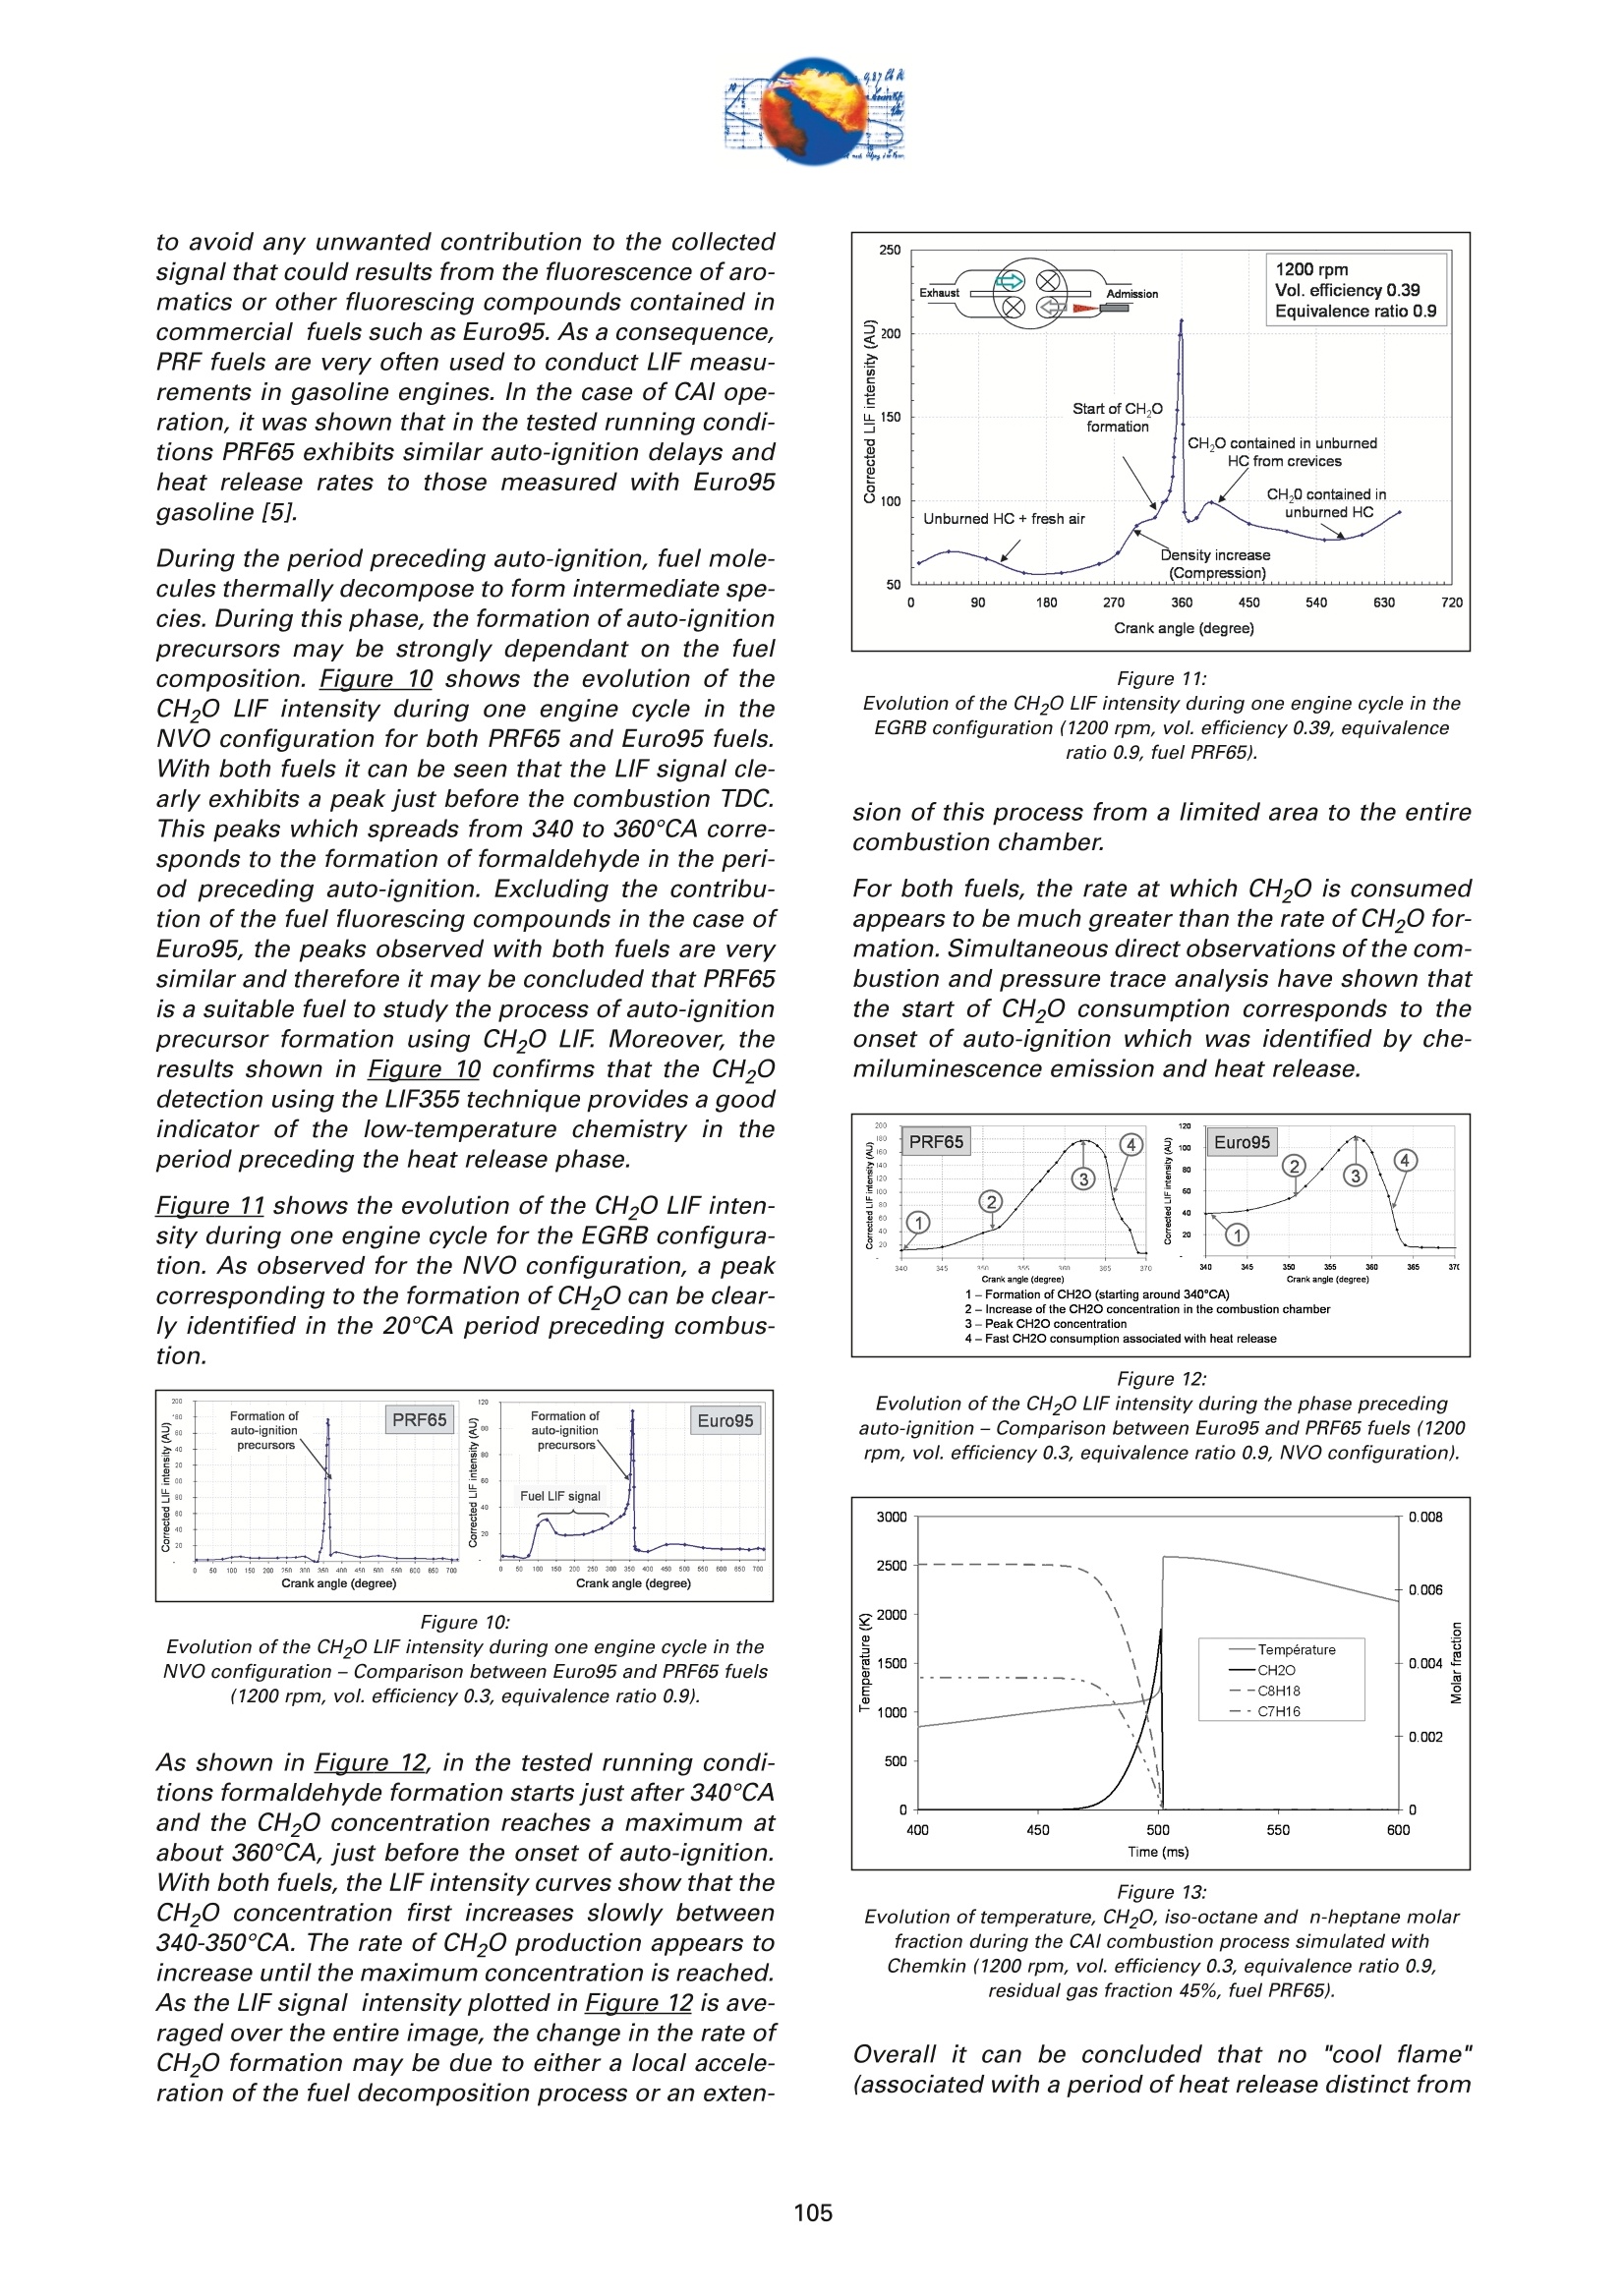
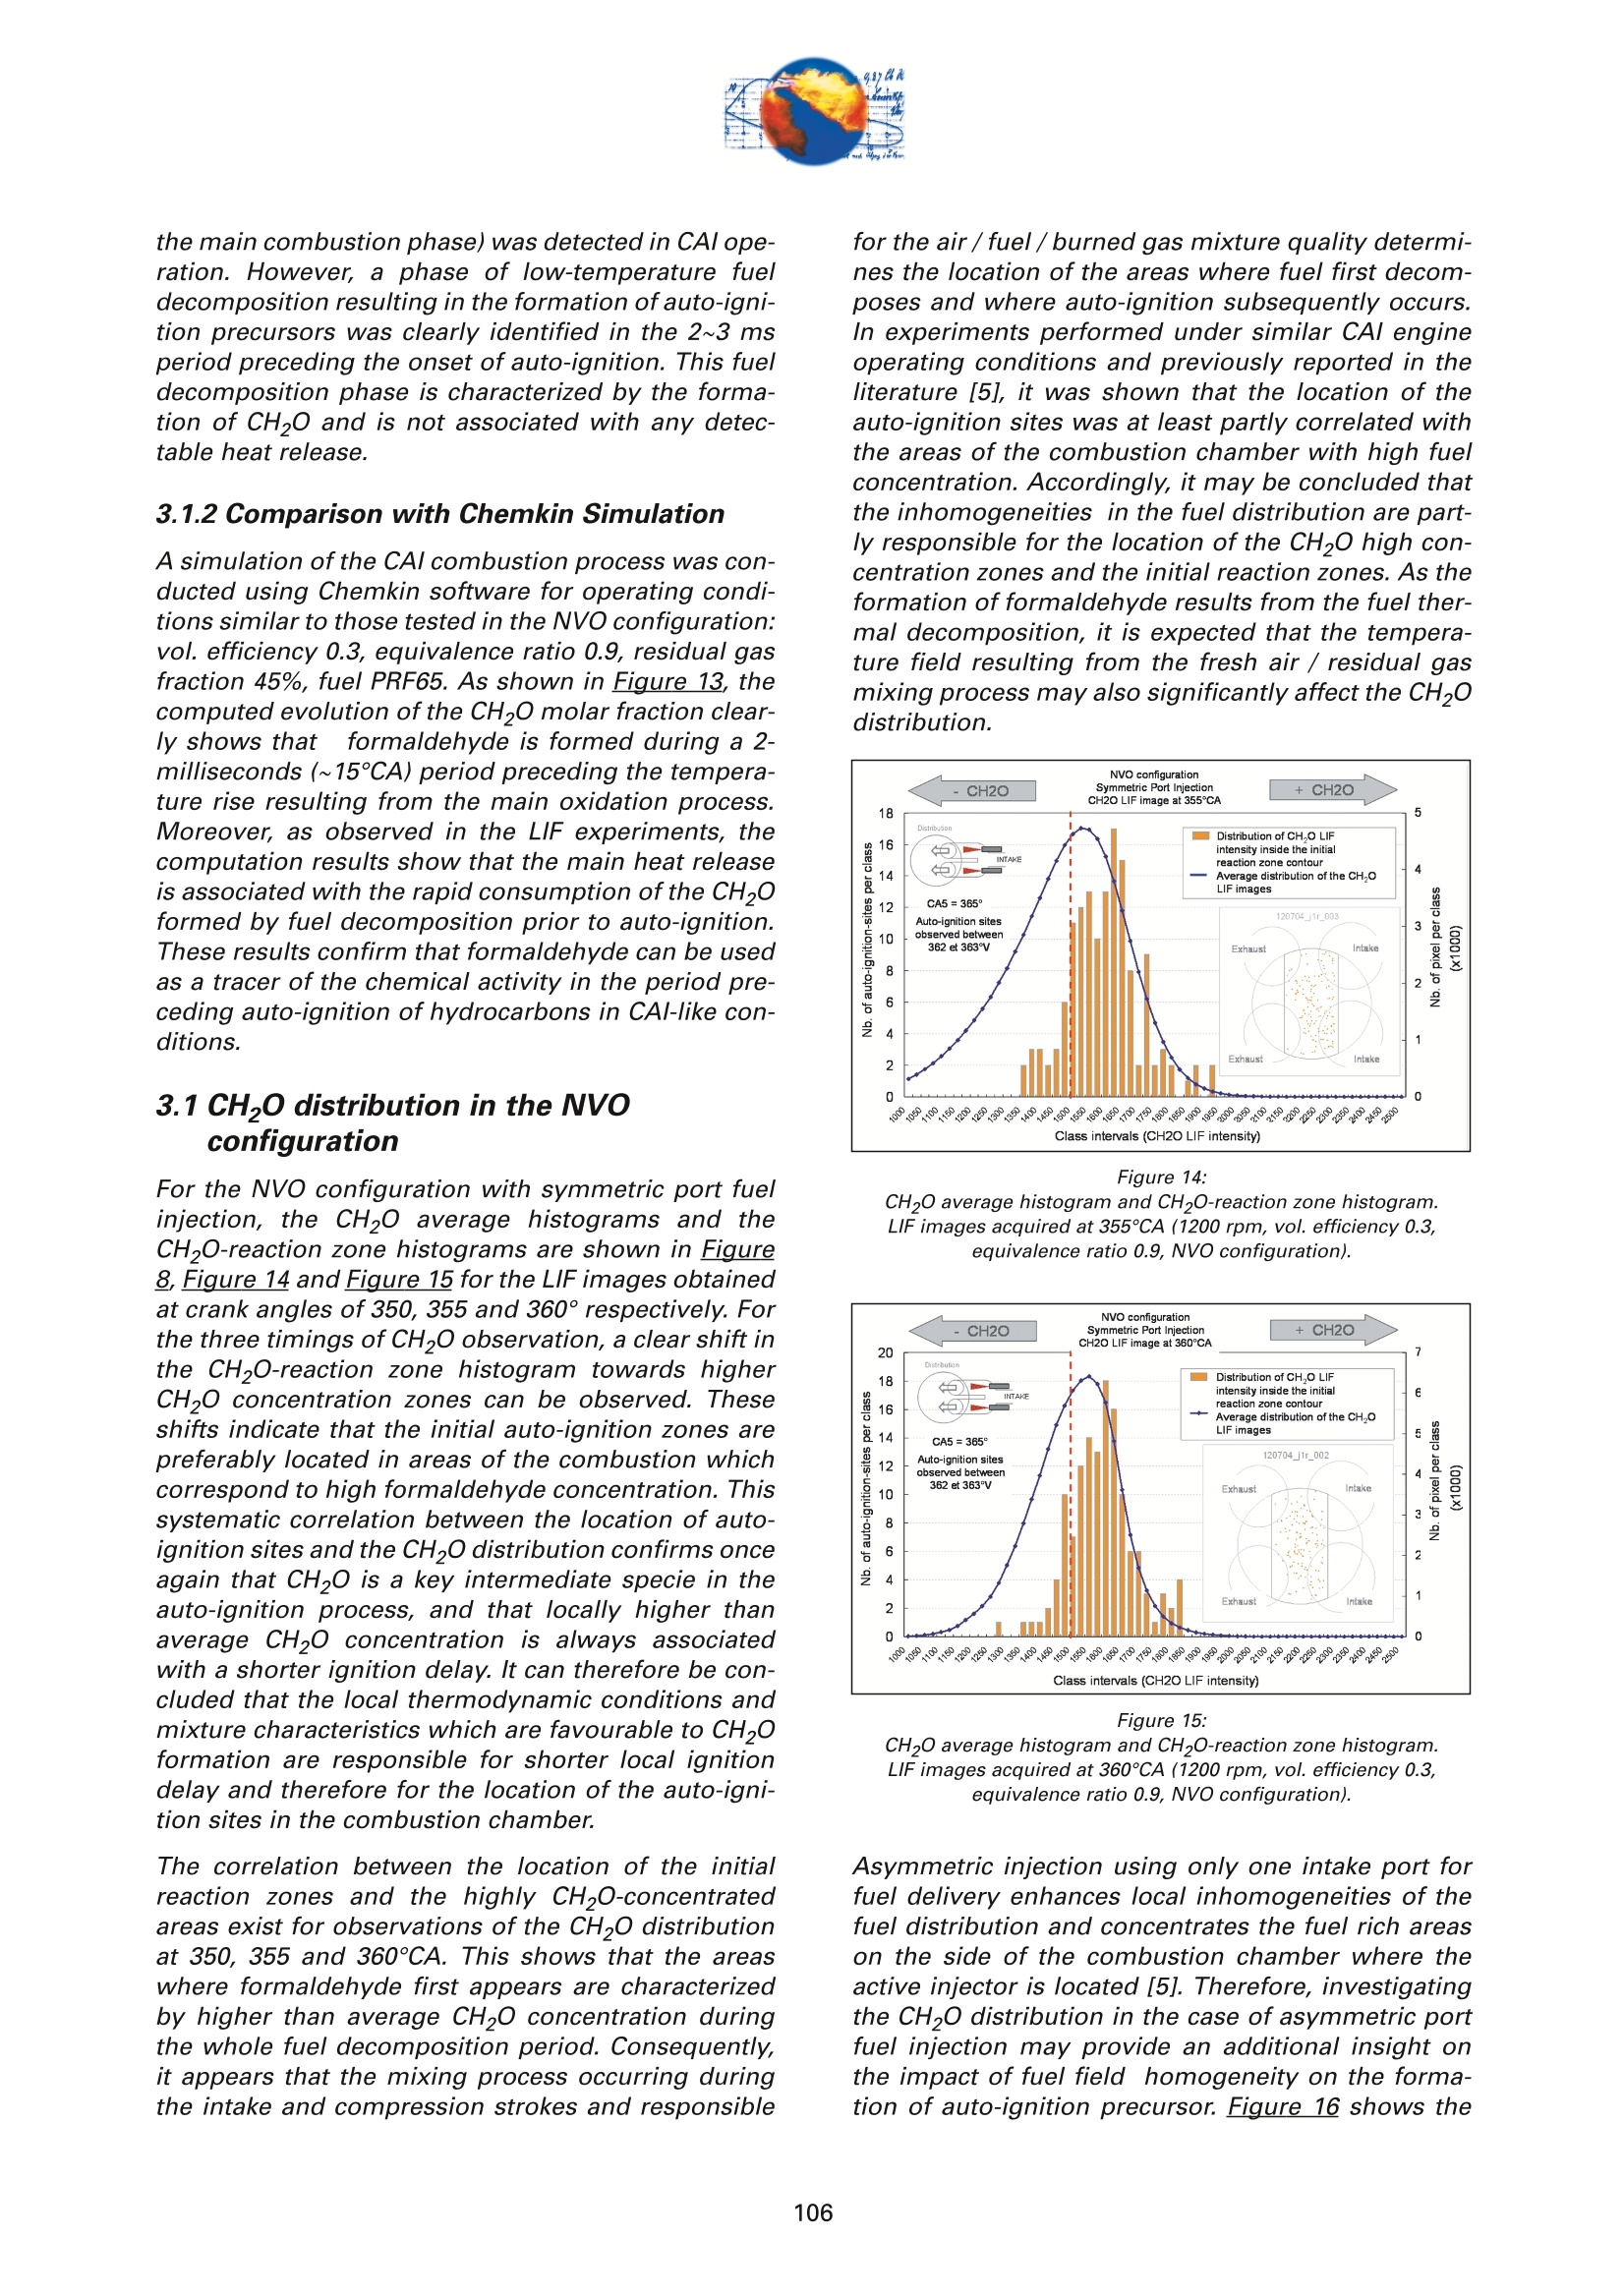
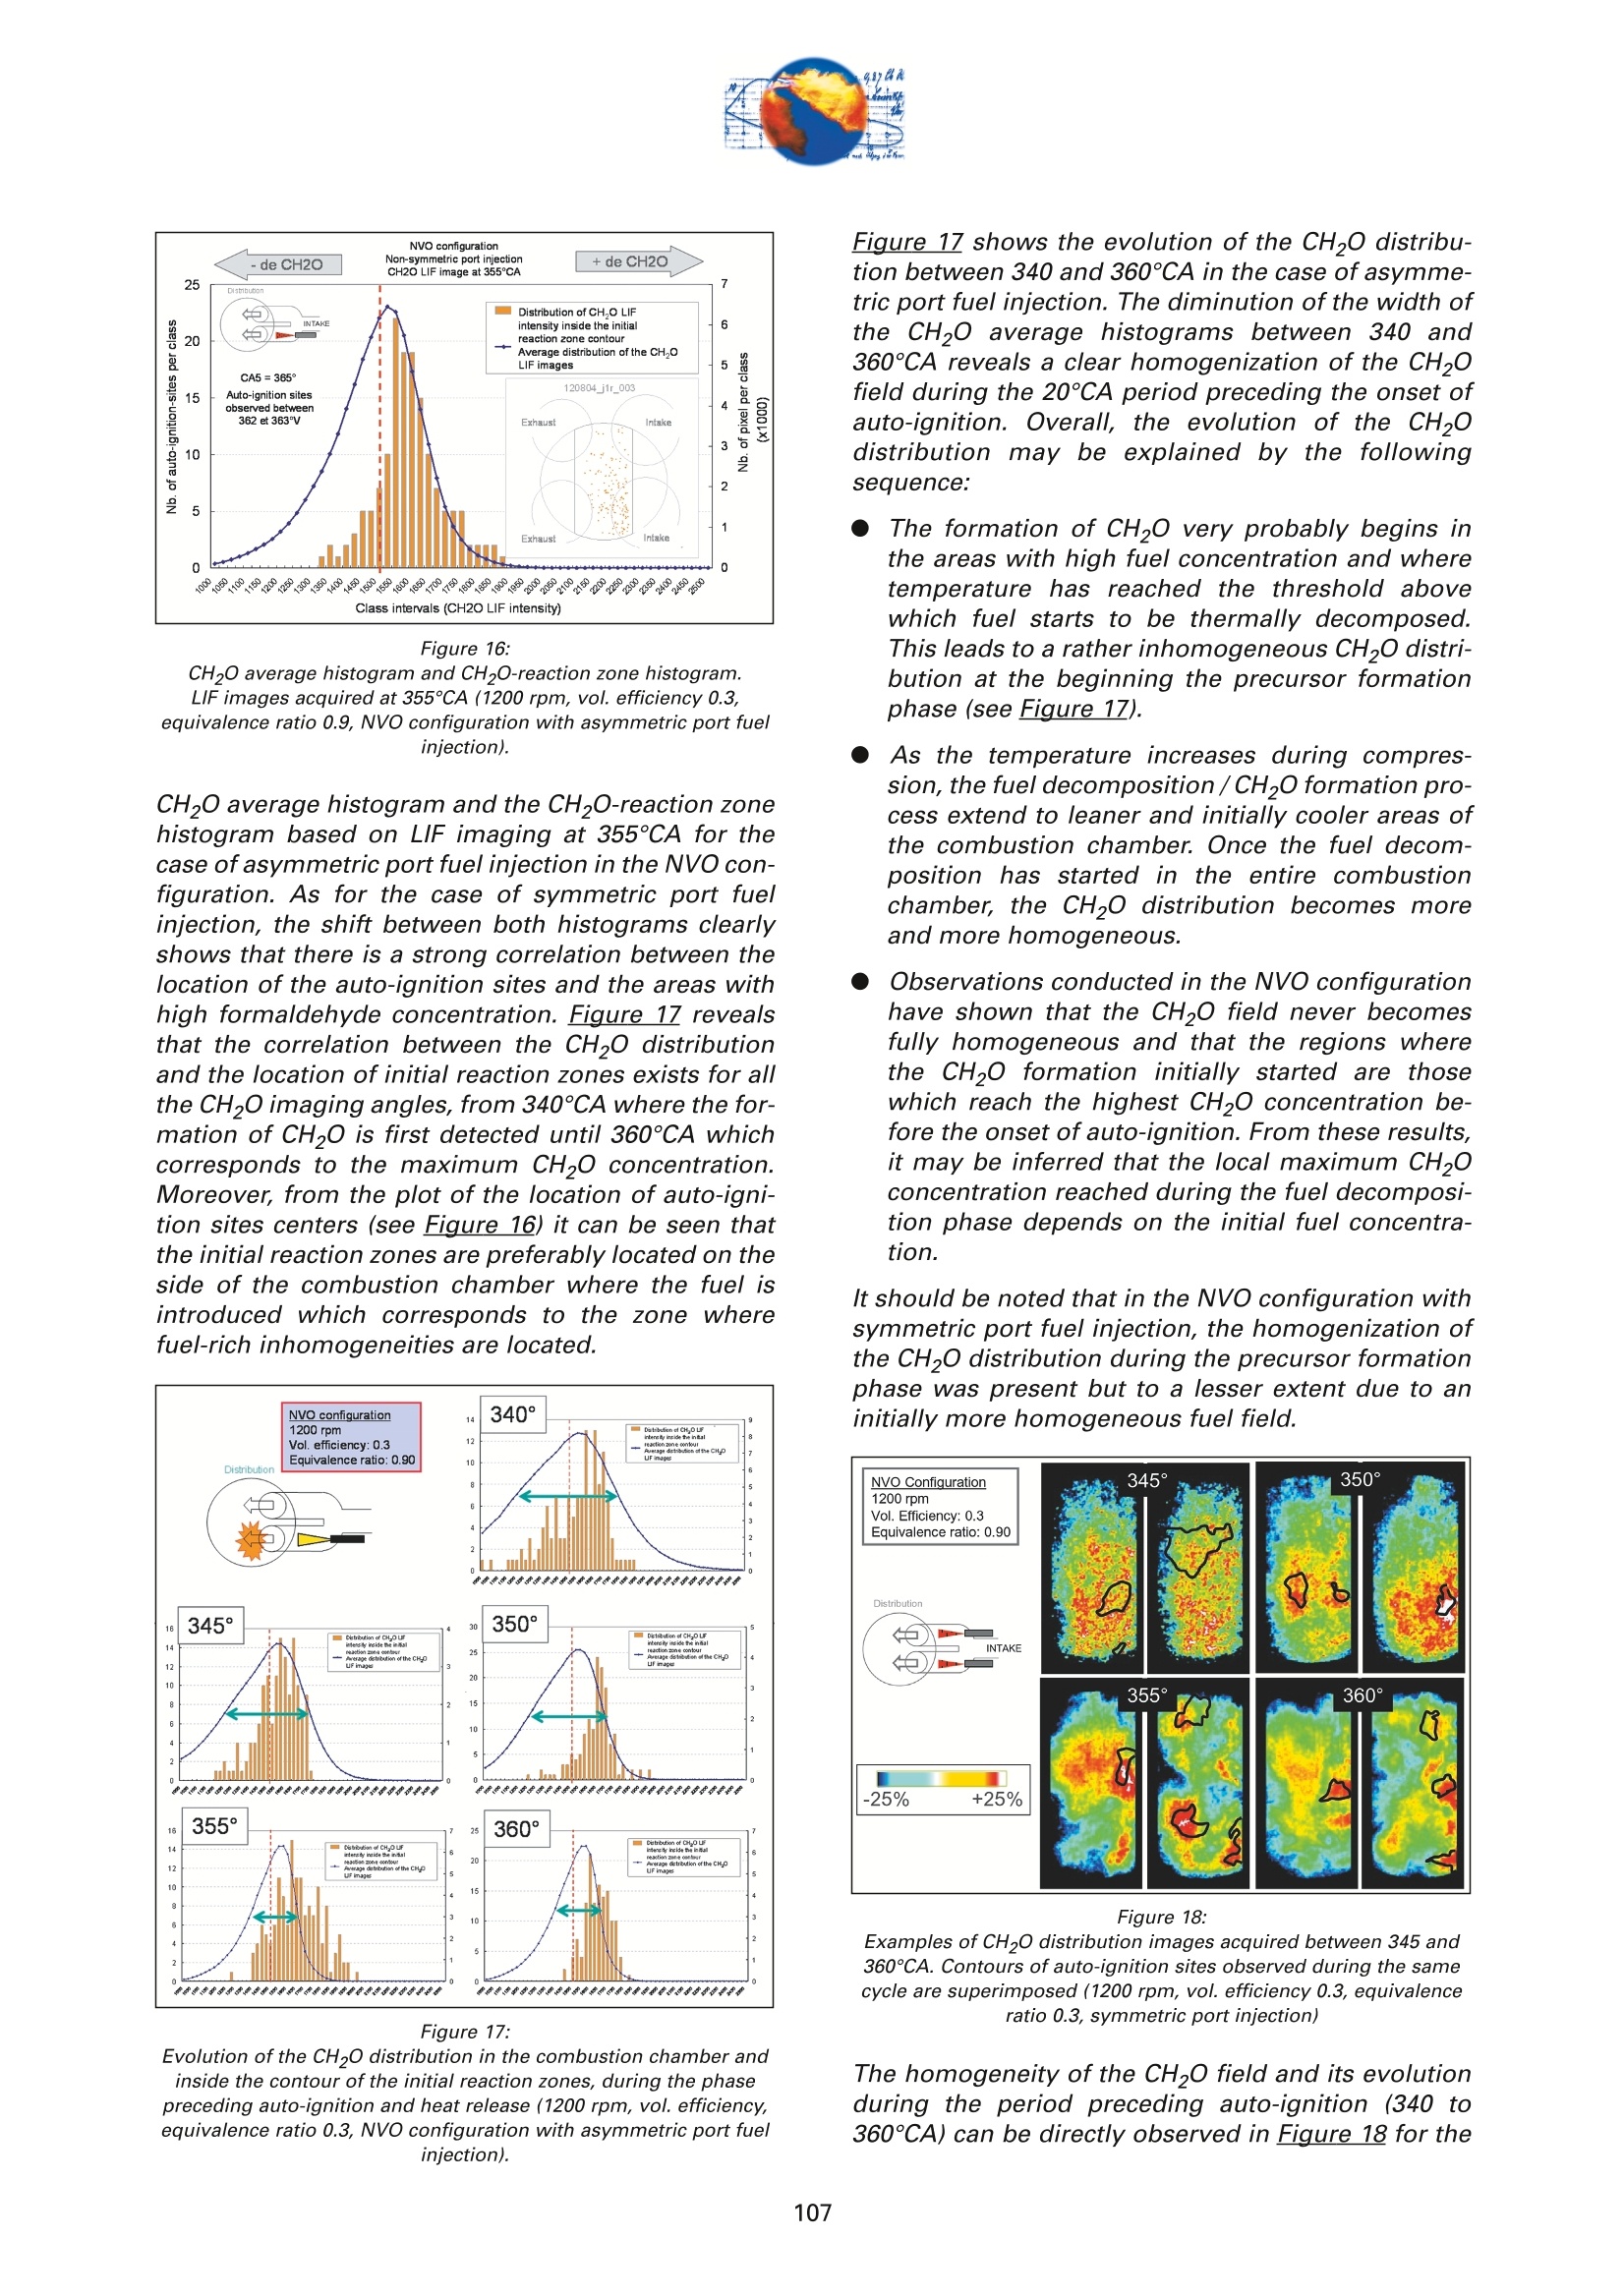
On the role of formaldehydein the CAI Combustion Process Dr. B. ThirouardInstitut francais du petrole (IFP),Rueil-Malmaison Cedex/France rr心a ob Depending on the fuel properties and the tempera-ture/pressure history, auto-ignition of hydrocarbonsmay exhibit a fuel decomposition phase prior to themain heat release. During this phase, intermediatecombustion species which play an important role inthe low-temperature oxidation process such asformaldehyde are formed. In this study, planar laser-induced fluorescence (PLIF) imaging of formaldehyde(CHO) has been performed in an optically-accessibleengine running in CAl (Controlled Auto-Ignition)mode to investigate the fuel decomposition phaseprior to auto-ignition. In the tested operating condi-tions, the LIF images indicated that formaldehydewas formed as early as 20℃A before the onset ofauto-ignition. The formaldehyde concentration wasfound to reach a maximum just before the appea-rance of the first auto-ignition sites. While the CH20production phase is characterized by slow chemistryand the absence of heat release, the consumption ofCH,O is associated with a short chemical kinetic timescale (< 1℃A at 1200 rpm) and a high heat releaserate. LIF images were also used to characterize the CH0spatial distribution. Results showed that formaldehy-de first appears in fuel-rich inhomogeneities of thefuel / air/ residual gas mixture and that the CH0distribution becomes almost homogeneous beforeauto-ignition. A cycle to cycle comparison betweenthe CH22O field and the location of auto-ignition sitesshowed that auto-ignition occurs systematically inareas of the combustion chamber locally-rich informaldehyde. This result confirms and emphasizesthe important role of CH2O in the CAl combustionprocess. Furthermore, the CH,0 distributions obtained withtwo different strategies of residual gas trapping werecompared. It appears that trapping residual gas usingNegative Valve Overlap (NVO) leads to relativelyinhomogeneous CH,O distributions and moderateheat release rates, while using exhaust gas re-brea-thing (EGRB) resulted in a very homogeneous CH20distribution associated with a fast and homogeneouscombustion process. Through this work, it was esta-blished that the CAl combustion mode involves threeimportant stages: Air /fuel /residual gas mixture preparation (intakeand compression stroke). Fuel decomposition into intermediate species suchas formaldehyde. The CHO distribution directlyresults from the 3D mixing process in the previousphase. Auto-ignition in the CH2O-rich areas of the com-bustion chamber. The homogeneity of the CH2Odistribution directly impacts the structure of thecombustion zone and the global heat release rate. Combustion of a premixed-charge by compressionignition is a promising alternative combustion pro-cess as it allows part load operation with high dilutionrate (air and/or residual gas dilution) while preservingengine stability. This combustion process attractedattention on account of its potential for achievinghigh efficiency and ultra-low NOy emissions [1, 2, 3,4]. When using commercial gasoline as fuel, auto-ignition of a premixed charge in a four-stroke enginecan be achieved with high compression ratio, inlet airheating or residual gas trapping. CAl refers to auto-ignition combustion obtained with a high proportionof burned gases trapped in the fresh mixture. In thiswork, CAl operation is achieved in an engine with acompression ratio of 11.6 running with gasoline-typefuel. While SI combustion is characterized by flame propa-gation and associated fast chemical reactions in aconfined reaction zone, chemiluminescence imagingstudies [5] have shown that the CAl combustion pro-cess could be described as a large reaction zoneresulting from an auto-ignition process which occurssuccessively at various in-cylinder locations. Themechanisms which promote auto-ignition involvesboth thermal and chemical effects of the recycled bur-ned gases. While numerous studies have shown thatthe heating effect is predominant [6,7], other investi-gations emphasized the active role of chemical spe-cies like CO, H, and NO [8]. Auto-ignition of hydrocarbon species under engine-like thermodynamic conditions involves "so-called"low-temperature chemistry (<1000 K) in the periodpreceding the combustion phase. In piston engines,depending on the fuel chemical properties and thepressure/temperature evolution the auto-ignition pro-cess may involve a single or a two-stage heat releaseprocess [9]. In the case of HCCl engines using relati-vely high compression ratios (>14) and/or diesel-typefuel, a two-stage combustion process characterizedby a "cool flame" and a main heat release phase weresystematically observed [10, 11, 12, 13]. In diesel-typeHCCI engines the pre-combustion phase is easilyidentified due to the associated heat release and che-miluminescence emission. During this "cool-flame"period partially oxidized hydrocarbons such as alde-hydes are formed and may be used as tracer of thechemical activity prior to the main combustion phase.In particular, formaldehyde has been identified as anearly intermediate species in the process of hydrocar-bon oxidation, either by flame propagation [14] orhomogeneous auto-ignition combustion [15, 9]. Inthis work, Laser-Induced Fluorescence imaging offormaldehyde is used to investigate and characte-rized the chemical activity and fuel decomposition inthe phase prior to auto-ignition in an optically-acces-sible engine running in CAl mode with gasoline-typefuel. The formation of formaldehyde is investigated in twoCAl operating configurations based on distinct resi- dual gas trapping strategies. Moreover, the formalde-hyde homogeneity was analyzed and its distributionwas correlated with the location of the auto-ignitionsites. Finally, the formaldehyde distribution and theevolution of the heat release rate during the combus-tion process are discussed. 2 ExperimentalL Setup and Pprocedure 2.1 Engine 2.1.1 Main characteristics The study was conducted on a single-cylinder gaso-line engine equipped with a 4-valve pentroof com-bustion chamber. The main engine characteristics areshown in Table 1. Taking advantage of the fully sepa-rated intake ports and the natural symmetric tumblemotion of the pentroof chamber, stratification of thefresh gases could be generated by introducing diffe-rent mixtures in each intake port of the engine [5]. Table 1:Engine characteristics Type: Four-valve pentroof Bore x Stroke (mm) 82 x83.5 Displacement (cm) 441 Compression ratio 11.6 Fuel 1: SP 95 (Euro95) Fuel 2: (for LIF) PRF 65 In-cylinder optical access was achieved via two quartzwindows in the cylinder head and one in the pistoncrown allowing combustion chamber visualizationwith a 45° mirror located in the elongated piston (seeFigure 1). The engine was equipped with a port fuelinjection system with one injector in each intake port(injection pressure: 4 bar). Injector deactivation wasused to allow asymmetric fueling in order to gene-rate a stratified air/fuel mixture. Figure 1:Engine optical access. 2.1.2 Valve actuation strategies To operate the engine in CAl mode, a large quantity ofresidual gas is required to achieve auto-ignitionduring the compression stroke. Two valve actuationstrategies were used to significantly increase theamount of hot burned gas which subsequently mixeswith the fresh gases (see Figure 2 and Figure 3): Negative Valve Overlap (NVO): In this case, theearly closing of the exhaust valves traps a largeamount of residual gases in the combustionchamber. In parallel, a late intake valve opening isused to limit the back flow of burned gases intothe intake ports (see Figure 2). During the nega-tive valve overlap, residual gases are compressedup to Top Dead Center (TDC) which results in sig-nificant heat loss to the walls. Exhaust Gas Re-Breathing (EGRB): In this configu-ration, the exhaust valve is first opened during theexhaust stroke and then opened for a second timeduring the intake stroke. During the second ope-ning, burned gases that have previously beenexpelled from the combustion chamber are re-admitted simultaneously with the fresh gases. Figure 2: Valve actuation for the NVO residual gas trapping strategy. The two valves actuation strategies define two CAloperation modes with different operating ranges. Asa matter of fact, NVO is more appropriate for low tovery low load operation while EGRB is more suitablefor intermediate load. Consequently, these two stra-tegies were studied on different operating points,which are defined in Table 2. Table 2:Operating conditions used in both NVO and EGRB configurations Configuration NVO EGRB Speed (rpm) 1200 1200 Vol. Efficiency 0.30 0.39 Air flow rate (Kg/h) 5.70 7.27 Equivalence ratio (Intake) 0.90 0.90 Equivalence ratio (Comb.) 0.75 0.86 Residual gas rate 51.7 47.5 IMEP (bar) 2.9 4.8 The residual gas rates obtained in the tested runningconditions were evaluated using a 0-D simulationcode and found to be 51.7% in the NVO configurationand 47.5% in the EGRB configuration. The equivalen-ce ratio of the mixture admitted to the engine wasmonitored with a lambda sensor in the exhaust pipe.Due to the high proportion of residual gas containingoxygen, the equivalence ratio measured by the lamb-da probed differs significantly from the one of thecombusting mixture when the fresh mixture is lean(see Table 2). Figure 3: Valve actuation for exhaust gas re-breathing strategy. 2.2 Optical Diagnostic Setup 2.2.1 Laser-Induced Fluorescence imagingof formaldehyde LIF detection of formaldehyde has been extensivelyused in burner flames [14, 16], pressurized vessels[17] and optically-accessible engines [10, 13,15,18,19] to study the combustion process. The excitationline associated with thevibrational band of formal-dehyde which is in the wavelength range of 352 to357 nm was found to be very convenient for CH0 LIFimaging [14, 16, 20]. This absorption line can be spe-cifically excited around the band head at 353.2 usinga narrow-band tunable laser. In this work, the thirdharmonic of a Nd:YAG laser (355 nm) was used toexcite the fluorescence of formaldehyde. However,excitation at a wavelength of 355 nm does present anumber of drawbacks. Firstly, this particular wave-length only allows excitation of weak transitions inthe CH,0 molecule [21] and unlike selective wave-length excitation [20], does not allow the discrimina-tion of the formaldehyde signal against non-resonantsignal contributions and the fluorescence of polycy-clic aromatic hydrocarbons PAH [17]. In this work, toverify that the collected LIF 355 signal was mainly dueto CH,0 fluorescence, an emission spectrum wasmeasured (see Figure 4) and compared to similarmeasurements reported by Bockle [16]. The experimental setup employed for the in-cylinderCH,0 measurements is shown in Figure 5. A 120-mJfrequency-tripled Nd:YAG laser was used to form ahorizontal light sheet which was passed through thecylinder head windows. The fluorescence signal wascollected onto an intensified CCD camera (USSLaVision 12 bit) via a 45°mirror located in the exten-ded piston. The camera was equipped with a Nikkor105-mm visible lens and a 465 nm bandpass filter(FWHM 70 nm). The LIF 355 technique could not be calibrated toobtain quantitativeCH,0 concentrationndata.However, the LIF intensity signal was used as an indi-cator of the local CH20 quantity in the detection volu-me defined by the laser sheet. Figure 4: Fluorescence emission spectrum recorded in CAl operation 5℃Abefore TDC. Figure 5: Experimental setup for single-cycle observation of theformaldehyde distribution (LIF355) and combustion development(chemiluminescence). 2.2.2 Acquisition procedure The high speed CCD camera allowed the acquisitionof up to 16 images within a single engine cycle. Eachacquisition of a 16-image sequence was conducted asdescribed below: For the first image, the laser was fired during the200-ns intensification gate producing a formalde-hyde LIF image with negligible contribution ofpotential chemiluminescenceeemission. Thetiming of the LIF image (first image acquired) wasvaried in order to cover the fuel decompositionphase whose beginning was considered to be thecrank angle of first CH20 detection. For the 15 following images, the timing of acquisi-tion was adjusted to cover the early stage of com-bustion development and in particular the onset ofauto-ignition. For these chemiluminescence ima-ges the intensifier gate length was increased to5 ms. In each engine configuration tested, acquisition of LIFimages were realized for 5 timings (340, 345, 350, 355and 360℃A) and repeated for 100 consecutive cyclesin order to conduct statistical data analysis. In all thetested configurations, CH20 was first detected around340℃A andfirst auto-ignition sites were observedbetween 360 and 365℃A. 2.2.3 Image post-processing LIF images were post-processed in order to correctfor: ●COptical noise due to non-filtered elastic scatteringand reflections of the LIFsignal: the correction wasperformed using a noise image acquired withoutinjection and combustion. Laser sheet inhomogeneities: the correction wasperformed using the image of an homogeneousmixture of air and vaporized biacetyl. Pulse to pulse variations of the laser energy. Moreover, the post-processing routine used in thiswork accounted for variations in either the intensifiergain setting and gate duration since the camera gaincharacteristics were previously calibrated thus per-mitting a quantitative analysis of the images acqui-red. The main bias in the quantitative analysis wasdue to the temperature variations and the their effecton the CHO fluorescence quantum yield. However, ata specific crank angle position temperature fluctua-tions within the detection plane were believed to besufficiently small to have a limited effect on the localLIF intensity signal allowing semi-quantitative CHOdistribution analysis. Finally, in order to visuallyamplify the CH20 distribution inhomogeneities a spe-cific color map ranging from 75 to 125% of the avera-ge intensity of the LIF signal in the image was appliedto the each corrected LIF images (see Figure 6). Tocomplete the analysis of the CH,0 distribution, histo-grams of the CH20 LIF intensity in each single-cycleimage were computed and averaged to form theaverage histogram of the CH20 LIF distribution. In theremain of this paper, this histogram is referred to asthe "CH20 average histogram". In the EGRB configuration with four active valves, thestandard image post-processing procedure did notprovide satisfying results in terms of optical noiseremoval. Consequently, image inhomogeneitieswhich were not related to CH,0 distribution wereremoved by dividing the single-cycle LIF images bythe normalized 100-cycle average LIF image. This pro-cedure, which has the advantage of totally removingany noise contribution to the collected LIF signal, hasthe drawback of suppressing any repeatable CH20macroscopic stratification that would normally be detected on the cycle-averaged LIF image. However,this appears not to be an issue in the test conductedin the EGRB configuration where no macroscopicstratification of the CH,O distribution exists. Figure 6: Description of the procedure of CH20 LIF image post-processing. Figure 7: Description of the chemiluminescence images post-processingprocedure(auto-ignition site detection and computation of theaverage CH2O LIF intensity inside the contours of the initialreaction zone). The chemiluminescence images were first post-pro-cessed in order to identify the image with the first sig-nificant chemiluminescence emission and then to iso-late the contour of the initial reaction zones.Eventually, using the single-cycle LIF images, the ave-rage intensity of the CH20 LIF signal collected in theareas defined by the contour of the initial reactionzones detected in the same cycle was computed (seeFigure Z). For each test, the image acquisition was performedover 200 consecutive cycles and a histogram of theaverage LIF intensity in the area bounded by the con-tour of the initial reaction zones was computed. In theremain of this paper, this histogram is referred to asthe "CH2O-reaction zone histogram". 2.2.4 Histogram analysis approach The CH20 average histogram and the CH2O-reactionzone histogram computed from the data measured inone NVO configuration test are shown in Figure 8.Comparison of both histograms on the same graphprovides a direct visual analysis of the CH20 distribu-tion and its impact on the auto-ignition process: The homogeneity of the CH20 distribution in thedetection plan at the crank angle of visualizationcan be evaluated using the width of the CH20average histogram. A correlation between the location of the auto-igni-tion sites and the CH,O distribution can be detec-ted through the relative position along the x-axisof the CH20 average histogram and the CH20-reaction zone histogram. Looking at Figure 8, it can be seen that there is a clear shift of the auto-ignition site distribution towards high-CH20 con-centration zones (class of high CH20 LIF intensity).This result indicates that auto-ignition preferablyoccurs in areas of the combustion chamberwhere the CH0 concentration is higher thanaverage. The shape of the average CH20 distribution wasexpected to provide information on the origin ofthe formaldehyde inhomogeneities. For instance,while partial mixing would create a ratherGaussian distribution, the inhomogeneitiescaused by unbalanced or saturated chemical pro-cess in the production of CH20 may have led to anasymmetric CH 0 distribution. However, in thiswork asymmetries in the CH20 distribution weresolely attributed to imperfect removal of the opti-cal noise (see Figure 8). The image post-processing was completed with aplot of the location of the centers of the initial reactionzones observed over 200 consecutive cycles (seeFigure 8). Figure 8:Example of CH20 average histogram and CH2O-reactionzone histogram. The histogram analysis which has previously beendescribed does have a number of inherent limitationsthat may alter the technique ability to detect anypotential correlation between the CH,0 distributionand the location of the initial reaction zones: LIF images provide information on the CH20distribution in the detection plan formed by thelaser sheet while the direct observation imagesdisplay any reaction zones detected in the com-bustion chamber volume. There is a delay between the LIF image acquisitionand the detection of the initial reaction zones.Depending on the acquisition configuration(timing of the LIF image) the time delay can varyfrom 1 to 20℃A. If a significant in-cylinder aero-dynamic flow exists, the charge motion can signi-ficantly affect the CH0 distribution between theLIF acquisition and the onset of auto-ignition. The statistical analysis is performed over a 100-cycle data set from which are removed all the data acquired during cycles where auto-ignition firstoccurs outside the CH,0 detection zone. Figure 9:Description of the engine configurations and running conditionstested. 2.3 Engine and imaging configurationtested The engine configurations tested and discussed inthis work are presented in Figure 9: NVO configuration with symmetric port fuelinjection. DNVO configuration with asymmetric injection. Inthis case fuel is injected into one intake port, resul-ting in in-cylinder fuel stratification. ●EGRB configuration with diagonal valve deactiva-tion. This valve strategy creates a strong swirlmotion during the intake stroke and is known toallow for the lowest load operation while usingexhaust gas re-breathing. EGRB configuration with four active valves. In the EGRB configuration, tests were conducted atthe minimum volumetric efficiency (0.39) at whichstable CAl operation could be maintained. In the NVOconfiguration, the volumetric efficiency of 0.3 corre-sponds to a stable mid-range CAl operation. Imageacquisition was performed with LIF image timingvarying from 340 to 360°CA. Due to the low formal-dehyde concentration in the combustion chamberbefore 350CA, the LIF image signal to noise ratio wasin general very low for CH20 images acquired at 340and 345℃A, thus limiting the analysis to imagesacquired from 350°CA onward. 3 Result Analysis 3.1 Evolution of the average CH,O LIFsignal 3.1.1 Comparison of PRF65 and Euro95 fuels To achieve a proper detection of CH,0 with the LIF355technique,it is necessary to use a non-fluorescentfuel such as a Primary Reference Fuel (PRF) in order to avoid any unwanted contribution to the collectedsignal that could results from the fluorescence of aro-matics or other fluorescing compounds contained incommercial fuels such as Euro95. As a consequence,PRF fuels are very often used to conduct LIF measu-rements in gasoline engines. In the case of CAl ope-ration, it was shown that in the tested running condi-tions PRF65 exhibits similar auto-ignition delays andheat release rates to those measured with Euro95gasoline[5]. During the period preceding auto-ignition, fuel mole-cules thermally decompose to form intermediate spe-cies. During this phase, the formation of auto-ignitionprecursors may be strongly dependant on the fuelcomposition. Figure 10 shows the evolution of theCH20 LIF intensity during one engine cycle in theNVO configuration for both PRF65 and Euro95 fuels.With both fuels it can be seen that the LIF signal cle-arly exhibits a peak just before the combustion TDC.This peaks which spreads from 340 to 360℃A corre-sponds to the formation of formaldehyde in the peri-od preceding auto-ignition. Excluding the contribu-tion of the fuel fluorescing compounds in the case ofEuro95, the peaks observed with both fuels are verysimilar and therefore it may be concluded that PRF65is a suitable fuel to study the process of auto-ignitionprecursor formation using CH2O LIF. Moreover, theresults shown in Figure 10 confirms that the CH,Odetection using the LIF355 technique provides a goodindicator of the low-temperature chemistry in theperiod preceding the heat release phase. Figure 11 shows the evolution of the CH,O LIF inten-sity during one engine cycle for the EGRB configura-tion. As observed for the NVO configuration, a peakcorresponding to the formation of CH20 can be clear-ly identified in the 20CA period preceding combus-tion. Figure 10: Evolution of the CHO LIF intensity during one engine cycle in theNVO configuration- Comparison between Euro95 and PRF65 fuels(1200 rpm, vol. efficiency0.3, equivalence ratio 0.9). As shown in Figure 12, in the tested running condi-tions formaldehyde formation starts just after 340°CAand the CH2O concentration reaches a maximum atabout 360℃A, just before the onset of auto-ignition.With both fuels, the LIF intensity curves show that theCH20 concentration first increases slowly between340-350CA. The rate of CH20 production appears toincrease until the maximum concentration is reached.As the LIF signal intensity plotted in Figure 12 is ave-raged over the entire image, the change in the rate ofCHO formation may be due to either a local accele-ration of the fuel decomposition process or an exten- Figure 11: Evolution of the CH2O LIF intensity during one engine cycle in theEGRB configuration (1200 rpm, vol. efficiency 0.39, equivalenceratio 0.9, fuel PRF65). sion of this process from a limited area to the entirecombustion chamber. For both fuels, the rate at which CH0 is consumedappears to be much greater than the rate of CH20 for-mation. Simultaneous direct observations of the com-bustion and pressure trace analysis have shown thatthe start of CHO consumption corresponds to theonset of auto-ignition which was identified by che-miluminescence emission and heat release. Figure 12: Evolution of the CH2O LIF intensity during the phase precedingauto-ignition -Comparison between Euro95 and PRF65 fuels (1200rpm, vol. efficiency 0.3, equivalence ratio 0.9, NVO configuration). Figure 13: Evolution of temperature, CH20, iso-octane and n-heptane molarfraction during the CAl combustion process simulated withChemkin (1200 rpm, vol. efficiency 0.3, equivalence ratio 0.9,residual gas fraction 45%, fuel PRF65). Overall it can be concluded that no "cool flame"(associated with a period of heat release distinct from the main combustion phase) was detected in CAl ope-ration. However,a phase of low-temperature fueldecomposition resulting in the formation of auto-igni-tion precursors was clearly identified in the 2~3 msperiod preceding the onset of auto-ignition. This fueldecomposition phase is characterized by the forma-tion of CH20 and is not associated with any detec-table heat release. 3.1.2 Comparison with Chemkin Simulation A simulation of the CAl combustion process was con-ducted using Chemkin software for operating condi-tions similar to those tested in the NVO configuration:vol. efficiency0.3, equivalence ratio 0.9, residual gasfraction 45%, fuel PRF65. As shown in Fiqure 13, thecomputed evolution of the CH20 molar fraction clear-ly shows that formaldehyde is formed during a 2-milliseconds (~15℃A) period preceding the tempera-ture rise resulting from the main oxidation process.Moreover, as observed in the LIF experiments, thecomputation results show that the main heat releaseis associated with the rapid consumption of the CHOformed by fuel decomposition prior to auto-ignition.These results confirm that formaldehyde can be usedas a tracer of the chemical activity in the period pre-ceding auto-ignition of hydrocarbons in CAl-like con-ditions. 3.1CH,Odistribution in the NVOconfiguration For the NVO configuration with symmetric port fuelinjection, the CH20 average histograms and theCH2O-reaction zone histograms are shown in Figure8, Figure 14 and Figure 15 for the LIF images obtainedat crank angles of 350, 355 and 360° respectively. Forthe three timings of CH,0 observation, a clear shift inthe CH2O-reaction zone histogram towards higherCH,O concentration zones can be observed. Theseshifts indicate that the initial auto-ignition zones arepreferably located in areas of the combustion whichcorrespond to high formaldehyde concentration. Thissystematic correlation between the location of auto-ignition sites and the CH,0 distribution confirms onceagain that CH2O is a key intermediate specie in theauto-ignition process, and that locally higher thanaverage CH20 concentration is always associatedwith a shorter ignition delay. It can therefore be con-cluded that the local thermodynamic conditions andmixture characteristics which are favourable to CH,Oformation are responsible for shorter local ignitiondelay and therefore for the location of the auto-igni-tion sites in the combustion chamber. The correlation between the location of the initialreaction zones and the highly CH2O-concentratedareas exist for observations of the CH,0 distributionat 350, 355 and 360°CA. This shows that the areaswhere formaldehyde first appears are characterizedby higher than average CH0 concentration duringthe whole fuel decomposition period. Consequently,it appears that the mixing process occurring duringthe intake and compression strokes and responsible for the air /fuel /burned gas mixture quality determi-nes the location of the areas where fuel first decom-poses and where auto-ignition subsequently occurs.In experiments performed under similar CAl engineoperating conditions and previously reported in theliterature [5], it was shown that the location of theauto-ignition sites was at least partly correlated withthe areas of the combustion chamber with high fuelconcentration. Accordingly, it may be concluded thatthe inhomogeneities in the fuel distribution are part-ly responsible for the location of the CH20 high con-centration zones and the initial reaction zones. As theformation of formaldehyde results from the fuel ther-mal decomposition, it is expected that the tempera-ture field resulting from the fresh air/ residual gasmixing process may also significantly affect the CH20distribution. Figure 14: CH20 average histogram and CH2O-reaction zone histogram.LIF images acquired at 355℃A (1200 rpm, vol. efficiency 0.3,equivalence ratio 0.9, NVO configuration). Figure 15: CH20 average histogram and CH2O-reaction zone histogram.LIF images acquired at 360℃A (1200 rpm, vol. efficiency 0.3,equivalence ratio 0.9, NVO configuration). Asymmetric injection using only one intake port forfuel delivery enhances local inhomogeneities of thefuel distribution and concentrates the fuel rich areason the side of the combustion chamber where theactive injector is located [5]. Therefore, investigatingthe CH,0 distribution in the case of asymmetric portfuel injection may provide an additional insight onthe impact of fuel field homogeneity on the forma-tion of auto-ignition precursor. Figure 16 shows the Figure 16: CH20 average histogram and CH2O-reaction zone histogram. LIF images acquired at 355℃A (1200 rpm, vol. efficiency 0.3,equivalence ratio 0.9, NVO configuration with asymmetric port fuelinjection). CH20 average histogram and the CH2O-reaction zonehistogram based on LIF imaging at 355℃A for thecase of asymmetric port fuel injection in the NVO con-figuration. As for the case of symmetric port fuelinjection, the shift between both histograms clearlyshows that there is a strong correlation between thelocation of the auto-ignition sites and the areas withhigh formaldehyde concentration.Figure 1Z revealsthat the correlation between the CH,0 distributionand the location of initial reaction zones exists for allthe CH20 imaging angles, from 340℃A where the for-mation of CH,O is first detected until 360°℃A whichcorresponds to the maximum CH20 concentration.Moreover, from the plot of the location of auto-igni-tion sites centers (see Figure 16) it can be seen thatthe initial reaction zones are preferably located on theside of the combustion chamber where the fuel isintroduced which corresponds to the zone wherefuel-rich inhomogeneities are located. Figure 17: Evolution of the CH20 distribution in the combustion chamber andinside the contour of the initial reaction zones, during the phasepreceding auto-ignition and heat release (1200 rpm, vol. efficiency,equivalence ratio 0.3, NVO configuration with asymmetric port fuelinjection). Figure 17 shows the evolution of the CH,O distribu-tion between 340 and 360°CA in the case of asymme-tric port fuel injection. The diminution of the width ofthe CH2O average histograms between 340 and360°CA reveals a clear homogenization of the CH20field during the 20℃A period preceding the onset ofauto-ignition. Overall, the evolution of the CH20distribution may be explained by the followingsequence: The formation of CH20 very probably begins inthe areas with high fuel concentration and wheretemperature has reached the threshold abovewhich fuel starts to be thermally decomposed.This leads to a rather inhomogeneous CH 0 distri-bution at the beginning the precursor formationphase (see Figure 1Z). As the temperature increases during compres-sion, the fuel decomposition/CH,O formation pro-cess extend to leaner and initially cooler areas ofthe combustionchamber. Once the fuel decom-position has started in the entire combustionchamber, the CH,O distribution becomes moreand more homogeneous. Observations conducted in the NVO configurationhave shown that the CH,O field never becomesfully homogeneous and that the regions wherethe CH0 formation initially started are thosewhich reach the highest CH0 concentration be-fore the onset of auto-ignition.From these results,it may be inferred that the local maximum CH,0concentration reached during the fuel decomposi-tion phase depends on the initial fuel concentra-tion. It should be noted that in the NVO configuration withsymmetric port fuel injection, the homogenization ofthe CH20 distribution during the precursor formationphase was present but to a lesser extent due to aninitially more homogeneous fuel field. Figure 18: Examples of CH20 distribution images acquired between 345 and360°CA. Contours of auto-ignition sites observed during the samecycle are superimposed (1200 rpm, vol. efficiency 0.3, equivalenceratio 0.3, symmetric port injection) The homogeneity of the CH20 field and its evolutionduring the period preceding auto-ignition (340 to360℃A) can be directly observed in Figure 18 for the NVO configuration with symmetric injection. Theimages of Figure 18 are single-cycle shots obtainedwith CH20 LIF imaging. The color map was scaledfrom 75% to 125% of the average LIF intensity inorder to emphasize the local variations in the CH,0distribution. It appears that the maximum amplitudeof the spatial variations of the CH2O LIF intensity/con-centration are in the range of 25% of the averageCH20 concentration, which corresponds to the rangeof the fuel distribution inhomogeneities reported bythe authors in previous work [5].Moreover, thehomogenization of the CH2O field during the precur-sor formation phase can be observed from the slightdecrease of the amplitude of the CH20 concentrationspatial variations. Eventually in Figure 18, the contours of the initialreaction zones observed in the same cycle have beensuperimposed onto the LIF images. For imagingcrank angles in the 350 to 360°interval, the signal tonoise ratio is sufficiently high for the data to providevisual evidence of the correlation between the highlocal CH,0 concentration and the location of the firstreaction zones. Figure 19: CH20 average histogram and CH2O-reaction zone histogram.LIF images acquired at 355℃A (1200 rpm, vol. efficiency 0.39,equivalence ratio 0.9, EGRB configuration with asymmetric portinjection and diagonal valve deactivation). 3.2CH,0 distribution in the EGRBconfiguration 3.2.1 EGRB configuration with diagonalvalve deactivation For the EGRB configuration with diagonal valve deac-tivation, the CH20 average histogram and the CH2O-reaction zone histogram based on LIF imaging at355℃A are shown in Figure 19. Looking at the widthof the CH20 average histogram and at the single-shotLIF image displayed in Figure 19, it appears that theCH O field is much more homogeneous in this EGRBconfiguration than in the previously discussed NVOconfigurations. This result corroborates direct obser-vations of the combustion conducted under similaroperating conditions and showing that the combus- tion zone identified by the chemiluminescence emis-sion is truly homogeneous in the EGRB configuration(see ref.[5]). The homogeneous CH20 distribution observed in theEGRB configuration implies that the air/fuel/residu-al gas mixture is much more homogeneous than inthe tested NVO configurations. This difference in mix-ture quality obtained with the two residual gas strate-gies is very probably due to enhanced aerodynamicmotion which favours gas mixing in the EGRB confi-guration. The specific air motion resulting from thesimultaneous opening of the exhaust and intake val-ves and the increased air flow rate used in the EGRBconfiguration may be responsible for enhancing theinternal aerodynamic field. As in the NVO configuration, the comparison of theCH20 average histogram and the CH2O-reaction zonehistogram based on LIF imaging at 355℃A showsthat the auto-ignition sites are preferably located inthe areas of the combustion chamber with higherthan average CH,0 concentration. This results whichimplies that the high CH20 concentration zones haveshorter auto-ignition delay is observed even thoughthe formaldehyde distribution is rather homogeneousin the EGRB configuration. 3.2.1 EGRB configuration with four activevalves For the EGRB configuration with four active valves,the CH20 average histograms and the CH2O-reactionzone histograms are shown in Figure 20, Figure 21,Figure 22, Figure 23 and Figure 24 for LIF imaging at340, 345, 350,355 and 360℃A respectively. For thisconfiguration, the LIF data were corrected using theaverage LIF image at each visualization angle. Thisprocedure allows a complete removal of the opticalnoise and thus enable LIF data analysis at 340 and345CA where the signal to noise is relatively low.From these results, it appears that: ●For CH,0 observations conducted between 350and 360℃A, a clear correlation between the highCH,O concentration areas and the location of thefirst reaction zones can be observed. The shiftbetween the CHO average histogram and theCH2O-reaction zone histogram shows that thecorrelation between the CH,O field and the auto-ignition sites becomes more and more significantas the CH,O distribution is observed closer to theonset of auto-ignition (~361℃A). As in the NVOconfiguration and EGRB configuration with dia-gonal valve deactivation, the importance of thefuel decomposition phase and of CH20 formationin the auto-ignition process is clearly established. The CH20 distribution observed at 340 and 345°CAis not correlated to the auto-ignition sites location.This absence of correlation may have two origins: a strong aerodynamic flow is responsible for asignificant convection of the CH20 fieldbetween the crank angle of LIF imaging and thedetection of the auto-ignition sites. ●Due to the rather homogeneous CH2O field andthe low signal to noise ratio in the LIF image,the number of "samples"/imaged cycles maynot be sufficient to have statistically significantdata. The width of the CH20 average histograms and at itsdiminution between 340 and 360°℃A, confirms that: ●As for the EGRB configuration with diagonal valvedeactivation the CH,0 distribution is much morehomogeneous than in NVO configurations. Onceagain, this result indicates that the specific valveactuation used in the EGRB configuration has apropensity to create a very homogeneous air /fuel/burned gas mixture. There is a significant homogenization of the CH2Odistribution during the 20℃A period preceding theonset of auto-ignition. However, the CH2O field isnot fully homogeneous at the time of auto-igni-tion since aa correlation can be establishedbetween the location of the initial reaction zonesand the CH,O field observed at 360CA, just a fewdegree crank angle before the onset of auto-ignition. Figure 20: CH2O average histogram and CH2O-reaction zone histogram.LIF images acquiGYred at 340℃A (1200 rpm, vol. efficiency 0.39,equivalence ratio 0.9, EGRB configuration with symmetric portinjection and four-active valves). Figure 21: CH20 average histogram and CHO-reaction zone histogram.LIF images acquired at 345℃A (1200 rpm, vol. efficiency 0.39,equivalence ratio 0.9, EGRB configuration with symmetric portinjection and four-active valves). Figure 22: CH20 average histogram and CH2O-reaction zone histogram.LIF images acquired at 350℃A (1200 rpm, vol. efficiency 0.39,equivalence ratio 0.9, EGRB configuration with symmetric portinjection and four-active valves). Figure 23: CH2O average histogram and CH2O-reaction zone histogram.LIF images acquired at 355℃A (1200 rpm, vol. efficiency 0.39,equivalence ratio 0.9, EGRB configuration with symmetric portinjection and four-active valves). Figure 24: CH20 average histogram and CH2O-reaction zone histogram.LIF images acquired at 360℃A (1200 rpm, vol. efficiency 0.39,equivalence ratio 0.9, EGRB configuration with symmetric portinjection and four-active valves). 3.3 Heat release analysis Figure 25 shows the evolution of the mass-burnedfraction computed from the cylinder pressure tracesin the NVO configuration and EGRB configurationwith diagonal valve deactivation. From these curves,a clear difference in the combustion process obtained with both strategies of burned gas trapping can beidentified. The end of combustion is characterized bya slow decay of the heat release rate in the NVO con-figuration and a sudden stop of the release process inthe EGRB configuration. The differences observed inthe shape of the heat release rate in both configura-tions may have two origins. First of all, the chosenEGRB configuration significantly shortens the auto-ignition delay (see Figure 25) resulting in an advan-ced combustion phasing, which may result in anincrease of the pressure rise rate and a more rapidend of the heat release process. Secondly, the diffe-rent valve actuation strategy results in a much morehomogeneous fuel / air / burned gas mixture in theEGRB configuration. In the latter case, auto-ignitionwould occur simultaneously in a very large zonethroughout the combustion chamber volume and theglobal heat release rate would be almost only deter-mined by the chemical kinetic time scale associatedwith the oxidation reactions. This possibility is stron-gly reinforced by the very homogeneous CH,O fieldwhich was observed in the EGRB configuration andwhich infers that the mixture was rather homogene-ous in terms of equivalence ratio and temperatureprior to fuel decomposition and formation of auto-ignition precursors. Moreover, because the CH0inhomogeneities are correlated with the location ofthe initial reaction zones and thus areas with reducedauto-ignition delays the homogeneous CH,0 distribu-tion implies that auto-ignition delays are very similarthroughout the combustion chamber and that oxida-tion reactions will start quasi-simultaneously. Eventually, the suggested influence of the mixturehomogeneity and the CH20 distribution on the shapeand duration of the global heat release process isstrongly corroborated by direct observations of thecombustion which showed that in similar operatingconditions the combustion is characterized by a suc-cession of local auto-ignition events in the NVO con-figuration and a rather homogeneous reaction zonein the EGRG configuration [5]. Regarding the links between the CH20 distributionand the combustion process,it may be concludedthat: The homogeneity of the formaldehyde fieldformed during the fuel decomposition periodpreceding the heat release phase is a good indica-tor of the map of auto-ignition delays in the com-bustion chamber. The homogeneity of the air / fuel / burned gasmixture and the resulting CH20 field directlyimpact the shape of the heat release rate duringthe CAI combustion process. The sensitivity of the heat release process to theCH20 distribution and thus the mixture qualitysuggests that adequate control of the equivalenceratio and / or temperature field could be used tomoderate the heat release rate and combustionnoise in CAl operation. These results emphasize the role of the in-cylinderaerodynamic field, injection and valve actuation stra-tegies as controlling factors which influence mixturequality. 0.7peui0n.g5sss0.4e0w.3 NVO 0.50.40.1 MNHRR(1/CA) 0.272 CA of MNHRR 363.3 MNHRR(1/CA) 0.368 0.2 CA5 359.4 359.5 CA50 362.9 CA5 356.1 359 Figure 25: Evolution of the mass burned fraction in the NVO (1200 rpm, vol. efficiency 0.3, equivalence ratio 0.9)and EGRB configuration (1200 rpm, vol.efficiency 0.39, equivalence ratio 0.9). Figure 26: Description of the auto-ignition precursor formation phase in theperiod preceding auto-ignition and heat release in CAl operation.CH2O life cycle in the CAl combustion process. 4 Conclusions and Summary In this work, the formaldehyde distribution wascharacterizedduring the period preceding theonset of auto-ignition in CAl combustion. Fromthe evolution of the quantity of CH20 detected inthe combustion chamber, it was established thatin CAl operation the heat release process was pre-ceded by a fuel decomposition phase which lastsapproximately 20℃A (at 1200 rpm) and which isnot associated with any detectable heat release.This phase of the CA/ combustion process differsfrom the "cool flame"period observed in dieselHCCI operation , which is usually shorter, veryclose to the main combustion and systematicallyassociated with a heat release. Overall,l,CAI combustion can be described as aprocess which occurs in three-phases (see Figure26): Mixture preparation: the level of homogeneityof the air/fuel/burned gas mixture which maybe strongly affected by the valve actuationstrategy partly determines the combustion pro-cess. Auto-ignition precursor formation: during thisphase fuel is thermally decomposed to formintermediate species involved in the auto-igni-tion process. Locally, the mixture characte-ristics (equivalence ratio and temperature)determine the concentration of auto-ignitionprecursors and the auto-ignition delay. ● H/eat release phase: once auto-ignition has star-ted, auto-ignition precursors are rapidly con-sumed by the oxidation reactions. The analysis of the formaldehyde distribution andits evolution during the fuel decomposition phasehave shown that the CH,O field which is ratherinhomogeneous at the start of CH2O formationbecomes more and more homogeneous duringthe period preceding auto-ignition. The CH20field which can be interpreted as an image of theauto-ignition precursor distribution appeared tobe very dependant on the gas trapping and thevalve actuation strategy. It was observed to bemuch more homogeneous in the EGRB configura-tion than in the NVO operation. In both cases, theCH20 field never becomes fully homogeneousbefore the onset of auto-ignition. The evolution ofthe CH,O distribution may have two possibleorigins: ●At the end of the fuel decomposition phase, therate of CH20 production globally decreases dueto the temperature and pressure increase. ● Locally, the final CH,0 concentration is deter-mined by the initial fuel quantity/equivalenceratio. The histogram analysis of the CH20 distribution inthe detection plane and inside the contour of theinitial reaction zones showed that auto-ignitionsites are preferably located in areas of the com-bustion chambers with high CH20 concentration.This correlation was found to be systematic for alloperating conditions. Following the evolution ofthe formaldehyde distribution during the entirefuel decomposition phase it was established thatareas where CH20 is first formed are usually theareas where the highest CH20 concentration arereached and where auto-ignition first occurs. Comparing NVO and EGRB configuration results,the CH,0 distribution was directly related to thefuel / air / residual gas mixture quality and to theshape of the rate of heat release during the com-bustion process. It was established that the CH0field which results from the initial mixture qualityprovides a good indicator of the auto-ignitiondelay map in the combustion chamber volumeand thus of the simultaneity of the auto-ignitionevents at the beginning of the heat releaseprocess. In comparison to its formation, the consumption ofCH,0 in the combustion zones is very rapid (seeFigure 26). This is to be related to the fact that theformation and the consumption of formaldehyde very probably involve distinct chemical kineticschemes and/or different thermodynamic condi-tions. 5 Aknowledgment This research was conducted within the framework ofa research program funded by the GroupementScientifique Moteur (IFP, PSA and Renault) for whichfinancialSsupportis gratefullyacknowledged.Moreover the author would like to express specialthanks to Thomas Mansion (Renault), Olivier Lafay(Renault), Thierry Duverger (PSA) and ErwannSamson (PSA) for their technical support and inputs. 6 References [1] Lavy J., Dabadie J.C., Angelberger C.,Willand J., Juretzka A., Schaflein J.,Lendresse Y., Satre A., Schultz C., Kramer H.,Zhao L., Damiano L,"Innovative Ultra-low NO、Controlled Auto-Ignition Combustion Process for GasolineEngines: the 4-SPACE Project",SAE Paper 2000-01-1837, 2000. [2] Duret L., Lavy J.,"Gasoline Controlled Auto-Ignition (CA/TM):Potential and Prospects for FutureAutomotive Application", IMechEConference, 21st Century EmissionsTechnologies, 4&5 December 2000, London. [3] Lavy J., Dabadie J. C., Duret P.,Angelberger C., Le Coz JF, Cherel J.,"Controlled Auto-Ignition (CAI): a NewlyHighly Efficient and Near Zero NOEmissions Combustion Processs forGasoline Engine Application", IFPInternational Congress, November 26-272001, Editions Technip. [4] Duret P.,"Gasoline CAl and Diesel HCCI: The WayToward Zero Emission with Major Engineand Fuel Technology Challenges",SAE Paper 2002-32-1787, 2002. [5] Thirouard, B., Cherel, J., Knop, V.,"Investigation of Mixture Quality Effect onCAI Combustion", SAE Paper 2005-01-0141,2005. [6] Zhao H., Peng Z., Williams J.,Ladommatos N., "Understanding the Effectsof Recycled Burnt Gases on the ControlledAutoignition (CAl) Combustion in Four-Stroke Gasoline Engines",SAE Paper 2001-01-3607,2001. [7] Chen R., Milovanovic N., Turner J.,Blundell D.,"The Thermal Effect of Internal, Exhaust Gas Recirculation on ControlledAuto Ignition", SAE Paper 2003-01-0751,2003. [8] Zheng J., Miller D., Cernansky N., Liu D., ( Zhang M.,"The Effect of Active Species in Internal EGRon Preignition Reactivity and on ReducingUHC and CO Emissions in HomogeneousCharge Engines", SAE Paper 2003-01-1831, 2003. ) ( [9] Yamaya, Y., Furutani, M., Ohta, Y . ,"Premixed Compression Ingnition of Formaldehyde-Doped Lean Butane/Air Mixtures in a Wide Range of Temperature", SAE Paper 2004-01-1977,2004. ) ( [101 Kashdan,J., Docquier, N., Bruneaux, G., "Effect of Piston Geometry on MixturePreparation and Combustion via LIEF and LIF of Combustion Radicals in an Optically Accessible, Direct Injection, HCCI Diesel Engine,"SAE Paper 2004-01-2945, 2004. ) [11] ( Shibata, G., Oyama, K., U rushihara, T.,Nakano, T ., "The Effect of Fuel Properties on Low and High Temperature Heat Release and Resulting Performance of an HCCI Engine", SAE Paper 2004-01-0553,2004. ) ( [12] Dec, J., Sjoberg, M., "/solating the Effects of Fuel Chemistry on Combustion Phasing in an HCCI Engine andthe Potential of Fuel Stratification for Ignition Control", SAE Paper 2004-01-0557, 2004. ) ( [13] Collin, R., Nygren, J., R ichter, M., Alden, M.,Hildingsson, L., Johansson, B.,"Simultaneous OH- and Formaldehyde-LIF Measurements in an HCCI Engine", SAE Paper 2003-01-3218, 2003. ) [14] Paul, P. H., Najm, H. N., "Planar Laser-Induced Fluorescence Imaging of Flame Heat Release Rate" 27th Symposium (Intl.) Combustion, The Combustion Institute, Pittsburg, 1998, 43-50. [15] Kashdan,J. T., Papagni, J. F., "LIF Imaging of Auto-Ignition and Combustion in a Direct Injection Diesel- fuelled HCCI Engine", SAE Paper 2005-01-3739. [16] Bockle S., Kazenwadel J., Kunzelmann T.,Shin D. I., Schulz C., Wolfrum C.,"Simultaneous Single-Shot Laser-BasedImaging of Formaldehyde, OH, andTemperature in Turbulent Flames",Proceedings of the Combustion Institute,Vol. 28, 2000, pp. 279-286. [17] Bruneaux G., Auge M., Lemenand C., "A study of Combustion Structure in High· Pressure Single Hole Common Rail Direct Injection Using Laser Induced Fluorescence of Radicals", Proc. COMODIA 2004, Yokohama, Japan, 2004. ( [18] Hildingsson, L., Persson, H., J ohansson, B. , Collin, R.,Nygren, J., Richter, M., Alden, M.,Hasegawa, R., Yanagihara, H.,Optical Diagnostics of HCCl and Low-Temperature Diesel Using Simultaneous 2-D PLIF of OH and Formaldehyde",SAE Paper 2004-01-2949. ) [19] Zhao,H., Peng, Z.,Ma, T.,"Investigation of the HCCI/CA/CombustionProcess by 2-D PLIF Imaging ofFormaldehyde", SAE Paper 2004-01-1901. [20] Harrington,J. E., Smyth, K. S.,"Laser-Induced Fluorescence Measurementsof Formaldehyde in a methane/air diffusionflame", Chemical Physics Letters, Vol.202,number 3+4, 1993, pp196-202. ( [21] Graf N., G ronki J., S chulz C . , Baritaud T., Cherel J., Duret P, Lavy J., "In-cylindercombustion Visulization in an Auto-ignitingGasoline Engine using Fuel Tracer andFormaldehyde-LIF Imaging", SAE Paper 2001-01-1924, 2001. ) Combustion of a premixed-charge by compressionignition is a promising alternative combustion processas it allows part load operation with high dilutionrate (air and/or residual gas dilution) while preservingengine stability. This combustion process attractedattention on account of its potential for achievinghigh efficiency and ultra-low NOx emissions [1, 2, 3,4]. When using commercial gasoline as fuel, autoignitionof a premixed charge in a four-stroke enginecan be achieved with high compression ratio, inlet airheating or residual gas trapping. CAI refers to autoignitioncombustion obtained with a high proportionof burned gases trapped in the fresh mixture. In thiswork, CAI operation is achieved in an engine with acompression ratio of 11.6 running with gasoline-typefuel.While SI combustion is characterized by flame propagationand associated fast chemical reactions in aconfined reaction zone, chemiluminescence imagingstudies [5] have shown that the CAI combustion processcould be described as a large reaction zoneresulting from an auto-ignition process which occurssuccessively at various in-cylinder locations. Themechanisms which promote auto-ignition involvesboth thermal and chemical effects of the recycled burnedgases. While numerous studies have shown thatthe heating effect is predominant [6,7], other investigationsemphasized the active role of chemical specieslike CO, H2 and NO [8].
确定
还剩12页未读,是否继续阅读?

产品配置单


北京欧兰科技发展有限公司为您提供《压缩引燃发动机中甲醛检测方案(流量计)》,该方案主要用于汽车电子电器中理化分析检测,参考标准--,《压缩引燃发动机中甲醛检测方案(流量计)》用到的仪器有PLIF平面激光诱导荧光火焰燃烧检测系统、德国LaVision PIV/PLIF粒子成像测速场仪、汽车发动机多参量测试系统、LaVision SprayMaster 喷雾成像测量系统、LaVision HighSpeedStar 高帧频相机
推荐专场


汽车尾气分析仪
更多


该厂商其他方案
更多