


冷超滤或微过滤牛奶:成分差异对其凝胶功能的影响的系统比较Cold ultrafiltered or microfiltered milk retentates A systematic comparison of the effects of compositional differences on their gelation functionality
方案详情

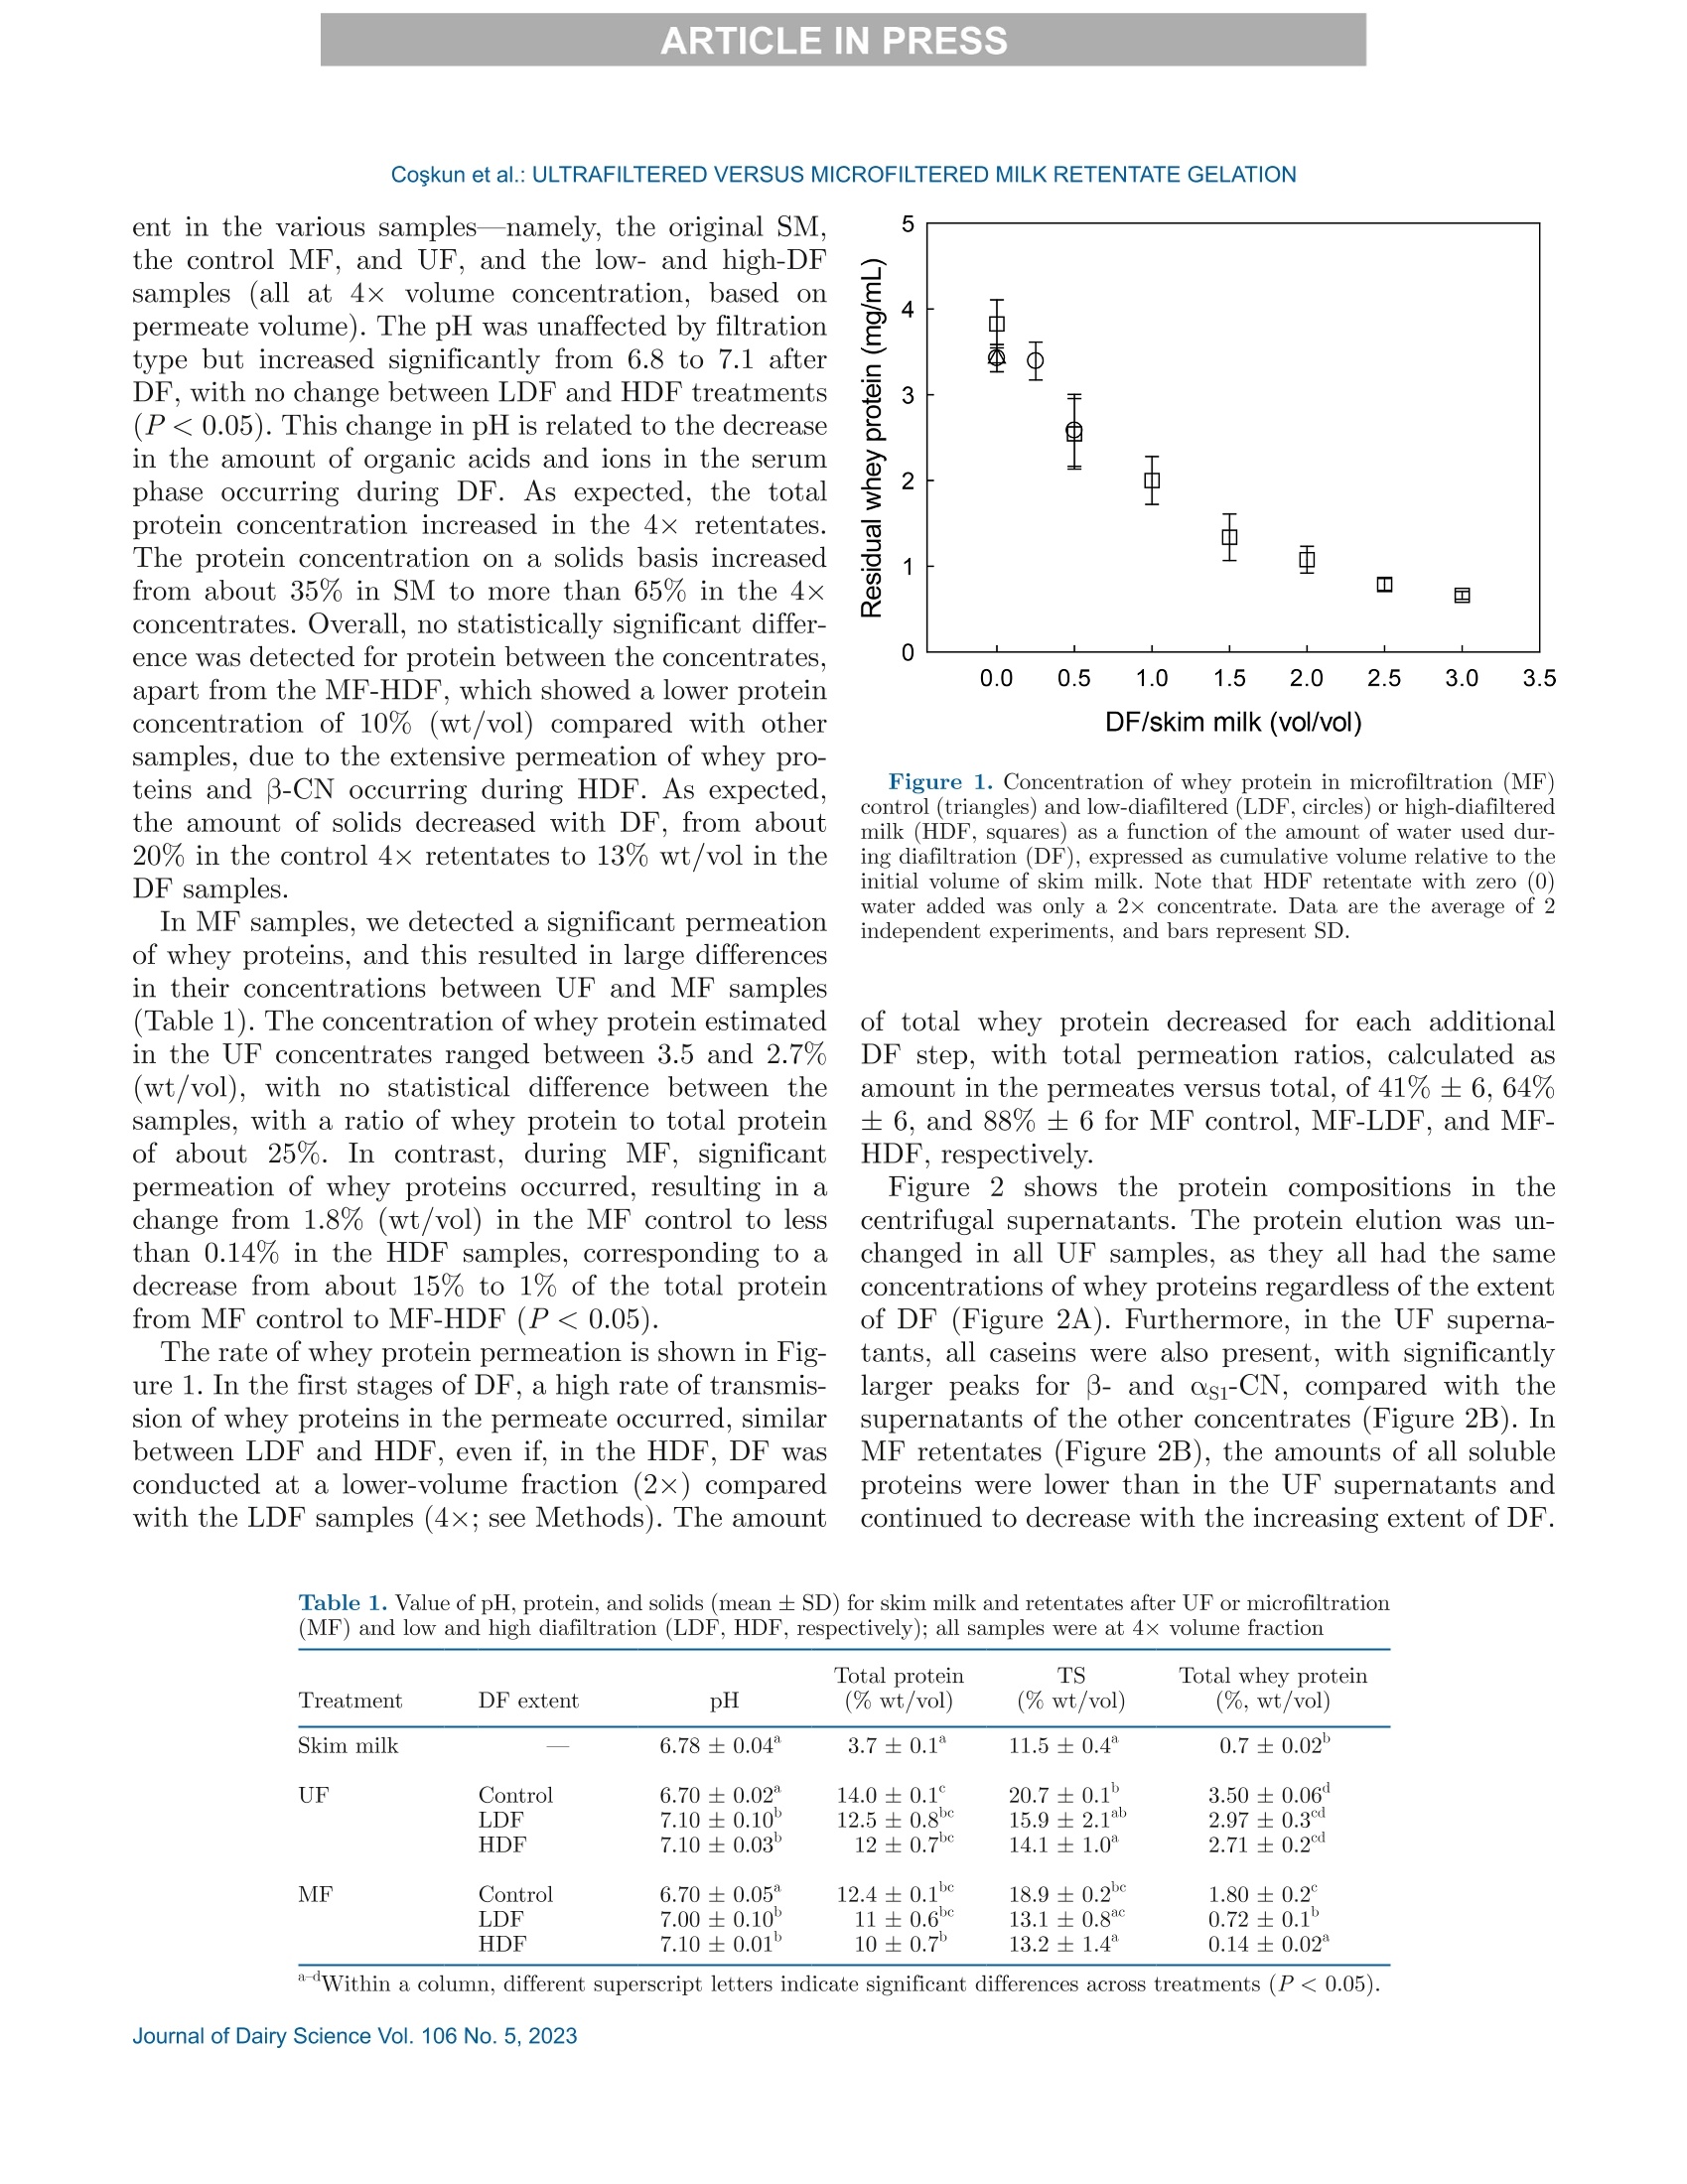
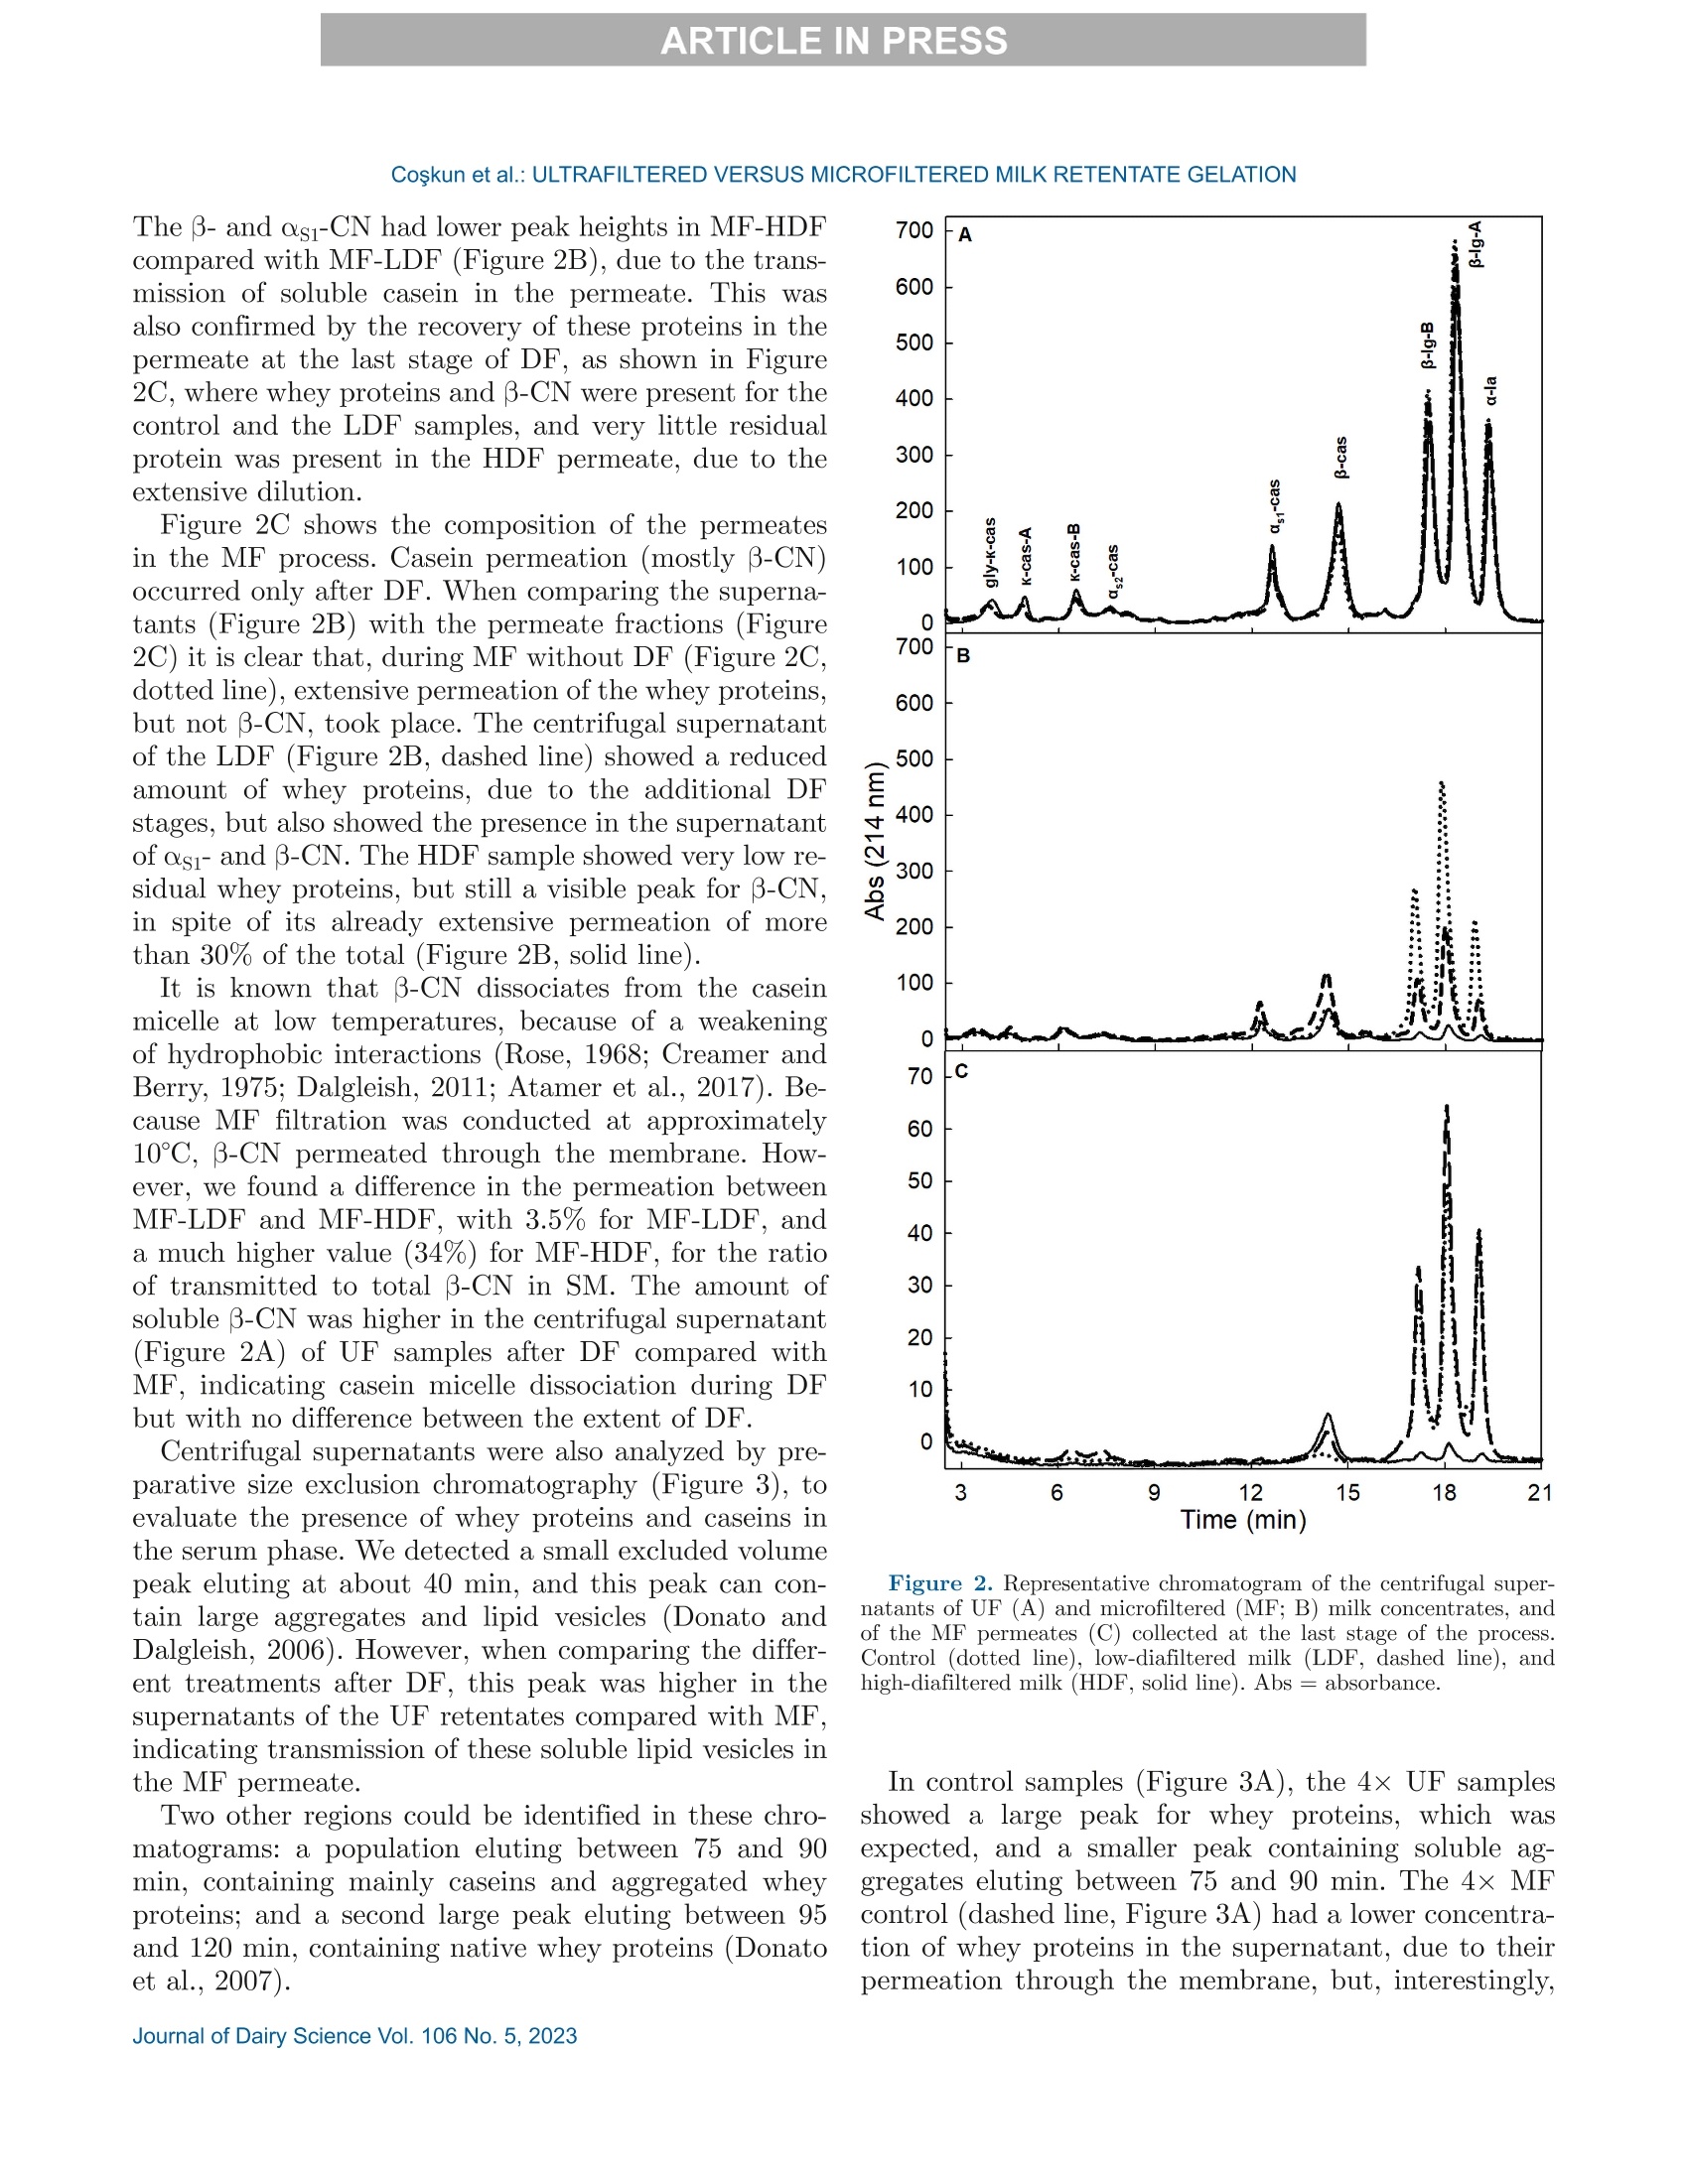
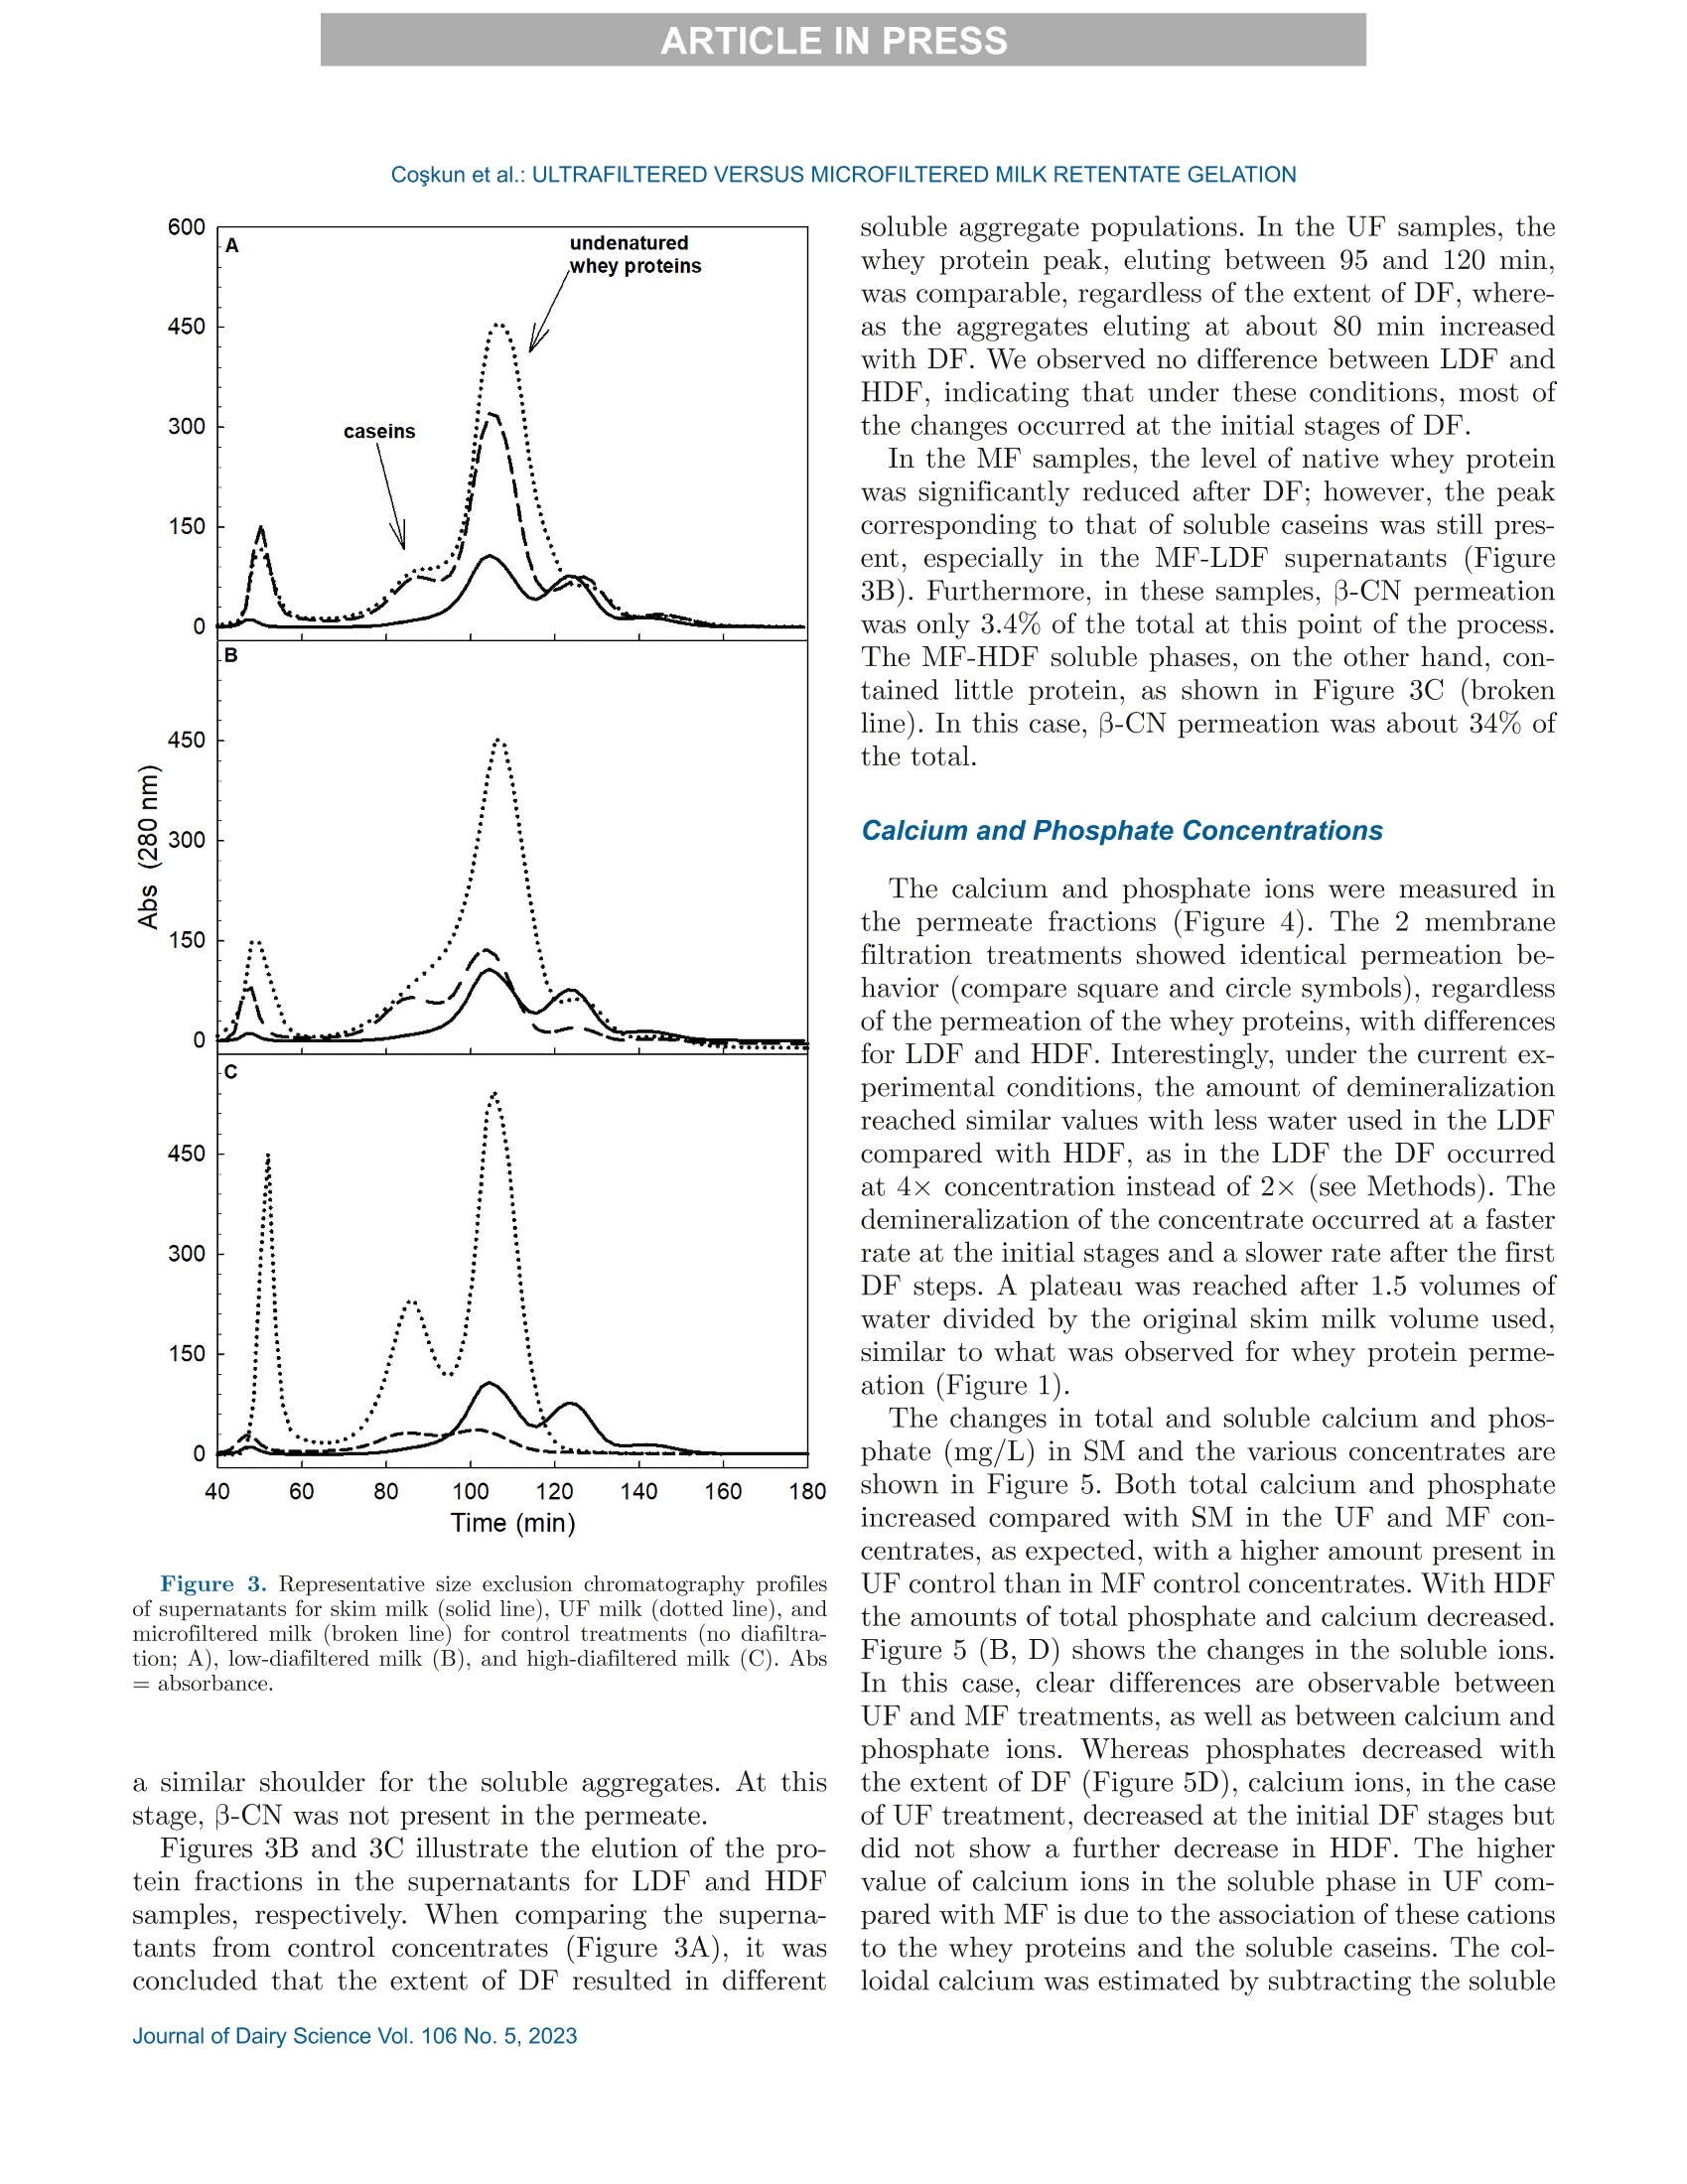
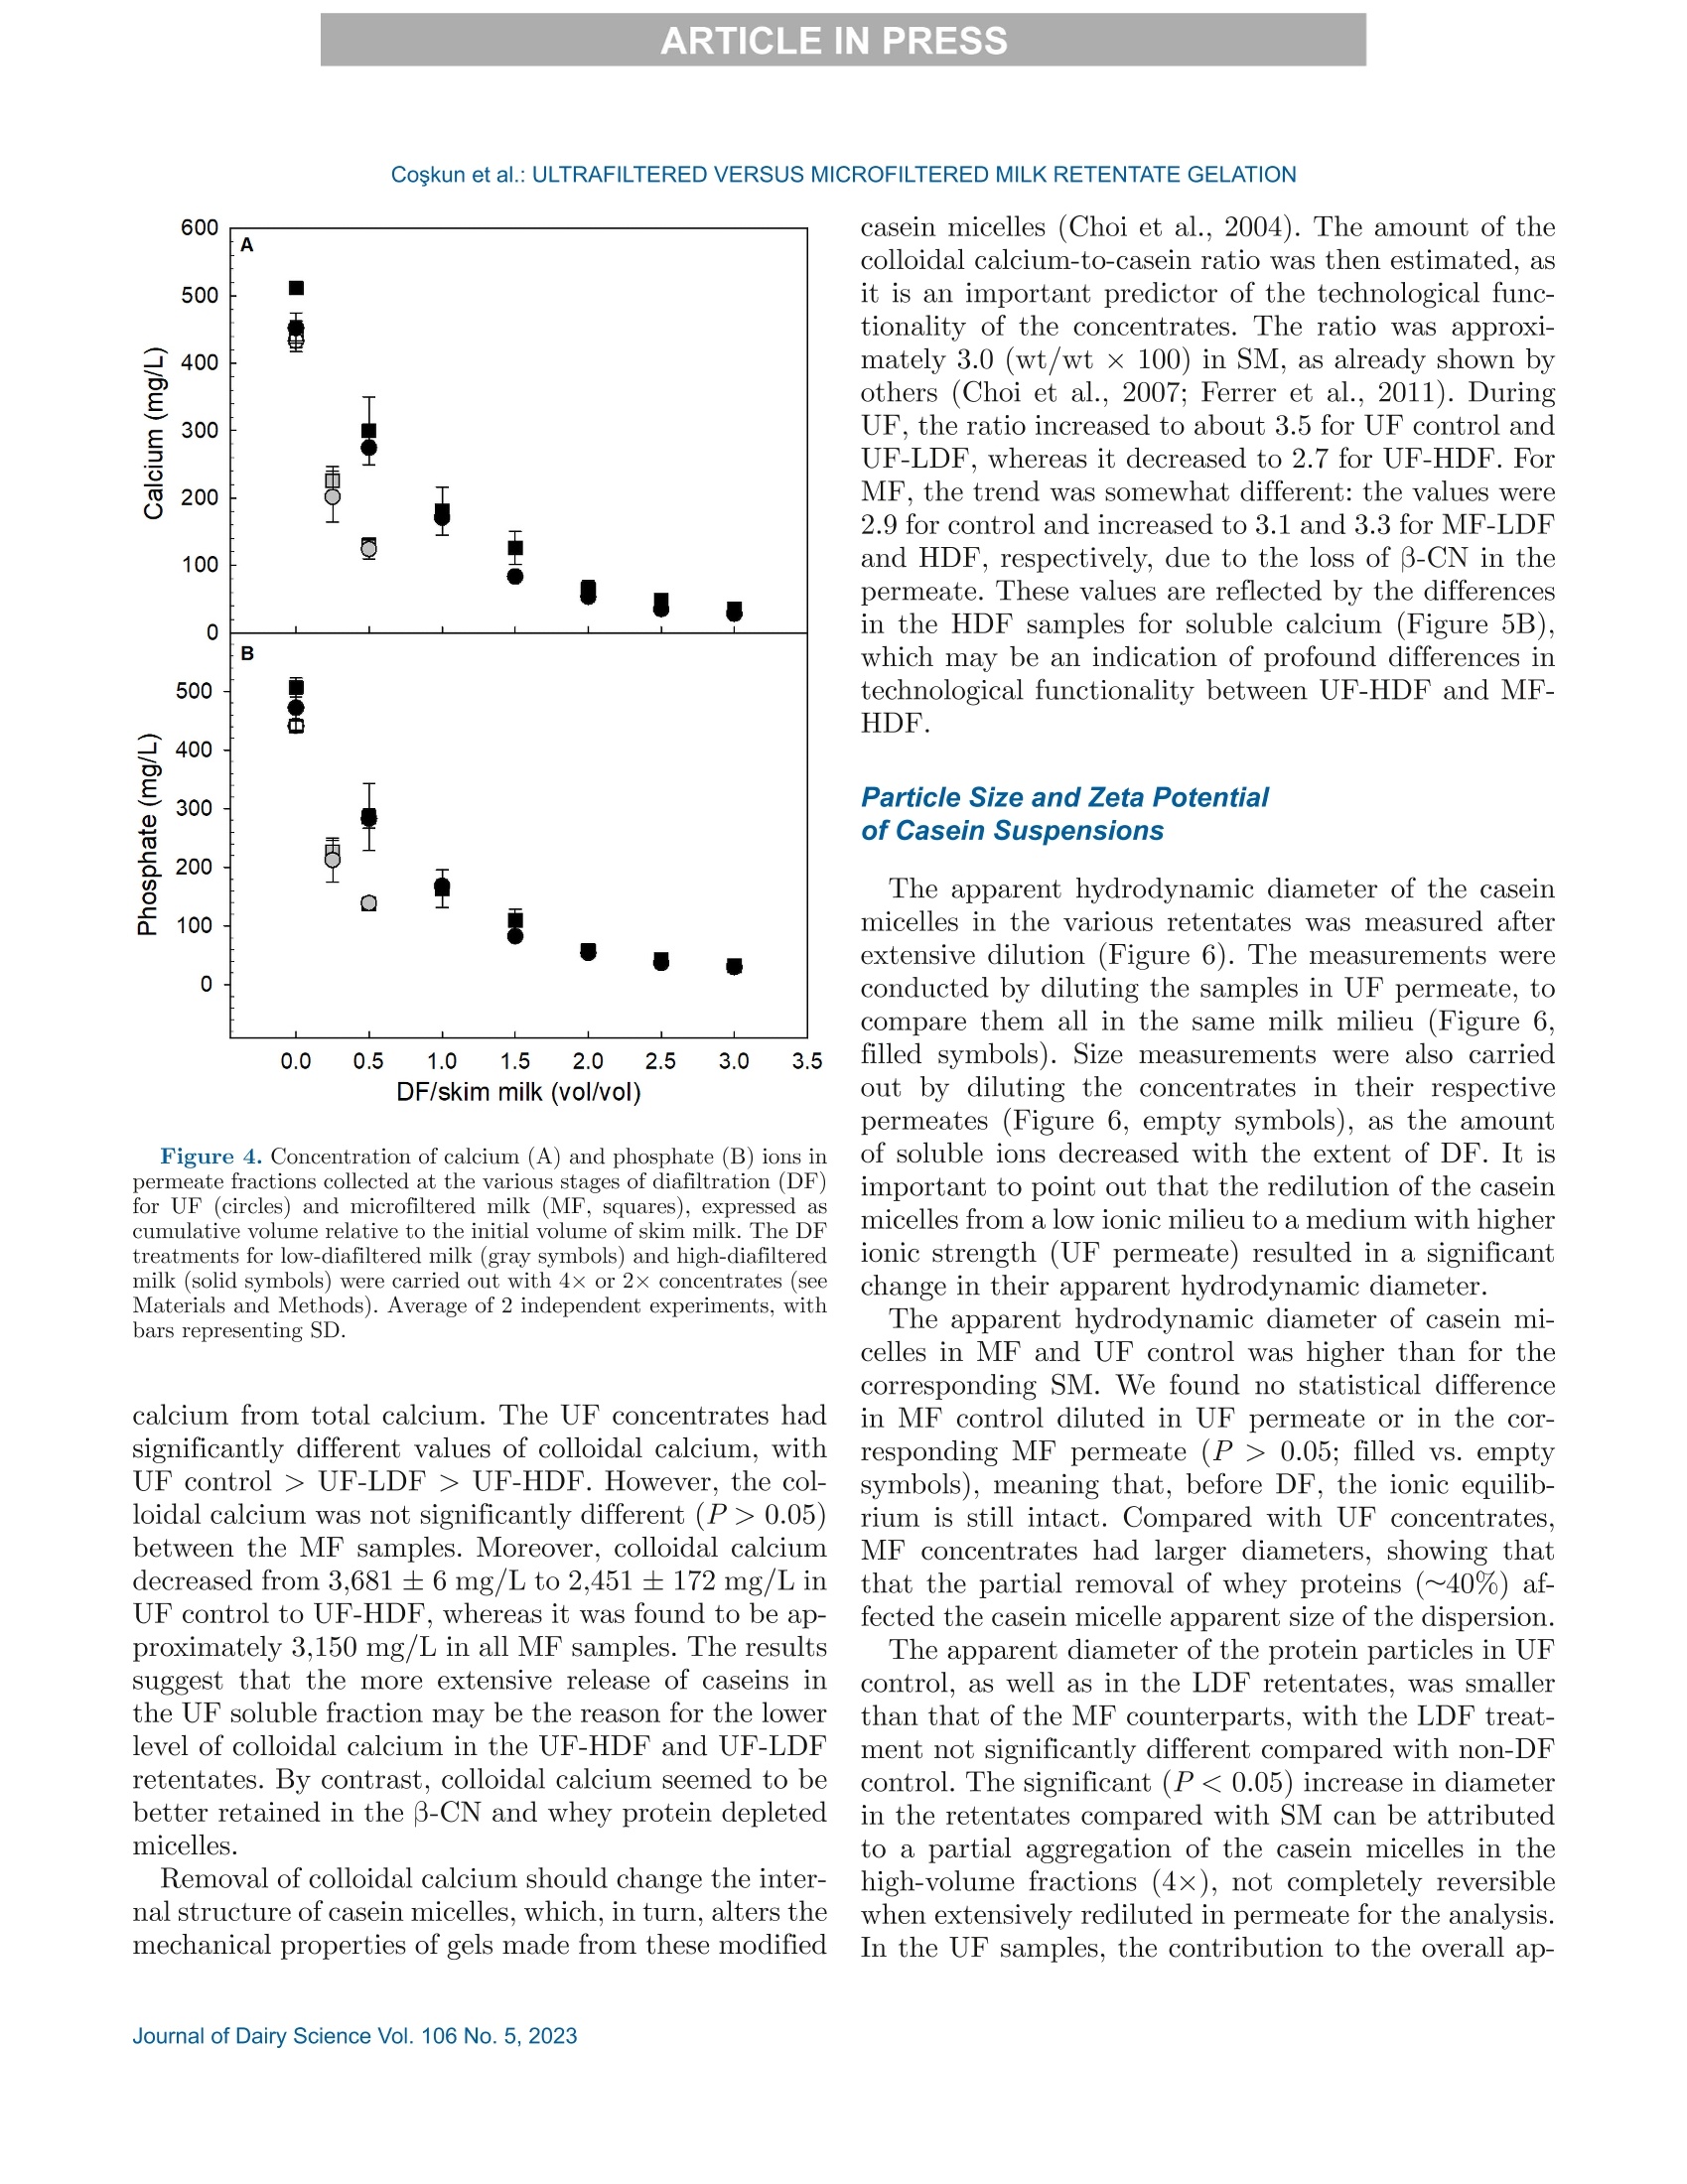
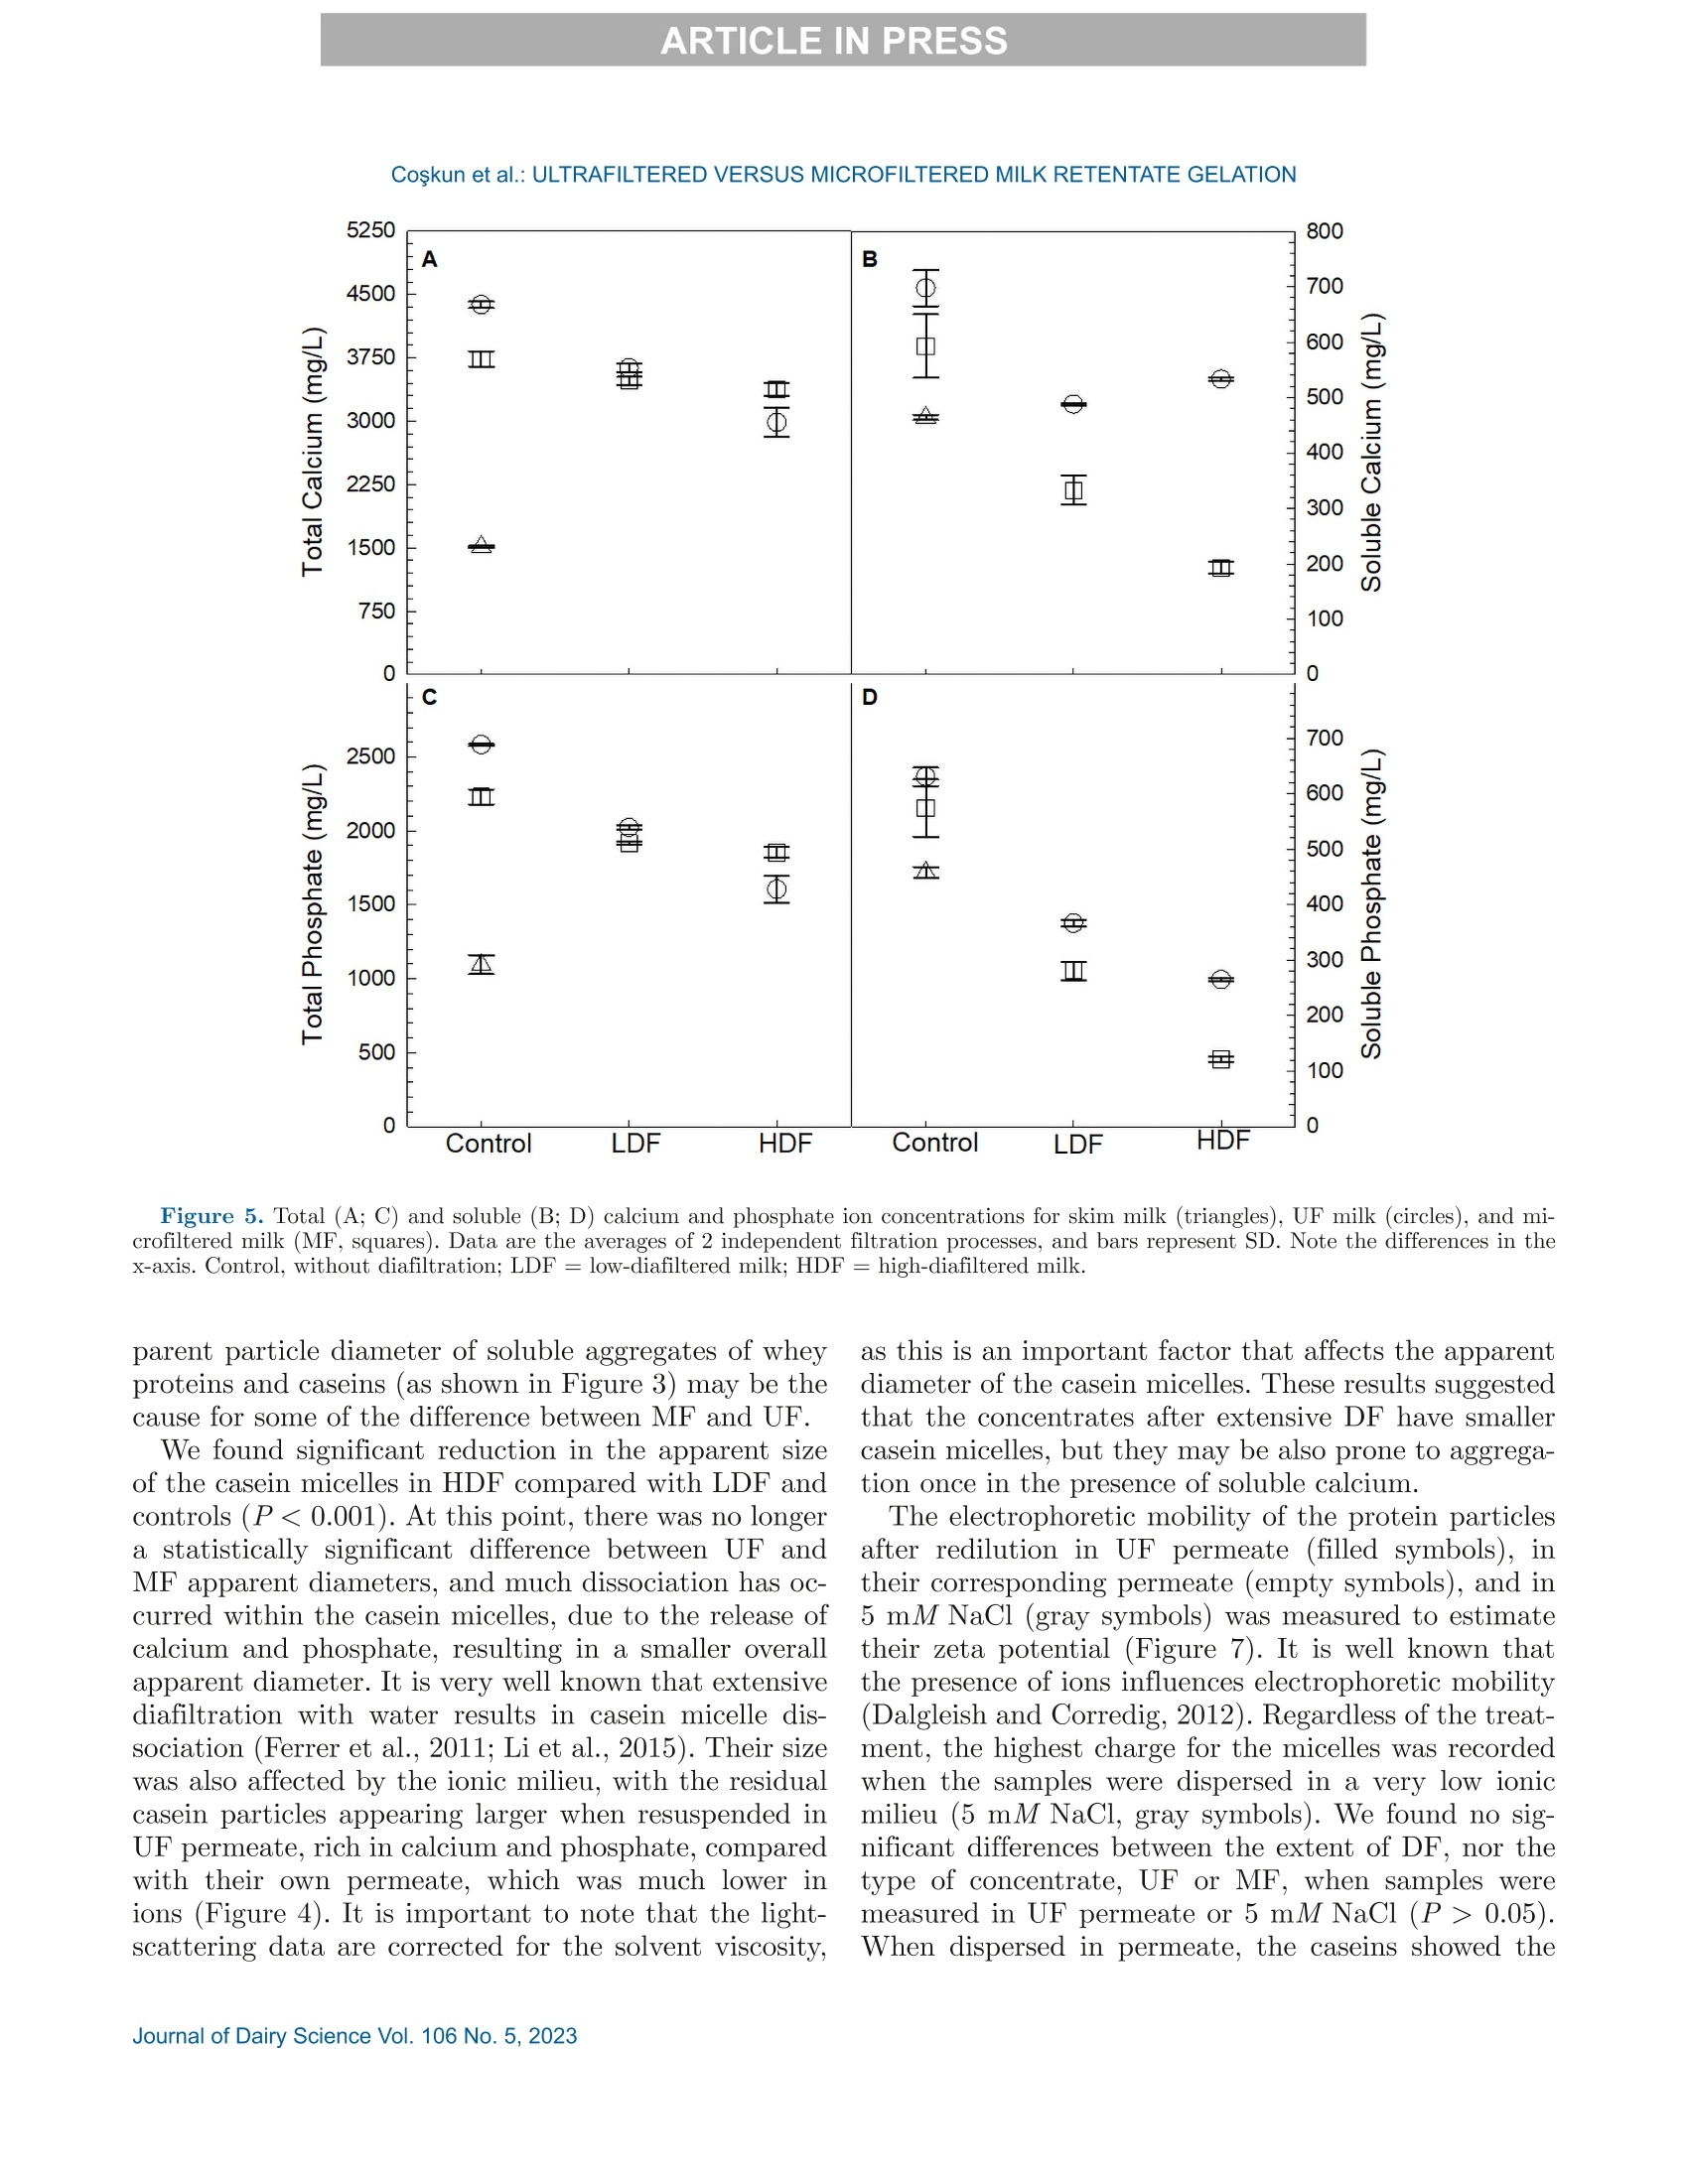
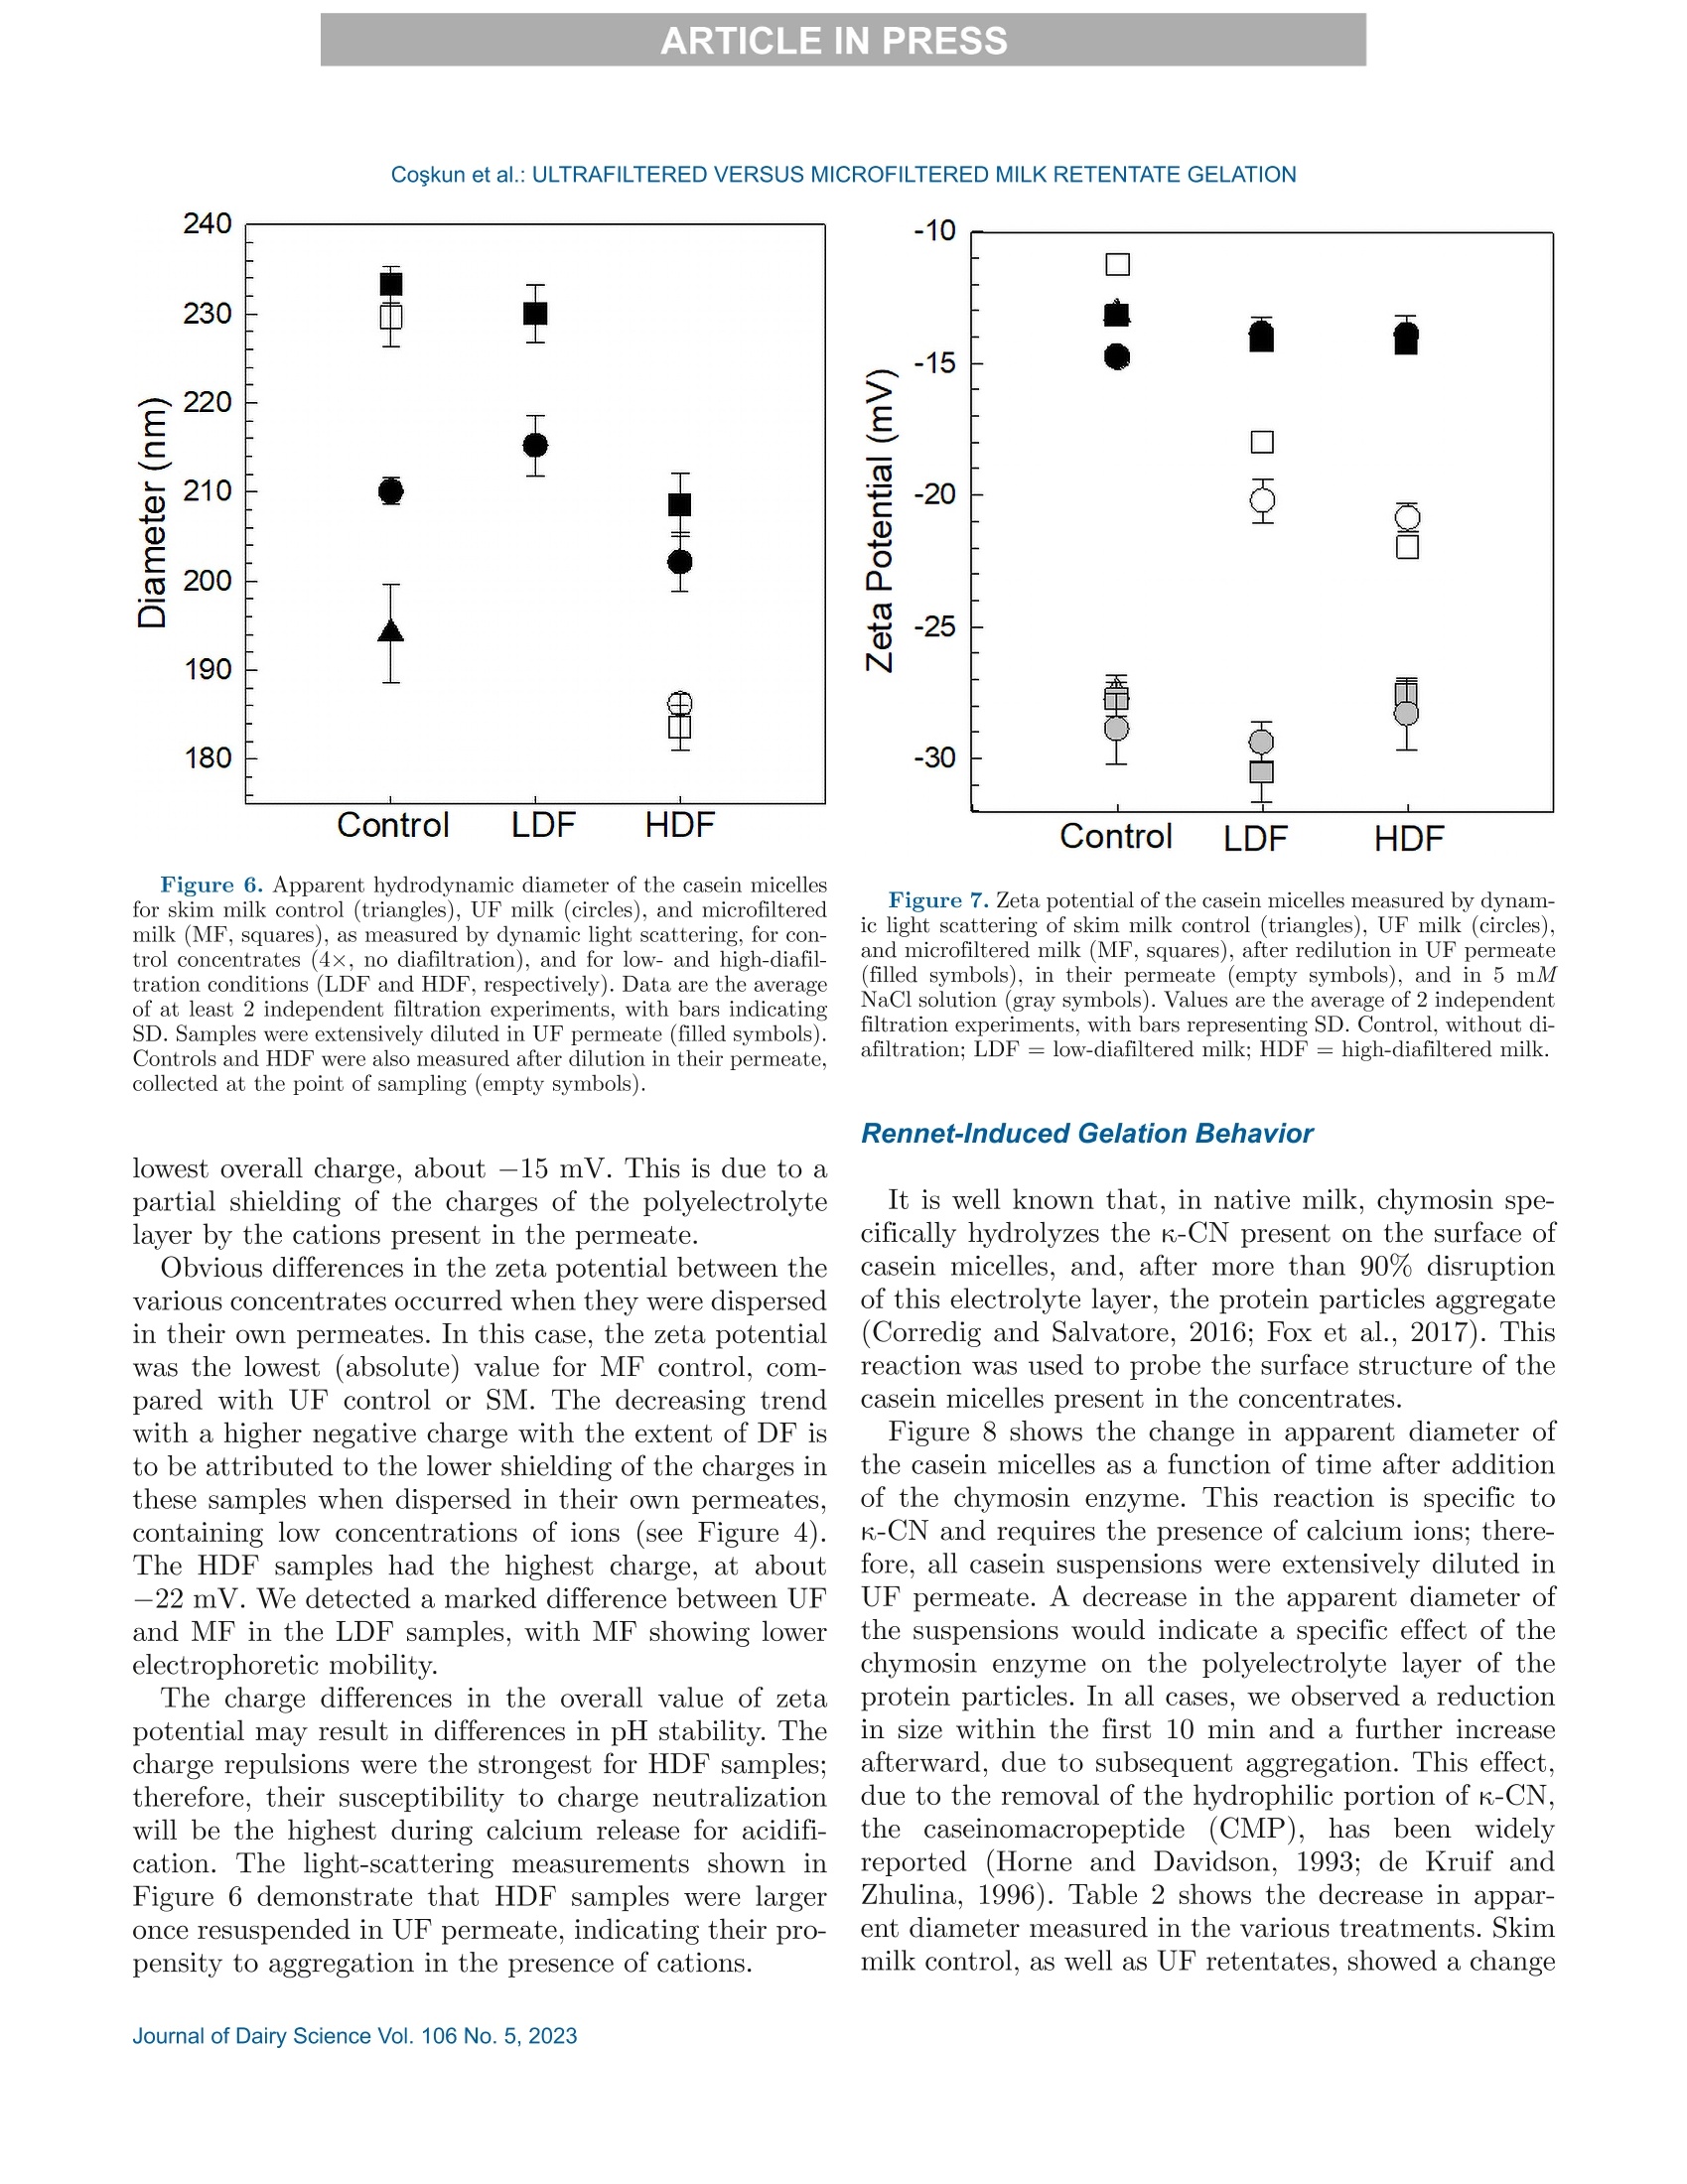
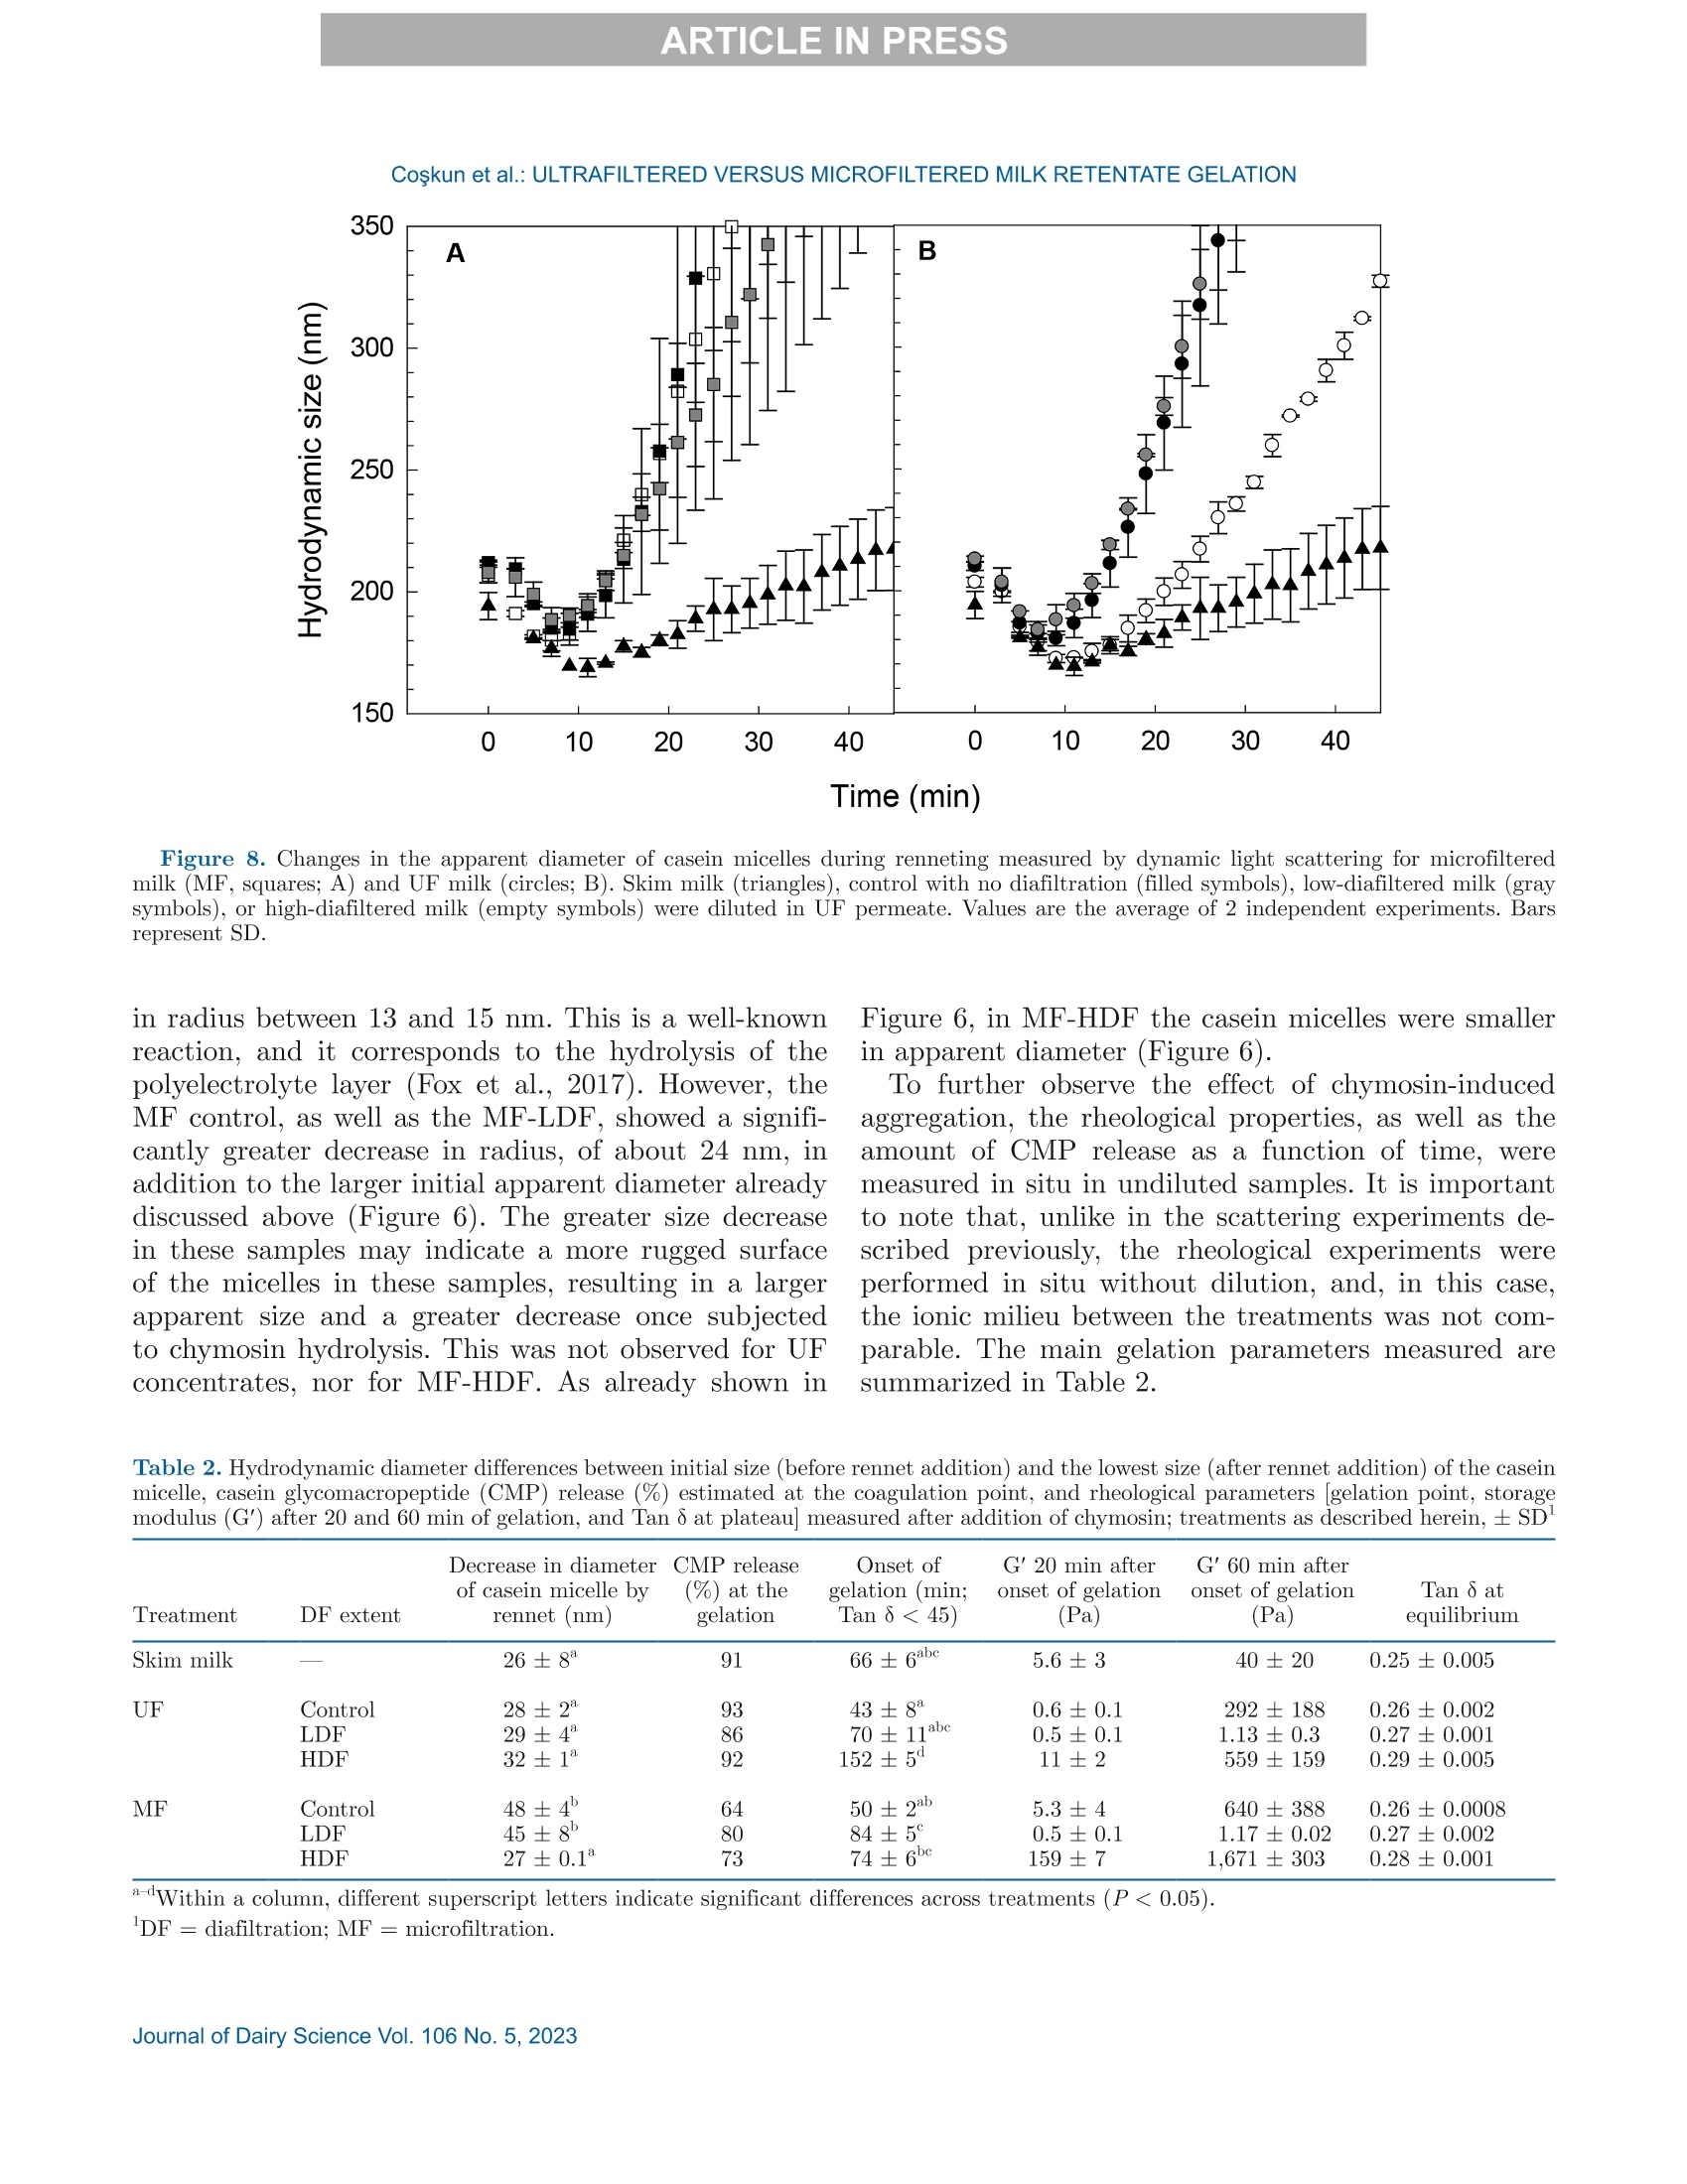
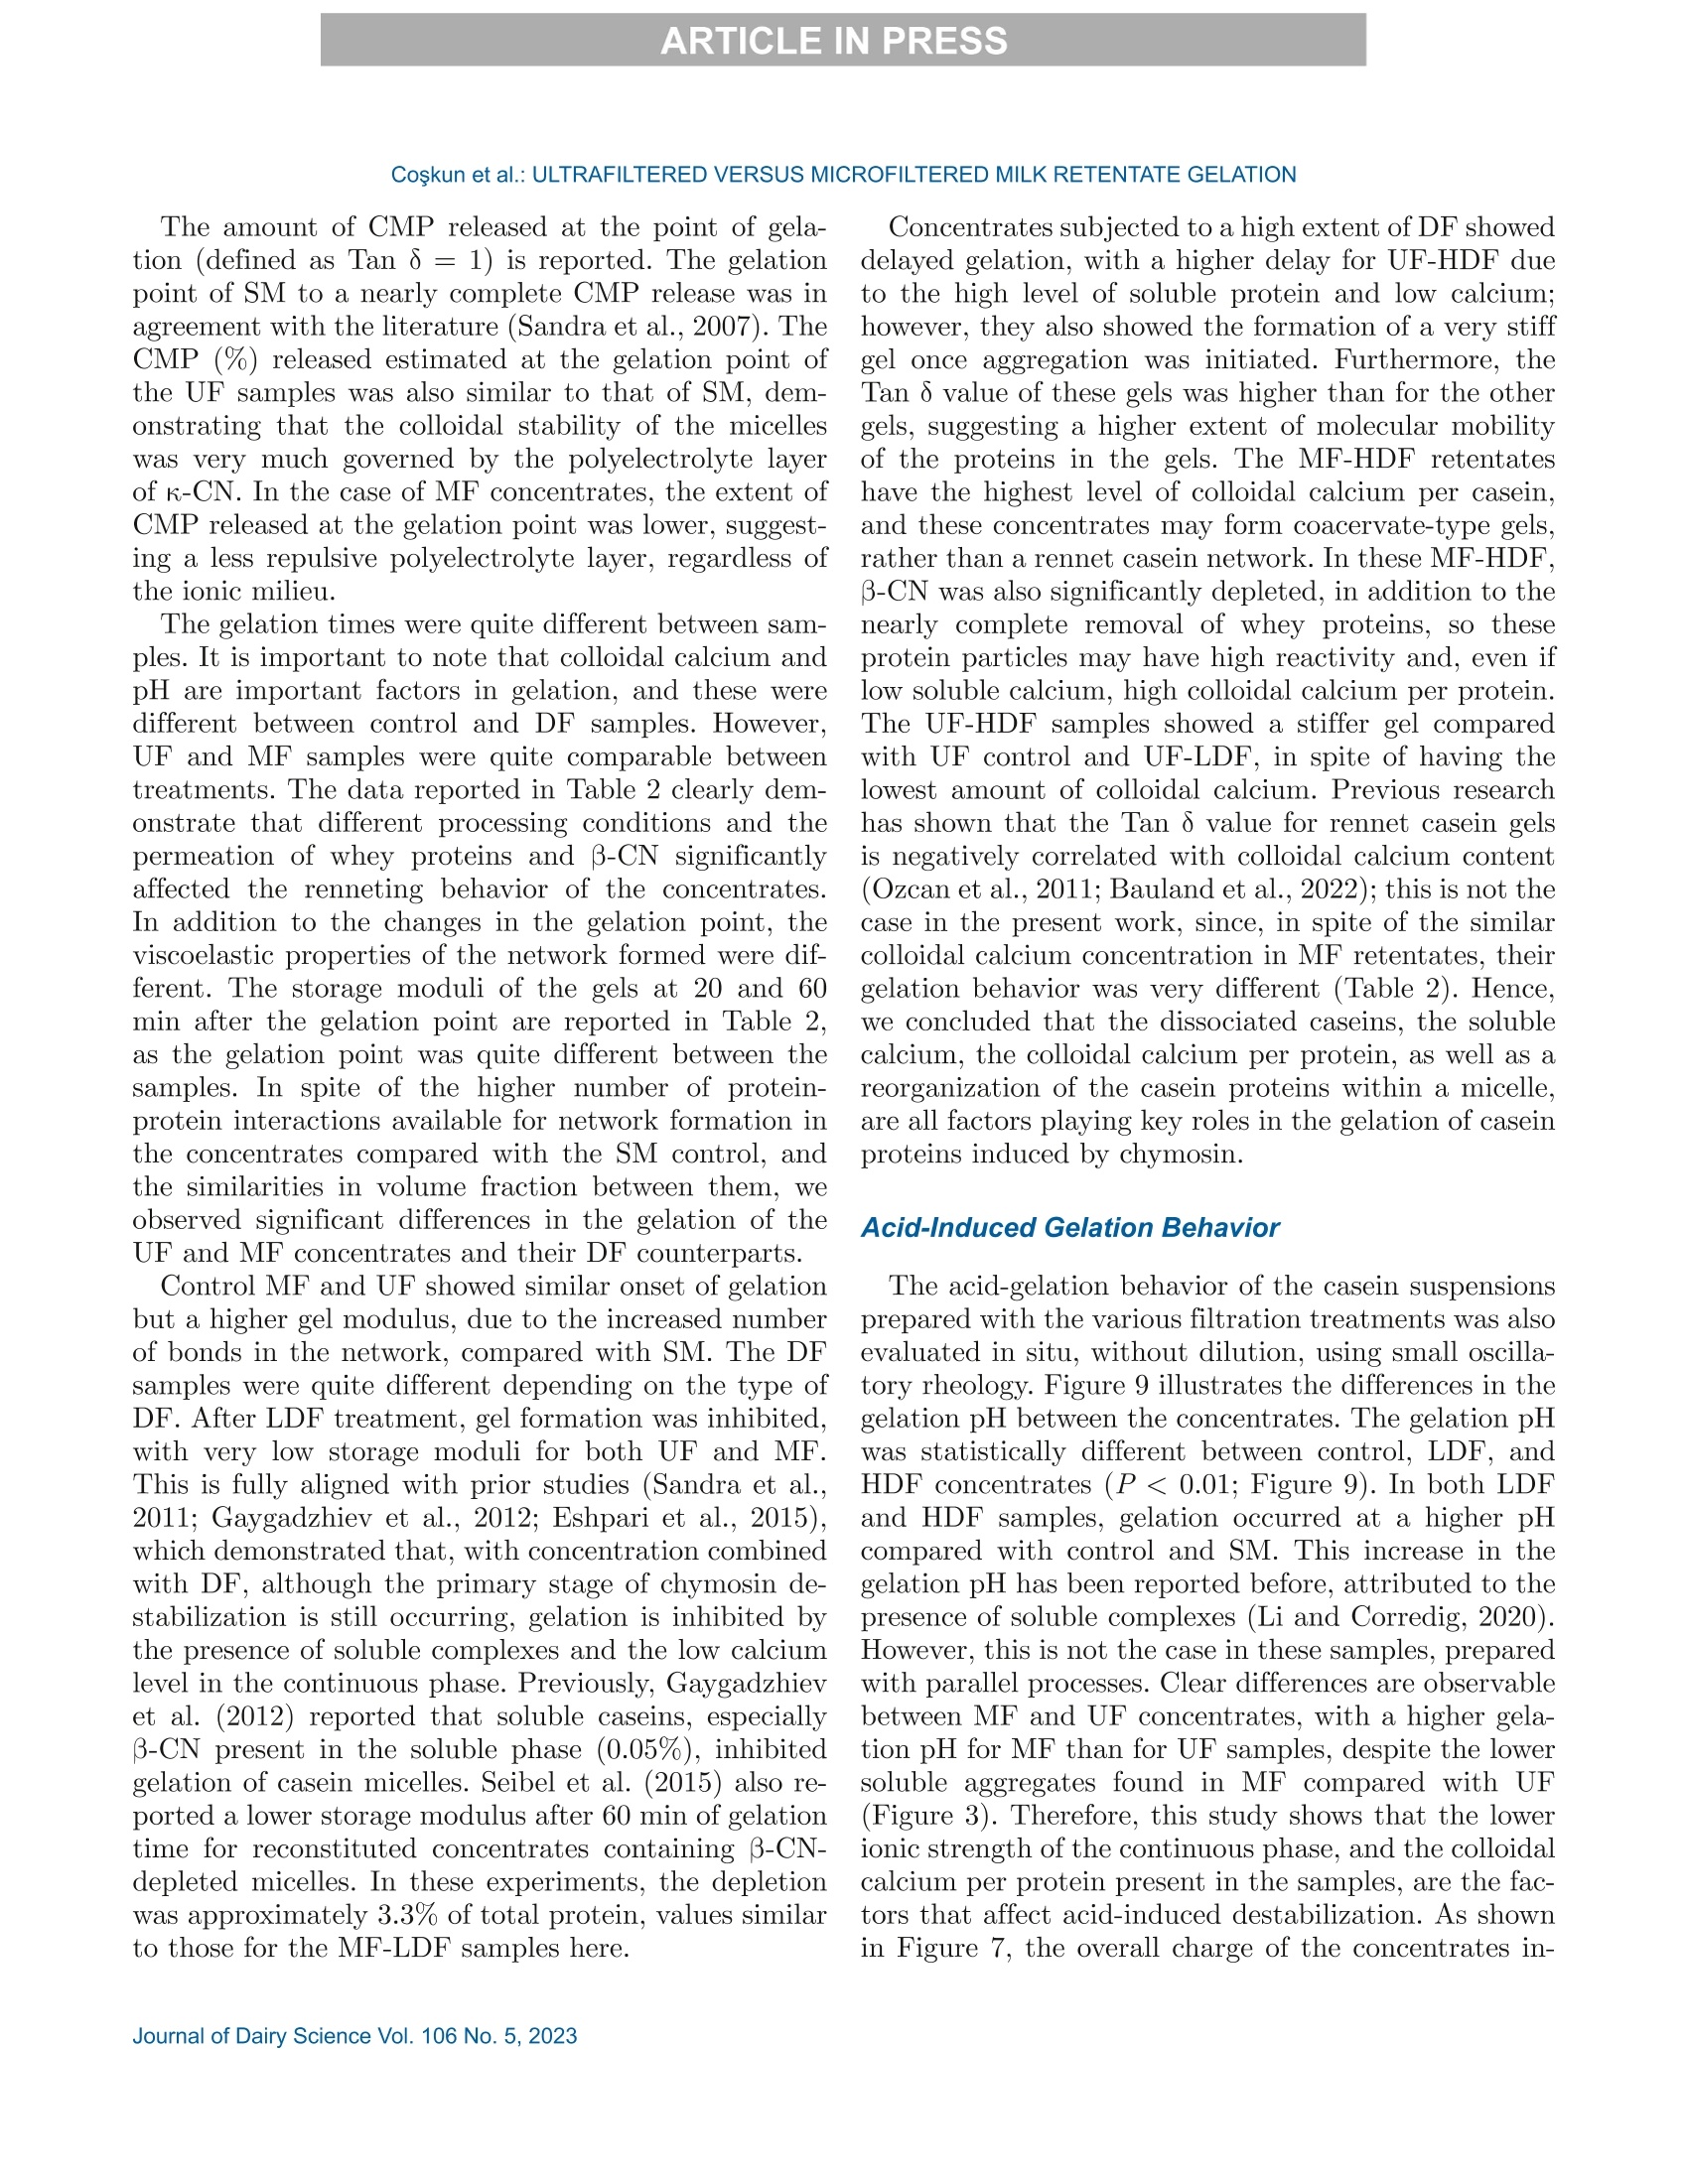
冷超滤或微过滤牛奶:成分差异对其凝胶功能的影响的系统比较Cold ultrafiltered or microfiltered milk retentates A systematic comparison of the effects of compositional differences on their gelation functionalityCoskun et al.: ULTRAFILTERED VERSUS MICROFILTERED MILK RETENTATE GELATION 冷超滤或微过滤牛奶:成分差异对其凝胶功能的影响的系统比较 J. Da i ry Sci . 106 htt p s ://doi .o rg /10.3168/jds.2022-22497 C 2023, The Authors. Published by Elsevier Inc. and Fass Inc. on behalf of the American Dairy Science Association .This is an open access article under the CC BY license (http://creativecommons.org/licenses/by/4.0/). Cold ultraf i ltered or microfi l tered milk retentates: A sy s tematic comparison of the effects of compositional differences on their gelation functionality Ozgenur Coskun,*D Lars Wiking, @ and Milena Corredig @ Department of Food Science, CiFood Multidisciplinary Center for Innovative Foods, Aarhus University, Agro Food Park 48,8200 Aarhus N, Denmark The colloidal stability of casein mice ll es suspensions prepared using ultrafiltration (UF) and microfiltration (MF) was studied by testing acid- and rennet-induced destabilization. Skim mi l k and 4x (based on volume reduction) concentrates were obtained by processing under simil a r condit i ons, at temperatures below 10°℃.Concentrates were subjec t ed to dif f erent levels of diafil-tration (DF), resulting in samples wi t h comparable ca-sein volume fractions but different amounts of proteins and ions i n the serum phase. The nove l ty of the work is the systematic comparison of MF and UF concen-trates of similar history . More spec i fically, concentrates simi l ar in ionic composition but with or w i thout serum proteins were compared, t o evaluate whether whey pro-t eins and B -casein depletion from the mice l les will play a role in the processing proper t ies, or whether these are affected solely by the ionic balance. Microfi l tered mice l le s’apparent diameter decreased by about 50 nm dur i ng the speci fi c hydrolysis of k-casein by chymos i n,whereas those in skim milk control showed a decrease of about half that size . All concent r ates subjec t ed to extensive DF showed smaller hydrody n amic diameters,with reductions of ~18 and 13 nm for MF and UF,respectively. Highly di a f i ltered UF retentates showed a delayed onset of rennet-induced gelat i on, due to low colloidal calcium, compared with other samples. Low-diafiltered samples showed weak storage modul u s (~1Pa) after 60 min of onset of gelat i on. In addition, onset pH increased with diafiltration to ~5.8 f or UF and ~6 for MF in high-diaf i ltered samples. These results clearly demonstrated that the functional proper t ies of casein m i celles change during membrane concent r at i on,and this cannot be solely attributed to changes i n ionic equilibrium. K ey word s : membrane f i ltrat i on, casein mice l les,whey protein depletion, gelation Rece i ved July 8, 2022. Accepted November 23, 2022. *Corr e sponding a u thor: ozgen u rcoskun @food.au.dk Caseins are a group of phosphoproteins comprising 4individual types of molecules, namely asi-, as 2-,B -, and K-CN, in approximate relative amounts of 4:1:3.5:1.5,respectively (Dalgleish, 2011). Their se l f-assembly in supramolecular colloidal particles is due to ionic and noncovalent interactions, as we l l as calcium phosphate bridging with phosphorylated ser i nes, and is affected by environmental and processing conditions, such as pH, temperature, ionic strength, and changes in volume fraction. The mechanisms underpinning their stability and dissociation have been previously described (Dal-gleish and Corredig, 2012). For example, storage of milk at low temperat u res (<10℃) at native pH causes B -CN molecules to diffuse into the soluble phase (Dalgle i sh and Law, 1988), due to a weakening of t he hydrophobic interact i ons. Casein mice l les have calcium phosphate c l usters as-sociated with the phosphory la ted moiet i es of as 1-,s2-and B-CN. These are responsible for the structure and stability of the casein micelles (Hol t, 1985). In nat i ve conditions, there is a balance of ions between the colloi-dal and the serum phases of mi l k, where approximately 2 mM calcium (Ca+) and phosphate (HPO4 and HPO4-) exist as free ions, and approximately 7 and 0.6mM Ca’+ exist as complexe s wi t h c i trat e and inorganic phosphate, respectively (Gaucheron, 2005). I t has been shown that colloidal calcium phosphate can dissociate without major ef f ec t s to the casein micel l e structure (Horne, 2020). Sequestrant addition, whether EDTA or citrate, above a critical concentration, w i ll result i n structure changes and ultimately i n the dissoc i ation of case i n mice ll es (Udabage et al., 2000). It has also b een recently hypothesized that with concent r ation,t he micelles become more resistant to environmental effects (Reiter et al, 2022). The structural modif i ca-tions of the case i n micelles caused by changes i n the Ca and phosphate equilibr iu m between the soluble and colloidal phases are t echnologically relevant, as t hey influence the behavior of casein dur i ng processing,such as manufacture of cheese (Kal i appan and Lucey,2011; Seibel et al.,2015) or yogur t (Ozcan et al., 2011). Membrane fil t ration has LS been used in the dairy industry for m any years for several purposes ((e .g.,removal of bacteria, increase of protein concent r a-tion, fractionation of components). It is known that an increased volume frac t ion (亚) causes an i ncrease i n the interactions between casein micelles, due to their decreased interparticle distance (Kar l sson et al., 2005;Krishnakutty Nair et al., 2014; Corredig et al., 2019).Although it has been shown that casein micelles st i ll behave like hard spheres at 重0.55 (Dahbi et al., 2010;Krishnakutty Nair et al ., 2014), their technological be-havior changes with processing condi t ions, and i t is yet not very clear how to control this. During f iltration, water is often added to the con-centrates, to improve processing effic i enc i es (Gavazzi i -一 April et al., 2018), known as diafiltration (DF), but the composition of the DF medium affects permeation. For example, Reitmaier et al. (2021) found differences i n permeation flux and deposit laye r after the use of tap or softened water as medium. In addition, their data suggested that addit i onal calcium in the DF medium could mitigate changes in the casein micelle structure and dissociation during concentration (Reitmaier et al .,2021). Heat i ng above 70℃ causes the whey proteins present in the sol u ble phase to unfold, expose their reac t ive sites, and aggregate, either between themselves or with casein proteins. The amount of the aggregates can also b e affected by pH and environmental conditions, in-cluding concentration and modulation of the amounts present during heating (Renan et al ., 2006; Li et al.,2015). During membrane filtrat i on of unheated milk,whey proteins are present in their native structures,and their permeat i on through the fil t ers depends on membrane size and selectivity. I n general, whey pro-teins are retained in the concentrate when UF mem-b ranes are used, whereas larger pore-size membranes,used for microfiltration (MF), ca u se whey proteins to transmit to t he permeate. When MF is carried out at temperatures below 10℃, B -CN also permeates, due to its presence as a monomer i n the serum phase (J arto et al., 2018; Schafe r et al., 2019). Although much has been published in relation to membrane filtration and ionic equilibrium, there is a lack of knowledge of the dynamics during protein deple-tion, in particular during t he dec r ease of whey protein and 3-CN in the concentrates. This work wil l further examine how modifications in the colloidal and soluble composition during UF and MF affect the t echnological functionality of the casein micel l es. Depletion of whey and 3-CN may indeed play a role in varying retentates functional proper t ies. During concentration, changes in the composition of the soluble fraction may contribute to variation in dissociation of the casein micelles, driv- ing differences in the changes in their supramolecular structure. To test this hypothesis,4×x concentrated samples were obtained by either UF or MF, using di f -ferent DF levels. Whereas UF ret a ins all the proteins,MF decreases the level of serum proteins present, in-creasing the ratio between caseins and whey proteins.Extensive DF can affect micelle dissociation (Coskun et al., 2022). In this work, concentrates with simi l ar pro-cessing histories but di f ferent serum compositions were tested, to dist i nguish between the demineral i zat i on and protein composition effects. In addition to the physio-chemical properties , gelation of the concentrates was evaluated using chymosin and ac i dification. Destabili-zation of casein micelles occurs when the polyelec t rolyte layer surrounding them is modified (de Kruif, 1999).Rennet-induced aggregation occurs when the enzyme chymosin hydrolyzes K-CN, and is affected by the free calcium concentration (Dalgleish and Corredig, 2012),b ut should not depend on the presence of nat i ve whey proteins. Ac i d-induced gel a tion, on the other hand, is affected b y a change in charge, calcium release, and col-lapse of the hairy layer, and, once again, the presence of native whey proteins in the serum phase should not influence t he gel formation or its final struc t ure (Lucey et al ., 1999; Dalgleish and Corredig, 2012). MATERIALS AND METHODS Pr ep arat i on of R e t e ntat es Fresh , p asteur i zed skim milk was obtained from Ar l a Foods (Arla Foods Amba Innovat i on Center ), and so-dium azide (0.02% wt/vol) was added t o retentates i m-mediately after filtration to prevent microbial grow t h.Concent r ation was conducted using a tangent i al f low filtration system (Vibro LE, SANI Membranes ApS)with hydrophilic polyethersulfone membranes (nominal molecular weight cut -off 30 kDa; membrane area of 0.35 m’) for UF and polyv i nylidene fl u oride membranes (nominal molecular we i ght cut -of f 800 kDa; membrane area of 0.35 m²) for MF. Both UF and MF process were p erformed at 10 ±3℃ with a transmembrane pressure o f 0.04 to 0.05 MPa . The system used is equipped wi t h a patented Vibro technology, which subjects the reten-t ate chamber and the membrane element to hor i zontal v i brat i ons, to keep the foul i ng layer at a minimum. Different concentration steps were conducted to reach a final 4× concentration, based on permeate vol-ume, as will be brie f ly out l ined. Skim mi l k (3L) was concentrated by UF and MF up t o 4x wit h no addition of diaf i l t ered media ; these samples were named UF con-trol and MF control . For the low extent of DF, 3 L of skim mi l k were concentra t ed to 4x; then Milli-Q water (Mi l lipore), half of the initial milk volume (1.5L), was added as DF medium in 2 sequential 0.75-L steps-t hat is to say , the second DF step was per f ormed when 0.75 L of permeate were collected. These samples were Total, soluble, and colloidal calcium and phosphate named UF-LDF and MF-LDF, depending on the were measured by inductively coupled plasma mass type of membrane filtrat i on used. For sampl e s t reated spectrometry (ICP-MS). In brief, retentates (20 pL),extensively by DF , 3 L of skim milk were concentrated retentate centrifugal supernatants (100 pL ), and per-f i rst to 2× the volume fract i on, and then 9 L of wa- meate fractions (150 pL) collected during membrane ter (3 times more than i nit i al milk volume) were used p rocessing were transferred to glass vials and weighed.as DF medium. In this case, after t he concent r ation HNO: (Cas number : 7697-37-2; 1 mL) was added and of milk from 3 L to 1.5 L, a volume of Milli-Q water weighed together with sample. The vials were sealed (1.5 L) was added every t i me 1.5 L of permeate was and placed inside a microwave oven (Mult i wave 3000,removed, to maintain the volume fraction at 2×, and Anton Paar GmbH))using a rotor (model 64MG5,t his addition was repeated in 6 sequent i al steps. After Anton Paar GmbH). The samples were digested us-t his extensive DF, the retentates were concentrated to ing 1,400 W with a 10-min heating, 10-min holding,4x volume fraction, based on permeate volume. These and 10-min cool i ng, reaching a maximum temperature samples were named UF-HDF and MF-HDF, de- of 145℃. After digestion, samples were weighed. The p e n ding on the type of membrane used. This design resulting solut i ons were dil u ted with Milli-Q wate r .ensured that all the samples produced with different Dilution ef f ects s were calculated by subtrac t ing the DF extents using UF and MF had a similar casein mi- total weight from the weight of the cap and glass vial celle volume frac t ion, 4×. In sum, 7 t r eatments were and dividing by the sample weight . Final digests were analyzed, including a skim milk control (SM). Control s analyzed directly in the vial via ICP-MS (7900, Agilent had no water added, and LDF and HDF had 0.5 vol- Technologies). Blank digestions with Mil l i-Q water and ume and 3 volumes of water added, respec t ivel y , based HNOs were also performed as controls.. 43Ca isotope on the original SM volume used. For all samples, at and 3P were ana l yzed in general-purpose plasma mode.least 2 independent f i l tration processes were conducted The sample depth was set to 129 mm. Helium was used for statistical comparison. to reduce polyatomic interferences. Nebulizer flow rate was 0.5 revolutions per second. Yitrium was used as internal standard. Composi t ional Analys i s The total protein content in samples was analyzed via the Dumas method (Gerhardt Dumat h erm,Ger-hardt GmbH and Co. KG)with a conversion factor of 6.38. The amount of nitrogen in the UF permeate was also measured and subtracted from t h e concentrate samples as nonprotein nit r ogen. Solu b le fractions of all the retentates were also ana-lyzed after separation by centrifugation at 20℃,100,000x g for 1 h (Coskun et al, 2022). The supernatants were then analyzed via size-exc l usion chromatography to evaluate differences i n composition of the soluble p rotein frac t ion, as previously described (Coskun et al.,2022). The protein fractions present in MF permeates and in the centrifugal supernatant of t he various reten-tates were analyzed using reverse-phase (RP)-HPLC (Coskun et al., 2022). The amount of o-LA and B-LG were calculated in the permeate using the area based on a calibration curve prepared with standards of a-LA from bovine milk (Biochemika, product no. 61289, GE)and β -LG from bovine milk (SigmaAldrich, produc t no.L0130). The area under each protein peak and the t otal peak area were quanti f ied using Chemstation software (Rev. B.04.03, Agilent ). To check the stability of the whole run, B -LG standards (3.7 mg/L) were also i n-jected every 10 samples. The apparenthydrodynamic diameter r was deter-mined using dynamic light scatter i ng (Malvern Zeta-sizer, Malvern Instruments). The retentate samples were measured after extensive dilution (1:1,000) using UF permeate , to restore the original serum conditions,and also after di l u tion using the i r own corresponding permeates: namely, the UF and MF permeates for con-trol samples and the permeates collec t ed in the last stage of process for HDF . This allowed for measuring the size of the micelles in their ion-depleted media. The measurements were correc t ed for the cor r esponding permeate viscosities, measured at 30℃ using a capil-lary viscometer (525 03/0c , Xylem Analytics Germany GmBh). The viscosity of the UF permeate was 0.888mPas, MF permeate was 0.973 mPas, UF-HDF was 0.8341 mPas, and finally MF-HDF permeate was mea-sured as 0.867 mPa·s. Retentates (3pL) were diluted in 3 mL of permeate previously filtered through 0.45-um filters (Osmonics Cameo PTFE Syringe Filters). Before measurements,samples at 22℃ were equilibrated for 20 s at 30℃. Measurements then calculated from the average of 15sub-runs lasting 6.71 s each. The changes in average diameter of case i n micelles with addition of chymosin were also studied using dynamic light scat t ering. In t his case, chymosin [45 uL of 10% enzyme solution,Chy-Max Plus , 200 international milk clotting units (IMCU)/mL, Chr. Hansen, corresponding to 0.3IMCU/mL final concentrat i on, prepared just be f ore use] was added to the cuvettes containing the samples (see above) diluted in UF permeate. In this way, all samples were dispersed in a simi l ar milieu, containing sufficient soluble calcium for enzymatic activity. The change in mice l le size over t i me was t hen measured as previously d e sc r ibed. The apparent zeta potential of the casein micelles was also measured using a Malvern Zetasizer (Malvern Instruments). The retentates were diluted 1,000 t i mes with filtered UF or the corresponding permeates, as descr i bed earlier. In addition, measurements were also carried out after dilution i n 5 mM NaCl solution, to provide only a m i n imal ionic strength, b ut without ad-dition of cations. Al l the measurements were conducted at 30°C. Gel at ion Exper i ments Renne t-I nduced G elation. The release of the ca-sein glycomacropeptide (CMP) as a function of t ime for al l treatments was measured using RP-HPLC. Chy-mosin (Chy-Max Plus, 200 IMCU/mL, Chr. Hansen),was diluted 1:100 in Mi ll i-Q water immediately before use and then added to samples previously equilibrated to 30℃ i n a water bath for 20 min, at the rate of 0.03IMCU/mL of milk. After rennet addition, 10-mL ali-quots were sampled at different times, and the reaction was stopped by adding 10 mL of 4% trichloroacetic ac i d (TCA). The samples were then st i rred and placed i n ice water . After stor i ng the samples overnight at 4℃,they were centrifuged at 4,500 × g for 30 min at 20℃(Eppendorf centr i fuge 5417 R, rotor type 26814). The supernatants were fi l tered through 0.45-um sy ri nge fil-ter (Osmonics Cameo PTFE Syringe Filters) and ana-lyzed using RP-HPLC. Samples (90 pL) were injected in a Jupiter column, (5 pm, C4, 300 A, 100 × 4.6 mm;Phenomenex) operated at 40℃ and detected at 214nm using HPLC system (Agilent 1100). The following solvent gradient was applied: 0 to 5 min, i socratic con-ditions, 18% B; 5 to 40 min, 18 to 39% B; 40 to 46 min,39 to 100% B; 46 to 54 min, isocrat i c conditions, 100%B; 54 to 58 min, 100 to 18% B; 58 to 62 min, isocratic conditions, 18% B (Gaygadzhiev et al, 2012). The area under each protein peak and the total peak areas were quant i fied using Chemstation software (Rev. B.04.03,Agilent ). The percentage CMP released was t hen calcu- lated relative to the maximum amount, de f ined as t he value at plateau. The development of a gel network was also measured using a controlled stress rheometer (HR20, TA Instru-ments), with a cup-and-bob geometry with a set gap of 0.59 mm. The gelation condit i ons used were the same as described for measur i ng CMP release. The rheo-logical parameters were then measured as a func t ion of time at a constant 1% strain and 1-Hz frequency.The relation between rheological parameters (storage modulus, G'; loss modulus, G"; and tangent de l ta, Tan 8), and the amount of CMP released was determined b y polynomial regression (R²> 0.99) using the order of 5 (SigmaPlot,, Version 14.0, Systat Software Inc .).The gelation t i me was est i mated when Tan 8= 1. For statistical analysis, the gelation time, the G'after 20and 60 min from gel point and the corresponding Tan 8were used to compare between treatments. Acid -Induced G elation. Acidification was con-ducted by addition of glucono-8-lactone and incubation at 40℃. Samples were equilibrated to 40℃ using a water bath, and then glucono-8-lactone was added , at 1.3% wt/wt for 1x SM control and 3.0% wt/wt for 4×concentrated samples (Li and Corredig ,2020). Samples were mixed for 30 s immediately after gl u cono-8-lactone addition, and then placed in the rheometer. The pH was recorded continuously with an Inolab 7310 pH meter (WTW, Xylem Analytics Germany ) at 40℃ f or each sample. Rheological measurements were performed with a con-trolled stress rheometer (HR20, TA Instruments), using a cup-and-bob geometry with a set gap of 0.59 mm. All measurements were made at 40℃, with constant 1%strain at 1-Hz frequency. Ge la tion t i me was de f ined as has been described herein. The relation between main parameters (G', G", and Tan 8) and pH determined by polynomial regression (R’> 0.99) using the order of 10(SigmaPlot , Version 14.0, Systat Software Inc .). S ta ti s t ica l A na l y s is. The data obtained were ana-lyzed using SigmaPlot (Version 14.0, Systat Software Inc .). One-way ANOVA with post-hoc Tukey tests were carried out to compare means. Data were expressed as sample mean ± standard deviation. I n all cases, at least 2 replicates for the samples (i.e., 2 separate milk b atches and concentrations by fi l tration) were anal y zed,and statistical signi f icance was considered for P < 0.05. RESUL T S A N D DISCUSSION Analy s is of Concentrate s and Thei r Corre s ponding Centrifugal Supernatants Table 1 summarizes the values of pH, total protein,and solids , as wel l as the amount of whey protein pres- ent in the various samples -namely, the original SM,t h e control MF, and UF, and the low- and high-DF samples (all at 4x volume concentration, based on permeate volume). The pH was unaffected by fi l tration type but increased significantly from 6.8 to 7.1 after DF, with no change between LDF and HDF tr eatments (P<0.05). This change in pH is related to the dec r ease in the amount of organic acids and ions in the serum phase occurring during DF . As expected, the total protein concentration increased in the 4x retentates.The protein concentrat i on on a solids basis increased from about 35% in SM to more than 65% in t he 4×concentrates . Overall, no statistically significant differ-ence was detected for prote i n between the concentrates,apart from the MF-HDF, which showed a l ower protein concentration of 10% (wt/vol) compared with other samples, due to the extensive permeat i on of whey pro-teins and B-CN occurring during HDF. As expected,the amount of solids decreased with DF , from about 20% in the control 4x retentates to 13% wt/vol in t he DF samples. In MF samples, we de t ected a significant permeation of whey proteins, and this resulted in large differences in their concentrations between UF and MF samples (Table 1). The concentration of whey protein est i mated in the UF concent r ates ranged between 3.5 and 2.7%(wt/vol), with no stat i stical di f ference between the samples, with a ratio of whey protein to total protein of about 25%. In contrast, during MF, significant permeation of whey proteins occurred, resulting in a change from 1.8% (wt/vol) in the MF cont r ol to l ess than 0.14% in the HDF samples, corresponding to a decrease from a b out 15% to 1% of the total protein from MF control to MF-HDF (P<0.05). The rate of whey protein permeation is shown in Fig-一 ure 1. In the f irst stages of DF, a high rate of transmis-一 sion of whey proteins in the pe r meate occurred, similar b etween LDF and HDF, even i f , in the HDF , DF was conducted at a lower-volume fraction (2×) compared with the LDF samples (4×; see Methods). The amount Fi gure 1. Concentration of whey prot e i n in mic r o f i ltr a tion (MF)control (tri a ngle s ) and l ow-diaf il tered (L D F, c i rcle s) or high-di a filte r e d milk (HDF , squar e s) as a function of the amount of water used dur-ing diafiltr a tion (DF ), expressed as cumulative volume rel a tive to the ini tial volume of skim milk. N o te that HDF r et e nt a te with zero (0)wate r added was only a 2× concent ra t e. Dat a a re th e average of 2independent experiments, and bars repre s ent SD. of total whey protein decreased for each additional DF step, with total permeation ratios, calculated as amount in the permeates versus total, of 41%±6,64%±6, and 88%± 6 for MF control, MF-LDF , and MF-HDF , respec t ively. F i gure 2 shows the protein compositions in the centrifugal supernatants. The protein elution was un-changed in all UF samples, as they all had the same concentrations of whey proteins regardless of the extent of DF (Figure 2A). F u rthermore , in the UF superna-tant s , all caseins were also present , with significantly larger peaks for B -and asi-CN, compared wi t h the supernatants of the other concent r ates (Figure 2B). In MF retentates (Figure 2B), the amounts of all soluble proteins were lower than in the UF supernatants and continued to decrease with the increasing extent of DF . Tab l e 1. V a lue of pH, protein, and solid s (mean ± SD) for skim mi l k and retentate s after UF or micr o filtration (MF ) and low and high d i a f il tration (LDF , HDF, respect i vely ); a l l samples we r e a t 4x volume fr a ction Treatment DF extent pH Total protein (% wt/vol) TS (% wt/vol) Total whey protein (%, wt/vol) Skim milk 6.78±0.04* 3.7±0.1 11.5±0.4* 0.7±0.02 UF Control 6.70±0.02* 14.0±0.1° 20.7±0.1 3.50±0.06° LDF 7.10±0.10 12.5±0.85c 15.9±2.1ab 2.97±0.3d HDF 7.10±0.03 12±0.7bc 14.1±1.0* 2.71±0.2d Control 6.70±0.05= 12.4±0.1c MF LDF 7.00±0.10 11±0.65c 13.1±0.8ac 1.80±0.2° HDF 7.10±0.01 0.14±0.02* 10±0.75 13.2±1.4 a -d Within a column, different supersc ri pt l etters i n d ic a te s ignificant difference s a cross treatments (P <0.05). The B- and as i -CN had lower peak heights in MF-HDF compared with MF-LDF (Figure 2B), due to t h e t r ans-mission of soluble casein in the permeate. This was also confirmed by the recovery of t h ese prote i ns in the permeate at the last stage of DF , as shown i n Figure 2C , where whey proteins and β-C N were present for the control and the LDF samples, and very little residual p rotein was present in the HDF permeate, due to the extensive dilution. F i gure 2C shows the composition of the permeates in the MF process. Casein permeation (mostly B -CN)occurred only after DF . When comparing the superna-tants (Figure 2B) with the permeate fractions (Figure 2C) it is clear that , during MF without DF (Figure 2C,dotted line), extensive permeation of the whey proteins,b ut not B-CN, took place. The centrifugal supernatant of the LDF (Figure 2B, dashed l ine) showed a reduced amount of whey proteins, due to the addit i onal DF stages, but also showed the presence in the supernatant of as i - and B-CN. The HDF sample showed very lo w re-sidual whey proteins, but still a visible peak for B -CN,in spite of its already extensive permeation of more th a n 30% of the total (Figure 2B, solid line). It is known that B -CN dissociates f rom the casein micelle at low temperatures, because of a weakening of hydrophobic interactions (Rose, 1968; Creamer and Berry, 1975; Dalgleish , 2011; Atamer et al., 2017). Be-cause MF fi l tration was conducted at approximately 10°℃, β-CN permeated through the membrane. How-ever, we found a difference in the permeation between MF-LDF and MF-HDF , with 3.5% for MF -LDF, and a much higher value (34%) for MF-HDF, for the ratio of transmitted to total B -CN in SM. The amount of soluble B-CN was higher in the centr i fugal supernatant (Figure 2A) of UF samples after DF compared with MF, indicating casein mice l le dissoc i at i on during DF b ut with no difference between the extent of DF. Centrifugal supernatants were also analyzed by pre-parative size exclusion chromatography (Figure 3), to evaluate the presence of whey proteins and caseins in t h e serum phase. We detected a smal l excluded volume peak eluting at about 40 min, and this peak can con-tain large aggregates and lipid vesicles (Donato and Dalgleish, 2006). However , when comparing the differ-ent treatments after DF, this peak was higher in the supernatants of the UF retentates compared with MF,indicating t r ansmission of these soluble li pid vesicles in the MF permeate. Two other regions could be i dentified in these chro-matograms: a popul a tion eluting between 75 and 90min, containing mainly caseins and aggregated whey proteins; and a second l a rge peak eluting be t ween 95and 120 min, containing native whey proteins (Donato et al., 2007). Time (min) Fi gu r e 2. Represent a tive chr o matogr a m of the centrifugal super-nat a nts of UF (A) and microfi l tered (MF; B) milk concent ra te s , and of the MF perme a tes (C) collected at t he last s t a ge of the process.Control (dotted line ), low -di a f il te r e d mi l k (LDF, dashed line ), and high-di a filtered milk (HDF , s o lid line ). Abs = a bsorbance. In control samples (Figure 3A), the 4x UF samples showed a large peak for whey prote i ns,which was expected, and a smaller peak containing soluble ag-gregates eluting between 75 and 90 min . The 4x MF control (dashed line, Figure 3A) had a lower concentra-t i on of whey proteins in the supernatant , due to the i r permeation through the membrane, but, interest i ngly, Fi gu r e 3. Represent a tive size exc l usion chromat o graphy prof i les o f supernatants for skim milk (s olid l ine ), UF milk (dotte d l ine ), a n d microf il tered mi l k (broken line ) for control treatments (no diaf i lt ra -tion; A ), low-di a filtered milk (B), and h igh-diafiltered milk (C ). A bs = absorbance . a similar shoulder for the soluble aggregates. At t his stage , B -CN was not present in the permeate. F i gures 3B and 3C i llustrate the elution of the pro-tein fractions in the supernatants for LDF and HDF samples, respectively. When comparing the superna-tants from control concentrates (Figure 3A), i t was concluded that the extent of DF resulted in different soluble aggregate populations. I n the UF samples, t he whey protein peak, eluting between 95 and 120 min,was comparable , regardless of the extent of DF, where-as the aggregates eluting at about 80 min increased with DF. We observed no difference between LDF and HDF, indicating that under these conditions, m ost of the changes occurred at the initial stages of DF. In the MF samples, the level of native whey protein was significantly reduced after DF ; however, the peak corresponding to that of soluble caseins was st i ll pres-ent , especially in the MF -LDF supernatants (Figure 3B). Furthermore, in these samples, B-CN permeation was only 3.4% of the total at this point of the process.The MF-HDF soluble phases, on the other hand, con-tained little protein, as shown in Figure 3C (broken line). In this case, 3-CN permeation was about 34% of the total. C a lc i um a n d Phosphate Concentrations The calcium and phosphate ions were measured in the permeate fractions (Figure 4). The 2 membrane fi l tration treatments showed identical permeation be-havior (compare square and c i rcle symbols), regardless of the permeation of the whey proteins, with differences for LDF and HDF . Interestingly, under the current ex-p erimental conditions, the amount of demineralization reached similar values with less water used in the LDF compared with HDF, as in the LDF the DF occurred at 4x concentration instead of 2× (see Methods). The demineralization of the concentrate occurred at a faster rate at the initial stages and a slower rate after t he first DF steps. A plateau was reached after 1.5 volumes of water divided by the original skim milk volume used,similar to what was observed for whey prote i n perme-ation (Figure 1). The changes in total and soluble calc i um and phos-phate (mg/L) in SM and the various concentrates are shown in Figure 5. Both total calc i um and phosphate increased compared with SM in the UF and MF con-centrates, as expected, with a higher amount present in UF control than in MF control concentrates. With HDF t h e amounts of total phosphate and calcium decreased.Figure 5 (B, D) shows the changes i n the soluble ions.In this case, clear di f ferences are observable between UF and MF treatments, as well as between calcium and p hosphate ions.Whereas phosphates decreased with the extent of DF (Figure 5D), calcium ions, in the case of UF treatment, decreased at the initial DF stages b ut did not show a fur t her decrease in HDF. The higher value of calcium ions in the soluble phase in UF com-pared with MF is due to the association of these cations to the whey proteins and the soluble caseins. The col-loidal calc i um was estimated by subt r acting the soluble 600 F ig ure 4. Concentrat i on of c a lcium (A) and phosphate (B) ions in permeate fr a c t ions col l ected at the var i ous stages of diafiltration (DF)for UF (c i rcles) a nd microf i lte red milk (MF, squares), expre s sed as cumulative volume relative to the initial volume of skim milk. The DF treatment s for low-diafiltered mi l k (gray symbols) and high-di a f i ltered milk (solid symbol s) were c a rried out wit h 4x or 2x concentrates (see Materials a nd Methods). Aver a ge of 2 independent exper i ment s , with bars repre s enting SD. calcium from total calcium. The UF concentrates had significant l y different values of colloidal calcium, with UF control > UF-LDF > UF-HDF. However , the col-loidal calcium was not significantly different (P>0.05)between the MF samples. Moreover, colloidal calcium decreased from 3,681 ±6 mg/L to 2,451 ±172 mg/L in UF control to UF-HDF, whereas i t was found to be ap-proximately 3,150 mg/L in al l MF samples. The results suggest that the more extensive release of case i ns i n the UF soluble fraction may be the reason for the lower level of colloidal calcium in the UF-HDF and UF-LDF retentates. By contrast, colloidal calcium seemed to be better retained in the 3-CN and whey protein depleted mice l les. Removal of colloidal calcium should change the inter-nal structure of casein micelles, which, in turn, alters the mechanical propert i es of gels made from these modi f ied casein micelles (Choi et al., 2004). The amount of t he colloidal calcium-to-casein ratio was then estimated, as it is an important predictor of the technological func-tionality of the concentrates. The ratio was approxi-mately 3.0 (wt/wt × 100) in SM, as already shown by others (Choi et al., 2007; Ferrer et al ., 2011). During UF, the ratio increased to about 3.5 for UF control and UF-LDF , whereas it decreased to 2.7 for UF-HDF. For MF , the trend was somewhat different : the values were 2.9 for control and increased to 3.1 and 3.3 for MF-LDF and HDF, respectively, due to the loss of B -CN in t he permeate. These values are reflected by the differences in the HDF samples for soluble calcium (Figure 5B),which may be an i ndication of profound differences i n technological functionality between UF-HDF and MF-HDF. Particle Size and Zet a Potential of Casei n Suspe n sions The apparent hydrodynamic diameter of the casein micelles in the var i ous retentates was measured after extensive dilution (Figure 6). The measurements were conducted b y diluting the samples in UF permeate, to compare them all in the same milk milieu (F i gure 6,fil l ed symbols). Size measurements were also carried out by diluting t h e concentrates in their respective permeates (Figure 6, empty symbols), as the amount of soluble ions decreased with the extent of DF. It is important to point out that the redilut i on of the casein micelles from a low ionic milieu to a medium with higher ionic strength (UF permeate) resulted in a signi f icant change in their apparent hydrodynamic diameter. The apparent hydrodynamic diameter of casein mi-ce l les in MF and UF cont r ol was higher than for the corresponding SM. We found no statistical difference in MF control diluted in UF permeate or i n the cor-responding MF permeate (P > 0.05; filled vs. empty symbols), meaning that , before DF, the ionic equilib-rium is st il l intact . Compared with UF concentrates,MF concentrates had larger diameters, showing that t hat the partial removal of whey proteins (~40%) af-fected the casein micelle apparent size of the dispersion. The apparent diameter of the protein particles in UF control, as well as in the LDF retentates, was smal l er than that of the MF counterparts, with the LDF tr eat-ment not significantly different compared with non-DF control. T h e significant (P <0.05) i n crease in diameter in the retentates compared with SM can be attr i buted to a partial aggregation of the casein micelles i n the high-volume fractions (4×), not completely reversible when extensively r ediluted in permeate for the analysis.In the UF samples, the contr i but i on to the overall ap- Fi gu r e 5. Tot a l (A; C) and s oluble (B; D) c a lcium and phosphate ion concentr a tions for skim milk (tr i a ngle s), UF milk (c i rc l es), and mi-crof i ltered mi l k (MF , squares ). Dat a a re the a ve r ages of 2 independent f i lt ra tion processe s, and bars represent SD. N ote the difference s in the x -axis. Control , without diaf i ltr a t i on; LDF= low-diaf i lte r ed mi l k; HDF= h i gh-diafilte r ed mi l k. p arent particle diame t er of soluble aggregates of whey proteins and caseins (as shown in Figure 3) may be the cause for some of the difference between MF and UF. We found significant reduction in the apparent size of the casein micelles in HDF compared with LDF and controls (P <0.001). At this point , there was no longer a stat i stically significant difference between UF and MF apparent diameters, and much dissociation has oc-curred wi t hin the casein micelles, due to the release of calc i um and p hosphate, result i ng in a smaller overall apparent diameter . I t i s very we l l known t h at extensive diafiltration with water results i n casein micelle dis-sociation (Ferrer et a l., 2011; Li et al., 2015). Their size was also affected by the ionic milieu, with the r esidual casein p articles appear i ng larger when resuspended i n UF permeate, rich in calcium and phosphate, compared with their own permeate, which was much lower in ions (Figure 4). I t is important to note that the light-scattering data are corrected for the solvent viscosity, as this is an important factor that affects the apparent diameter of the casein micelles. These results suggested that the concentrates after extensive DF have smaller casein micelles, but they may be also prone to aggrega-tion once i n the presence of soluble calcium. The electrophoretic mobility of the protein particles after redilution in UF permeate (filled symbols), in t h eir corresponding permeate (empty symbols), and i n 5 mM NaCl (gray symbols) was measured to est i mate their zeta potent i al (Figure 7). It is well known that the presence of ions influences electrophoretic mobility (Dalgleish and Corredig ,2012). Regardless of the treat-ment, the highest charge for the micelles was recorded when the samples were disper s ed i n a very l ow ionic milieu (5 mM NaCl, gray symbols). We found no sig-nificant differences be t ween the extent of DF , nor t he type of concentrate, UF or MF , when samples were measured in UF permeate or 5 mM N a Cl (P > 0.05).When dispersed in permeate, the caseins showed the F ig u r e 6. Apparent hydrodynamic di a meter of the case i n mice l les for skim milk control (tr i a n gles), UF milk (ci r cles), and microfi l tered milk (MF , squares ), as measured by d ynamic l i ght scat te r i ng, for con-trol concentrate s (4x, no diaf i ltr a tion), and f or low- and high-diafil-tration conditions (LDF and HDF , respec t ive l y). Dat a are t he average of at lea s t 2 independent filtr a t i on experiments, with bars indic a ting SD. Samples we r e extensively di l uted i n UF permeate (f il led symbols).Controls and HDF were al s o measured after dilut i on i n the i r permeate ,col l ected at the point of sampling (empty s ymbols). lowest overall charge, about -15 mV. This is due to a partial shielding of the charges of the polyelec tr olyte layer by the cations present in the permeate. Obvious differences in the zeta potential between the various concentrates occurred when they were dispersed in their own permeates. In this case, the zeta potential was the lowest (absolute ) value for MF control, com-pared with UF control or SM. The decreasing trend with a higher negative charge with the extent of DF i s to be attributed to the lower shielding of the charges in these samples when dispersed in their own permeates,containing low concentrations of ions (see Figure 4).The HDF samples had the highest charge, at about -22 mV. We detected a marked difference between UF and MF in the LDF samples, with MF showing lower electrophoretic mobility. The charge di f ferences in the overall value of zeta potential may result in differences in pH stabi l ity. The charge repulsions were the strongest for HDF samples;therefore, their susceptibility to charge neutralization will be the highest during calcium release for ac i difi-cation. The l ight-scattering measurements shown in Figure 6 demonstrate that HDF samples were larger once resuspended in UF permeate, i ndicating their pro-pensity to aggregation i n the presence of cations. Fig ure 7. Zet a potent i al of the case i n mice l le s me a sured by dynam-ic l i ght scatter i ng of skim milk control (t ri angle s), UF milk (c i rcles ),and microfiltered milk (MF , s quare s), a fter redilut i on in UF permeate (fil led symbols ), in the i r permeate (empty s ymbols), and i n 5 mM NaCl s olut i on (gr a y symbols). V a lues are the average of 2 inde p endent filtrat i on expe ri ments, with bars representing SD. Cont r o l , without di -afiltrat i on; LDF = l ow-diafilt e red milk; HDF = high-diafiltere d milk. Rennet-Induced Gelation Behavior It is well known that, i n nat iv e milk, chymosin spe-c i fically hydrolyzes the k-CN present on the surface of casein micelles, and, after more than 90% disruption of this e l ect r olyte layer , the prote in par ti cles aggregate (Corred i g and Salvatore, 2016; Fox et al ., 2017). T h is reaction was used to probe t he sur f ace st r uc t ure of t he casein micelles present in the concentrates. Figure 8 shows the change i n apparent diameter of t he casein micelles as a function of time after addition of the chymosin enzyme. This reaction i s spec i fic to K-CN and requires t he presence of calcium ions; there-fore, all casein suspensions were e x t ensively diluted i n UF permeate. A decrease i n the apparent diameter of t he suspensions would indicate a spec ifi c ef f e c t of t he chymosin enzyme on the polyelectrolyte layer of the p rote i n particles. In all cases, we observed a r eduction in size within the firs t 10 m in and a furt h er increase afterward, due to subsequent aggregat i on. This effect ,d u e to the removal of the hydrophi l ic port i on of K-CN ,th e case i nomacropept i de (CMP), has been wide l y reported (Horne and Davidson, 1993; de Kruif and Zhulina, 1996). Table 2 shows the decrease i n appar-ent diameter measured in t he various treatments. Skim milk control, as well as UF retentates, showed a change Time (min) Fi g ur e 8. Changes in the apparent diameter of c as ein mice l les durin g rennet i ng measured by dynamic l ight sc a tter in g for microfiltered milk (MF, squares ; A ) and UF milk (c i rc l e s ; B). Skim m i l k (tr i angles), con t rol with no diafi l trat i on (f i l l e d symbols), l o w-diafiltered milk (gray symbols), or high-di a fi l tered mi l k (empty symbol s ) were dilut e d i n UF permeate . V a l u es a re t he a verage of 2 i ndepe n de n t exper i me n ts. Bars represent SD. in radius between 13 and 15 nm. This is a we l l-known re a ction, and it correspond s to t he hydrolysis of the polyelectrolyte layer (Fox et al, 2017). However, the MF control, as well as the MF-LDF, showed a signifi i -一 cantly greater decrease in radius, of about 24 nm, in addition to the l arger initial apparent diameter already discussed above (Figure 6). The greater size dec r ease in these samples may indicate a more rugged surface of the micelles in these samples, resulting in a larger apparent size and a greater decrease once subjected t o chymosin hydrolysis. This was not observed for UF concentrates, nor for MF-HDF. As already shown in Figure 6, in MF-HDF the casein mice l les were smaller in apparent diame t er (Figure 6). To further observe the effect of chymosin-induced aggregation, the rheological properties, as we l l as the amount of CMP release as a function of time, were measured in situ in undiluted samples. It is important to note that , unlike in the scattering experiments de -scr i bed previously, the rheological experiments were performed in situ without dilution, and, in t his case,t he ionic milieu between the treatments was not com-parable. The main ge la tion parameters measured are summarized in Table 2. Table 2. Hydrodynamic diameter differences between i ni ti al size (bef o re renne t ad di ti on) a nd t he l owe s t size (af te r renne t addi ti on) of the c a se i n mice ll e, casein glycomacropept i de (CMP) re l ease (%) est i mated at t he coagul at ion point , a nd r h eological par a me t ers ge l ation point , s torage modulus (G') after 20 and 60 min of ge l ation, and T a n ǒ at p l ate a u] measured afte r addit i on of chymosin; treatment s as de s cribed here i n, ± SD Decrease in diameter CMP release Onset of G'20 min after G'60 min after of casein micelle by (%) at the gelation (min; onset of gelation onset of gelation Tan 8 at Treatment DF extent rennet (nm) gelation Tan 8 < 45) (Pa) (Pa) equilibrium Skim milk 26±8* 91 66 ± 6abc 5.6±3 40±20 0.25±0.005 UF Control 28±2 93 43±8 0.6±0.1 292±188 0.26±0.002 LDF 29±4 86 70 ± 11abc 0.5±0.1 1.13±0.3 0.27±0.001 HDF 32±1 92 152±5d 11±2 559±159 0.29±0.005 MF Control 48±4 64 50±2ab 5.3±4 640±388 0.26±0.0008 LDF 45±8 80 84±5° 0.5±0.1 1.17±0.02 0.27±0.002 HDF 27±0.1a 73 74±6bc 159±7 1,671±303 0.28±0.001 The amount of CMP re l eased at the point of gela-tion (def i ned as Tan 8 = 1) is r eported. The ge l ation point of SM to a nearly complete CMP release was in agreement with the l iterature (Sandra et al., 2007). The CMP (%) released est i mated at t he ge l ation point of the UF samples was also simi l ar to that of SM, dem-onstrating that the colloidal stabi l ity of the m icelles was very much governed by the polyelectrolyte layer of K-CN. In the case of MF concentrates, the extent of CMP released at the gelation point was l o wer, suggest-ing a l ess repulsive polye l ect r olyte layer, regardless of t he ionic milieu. The gelation times were quite different between sam-p les. It i s impor t ant to note that colloidal calcium and pH are important factors in gel a tion, and these were different between control and DF samples. However ,UF and MF samples were quite comparable between treatments. The data reported in T able 2 c l early dem-onstrate that di f ferent processing conditions and t he permeation of whey proteins and 3-CN signi f icantly affected the renneting behavior of the concentrates.In addition to the changes in the gelation point , the viscoelastic proper t ies of the networ k formed were dif-ferent . The storage moduli of the gels at 20 and 60min after the gelation point are reported in Table 2,as the gelation point was quite di ff erent between the samples. In spite of the higher number of protein-protein interactions available for network f ormation in the concentrates compared with the SM control, and the similarities in volume fraction between them, we observed significant differences in the gelation of the UF and MF concentrates and their DF counterpart s . Control MF and UF showed simi l ar onset of gelation but a higher gel modulus, due t o the increased number of bonds in the network, compared with SM. The DF samples were quite different depending on the type of DF . After LDF treatment , gel formation was inhibited,with very low storage moduli for both UF and MF.This is fully aligned with prior studies (Sandra et al .,2011; Gaygadzhiev et al., 2012; Eshpar i et al., 2015),which demonstrated that, with concentration combined with DF , although the primary stage of chymosin de-stabi l ization is sti l l occurring, gel a tion is i nhibited by the presence of soluble complexes and the low calcium level in the continuous phase. Previously, Gaygadzhiev et al. (2012) reported that soluble caseins, espec i ally B-CN present in the soluble phase (0.05%), inhibited gelation of casein micelles. Seibel et al. (2015) also re-ported a lower storage modulus after 60 min of gelation t i me for reconstituted concentrates containing B-CN-depleted mice l les. In these exper i ments, the depletion was approximately 3.3% of total protein, values similar to those for the MF-LDF samples here. Concentrates subjected to a high extent of DF showed delayed gelation , with a higher delay for UF-HDF due to the high level of soluble protein and l ow calcium;however, they also showed the formation of a very stiff gel once aggregation was ini t iated. Furthermore, the Tan 8 value of these gels was higher than for the other gels, suggesting a higher extent of molecular mobility of the proteins in the gels. The MF-HDF retentates have the highest l evel of colloidal calcium per casein,and these concentrates may form coacervate-type ge l s,rather than a rennet casein network. In these MF-HDF,B -CN was also significantly depleted, in addition to the nearly complete removal of whey proteins, so these p Pr r O otein particles may have high r eac t ivity and, ev en if 1ghT low soluble calcium, high colloidal calcium per protein.The UF-HDF samples showed a stiffer gel compared with UF control and UF-LDF, i n spite of having the lowest amount of colloidal calcium. Previous research has shown that the Tan 8 value for rennet casein gels is negatively correlated with colloidal calcium content (Ozcan et al., 2011; Bauland et al., 2022); this is not the case in t he present work, since, in spite of the similar colloidal calc i um concentration in MF retentates, their gel a tion behavior was very dif f erent (Table 2). Hence,we concluded that the dissociated caseins, the soluble calcium, the colloidal calcium per protein, as well as a reorganization of the casein proteins within a micelle,are all factors playing key roles in the ge l ation of casein proteins induced by chymosin. The acid-gelation behavior of the casein suspensions prepared with the var i ous f iltration treatments was also evaluated in situ, without dilution, using small osci l la-tory r heology. Figure 9 i l lustrates the di ff erences in t he gelation pH between the concentrates. The gelation pH was statistically different between control, LDF, and HDF concentrates (P < 0.01; Figure 9). In both LDF and HDF samples, gelation occurred at a higher pH compared with control and SM. This inc r ease in the gelation pH has been reported before, attributed to the presence of soluble complexes (Li and Corredig, 2020).However, this is not the case in these samples, prepared with parallel processes. Clear differences are observable b etween MF and UF concentrates, with a higher gela-tion pH for MF than for UF samples, despite the lower soluble aggregates found in MF compared with UF(Figure 3). Therefore, this study shows that t he lower ionic strength of the continuous phase, and the colloidal calcium per protein present i n the samples, are t he f ac -tors that affect acid-induced destabilization. As shown in Figure 7, the overall charge of the concentrates in- F ig u r e 9. Av e rage value s of pH of gelation for microfi l t e red (MF,squar e s) a nd UF milk concentrates (c i rcles ) and ski m mi l k (triangle s ),a fter addition of glucono-8-l a ctone 3% (wt /wt ) to conce n trates and 1.3% (wt /wt ) to skim mi lk . Control (solid symbols), w i thout di a f i l tr a-tion; LDF (gr a y s y mbols)= low-diafil t ered milk; HDF (empty sym-bol s ) = high-di a filtered milk; skim milk control (tr iangle s ). Result s are a verag e of 2 independent f il t r a tion expe r iments with SD. creased markedly between control, LDF, and HDF con-centrates, which would point t o a higher charge r epul-sion for the casein p articles in the diafiltered samples.It may be hypothesized that , during acidification, the residual colloidal calci u m was released from the casein micelles and wou l d resul t i n rapid neutralizat i on of t he protein structures. CONCLUSIONS This work demonstrates that the extent and mode of DF cause changes not on ly i n the composi ti on of the soluble phase of the concentrates but also in the functionality of the micel l ar caseins. The protein mate-rial present i n the serum phase al s o plays a r ole in the aggregation of the casein micelles and the propert i es of the final gels. The novelty of the work lies i n the systemat i c evaluat i on of concentrates compared at the same (4x) volume fraction, but with dramatic differ-ences in the amount of soluble i ons, as wel l as presence of B -CN and whey p roteins in t he soluble phase. Soluble caseins were p resent i n higher concentration in UF after diaf i ltrat i on. However , corresponding MF samples had similar colloidal calcium concentrations, but profound di ff erences were found not only for caseins but also i n t h e size and reactivity of the casein m i ce l les. The lowest apparent hydrodynamic size was found for extensively diafi l tered caseins. Gelation exper i ments demonst r ated t hat , after HDF, case i n part i c l es gelled at a higher pH during ac i di f ication and, with addition of chymosin,formed gelswith high elast i c modulus.. This study shows that the permeation of B-CN and whey proteins during the process of casein micel l es concentration can strongly affect t he technological properties of the f inal product . ACKNOWLEDGME N TS This work was funded b y t h e Danish Milk Levy Fund (Aarhus, Denmark). The suppor t of Ar l a Food Amba (Aarhus, Denmark) and the Center f or Innovative Food (CiFOOD) at Aarhus University (Aarhus, Denmark)is also greatly acknowledged. Data were generated through accessing the research infrastructure at Aarhus University, including FOODHAY (Food and Health Open Innovation Laboratory, Danish Roadmap for Re-search In f rastructure). The author s have not stated any conf li cts of interest . REFERENCES A t a mer , Z., A . E . Po s t , T. Schuber t , A. Holder , R . M. Boom, a nd J.Hinrichs. 2017. Bov i ne B -casein: I s olation, prope r t i es and f u nc ti on-a lity . A rev i ew. Int. Dairy J . 66:115-125. ht t ps://d oi .org /10.1016/j .idair yj .2016.11.010. Baul a nd, J., M.-H. F a me la rt, M. Faive l ey, and T . C r oguennec . 2022.Rheologic a l propert i es of enzymat i c mi l k ge l : Effec t of ion part i-tioning in case i n mice l les. Food Hydrocoll . 130:107739. https://d oi .org/10.1016/j .f oodhyd .2022.107739. Choi, J., D. S . Horne, M. E. J ohns o n, a nd J . A. Lucey . 2004. Effects of in s oluble calcium phosphat e on cheese func t ionalit y . J . Dairy Sc i .87(Suppl . 1):231. Choi, J., D. S . Horne, and J. A . Lucey. 2007. Effec t of insolubl e cal-cium concentr a tion on rennet co a gu l at i o n prope r t i es of mi l k . J.Dairy Sc i . 90:2612-2623. h t t ps ://d oi.org /10.3168/jds .2006-814. Corr e di g, M., P. K. Nair, Y. Li, H. Eshpari, and Z. Zhao. 2019. In-vited review: Understanding the behavior of caseins in mi l k con-c e ntr a tes. J . Dairy Sc i . 102:4772-4782. h t t ps://d oi .org /10.3168/jds.2018-15943. Corredig , M., a nd E. Salvatore . 2016. Enzymati c coagul a t i on of milk.Page s 287-307 in Adv a nced Dairy Chemistry, Volume 1B. Pro-teins: Applied Aspect s. P. L . H. McSweeney and J. A. O'Mahony ,ed. Spr i nge r . Coskun, O.,L. Wiking, S. R. Yazdi , and M. Corredig. 2022. Molecular d etails of the formation of s ol u ble aggregates during ultr a f i ltr a -tion o r m icrof i ltr a tion combined with dia f ilt r ation of skim milk.F o od Hydro c oll. 124:107244. h ttps://doi .org/10.1016/j.f ood h yd .2021.107244. Creamer , L. K., a nd G. P . Berry. 1975. A s tudy of the properties of dissoci a ted bovin e casein mice lles . J. Dairy Res. 42:169-183. https://doi .or g /10.1017/S002202990001520X . Dahbi, L., M. Alex a nde r , V . Trappe , J . K. Dhont , a nd P. Schurten-berger . 2010. Rheology and s truc t ural a rrest of c a se i n s uspensions.J . Colloid I nterf a ce Sc i. 342:564-570. ht t p s ://d oi.org /10.1016/j .jcis.2009.10.042. Dalgle is h, D. G. 2011. On the struc t ur al models of bov i ne c a se i n mi-ce l les -Review and possible improvement s . Soft Mat t e r 7:2265-2272. htt p s ://doi .org/10.1039/C0SM00806K. Dalgle i sh, D. G., and M. Corredig. 2012. The struct u re of the casein micelle of mil k and i ts changes dur i ng pr o cessing. Annu. Rev. Food Sci . Technol. 3:449-467.https://doi .org/10.1146/annurev-food -022811-101214. Dalglei s h, D. G., and A. J . R. Law. 1988. pH-i nduced di s soc i ation of bovine casein mice l les. I . Analysis of l i berated c a se i ns. J. Dai ry Res. 55:529-538. h tt p s ://doi.org/10.1017/S0022029900033306. d e Kruif , C . G., and E. B. Zhul i na. 1996. K-C as ein a s a polye l ect r olyte brush on the s ur f ace of c a sei n mice ll e s . Colloi d s Sur f . A Physi-cochem. Eng. Asp. 117:151-159.h tt p s ://doi .org/10.1016/0927-7757(96)03696-5. de Kruif , C . G. 1999. C as ein mice l le inter a c t ions. Int . Dairy J. 9:183-188. https ://doi .o rg/10.1016/S0958-6946(99)00058-8. Donat o , L., a nd G. D. Dalgle i sh. 2006. Effect of the pH o f heat i ng on the qu a lit a tive a nd quantit a t i ve compositions of the sera of recon-s tituted s kim mi l ks and on the mechanisms of formation of soluble a g greg a tes. J . Ag r ic . Food Chem. 54:7804-7811. https://doi.org/10.1021/jf 060961i. Donato, L., F . Guyomarc ’h, S. Amiot , and D. G. Dalgle i s h. 2007. For-mation of whey protein/k-c a sein complexes in he a ted milk: Pre f er-enti a l re a ct i on of whey protein with k-ca s e i n in the c a sein mice l les.Int . Dairy J . 17:1161-1167. https://doi.or g/10.1016/j .id airy j.2007.03.011. Eshpari, H., R. Jimenez-Flores , P. S . Tong, and M. Corredig. 2015.Part i al calc i um depletion during membr a ne fi l tration a ff e c t s ge -lat i on of r e cons t ituted milk prote in concentr a t e s. J . Dairy Sc i.98:8454-8463. h t tps ://doi.org/10.3168/jds.2015-9856. Ferrer, M. A., M. A l exander , and M. Cor r edig. 2011. Does ultraf i ltra-tion have a l a st i ng ef f ec t on the physico-chemical proper t ie s of t he case i n mice l les? Dairy Sc i . Technol. 91:151-170. h tt p s://doi.org/10.1007/s13594-011-0002-0. Fox, P. F., T. P. Guinee, T. M. Cogan, a nd P. L. H. McSweeney. 2017.Enzymat i c coagulation of milk. Pages 185-229 in Fundamentals of Cheese Sc i ence . Springer US. Gaucheron, F. 2005. The miner a ls of milk. Reprod. Nutr. Dev . 45:473-483. h tt p s://doi.org/10.1051/rnd :2005030. Gavazzi-Apri l,C ., S. Benoit , A. Doyen, M. Britt e n, and Y. Pouliot .2018. Preparati o n of milk prote i n conc e ntr a tes by ult r af i l t r a t i on and cont i nuous diafi l tration: Eff e ct of process de s ign on overall ef f iciency . J. Dairy Sci . 101:9670-9679. ht t ps://d oi .o rg /10.3168/j ds.2018-14430. Gaygad z h i ev , Z., V. Mas s e l , M. Al e xander, and M. Corredig. 2012.Addition of sodium caseinate to skim milk inhibi t s rennet -i nduced ag greg a tion of c as ein mice l les. Food Hydrocoll. 26:405-411. h t t ps://doi.or g /10.1016/j .foodhyd.2011.02.015. Holt, C . 1985. The mil k s a lts: Th e i r s ecreti o n, concent r ations a nd phy s ical chemi st ry. Page s 143-1811i in n Dev e lopment s in Dair y Chemistry —3: Lactose a nd Minor Const i tuent s . P. F . Fox, ed.Spr i n g er Netherl a nds. Horne , D. S. 2020. Chapter 6: Case i n mice l le st r ucture and st a bi l i t y .Pages 213-250 in Milk Pr o teins. 3rd ed. M. Bol a nd a nd H. Singh,ed. Academic Press. Horne, D. S., and C . M. Davidson. 1993. Direct obs e rvat i on of decrease in s i z e of casein mice l les dur i ng the i ni ti al st a ges of r enne t ing of skim mi l k . Int . Dairy J. 3:61-71. h t t ps://d oi .org/10.1016/0958-6946(93)90076-C . Jarto, I., J. A. Lucey, a nd K. E. Smith. 2018. I mpact of proc es sing temperature on product i on of mi l k prote i n perme a te during m ic r o-filtr a tion of skim or whole milk. Int . J. Dairy T e chnol . 71:844-848.https://doi.or g/10.1111/1471-0307.12542. Kali a ppan , S ., and J. A. Lucey. 2011. I nfluence of mi x tures of c a l-c i um-chel a ting salts on the physicochemic a l proper ti es of case i n micelles. J. Dairy Sc i. 94:4255-4263. h t t ps://d oi.o r g/10.3168/j ds .2010-3343. Kar l sson, A. O., R. Ipsen, K. Schrader , a nd Y. Ardo. 2005. Re l ation-s hip betw e en phy s ic a l propertie s of case i n mice l l es a nd rheology of skim milk. J. Dairy Sc i . 88:3784-3797. h ttps://d oi.o r g/10.3168/jds .S0022-0302(05)73064-2. Li, Y., a nd M. Corredig. 2020. Ac i d induced g e l ation behavi o r of skim milk concentrated by membr a ne f ilt ration. J. T exture St u d.51:101-110. Li , Y., D. Dalgle i sh , and M. Corredig. 2015. Inf l uence of heating tre a t-ment a nd membr a ne concentration on the f o rmation of soluble aggregates. Food Re s . Int . 76:309-316. https://d oi.org /10.1016/j .foodres.2015.06.016. Lucey, J. A., P. A. Munro, and H. Si n gh. 1999. Ef fe c t s of heat tre at -ment and whey prot e i n a d dit i on on the r heo l ogical proper t ies and struct ur e of ac i d skim m i lk ge ls. Int . Dairy J. 9:275-279. h ttps://doi .or g/10.1016/S0958-6946(99)00074-6. Ozcan, T ., D . Horne, a nd J. A. Lucey. 2011. Effec t of increasing the colloid a l calc i um phosphate of mi l k on the t e xture a nd mic r o-struct ur e of yogurt . J . Dairy Sc i . 94:5278-5288. h ttps://do i.org/10.3168/jds.2010-3932. Re i t e r, M., M. Re i tmaier , and U. Kulozik. 2022. Compos i t io nal changes of c a sein micelles induced by c a lcium or chel a t a nt addi-tion at threefold a nd natur a l casein concentration. Int . Dairy J.130:105365. h t tps ://doi .org/10.1016/j.i dairyj.2022.105365. Reitmaier,M., I. Bachmann, H.-J . Heidebrecht , and U . Kulozik. 2021.Effect of change s i n io nic compos i t ion induced by dif f e r en t diafil-tration medi a on depos i ted l a yer pr o pert i es and separat i on e f fi-ciency in mi l k protein fr a ctionation by mic r ofiltr a tion. Int . Dairy J . 120:105089. h ttps://doi.or g/10.1016/j .idairy j .2021.105089. Renan, M., O. Mekmene , M. H. Famel a r t , F . Guyomarc ’h, V. Arnoul t-Deles t, D. Paquet , a nd G. Brule . 2006. pH-Dependent behaviour of soluble prot e in aggregat es formed during heat-treatment of milk a t pH 6.5 or 7.2. J . D airy Res. 73:79-86. https://d oi .org /10.1017/So022029905001627. Rose , D. 1968. Re l a ti o n between m i c e llar and serum c a sein in bo-vine milk. J. Dairy Sc i. 51:1897-1902. h ttps://d oi .o r g/10.3168/jds .S0022-0302(68)87308-4. Sandra , S., M. Al e xander , a nd D. G. Dal g le i sh. 2007. The rennet co-agul a tion mechanism of skim mi l k as obse r v e d by transmission diffusing w a ve spectroscopy . J. C o lloid Inter f ace Sci . 308:364-373.htt p s://doi.or g/10.1016/j.jc is.2007.01.021. S a ndra , S ., C. Cooper, M. A l e xander , and M. Corredi g . 2011. Coagula-tion pr o perties o f ultrafil te red milk re t ent a t es me a sured using rhe -ology a nd diffusing wave spectroscopy . F o od Res. Int . 44:951-956.https://doi.or g/10.1016/j .foodres.2011.02.018. Sch a fe r , J., T . Schubert , and Z . At a mer . 2019. Pilot -s c a l e B -c as e i n d e pletion from mice l l a r c a se i n via cold microfi l tr a t i on i n the diafil -tr a tion mode . Int . Dair y J . 97:222-229. h t t ps://d oi.org/10.1016/j .idai ryj .2019.06.009. Se ib e l , J. R., M. S. Molitor , and J. A. Lucey. 2015. Proper ti e s of case i n concentrates cont a ining var i ous l eve l s of bet a -case i n. Int . J. Dairy T e chnol . 68:24-29. h t t ps://d oi.or g/10.1111/1471-0307.12170. Udabage, P ., I . R. McKinnon, and M. A. August i n. 2000. Mineral a nd c as e i n equi l ibria i n milk: Ef f ect s o f a dded s alt s a nd calc i um-che -l a t i ng age n t s . J . Dairy Re s. 67:361-370. h t t ps://doi .org /10.1017/S0022029900004271. ORCIDS Ozgenur C o skun @ h ttps ://orc i d.org/0000-0002-4466-658X Lars W i king @ h t tp s://orcid.or g/0000-0002-1601-2933
确定
还剩12页未读,是否继续阅读?

产品配置单

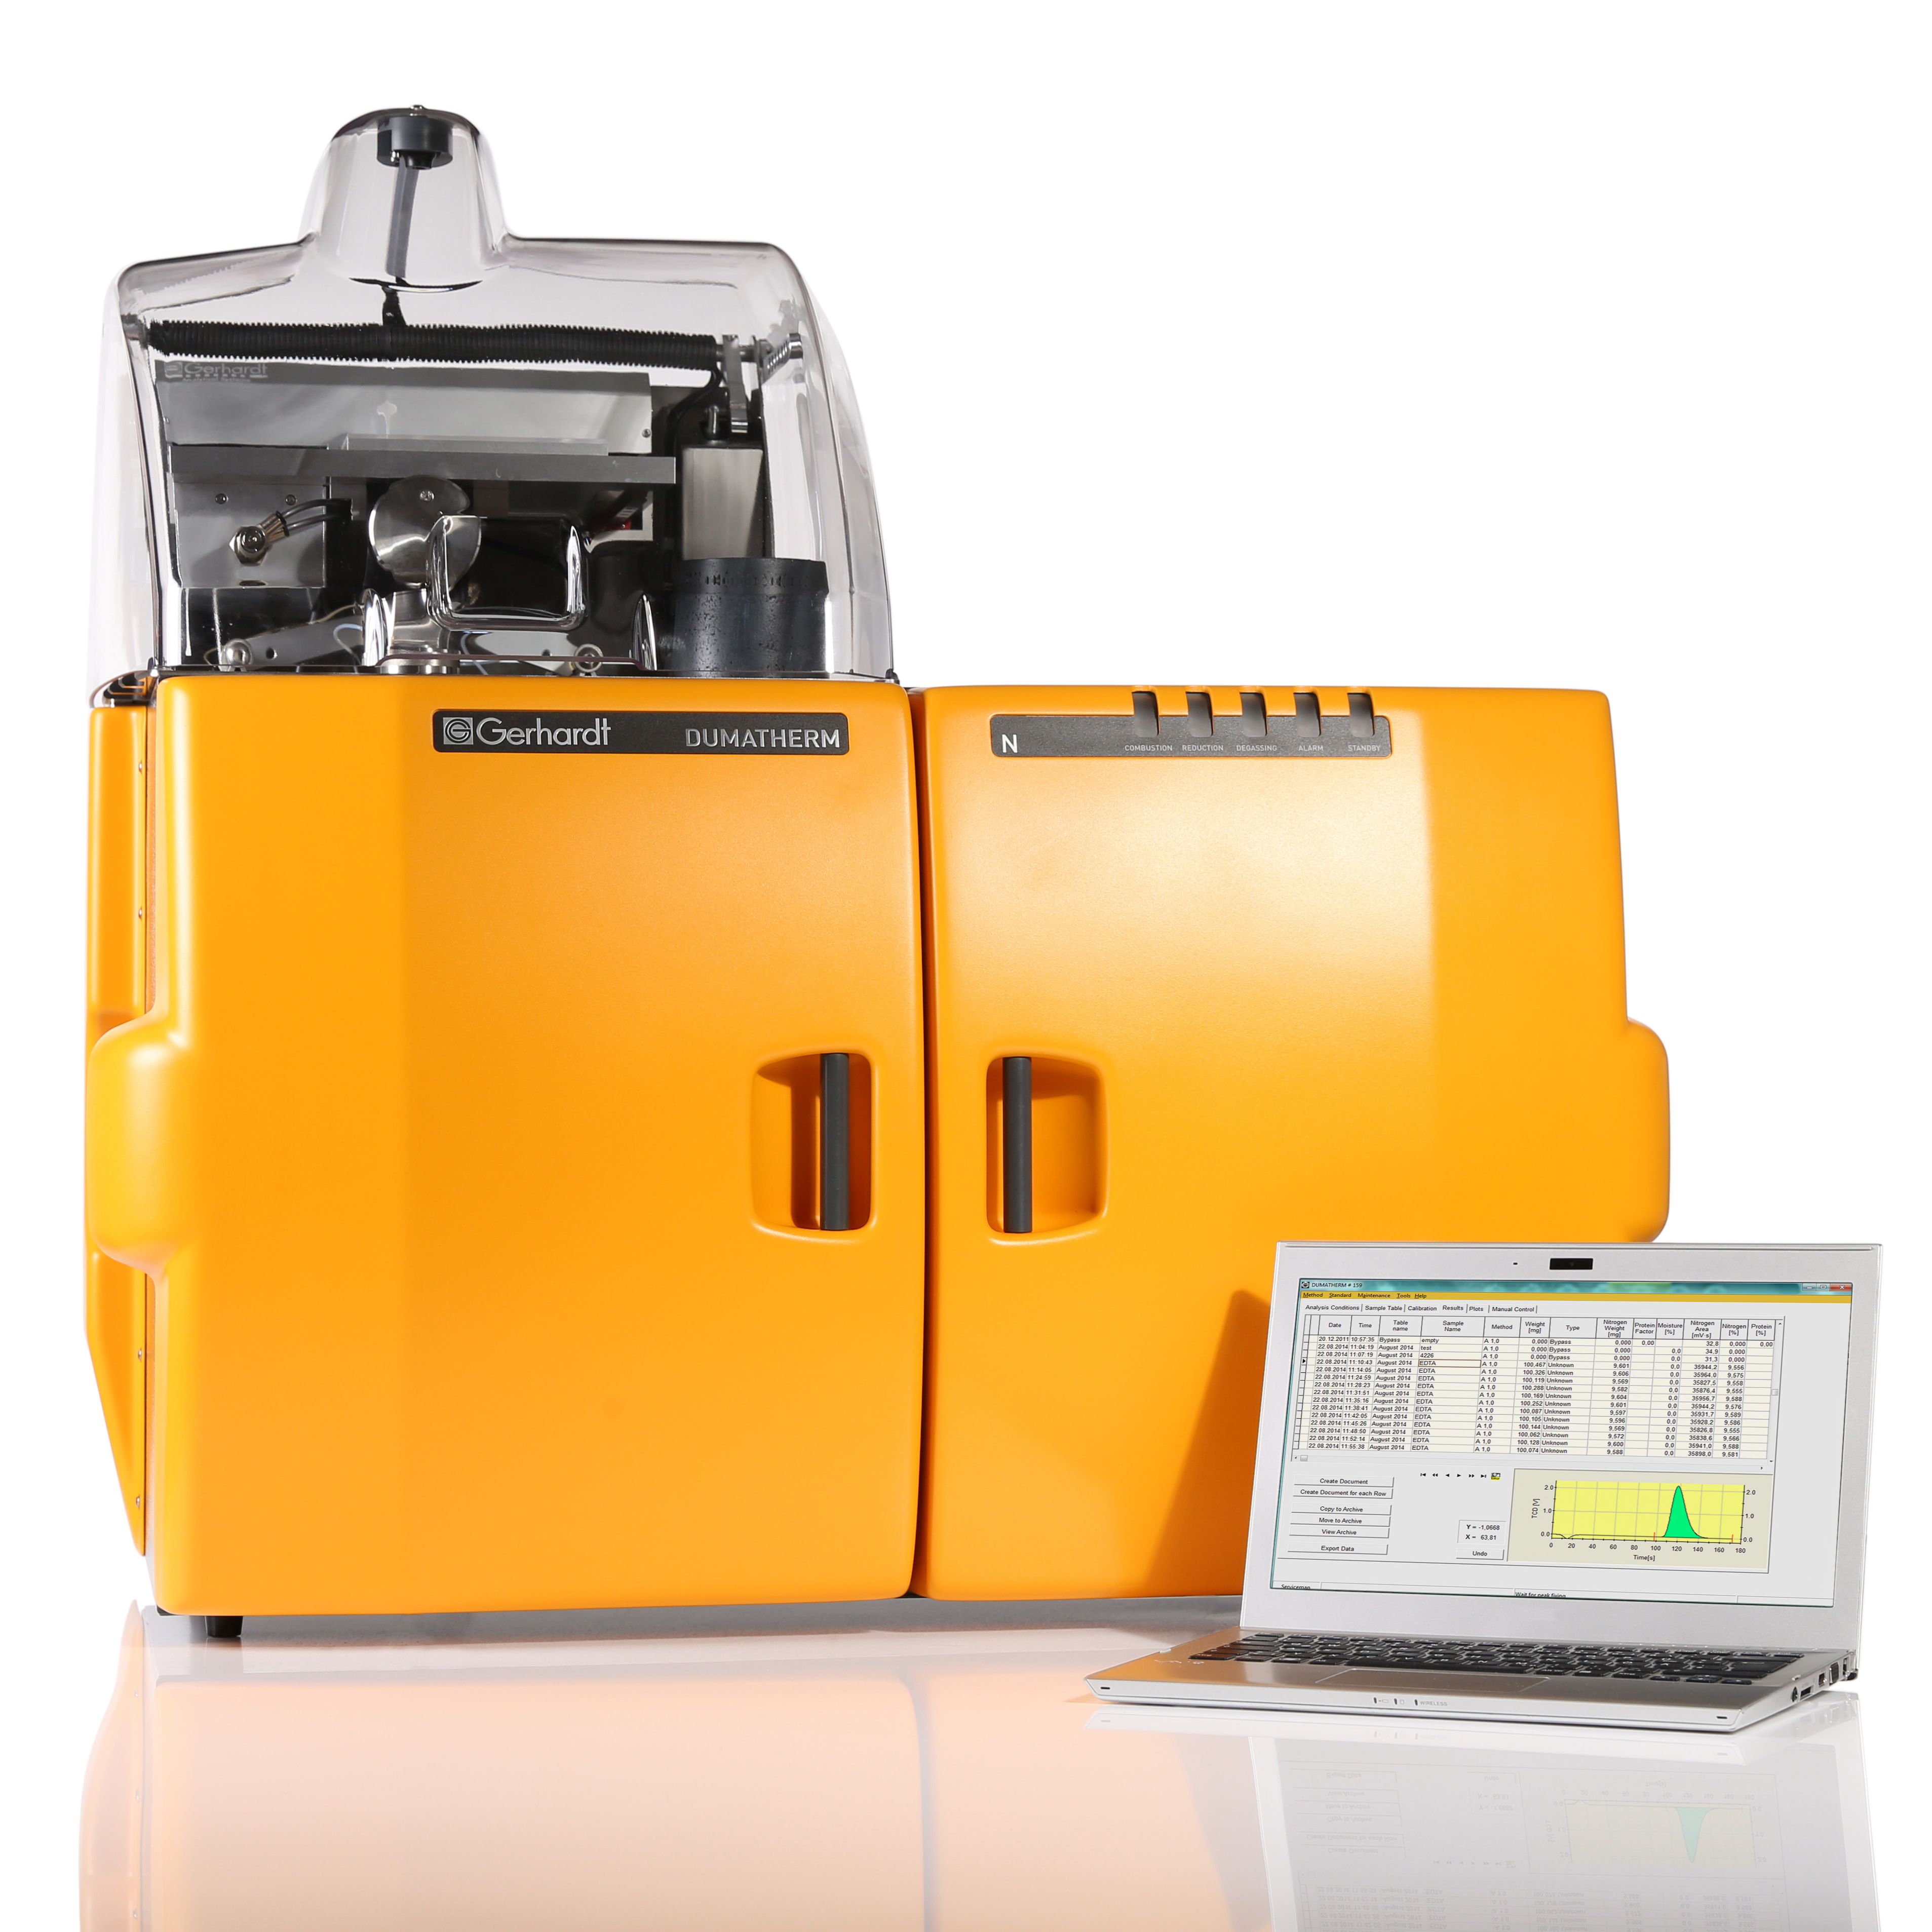
中国格哈特为您提供《冷超滤牛奶、冷微过滤牛奶中蛋白质和非蛋白氮的检测》,该方案主要用于液体乳中营养成分检测,参考标准《GB 5009.5 食品安全国家标准 食品中蛋白质的测定》,《冷超滤牛奶、冷微过滤牛奶中蛋白质和非蛋白氮的检测》用到的仪器有格哈特杜马斯定氮仪DT N Pro
推荐专场


相关方案
更多
该厂商其他方案
更多