


方案详情
文
Amethodisproposedthatmakespossibledeterminingtotaland“thermallystable”vanadiumincrudeoilwithoutpriorseparation,andtocalculate“volatile”vanadiumbydifference.Thevolatilefractionisbelievedtobelargelyvanadylporphyrinecomplexes.Themethodisbasedontheunsurpassedbackgroundcorrectioncapabilityofhigh-resolutioncontinuumsourcegraphitefurnaceatomicabsorptionspectrometry(HR-CSGFAAS),whichallowspyrolysistemperaturesaslowas300◦Ctobeused.Thesampleswerepreparedasoil-in-wateremulsions,andaqueousstandardsemulsifiedinthesamewaywereusedforcalibration.Totalvanadiumhasbeendeterminedusingapyrolysistemperatureof400◦C,and“thermallystable”vanadiumusingapyrolysistemperatureof800◦C.Thecontentoftotalvanadiumin12Braziliancrudeoilsampleswasfoundtobebetweenlessthan0.04andabout30mgkg−1.Thevolatilefractionwasbetween5and51%ofthetotalcontent,andtherewasnocorrelationbetweenthetotalandthevolatilevanadiumcontent.Thelimitsofdetectionandquantificationwere0.04and0.12mgkg−1ofVincrudeoil,respectively,basedonamassof2gofoilin10mLofemulsion.Theprecisionwasbetterthan4%atthe3mgkg−1levelandbetterthan1.5%atthe30mgkg−1levelofVincrudeoil.
方案详情

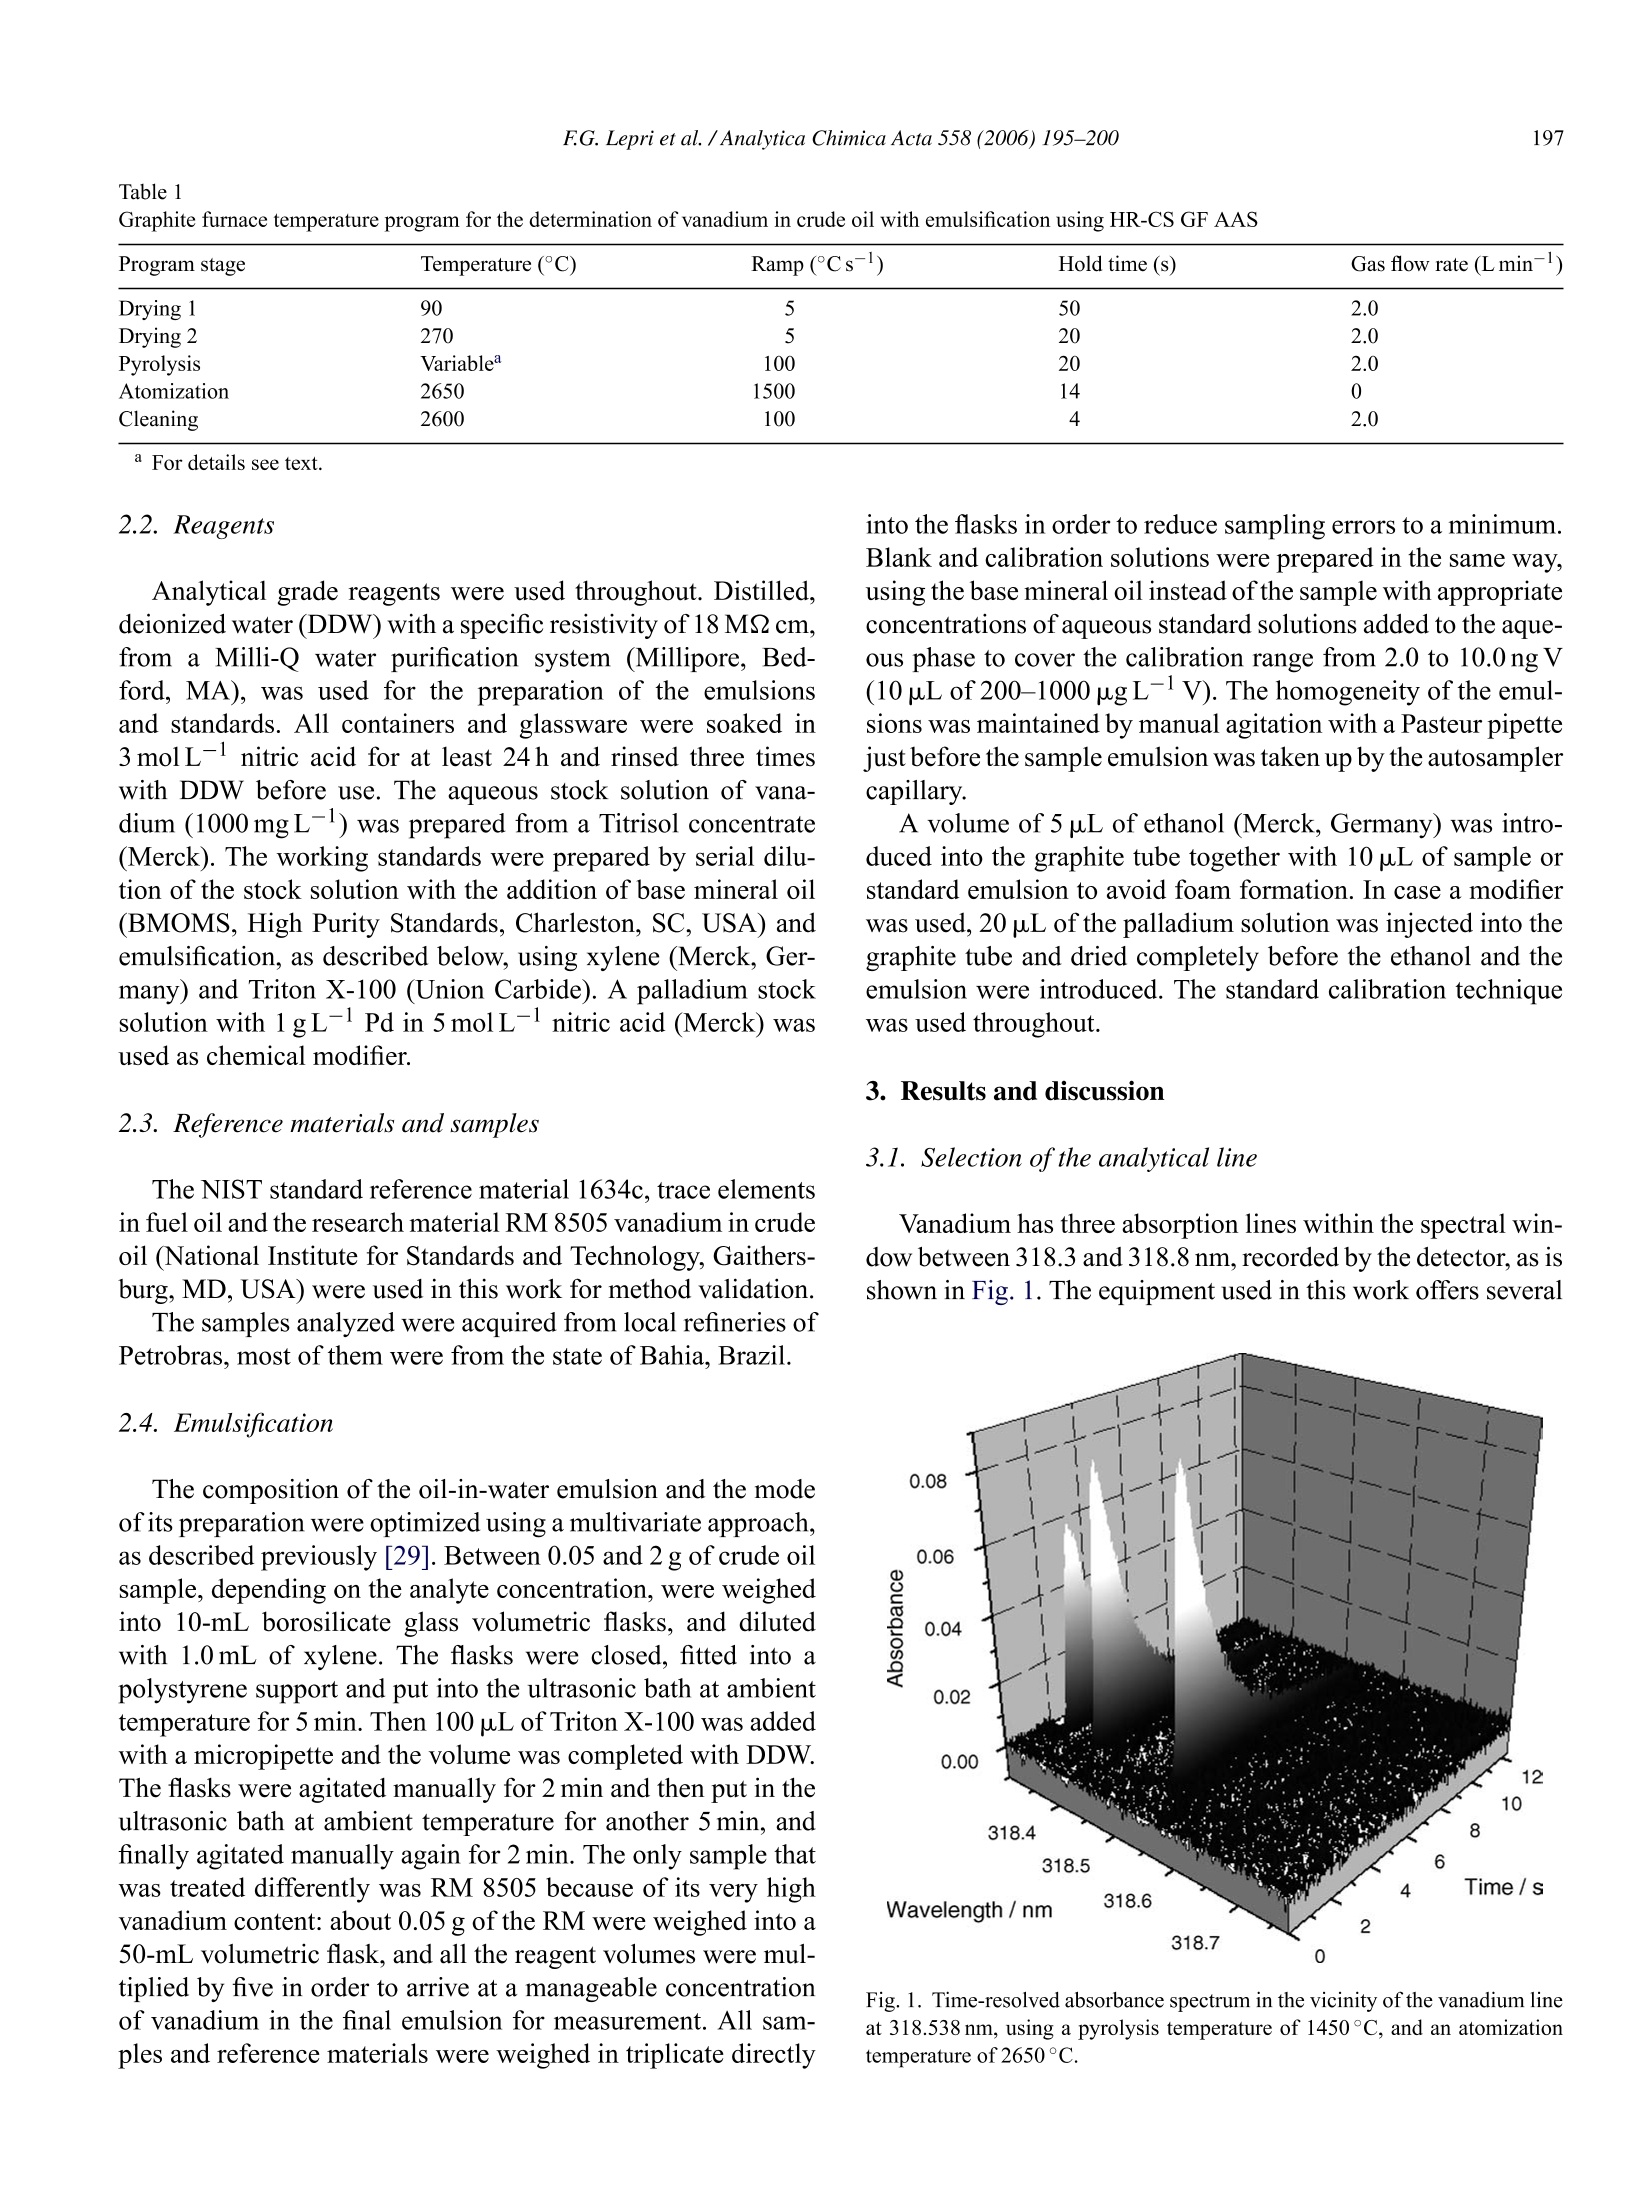
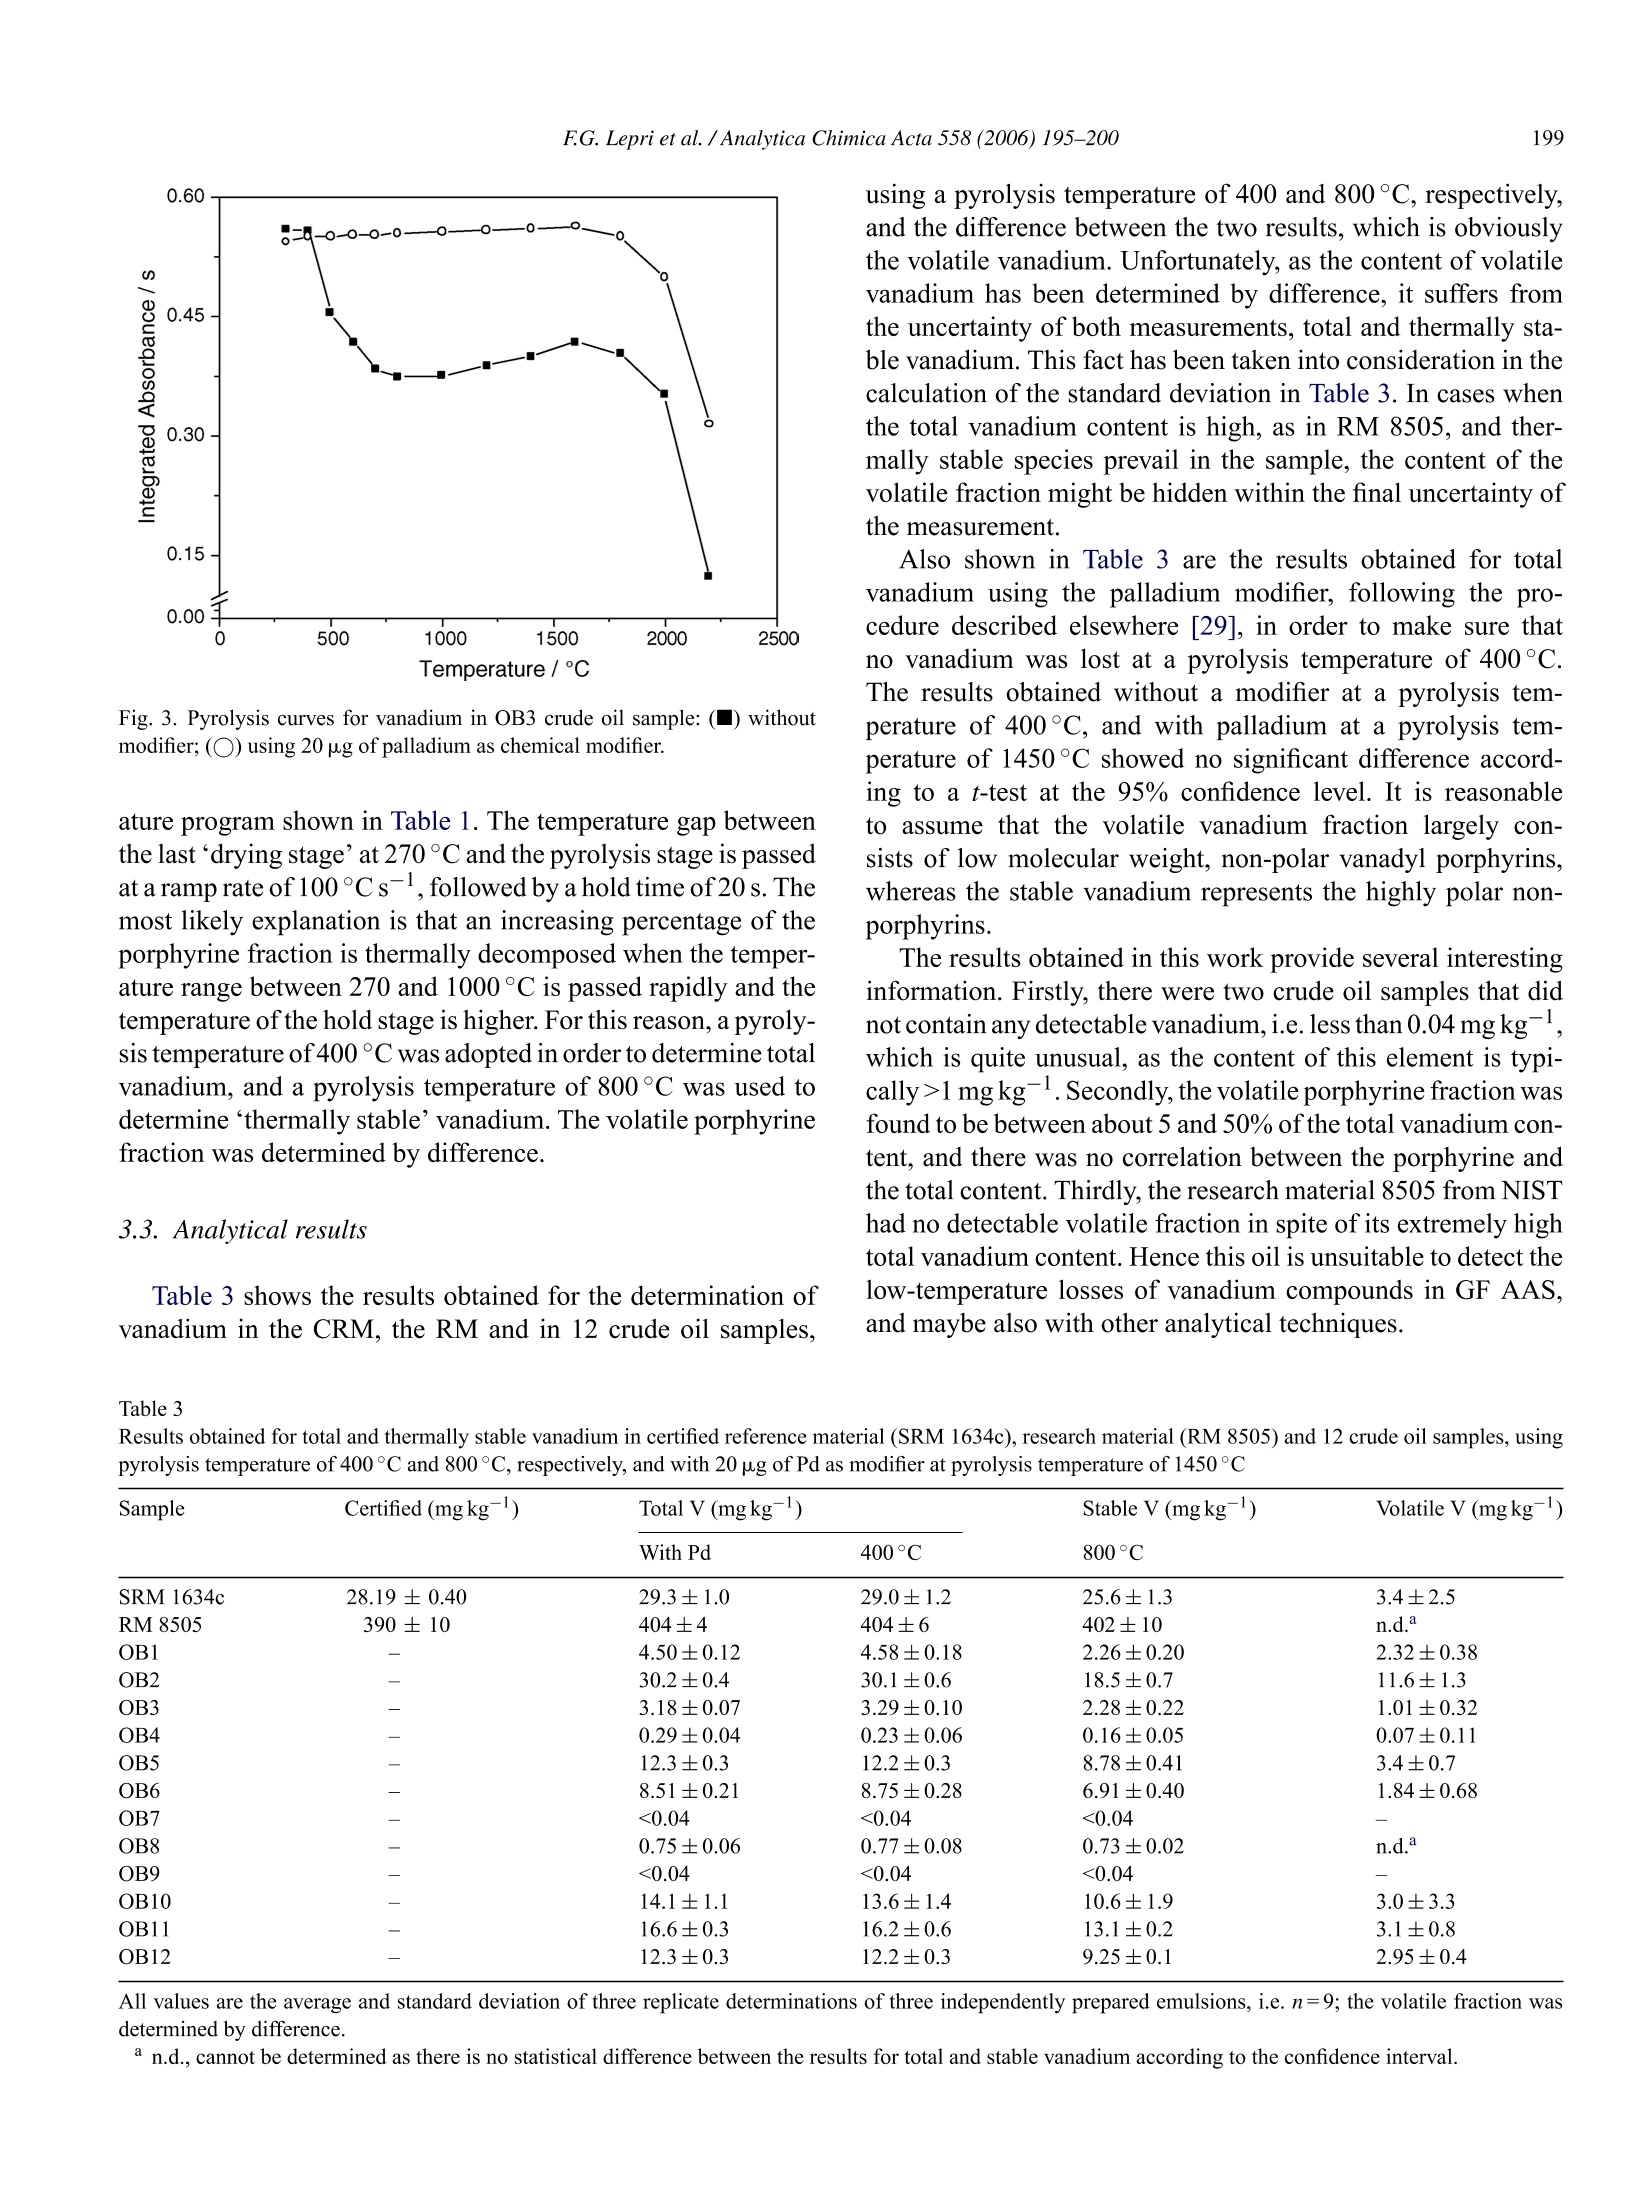
Available online at www.sciencedirect.comAnalytica Chimica Acta 558 (2006) 195-200www.elsevier.com/locate/aca :196FG.Lepri et al. /Analytica Chimica Acta 558(2006)195-200 ANALYTICACHIMICAACTA Speciation analysis of volatile and non-volatile vanadium compounds inBrazilian crude oils using high-resolution continuum source graphitefurnace atomic absorption spectrometry Fabio G. Lepri, Bernhard Welz a*, Daniel L.G. Borges, Alessandra F. Silva a,Maria Goreti R. Vale, Uwe Heitmann° a Departamento de Quimica, Universidade Federal de Santa Catarina, 88040-900 Florian6polis, SC, Brazil Instituto de Quimica, Universidade Federal do Rio Grande do Sul, Av. Bento Goncalves 9500, 91501-970 Porto Alegre, RS, Brazil ISAS -Institute of Analytical Sciences, Department Berlin, Albert-Einstein-Str:9, 12489 Berlin, Germany Received 22 September 2005; received in revised form 27 October 2005; accepted 31 October 2005 Available online 2 December 2005 Abstract A method is proposed that makes possible determining total and“thermally stable vanadium in crude oil without prior separation, and tocalculate“volatile” vanadium by difference. The volatile fraction is believed to be largely vanadyl porphyrine complexes. The method is based onthe unsurpassed background correction capability of high-resolution continuum source graphite furnace atomic absorption spectrometry (HR-CSGF AAS), which allows pyrolysis temperatures as low as 300°C to be used. The samples were prepared as oil-in-water emulsions, and aqueousstandards emulsified in the same way were used for calibration. Total vanadium has been determined using a pyrolysis temperature of 400°C, and“thermally stable”vanadium using a pyrolysis temperature of 800°C. The content of total vanadium in 12 Brazilian crude oil samples was foundto be between less than 0.04 and about 30 mg kg. The volatile fraction was between 5 and 51% of the total content, and there was no correlationbetween the total and the volatile vanadium content. The limits of detection and quantification were 0.04 and 0.12 mg kg- of V in crude oil,respectively, based on a mass of 2 g of oil in 10mL ofemulsion. The precision was better than 4% at the 3 mgkg-level and better than 1.5% atthe 30 mg kglevel of V in crude oil. O 2005 Elsevier B.V. All rights reserved. Keywords: Vanadium in crude oil; Graphite furnace atomic absorption spectrometry; High-resolution continuum source atomic absorption spectrometry; Volatilevanadyl porphyrins; Palladium modifier 1. Introduction Vanadium in crude oil occurs in a variety of compounds,which originate largely from the formation ofcrude oil. Amongthem are non-polar porphyrin complexes, which originate fromthe plant chlorophylls through the substitution of Mg with thetrace element [1], and polar, salt-lik1 Pe non-porphyrins [1-3].Their concentration, which is typically in the mg kg-range,provides information about the maturity and the origin of thepetroleum [4]. Vanadium is a serious catalyst poison, and maycause undesirable side reactions in refinery operations. Poreblocking, fouling of active sites and change in catalysts selec- ( * Corresponding a u thor. Fax: + 55 4 8 3 3 31 68 5 0. ) ( E-mail addresses: welz@qmc.ufsc.br, w.bernardo@terra.com.br(B. Welz). ) ( 0003-2670/S-see front matter 2 00 5 Else v ier B. V . Al l rights reserved.doi:10.1016/j.aca.2005.10.083 ) tivity are typical problems [5]. Vanadium, in addition causescorrosion problems that derive from the formation, e.g. in thecombustion chamber of power plants, of sodium vanadates,which have low melting points; the molten vanadates react withthe metal surface of the superheaters and form the metal oxide[61. A variety of spectrometric techniques have been used for thedetermination of vanadium in crude oil and petroleum prod-ucts, such as inductively coupled plasma (ICP) optical emissiorspectrometry [7-9], ICP mass spectrometry [10-12] and X-ray fluorescence spectroscopy [13,14]. However, flame atomicabsorption spectrometry (F AAS) has been the technique ofchoice in most publications [15-21]. The main advantages ofthat technique are that firstly, a direct determination of the ana-lyte in the hydrocarbon matrix appears to be possible aftercorresponding dilution with an organic solvent, and secondly, the flames used in F AAS, in contrast to an ICP, are quite tolerantto most organic solvents. Nevertheless, direct determinations arenot free of problems since the solvent and the compounds usedfor calibration have a substantial influence on the sensitivity. Forthe analysis of crude oil, it is important to use a solvent mixturethat contains a component to completely dissolve asphaltenesand resins, which only have limited solubility in non-polar sol-vents. For a direct determination of vanadium in diluted crudeoil samples, complete agreement between the metal compoundin the test sample solution and in the calibration solution wouldbe ideal [18]. This is not possible because vanadium is present ina number of various compounds in crude oil,and the composi-tion is a priori not known in advance. A number of reports havebeen published on differing sensitivities of the various organiccompounds of vanadium by F AAS [15,22,23]. Graphite furnace (GF) AAS appears to be an alternativesince the problem of differing sensitivity for various compoundsapparently does not exist; the results from a simple dilutionwith xylene and ashing were found to be practically identi-cal [24]. In addition, crude oil can be so strongly diluted thatthe hydrocarbon matrix does not cause any major interference[25]. The formation and analysis of an oil-in-water emulsion ormicroemulsion instead of a dilution of the crude oil sample withan organic solvent has been proposed for F AAS [21], as wellas for GF AAS [26-29] with the distinct advantage that aqueousstandards could be used for calibration. However, recent investigations by these authors have shownthat GF AAS is not without problems either, and might actu-ally be a source for severe systematic errors [28,29]. A carefulinvestigation of the determination of nickel in crude oil revealedthat up to 50% of the nickel might be lost during the pyrol-ysis stage already at temperatures above 400°C, whereas therest of the nickel was thermally stable up to about 1400°C[28]. Based on literature data [3] it has been assumed that itwas the non-polar porphyrins that were lost, whereas the highlypolar non-porphyrins were retained in the graphite tube to hightemperatures. A similar behavior was also found for vanadium[29]. One of the big problems is that pyrolysis temperatureslower than 600°C cannot be investigated when conventionalGF AAS is used because of the excessively high backgroundabsorption caused by the oil matrix under these conditions, par-ticularly when deuterium arc background correction is used. Thedetermination of total nickel and vanadium in crude oil hencerequires the addition of a chemical modifier in order to stabilizethe volatile compounds [29], which complicates the proceduresignificantly. The goal of this work was to investigate if high-resolutioncontinuum source (HR-CS) GF AAS could be used for kind ofa speciation analysis of vanadium in crude oil, in order to dis-tinguish between the volatile porphyrin complexes and the non-volatile non-porphyrins. The far superior background correctioncapability of HR-CS AAS makes possible to use pyrolysis tem-peratures as low as 300°C for crude oil analysis. No losses ofvanadium porphyrins are expected under these conditions, sothat the total analyte content could be determined under theseconditions, whereas the concentration of the non-porphyrinscould be determined using higher pyrolysis temperatures, pro- viding the amount of porphyrins by difference. The expectedadvantage of this procedure would be that kind of a fractiona-tion could be obtained without any additional sample preparationand without any chromatographic or other pre-separation. 2. Experimental 2.1.Instrumentation All measurements in this work were carried out using a proto-type high-resolution continuum source atomic absorption spec-trometer,built at ISAS Berlin(Berlin, Germany). The instrumentis based on a Model AAS 6 Vario (Analytik Jena AG, Jena, Ger-many), from which the entire optical compartment includingdetector and associated controls had been removed and replacedby a high-resolution double monochromator (DEMON),similarto the system described by Heitmann et al. [30]. The instru-ment, which utilizes a high-intensity xenon short-arc lamp asa continuum source, and a linear CCD array detector with 512pixels, among other features, has been described in detail pre-viously [28,31]. At 318.538 nm, the most sensitive absorptionline of vanadium, the resolution per pixel was 2.4 pm, and anintermediate slit width of 200 um was used, making possiblethe simultaneous evaluation of 200 pixels, corresponding toabout ±0.25 nm around the analytical wavelength. The vana-dium absorption was measured using the central pixel (CP)only, and CP±1, i.e. over a spectral interval of about 8 pm.However, only the data obtained using CP±1 are presented inthis work because of the better sensitivity and signal-to-noiseratio obtained under these conditions; otherwise the differencebetween the two modes of evaluation was of negligible influ-ence on the analytical results. The system was controlled by aPentium III, 1000 MHz personal computer, running an in-housedeveloped data acquisition program. The conventional transversely heated graphite tube atomizersystem, supplied by Analytik Jena together with the Model AAS6 Vario, was used throughout. All experiments were carried outusing pyrolytically coated graphite tubes with an integrated PINplatform (Analytik Jena Part No.407-A81.025). An MPE 5 fur-nace autosampler (Analytik Jena AG) was used for introductionof emulsions and solutions. Argon with a purity of 99.996%(White Martins, Sao Paulo, Brazil) was used as the purge gaswith a flow rate of 2.0L min- during all stages, except duringatomization, where the flow was stopped. Integrated absorbance(peak area) was used exclusively for signal evaluation and quan-tification. The optimized graphite furnace temperature programused for all determinations with HR-CS GF AAS is given inTable1. In case when a chemical modifier was used, the mod-ifier solution was introduced first, and the first two steps of thetemperature program were executed in order to dry and ‘condi-tion’the modifier. Then the program was stopped and the furnaceallowed cooling before the sample was introduced, and the entiretemperature program executed. A Unique-Thorton Model USC-2850 ultrasonic bath (Thor-ton, Sao Paulo, Brazil) operated at a frequency of 37±3 kHz,with temperature control up to 80±5°C, was used for prepara-tion of the emulsions. Table 1Graphite furnace temperature program for the determination of vanadium in crude oil with emulsification using HR-CS GF AAS Program stage Temperature (C) Ramp(Cs-) Hold time (s) Gas flow rate (L min-) Drying 1 90 5 50 2.0 Drying 2 270 5 20 2.0 Pyrolysis Variable 100 20 2.0 Atomization 2650 1500 14 0 Cleaning 2600 100 4 2.0 Analytical grade reagents were used throughout. Distilled,deionized water (DDW) with a specific resistivity of 18 M2 cm,from a Milli-Qwater purification system (Millipore, Bed-ford, MA), was used for the preparation of the emulsionsand standards. All containers and glassware were soaked in3 molL-1 nitric acid for at least 24 h and rinsed three timeswith DDW before use. The aqueous stock solution of vana-dium (1000mgL-) was prepared from a Titrisol concentrate(Merck). The working standards were prepared by serial dilu-tion of the stock solution with the addition of base mineral oil(BMOMS, High Purity Standards, Charleston, SC, USA) andemulsification, as described below, using xylene (Merck, Ger-many) and Triton X-100 (Union Carbide). A palladium stocksolution with 1gL- Pd in 5 mol L- nitric acid (Merck) wasused as chemical modifier. 2.3. Reference materials and samples The NIST standard reference material 1634c, trace elementsin fuel oil and the research material RM 8505 vanadium in crudeoil (National Institute for Standards and Technology, Gaithers-burg, MD, USA) were used in this work for method validation. The samples analyzed were acquired from local refineries ofPetrobras,most of them were from the state of Bahia, Brazil. 2.4. Emulsification The composition of the oil-in-water emulsion and the modeof its preparation were optimized using a multivariate approach,as described previously [29]. Between 0.05 and 2 g of crude oilsample,depending on the analyte concentration, were weighedinto 10-mL borosilicate glass volumetric flasks, and dilutedwith 1.0mL of xylene. The flasks were closed, fitted into apolystyrene support and put into the ultrasonic bath at ambienttemperature for 5 min. Then 100 pL of Triton X-100 was addedwith a micropipette and the volume was completed with DDW.The flasks were agitated manually for 2 min and then put in theultrasonic bath at ambient temperature for another 5 min,andfinally agitated manually again for 2 min. The only sample thatwas treated differently was RM 8505 because of its very highvanadium content: about 0.05 g of the RM were weighed into a50-mL volumetric flask, and all the reagent volumes were mul-tiplied by five in order to arrive at a manageable concentrationof vanadium in the final emulsion for measurement. All sam-ples and reference materials were weighed in triplicate directly into the flasks in order to reduce sampling errors to a minimumBlank and calibration solutions were prepared in the same way,using the base mineral oil instead of the sample with appropriate. concentrations of aqueous standard solutions added to the aque-ous phase to cover the calibration range from 2.0 to 10.0 ng V(10 p.L of 200-1000 ugL-V). The homogeneity of the emul-sions was maintained by manual agitation with a Pasteur pipettejust before the sample emulsion was taken up by the autosamplercapillary. A volume of 5 pL of ethanol (Merck, Germany) was intro-duced into the graphite tube together with 10 pL of sample orstandard emulsion to avoid foam formation. In case a modifiewas used, 20 pL of the palladium solution was injected into thegraphite tube and dried completely before the ethanol and theemulsion were introduced. The standard calibration techniquewas used throughout. 3. Results and discussion 3.1. Selection of the analytical line Vanadium has three absorption lines within the spectral win-dow between 318.3 and 318.8 nm, recorded by the detector, as isshown in Fig. 1. The equipment used in this work offers several Fig. 1. Time-resolved absorbance spectrum in the vicinity of the vanadium lineat 318.538 nm, using a pyrolysis temperature of 1450°C, and an atomizationtemperature of 2650°C. Table 2 Characteristic mass (mo, pg) for vanadium in oil-in-water emulsion at the threeanalytical lines, using center pixel (CP) and peak volume registration over sevenpixels (CP±3), and the sum of the three analytical lines Wavelength (nm) CP CP±3 318.538 29 14 318.398 23 11 318.343 44 22 All the three lines 10 5 different modes of operation in order to increase or decrease thesensitivity of the measurement, and also to increase the linearworking range, depending on the analyte concentration in thesample and the specific requirements [32]. A sensitivity and lin-earity of the working curve comparable to that of conventionalline source (LS) AAS is usually obtained when only the centerpixel (CP) is used for measurement, i.e. when only the core of theabsorption line is evaluated. The sensitivity typically increasesoverthat ofLS AAS when more than one pixel is used for absorp-tion measurement, a technique called peak volume registration.A further improvement in sensitivity can be obtained for ele-ments with a multiplet, such as vanadium, by integrating overthe volume of all analytical lines. The characteristic mass, mo,defined as the analyte mass that gives an integrated absorbanceof0.0044 s,obtained for vanadium in an oil-in-water emulsion atthe three analytical lines using CP and peak volume registrationover seven pixels (CP±3) is shown in Table 2. It is obvious thatthe sensitivity can be varied within almost one order of magni-tude simply by choosing the appropriate pixel or combinationof pixels and lines for evaluation. Alternately, sensitivity can bedecreased and the linear range extended by measuring on theline wings only, a technique called side pixel registration [32].Only peak volume registration over three pixels (CP±1) at the318.538 nm line was used for analytical work, as this techniquegave satisfactory results for the investigated samples. 3.2. Analytical conditions The spectrometer used in this study is equipped with a CCDarray detector with 512 pixels, 200 of which are used for analyt-ical purposes to make the spectral environment about ±0.25 nmaround the analytical line visible, as is shown in Fig. 1. Adecisive feature of this arrangement is that all pixels are illu-minated simultaneously, and all pixel information is shiftedsimultaneously into a readout register, so that each individualpixel works as an independent detector. As typically only threepixels are used to measure analyte absorption, all other pix-els are available for correction purposes, such as eliminatingwavelength-independent lamp flicker noise or to correct for con-tinuous background absorption. Both features are shown for theabsorbance signals of a crude oil sample after a pyrolysis at 300and 700°C in Fig. 2a and b, respectively. For reasons of clarity,the uncorrected and the corrected absorbance signals measuredat the CP only are shown. After a pyrolysis temperature ofonly300°C (Fig. 2a) the atomic absorption is preceded by a verystrong wavelength-independent background absorption, which Time /s Fig. 2. Absorbance signals over time for OB3 crude oil at the vanadium line at318.538 nm (CP only) without and with the use of correction pixels; gray line:uncorrected signals; black line: absorbance signals corrected for all spectrallycontinuous events, such as continuous background absorption; atomization tem-perature 2650°C; (a)pyrolysis temperature 300°C; (b) pyrolysis temperature700°C. is caused by the high-boiling fraction of crude oil that couldnot be removed at 300°C. After the automatic correction onlyincreased baseline noise remains, as the transmission ofradiationwas attenuated to about 0.1% during the background absorptionphase. However, the analyte absorption is well separated fromthis noisy phase, so that an undisturbed measurement is possi-ble even under these conditions. After a pyrolysis temperature of700°C (Fig.2b)there is essentially no more background absorp-tion, and only the lamp flicker is visible in the uncorrected signal,which is eliminated perfectre_ly by the automatic correction sys-tem. The pyrolysis curves for vanadium in a crude oil, preparedas oil-in-water emulsion, without and with the addition of pal-ladium as a chemical modifier are shown in Fig. 3. Withoutthe addition of a modifier significant losses of vanadium areobserved at temperatures above 400°C. The addition of the pal-ladium modifier was investigated only in order to make sure thatno vanadium was lost at pyrolysis temperatures below 400°C.It is interesting to note that a minimum was obtained in thepyrolysis curve without a modifier at temperatures between 800and 1000°C, followed by a slight increase of the integratedabsorbance up to 1600°C, which was not observed in the pres-ence ofthe modifier. In the present case this means that ~31% ofthe vanadium is lost at 800°C, but only ~24% at 1600°C. Theexplanation for this phenomenon could be found in the temper- Fig. 3. Pyrolysis curves for vanadium in OB3 crude oil sample:() withoutmodifier; (O) using 20 pg of palladium as chemical modifier. ature program shown in Table 1. The temperature gap betweenthe lastdrying stage’at 270 °C and the pyrolysis stage is passedat aramp rate of 100°Cs, followed by a hold time of 20 s. Themost likely explanation is that an increasing percentage of theporphyrine fraction is thermally decomposed when the temper-ature range between 270 and 1000C is passed rapidly and thetemperature of the hold stage is higher. For this reason, a pyroly-sis temperature of 400 °C was adopted in order to determine totalvanadium, and a pyrolysis temperature of 800°C was used todetermine“thermally stable’vanadium. The volatile porphyrinefraction was determined by difference. 3.3. Analytical results Table 3 shows the results obtained for the determination ofvanadium in the CRM, the RM and in 12 crude oil samples, using a pyrolysis temperature of 400 and 800°C,respectively,and the difference between the two results, which is obviouslythe volatile vanadium. Unfortunately, as the content of volatilevanadium has been determined by difference, it suffers fromthe uncertainty of both measurements, total and thermally sta-ble vanadium.This fact has been taken into consideration in thecalculation of the standard deviation in Table 3. In cases whenthe total vanadium content is high, as in RM 8505, and ther-mally stable species prevail in the sample, the content of thevolatile fraction might be hidden within the final uncertainty ofthe measurement. Also shown in Table 3 are the results obtained for totalvanadium using the palladium modifier, following the pro-cedure described elsewhere [29], in order to make sure thatno vanadium was lost at a pyrolysis temperature of 400°C.The results obtained without a modifier at a pyrolysis tem-perature of 400°C, and with palladium at a pyrolysis tem-perature of 1450°C showed no significant difference accord-ing to a t-test at the 95% confidence level. It is reasonableto assume that the volatile vanadium fraction largely con-sists of low molecular weight, non-polar vanadyl porphyrins,whereas the stable vanadium represents the highly polar non-porphyrins. The results obtained in this work provide several interestinginformation. Firstly, there were two crude oil samples that didnot contain any detectable vanadium, i.e. less than 0.04 mgkg,which is quite unusual, as the content of this element is typi-cally>1mgkg. Secondly, the volatile porphyrine fraction wasfound to be between about 5 and 50% of the total vanadium con-tent, and there was no correlation between the porphyrine andthe total content. Thirdly, the research material 8505 from NISThad no detectable volatile fraction in spite of its extremely hightotal vanadium content. Hence this oil is unsuitable to detect thelow-temperature losses of vanadium compounds in GF AAS,and maybe also with other analytical techniques. Table 3 Results obtained for total and thermally stable vanadium in certified reference material (SRM 1634c), research material (RM 8505) and 12 crude oil samples, usingpyrolysis temperature of 400°C and 800°C, respectively, and with 20 pg of Pd as modifier at pyrolysis temperature of 1450°C With Pd 400°C 800°C SRM 1634c 28.19 ±0.40 29.3±1.0 29.0±1.2 25.6±1.3 3.4±2.5 RM8505 390±10 404±4 404±6 402±10 n.d. OBl 4.50±0.12 4.58±0.18 2.26±0.20 2.32±0.38 OB2 30.2±0.4 30.1±0.6 18.5±0.7 11.6±1.3 OB3 3.18±0.07 3.29±0.10 2.28±0.22 1.01±0.32 OB4 0.29±0.04 0.23±0.06 0.16±0.05 0.07±0.11 OB5 12.3±0.3 12.2±0.3 8.78±0.41 3.4±0.7 OB6 8.51±0.21 8.75±0.28 6.91±0.40 1.84±0.68 OB7 <0.04 <0.04 <0.04 OB8 0.75±0.06 0.77±0.08 0.73±0.02 n.d." OB9 - <0.04 <0.04 <0.04 OB10 14.1±1.1 13.6±1.4 10.6±1.9 3.0±3.3 OB11 16.6±0.3 16.2±0.6 13.1±0.2 3.1±0.8 OB12 12.3±0.3 12.2±0.3 9.25±0.1 2.95±0.4 All values are the average and standard deviation of three replicate determinations of three independently prepared emulsions, i.e. n=9; the volatile fraction wasdetermined by difference. The limit of detection (LOD), calculated as three times thestandard deviation of ten consecutives measurements of a blanksolution, and the limit of quantification (LOQ), calculated asthree times the LOD was 0.04 and 0.12mgkg,respectively,based on a mass of 2.0 g of oil in 10 mL of emulsion. The char-acteristic mass (mo) was 17pg, which is about a factor of twobetter than published values using line source GF AAS [33].The precision was better than 4% at the concentration levelaround 3 mg kg, and better than 1.5% at the concentrationlevel around 30mg kg-of vanadium in crude oil using the pro-posed method. 4. Conclusions Using high-resolution continuum source graphite furnaceatomic absorption spectrometry with its unsurpassed back-ground correction capability it was possible to determine theconcentration oftotal vanadium and of the thermally stable frac-tion in crude oil simply by altering the pyrolysis temperature.The volatile fraction, which most likely consists of the non-polar vanadyl porphyrine complexes, could be determined bydifference. This selective determination of the volatile fractionis considered to be of particular importance, as it is for surepredominantly this type of species that is transported in the dis-tillation process to intermediate products, such as naphtha andpetroleum condensate, and acts as catalyst poison. The qualityof a crude oil might therefore be much better characterized byits content of volatile vanadium than by its total content, whichis not correlated to the former one. The only disadvantage ofthis approach is that the most important fraction is determinedby difference and suffers from the imprecision of both mea-surements. Another point of concern is that in the presence ofhigh-asphaltenes content the vanadyl porphyrins might be in parttrapped in carbonaceous structures in the pyrolysis stage. Thispotential problem will be investigated in future studies on thissubject. Acknowledgements The authors are grateful to Conselho Nacional de Desenvolvi-mento Cientifico e Tecnologico (CNPq), and to Fundacao deAmparo a Pesquisa do Rio Grande do Sul(FAPERGS). I.C.F.D.,A.F.S., F.G.L. and D.L.G.B. have scholarships from CNPq. Theauthors are also grateful to CNPq-Programa de Ciencias e Tec-nologia do Petroleo (CTPetro Process 479333/01-7) for financialsupport, and to Analytik Jena AG for financial support andthe donation of the high-resolution continuum source atomicabsorption spectrometer. The financial support by the Senatsver-waltung fur Wissenschaft, Forschung und Kultur des LandesBerlin, and the Bundesministerium fur Bildung und Forschungis gratefully acknowledged. ( [1] T .F. Yen, i n: T .F. Yen ( Ed.), T he R o le of Trace Me t als in P et r oleum,Ann Arbor S c ience P u blishers, Ann Arbor, MI, 1975. ) ( [ 2] R.H. F ish, J.J . Komlenic , B.K. Wines, Anal. Chem. 56 (1985) 2452. ) ( 3] N. Marquez, F. Y s ambertt, C . de l a Cruz, A n al. Chim. A c ta 395 (1999)343. ) ( [ 4 ] J .A.G. B arwise, M etal complexes in fo s sil fuels, in: R .H. F i lby, J.F. Branthaver (Eds.),ACS Symposium Se r ies 344, Washington, DC, 19 8 7, p. 100. ) ( [ 5 ] J.F. Branthaver, M etal c o mplexes in f os s il fue l s, in: R. H. Fil by , J.F . B ranthaver (Eds.), ACS Symposium Series 344, Washington, DC, 1 987, p. 188. ) ( [6] W.T . R eid, E xternal C orrosion and D e posits-Boi l ers and Gas Turb i n es, E lsevier, Amsterdam, 1 971, p . 134. ) ( [7] B 3 . . P ahlavanpour , E . K . J ohnson, in: G .B. C r umpip ( Ed.),Petroanalysis’8 7- Developments in Analytical C h emistry m the P etroleum I ndustry, Wiley, London, 1988, p. 189. ) ( [8] D. W . Hausler, R . Carlson, Spectrochim. Ac t a Rev. 14 ( 19 9 1) 124. ) ( [9] M. Turunen, S. P eraniemi, M . A h lgren, H . We s terholm, Ana l . Chim. A cta 311 (1995) 85. ) ( [10] A.A. V an Heuzen, i n: A . R . D a te, A.L. G ray (Eds.), A p plication of Induc- t ively Coupled P lasma M a ss Sp e ctrometry, Bl a ckie, L o ndon, 19 8 9, p.169. ) ( [11] H.M. Al-Swaidan, Talanta 43 (1996) 131 3 . ) ( [ 1 2] C . D uyck, N . M iekeley, C. L .P. Si l veira, P. S z atmari, Spectrochim. ActaPart B 57 (2002) 1 979. ) ( [13 ] K. Iwasaki, K. Tanaka, Anal. Chim. Acta 1 36 (1982) 293. ) ( [14] E .R . Denoyer, L . A. S iegel, Anal . Chim. Acta 1 92 ( 1987) 3 61. ) ( [15] I . Lang, G . S e bor, V . S y ch r a, D . Ko l ihová, O. Weisser, Ana l . Chim . A cta 84 (1976) 299. ) ( [16] British Standard BS-2000-288, 1 9 8 3. ) ( [17] O. Osibanjo, S.E . Kakulu, S.O. Ajayi, Analyst 109 (1984) 1 27. ) ( [ 1 8] S.H. K agler, i n: S.H. K agler ( Ed.), N eue M i neralolanalyse, I . Spek- t roskopie, H uthig, Heidelberg, 1 9 87, p. 2 5 3. ) ( [19] N. S . Kaki, M.M. B arbooti, S . S . Baha-Uddin, E .B. H assan, Appl. Spec- t rosc. 43 ( 1989) 1257. ) ( [20] M . Bettinelli, P . T i t tarelli, J . Anal. At. Spectrom. 9 ( 1 994) 80 5 . ) ( [21] O . P latteau, M. Carrillo, F u el 7 4 ( 1995) 761. ) ( [22] I . Lang, G. Sebor, O. Weisser, V. Sychra, Anal. Chim. Acta 88 ( 1977) 313. ) ( [23] G. Sebor, I. L ang, D. Kolihova, O. Weisser, Analyst 107 ( 1982) 1350. ) ( [24] P . Bermejo-Barrera, C . P i ta-Calvo, F . B e rmejo-Mar t inez, Ana l . Let t . 24 ( 1991) 447. ) ( [25] M.C. G onzalez, A . R. R o driguez, V. Gonzalez, Mi c rochem. J. 34 ( 19 8 7)94. ) ( [26] R .Q. A u celio, A . J. C u rtius, B . Welz, J. Anal. A t . Spectrom. 15 ( 2000) 1 389. ) ( [27] J . L. Burguera, R .M. A v il a -Gomez, M. Bur g uera, R.A . Salager, J.L. S alager, C . L. B racho, M . Burguera-Pascu, C . Bu r guera-Pascu, R .B runetto, M . Gallignani, Y.P . P ena, T a lanta 61 ( 2 003) 353. ) ( [28] M .G.R. V a le, I. C .F. D amin, A. K l assen, M . M. Si l va, B . W e lz, A. F . S ilva, F .G. L epri, D.L.G. Borges, U. Heitmann, M icrochem. J. 7 7 (2004) 1 31. ) ( [29] I.C.F. Damin, M.G.R. V ale, M.M. S i lva, B . W elz, F .G. L epri, W.N.L. ) ( d os Santos, S.L. C . F e rreira, J . Anal. A t. Spectrom. 2 0 ( 2 005) 13 5 2. ) ( [ 3 0] U . H eitmann, M . Schiitz, H. Be cker-Ross, S. F l orek, S p ectrochim. A c ta P art B 51 (1 996) 1 095. ) ( [31] A.F . Silva, D.L . G. Borges, B . W elz, M . G.R. Va l e, M. M . Sil v a , A. K lassen, U . Heitmann, S pectrochim. Acta P art B 59 (2004) 841. ) ( [ 3 2] B . Welz, H . B ecker-Ross, S . Florek, U. H eitmann, H i gh-Resolution Co n - tinuum Source AAS, W iley-VCH, Weinheim, N e w York, 2 0 05, p. 6 2. ) ( [33] B . W elz, M . Sperling, Atomic Absorption Spectrometry, third ed., Wile y -VCH, Weinheim, New Y o rk, 1 9 99, p. 5 68. )
确定


还剩4页未读,是否继续阅读?

耶拿分析仪器(北京)有限公司为您提供《原油中挥发性和非挥发性钒化合物检测方案(原子吸收光谱)》,该方案主要用于原油中挥发性和非挥发性钒化合物检测,参考标准--,《原油中挥发性和非挥发性钒化合物检测方案(原子吸收光谱)》用到的仪器有
相关方案
更多
该厂商其他方案
更多