


飞行器空气动力学领域关于3维失速团和翼型压力关系的研究报告。发表在实验流体上《Exp Fluids》2016年第57卷。
方案详情

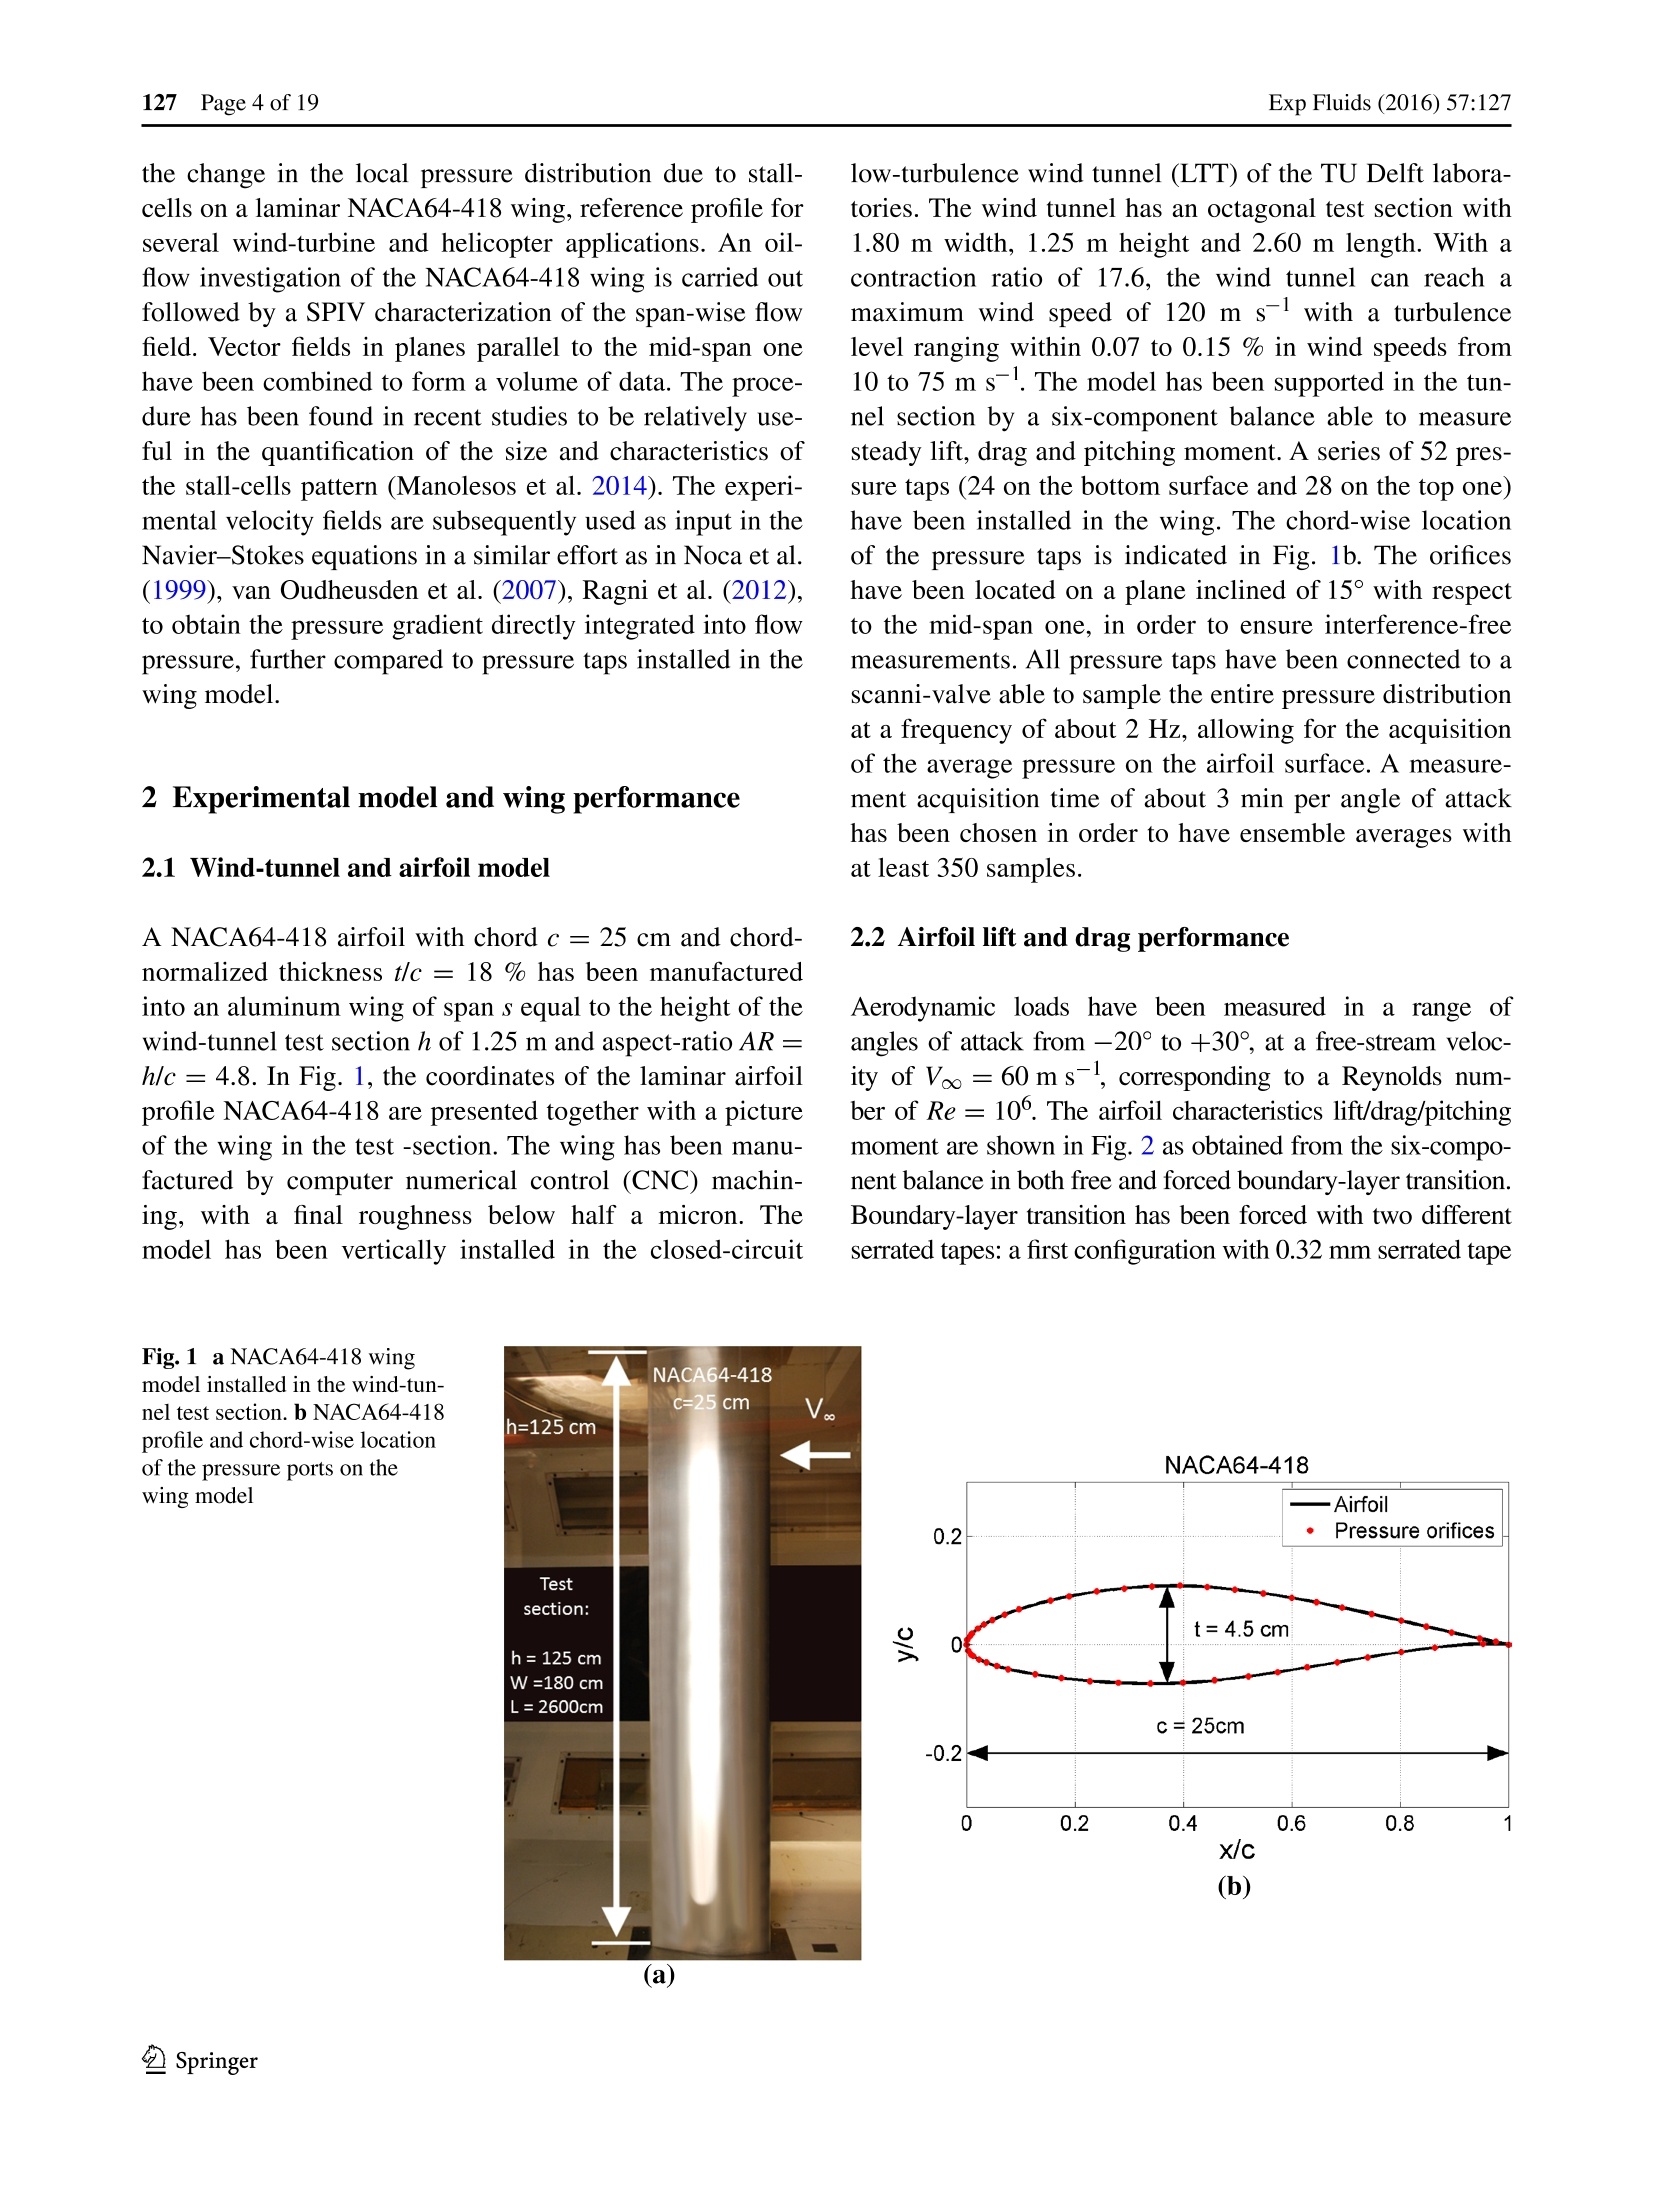
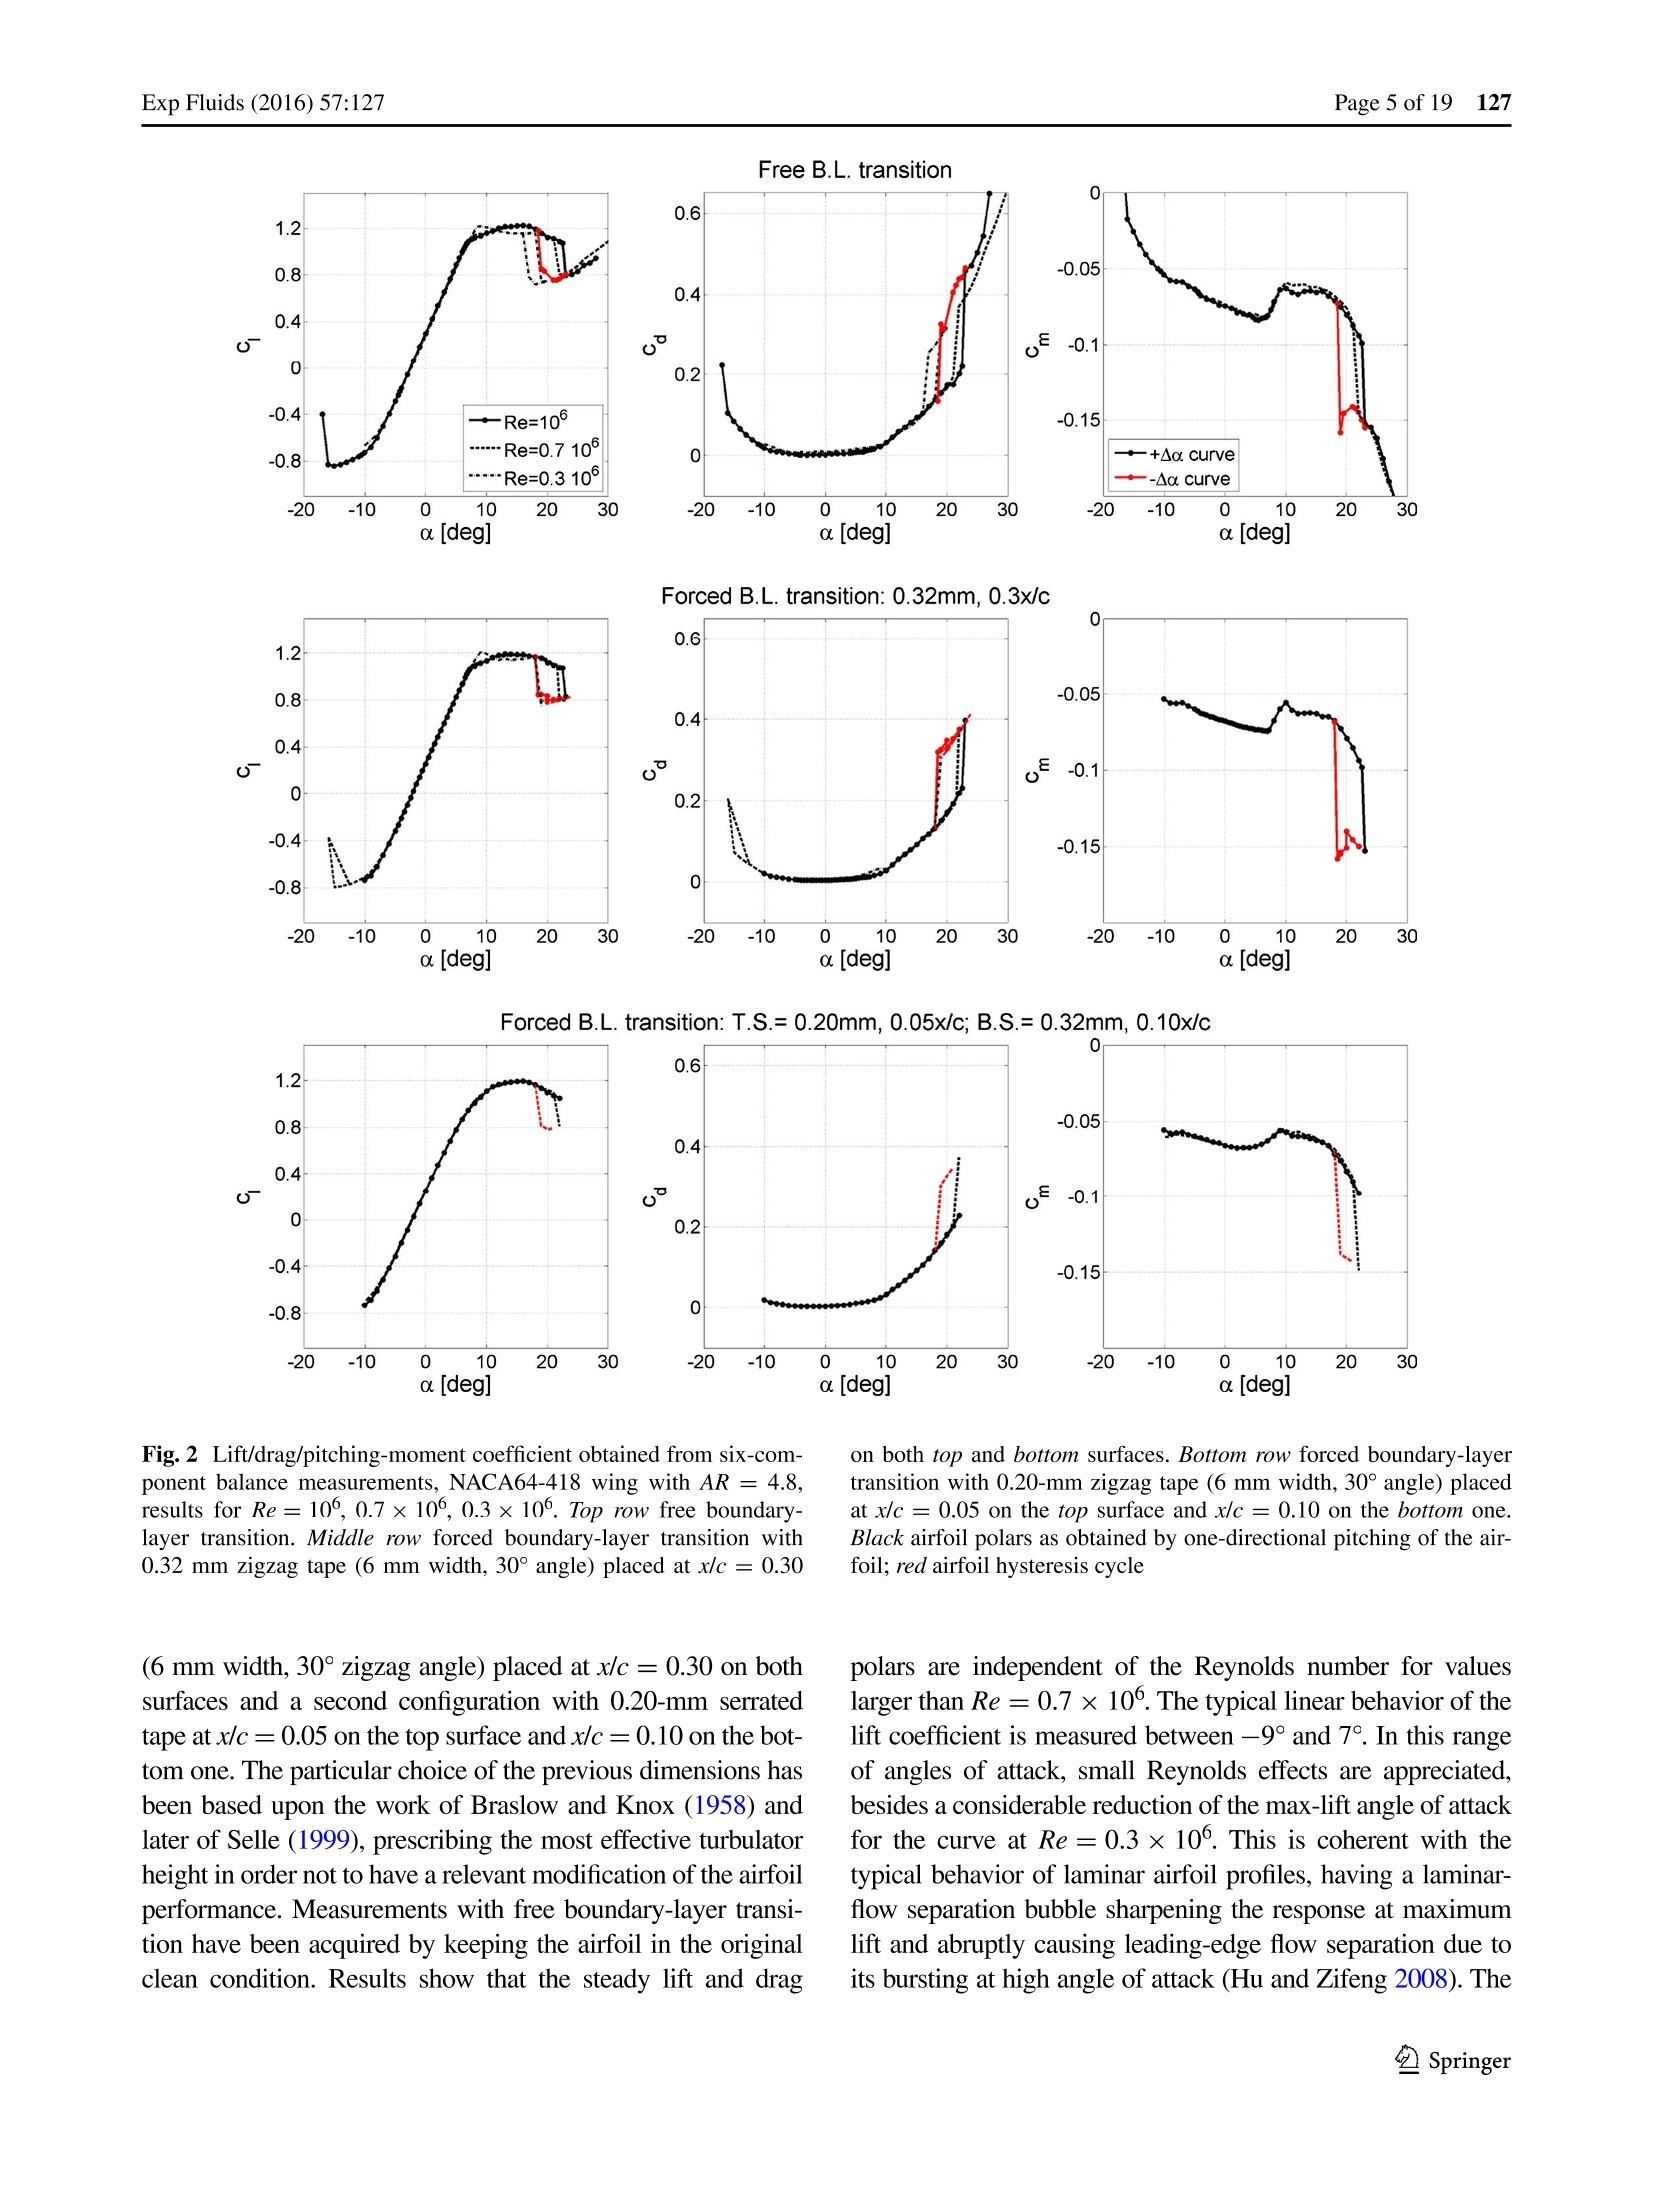
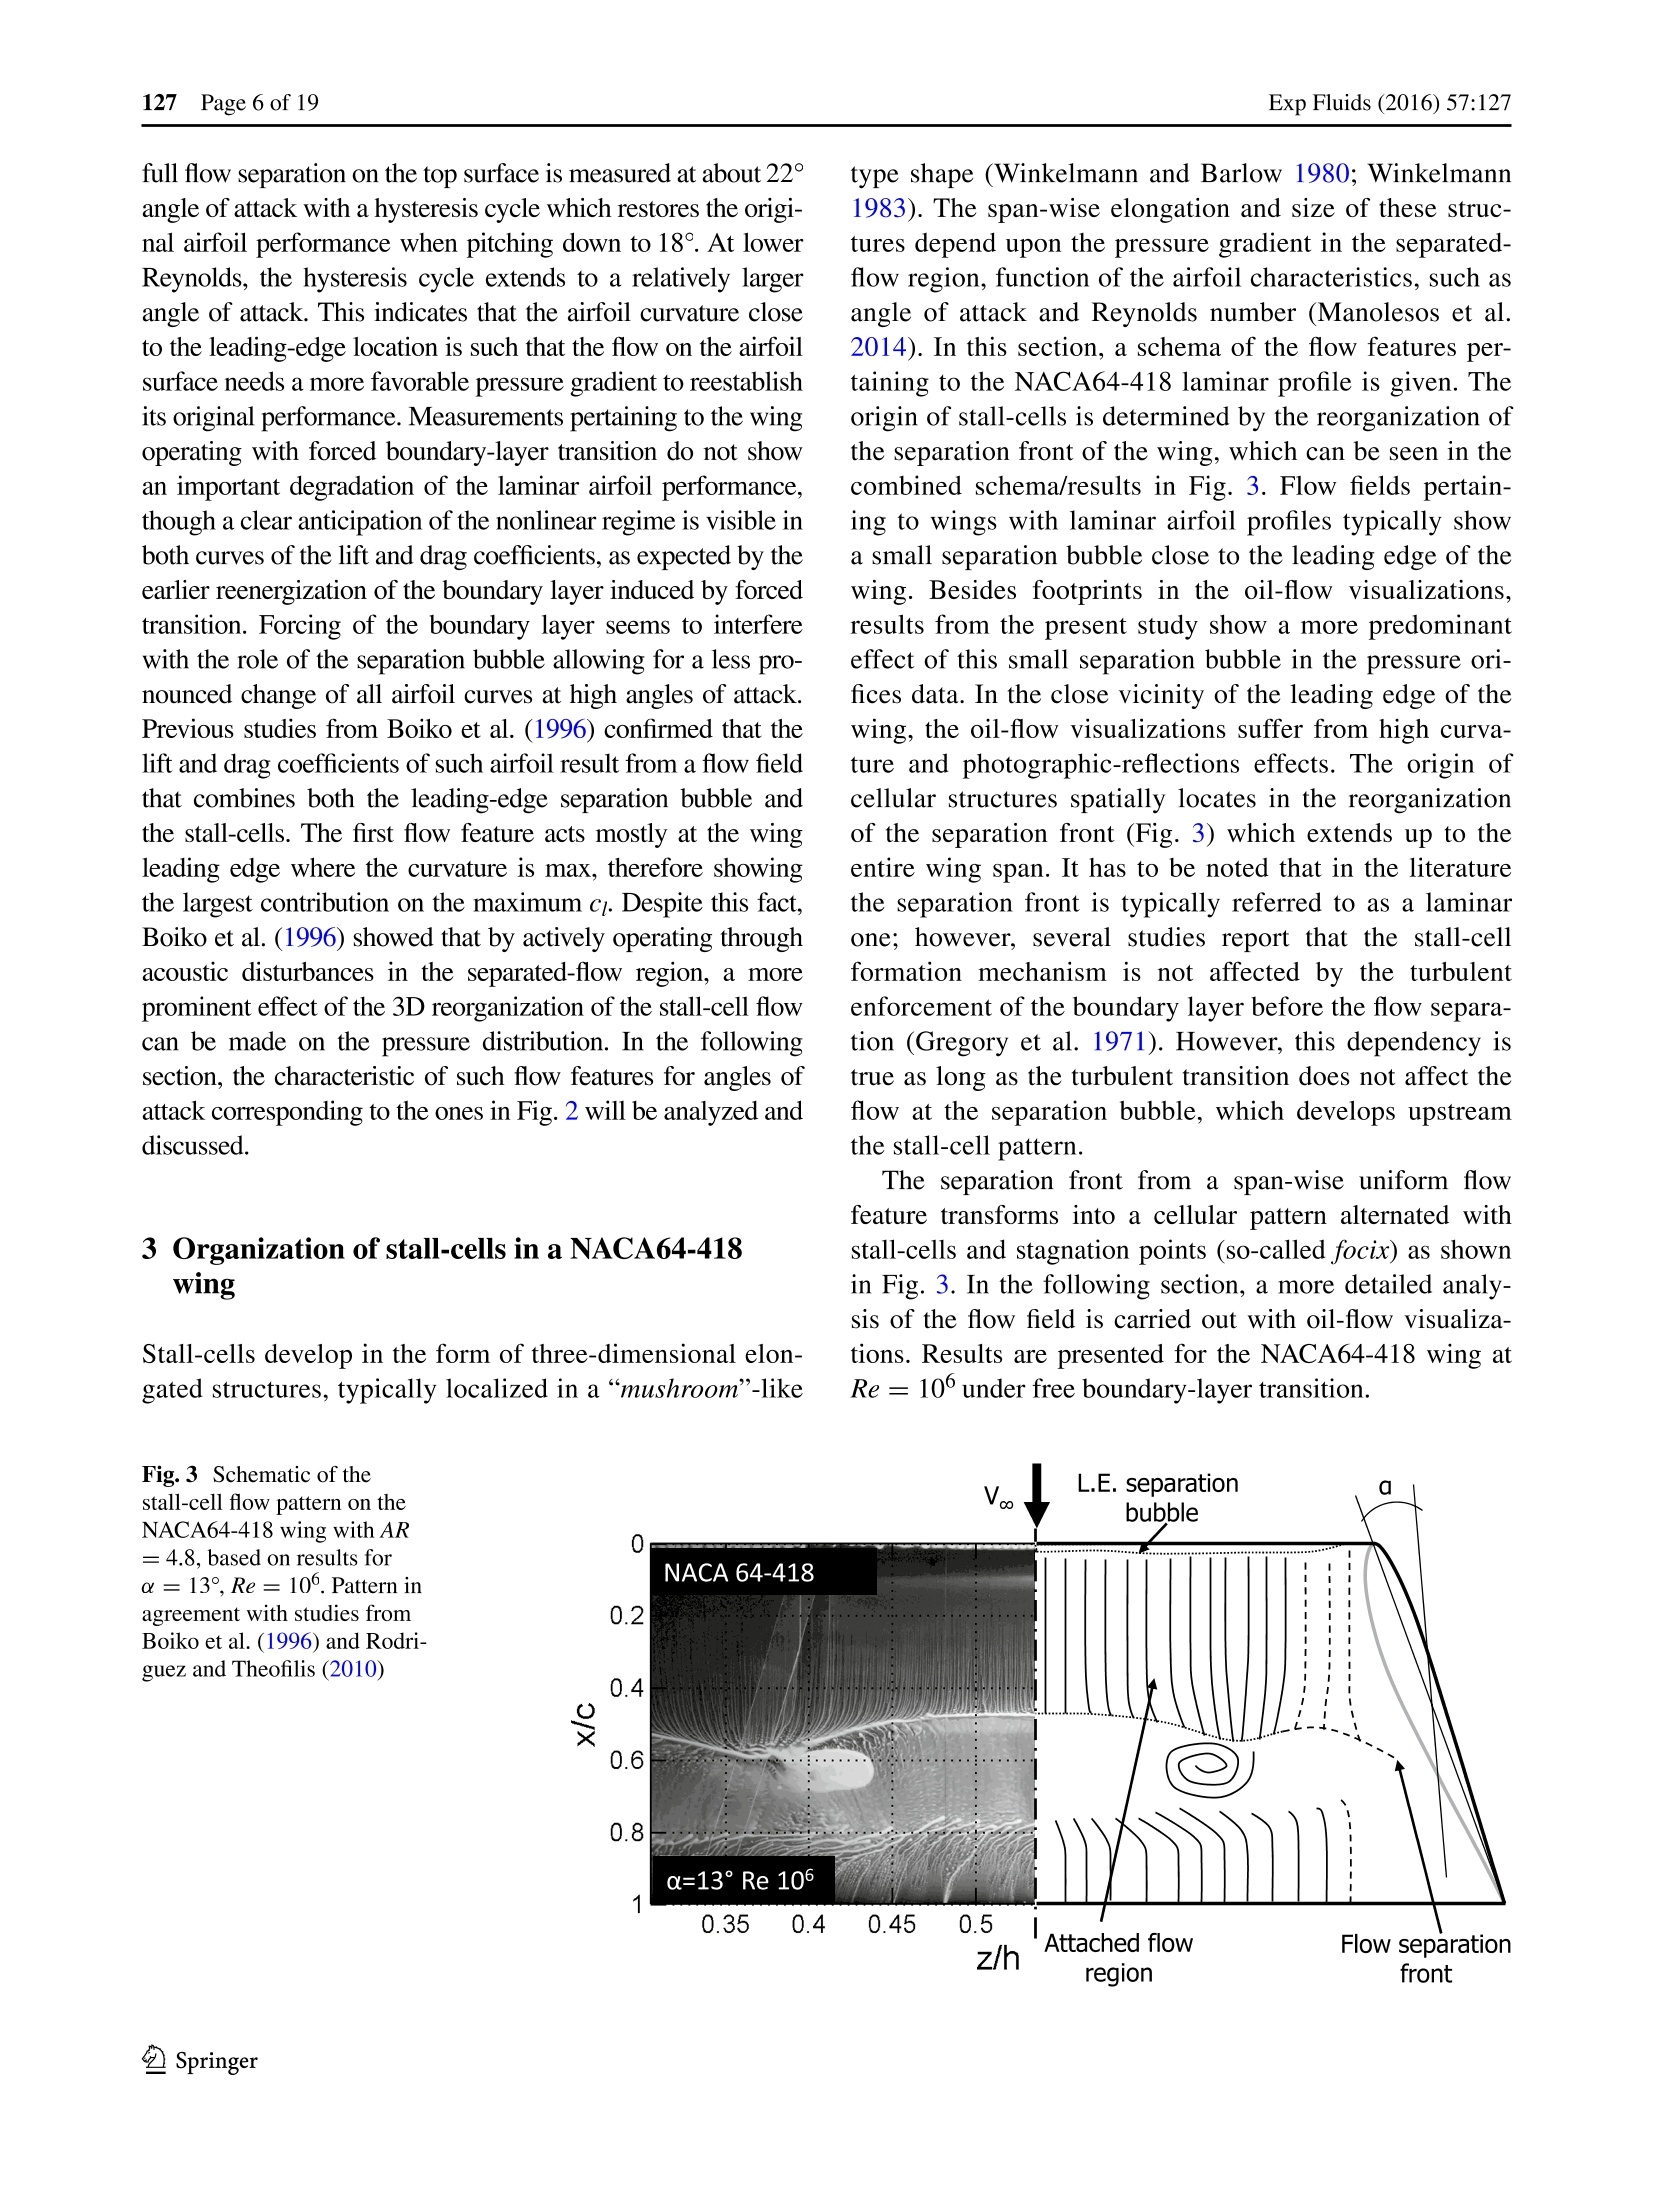
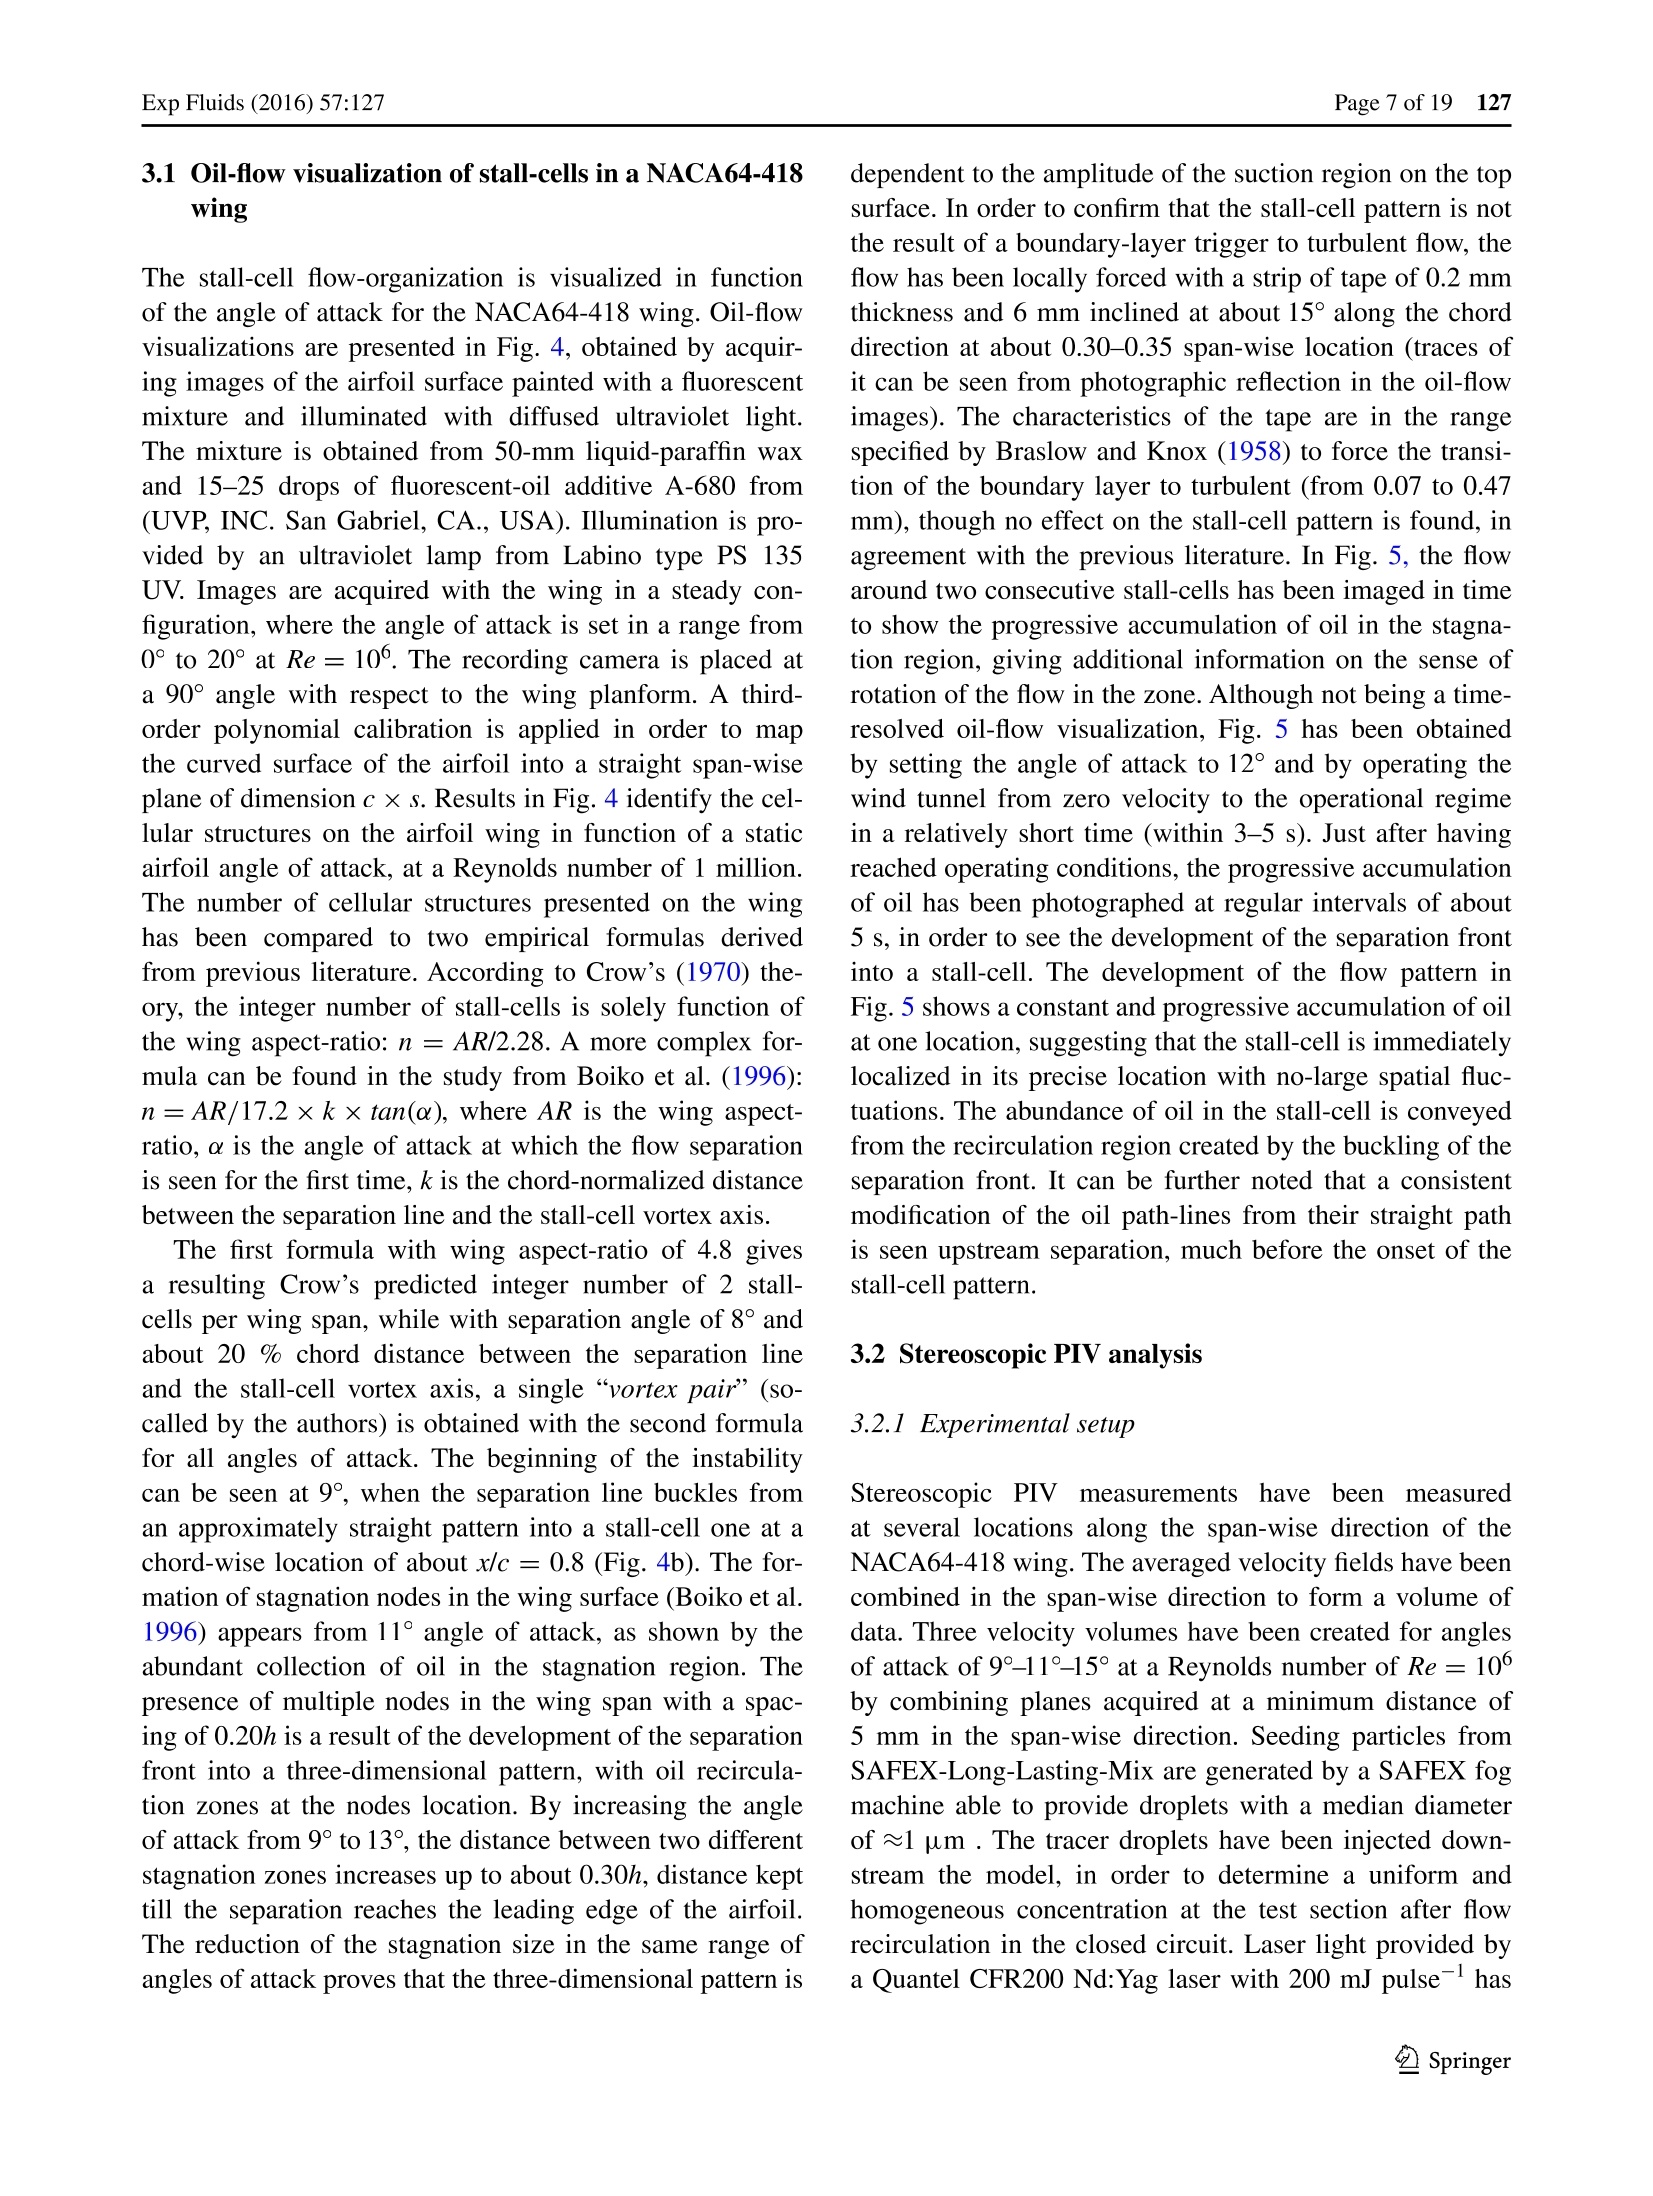
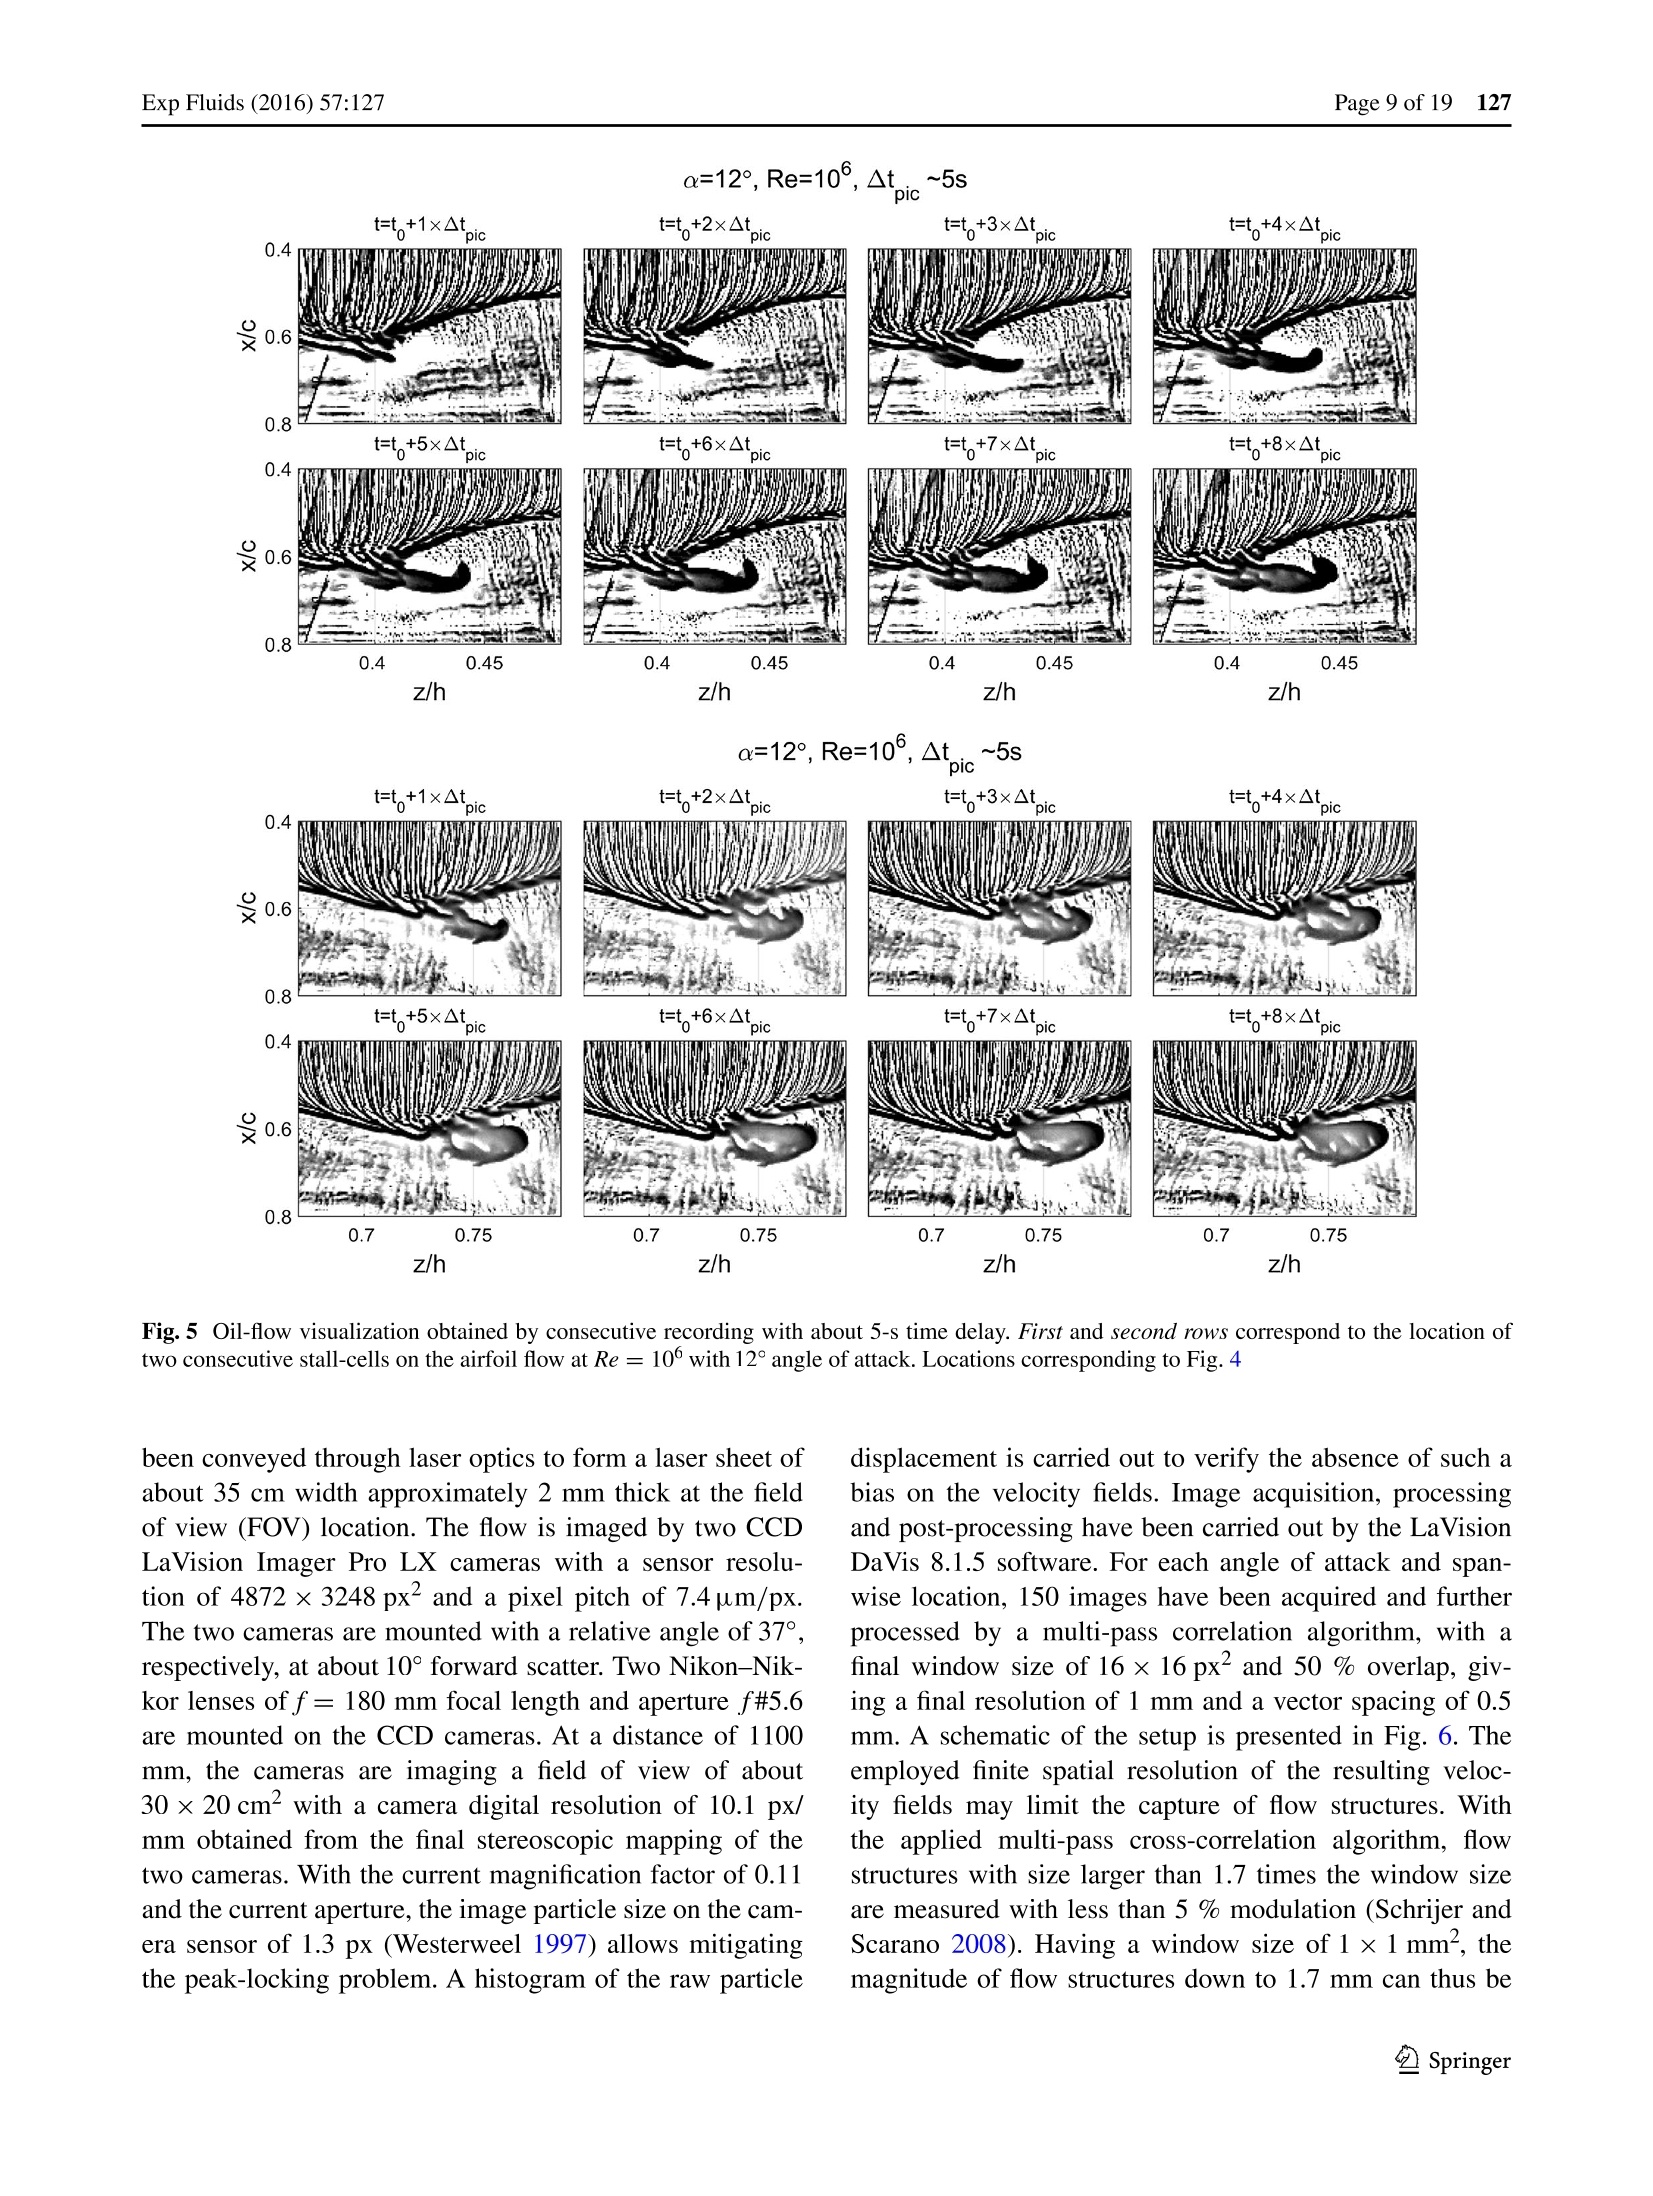
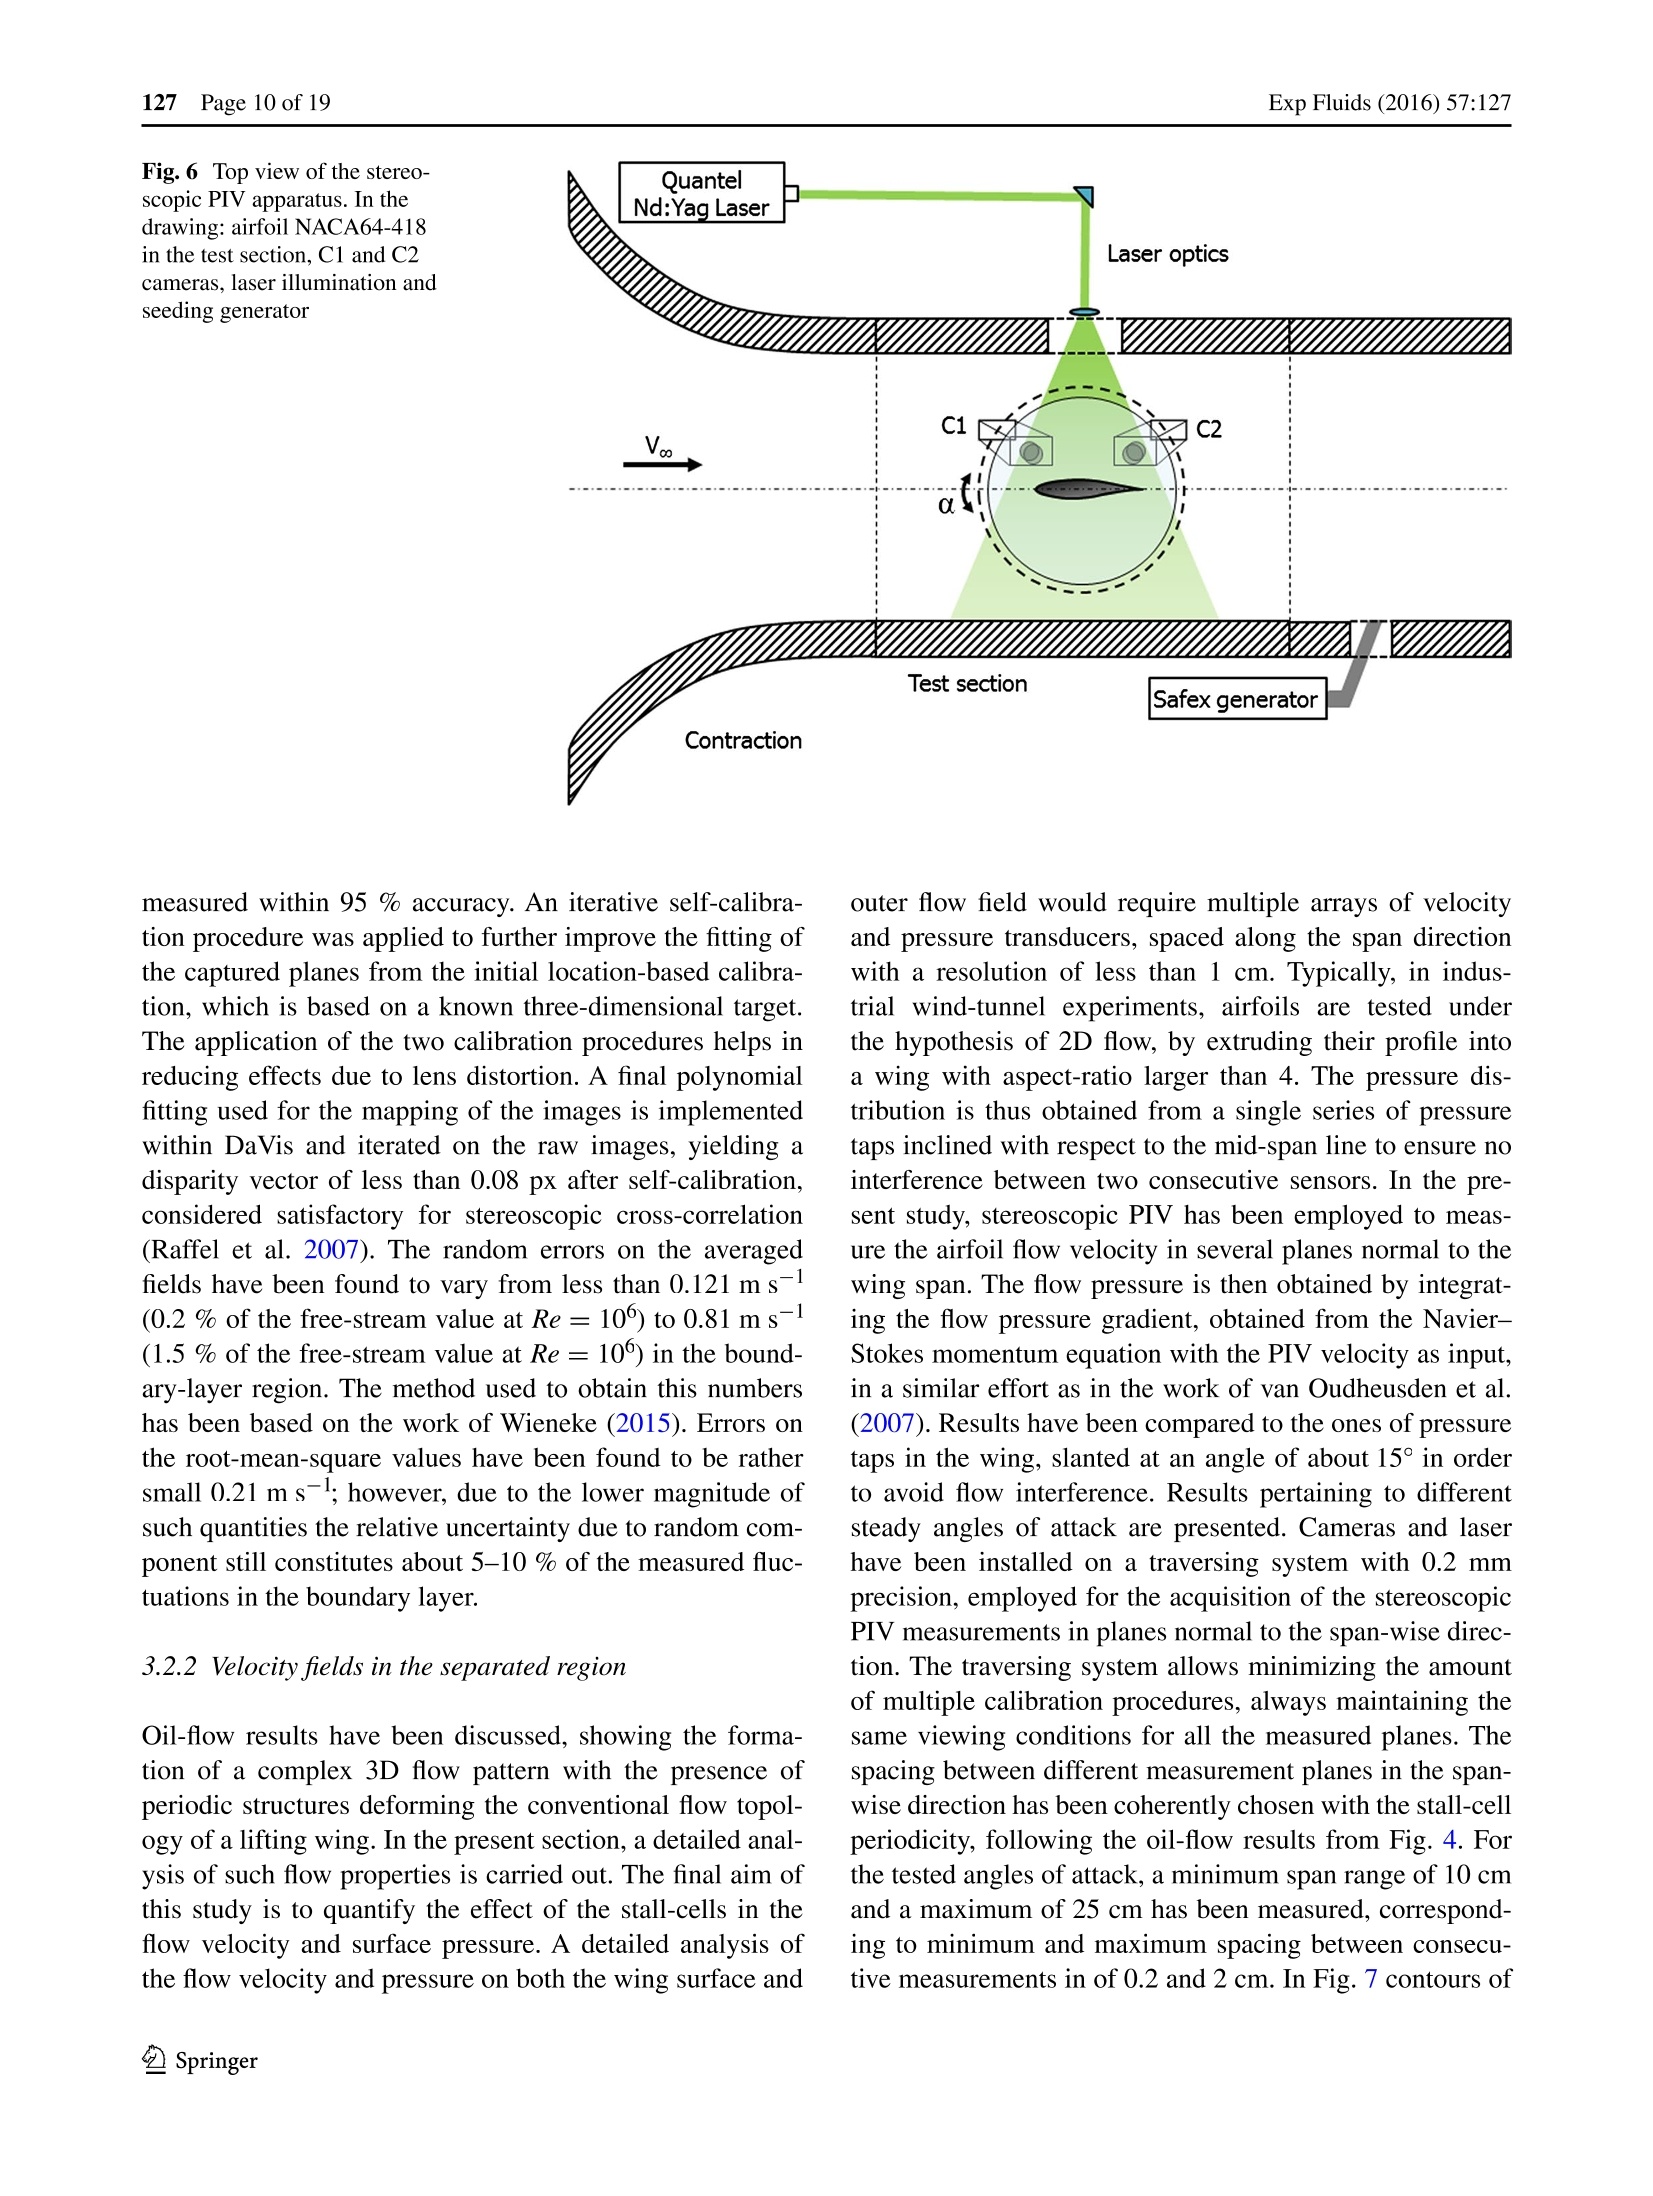
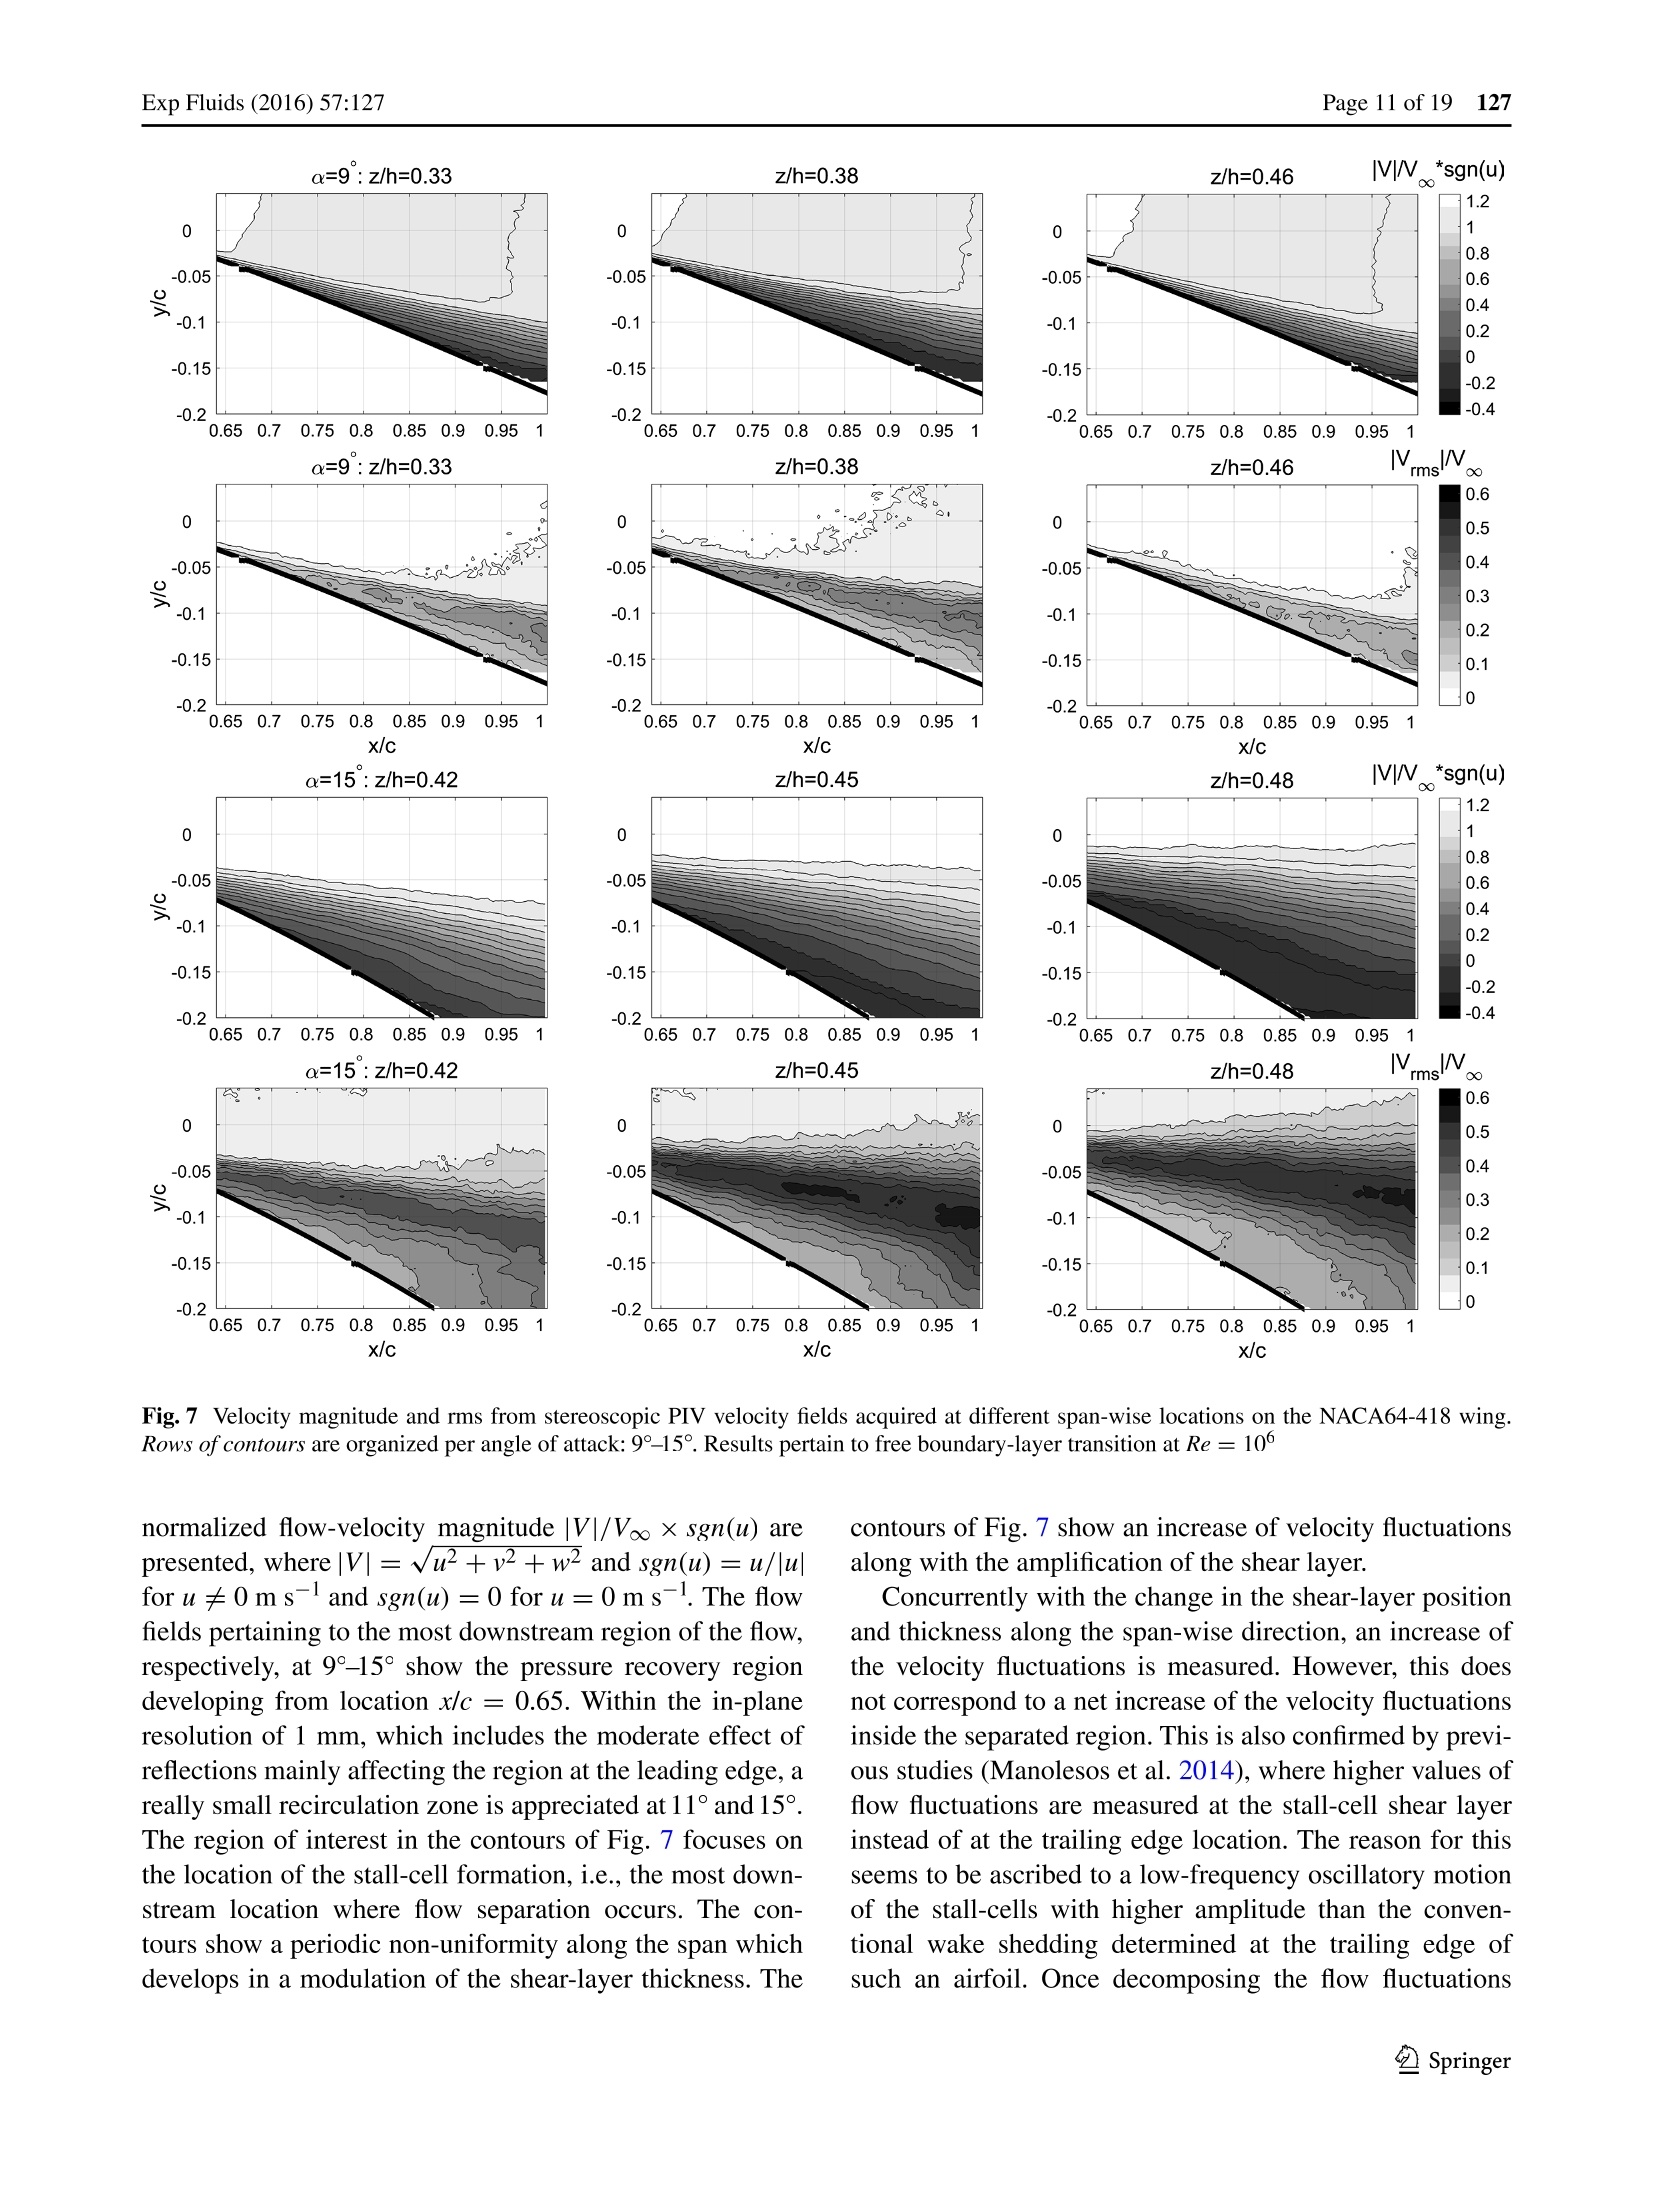
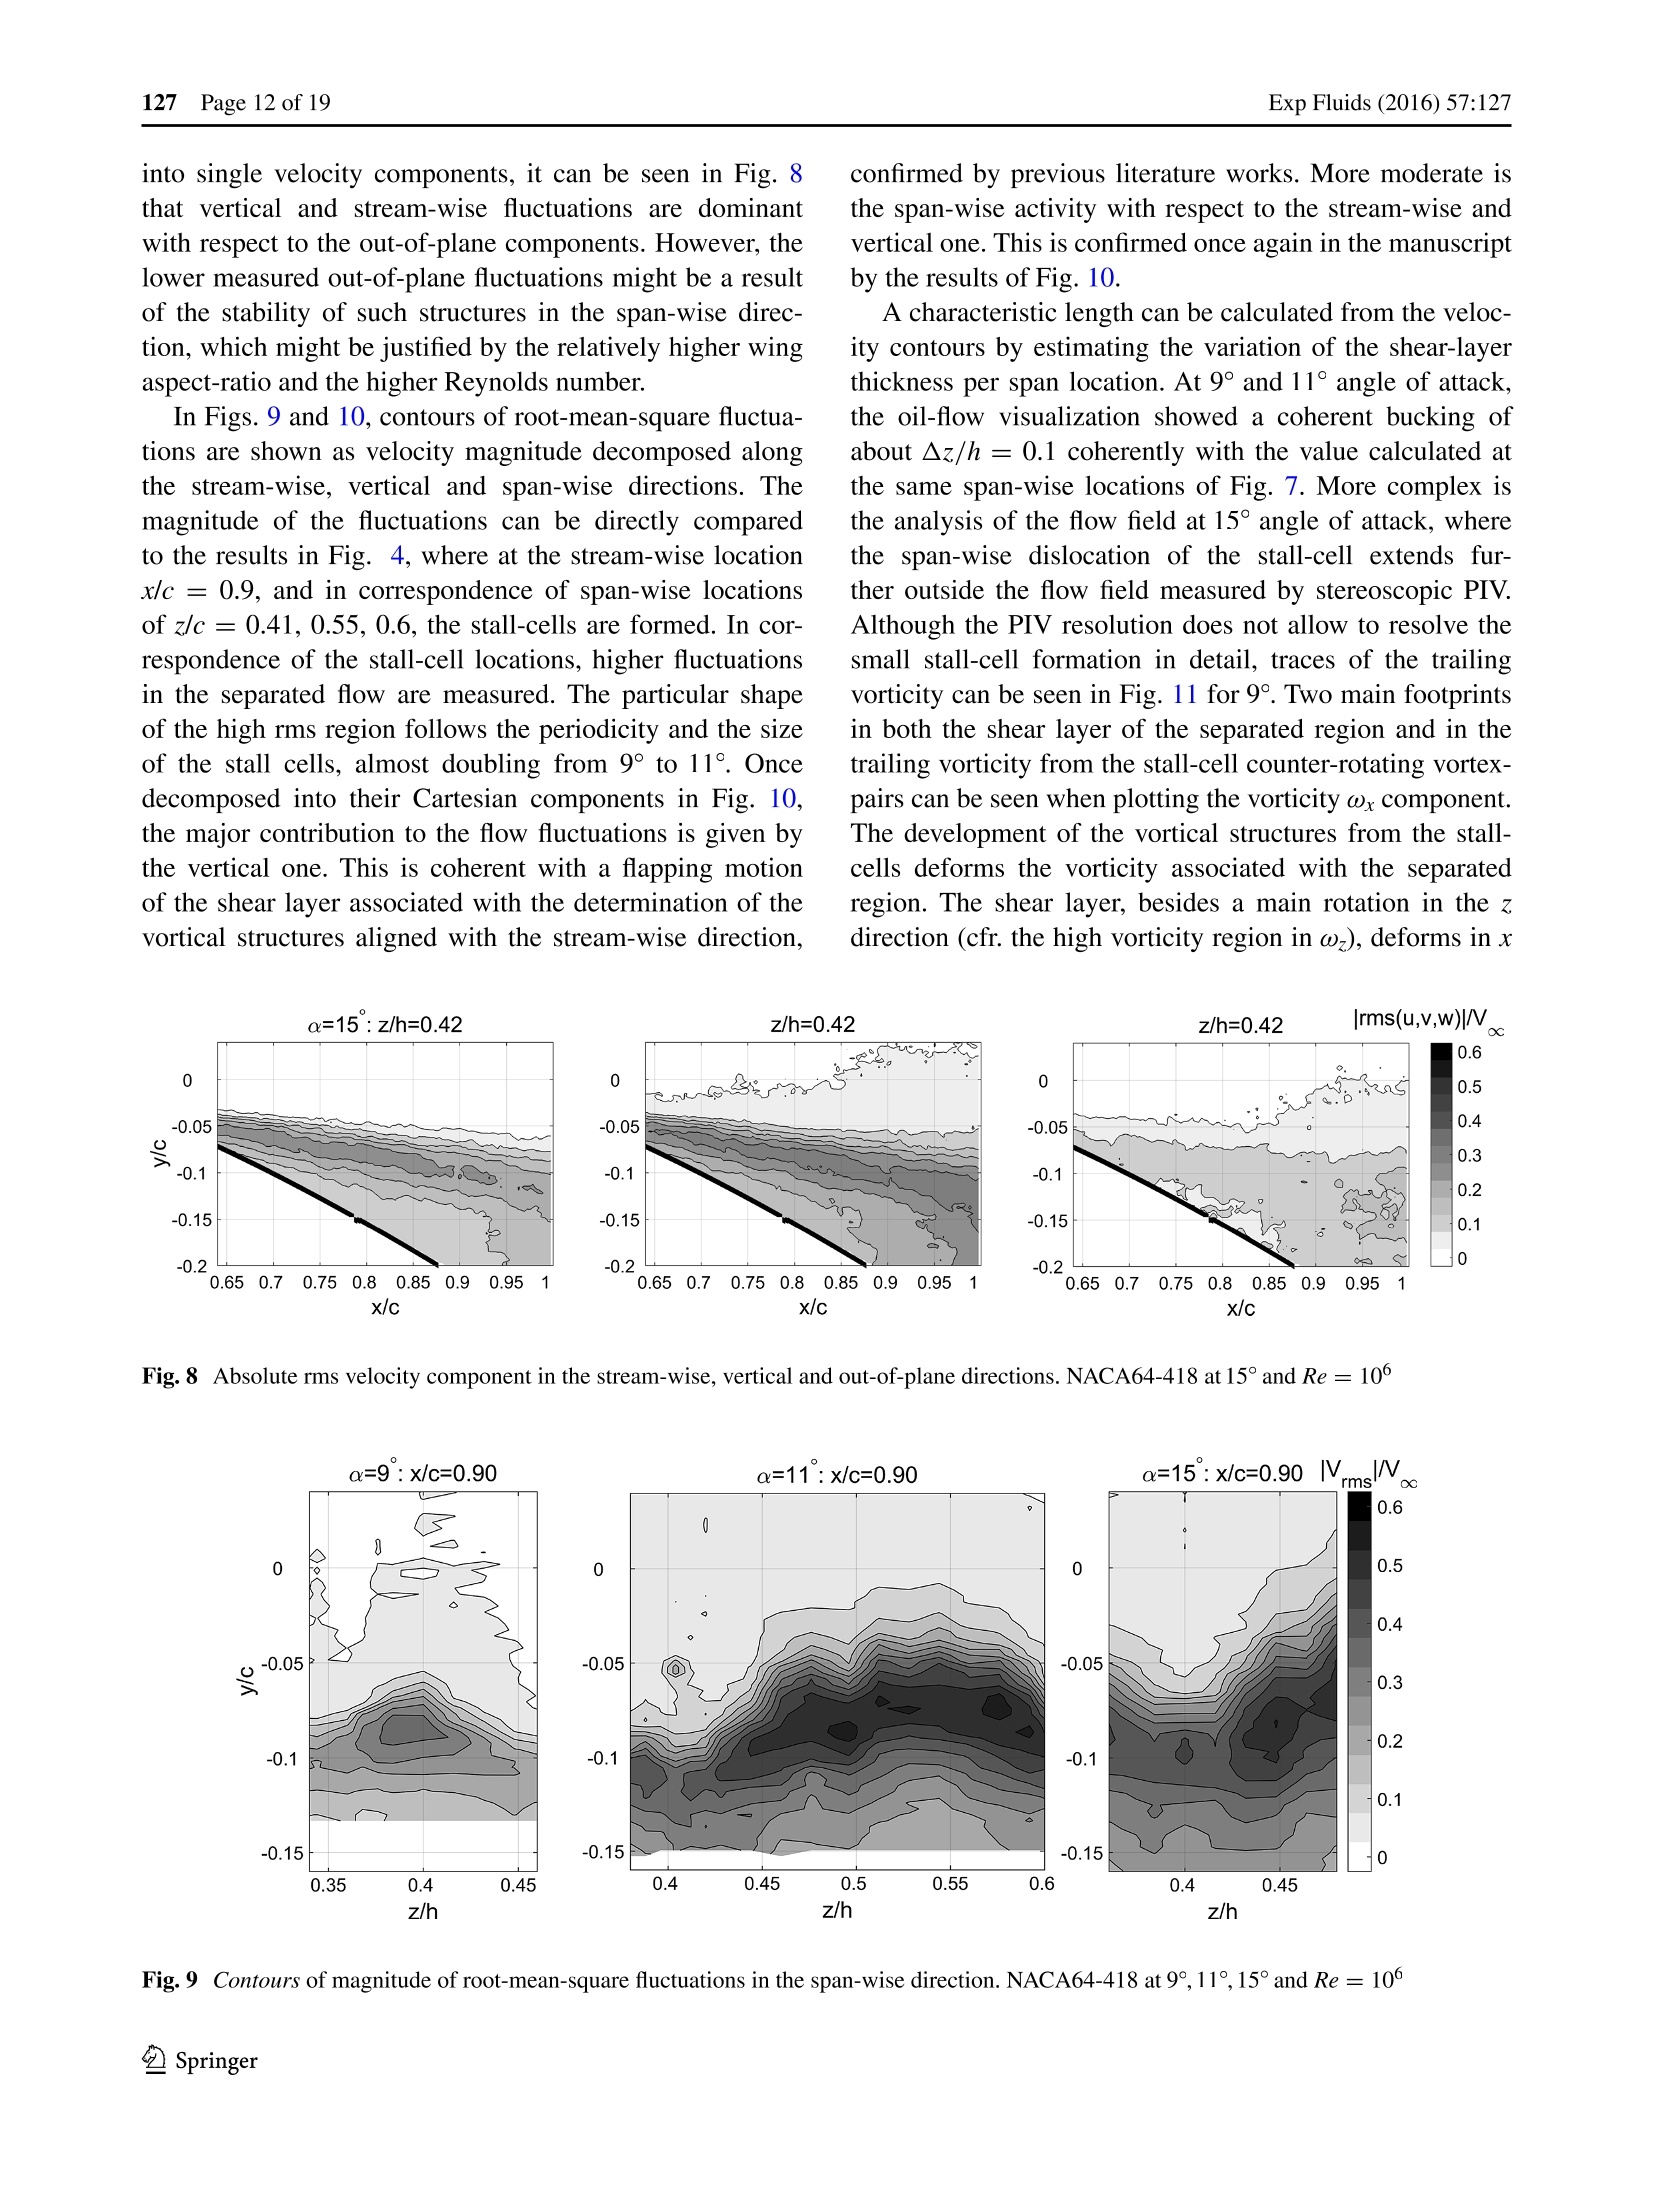
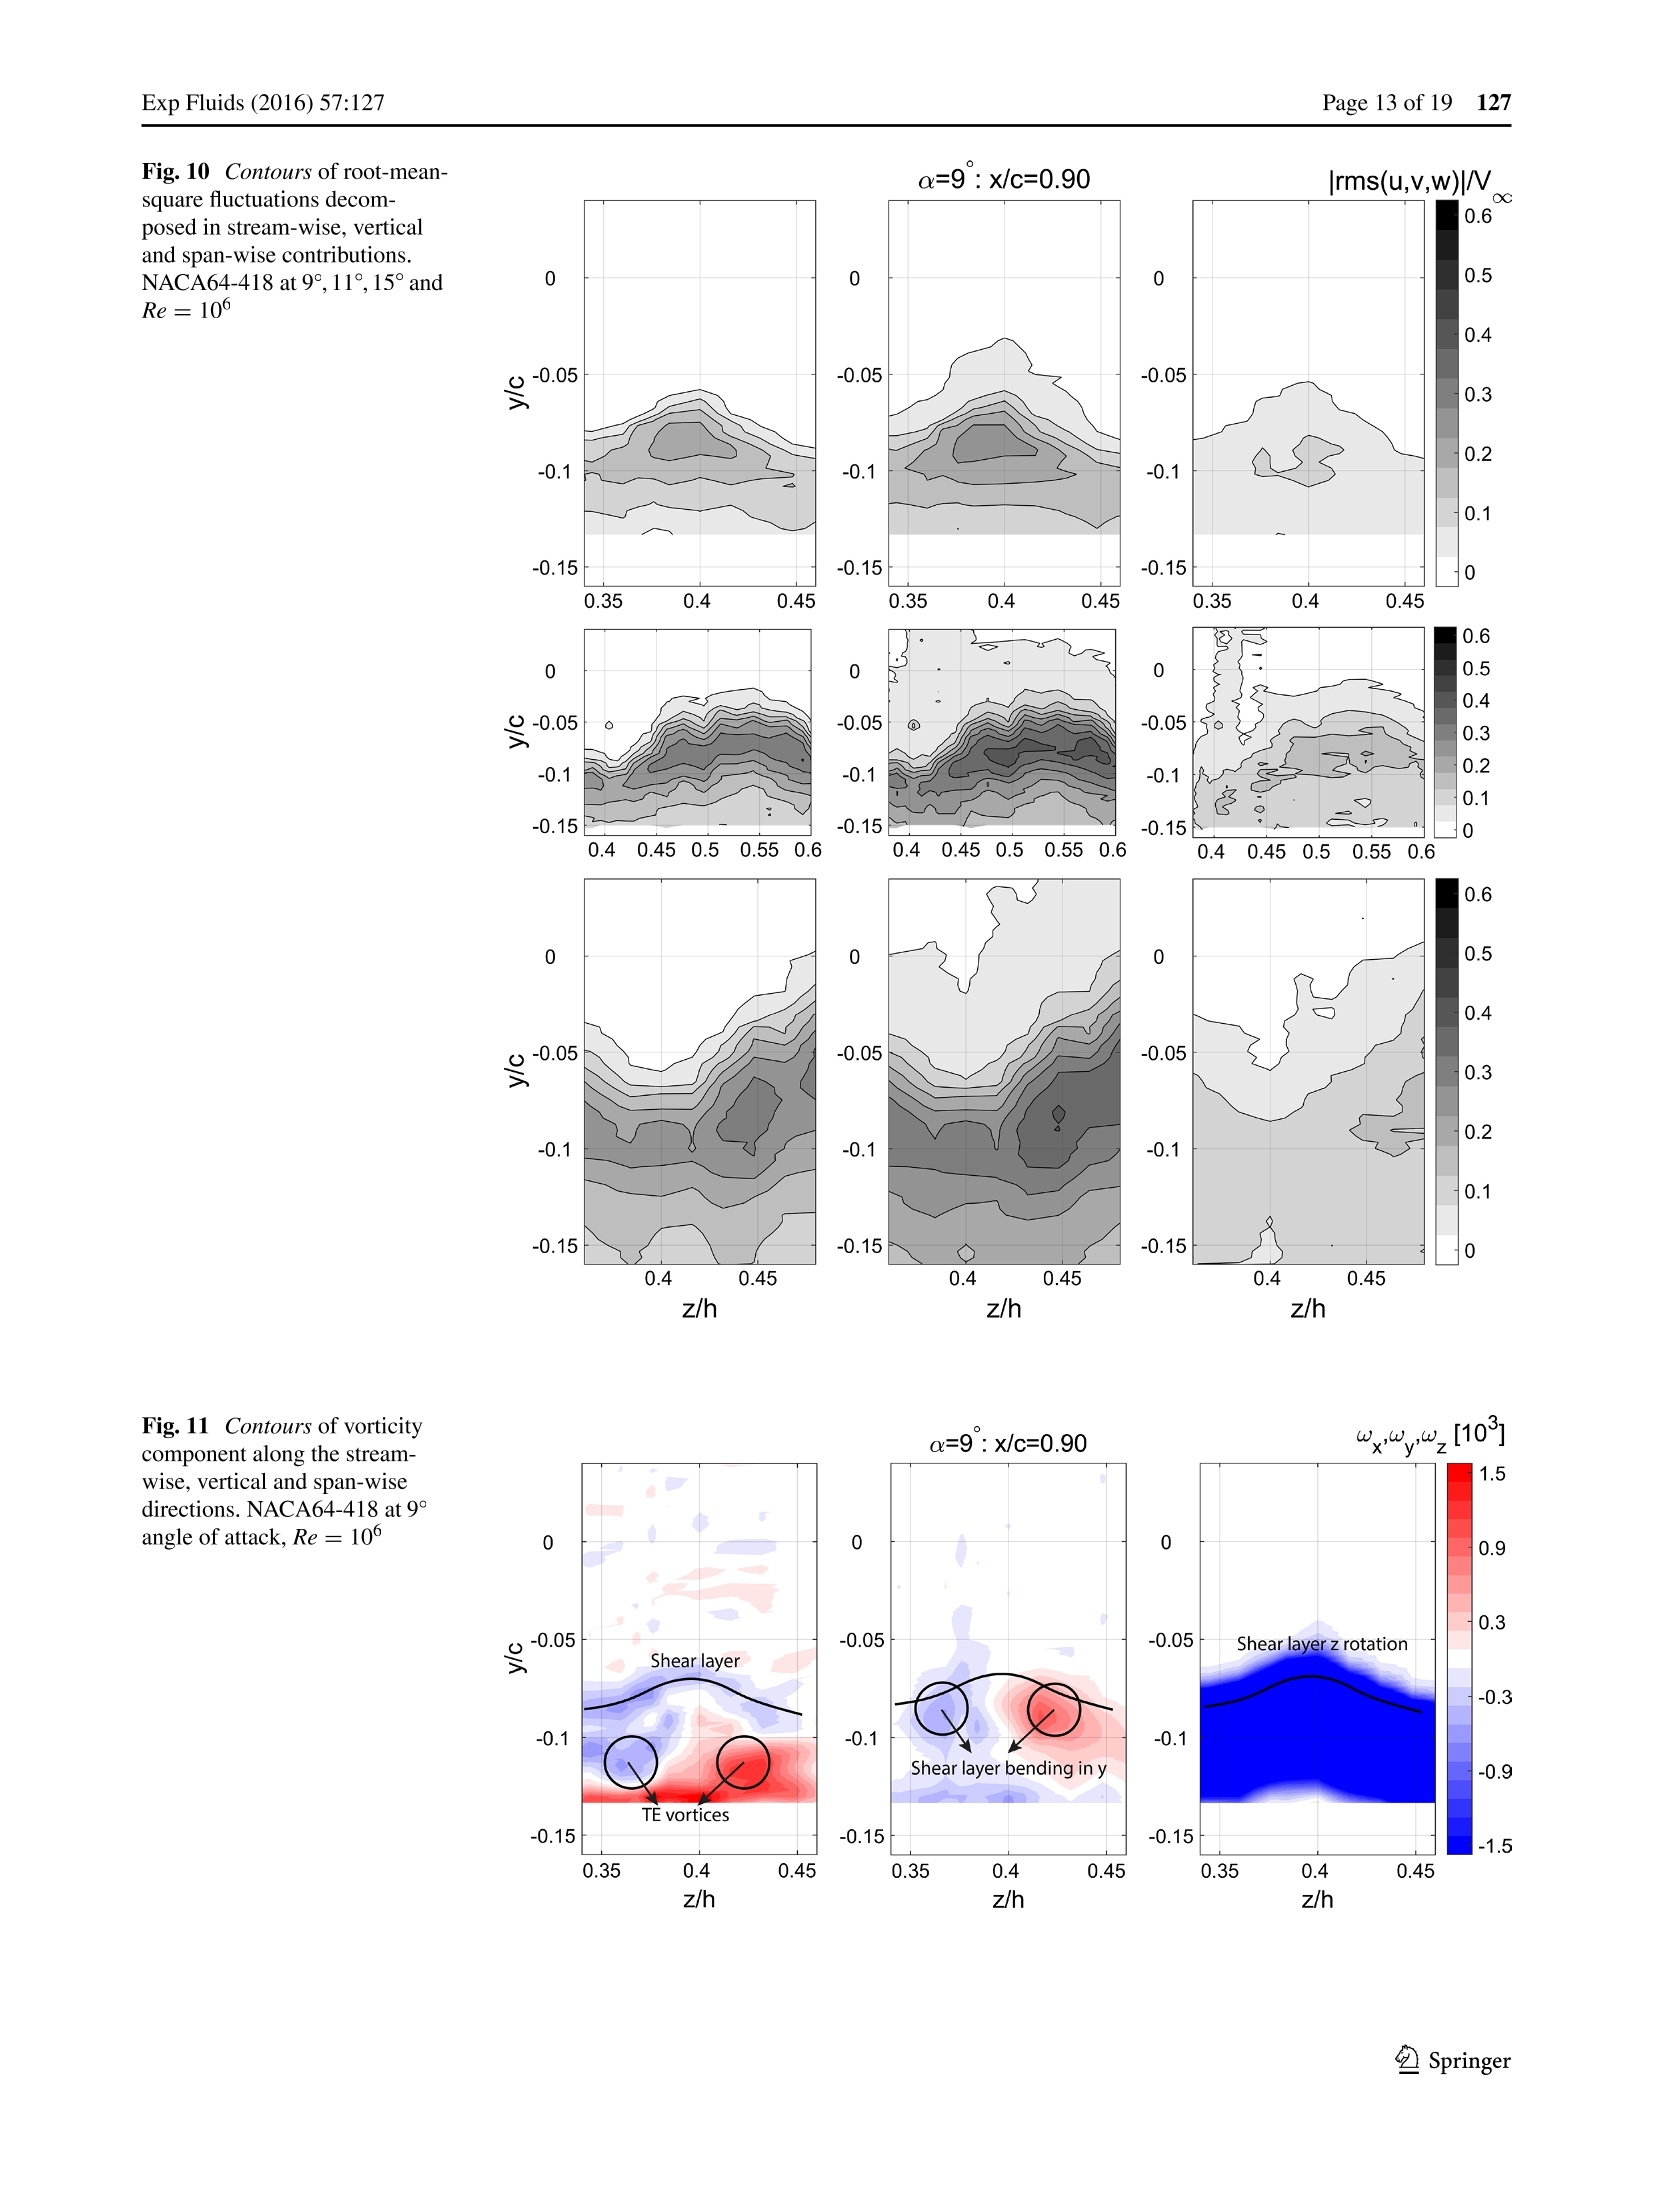
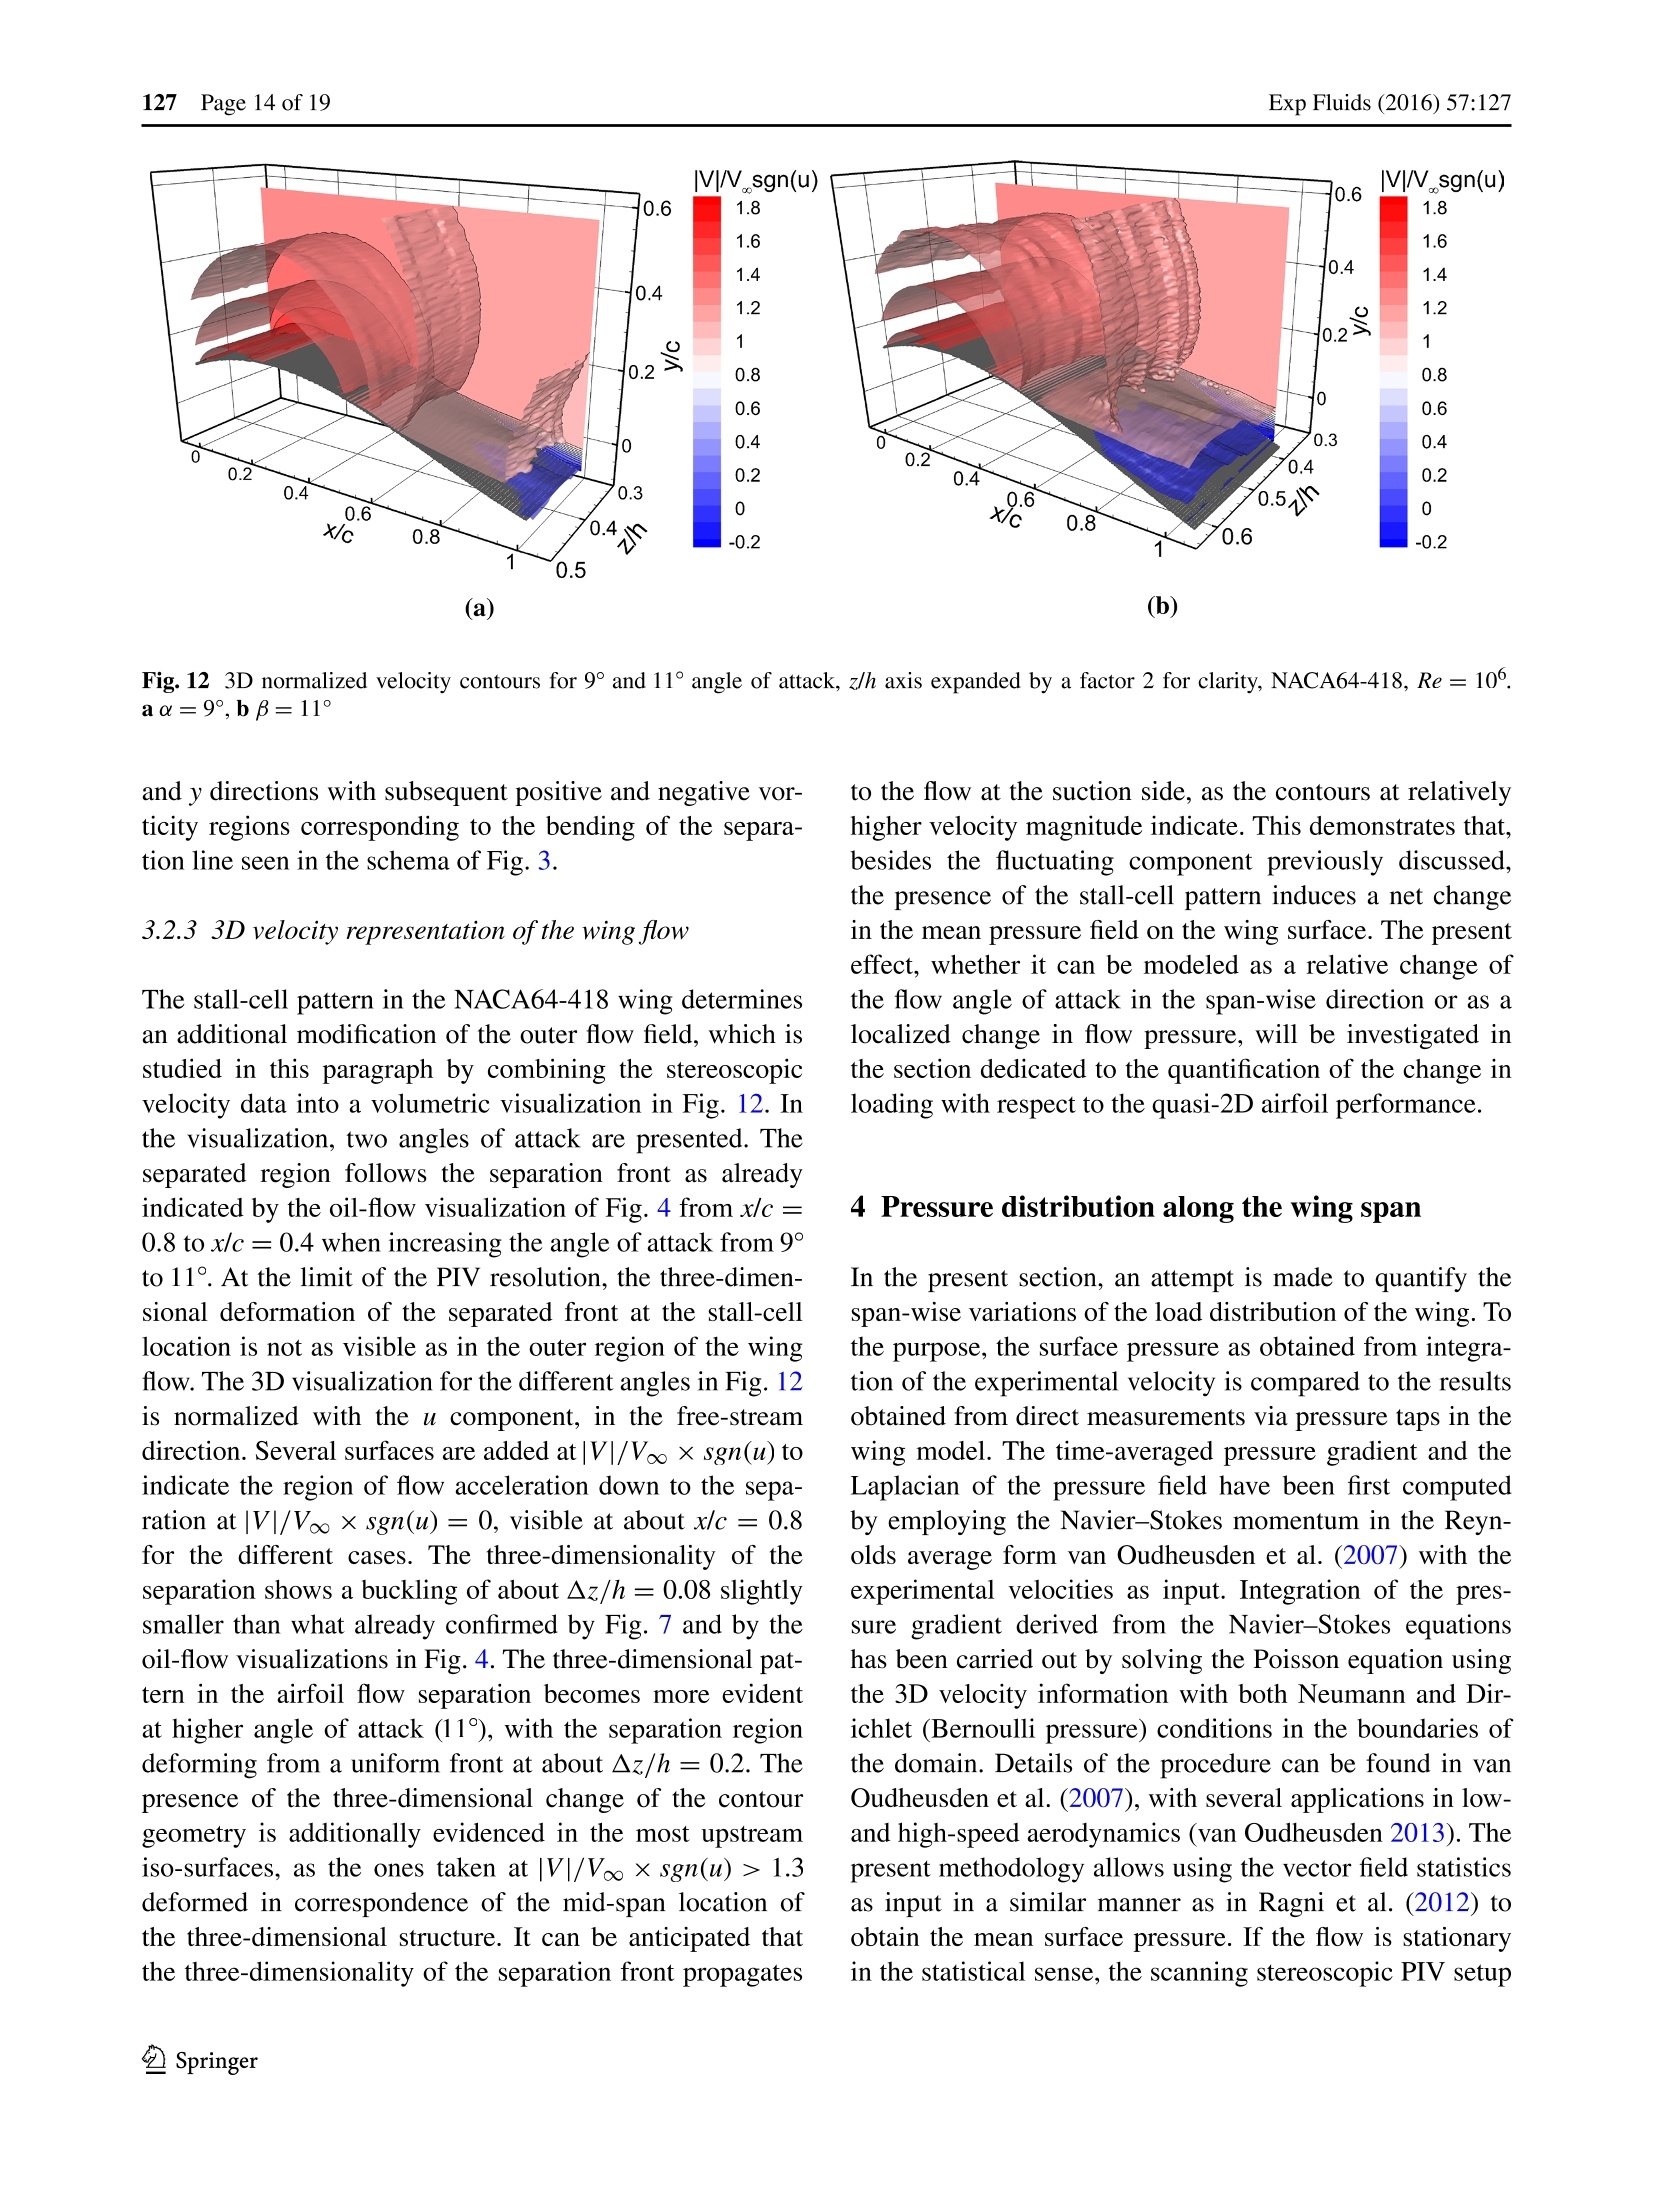
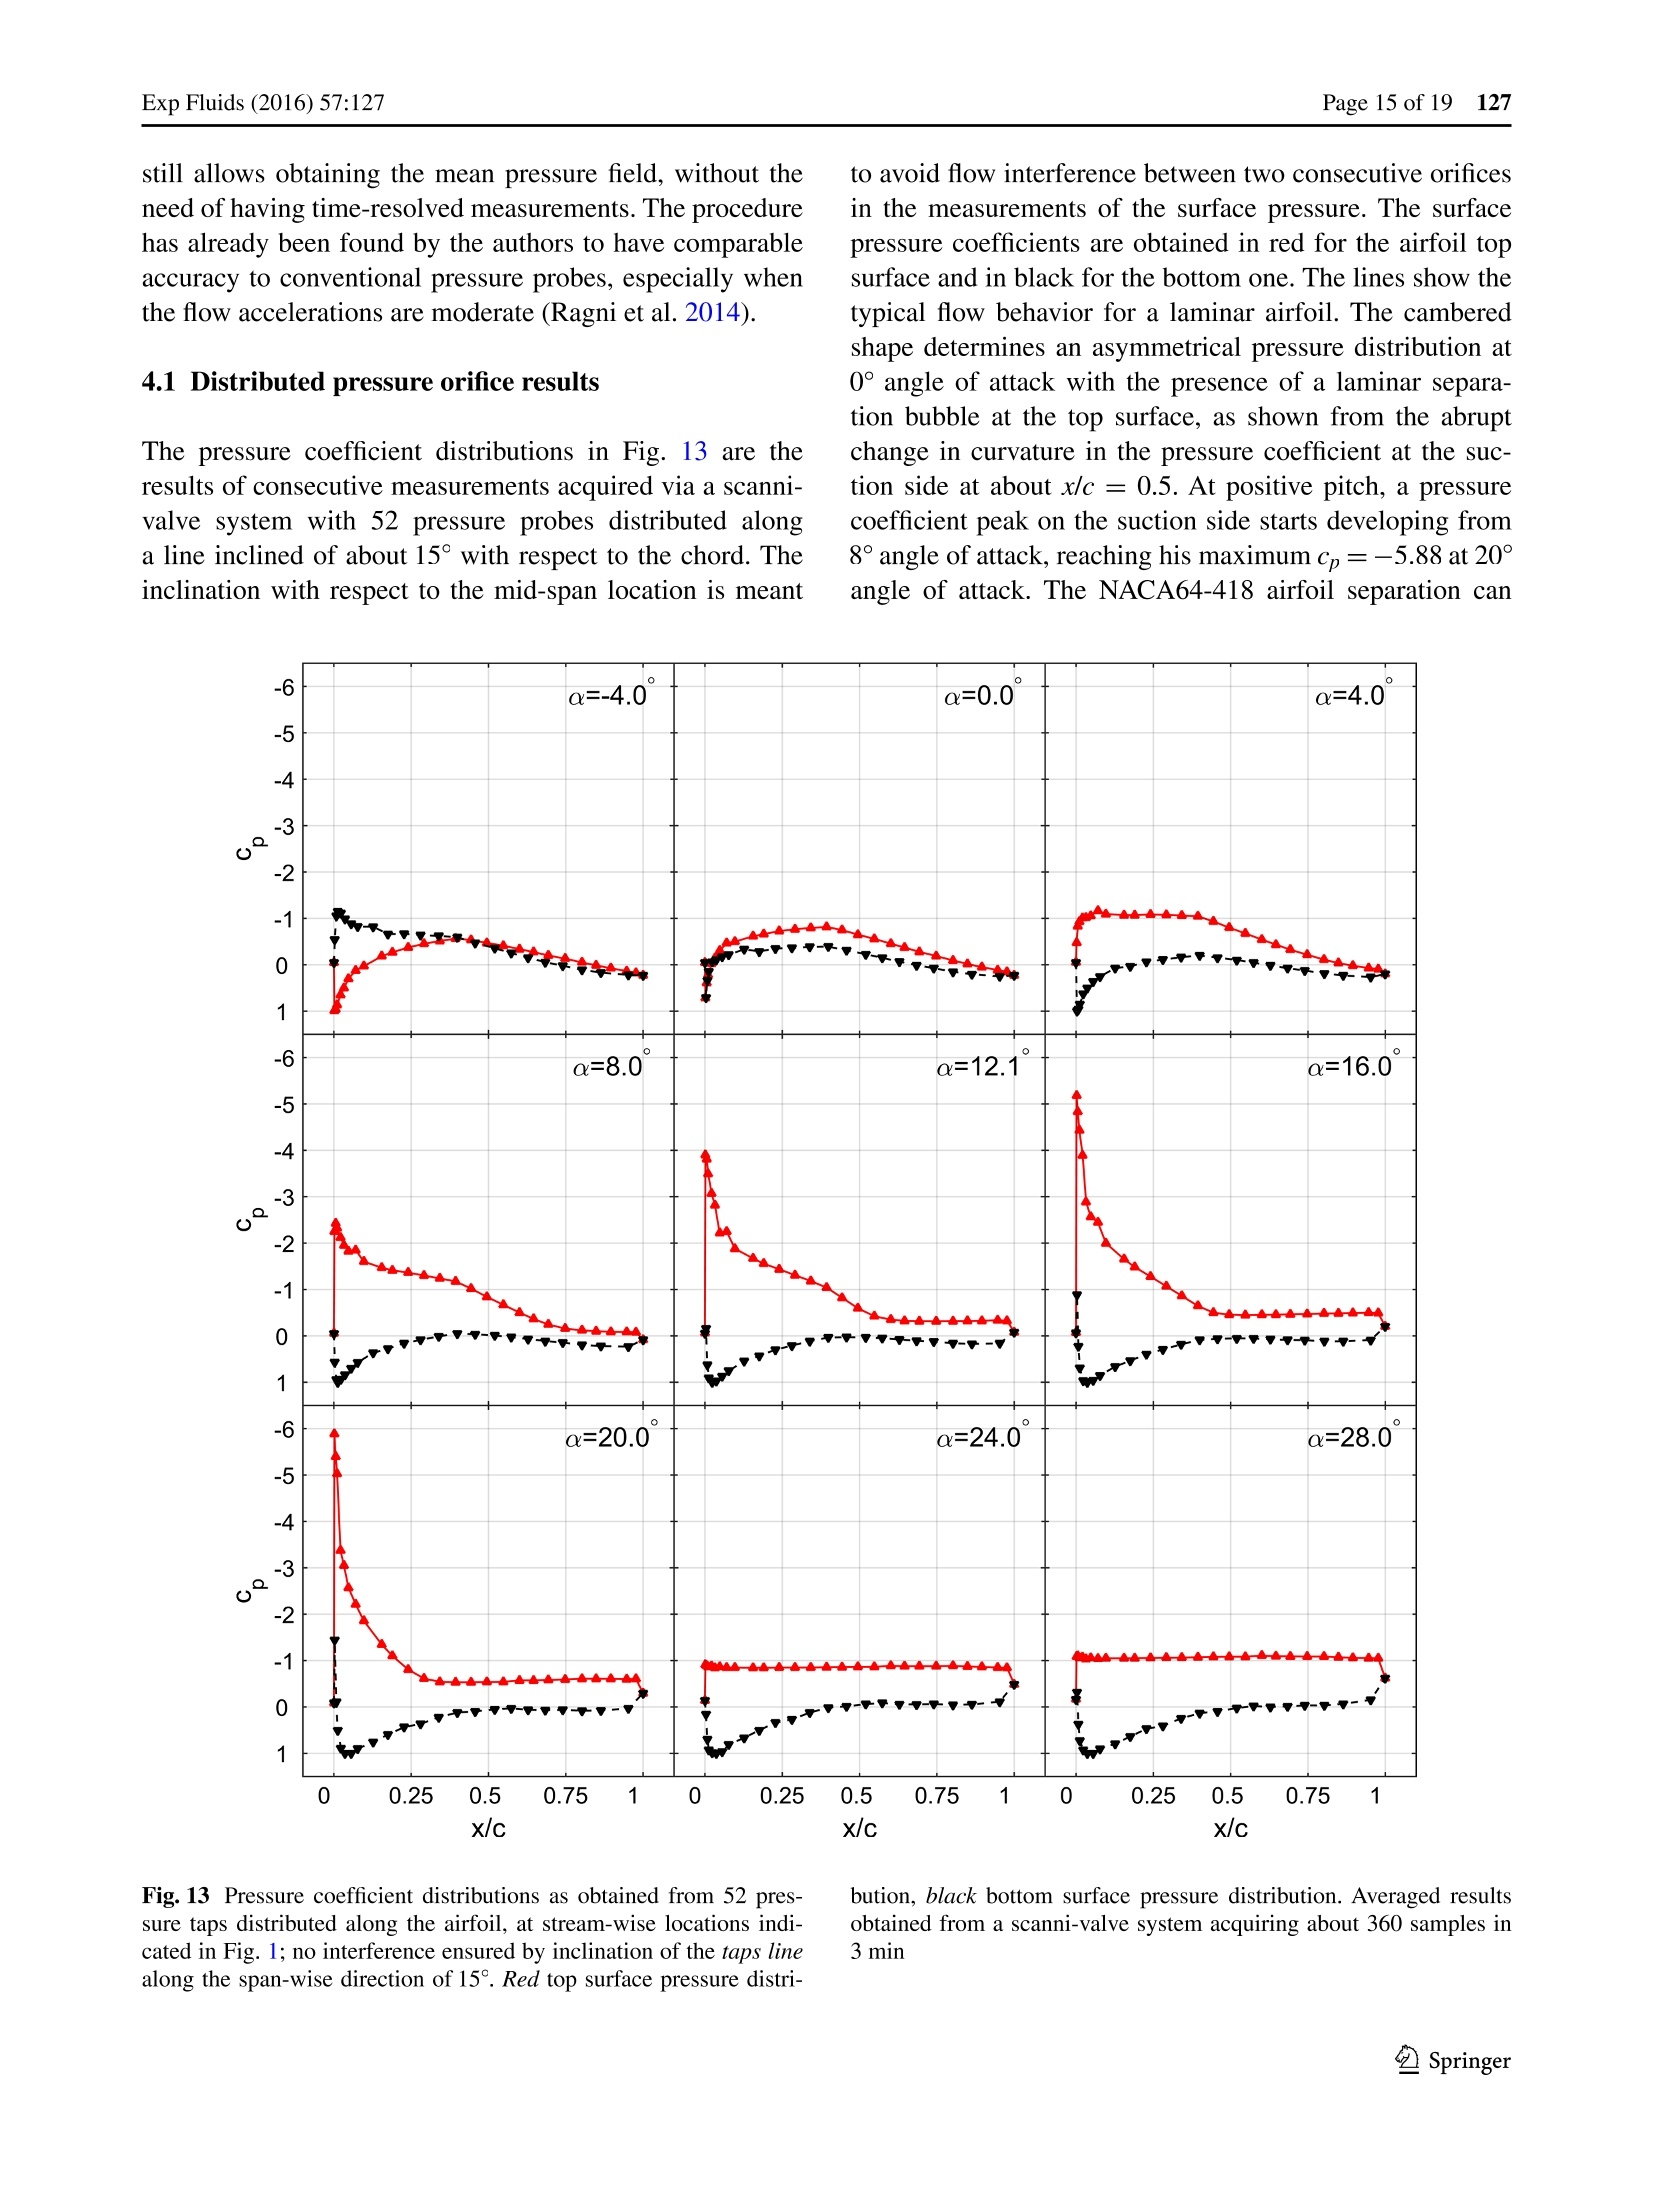
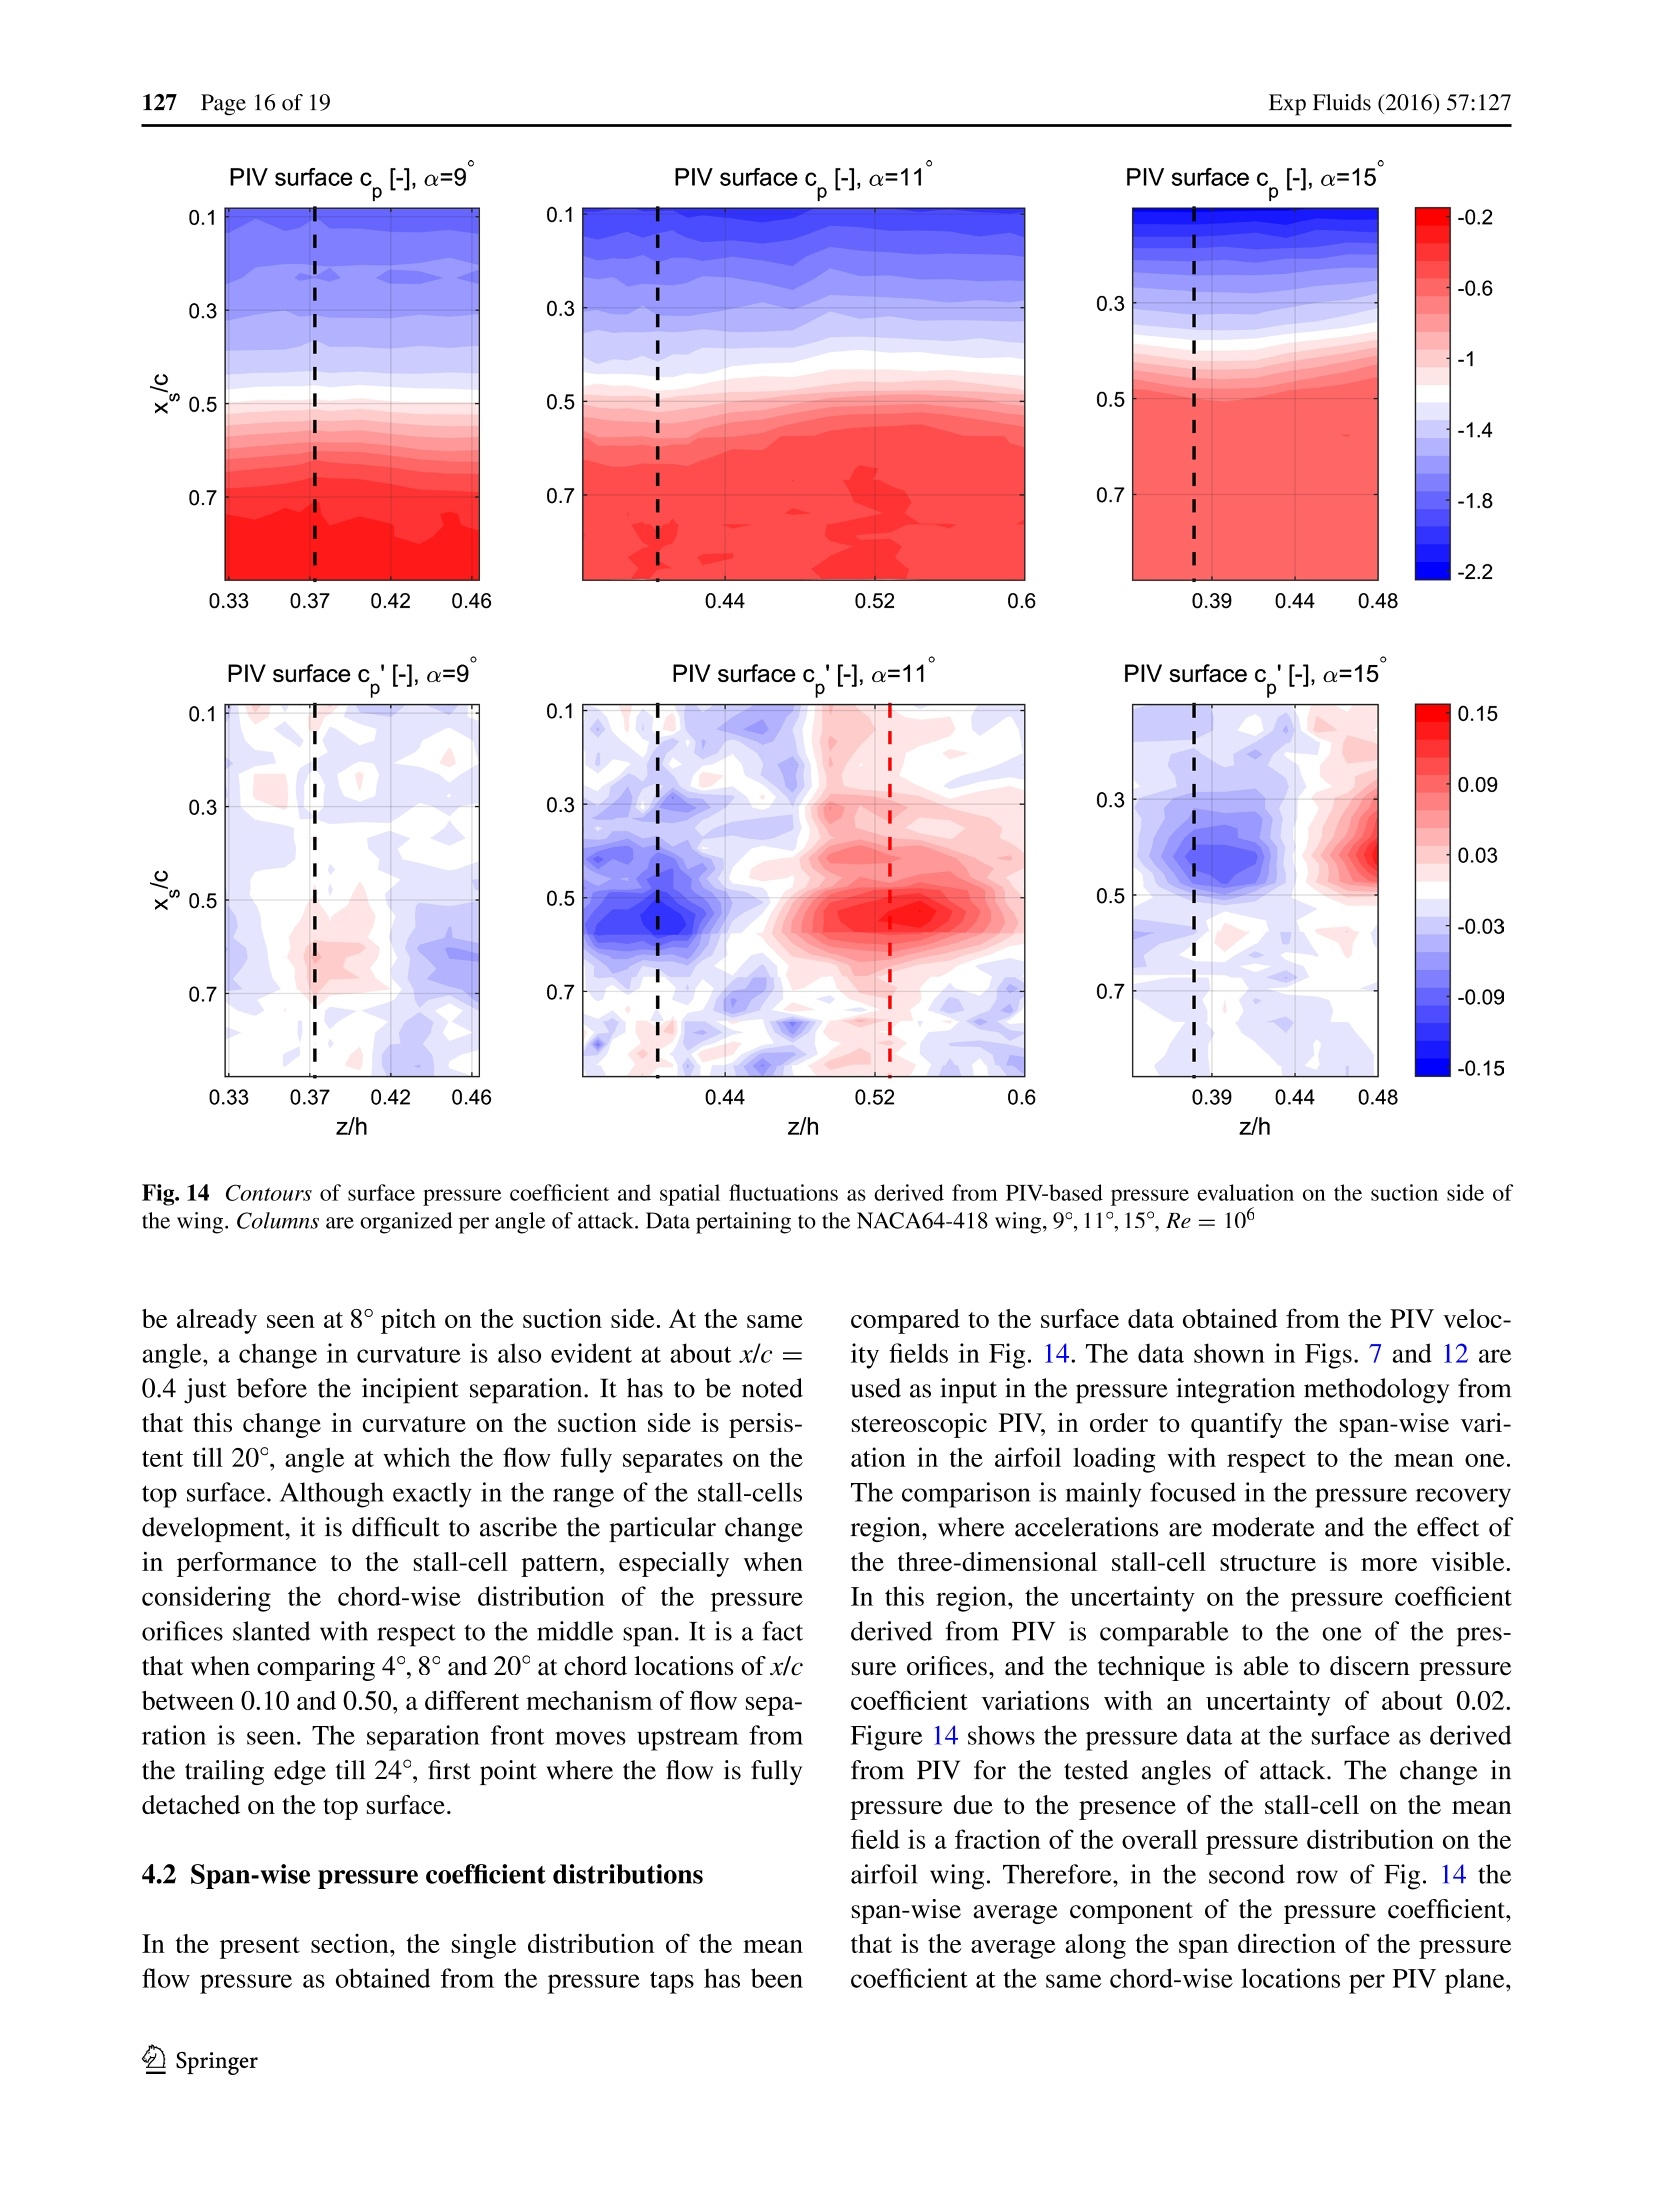
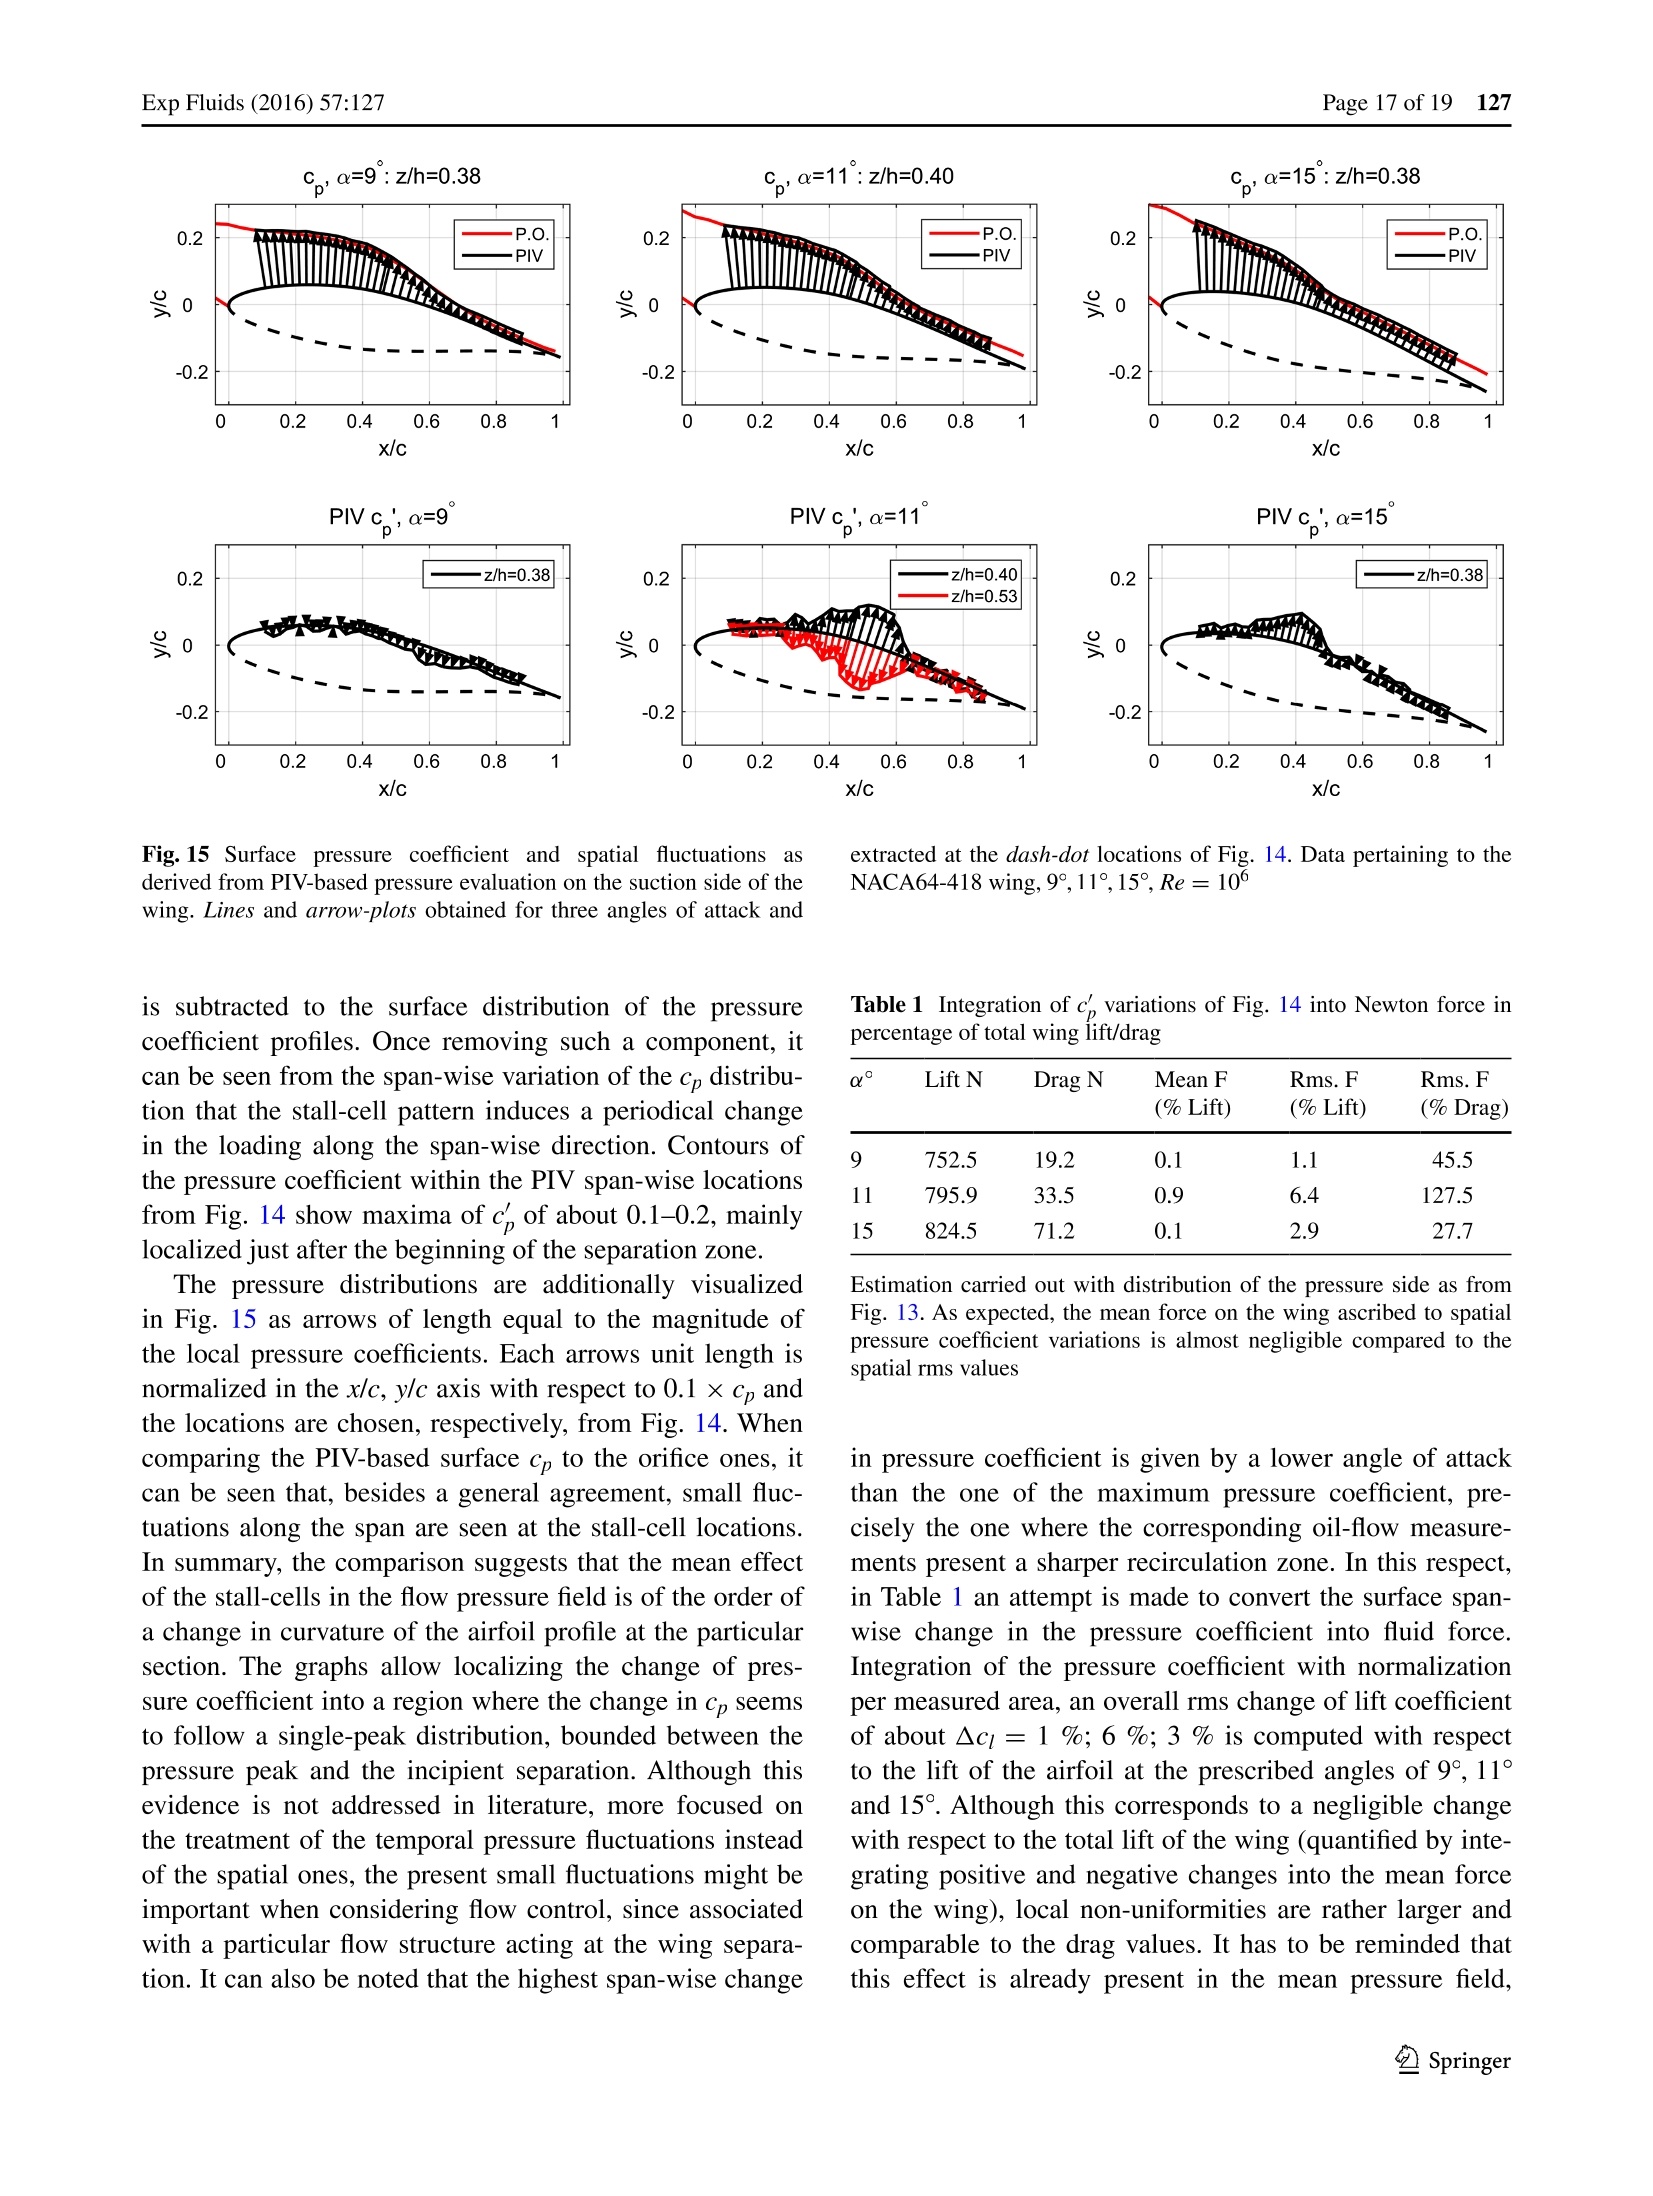
Exp Fluids (2016) 57:127CrossMarkDOI 10.1007/s00348-016-2215-8 127Exp Fluids (2016) 57:127Page 2 of 19 Effect of 3D stall-cells on the pressure distribution of a laminarNACA64-418 wing Daniele Ragni· Carlos Ferreira Received: 22 January 2016/ Revised: 27 June 2016/ Accepted: 4 July 2016/ Published online: 23 July 2016C The Author(s) 2016. This article is published with open access at Springerlink.com AbstracttAA 3D stall-cell flow-field has been studied ina 4.8 aspect-ratio wing obtained by linear extrusion of alaminar NACA64-418 airfoil profile. The span-wise changein the velocity and pressure distribution along the wing hasbeen quantified with respect to the development of cellularstructures from 8° to 20° angle of attack. Oil-flow visuali-zations help localizing the regular cellular pattern in func-tion of the angle of attack. Multi-plane stereoscopic PIVmeasurements obtained by traversing the entire setup alongthe wing span show that the flow separation is not span-wise uniform. The combination of different stereoscopicfields into a3D volume of velocity data allows studying theglobal effect of the stall-cell pattern on the wing flow. Inte-gration of the experimentally computed pressure gradientfrom the Navier-Stokes equation is employed to computethe span-wise distribution of the mean surface pressure.Comparison of the results with the ones obtained frompressure taps installed in the wing evidences a span-wiseperiodic loading on the wing. The periodic loading hasmaxima confined in the stream-wise direction between thelocation of the highest airfoil curvature and the one of theairfoil flow separation. Estimation of the periodic loading isfound within 2-6 % of the sectional wing lift. List of symbols (u,V,W) Cartesian-velocity components along the stream-wise, wall-normal and out-of-plane directions 区Daniele Ragni d.ragni@tudelft.nl Aerodynamics, Wind-Energy and Flight Performanceand Propulsion AWEP Department, TU Delft AerospaceFaculty, Kluyverweg 1, 2629 HS Delft, The Netherlands (x,y, Z) Cartesian-coordinate components along thestream-wise, wall-normal and out-of-planedirections Angle of attack of the wing () 8 Discrete difference Mean of a quantity,f Flow density (kg m-) pA Planform area of the wing, s ×c (m) Wing aspect-ratio, s/c Wing chord, profile chord (m) DCd Drag coefficient, obtained as: -1/2pVA C1 Lift coefficient, obtained as: 1/2pv2.4xo Cm Pitching-moment coefficient, obtained as:M 1/2pVAcPressure coefficient, obtained as: P-PooD Wing drag (N)d Lens diameter (mm) Lens focal length (mm) Fluctuations of a quantity,f Lens aperture, fld Test-section height (m) Wing lift (N) Test-section length (m) Wing pitching-moment (N m) Stall-cell number Static pressure (Pa) Free-stream static pressure (Pa) Wing span (m) Sign of a variable, f/lf| Strouhal number, defined as vc/Vo, wherev is the characteristic frequency of the vortex-shed- ding in the flow Wing/airfoil thickness per chord percentage Velocity vector with Cartesian components,u, v,w (ms-), along the stream-wise,wall-nor- TE Trailing edge 1 Introduction 1.1 Stall-cells in airfoils separation at the leading edge occurring at a relatively highangle of attack. As seen by Gregory et al. (1971), stall-cells have been found to be rather persistent flow featuresalready in supposedly 2D airfoil-testing. In their study,several mechanisms including extensive wall-suction wereattempted to suppress the 3D flow pattern and to restore auniform flow separation at the suction side of the model. Intheir early study, focusing on a simple flow visualization,Winkelmann and Barlow (1980) refer to such structures asmushroom-shaped or “owl’s face”cellular patterns. Thepeculiar names are due to a pair of counter-rotating vorticeswith axis perpendicular to the wing planform, generated bythe rearrangement of the flow separation front occurring atmoderate angles of attack. Additional investigations fromWinkelmann (1990) and Bippes et al. (1987) confirmed thepresence of paired vortical structures developing along thewing, though not further progressing in linking their for-mation to the typology of airfoil separation. Although thesecounter-rotating vortices have been visualized in severalfinite-wing models, both early (Gregory et al. 1971) andmore recent literature (Schewe 2001) agree in not attrib-uting the physical origin of stall-cells to the consistentseparation typically occurring at the wing tips. One of thefirst explanations given to the formation of 3D structuresfrom a 2D separation line has been originally found in thework of Weihs and Katz (1983). In their work, they sug-gested that the cellular pattern is the result of a Crow-typeinstability, where two counter-rotating vortices mutuallyinteract amplifying small oscillations in their shape, upto the formation of a chain of vortex rings (Crow 1970).Although this hypothesis might explain the first stage ofthe evolution of the vortex sheet associated with the flowseparation into a three-dimensional cellular pattern, theintrinsic inviscid character of Crow-type instabilities can-not give information on the origin of the pattern, due to thepresence of a viscous boundary layer and solid bounda-ries. Weihs and Katz (1983) still focus on the deformationof the flow separation front into a more complex pattern ata moderate airfoil angle of attack. In more recent studies(Rodriguez and Theofilis 2010), new hypotheses tend toascribe the phenomenon to span-wise instabilities in theflow separation front, amplified by the increase in angle ofattack at low Reynolds number for laminar airfoils. Morein particular, the work of Rodriguez and Theofilis (2010)attributes the generation of stall-cells to the amplificationsof a two-dimensional instability in the flow separation line.Elimelech et al. (2012) correct the present idea by ascribingthe phenomenon to a three-dimensional span-wise instabil-ity. However, the work of Yon and Katz (1998a) refuted theprevious hypothesis by acquiring pressure measurementson a wing model, being in disagreement with the pres-ence of such an instability made out of a single vortical-line.Additionally, the latter provided extra information on stall-cells pattern characteristics, as for example the linearproportionality between the integer number of cells on thewing surface and their aspect-ratio, in agreement with theestimation from Winkelmann and Barlow (1980) obtainedon a wing-flap few years before. More extended informa-tion is also provided by the authors on the time-scale of thecellular movement (Yon and Katz 1998a, b). Recent resultsfrom Manolesos et al. (2014) confirmed that the geomet.rical shape of such structures in function of the angle ofattack is function of the profile characteristic. In particular,they showed that the Reynolds number has an effect on theupstream location of the separation front, while the stall-cell area-growth is proportional to the increase in angle ofattack and, more precisely, independent of the wing aspect-ratio for relatively high angles. 1.2 Frequency content and dynamics Stall-cells have been found to have both a rather steady ordynamic time-response, with peculiar features dependenton the flow Reynolds number and on the characteristics ofthe boundary layer at their location. Yon and Katz (1998a)showed, by use of fast-responding pressure transducersembedded in a NACA0015 wing at Re=0.60 ×10, thatstall-cells oscillate with a dominant frequency below theone corresponding to wake instabilities, determined bythe separated flow on the wing. In particular, the authorsshowed that low-frequency (St ≈ 0.04) oscillations areassociated with stall-cells, while higher-frequency contri-butions relate to the most common wake instabilities (St ≈0.15). Additionally, their unsteady-pressure time-historiessuggested that pressure fluctuations as measured at thelocations of stall-cells do not have any connection with theones associated with the wake shedding entailing that: l. tthe wing shear layer determines the formation of twoindependent types of coherent structures: one pertain-ing to the shedding of the separated flow in the wakeand another to the stall-cell pattern; 2. although cellular structures are found to be unsteady,their movement in time is rather limited when com-pared to bluff-body shedding. The behavior of stall-cells at lower Reynolds numbersis more controversial: recent studies from Broeren andBragg (2001) found no span-wise time-fluctuations atRe=0.30× 10, contrarily to the work of Zarutskayaand Arieli (2005), reporting rather irregular motions atRe=0.39 x10. Recent works from Rodriguez andTheofilis (2010) using bi-global linear-instability analy-sisshowed topologicalsimilaritiesbetweenn1:laminarseparation bubbles andstall-cells, in terms of modalinstability-components. Stall-cells have been found to modify the loading distribu-tion of airfoil wings. A first insight can be already found inthe work of Yon and Katz (1998b). In their work, by analy-sis of pressure measurements in the attached flow regionbetween different stall-cells, they found a wing pressuredistribution corresponding to the one obtained with poten-tial-flow calculations of the same flow at a lower angle ofattack.One of the main conclusions of their study was therelevance of these differences with respect to the maneu-verability of the wing once deployed in aircraft applica-tions. This was also confirmed later by Disotell and Greg-ory (2015) suggesting that stream-wise vortices emanatingfrom the stall-cell “foci”determine a consistent downwashwith associated high-amplitude pressure fluctuations. Whenextended to airfoils and wings in dynamic regimes, Carta(1975) measured an additional non-uniform load distribu-tion determined by these cellular flow structures, activelycontributing to the presence of stall-delay. The presence ofthese stall-cell structures has been investigated as well inhelicopter applications (Ottavio et al. 2008). In these highaspect-ratio rotating-wings, the radial flow is the driverof the instability which brings to the development of cel-lular structures preventing the centrifugal increase of theradial-velocity distribution up to the tip. In computationalfluid dynamics, a substantial amount of research has beendevoted to determine the effect on the pressure distribu-tion and loading in low aspect-ratio wings (e.g., Zarutskayaand Arieli 2005; Taira and Colonius 2001). In particular,Taira and Colonius (2001) concluded that in low aspect-ratio wings, the stall-cells regime is an intermediate statewhich persists till the wake degenerates in a pure 2D Kar-man-shedding. Despite the large body of literature focus-ing on stall-cells dynamics, it is rather unclear what theiractual effects on the wing velocity and pressure fields are.Predominantly in wind-turbine blades, currently designedon the basis oftwo-dimensional BEM codes (Burton et al.2001), 2D polars from wind-tunnel tests (Selig et al. 1995,2011) and steady computations, it is crucial to quantifythe performance change with respect to a flow separationthat is not span-wise uniform. Especially in modern airfoildesign-solutions, where aerodynamic and structural charac-teristics (Ragni et al. 2014) are combined in high aspect-ratio blades, the determination of a 3D unsteady loadingmight enhance the fatigue of the wing, or even affect theresonant response of the structure once installed in a windturbine. In this respect, the present study addresses thecomparison between supposedly two-dimensional steadypolars acquired with wind-tunnel pressure taps, and thethree-dimensionalpressure distribution computed fromstereoscopic particle-image velocimetry (SPIV) velocityfields. More precisely, the manuscript aims at quantifying the change in the local pressure distribution due to stall-cells on a laminar NACA64-418 wing, reference profile forseveral wind-turbine and helicopter applications. An oil-flow investigation of the NACA64-418 wing is carried outfollowed by a SPIV characterization of the span-wise flowfield. Vector fields in planes parallel to the mid-span onehave been combined to form a volume of data. The proce-dure has been found in recent studies to be relatively use-ful in the quantification of the size and characteristics ofthe stall-cells pattern (Manolesos et al. 2014). The experi-mental velocity fields are subsequently used as input in theNavier-Stokes equations in a similar effort as in Noca et al.(1999), van Oudheusden et al. (2007), Ragni et al.(2012),to obtain the pressure gradient directly integrated into flowpressure, further compared to pressure taps installed in thewing model. 2 Experimental model and wing performance 2.1 Wind-tunnel and airfoil model A NACA64-418 airfoil with chord c = 25 cm and chord-normalized thickness t/c= 18 % has been manufacturedinto an aluminum wing of span s equal to the height of thewind-tunnel test section h of 1.25 m and aspect-ratio AR=h/c = 4.8. In Fig. 1, the coordinates of the laminar airfoilprofile NACA64-418 are presented together with a pictureof the wing in the test -section. The wing has been manu-factured by computer numerical control (CNC) machin-ing, with a final roughness below half a micron. Themodel has been vertically installed in the closed-circuit low-turbulence wind tunnel (LTT) of the TU Delft labora-tories. The wind tunnel has an octagonal test section with1.80 m width,1.25 m height and 2.60 m length. With acontraction ratio of 17.6, the wind tunnel can reach amaximum wind speed of 120 m s- with a turbulencelevel ranging within 0.07 to 0.15 % in wind speeds from10 to 75 m s. The model has been supported in the tun-nel section by a six-component balance able to measuresteady lift, drag and pitching moment. A series of 52 pres-sure taps (24 on the bottom surface and 28 on the top one)have been installed in the wing. The chord-wise locationof the pressure taps is indicated in Fig. 1b. The orificeshave been located on a plane inclined of 15°with respectto the mid-span one, in order to ensure interference-freemeasurements. All pressure taps have been connected to ascanni-valve able to sample the entire pressure distributionat a frequency of about 2 Hz, allowing for the acquisitionofthe average pressure on the airfoil surface. A measure-ment acquisition time of about 3 min per angle of attackhas been chosen in order to have ensemble averages withat least 350 samples. 2.2 Airfoil lift and drag performance Aerodynamic loads have been measured in a range ofangles of attack from -20° to +30°, at a free-stream veloc-ity of V.o=60 m s-, corresponding to a Reynolds num-ber of Re=10. The airfoil characteristics lift/drag/pitchingmoment are shown in Fig. 2 as obtained from the six-compo-nent balance in both free and forced boundary-layer transition.Boundary-layer transition has been forced with two differentserrated tapes: a first configuration with 0.32 mm serrated tape Fig.1 a NACA64-418 wingmodel installed in the wind-tun-nel test section. b NACA64-418profile and chord-wise locationof the pressure ports on thewing model Free B.L. transition 30 Forced B.L. transition: T.S.= 0.20mm, 0.05x/c; B.S.=0.32mm, 0.10x/c Fig. 2Lift/drag/pitching-moment coefficient obtained from six-com-ponent balance measurements, NACA64-418 wing with AR=4.8,results for Re=10, 0.7×10,0.3×10. Top row free boundary-layer transition. Middle row forced boundary-layer transition with0.32 mm zigzag tape (6 mm width, 30°angle) placed at x/c= 0.30 (6 mm width, 30° zigzag angle) placed at x/c = 0.30 on bothsurfaces and a second configuration with 0.20-mm serratedtape at x/c= 0.05 on the top surface and x/c = 0.10 on the bot-tom one. The particular choice of the previous dimensions hasbeen based upon the work of Braslow and Knox (1958) andlater of Selle (1999),prescribing the most effective turbulatorheight in order not to have a relevant modification of the airfoilperformance. Measurements with free boundary-layer transi-tion have been acquired by keeping the airfoil in the originalclean condition. Results show that the steady lift and drag on both top and bottom surfaces. Bottom row forced boundary-layertransition with 0.20-mm zigzag tape (6 mm width, 30°angle) placedat x/c = 0.05 on the top surface and x/c = 0.10 on the bottom one.Black airfoil polars as obtained by one-directional pitching of the air-foil; red airfoil hysteresis cycle polars are independent of the Reynolds number for valueslarger than Re=0.7×10. The typical linear behavior of thelift coefficient is measured between -9° and 7°. In this rangeof angles of attack, small Reynolds effects are appreciated,besides a considerable reduction of the max-lift angle of attackfor the curve at Re=0.3×10⁶. This is coherent with thetypical behavior of laminar airfoil profiles, having a laminar-flow separation bubble sharpening the response at maximumlift and abruptly causing leading-edge flow separation due toits bursting at high angle of attack (Hu and Zifeng 2008). The full flow separation on the top surface is measured at about 22°angle of attack with a hysteresis cycle which restores the origi-nal airfoil performance when pitching down to 18°. At lowerReynolds, the hysteresis cycle extends to a relatively largerangle of attack. This indicates that the airfoil curvature closeto the leading-edge location is such that the flow on the airfoilsurface needs a more favorable pressure gradient to reestablishits original performance. Measurements pertaining to the wingoperating with forced boundary-layer transition do not showan important degradation of the laminar airfoil performance,though a clear anticipation of the nonlinear regime is visible inboth curves of the lift and drag coefficients, as expected by theearlier reenergization of the boundary layer induced by forcedtransition. Forcing of the boundary layer seems to interferewith the role of the separation bubble allowing for a less pro-nounced change of all airfoil curves at high angles of attackk.Previous studies from Boiko et al. (1996) confirmed that thelift and drag coefficients of such airfoil result from a flow fieldthat combines both the leading-edge separation bubble andthe stall-cells. The first flow feature acts mostly at the wingleading edge where the curvature is max, therefore showingthe largest contribution on the maximum c. Despite this fact,Boiko et al. (1996) showed that by actively operating throughacoustic disturbances in the separated-flow region, a moreprominent effect of the 3D reorganization of the stall-cell flowcan be made on the pressure distribution. In the followingsection, the characteristic of such flow features for angles ofattack corresponding to the ones in Fig. 2 will be analyzed anddiscussed. 3 Organization of stall-cells in a NACA64-418wing Stall-cells develop in the form of three-dimensional elon-gated structures, typically localized in a“mushroom”-like type shape (Winkelmann and Barlow 1980; Winkelmann1983). The span-wise elongation and size of these struc-tures depend upon the pressure gradient in the separated-flow region, function of the airfoil characteristics, such asangle of attack and Reynolds number (Manolesos et al.2014). In this section, a schema of the flow features per-taining to the NACA64-418 laminar profile is given. Theorigin of stall-cells is determined by the reorganization ofthe separation front of the wing, which can be seen in thecombined schema/results in Fig. 3. Flow fields pertain-ing to wings with laminar airfoil profiles typically showa small separation bubble close to the leading edge of thewing. Besides footprints in the oil-flow visualizations,results from the present study show a more predominanteffect of this small separation bubble in the pressure ori-fices data. In the close vicinity of the leading edge of thewing, the oil-flow visualizations suffer from high curva-ture and photographic-reflections effects. The origin ofcellular structures spatially locates in the reorganizationof the separation front (Fig. 3) which extends up to theentire wing span. It has to be noted that in the literaturethe separation front is typically referred to as a laminarone; however, several studies report that the stall-cellformation mechanism is not affected by the turbulentenforcement of the boundary layer before the flow separa-tion (Gregory et al. 1971). However, this dependency istrue as long as the turbulent transition does not affect theflow at the separation bubble, which develops upstreamthe stall-cell pattern. The separation front from a span-wise uniform flowfeature transforms into a cellular pattern alternated withstall-cells and stagnation points (so-called focix) as shownin Fig. 3. In the following section, a more detailed analy-sis of the flow field is carried out with oil-flow visualiza-tions. Results are presented for the NACA64-418 wing atRe=10 under free boundary-layer transition. Flow separationfront 3.1 Oil-flow visualization of stall-cells in a NACA64-418wing The stall-cell flow-organization is visualized in functionof the angle of attack for the NACA64-418 wing. Oil-flowvisualizations are presented in Fig. 4, obtained by acquir-ing images of the airfoil surface painted with a fluorescentmixture and illuminated with diffused ultraviolet light.The mixture is obtained from 50-mm liquid-paraffin waxand 15-25 drops of fluorescent-oil additive A-680 from(UVP, INC. San Gabriel, CA., USA). Illumination is pro-vided by an ultraviolet lamp from Labino type PS 135UV. Images are acquired with the wing in a steady con-figuration, where the angle of attack is set in a range from0° to 20°at Re=10. The recording camera is placed ata 90° angle with respect to the wing planform. A third-order polynomial calibration is applied in order to mapthe curved surface of the airfoil into a straight span-wiseplane of dimension c ×s. Results in Fig. 4 identify the cel-lular structures on the airfoil wing in function of a staticairfoil angle of attack, at a Reynolds number of 1 million.The number of cellular structures presented on the winghas been compared to two empirical formulas derivedfrom previous literature. According to Crow’s (1970) the-ory, the integer number of stall-cells is solely function ofthe wing aspect-ratio: n=AR/2.28. A more complex for-mula can be found in the study from Boiko et al. (1996):n=AR/17.2xk×tan(a), where AR is the wing aspect-ratio, a is the angle of attack at which the flow separationis seen for the first time, k is the chord-normalized distancebetween the separation line and the stall-cell vortex axis. The first formula with wing aspect-ratio of 4.8 givesa resulting Crow’s predicted integer number of 2 stall-cells per wing span, while with separation angle of 8° andabout 20 % chord distance between the separation lineand the stall-cell vortex axis, a single“vortex pair”(so-called by the authors) is obtained with the second formulafor all angles of attack. The beginning of the instabilitycan be seen at 9°, when the separation line buckles froman approximately straight pattern into a stall-cell one at achord-wise location of about x/c = 0.8 (Fig.4b). The for-mation of stagnation nodes in the wing surface (Boiko et al.1996) appears from 11° angle of attack, as shown by theabundant collection of oil in the stagnation region. Thepresence of multiple nodes in the wing span with a spac-ing of 0.20h is a result of the development of the separationfront into a three-dimensional pattern, with oil recircula-tion zones at the nodes location. By increasing the angleof attack from 9° to 13°, the distance between two differentstagnation zones increases up to about 0.30h, distance kepttill the separation reaches the leading edge of the airfoil.The reduction of the stagnation size in the same range ofangles of attack proves that the three-dimensional pattern is dependent to the amplitude of the suction region on the topsurface. In order to confirm that the stall-cell pattern is notthe result of a boundary-layer trigger to turbulent flow, theflow has been locally forced with a strip of tape of 0.2 mmthickness and 6 mm inclined at about 15° along the chorddirection at about 0.30-0.35 span-wise location (traces ofit can be seen from photographic reflection in the oil-flowimages). The characteristics of the tape are in the rangespecified by Braslow and Knox (1958) to force the transi-tion of the boundary layer to turbulent (from 0.07 to 0.47mm), though no effect on the stall-cell pattern is found, inagreement with the previous literature. In Fig. 5, the flowaround two consecutive stall-cells has been imaged in timeto show the progressive accumulation of oil in the stagna-tion region, giving additional information on the sense ofrotation of the flow in the zone. Although not being a time-resolved oil-flow visualization, Fig. 5 has been obtainedby setting the angle of attack to 12° and by operating thewind tunnel from zero velocity to the operational regimein a relatively short time (within 3-5 s). Just after havingreached operating conditions, the progressive accumulationof oil has been photographed at regular intervals of about5 s, in order to see the development of the separation frontinto a stall-cell. The development of the flow pattern inFig. 5 shows a constant and progressive accumulation of oilat one location, suggesting that the stall-cell is immediatelylocalized in its precise location with no-large spatial fluc-tuations. The abundance of oil in the stall-cell is conveyedfrom the recirculation region created by the buckling of theseparation front. It can be further noted that a consistentmodification of the oil path-lines from their straight pathis seen upstream separation, much before the onset of thestall-cell pattern. 3.2 Stereoscopic PIV analysis 3.2.1 Experimental setup Stereoscopic PIV measurementsShave been measuredat several locations along the span-wise direction of theNACA64-418 wing. The averaged velocity fields have beencombined in the span-wise direction to form a volume ofdata. Three velocity volumes have been created for anglesof attack of 9°-11°-15° at a Reynolds number of Re =10°by combining planes acquired at a minimum distance of5 mm in the span-wise direction. Seeding particles fromSAFEX-Long-Lasting-Mix are generated by a SAFEX fogmachine able to provide droplets with a median diameterof ≈1 um. The tracer droplets have been injected down-stream the model, in order to determine a uniform andhomogeneous concentration at the test section after flowrecirculation in the closed circuit. Laser light provided bya Quantel CFR200 Nd:Yag laser with 200 mJ pulse- has 0 L.E. 0.2 0.4 0.6 0.8 T.E 1 0.35 0.4 0.45 0.5 0.55 0.6 0.65 0.7 (a) 0 L.E. 0.2 0.4 0.6 0.8 T.E 0.35 0.4 0.45 0.5 0.55 0.6 0.65 0.7 (c) (e) (f) (g) Fig. 4 Oil-flow visualizations of stall-cells in a NACA64-418 wingat Re =106. Coordinates normalized with the airfoil chord of 25 cmand the airfoil span s = h of 1.25 m. Results corrected by polyno- mial mapping into the planec×s. a 二=7°,bα=9°, c a=11°, dα=12°, ba=13°,fa=15°,gα=18°,h α=20° Fig.5 Oil-flow visualization obtained by consecutive recording with about 5-s time delay. First and second rows correspond to the location oftwo consecutive stall-cells on the airfoil flow at Re =10 with 12°angle of attack. Locations corresponding to Fig. 4 been conveyed through laser optics to form a laser sheet ofabout 35 cm width approximately 2 mm thick at the fieldof view (FOV) location. The flow is imaged by two CCDLaVision Imager Pro LX cameras with a sensor resolu-tion of 4872 ×3248 px² and a pixel pitch of 7.4 um/px.The two cameras are mounted with a relative angle of 37°,respectively, at about 10° forward scatter. Two Nikon-Nik·kor lenses of f= 180 mm focal length and aperture f#5.6are mounted on the CCD cameras. At a distance of 1100mm, the cameras are imaging a field of view of about30×20 cm² with a camera digital resolution of 10.1 px/mm obtained from the final stereoscopic mapping of thetwo cameras. With the current magnification factor of 0.11and the current aperture, the image particle size on the cam-era sensor of 1.3 px (Westerweel 1997) allows mitigatingthe peak-locking problem. A histogram of the raw particle displacement is carried out to verify the absence of such abias on the velocity fields. Image acquisition, processingand post-processing have been carried out by the LaVisionDaVis 8.1.5 software. For each angle of attack and span-wise location, 150 images have been acquired and furtherprocessed by a multi-pass correlation algorithm, with afinal window size of 16×16 px and 50 % overlap, giv-ing a final resolution of 1 mm and a vector spacing of 0.5mm. A schematic of the setup is presented in Fig. 6. Theemployed finite spatial resolution of the resulting veloc-ity fields may limit the capture of flow structures. Withthe applied multi-pass cross-correlation algorithm, flowstructures with size larger than 1.7 times the window sizeare measured with less than 5 % modulation (Schrijer andScarano 2008). Having a window size of 1 ×1 mm², themagnitude of flow structures down to 1.7 mm can thus be Fig. 6 Top view of the stereo-scopic PIV apparatus. In thedrawing: airfoil NACA64-418in the test section, C1 and C2cameras, laser illumination andseeding generator Quantel Nd:Yag Laser Laser optics Contraction measured within 95 % accuracy. An iterative self-calibra-tion procedure was applied to further improve the fitting ofthe captured planes from the initial location-based calibra-tion, which is based on a known three-dimensional target.The application of the two calibration procedures helps inreducing effects due to lens distortion. A final polynomialfitting used for the mapping of the images is implementedwithin DaVis and iterated on the raw images, yielding adisparity vector of less than 0.08 px after self-calibration,considered satisfactory for stereoscopic cross-correlation(Raffel et al. 2007). The random errors on the averagedfields have been found to vary from less than 0.121 m s-(0.2% of the free-stream value at Re=109) to 0.81 m s-l(1.5 % of the free-stream value at Re =10) in the bound-ary-layer region. The method used to obtain this numbershas been based on the work of Wieneke (2015). Errors onthe root-mean-square values have been found to be rathersmall 0.21 ms-; however, due to the lower magnitude ofsuch quantities the relative uncertainty due to random com-ponent still constitutes about 5-10 % of the measured fluc-tuations in the boundary layer. 3.2.2 Velocity fields in the separated region Oil-flow results have been discussed, showing the formation of a complex 3D flow pattern with the presence ofperiodic structures deforming the conventional flow topol-ogy of a lifting wing. In the present section, a detailed anal-ysis of such flow properties is carried out. The final aim ofthis study is to quantify the effect of the stall-cells in theflow velocity and surface pressure. A detailed analysis ofthe flow velocity and pressure on both the wing surface and outer flow field would require multiple arrays of velocityand pressure transducers, spaced along the span directionwith a resolution of less than 1 cm. Typically, in indus-trial wind-tunnel experiments, airfoils are tested underthe hypothesis of 2D flow, by extruding their profile intoa wing with aspect-ratio larger than 4. The pressure dis-tribution is thus obtained from a single series of pressuretaps inclined with respect to the mid-span line to ensure nointerference between two consecutive sensors. In the pre-sent study, stereoscopic PIV has been employed to meas-ure the airfoil flow velocity in several planes normal to thewing span. The flow pressure is then obtained by integrat-ing the flow pressure gradient, obtained from the Navier-Stokes momentum equation with the PIV velocity as input,in a similar effort as in the work of van Oudheusden et al.(2007). Results have been compared to the ones of pressuretaps in the wing, slanted at an angle of about 15° in orderto avoid flow interference. Results pertaining to differentsteady angles of attack are presented. Cameras and laserhave been installed on a traversing system with 0.2 mmprecision, employed for the acquisition of the stereoscopicPIV measurements in planes normal to the span-wise direc-tion. The traversing system allows minimizing the amountof multiple calibration procedures, always maintaining thesame viewing conditions for all the measured planes. Thespacing between different measurement planes in the span-wise direction has been coherently chosen with the stall-cellperiodicity, following the oil-flow results from Fig. 4. Forthe tested angles of attack, a minimum span range of 10 cmand a maximum of 25 cm has been measured, correspond-ing to minimum and maximum spacing between consecu-tive measurements in of 0.2 and 2 cm. In Fig. 7 contours of normalized flow-velocity magnitude |V|/V。oxsgn(u) arepresented, where |V|=√u²+v2+wand sgn(u) =u/|u|for u/0 ms-l and sgn(u)=0 for u=0 m s-. The flowfields pertaining to the most downstream region of the flow,respectively, at 9°-15° show the pressure recovery regiondeveloping from location x/c = 0.65. Within the in-planeresolution of 1 mm, which includes the moderate effect ofreflections mainly affecting the region at the leading edge, areally small recirculation zone is appreciated at 11° and 15°.The region of interest in the contours of Fig. 7 focuses onthe location of the stall-cell formation, i.e.,the most down-stream location where flow separation occurs. The contours show a periodic non-uniformity along the span whichdevelops in a modulation of the shear-layer thickness. The contours of Fig. 7 show an increase of velocity fluctuationsalong with the amplification of the shear layer. Concurrently with the change in the shear-layer positionand thickness along the span-wise direction, an increase ofthe velocity fluctuations is measured. However, this doesnot correspond to a net increase of the velocity fluctuationsinside the separated region. This is also confirmed by previ-ous studies (Manolesos et al. 2014), where higher values offlow fluctuations are measured at the stall-cell shear layerinstead of at the trailing edge location. The reason for thisseems to be ascribed to a low-frequency oscillatory motionof the stall-cells with higher amplitude than the conven-tional wake shedding determined at the trailing edge ofsuch an airfoil. Once decomposing the flow fluctuations into single velocity components, it can be seen in Fig. 8that vertical and stream-wise fluctuations are dominantwith respect to the out-of-plane components. However, thelower measured out-of-plane fluctuations might be a resultof the stability of such structures in the span-wise direc-tion, which might be justified by the relatively higher wingaspect-ratio and the higher Reynolds number. In Figs. 9 and 10, contours of root-mean-square fluctua-tions are shown as velocity magnitude decomposed alongthe stream-wise, vertical and span-wise directions. Themagnitude of the fluctuations can be directly comparedto the results in Fig.4, where at the stream-wise locationx/c = 0.9, and in correspondence of span-wise locationsof z/c=0.41, 0.55, 0.6, the stall-cells are formed. In cor-respondence of the stall-cell locations, higher fluctuationsin the separated flow are measured. The particular shapeof the high rms region follows the periodicity and the sizeof the stall cells, almost doubling from 9° to 11°. Oncedecomposed into their Cartesian components in Fig. 10,the major contribution to the flow fluctuations is given bythe vertical one. This is coherent with a flapping motionof the shear layer associated with the determination of thevortical structures aligned with the stream-wise direction, confirmed by previous literature works. More moderate isthe span-wise activity with respect to the stream-wise andvertical one. This is confirmed once again in the manuscriptby the results of Fig. 10. A characteristic length can be calculated from the veloc-ity contours by estimating the variation of the shear-layerthickness per span location. At 9° and 11° angle of attack,the oil-flow visualization showed a coherent bucking ofabout z/h=0.1 coherently with the value calculated atthe same span-wise locations of Fig. 7.More complex isthe analysis of the flow field at 15° angle of attack, wherethe span-wise dislocation of the stall-cell extends fur-ther outside the flow field measured by stereoscopic PIV.Although the PIV resolution does not allow to resolve thesmall stall-cell formation in detail, traces of the trailingvorticity can be seen in Fig. 11 for 9°. Two main footprintsin both the shear layer of the separated region and in thetrailing vorticity from the stall-cell counter-rotating vortex-pairs can be seen when plotting the vorticity ωx component.The development of the vortical structures from the stall-cells deforms the vorticity associated with the separatedregion. The shear layer, besides a main rotation in the zdirection (cfr. the high vorticity region in wz), deforms in x Fig. 8 Absolute rms velocity component in the stream-wise, vertical and out-of-plane directions. NACA64-418 at 15°and Re =10° Vrms. 0.6 0 0.5 0.4 -0.05 0.3 0.2 -0.1 0.1 -0.15 0 Fig.9 Contours of magnitude of root-mean-square fluctuations in the span-wise direction. NACA64-418 at 9°,11°,15° and Re =10° Fig. 10 Contours of root-mean-square fluctuations decom-posed in stream-wise, verticaland span-wise contributions.NACA64-418 at 9°,11°,15° andRe=10° Fig.11 Contours of vorticitycomponent along the stream-wise, vertical and span-wisedirections. NACA64-418 at 9°angle of attack, Re=10° (a) (b) Fig. 12 3D normalized velocity contours for 9° and 11° angle of attack, z/h axis expanded by a factor 2 for clarity, NACA64-418, Re=10°.aα=9°,b =11° and y directions with subsequent positive and negative vor-ticity regions corresponding to the bending of the separa-tion line seen in the schema of Fig.3. 3.2.3 3D velocity representation of the wing flow The stall-cell pattern in the NACA64-418 wing determinesan additional modification of the outer flow field, which isstudied in this paragraph by combining the stereoscopicvelocity data into a volumetric visualization in Fig. 12. Inthe visualization, two angles of attack are presented. Theseparated region follows the separation front as alreadyindicated by the oil-flow visualization of Fig. 4 from x/c=0.8 to x/c=0.4 when increasing the angle of attack from 9°to 11°. At the limit of the PIV resolution, the three-dimen-sional deformation of the separated front at the stall-celllocation is not as visible as in the outer region of the wingflow. The 3D visualization for the different angles in Fig. 12is normalized with the u component, in the free-streamdirection. Several surfaces are added at|VI/V。oxsgn(u) toindicate the region of flow acceleration down to the sepa-ration at|V|/V。x sgn(u)=0,visible at about x/c = 0.8for the different cases. The three-dimensionality of theseparation shows a buckling of about Az/h=0.08 slightlysmaller than what already confirmed by Fig. 7 and by theoil-flow visualizations in Fig. 4. The three-dimensional pat-tern in the airfoil flow separation becomes more evidentat higher angle of attack (11°), with the separation regiondeforming from a uniform front at about z/h=0.2. Thepresence of the three-dimensional change of the contourgeometry is additionally evidenced in the most upstreamiso-surfaces, as the ones taken at |VI/Vox sgn(u)> 1.3deformed in correspondence of the mid-span location ofthe three-dimensional structure. It can be anticipated thatthe three-dimensionality of the separation front propagates to the flow at the suction side, as the contours at relativelyhigher velocity magnitude indicate. This demonstrates that,besides the fluctuating component previously discussed,the presence of the stall-cell pattern induces a net changein the mean pressure field on the wing surface. The presenteffect, whether it can be modeled as a relative change ofthe flow angle of attack in the span-wise direction or as alocalized change in flow pressure, will be investigated inthe section dedicated to the quantification of the change inloading with respect to the quasi-2D airfoil performance. 4 Pressure distribution along the wing span In the present section, an attempt is made to quantify thespan-wise variations of the load distribution of the wing. Tothe purpose, the surface pressure as obtained from integra-tion of the experimental velocity is compared to the resultsobtained from direct measurements via pressure taps in thewing model. The time-averaged pressure gradient and theLaplacian of the pressure field have been first computedby employing the Navier-Stokes momentum in the Reyn-olds average form van Oudheusden et al. (2007) with theexperimental velocities as input. Integration of the pres-sure gradient derived from the Navier-Stokes equationshas been carried out by solving the Poisson equation usingthe 3D velocity information with both Neumann and Dir-ichlet (Bernoulli pressure) conditions in the boundaries ofthe domain. Details of the procedure can be found in vanOudheusden et al. (2007), with several applications in low-and high-speed aerodynamics (van Oudheusden 2013). Thepresent methodology allows using the vector field statisticsas input in a similar manner as in Ragni et al. (2012) toobtain the mean surface pressure. If the flow is stationaryin the statistical sense, the scanning stereoscopic PIV setup still allows obtaining the mean pressure field, without theneed of having time-resolved measurements. The procedurehas already been found by the authors to have comparableaccuracy to conventional pressure probes, especially whenthe flow accelerations are moderate (Ragni et al. 2014). 4.1 Distributed pressure orifice results The pressure coefficient distributions in Fig. 13 are theresults of consecutive measurements acquired via a scanni-valve system with 52 pressure probes distributed alonga line inclined of about 15°with respect to the chord. Theinclination with respect to the mid-span location is meant to avoid flow interference between two consecutive orificesin the measurements of the surface pressure. The surfacepressure coefficients are obtained in red for the airfoil topsurface and in black for the bottom one. The lines show thetypical flow behavior for a laminar airfoil. The camberedshape determines an asymmetrical pressure distribution at0° angle of attack with the presence of a laminar separa-tion bubble at the top surface, as shown from the abruptchange in curvature in the pressure coefficient at the suc-tion side at about x/c=0.5. At positive pitch, a pressurecoefficient peak on the suction side starts developing from8° angle of attack, reaching his maximum cp=-5.88 at 20°angle of attack. The NACA64-418 airfoil separation can Fig. 13 Pressure coefficient distributions as obtained from 52 pres-sure taps distributed along the airfoil, at stream-wise locations indi-cated in Fig. 1; no interference ensured by inclination of the taps linealong the span-wise direction of 15°. Red top surface pressure distri- bution, black bottom surface pressure distribution.Averaged resultsobtained from a scanni-valve system acquiring about 360 samples in3 min PIV surface c [-],a=9 PlV surface c[-], α=11 PIV surface c [-],a=15 0.1 0.3 x"0.5 0.7 -0.2 -0.6 -1 -1.4 -1.8 -2.2 0.33 0.37 0.48 0.1 0.15 0.09 0.3 0.03 0 ×"0.5 -0.03 0.7 -0.09 -0.15 0.33 0.37 0.48 Fig. 14 Contours of surface pressure coefficient and spatial fluctuations as derived from PIV-based pressure evaluation on the suction side ofthe wing. Columns are organized per angle of attack. Data pertaining to the NACA64-418 wing,9°,11°,15°, Re= 10° be already seen at 8° pitch on the suction side. At the sameangle, a change in curvature is also evident at about x/c =0.4 just before the incipient separation. It has to be notedthat this change in curvature on the suction side is persis-tent till 20°, angle at which the flow fully separates on thetop surface. Although exactly in the range of the stall-cellsdevelopment, it is difficult to ascribe the particular changein performance to the stall-cell pattern, especially whenconsidering the chord-wise distribution of the pressureorifices slanted with respect to the middle span. It is a factthat when comparing 4°,8° and 20° at chord locations of x/cbetween 0.10 and 0.50, a different mechanism of flow sepa-ration is seen. The separation front moves upstream fromthe trailing edge till 24°, first point where the flow is fullydetached on the top surface. 4.2 Span-wise pressure coefficient distributions In the present section, the single distribution of the meanflow pressure as obtained from the pressure taps has been compared to the surface data obtained from the PIV veloc-ity fields in Fig. 14. The data shown in Figs. 7 and 12 areused as input in the pressure integration methodology fromstereoscopic PIV, in order to quantify the span-wise vari-ation in the airfoil loading with respect to the mean one.The comparison is mainly focused in the pressure recoveryregion, where accelerations are moderate and the effect ofthe three-dimensional stall-cell structure is more visible.In this region, the uncertainty on the pressure coefficientderived from PIV is comparable to the one of the pres-sure orifices, and the technique is able to discern pressurecoefficient variations with an uncertainty of about 0.02.Figure 14 shows the pressure data at the surface as derivedfrom PIV for the tested angles of attack. The change inpressure due to the presence of the stall-cell on the meanfield is a fraction of the overall pressure distribution on theairfoil wing. Therefore, in the second row of Fig. 14 thespan-wise average component of the pressure coefficient,that is the average along the span direction of the pressurecoefficient at the same chord-wise locations per PIV plane, c,α=15:z/h=0.38 x/c x/c PIVc', a=9 PIVc',a=15 Fig. 15 Surface pressure coefficient and spatial fluctuations asderived from PIV-based pressure evaluation on the suction side of thewing. Lines and arrow-plots obtained for three angles of attack and is subtracted to the surface distribution of the pressurecoefficient profiles. Once removing such a component, itcan be seen from the span-wise variation of the cp distribu-tion that the stall-cell pattern induces a periodical changein the loading along the span-wise direction. Contours ofthe pressure coefficient within the PIV span-wise locationsfrom Fig. 14 show maxima ofc, of about 0.1-0.2, mainlylocalized just after the beginning of the separation zone. The pressure distributions are additionally visualizedin Fig. 15 as arrows of length equal to the magnitude ofthe local pressure coefficients. Each arrows unit length isnormalized in the x/c, y/c axis with respect to 0.1× cp andthe locations are chosen, respectively, from Fig. 14. Whencomparing the PIV-based surface cp to the orifice ones, itcan be seen that, besides a general agreement, small fluc-tuations along the span are seen at the stall-cell locations.In summary, the comparison suggests that the mean effectof the stall-cells in the flow pressure field is of the order ofa change in curvature of the airfoil profile at the particularsection. The graphs allow localizing the change of pres-sure coefficient into a region where the change in Cp seemsto follow a single-peak distribution, bounded between thepressure peak and the incipient separation. Although thisevidence is not addressed in literature, more focused onthe treatment of the temporal pressure fluctuations insteadof the spatial ones, the present small fluctuations might beimportant when considering flow control, since associatedwith a particular flow structure acting at the wing separa-tion. It can also be noted that the highest span-wise change Table 1 Integration of c, variations of Fig. 14 into Newton force inpercentage of total wing lift/drag Lift N Drag N Mean F Rms. F Rms. F (%Lift) (% Lift) (%Drag) 9 752.5 19.2 0.1 1.1 45.5 11 795.9 33.5 0.9 6.4 127.5 15 824.5 71.2 0.1 2.9 27.7 Estimation carried out with distribution of the pressure side as fromFig. 13. As expected, the mean force on the wing ascribed to spatialpressure coefficient variations is almost negligible compared to thespatial rms values in pressure coefficient is given by a lower angle of attackthan the one of the maximum pressure coefficient, pre-cisely the one where the corresponding oil-flow measure-ments present a sharper recirculation zone. In this respect,in Table 1 an attempt is made to convert the surface span-wise change in the pressure coefficient into fluid force.Integration of the pressure coefficient with normalizationper measured area, an overall rms change of lift coefficientof about Acj=1%;6%; 3 % is computed with respectto the lift of the airfoil at the prescribed angles of 9°, 11°and 15°. Although this corresponds to a negligible changewith respect to the total lift of the wing (quantified by inte-grating positive and negative changes into the mean forceon the wing), local non-uniformities are rather larger andcomparable to the drag values. It has to be reminded thatthis effect is already present in the mean pressure field, on which the fluctuating component due to the oscillatorymotion of the stall-cells has to be superimposed. 5 Conclusions The effect of stall-cells on the mean flow velocities andpressure of a NACA64-418 has been investigated. Flowvisualization at Reynolds Re =10 showed the presenceof a pattern of stall-cells which develops from 9° up to 20°angle of attack. The size and the shape of such structureshave been found in agreement with previous literature,with a stall-cell inner-size growing up to 0.2c. Footprintsof the presence of a small leading-edge separation bubblehave been measured in pressure orifices data. However, itseffect does not seem to influence the stall-cell developmentuntil the full separation at the suction side is reached. Aninvestigation carried out by employing a multi-plane stere-oscopic PIV setup showed the presence of a span-wise non-uniformity in the separation front of the wing, with maximaof root-mean-square velocity fluctuations still localized incorrespondence of the shear-layer profile. Analysis of thesingle velocity and vorticity components show vortical fea-tures aligned with the stream-wise direction,deforming theshear-layer profile in both vertical and span-wise directions.This is also confirmed by the stronger contribution of thevertical and stream-wise fluctuations when compared to thespan-wise ones. This particular fact suggests that the shed-ding of the separation front is decoupled from its breaking,forming the stall-cells pattern. Stacking of the different ste-reoscopic velocity fields pertaining to different span-wiselocations shows that the influence of the pattern is extendedto outer regions upstream the wing separation, as well asdetermining a periodic change in the whole wing velocityand pressure field. Integration of the PIV velocity fieldsinto pressure shows a net modulation effect in the spanwise direction which localized in a vast region between themaximum suction peak and the beginning of the separationfront, with maximum variations of about 0.15 dictated bythe strength of the vortical structures at the stall-cell loca-tion, and not by the local pressure peak of the wing. Whilethis effect is clearly visible in the span-wise distribution ofthe surface pressurecoefficient, the final effect on the pres-sure orifices is similar to a local change in the airfoil cur-vature. This effect is already measured on the mean pres-sure field, and it might have important repercussions on theflow separation zone, where the pressure fluctuations aremainly located. The pressure coefficient variations alongthe wing span mainly distribute along the pressure recoveryzone of the airfoil profile. Integration of such distributionalong the full span has been attempted, conveying maxi-mum rms fluctuations with respect to the mean lift coef-ficient of about 2-6 %. Future work is dedicated to further characterize the time characteristics and the stability ofthe stall-cells in function of the pressure field regeneratedalong the wing. Open Access This article is distributed under the terms of the Crea-tive Commons Attribution 4.0 International License (http://crea-tivecommons.org/licenses/by/4.0/), which permits unrestricted use,distribution, and reproduction in any medium, provided you giveappropriate credit to the original author(s) and the source, provide alink to the Creative Commons license, and indicate if changes weremade. References Bippes H, Smith FT, Brown SN (1987) Experimental investigationof topological structures in three-dimensional separated flow.Bound Layer Sep. Springer, Berlin Boiko AV, Dovgal AV, Zanin BY, Kozlov VV (1996) Three-dimen-sional structure of separated flows on wings. Thermophys Aero-mech 3(1):1-13 Braslow A, Knox E (1958) Simplified method for determination ofcritical height of distributed roughness particles for boundary-layer transition at Mach numbers from 0 to 5, Naca technical note ( Broeren A, Bragg M A (2001) S p anwise variation o f t he unsteadystalling flowfields of two-dimensional a i rfoil models. A I AA J39(9):1641-1651 ) Burton T, Sharpe D, Jenkins N, Bossanyi E (2001) Wind energy hand-book. Wiley, New York Carta FO (1975) Chordwise propagation of dynamic stall cells on anoscillating airfoil. AIAA Pap 25:1-9 Clancy LJ (1975) Aerodynamics. Pitman Publishing Limited, Long AcreCrimi P, Reeves BL (1976) Analysis of leading-edge separation bub-bles on airfoils. AIAAJ 14(11):1548-1555 ( Crow S C (1 9 70) Stability theory for a pair of trailing vortices. AIAA J8(12):2172-2179 ) ( Disotell KJ, Gregory JW (2015) Ti m e-resolved measurement of c e l- l ular separation of a stalling airfoil. I n : Proceedings of the AIAASciTech 5-9 January, A IAA, K i ssimmee, Florida ) ( Gregory N, Quincey V,O'Reilly C, H a ll D ( 1 9 71) Progress report on observations of three-dimensional flow patterns obtained during stall development on aerofoils, and on the problem of measuringtwo-dimensional characteristics, Br i tish a. r .c.c.p ) ( Hu H, Zifeng Y (2008) An experimental s t udy of the l aminar f lowseparation on a l ow-Reynolds-number airfoil. J Fluids Eng130:051101 ) ( Kozlov VV,Zverkov ID, Z anin B Y, D ovgal A V, Rudyak VY, Bord E G, Kranchev DF (2006) Ex p erimenta and theoretical investiga-tion of boundary layer perturbations on a low-aspect-ratio wing.Themophys Aeromech 13(4):507-514 ) ( Manolesos M, P a padakis G, Voutsinas S (2 0 14) Ex p erimental an d c omputational a n alysis o f stall c ells o n rectangular w i ngs. J Wind Energy 17(6):939-955 ) ( N oca F, S hiels S, Jeon D (1999) A comparison of methods for evalu-ating time-dependent f l uid dynamic forces on bodies, using onlyvelocity fields and their derivatives. J Fluids Struct 13:551-578 ) ( Ottavio JD, Watson K , Cormey J, K omerath N (2008) Discrete struc-tures in the radial flow over a rotor blade i n d ynamic stall. I n: Proceedings of the 26th AIAA applied a e rodynamics conference 18-21August, AIAA, Honolulu, Hawaii ) ( Raffel M, W illert CE, W ereley ST, Kompenhans J (2007) Particleimage velocimetry-a pra c tical guide. Springer, Berlin ) Ragni D, van Oudheusden BW, Scarano F (2012) 3D pressure imag-ing of an aircraft propeller blade-tip flow by phase-locked stereo-scopic PIV. Exp Fluids 52(2):463-477 Ragni D, Ferreira CS, Correale G (2014) Experimental investigationof an optimized airfoil for vertical-axis wind turbines. J WindEnergy 18(9):1629-1643 Rodriguez D, Theofilis V (2010) On the birth of stall cells on airfoils.Theor Comput Fluid Dyn 25(105):1-4 Schewe G (2001) Reynolds-number effects in flow around more-or-less bluff bodies.J Wind Eng Ind Aerodyn 89(14-15):1267-1289 Schrijer FFJ, Scarano F (2008) Effect of predictor-corrector filteringon the stability and spatial resolution of iterative PIV interroga-tion. Exp Fluid 45(5):927-941 Selig MS, Deters RW, Williamson GA (2011) Wind tunnel testing air-foils at low Reynolds numbers. In: Proceedings of the 49th aero-space sciences meeting 4-7 January, AIAA, Orlando, FL Selig MS, Guglielmo JJ, Broeren AP, Gigure P (1995) Summary oflow-speed airfoil data. SoarTech, Virginia Beach Selle J (1999) Study on the effectiveness of turbulator tape on bound-ary-layer transition. Technical report, University of California atDavis Taira K, Colonius T (2001) Three-dimensional flows around low-aspect-ratio flat-plate wings at low Reynolds numbers. J FluidMech 623:187-207 ( van Oudheusden BW, Scarano F, Roosenboom EWM, Casimiri EWF,Souverein L J ( 2 007) Ev a luation of integral fo r ces an d pressurefields from planar velocimetry data f or incompressible and com- p ressible flows. Exp Fluids 43(2):153-162 ) van Oudheusden BW (2013) PIV-based pressure measurement. MeasSci Technol 24(3):032001. doi:10.1088/0957-0233/24/3/032001 Weihs D, Katz J (1983) Cellular patterns in poststall flow overunswept wings.AIAA J21(12):1757-1759 Westerweel J (1997) Fundamentals of digital particle image veloci-metry. Meas Sci Technol 8:1379-1392 ( Wieneke B (2 0 15) PIV unc e rtainty quantification fro m correlation s tatistics . Meas Sci Technol 26(7):074002 ) Winkelmann AE (1983) On the occurrence of mushroom shaped stallcells in separated flow. AIAA paper 1734 Winkelmann AE (1990) Flow field studies behind a wing at lowReynolds number. AIAA paper 1471 Winkelmann AE, Barlow J (1980) Flow field model for a rectangularplanform wing beyond stall. AIAA J 18(8):1006-1008 Yon SA, Katz J (1998) Study of the unsteady flow features on astalled wing. AIAAJ36(3):305-312 Yon SA, Katz J (1998) Cellular structures in the flow over the flap ofa two-element wing. J Aircr 35(2):230-232 ( Zarutskaya T, Arieli R (2005) On vo r tical flows st r uctures a t w i ngstall and beyond. AIAA paper no.4913 ) Springer A 3D stall-cell flow-field has been studied ina 4.8 aspect-ratio wing obtained by linear extrusion of alaminar NACA64-418 airfoil profile. The span-wise changein the velocity and pressure distribution along the wing hasbeen quantified with respect to the development of cellularstructures from 8◦ to 20◦ angle of attack. Oil-flow visualizationshelp localizing the regular cellular pattern in functionof the angle of attack. Multi-plane stereoscopic PIVmeasurements obtained by traversing the entire setup alongthe wing span show that the flow separation is not spanwiseuniform. The combination of different stereoscopicfields into a 3D volume of velocity data allows studying theglobal effect of the stall-cell pattern on the wing flow. Integrationof the experimentally computed pressure gradientfrom the Navier–Stokes equation is employed to computethe span-wise distribution of the mean surface pressure.Comparison of the results with the ones obtained frompressure taps installed in the wing evidences a span-wiseperiodic loading on the wing. The periodic loading hasmaxima confined in the stream-wise direction between thelocation of the highest airfoil curvature and the one of theairfoil flow separation. Estimation of the periodic loading isfound within 2–6 % of the sectional wing lift.
确定

还剩17页未读,是否继续阅读?

产品配置单


北京欧兰科技发展有限公司为您提供《NACA64-418翼型中3维失速团对层流NACA64-418翼型压力分布的影响检测方案(粒子图像测速)》,该方案主要用于其他中3维失速团对层流NACA64-418翼型压力分布的影响检测,参考标准--,《NACA64-418翼型中3维失速团对层流NACA64-418翼型压力分布的影响检测方案(粒子图像测速)》用到的仪器有德国LaVision PIV/PLIF粒子成像测速场仪、Imager LX PIV相机、PLIF平面激光诱导荧光火焰燃烧检测系统
推荐专场


CCD相机/影像CCD
更多


相关方案
更多
该厂商其他方案
更多