


方案详情
文
采用LaVision公司的时间分辨粒子成像测速系统,对水模拟发动机模型中流场的涡流和滚流两种流动形态进行了测量和研究。
方案详情

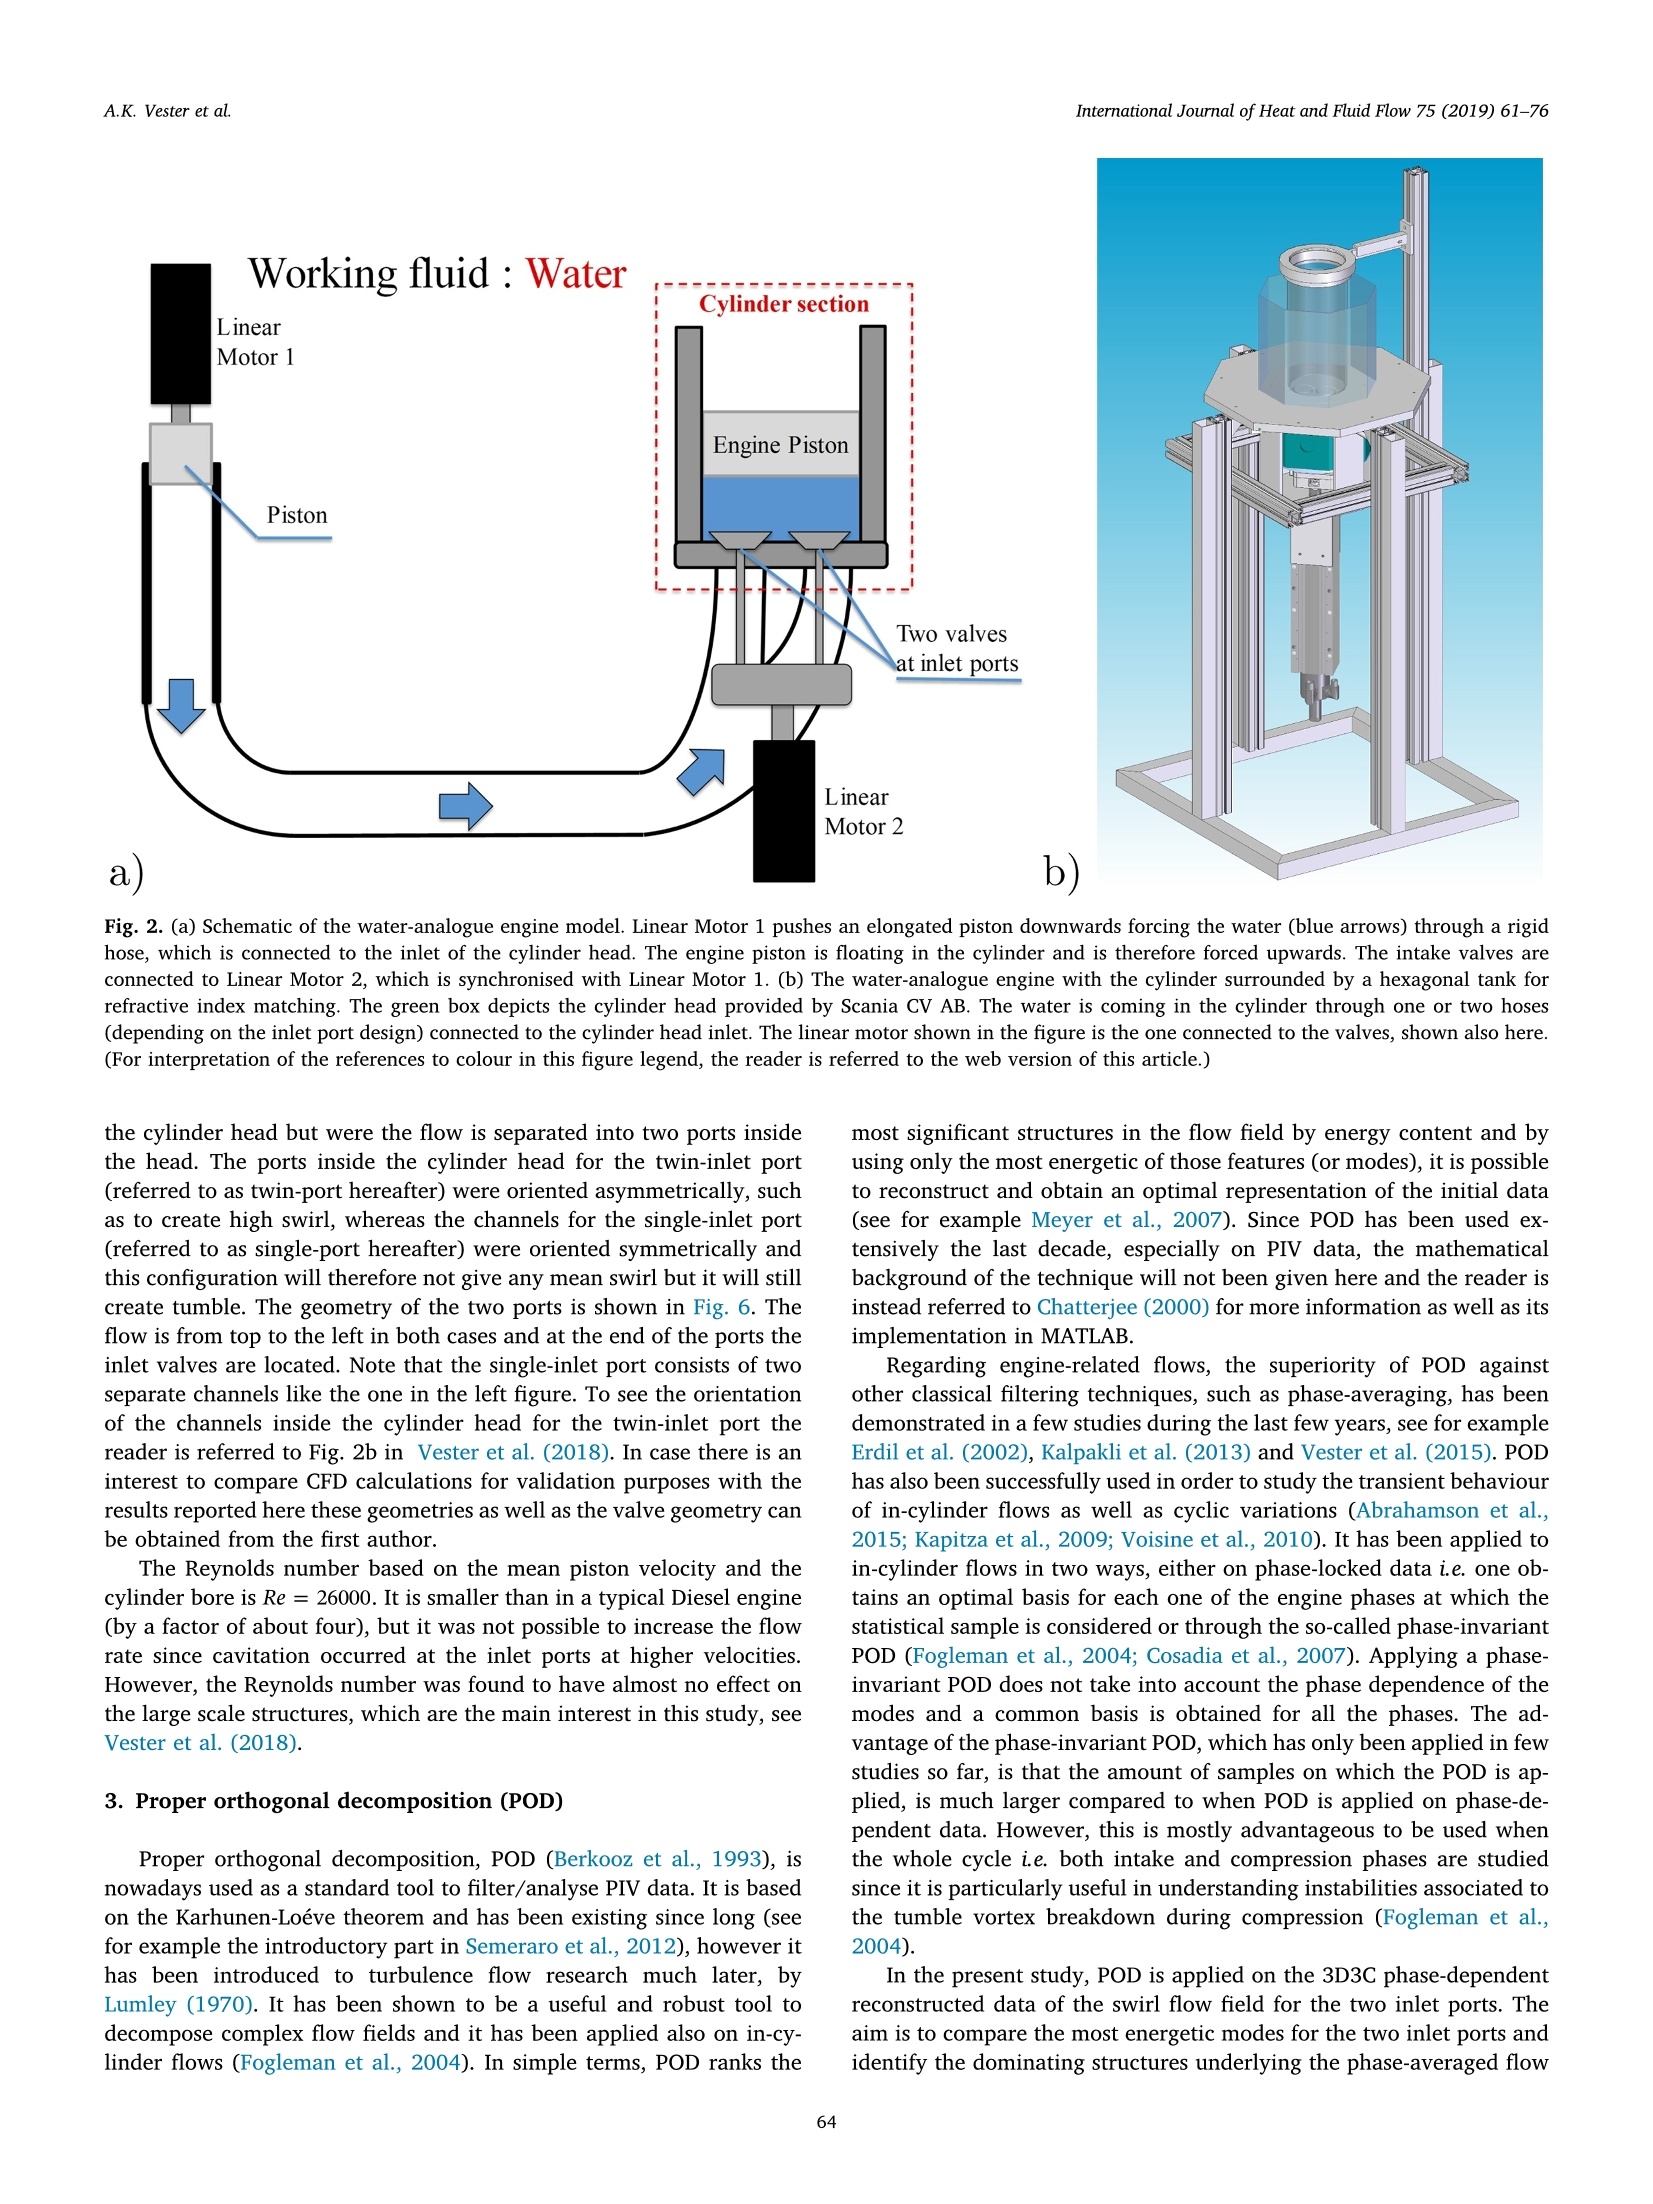
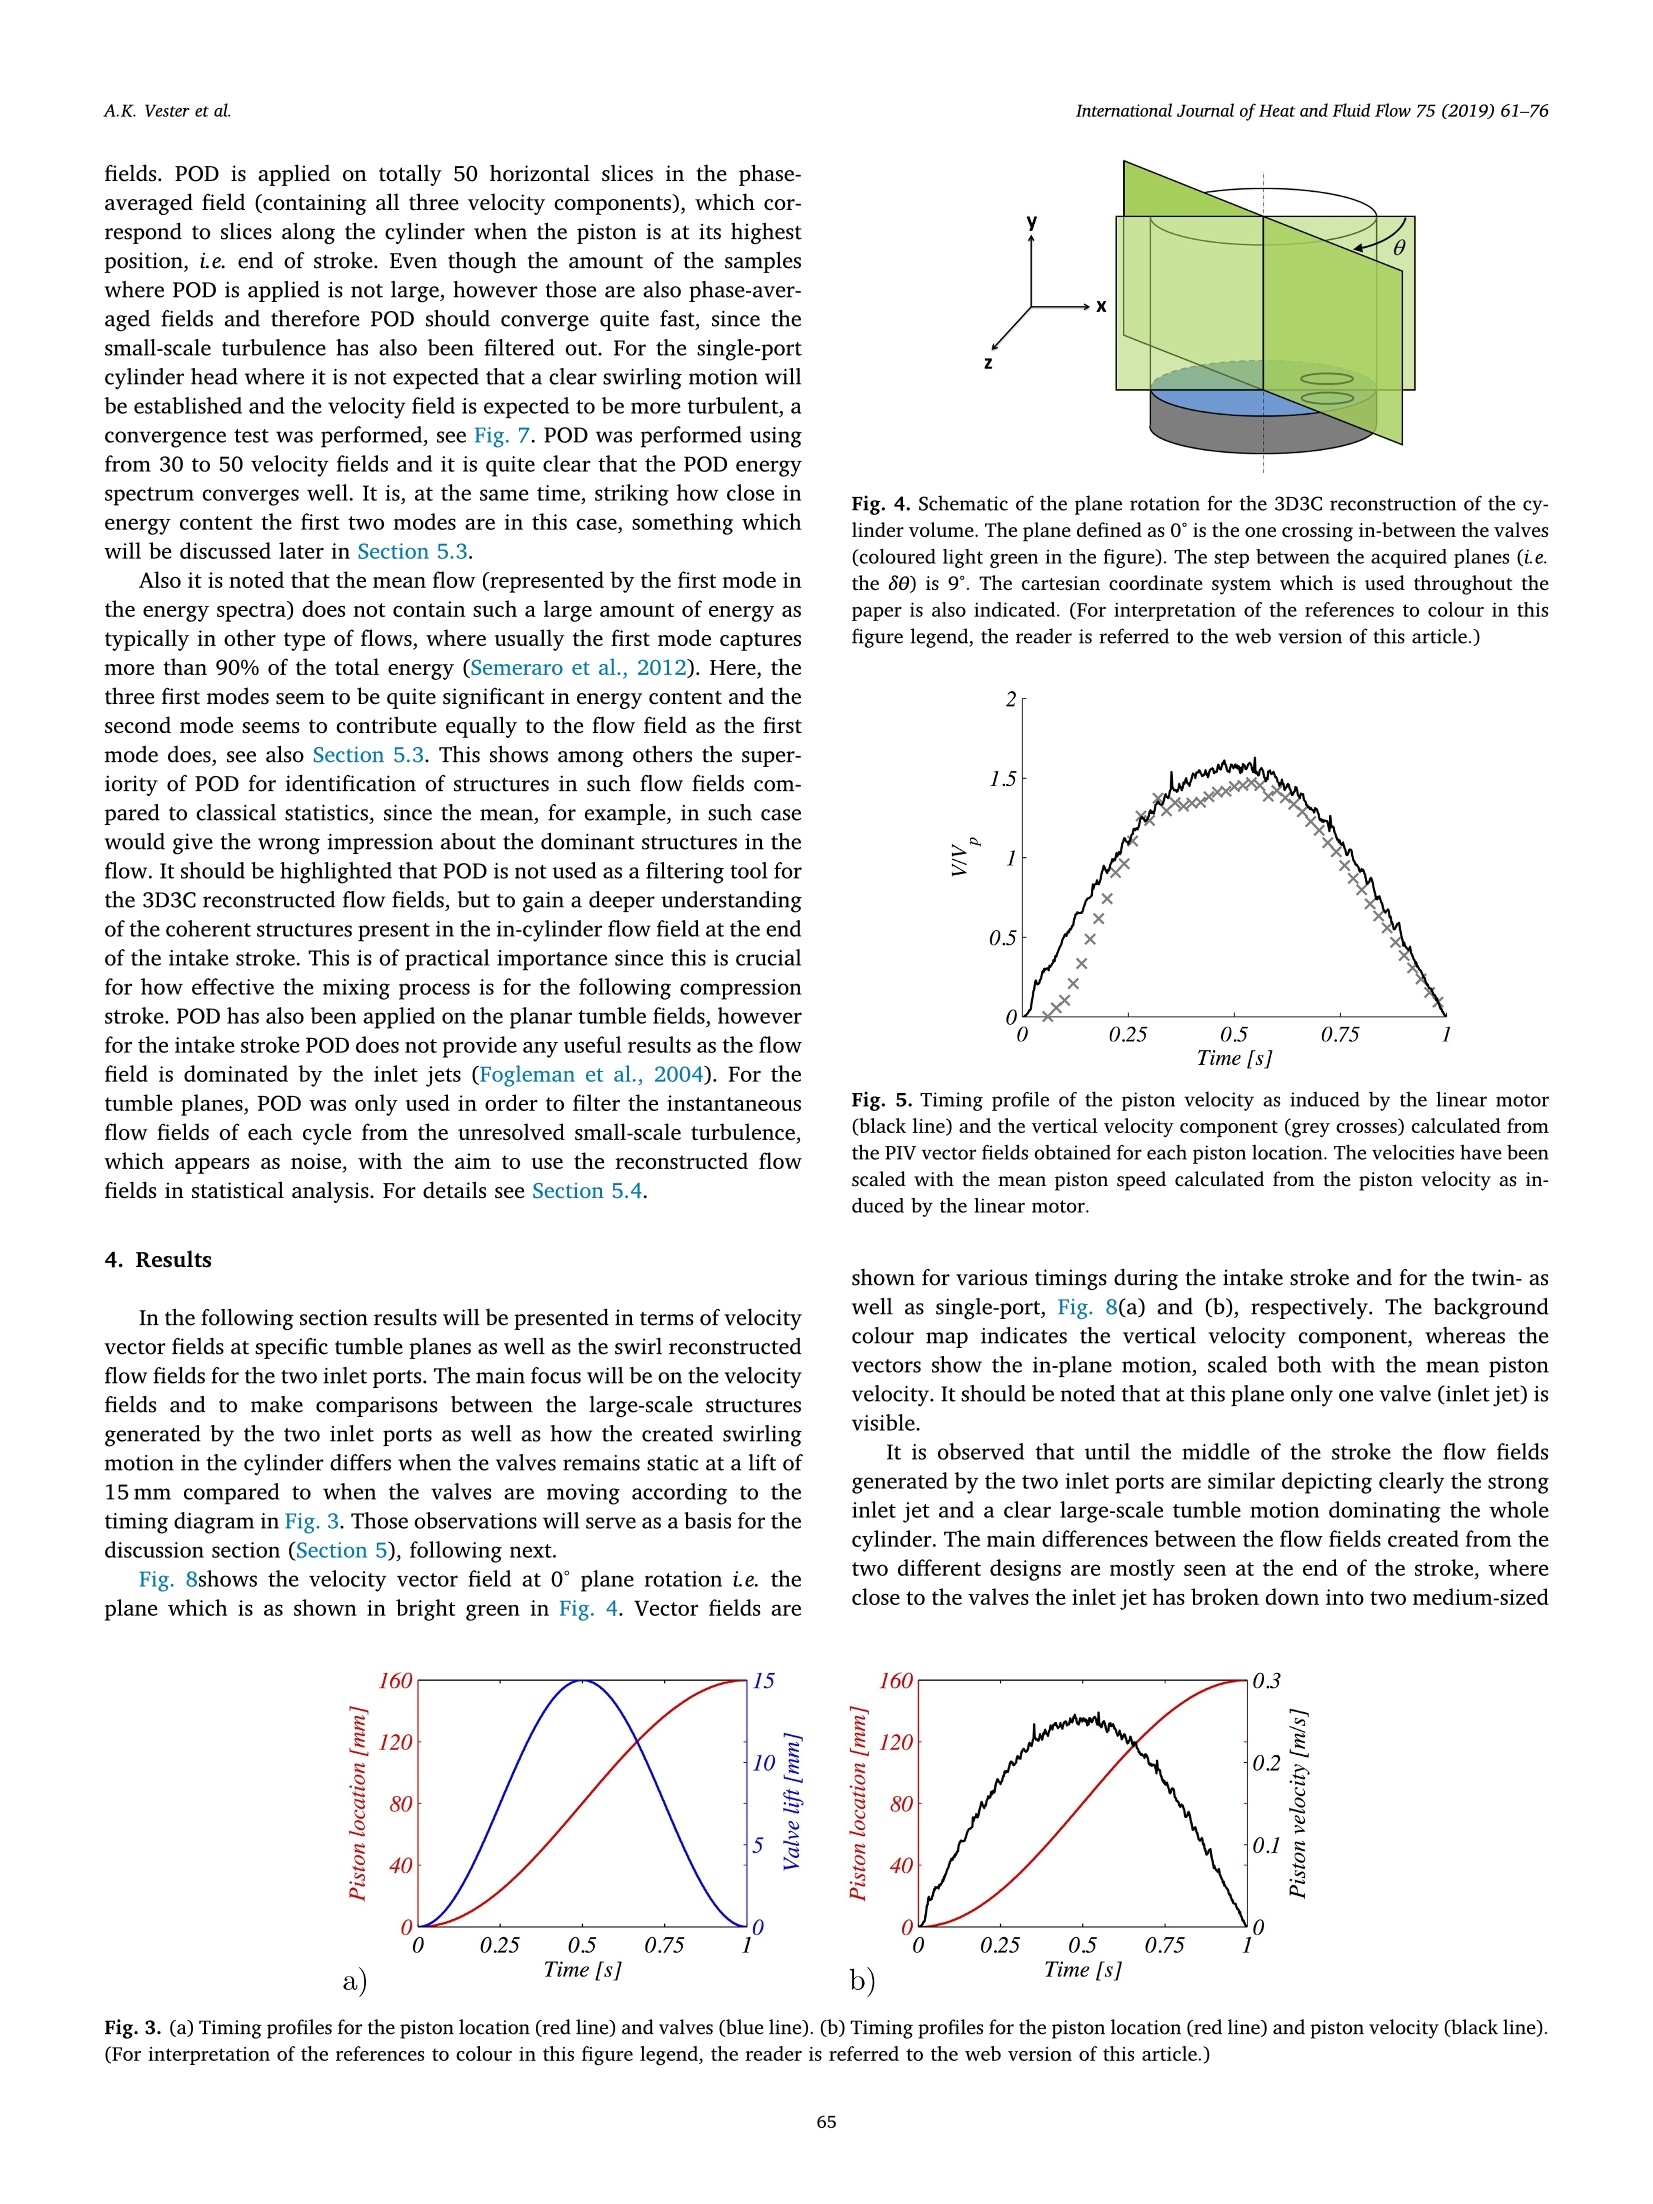
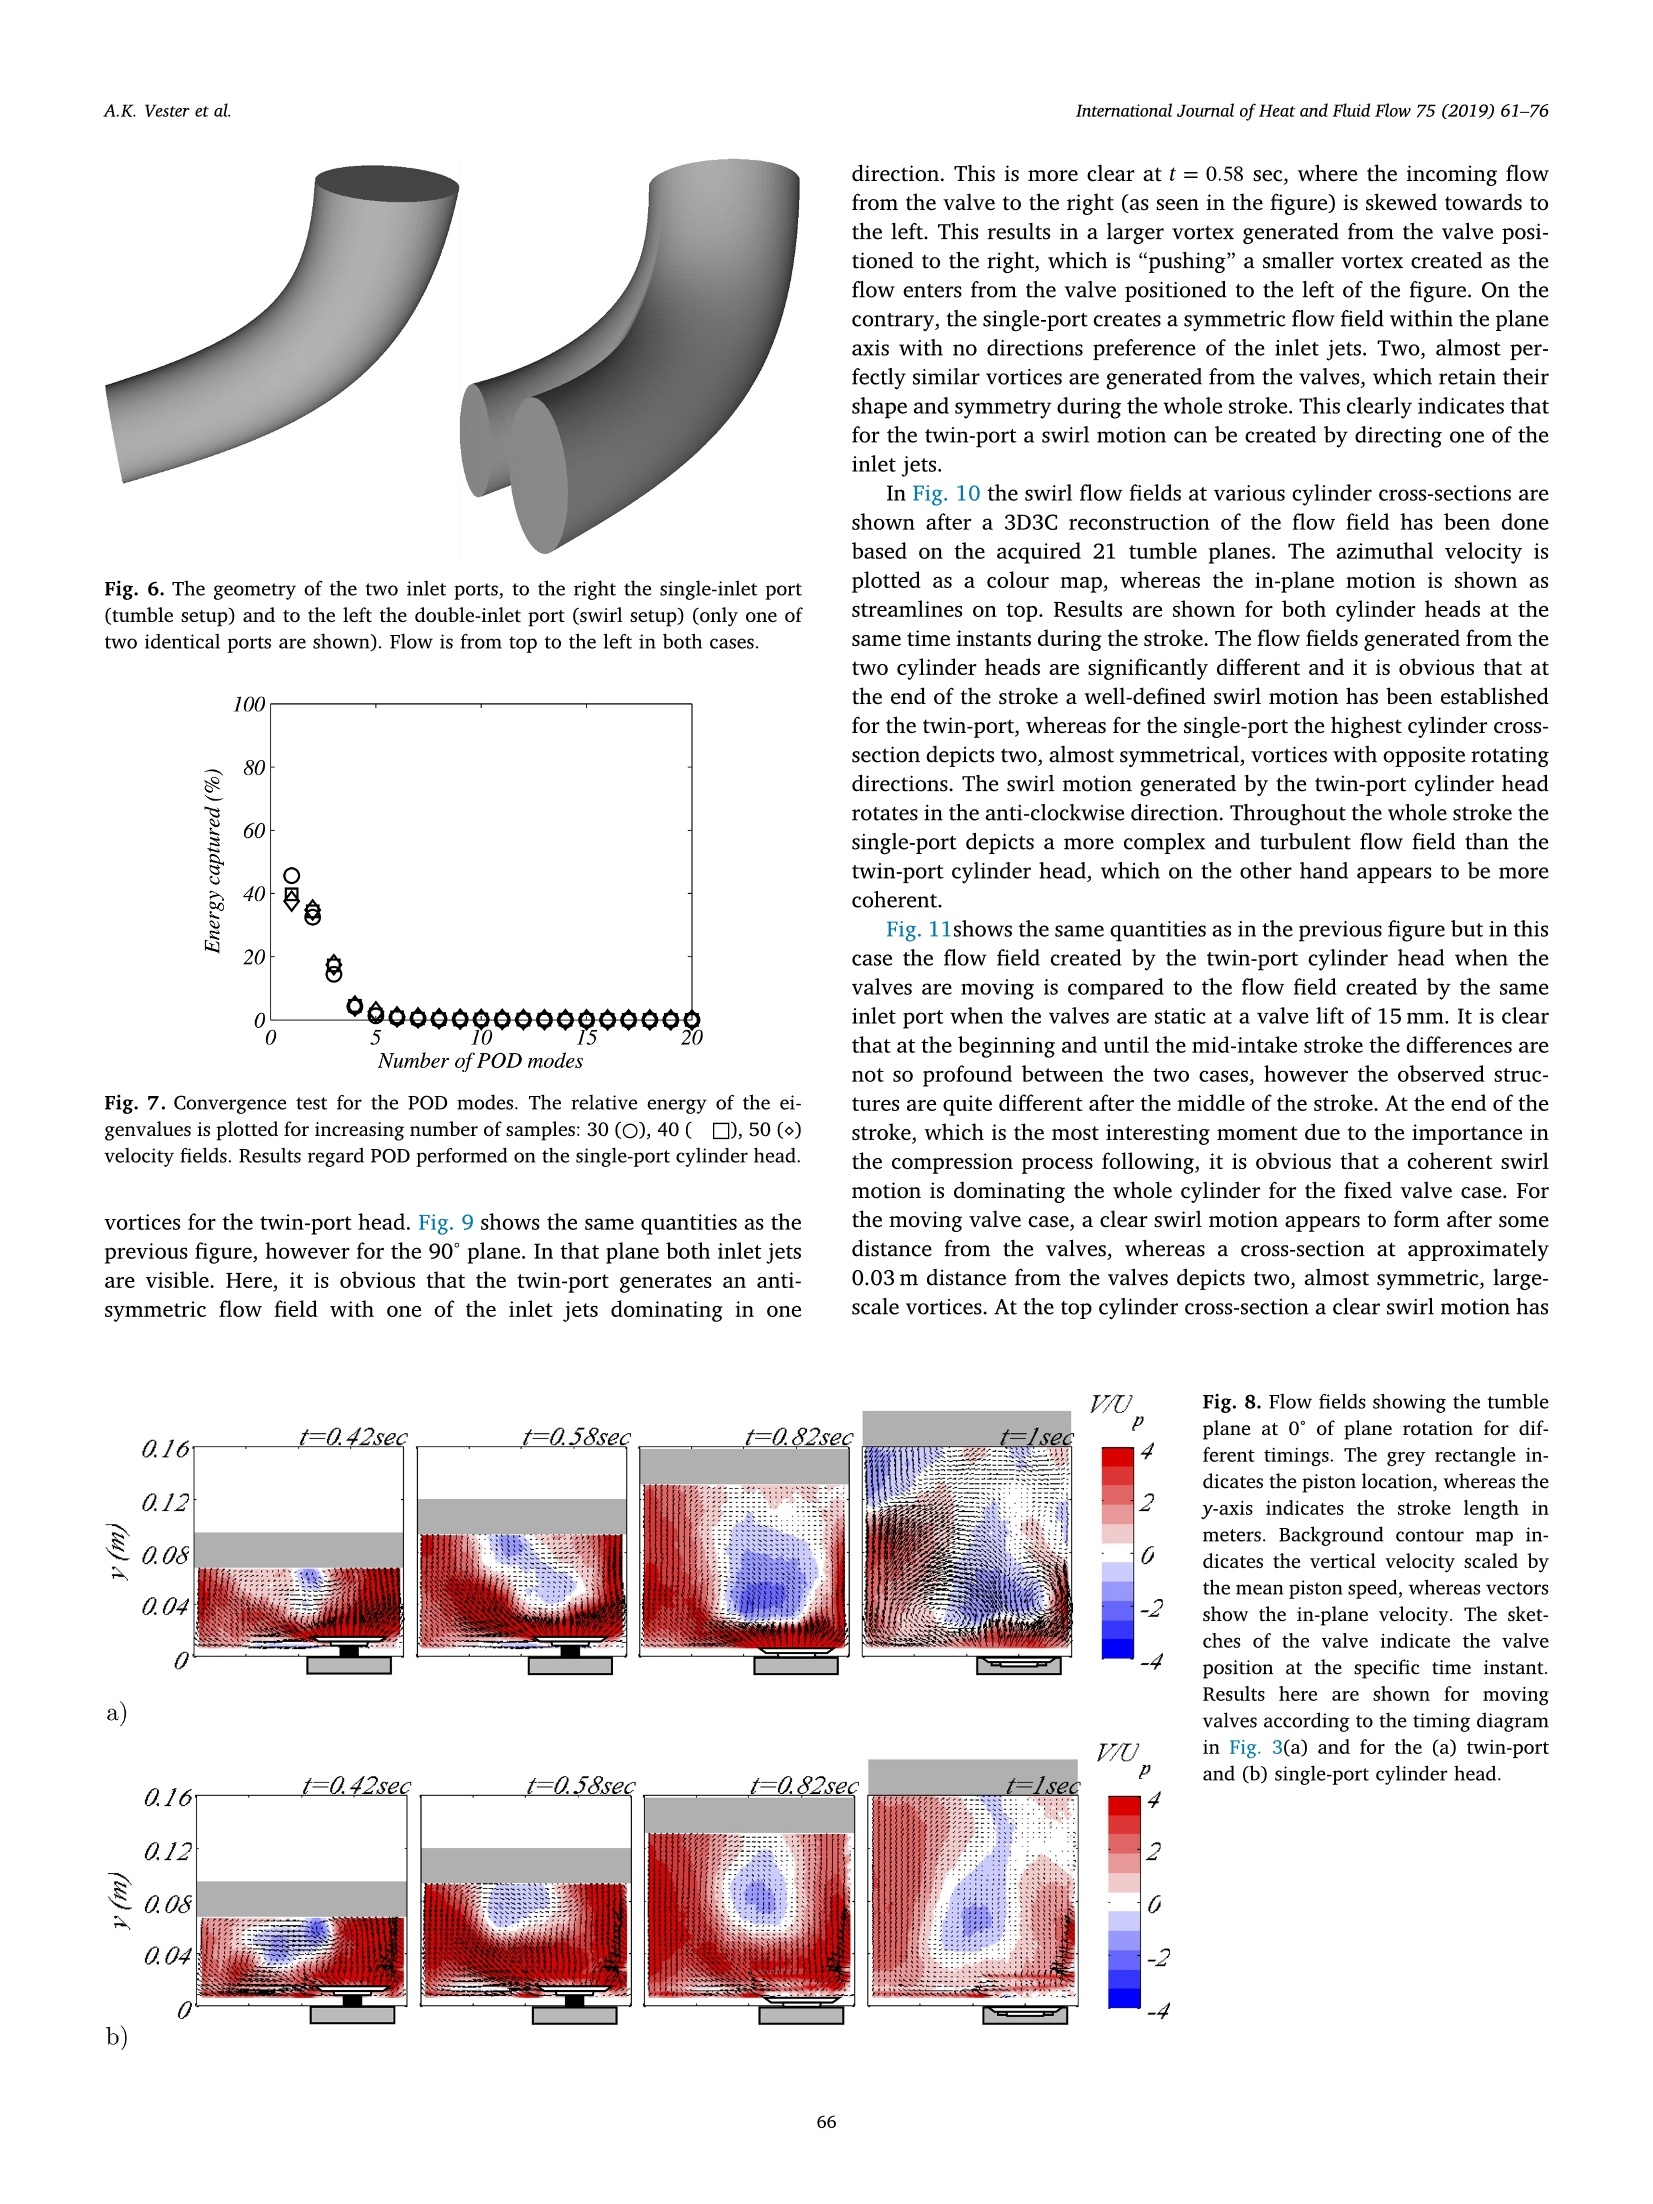
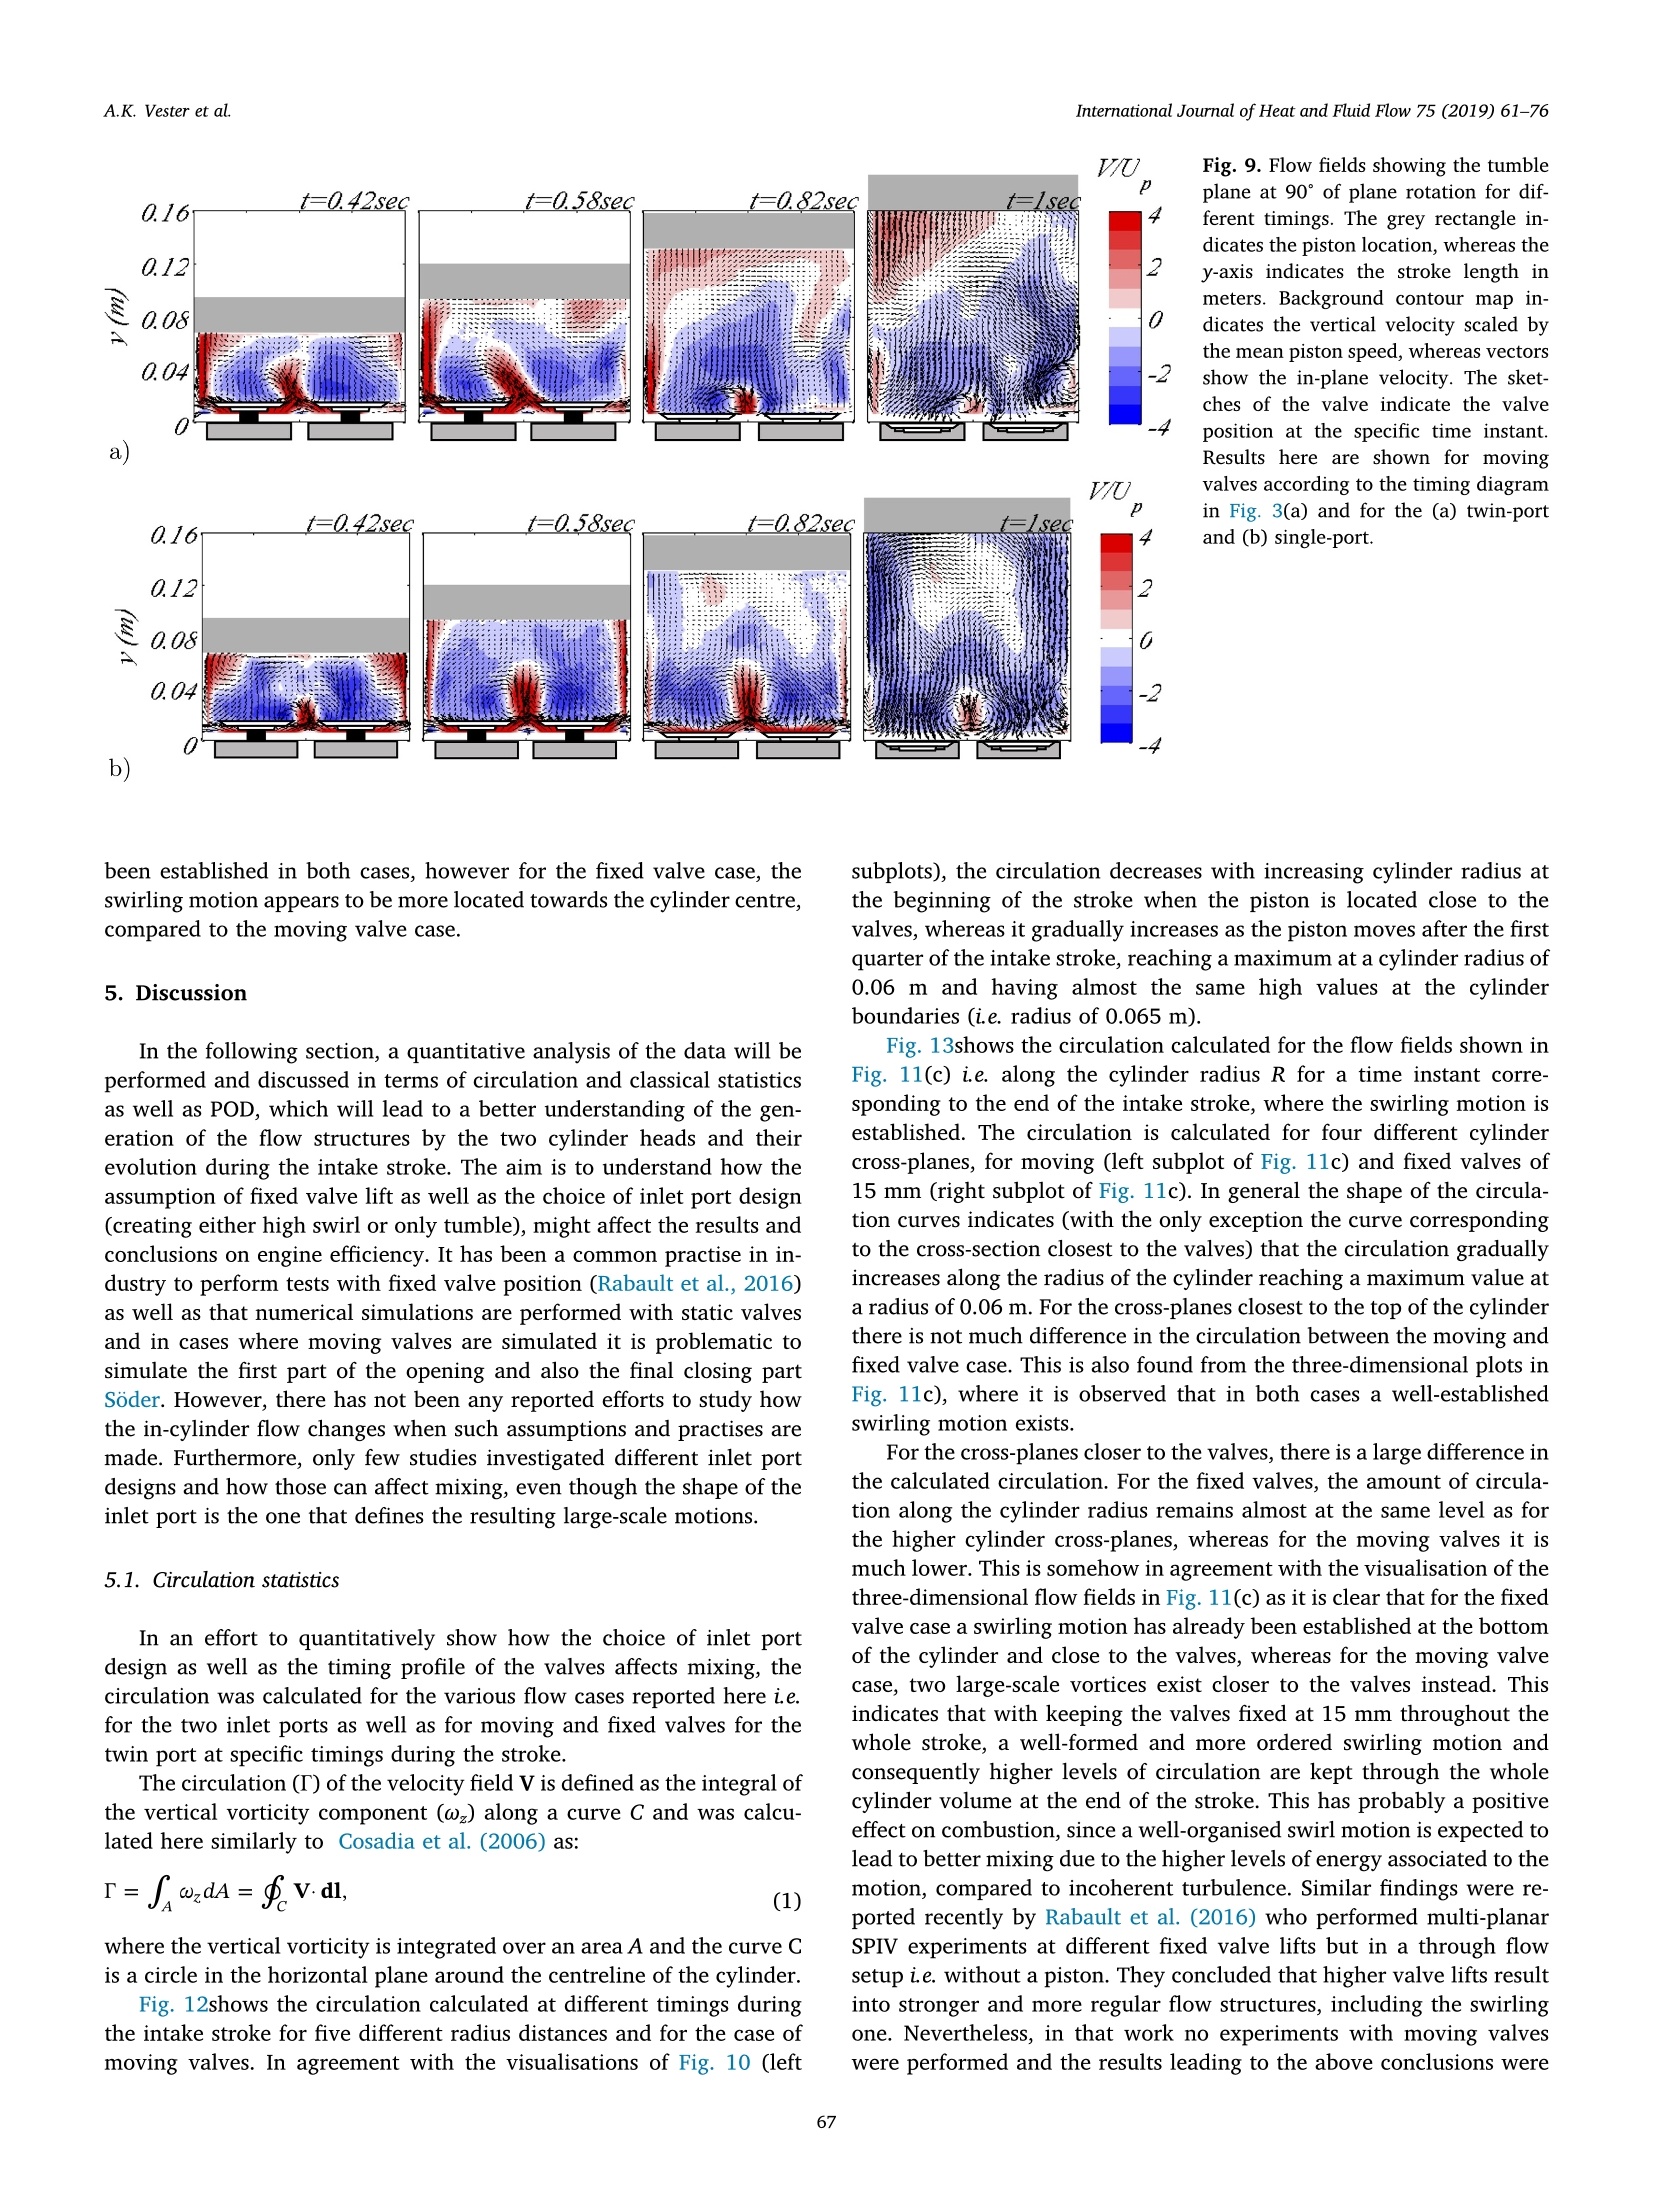
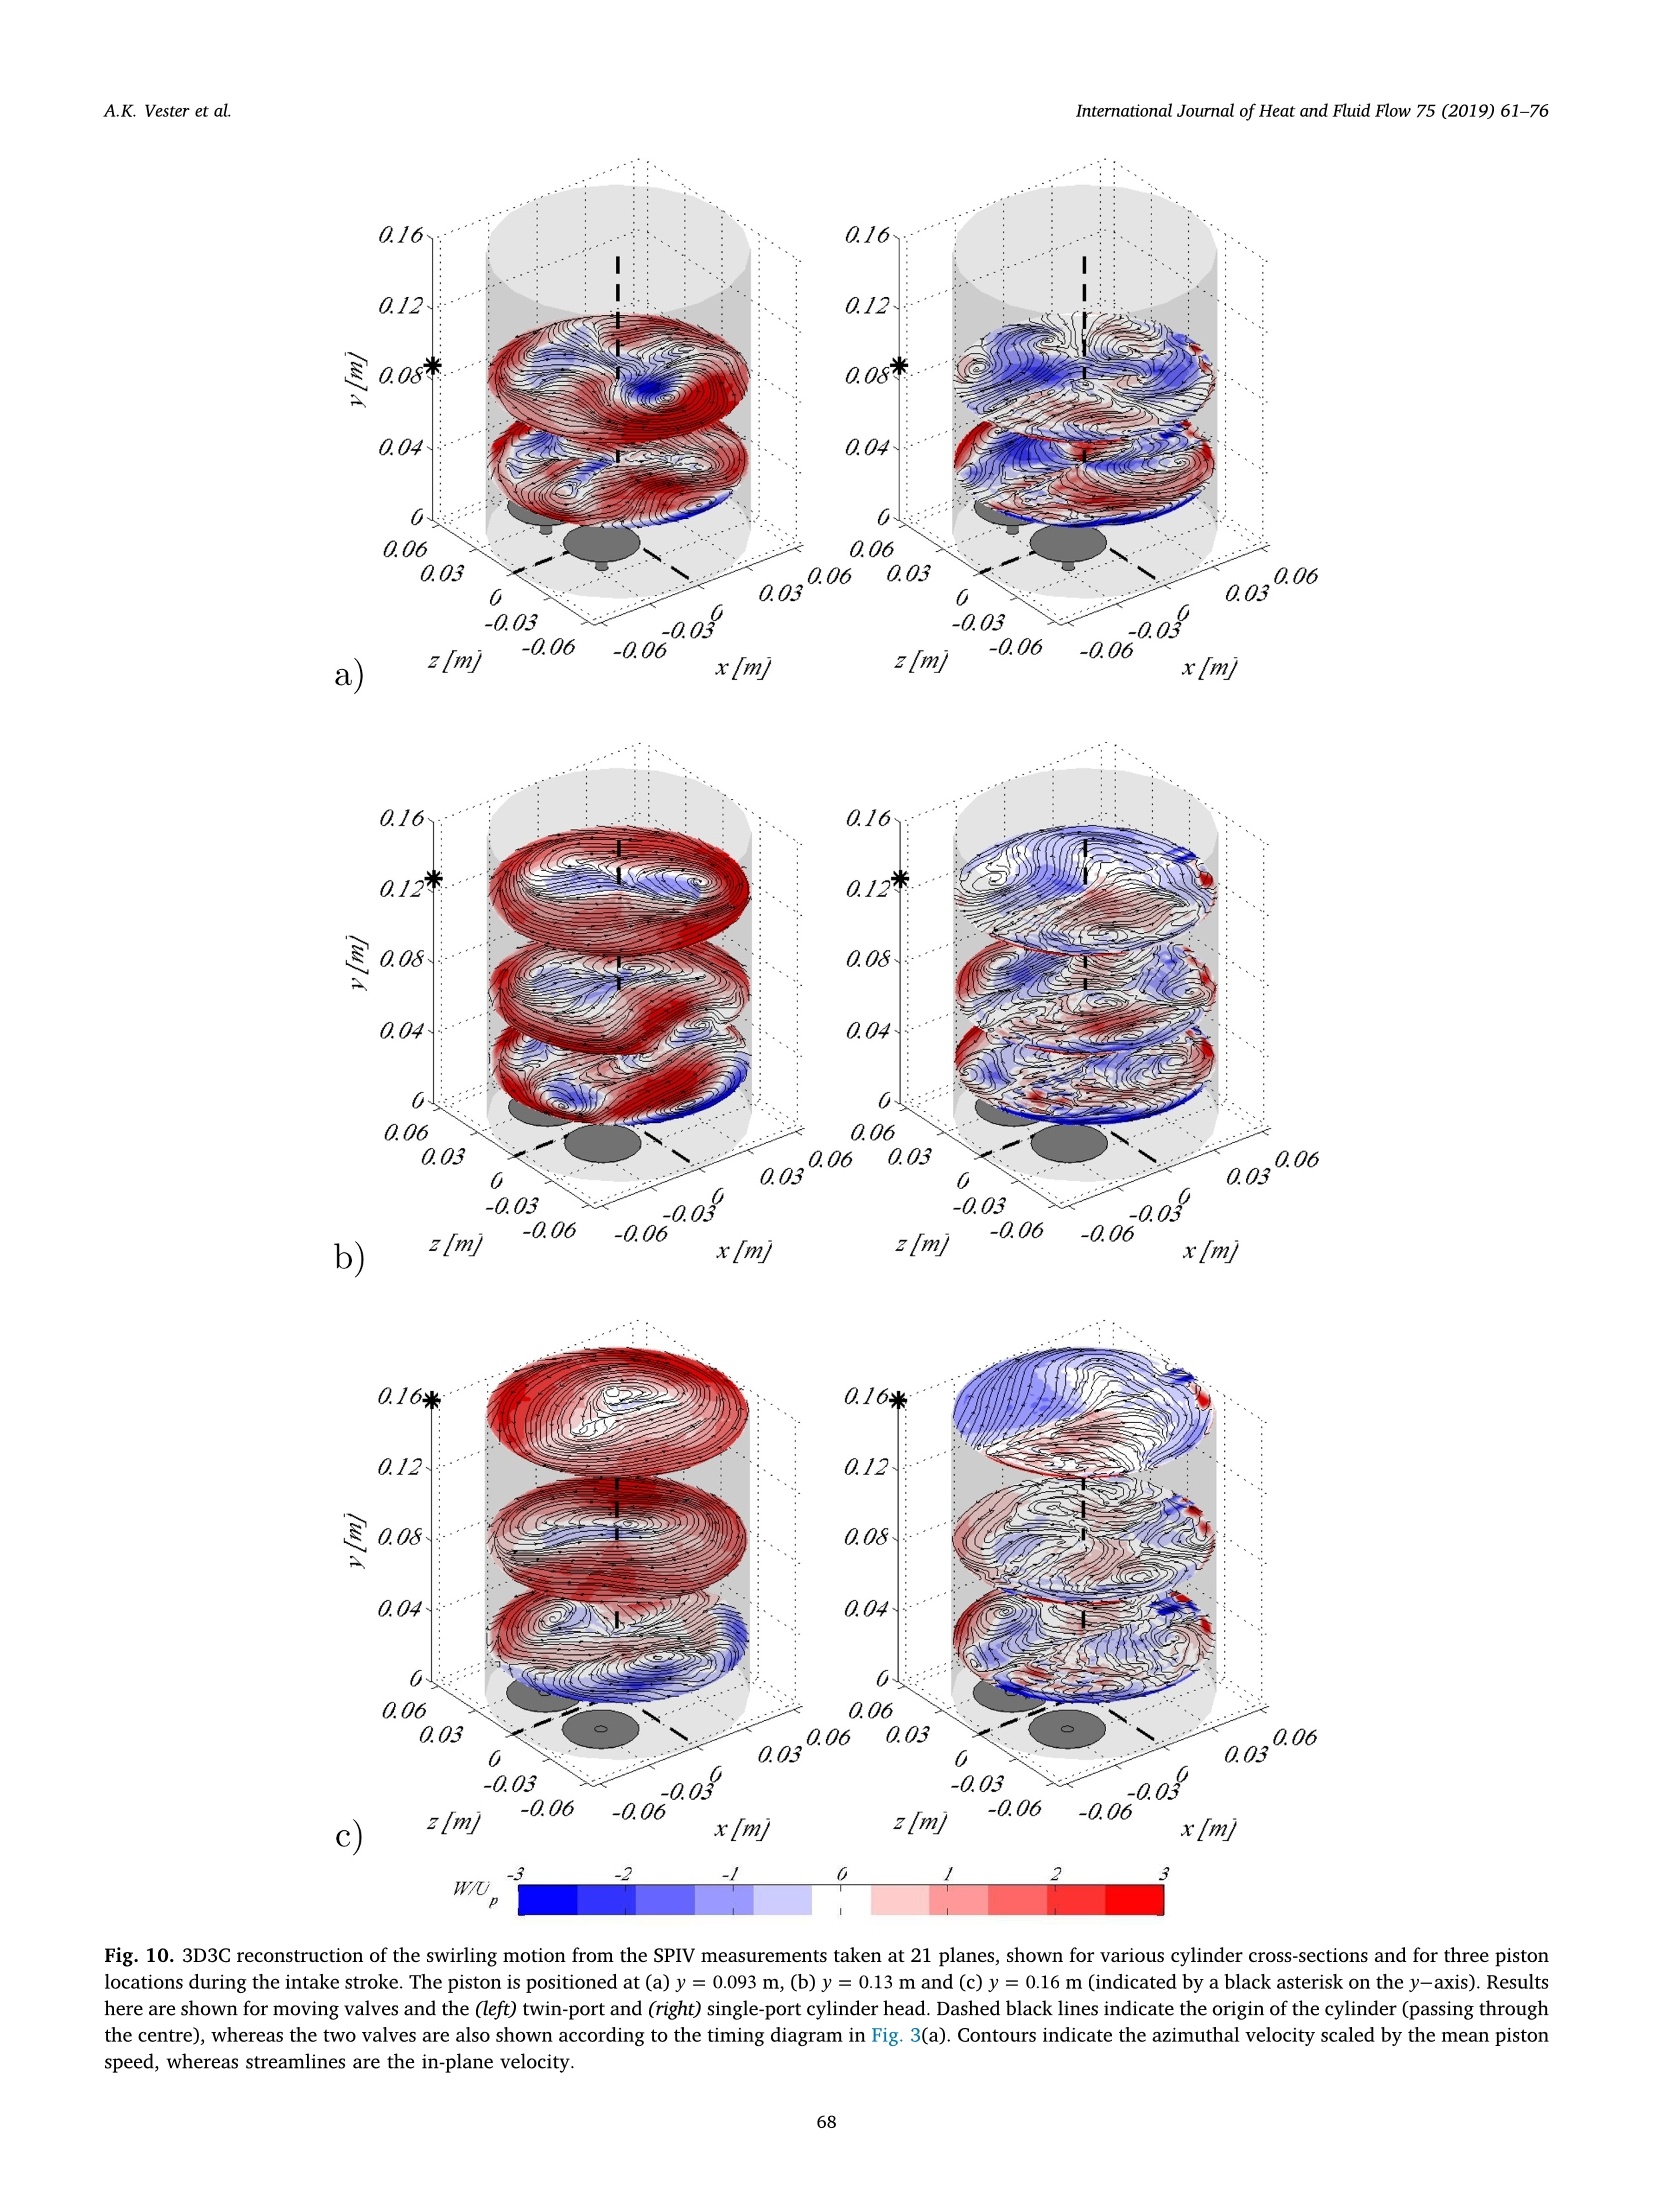
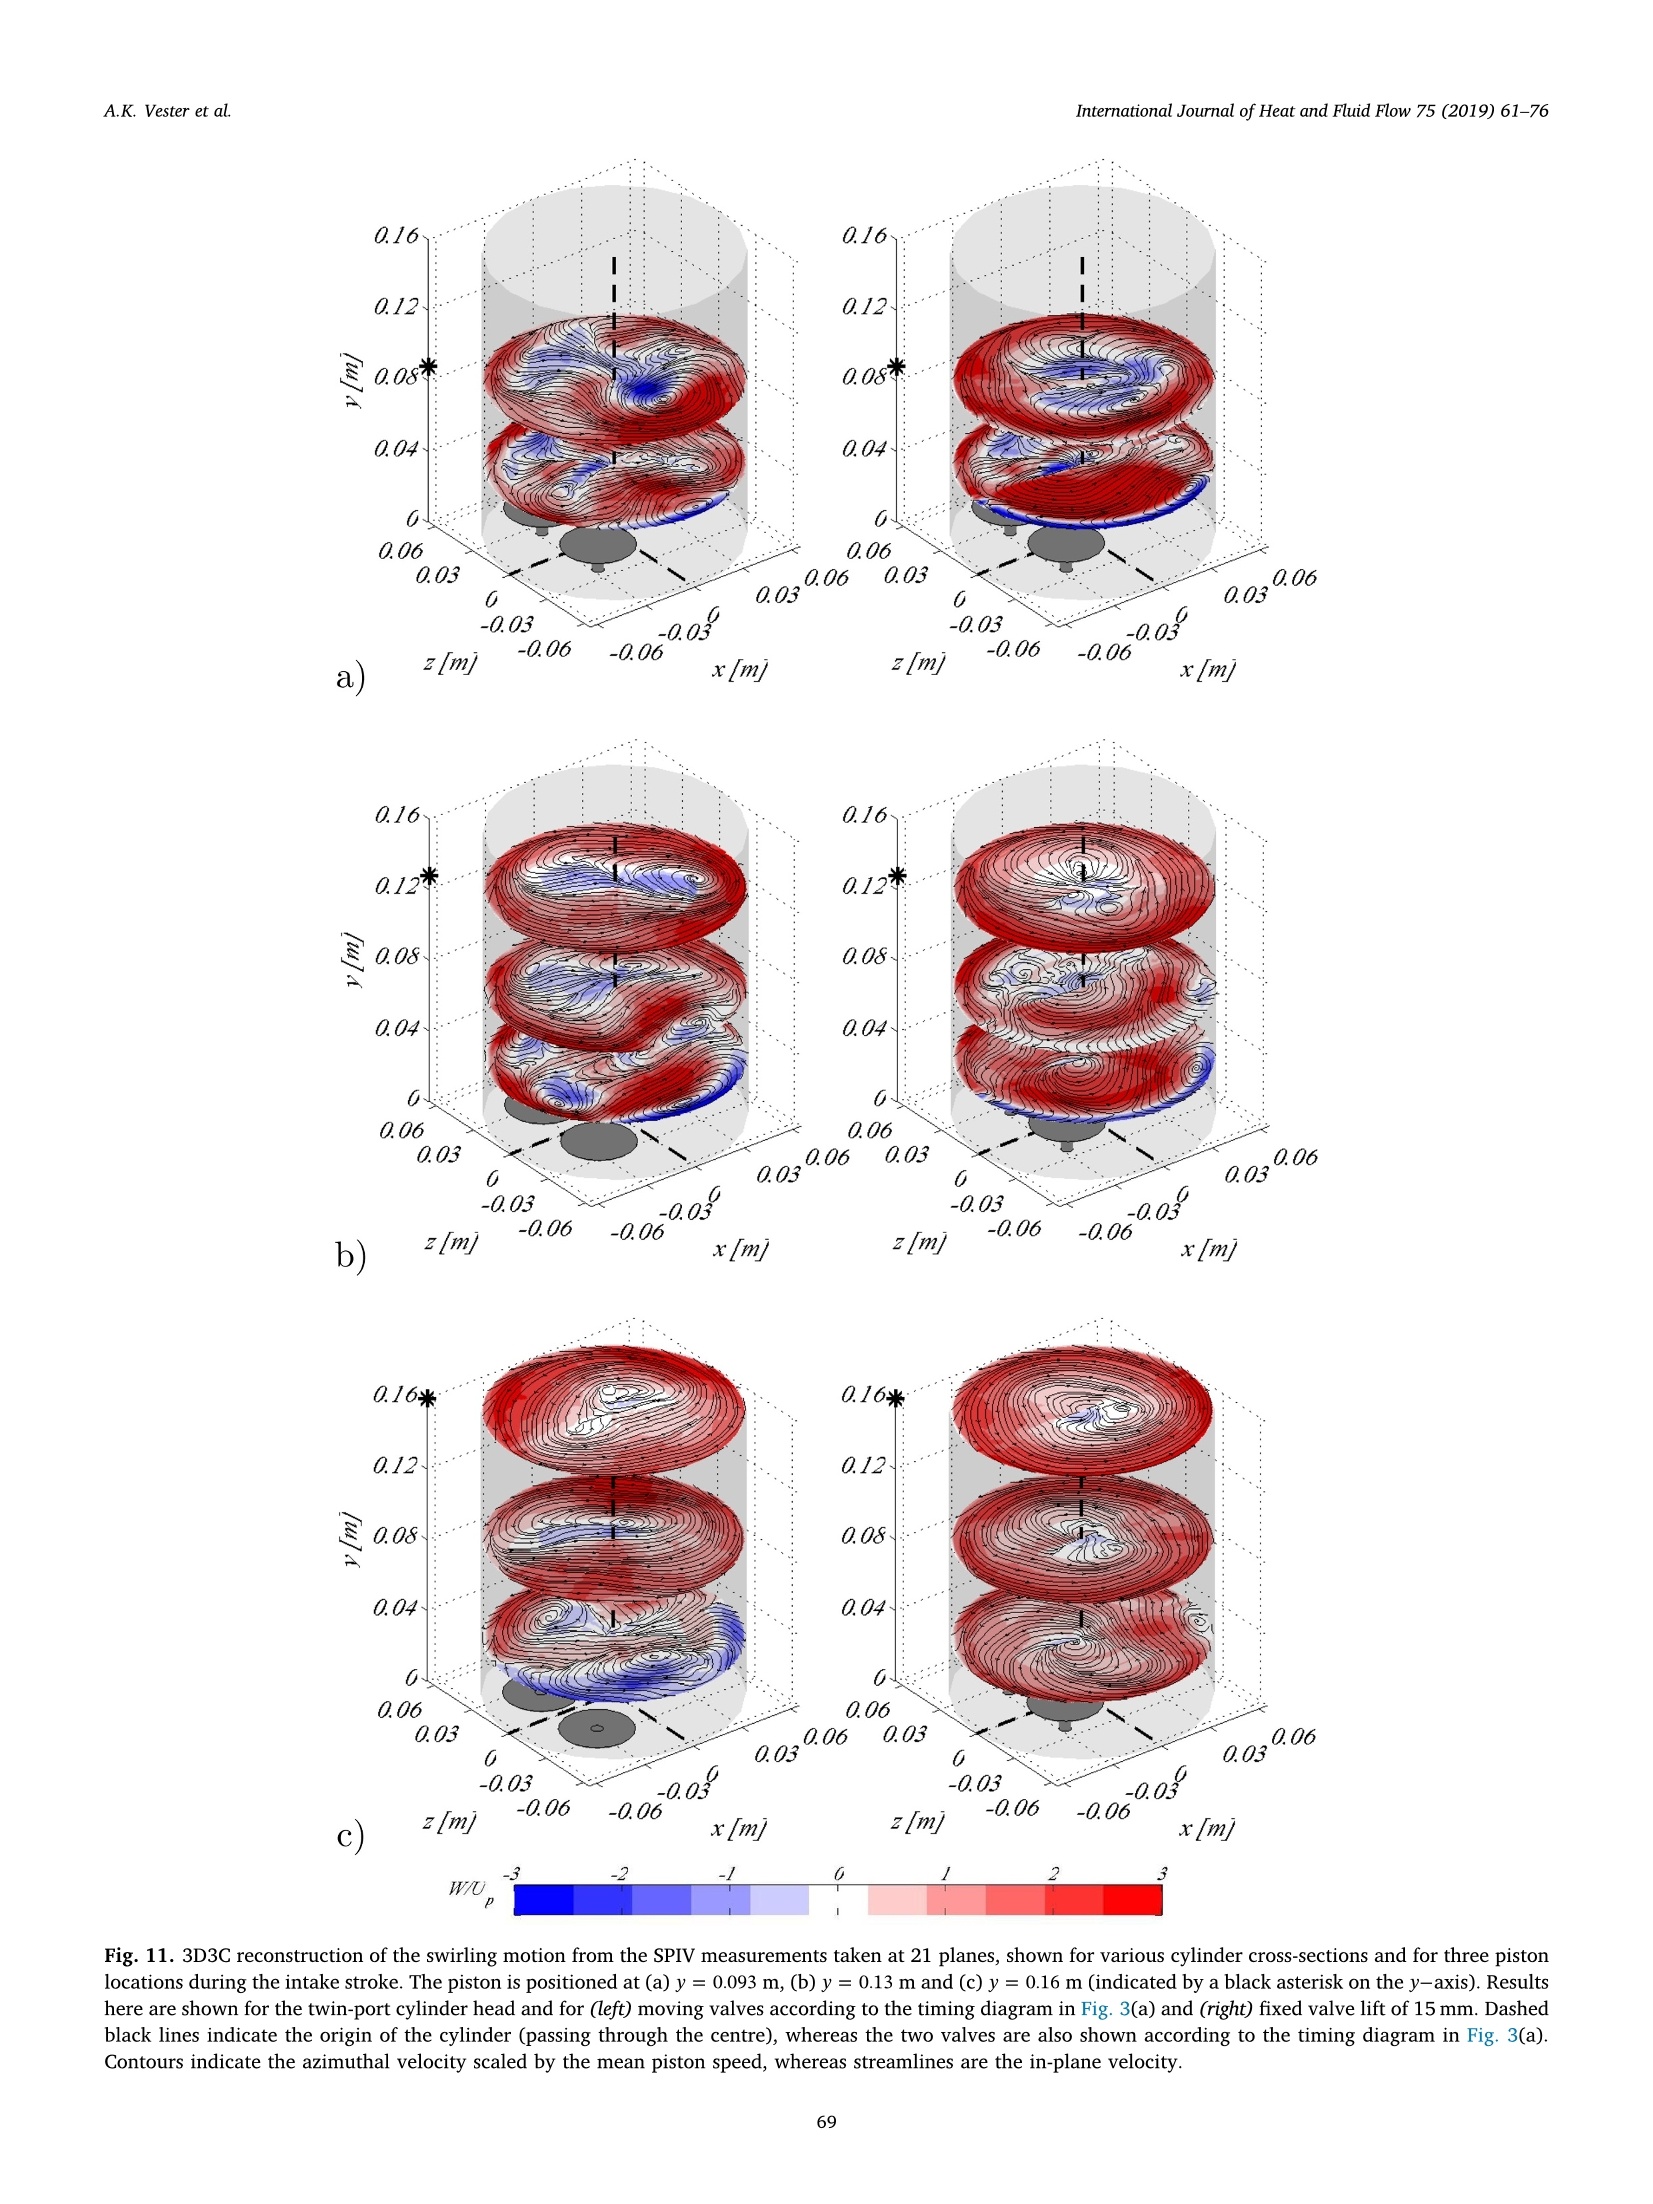
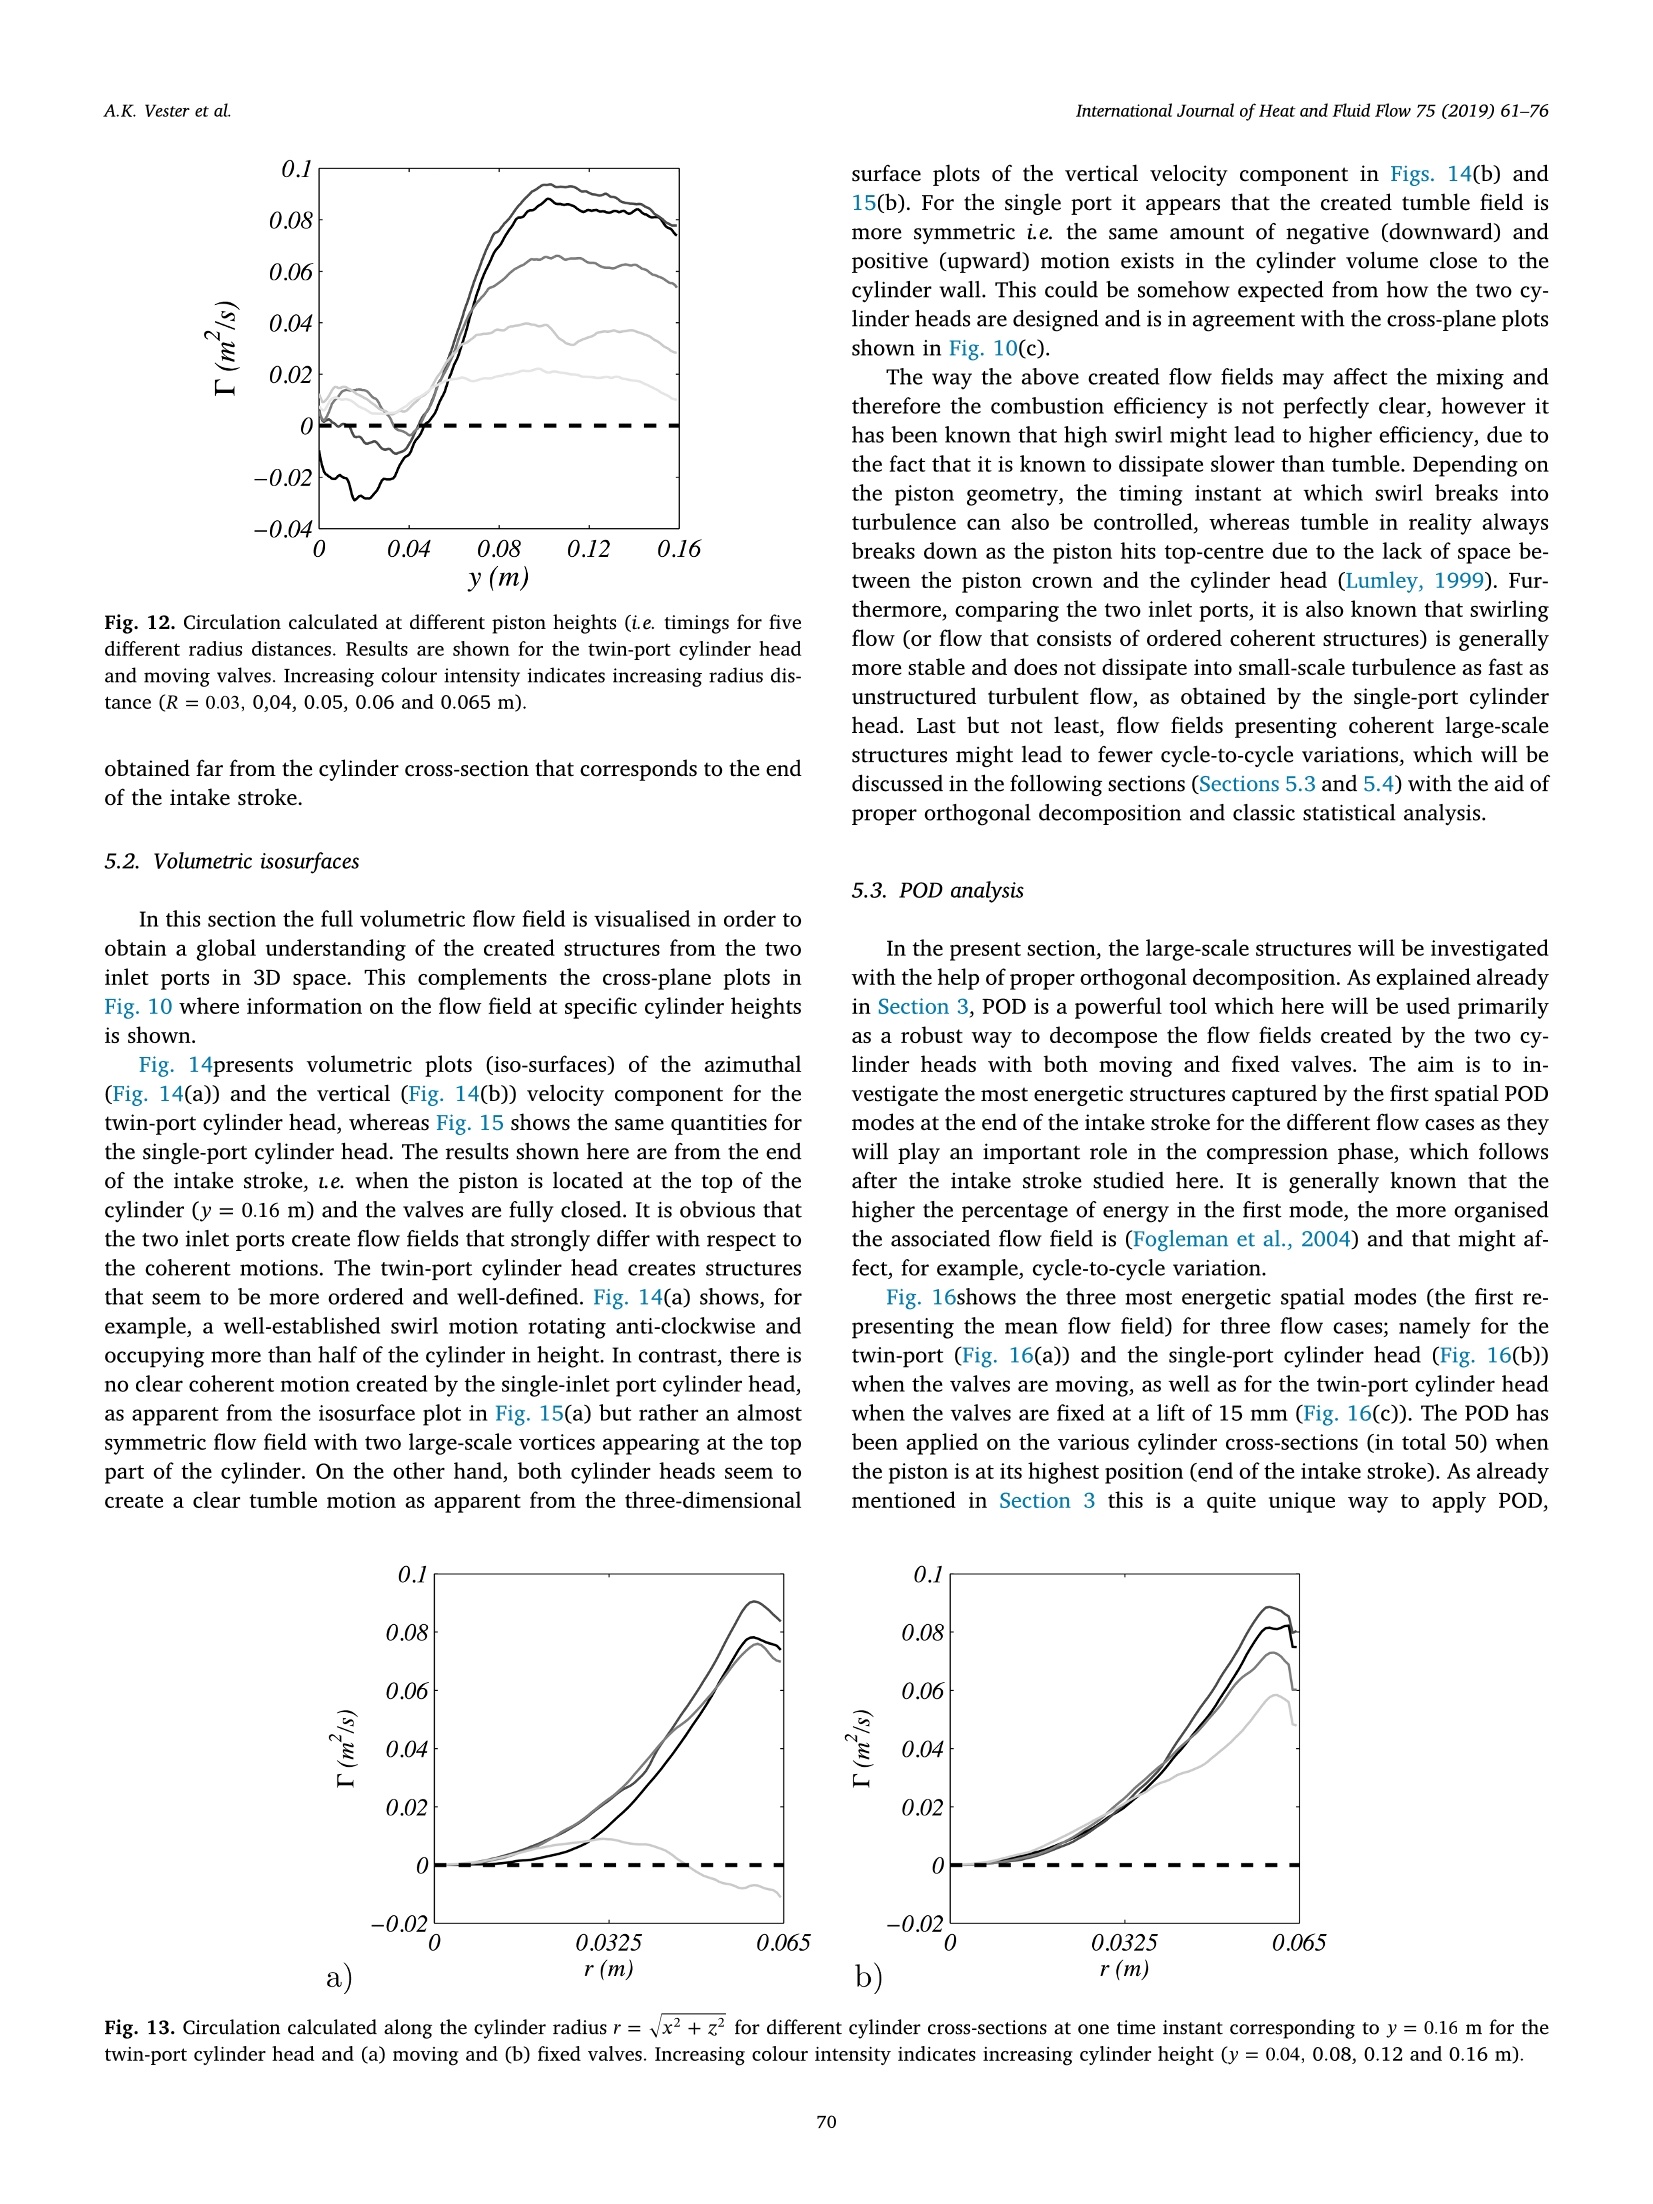
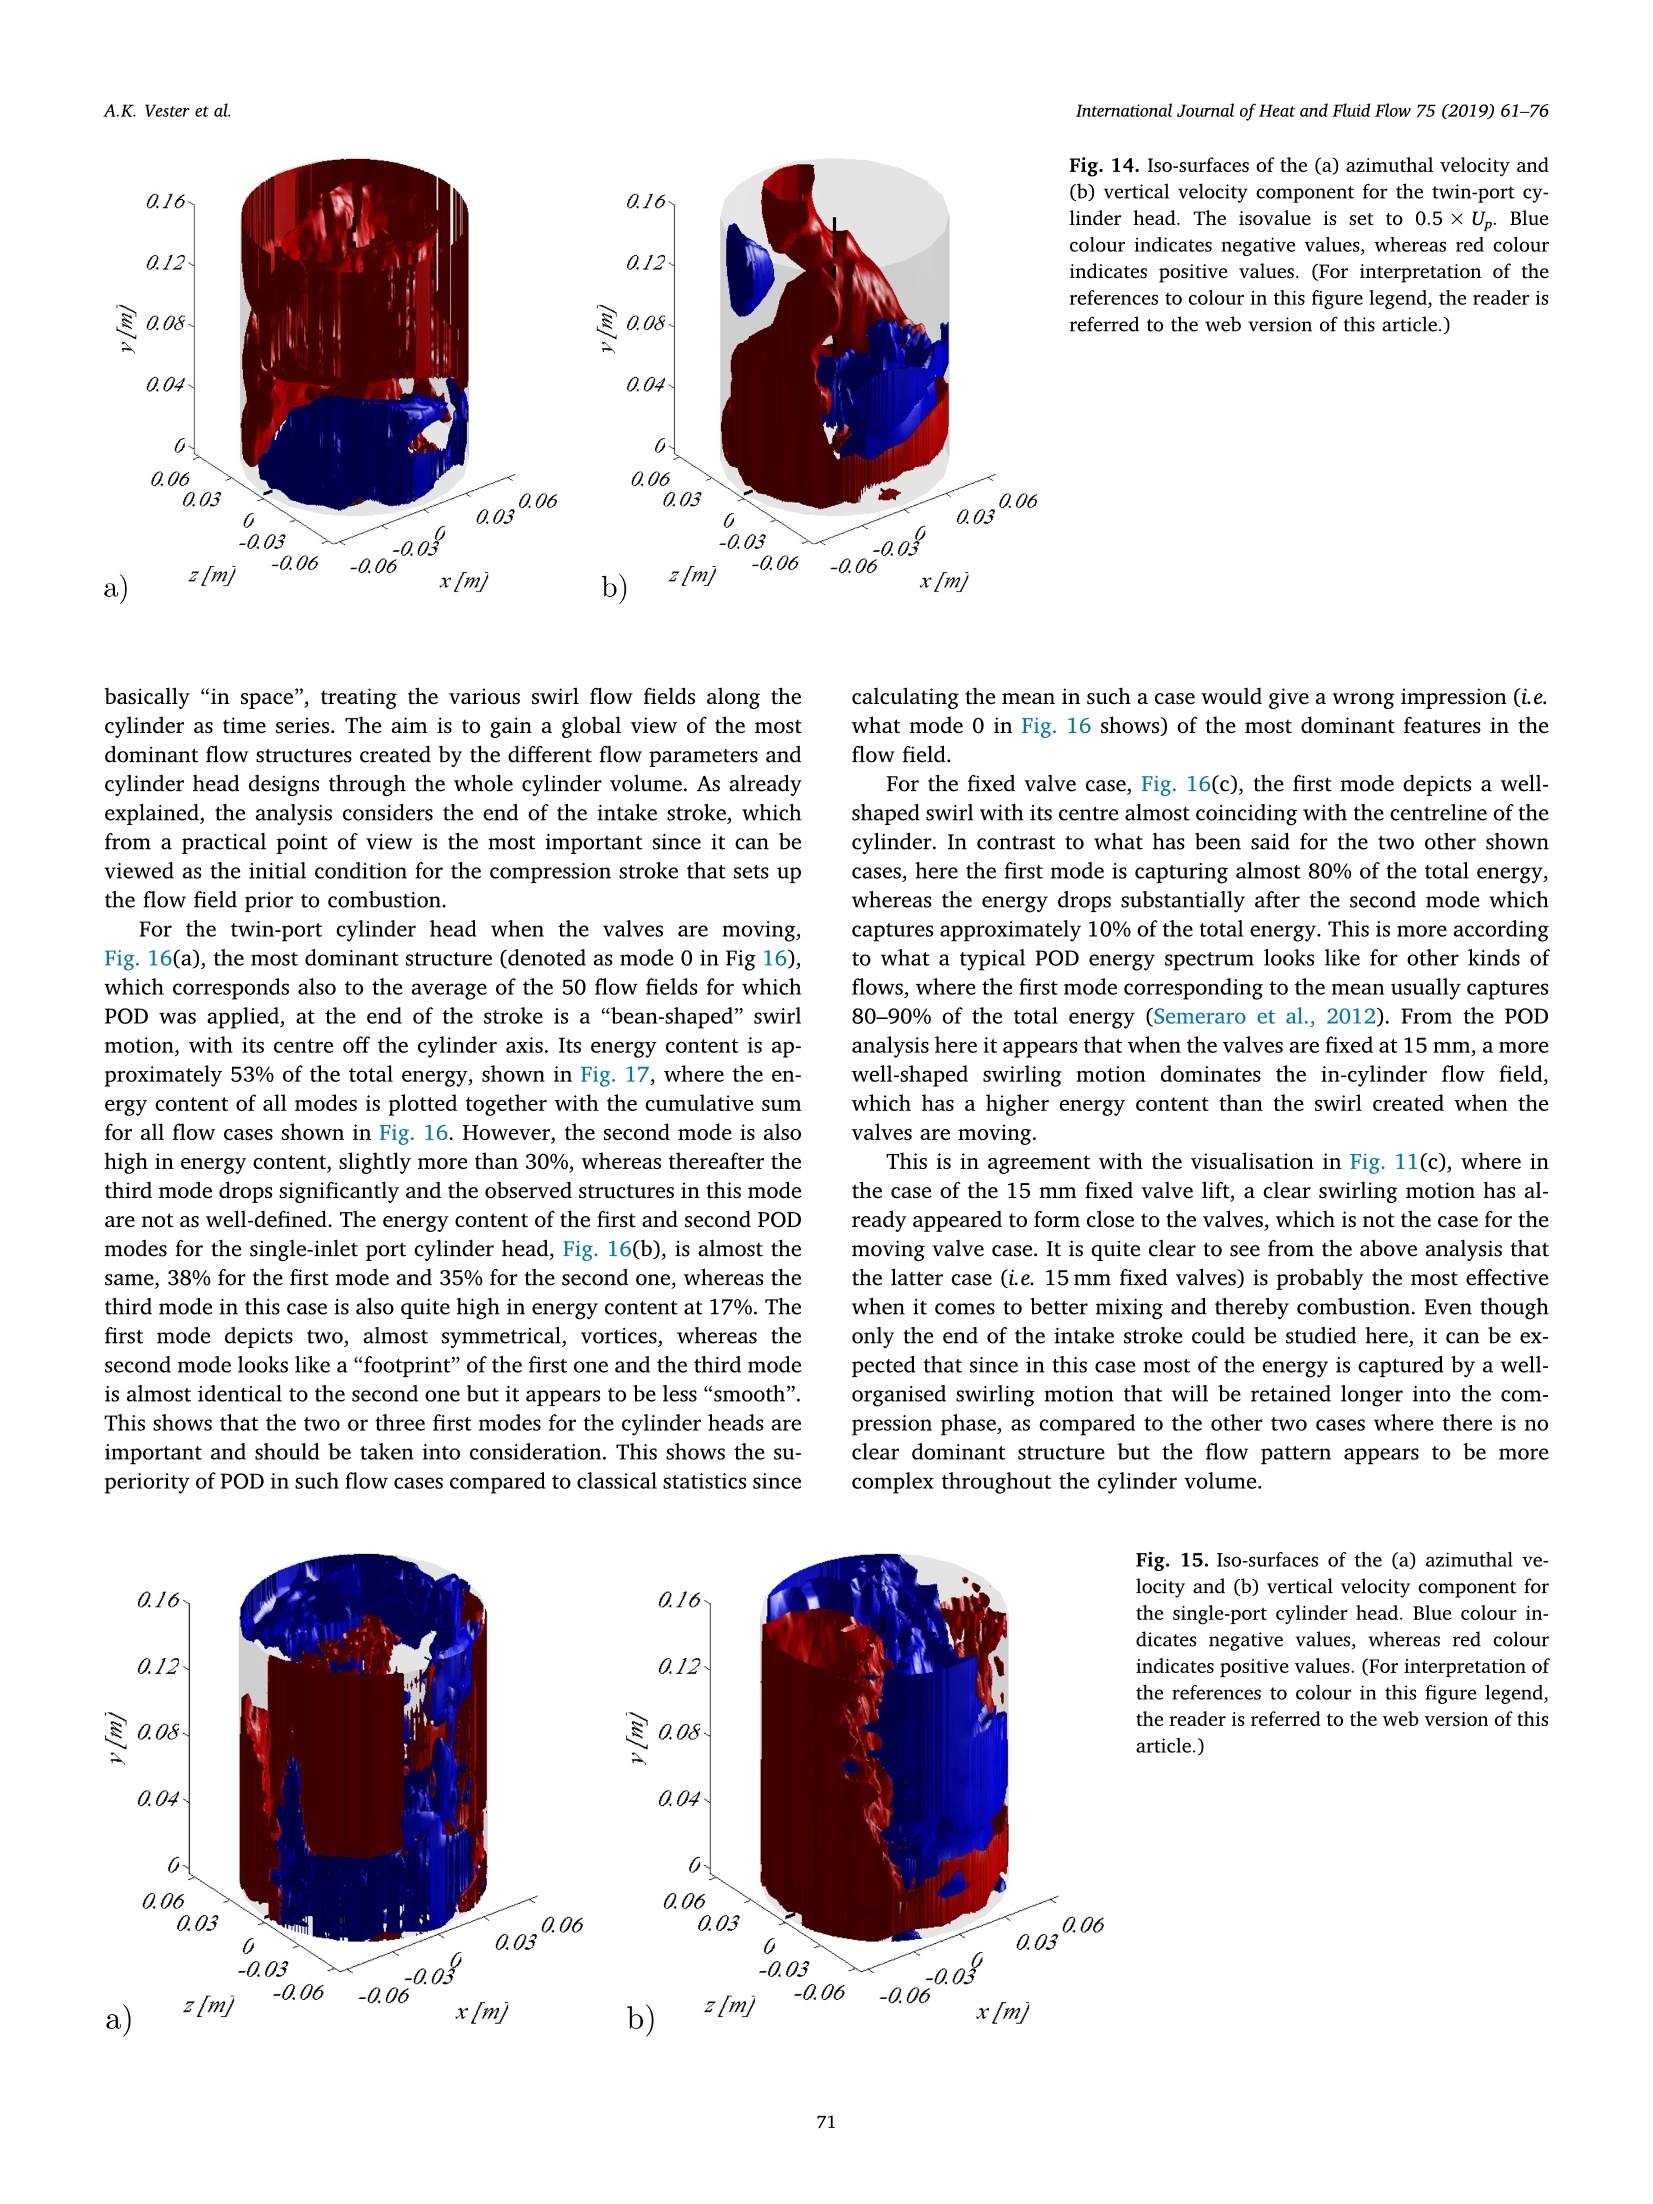
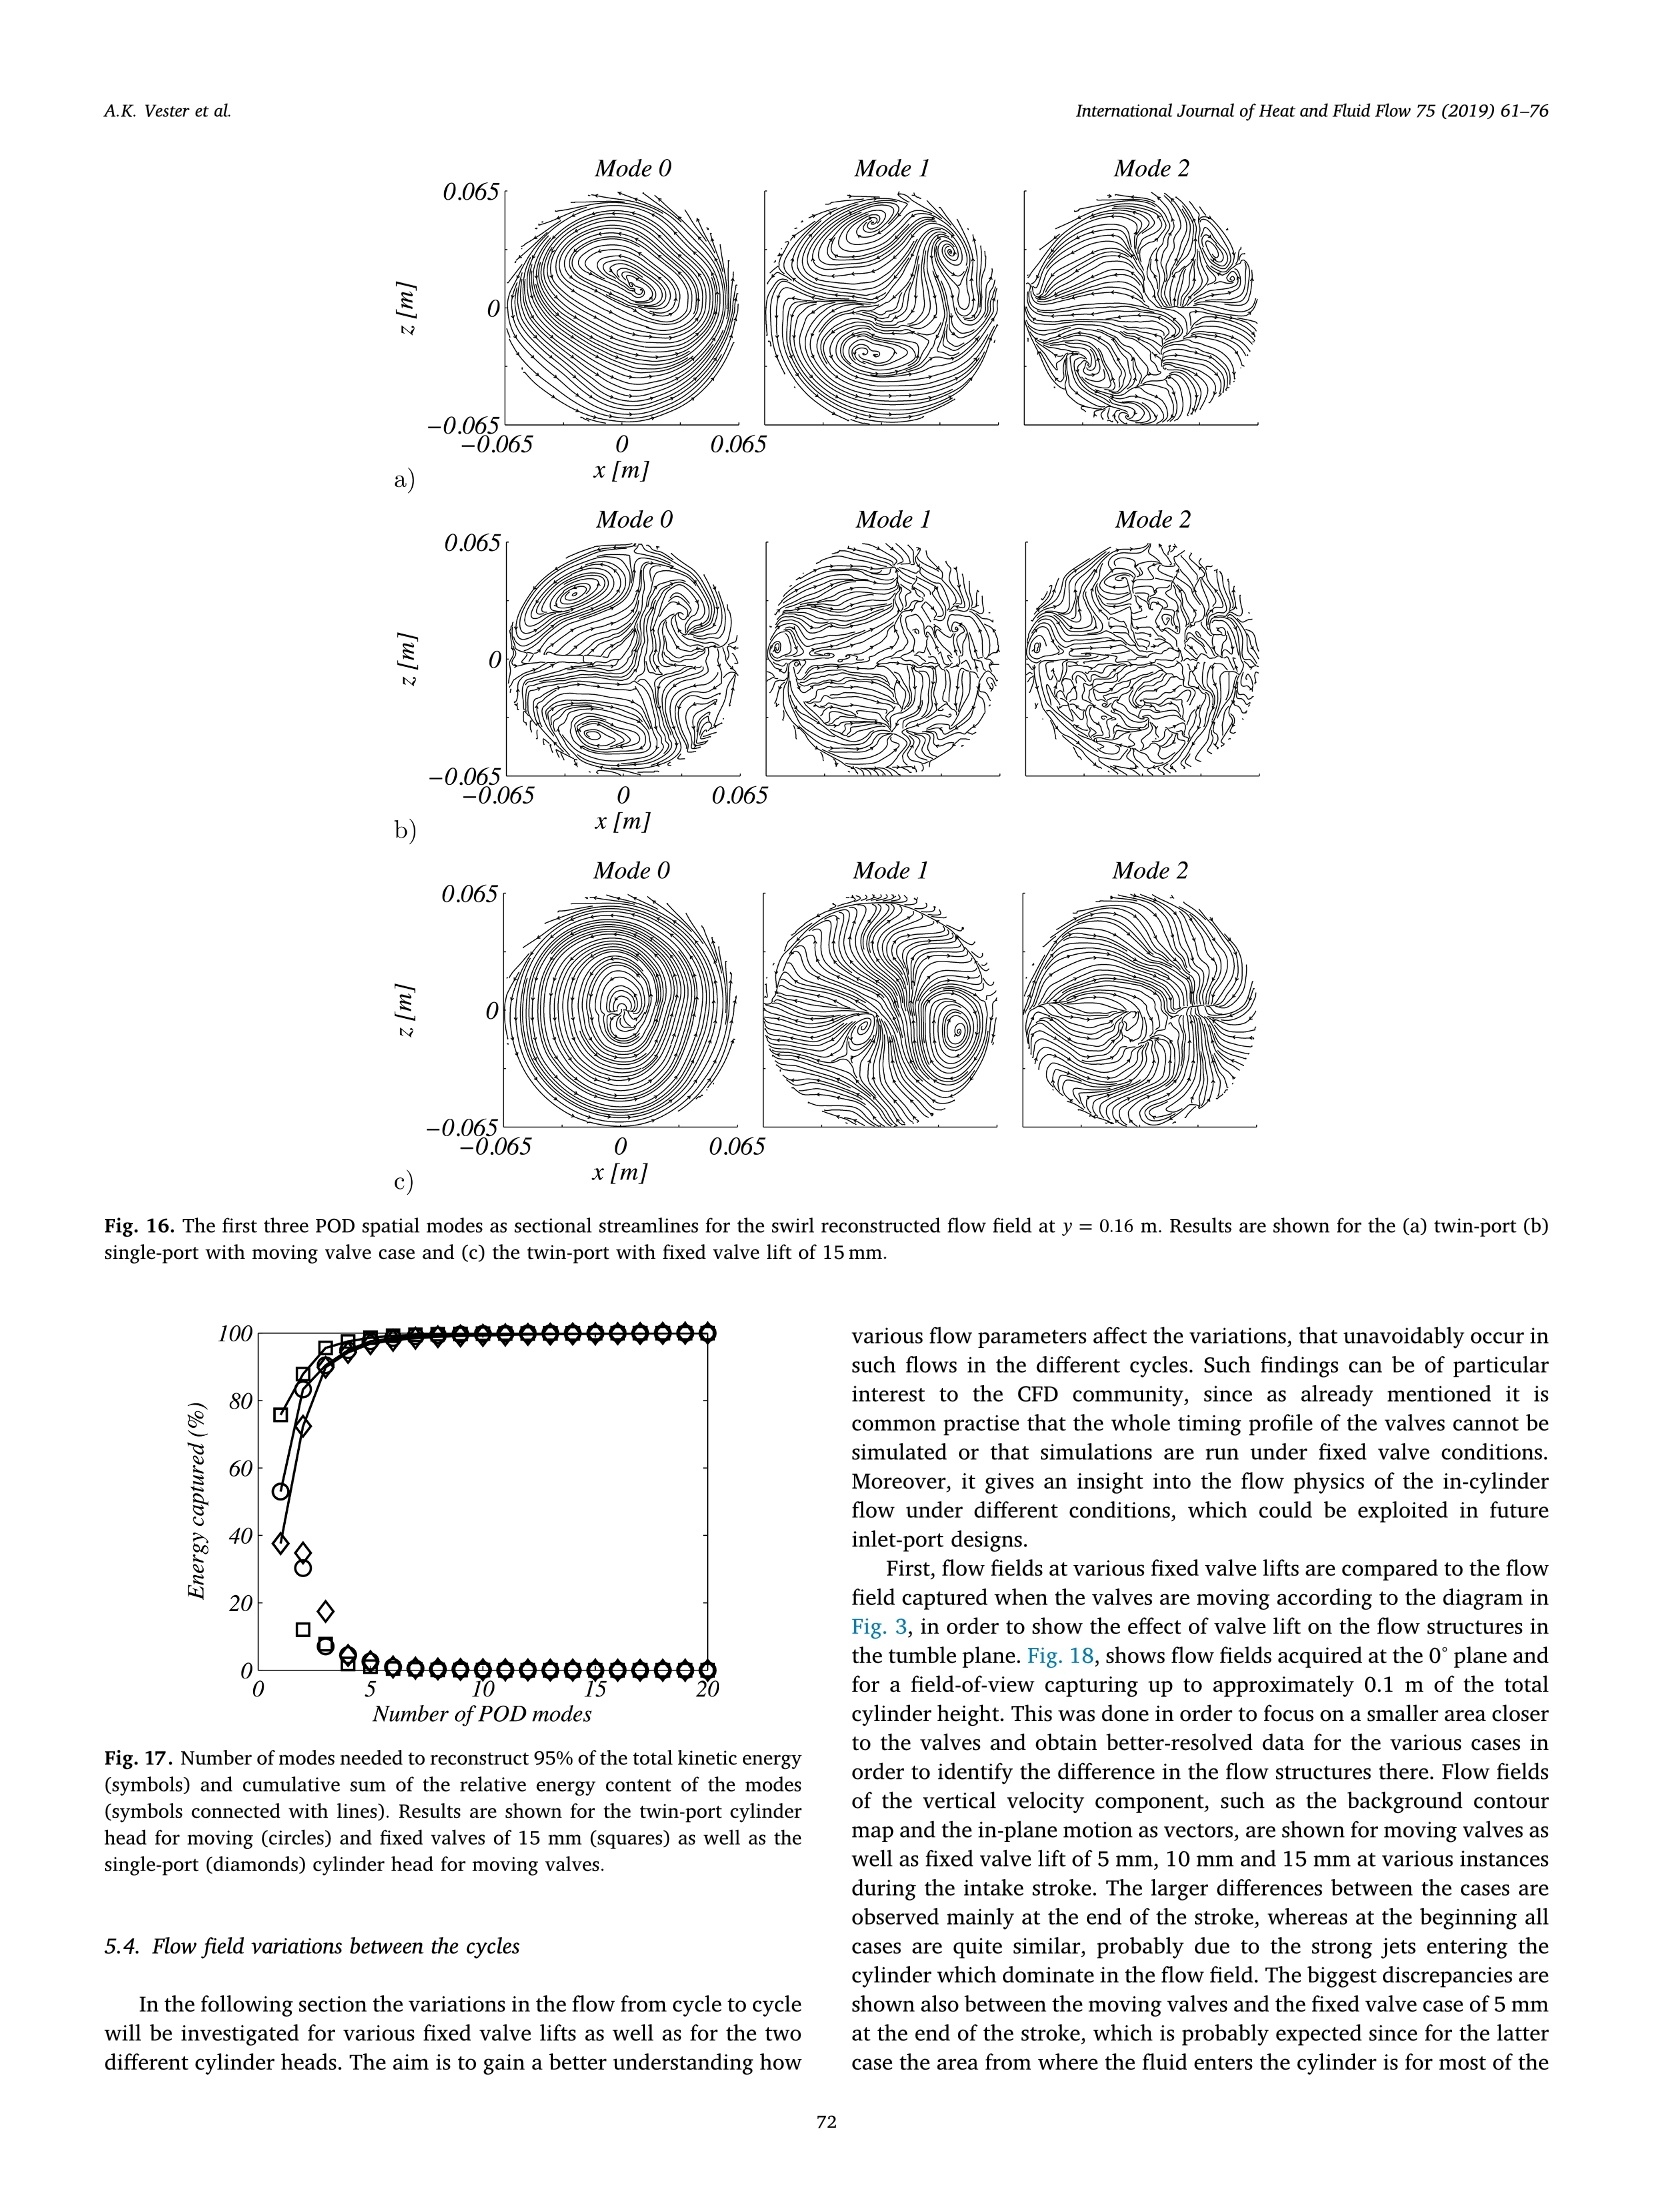
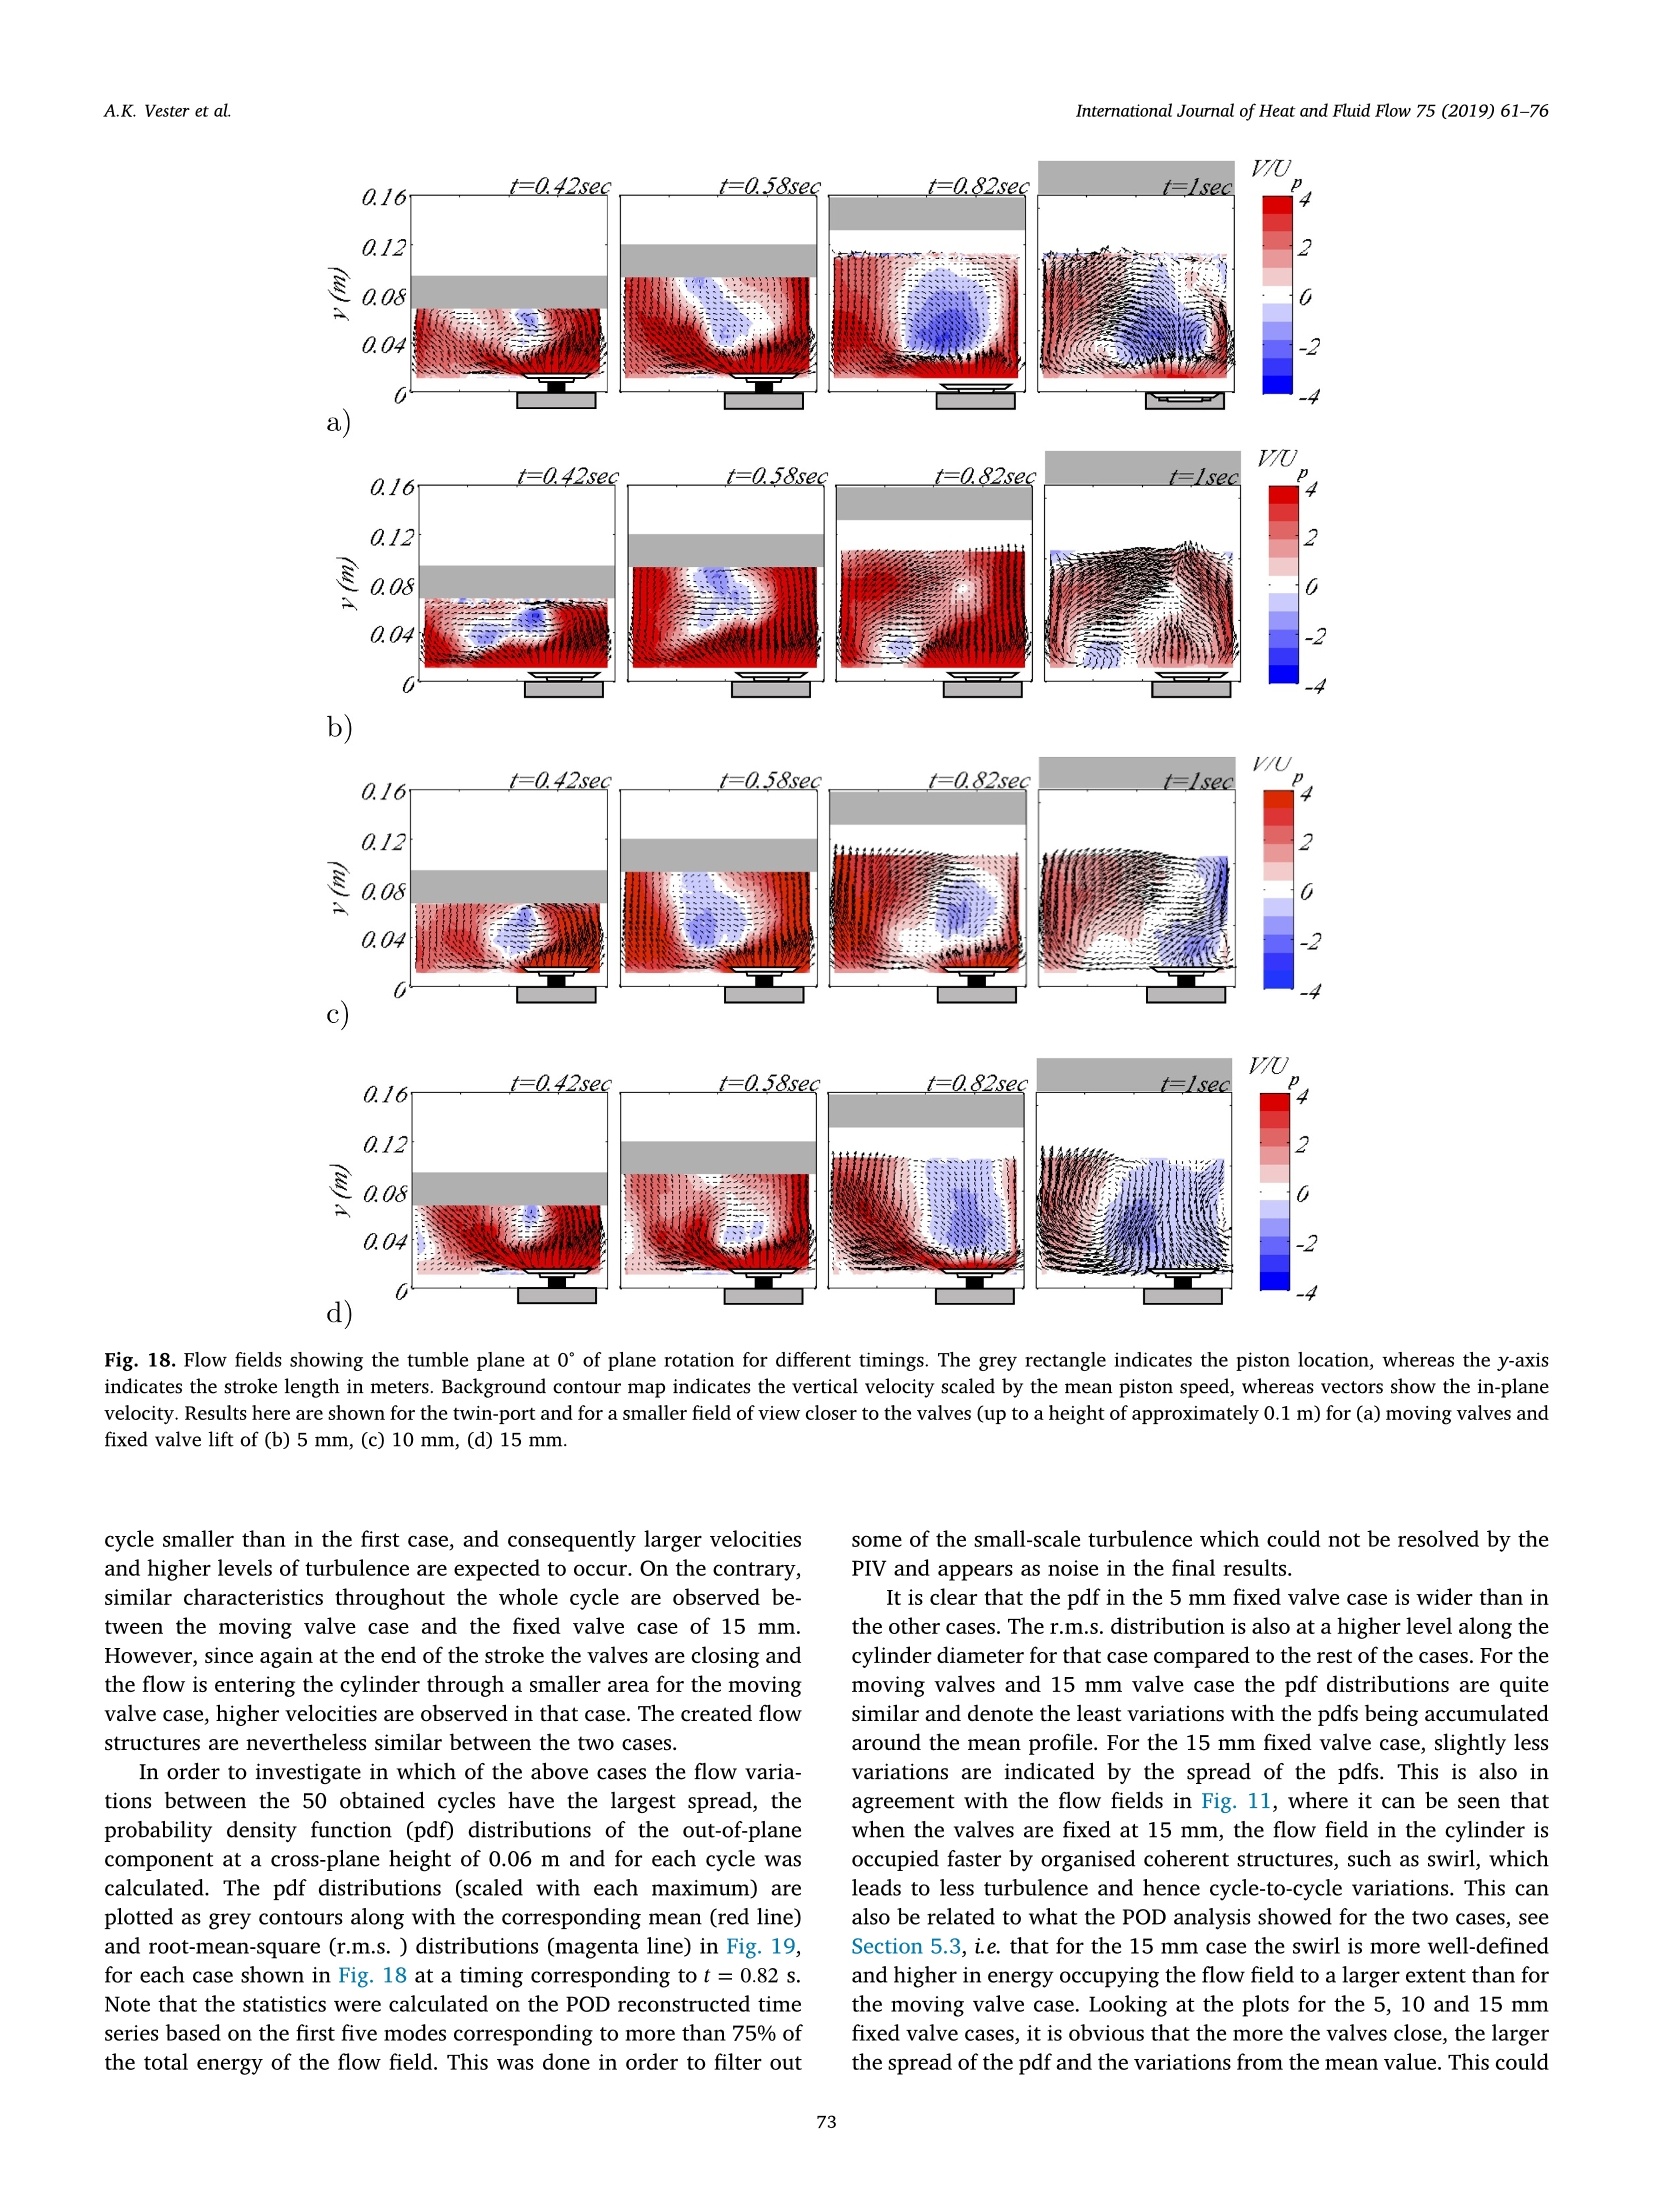
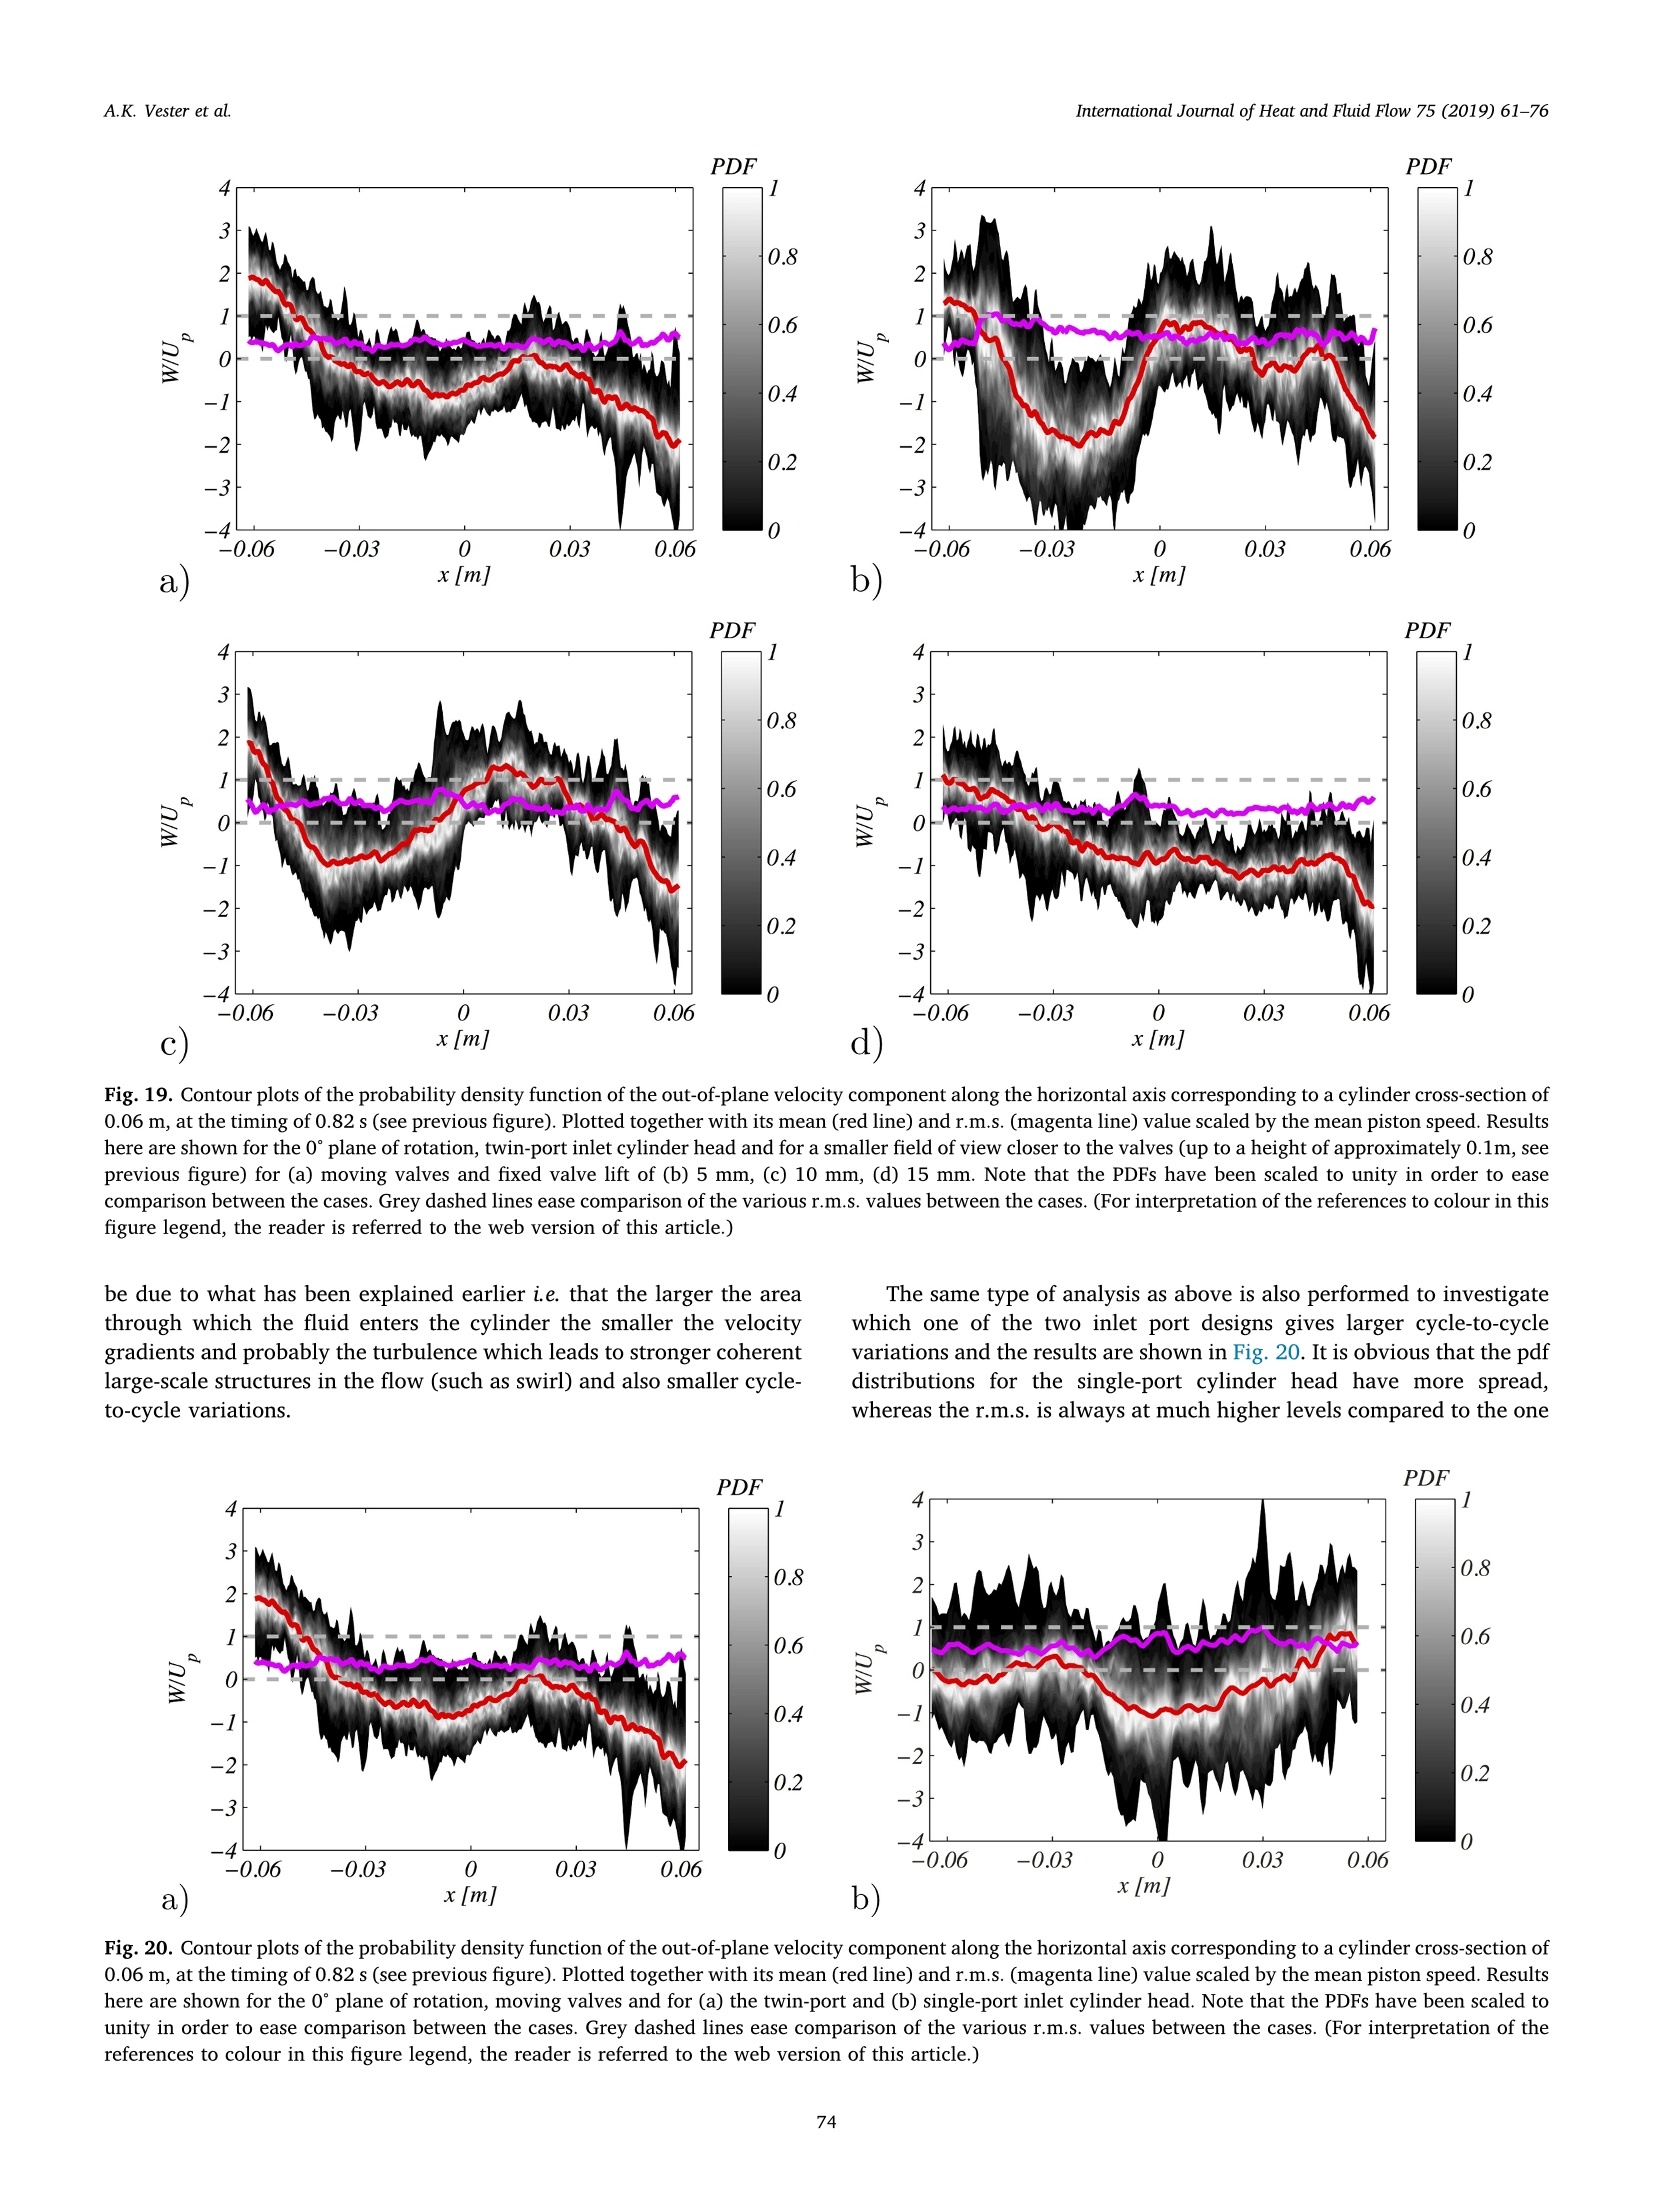
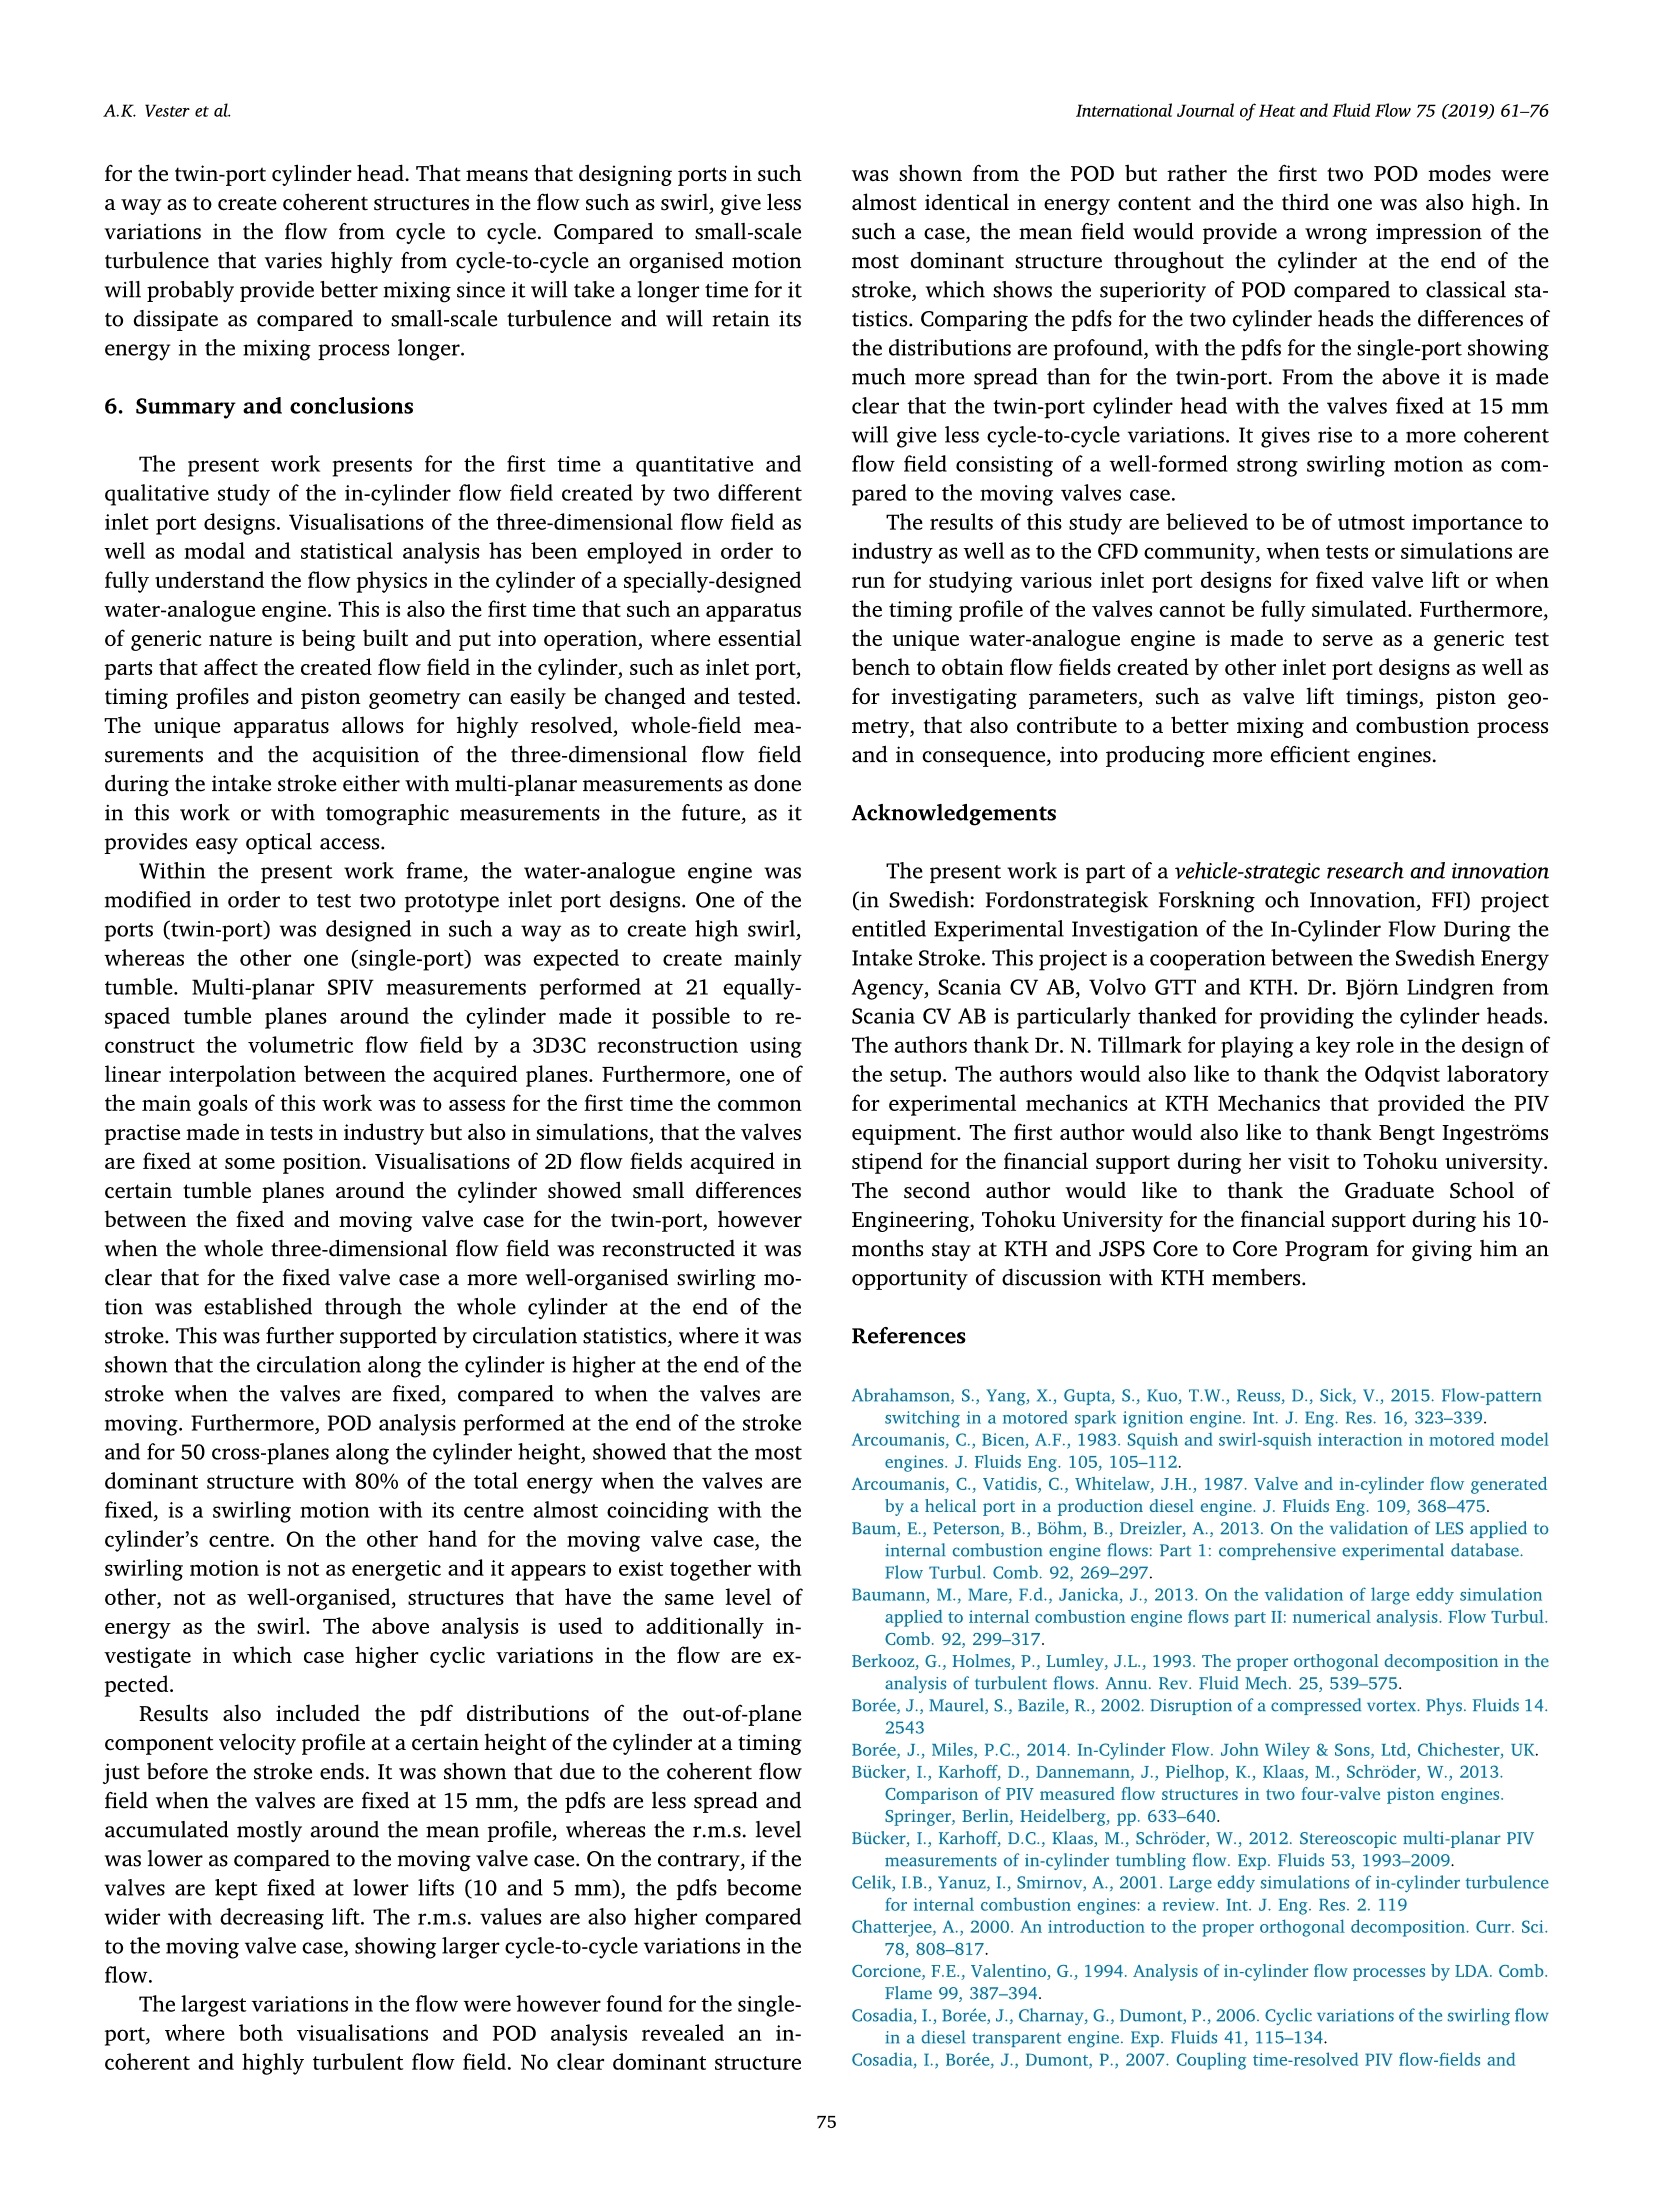
International Journal of Heat and Fluid Flow 75 (2019) 61-76Contents lists available at ScienceDirect International Journal of Heat and Fluid Flow 75 (2019) 61-76A.K. Vester et al. International Journal of Heat and Fluid Flow journal homepage: www.elsevier.com/locate/ijhff Investigating swirl and tumble using two prototype inlet port designs bymeans of multi-planar PIV A. Kalpakli Vester*,,a, Y. Nishio, P.H. Alfredsson KTH Mechanics Osquars Backe 18, Stockholm, SE-100 44, Sweden Graduate School of Engineering, Tohoku University, 6-6-01 Aramaki-Aoba, Aoba-ku, Sendai, 980-8579, Japan ARTICLEINFO ABSTRACT Keywords: Tumble SwirlStereoscopic particle image velocimetryProper orthogonal decomposition 3D3C reconstruction Flow structures created during the intake stroke of an engine were investigated by means of multi-planar particleimage velocimetry (PIV). A unique water-analogue engine model has been developed, where all essential partsand parameters, such as the cylinder head, valve timing, piston geometry and motion, etc. can easily be mod-ified. Two cylinder heads with geometrically different inlet ports were investigated and experiments wereperformed with both moving and fixed valves. Three-dimensional visualisations of the flow field, mode de-composition through proper orthogonal decomposition, circulation as well as classical statistics were obtainedand evaluated in order to gain an understanding of the flow structures, i.e. tumble and swirl, created by the twocylinder heads. It was clearly shown that one of the cylinder heads created a strong swirling motion in thecylinder. Three different fixed valve positions were investigated and the fully opened valve gave the strongestlarge-scale structures, whereas with smaller openings a larger amount of the kinetic energy was converted intosmall-scale turbulence. Results showed a more organised and stable flow field consisting of a well-defined swirlmotion occupying the whole cylinder at the end of the intake stroke when the valves were fixed at the highestposition. The moving valve case gave results similar to the fully open case but with slightly higher turbulence.Cycle-to-cycle variations were found to be less pronounced for these two cases as compared to the smaller fixedvalve lifts. The second cylinder head showed a flow field that was more turbulent and much less coherent.Statistical analysis showed that this had a direct effect on cyclic variations in the flow where this head showedmore profound variations. 1. Introduction The flow physics of the in-cylinder flow in an internal combustionengine have long been capturing the interest of the research communitydue to its influence in the mixingand combustionn procesS(Heywood, 1987). It is nowadays realised that fundamental research ofthe flow dynamics in the cylinder is essential (Lumley, 2001) for furtherimprovement of engine efficiency and reduction of emissions. In thevehicle industry it is common practice to design the inlet ports (wedenote the channels in the cylinder head that leads to the inlet valves as“ports") in such a way as to enhance organised large-scale structures inthe cylinder, so-called tumble (aligned parallel to the cylinder axis) andswirl (aligned normal to the cylinder axis) (Boree and Miles, 2014). Fora schematic of the two motions see Fig. 1. The idea with promoting suchcoherent structures is that some of the energy of the turbulent inlet jetsentering the cylinder from the inlet valves will be retained longer through the combustion cycle and lead to better mixing and thus in-creased engine efficiency (Lumley, 1999). The inlet ports of a gasolineengine are designed to give a strong tumble motion at the end of theintake stroke, whereas for Diesel engines high swirl is usually desired. Itis still, however, unknown how to find an optimal design of the inletports in order to create such coherent motions. Even though tumble andswirl are generally associated with increased combustion efficiency ithas been known, for example, that too high swirl can lead to fuel spraycollision, increasing subsequently the local air/fuel ratio and thereforeincreasing soot emissions and fuel consumption (see e.g. Towers andTowers, 2004). There are several studies reported in the literature of the organisedmotions of the in-cylinder flow. A common practise in industry is toperform cold flow experiments in order to characterise swirl and tumblein steady flow engine test benches, i.e. with a fixed valve position. Forexample, particle image velocimetry (PIV) measurements have recently ( E-mail address: sissy@mech.k t h.se ( A.K. V ester). ) ( C u rrent address: Department of Systems Design Engineering, Seikei Un i versity, 3-3-1 kichijyoji-kitamachi, m usashino-shi,Tokyo 180-8633, Ja p an. ) ( Received 23 March 2018; Received in r evised form 16 November 2 0 18; A c cepted 17 November 2018 ) ( 0142-727X/C 2018 The A uthors. Published by El s ev i er Inc. This is an o pe n access article under the CC BY- N C-ND license ) ( (http://creativecommons.org/licenses/BY-NC-ND/4.0/). ) Fig. 1. Schematic of the tumble and swirl motions in the cylinder. The bluearrow indicates swirl and the yellow ones indicate tumble. (For interpretationof the references to colour in this figure legend, the reader is referred to the webversion of this article.) been performed at a steady flow test bench at Scania CV AB(Rabault et al.,2016). Through such measurements, inlet port designscan be tested in terms of the amount of swirl that they are capable tocreate, however the fixed valves and absence of the piston make theflow conditions quite different compared to the real case.Furthermorethe common assumption of swirl being quantified by comparisons withsolid-body rotation has also been proven to be incorrect (Towers andTowers, 2004). On the contrary, with the increasing demand in enginedevelopment, simplified assumptions should be discouraged sincedeeper knowledge of the large-scale structures in dynamic flow setups isneeded (Soder, 2015). Most existing research studies performed in dynamic flow setupshave mainly focused on tumble since most of them regard specific ga-soline engines (Baum et al.,2013; Bucker et al., 2013; 2012; Koehleret al., 2015; van Overbriggen et al., 2013b), whereas only few studieson the in-cylinder flow in Diesel engine exist (Cosadia et al., 2006; Yuet al., 2006). Even fewer studies exist where the large-scale structuresare investigated in simpler, generic setups where the flow physics canbe investigated by changing various flow parameters and geometricconditions. Boree et al. (2002) is probably the only one-to the authors'knowledge - that obtained highly resolved data of the tumbling motionby performing PIV measurements in a square chamber. The tumblemotion could be observed through generation, disruption and break-down during the intake and compression strokes and the authors couldinvestigate flow instabilities. Some early work on in-cylinder flows were done using single-pointexperimental techniques such as hot-wire anemometry (for example theX-wire measurements by Pajkovic and Petrovic, 2008) and laser-Dop-pler velocimetry (Arcoumanis and Bicen, 1983; Arcoumanis et al.,1987; Corcione and Valentino, 1994; Morse et al., 1979). Due to theneed for capturing the coherent structures in 3D space, those are,however, not optimal techniques. The rapid development of hardwareand software for PIV over the last decades has made whole-field datapossible and has become a standard technique for studies of in-cylinderflows. Initially so called planar (or two-dimensional) PIV was used buttoday also stereoscopic PIV (3 velocity components in a plane) hasbecome common. In the studies in Dannemann et al. (2010a,b) two-dimensional PIVwas performed in multiple vertical (i.e. tumble) planes at differentcrank angle degrees (CAD) in a motorcycle four-stroke single-cylinderengine. However, the spatial resolution of those measurements was limited and coherent structures at higher crank angles e.g. 160° couldnot be identified. The authors concluded that fully three-dimensionalmeasurements should be performed instead. Multi-planar stereoscopicPIV measurements in a gasoline engine cylinder with a tumble portwere also performed by Biicker et al. (2012). Phase-locked measure-ments were performed at 15 crank angles obtaining the flow fields at 14axial planes, covering nearly the complete cylinder volume. The tumblevortex was identified and shown to be the dominating structure,varying in strength, position and shape between the intake and com-pression strokes. In Karhoff et al. (2013) the cycle-to-cycle variations inthe cylinder were studied by means of time-resolved stereoscopic PIV ina four-stroke, four-valve, single-cylinder gasoline optical engine. It wasshown that the turbulent kinetic energy is high during the intake strokewhile it decreases at increasing crank angles and remains at an almoststable level during the compression stroke until the tumble vortexbreaks down at 320°CAD. From the few studies performed in a Diesel engine (where swirl hasbeen studied), Cosadia et al. (2006) investigated the cycle-to-cyclevariations by means of time-resolved planar PIV. It was shown that theswirling motion varied from a vortex type to an annular type from onecycle to another. Yu et al. (2006) performed both large-eddy simula-tions (LES) and PIV in an optical Diesel engine (based on a VOLVOproduction engine) and showed that in the intake phase, the tumble andswirl motions introduce strong large-scale vortex pipes which breakdown and thereby transfer energy to smaller turbulent eddies. Thelarge-scale vortex pipes were found near the intake valve and also nearthe corner of the piston surface and bore walls, as well as near the rimof the piston bowl. In the later stage of the compression phase the flowwas characterised by more isotropic turbulent eddies. Another group of studies has focused on the intake stroke and sincethe flow during that phase can be assumed incompressible, the air inthe optical engine can be substituted by water. The motivation forrunning water instead of air is that one can, even at a low piston ve-locity (V), achieve high Reynolds numbers (Re=DV,/v, where D thecylinder diameter and vare the kinematic viscosity of the fluid medium,respectively). From an experimental point of view water gives the op-portunity for refractive index matching compared to air, and therebyminimise loss of validated data due to light reflections from the lasersused when performing PIV, it simplifies seeding and since piston speedsare lower it is easier to obtain time-resolved PIV data. As long as thegeometrical characteristics of the cylinder (i.e. constant ratio betweenbore and stroke) are kept the same in the model and the Reynoldsnumbers between the two cases are closely matched one should expecthigh flow similarity, see for example Vester et al..((2018)) andKhalighi and Huebler (1988). One of the first pioneering studies using a so-called water-analogueengine was the one by Khalighi (1991). In that study, shrouded valveswere used in order to create a pure tumble motion in the cylinder andvisualisations of the tumbling motion were obtained for different en-gine speeds by means of particle tracking velocimetry. The tumblingmotion was found to dominate the whole field-of-view and the motionwas found to be repeatable, i.e. there was no“cycle-to-cycle”variation.Hess et al. (2012) also used a water-analogue engine and did compar-isons of the results obtained when using water as the working fluid andwhen using a water-glycerin mixture. The use of water-glycerin mixtureas the working fluid improved the refractive index matching furtherand allowed highly resolved volumetric data. It was found that the flowfield did not change in the two cases, at least not concerning the large-scale structures. In a follow-up work (Koehler et al., 2014), scanningPIV revealed horseshoe-type vortices to form at the valves generating astrong swirling motion in the early intake phase. The authors suggestedthat those vortices play an important role in cycle-to-cycle variations. Due to the complexity of the flow field, data obtained only in oneplane are not enough to fully understand the behaviour of the flowduring the intake stroke. Some efforts have therefore been done duringthe last decade in order to capture the three-dimensionality of the in- cylinder flow structures.Measurement techniques that have been usedso far to provide the three-dimensional flow field in an engine cylinder,include scanning and holographic PIV (Hess et al., 2010; 2012; Koehleret al., 2015; 2014; van Overbriiggen et al., 2013b), tomographic PIV,TPIV (Baum et al., 2013; van Overbriiggen et al., 2013a) as well asmagnetic resonance velocimetry, MRI (Freudenhammer et al., 2014).The first two are difficult and time-consuming to implement, whereasTPIV so far has been limited to providing only a thin volume slice of thecylinder, it requires long processing times and a plurality of opticalaccess which is not always achievable. MRI is a promising technique,which however is so far limited in spatial resolution and to phase-averaged flow velocities. Computational fluid dynamics (CFD), such asthe LES studies in Baumann et al. (2013) and Celik et al. (2001), havealso been employed to investigate the intake stroke although those stillneed validation through experiments. Tomographic PIV measurements in an optical gasoline engine wereperformed in Baum et al. (2013), providing the instantaneous volu-metric flow field at selected crank-angle degrees during the intake andcompression stroke. The uncertainty analysis that was performed by theauthors indicated the feasibility of TPIV in such a flow environment.TPIV measurements were also performed by van Overbriiggenet al. (2013a) in the cylinder of a four-valve internal combustion engineat 80, 160 and 240° CAD for which the ensemble-averaged velocityfields and the turbulent kinetic energy were determined using 300 in-stantaneous vector fields. Even though the important contribution ofthe above studies in understanding the physics of the in-cylinder flow,there are still many limitations to overcome as well as questions to beanswered. There is still need of a detailed study where the three-di-mensional flow field in the cylinder is captured in detail under a varietyof parameters such as inlet port designs, timing profiles etc with the aimto fully understand the role of both tumble and swirl in the mixing andcombustion process. In the present study a unique water analogue engine model has beendesigned, built and taken into operation. The engine cylinder is ofgeneric nature and parts of the setup, such as the inlet port, can easilybe interchanged so that the flow field in both prototype as well as al-ready in-production cylinder heads can be determined and specificallyin terms of swirl and tumble generation. The whole cylinder head canbe rotated in small increments with respect to the laser plane and thisallows for stereoscopic PIV measurements to be performed easily atvarious tumble planes so as to reconstruct the whole cylinder volume ina phase averaged sense. This is the first time - to the authors knowledge- that such a generic setup is taken into operation specifically dedicatedto investigate in detail the three-dimensional flow field in an enginecylinder for a variety of inlet-port designs. In Section 2 the uniquewater-analogue engine used for the measurements in this study as wellas the PIV system used are described. Proper orthogonal decomposition(POD) is used to analyse some of the data and the technique andmethodology used here is briefly described in Section 3. Selected resultsin both tumble and swirl planes are shown in Section 4, whereas finallythe outcome is discussed in Section 5. 2. Experimental setup During the intake stroke of an internal combustion engine the flowthrough the ports and into the cylinder can be assumed to be in-compressible. Therefore, as long as parameters such as for e.g. thegeometrical characteristics, are kept the same between the cylinders ofa model engine and a real engine, the in-cylinder flow dynamics are notaffected by using an incompressible medium such as water as the flowmedium, see Vester et al. (2018). In the present study the model enginecylinder has the same size as that of a typical heavy-duty truck Dieselengine, with a bore of 130 mm and a stroke of 160 mm. Fig.2(a) shows a schematic of the working principle of the enginemodel,whereas Fig. 2(b) shows the main part of the setup, consisting ofthe cylinder section and the inlet port. The flow is driven by a linear motor connected to a piston, shown in Fig.2(a), which forces the waterthrough the system and pushes the floating piston - which here is a flatone - in the cylinder upwards. The main setup is made in such a waythat parts, such as the cylinder head and valves, can be interchanged. Itshould be noted at this point that the inlet port is at the bottom of thecylinder, i.e.“upside-down”compared to most real engines. Therefore,the piston is moving upwards instead of downwards and the bottomdead centre (BDC) in such case is when the piston is at the highestposition (y=0.16 m). Furthermore, there is a hexagonal tank sur-rounding the cylinder, see Fig. 2(b), which is filled with water for re-fractive index matching between the glass cylinder and the water. Theline of view of each cameras is perpendicular to one of the surfaces ofthe hexagonal tank. The intake valves are also moved by a fast-actinglinear motor where the lift opening profile can be accurately controlledthrough the drive of the linear motor. The two linear motors i.e. the onecontrolling the piston and the one controlling the valves, are synchro-nised so that a real engine intake stroke can be mimicked. Both linearmotors are provided by LinMot@. Fig.3(a) shows the timing diagram forthe valves and the piston location, whereas Fig. 3(b) shows the valve liftand piston velocity profile chosen for the results shown in this study.Note that Fig. 3(b) shows the velocity profile for the cylinder piston andnot the one denoted as piston and connected to Linear Motor 1 inFig.2(a). However, the timing diagram for the cylinder piston is cal-culated simply through a similarity analysis from the timing diagram ofthe piston connected to the linear motor, which is an input to thesoftware (LinMot Talk 6) controlling the linear motor. In order to be able to reconstruct the whole cylinder volume, theinlet port can be rotated manually so SPIV data at multiple tumbleplanes can be acquired. In such way, there is no need of moving orrecalibrating the PIV cameras. For the present study, 21 consecutivetumble planes with 9°step between them are obtained as shown inFig. 4. The whole cylinder volume is obtained by linear interpolationbetween the acquired planes. The SPIV system is from LaVision GmbH and consists of two high-speed cameras (Imager Pro-HS 4M, 2016 ×2016 px resolution) and aLitron Nd:Yag laser (maximum power per cavity 100 mJ and maximumrepetition rate at 50 Hz). The cameras were positioned at an angle ofapproximately 45° with respect to the object plane. Furthermore, spe-cial adapters were used on both cameras in order to satisfy theScheimpflug criterion. For the seeding of the flow, Vestosint@particlesof 56 um diameter were mixed with the water. The data were taken at asampling frequency of 50 Hz, whereas 50 cycles were obtained forevery plane in order to obtain the phase-averaged flow field. Thenumber of cycles for the phase averaging was decided after calculatingthe correlation coefficient between phase-averaged quantities (e.g.azimuthal velocity) for increasing number of acquired cycles. A totalnumber of 2500 particle images were obtained at each plane and theprocessing of the particle images was performed using DaVis 8.3 byLaVision GmbH, whereas any type of data analysis on the vector fieldswas done using MATLAB. The vector fields were calculated through amulti-pass correlation iteration procedure for increased spatial resolu-tion starting from a 64 × 64 px and decreasing to 16 × 16 px inter-rogation area with 50% overlapping. In order to check the quality of the PIV data the timing profile of thepiston velocity induced by the linear motor (theoretical) is plotted andcompared against the vertical velocity component calculated from themeasured PIV vector fields (experimental) for each piston location andshown in Fig. 5. As can been seen from the results, the agreement isgood which indicates that the PIV correctly provides the flow fieldvelocities. Some small discrepancies exist, which are due to the fact thatthe velocities have been integrated over a smaller cylinder area than the“theoretical” one due to reflections close to the cylinder walls and thevalves. Data were taken using two different cylinder heads provided byScania CV AB, onetwin-inlet port, i.e. one that has two inlets into thecylinder head and one single-inlet port, l.e. one that has one inlet into a) Fig. 2. (a) Schematic of the water-analogue engine model.Linear Motor 1 pushes an elongated piston downwards forcing the water (blue arrows) through a rigidhose, which is connected to the inlet of the cylinder head. The engine piston is floating in the cylinder and is therefore forced upwards. The intake valves areconnected to Linear Motor 2, which is synchronised with Linear Motor 1. (b) The water-analogue engine with the cylinder surrounded by a hexagonal tank forrefractive index matching. The green box depicts the cylinder head provided by Scania CV AB. The water is coming in the cylinder through one or two hoses(depending on the inlet port design) connected to the cylinder head inlet. The linear motor shown in the figure is the one connected to the valves, shown also here.(For interpretation of the references to colour in this figure legend, the reader is referred to the web version of this article.) the cylinder head but were the flow is separated into two ports insidethe head. The ports inside the cylinder head for the twin-inlet port(referred to as twin-port hereafter) were oriented asymmetrically, suchas to create high swirl, whereas the channels for the single-inlet port(referred to as single-port hereafter) were oriented symmetrically andthis configuration will therefore not give any mean swirl but it will stillcreate tumble. The geometry of the two ports is shown in Fig. 6. Theflow is from top to the left in both cases and at the end of the ports theinlet valves are located. Note that the single-inlet port consists of twoseparate channels like the one in the left figure. To see the orientationof the channels inside the cylinder head for the twin-inlet port thereader is referred to Fig. 2b in Vester et al. (2018). In case there is aninterest to compare CFD calculations for validation purposes with theresults reported here these geometries as well as the valve geometry canbe obtained from the first author. The Reynolds number based on the mean piston velocity and thecylinder bore is Re =26000. It is smaller than in a typical Diesel engine(by a factor of about four), but it was not possible to increase the flowrate since cavitation occurred at the inlet ports at higher velocities.However,the Reynolds number was found to have almost no effect onthe large scale structures, which are the main interest in this study, seeVester et al. (2018). 3. Proper orthogonal decomposition (POD) Proper orthogonal decomposition, POD (Berkooz et al.,1993), isnowadays used as a standard tool to filter/analyse PIV data. It is basedon the Karhunen-Loeve theorem and has been existing since long (seefor example the introductory part in Semeraro et al., 2012), however ithas been introduced to turbulence flow research much later, byLumley (1970). It has been shown to be a useful and robust tool todecompose complex flow fields and it has been applied also on in-cy-linder flows (Fogleman et al., 2004). In simple terms, POD ranks the most significant structures in the flow field by energy content and byusing only the most energetic of those features (or modes), it is possibleto reconstruct and obtain an optimal representation of the initial data(see for example Meyer et al., 2007). Since POD has been used ex-tensively the last decade, especially on PIV data, the mathematicalbackground of the technique will not been given here and the reader isinstead referred to Chatterjee (2000) for more information as well as itsimplementation in MATLAB. Regarding engine-related flows, the superiority of POD againstother classical filtering techniques, such as phase-averaging, has beendemonstrated in a few studies during the last few years, see for exampleErdil et al. (2002), Kalpakli et al.(2013)and Vester et al. (2015).PODhas also been successfully used in order to study the transient behaviourof in-cylinder flows as well as cyclic variations (Abrahamson et al.,2015; Kapitza et al., 2009; Voisine et al., 2010). It has been applied toin-cylinder flows in two ways, either on phase-locked data i.e. one ob-tains an optimal basis for each one of the engine phases at which thestatistical sample is considered or through the so-called phase-invariantPOD (Fogleman et al., 2004; Cosadia et al., 2007). Applying a phase-invariant POD does not take into account the phase dependence of themodes and a common basis is obtained for all the phases. The ad-vantage of the phase-invariant POD, which has only been applied in fewstudies so far, is that the amount of samples on which the POD is ap-plied, is much larger compared to when POD is applied on phase-de-pendent data. However, this is mostly advantageous to be used whenthe whole cycle i.e. both intake and compression phases are studiedsince it is particularly useful in understanding instabilities associated tothe tumble vortex breakdown during compression (Fogleman et al.,2004). In the present study, POD is applied on the 3D3C phase-dependentreconstructed data of the swirl flow field for the two inlet ports. Theaim is to compare the most energetic modes for the two inlet ports andidentify the dominating structures underlying the phase-averaged flow fields. POD is applied on totally 50 horizontal slices in the phase-averaged field (containing all three velocity components), which cor-respond to slices along the cylinder when the piston is at its highestposition, i.e. end of stroke. Even though the amount of the sampleswhere POD is applied is not large, however those are also phase-aver-aged fields and therefore POD should converge quite fast, since thesmall-scale turbulence has also been filtered out. For the single-portcylinder head where it is not expected that a clear swirling motion willbe established and the velocity field is expected to be more turbulent, aconvergence test was performed, see Fig. 7. POD was performed usingfrom 30 to 50 velocity fields and it is quite clear that the POD energyspectrum converges well. It is, at the same time, striking how close inenergy content the first two modes are in this case, something whichwill be discussed later in Section 5.3. Also it is noted that the mean flow (represented by the first mode inthe energy spectra) does not contain such a large amount of energy astypically in other type of flows, where usually the first mode capturesmore than 90% of the total energy (Semeraro et al., 2012). Here, thethree first modes seem to be quite significant in energy content and thesecond mode seems to contribute equally to the flow field as the firstmode does, see also Section 5.3. This shows among others the super-iority of POD for identification of structures in such flow fields com-pared to classical statistics, since the mean, for example, in such casewould give the wrong impression about the dominant structures in theflow. It should be highlighted that POD is not used as a filtering tool forthe 3D3C reconstructed flow fields, but to gain a deeper understandingof the coherent structures present in the in-cylinder flow field at the endof the intake stroke. This is of practical importance since this is crucialfor how effective the mixing process is for the following compressionstroke. POD has also been applied on the planar tumble fields, howeverfor the intake stroke POD does not provide any useful results as the flowfield is dominated by the inlet jets (Fogleman et al.,2004). For thetumble planes, POD was only used in order to filter the instantaneousflow fields of each cycle from the unresolved small-scale turbulence,which appears as noise, with the aim to use the reconstructed flowfields in statistical analysis. For details see Section 5.4. 4. Results In the following section results will be presented in terms of velocityvector fields at specific tumble planes as well as the swirl reconstructedflow fields for the two inlet ports. The main focus will be on the velocityfields and to make comparisons between the large-scale structuresgenerated by the two inlet ports as well as how the created swirlingmotion in the cylinder differs when the valves remains static at a lift of15 mm compared to when the valves are moving according to thetiming diagram in Fig. 3. Those observations will serve as a basis for thediscussion section (Section 5), following next. Fig. 8shows the velocity vector field at 0°plane rotation i.e. theplane which is as shown in bright green in Fig. 4. Vector fields are Fig. 4. Schematic of the plane rotation for the 3D3C reconstruction of the cy-linder volume.The plane defined as 0°is the one crossing in-between the valves(coloured light green in the figure). The step between the acquired planes (i.e.the 80) is 9°. The cartesian coordinate system which is used throughout thepaper is also indicated. (For interpretation of the references to colour in thisfigure legend, the reader is referred to the web version of this article.) Time [s] Fig. 5. Timing profile of the piston velocity as induced by the linear motor(black line) and the vertical velocity component (grey crosses) calculated fromthe PIV vector fields obtained for each piston location. The velocities have beenscaled with the mean piston speed calculated from the piston velocity as in-duced by the linear motor. shown for various timings during the intake stroke and for the twin- aswell as single-port, Fig. 8(a) and (b), respectively. The backgroundcolour map indicates the vertical velocity component, whereas thevectors show the in-plane motion, scaled both with the mean pistonvelocity. It should be noted that at this plane only one valve (inlet jet) isvisible. It is observed that until the middle of the stroke the flow fieldsgenerated by the two inlet ports are similar depicting clearly the stronginlet jet and a clear large-scale tumble motion dominating the wholecylinder. The main differences between the flow fields created from thetwo different designs are mostly seen at the end of the stroke, whereclose to the valves the inlet jet has broken down into two medium-sized a) Fig. 3. (a) Timing profiles for the piston location (red line) and valves (blue line). (b) Timing profiles for the piston location (red line) and piston velocity (black line).(For interpretation of the references to colour in this figure legend, the reader is referred to the web version of this article.) Fig. 6. The geometry of the two inlet ports, to the right the single-inlet port(tumble setup) and to the left the double-inlet port (swirl setup) (only one oftwo identical ports are shown). Flow is from top to the left in both cases. Fig. 7. Convergence test for the POD modes. The relative energy of the ei-genvalues is plotted for increasing number of samples: 30 (O), 40 ( ¥),50()velocity fields. Results regard POD performed on the single-port cylinder head. vortices for the twin-port head. Fig. 9 shows the same quantities as theprevious figure, however for the 90° plane. In that plane both inlet jetsare visible. Here, it is obvious that the twin-port generates an anti-symmetric flow field with one of the inlet jets dominating in one direction. This is more clear at t=0.58 sec, where the incoming flowfrom the valve to the right (as seen in the figure) is skewed towards tothe left. This results in a larger vortex generated from the valve posi-tioned to the right, which is“pushing”a smaller vortex created as theflow enters from the valve positioned to the left of the figure. On thecontrary, the single-port creates a symmetric flow field within the planeaxis with no directions preference of the inlet jets. Two, almost per-fectly similar vortices are generated from the valves, which retain theirshape and symmetry during the whole stroke. This clearly indicates thatfor the twin-port a swirl motion can be created by directing one of theinlet jets. In Fig. 10 the swirl flow fields at various cylinder cross-sections areshown after a 3D3C reconstruction of the flow field has been donebased on the acquired 21 tumble planes. The azimuthal velocity isplotted as a colour map, whereas the in-plane motion is shown asstreamlines on top. Results are shown for both cylinder heads at thesame time instants during the stroke. The flow fields generated from thetwo cylinder heads are significantly different and it is obvious that atthe end of the stroke a well-defined swirl motion has been establishedfor the twin-port, whereas for the single-port the highest cylinder cross-section depicts two, almost symmetrical, vortices with opposite rotatingdirections. The swirl motion generated by the twin-port cylinder headrotates in the anti-clockwise direction. Throughout the whole stroke thesingle-port depicts a more complex and turbulent flow field than thetwin-port cylinder head, which on the other hand appears to be morecoherent. Fig. 11shows the same quantities as in the previous figure but in thiscase the flow field created by the twin-port cylinder head when thevalves are moving is compared to the flow field created by the sameinlet port when the valves are static at a valve lift of 15 mm. It is clearthat at the beginning and until the mid-intake stroke the differences arenot so profound between the two cases, however the observed struc-tures are quite different after the middle of the stroke. At the end of thestroke, which is the most interesting moment due to the importance inthe compression process following, it is obvious that a coherent swirlmotion is dominating the whole cylinder for the fixed valve case. Forthe moving valve case, a clear swirl motion appears to form after somedistance from the valves, whereas a cross-section at approximately0.03 m distance from the valves depicts two, almost symmetric, large-scale vortices. At the top cylinder cross-section a clear swirl motion has Fig. 8. Flow fields showing the tumbleplane at 0°of plane rotation for dif-ferent timings. The grey rectangle in-dicates the piston location, whereas they-axis indicates the stroke length inmeters. Background contour map in-dicates the vertical velocity scaled bythe mean piston speed, whereas vectorsshow the in-plane velocity. The sket-ches of the valve indicate the valveposition at the specific time instant.Results here are shown for movingvalves according to the timing diagramin Fig. 3(a) and for the (a) twin-portand (b) single-port cylinder head. Fig. 9. Flow fields showing the tumbleplane at 90° of plane rotation for dif-ferent timings. The grey rectangle in-dicates the piston location, whereas they-axis indicates the stroke length inmeters. Background contour map in-dicates the vertical velocity scaled bythe mean piston speed, whereas vectorsshow the in-plane velocity. The sket-ches of the valve indicate the valveposition at the specific time instant.Results here are shown for movingvalves according to the timing diagramin Fig. 3(a) and for the (a) twin-portand (b) single-port. been established in both cases, however for the fixed valve case, theswirling motion appears to be more located towards the cylinder centre,compared to the moving valve case. 5. Discussion In the following section, a quantitative analysis of the data will beperformed and discussed in terms of circulation and classical statisticsas well as POD, which will lead to a better understanding of the gen-eration of the flow structures by the two cylinder heads and theirevolution during the intake stroke. The aim is to understand how theassumption of fixed valve lift as well as the choice of inlet port design(creating either high swirl or only tumble), might affect the results andconclusions on engine efficiency. It has been a common practise in in-dustry to perform tests with fixed valve position (Rabault et al., 2016)as well as that numerical simulations are performed with static valvesand in cases where moving valves are simulated it is problematic tosimulate the first part of the opening and also the final closing partSoder. However, there has not been any reported efforts to study howthe in-cylinder flow changes when such assumptions and practises aremade. Furthermore, only few studies investigated different inlet portdesigns and how those can affect mixing, even though the shape of theinlet port is the one that defines the resulting large-scale motions. 5.1. Circulation statistics In an effort to quantitatively show how the choice of inlet portdesign as well as the timing profile of the valves affects mixing, thecirculation was calculated for the various flow cases reported here i.e.for the two inlet ports as well as for moving and fixed valves for thetwin port at specific timings during the stroke. The circulation (T) of the velocity field V is defined as the integral ofthe vertical vorticity component (ωz) alonga curve C and was calcu-lated here similarly to Cosadia et al. (2006) as: where the vertical vorticity is integrated over an area A and the curve Cis a circle in the horizontal plane around the centreline of the cylinder. Fig. 12shows the circulation calculated at different timings duringthe intake stroke for five different radius distances and for the case ofmoving valves. In agreement with the visualisations of Fig. 10 (left subplots), the circulation decreases with increasing cylinder radius atthe beginning of the stroke when the piston is located close to thevalves, whereas it gradually increases as the piston moves after the firstquarter of the intake stroke, reaching a maximum at a cylinder radius of0.06 m and having almost the same high values at the cylinderboundaries (i.e. radius of 0.065 m). Fig. 13shows the circulation calculated for the flow fields shown inFig. 11(c) i.e. along the cylinder radius R for a time instant corre-sponding to the end of the intake stroke, where the swirling motion isestablished. The circulation is calculated for four different cylindercross-planes, for moving (left subplot of Fig. 11c) and fixed valves of15 mm (right subplot of Fig. 11c). In general the shape of the circula-tion curves indicates (with the only exception the curve correspondingto the cross-section closest to the valves) that the circulation graduallyincreases along the radius of the cylinder reaching a maximum value ata radius of 0.06 m. For the cross-planes closest to the top of the cylinderthere is not much difference in the circulation between the moving andfixed valve case. This is also found from the three-dimensional plots inFig. 11c), where it is observed that in both cases a well-establishedswirling motion exists. For the cross-planes closer to the valves, there is a large difference inthe calculated circulation. For the fixed valves, the amount of circula-tion along the cylinder radius remains almost at the same level as forthe higher cylinder cross-planes, whereas for the moving valves it ismuch lower.This is somehow in agreement with the visualisation of thethree-dimensional flow fields in Fig. 11(c) as it is clear that for the fixedvalve case a swirling motion has already been established at the bottomof the cylinder and close to the valves, whereas for the moving valvecase, two large-scale vortices exist closer to the valves instead. Thisindicates that with keeping the valves fixed at 15 mm throughout thewhole stroke, a well-formed and more ordered swirling motion andconsequently higher levels of circulation are kept through the wholecylinder volume at the end of the stroke. This has probably a positiveeffect on combustion, since a well-organised swirl motion is expected tolead to better mixing due to the higher levels of energy associated to themotion, compared to incoherent turbulence. Similar findings were re-ported recently by Rabault et al. (2016) who performed multi-planarSPIV experiments at different fixed valve lifts but in a through flowsetup i.e. without a piston. They concluded that higher valve lifts resultinto stronger and more regular flow structures, including the swirlingone. Nevertheless, in that work no experiments with moving valveswere performed and the results leading to the above conclusions were 016 0.16- -0.06 z/m/ -006 -0.06 z[m/ -006 c) x/m) x[m/ -2 -1 0 2 W/U. Fig. 10. 3D3C reconstruction of the swirling motion from the SPIV measurements taken at 21 planes, shown for various cylinder cross-sections and for three pistonlocations during the intake stroke. The piston is positioned at (a)y=0.093 m,(b)y= 0.13 m and (c)y =0.16 m (indicated by a black asterisk on the y-axis). Resultshere are shown for moving valves and the (left) twin-port and (right) single-port cylinder head. Dashed black lines indicate the origin of the cylinder (passing throughthe centre), whereas the two valves are also shown according to the timing diagram in Fig. 3(a). Contours indicate the azimuthal velocity scaled by the mean pistonspeed, whereas streamlines are the in-plane velocity. -0.06 -0.06 c) z/m/ -0.06 x/m/ z[m] -0.06 x[m -3 -2 -1 / 2 W/U Fig. 11. 3D3C reconstruction of the swirling motion from the SPIV measurements taken at 21 planes, shown for various cylinder cross-sections and for three pistonlocations during the intake stroke. The piston is positioned at (a)y = 0.093 m, (b)y= 0.13 m and (c)y =0.16 m (indicated by a black asterisk on the y-axis). Resultshere are shown for the twin-port cylinder head and for (left) moving valves according to the timing diagram in Fig.3(a) and (right) fixed valve lift of 15 mm. Dashedblack lines indicate the origin of the cylinder (passing through the centre), whereas the two valves are also shown according to the timing diagram in Fig. 3(a).Contours indicate the azimuthal velocity scaled by the mean piston speed, whereas streamlines are the in-plane velocity. Fig. 12. Circulation calculated at different piston heights (i.e. timings for fivedifferent radius distances. Results are shown for the twin-port cylinder headand moving valves. Increasing colour intensity indicates increasing radius dis-tance (R =0.03,0,04,0.05,0.06 and 0.065 m). obtained far from the cylinder cross-section that corresponds to the endof the intake stroke. 5.2. Volumetric isosurfaces In this section the full volumetric flow field is visualised in order toobtain a global understanding of the created structures from the twoinlet ports in 3D space. This complements the cross-plane plots inFig. 10 where information on the flow field at specific cylinder heightsis shown. Fig. 14presents volumetric plots (iso-surfaces) of the azimuthal(Fig. 14(a)) and the vertical (Fig.14(b)) velocity component for thetwin-port cylinder head, whereas Fig. 15 shows the same quantities forthe single-port cylinder head. The results shown here are from the endof the intake stroke, i.e. when the piston is located at the top of thecylinder (y=0.16 m) and the valves are fully closed. It is obvious thatthe two inlet ports create flow fields that strongly differ with respect tothe coherent motions. The twin-port cylinder head creates structuresthat seem to be more ordered and well-defined. Fig. 14(a) shows, forexample, a well-established swirl motion rotating anti-clockwise andoccupying more than half of the cylinder in height. In contrast, there isno clear coherent motion created by the single-inlet port cylinder head,as apparent from the isosurface plot in Fig. 15(a) but rather an almostsymmetric flow field with two large-scale vortices appearing at the toppart of the cylinder. On the other hand, both cylinder heads seem tocreate a clear tumble motion as apparent from the three-dimensional a) surface plots of the vertical velocity component in Figs. 14(b) and15(b). For the single port it appears that the created tumble field ismore symmetric i.e. the same amount of negative (downward) andpositive (upward) motion exists in the cylinder volume close to thecylinder wall. This could be somehow expected from how the two cy-linder heads are designed and is in agreement with the cross-plane plotsshown in Fig. 10(c). The way the above created flow fields may affect the mixing andtherefore the combustion efficiency is not perfectly clear, however ithas been known that high swirl might lead to higher efficiency, due tothe fact that it is known to dissipate slower than tumble. Depending onthe piston geometry, the timing instant at which swirl breaks intoturbulence can also be controlled, whereas tumble in reality alwaysbreaks down as the piston hits top-centre due to the lack of space be-tween the piston crown and the cylinder head (Lumley, 1999). Fur-thermore, comparing the two inlet ports, it is also known that swirlingflow (or flow that consists of ordered coherent structures) is generallymore stable and does not dissipate into small-scale turbulence as fast asunstructured turbulent flow, as obtained by the single-port cylinderhead. Last but not least, flow fields presenting coherent large-scalestructures might lead to fewer cycle-to-cycle variations, which will bediscussed in the following sections (Sections 5.3 and 5.4) with the aid ofproper orthogonal decomposition and classic statistical analysis. 5.3. POD analysis In the present section, the large-scale structures will be investigatedwith the help of proper orthogonal decomposition. As explained alreadyin Section 3, POD is a powerful tool which here will be used primarilyas a robust way to decompose the flow fields created by the two cy-linder heads with both moving and fixed valves. The aim is to in-vestigate the most energetic structures captured by the first spatial PODmodes at the end of the intake stroke for the different flow cases as theywill play an important role in the compression phase, which followsafter the intake stroke studied here. It is generally known that thehigher the percentage of energy in the first mode, the more organisedthe associated flow field is (Fogleman et al., 2004) and that might af-fect, for example, cycle-to-cycle variation. Fig. 16shows the three most energetic spatial modes (the first re-presenting the mean flow field) for three flow cases; namely for thetwin-port (Fig. 16(a)) and the single-port cylinder head (Fig. 16(b))when the valves are moving, as well as for the twin-port cylinder headwhen the valves are fixed at a lift of 15 mm (Fig.16(c)). The POD hasbeen applied on the various cylinder cross-sections (in total 50) whenthe piston is at its highest position (end of the intake stroke). As alreadymentioned in Section 3 this is a quite unique way to apply POD, Fig. 14. Iso-surfaces of the (a) azimuthal velocity and(b) vertical velocity component for the twin-port cy-linder head. The isovalue is set to 0.5 xU. Bluecolour indicates negative values, whereas red colourindicates positive values. (For interpretation of thereferences to colour in this figure legend,the reader isreferred to the web version of this article.) basically “in space”, treating the various swirl flow fields along thecylinder as time series. The aim is to gain a global view of the mostdominant flow structures created by the different flow parameters andcylinder head designs through the whole cylinder volume. As alreadyexplained, the analysis considers the end of the intake stroke, whichfrom a practical point of view is the most important since it can beviewed as the initial condition for the compression stroke that sets upthe flow field prior to combustion. For the twin-port cylinder head when the valves are moving,Fig.16(a), the most dominant structure (denoted as mode 0 in Fig 16),which corresponds also to the average of the 50 flow fields for whichPOD was applied, at the end of the stroke is a “bean-shaped”swirlmotion, with its centre off the cylinder axis. Its energy content is ap-proximately 53% of the total energy, shown in Fig. 17, where the en-ergy content of all modes is plotted together with the cumulative sumfor all flow cases shown in Fig. 16. However, the second mode is alsohigh in energy content, slightly more than 30%, whereas thereafter thethird mode drops significantly and the observed structures in this modeare not as well-defined. The energy content of the first and second PODmodes for the single-inlet port cylinder head, Fig. 16(b),is almost thesame, 38% for the first mode and 35% for the second one, whereas thethird mode in this case is also quite high in energy content at 17%. Thefirst mode depicts two, almost symmetrical, vortices, whereas thesecond mode looks like a“footprint”of the first one and the third modeis almost identical to the second one but it appears to be less“smooth”.This shows that the two or three first modes for the cylinder heads areimportant and should be taken into consideration. This shows the su-periority of POD in such flow cases compared to classical statistics since calculating the mean in such a case would give a wrong impression (i.e.what mode 0 in Fig. 16 shows) of the most dominant features in theflow field. For the fixed valve case, Fig. 16(c), the first mode depicts a well-shaped swirl with its centre almost coinciding with the centreline of thecylinder. In contrast to what has been said for the two other showncases, here the first mode is capturing almost 80% of the total energy,whereas the energy drops substantially after the second mode whichcaptures approximately 10% of the total energy. This is more accordingto what a typical POD energy spectrum looks like for other kinds offlows, where the first mode corresponding to the mean usually captures80-90% of the total energy (Semeraro et al., 2012). From the PODanalysis here it appears that when the valves are fixed at 15 mm, a morewell-shaped swirling motion dominates the in-cylinder flow field,which has a higher energy content than the swirl created when thevalves are moving. This is in agreement with the visualisation in Fig. 11(c), where inthe case of the 15 mm fixed valve lift, a clear swirling motion has al-ready appeared to form close to the valves, which is not the case for themoving valve case. It is quite clear to see from the above analysis thatthe latter case (i.e. 15 mm fixed valves) is probably the most effectivewhen it comes to better mixing and thereby combustion. Even thoughonly the end of the intake stroke could be studied here, it can be ex-pected that since in this case most of the energy is captured by a well-organised swirling motion that will be retained longer into the com-pression phase, as compared to the other two cases where there is noclear dominant structure but the flow pattern appears to be morecomplex throughout the cylinder volume. Fig. 15. Iso-surfaces of the (a) azimuthal ve-locity and (b) vertical velocity component forthe single-port cylinder head. Blue colour in-dicates negative values, whereas red colourindicates positive values. (For interpretation ofthe references to colour in this figure legend,the reader is referred to the web version of thisarticle.) Mode 0 Mode l Mode 2 0.065 -0.065 -0.065 0 0.065 c) x[m Fig. 16. The first three POD spatial modes as sectional streamlines for the swirl reconstructed flow field at y= 0.16 m. Results are shown for the (a) twin-port (b)single-port with moving valve case and (c) the twin-port with fixed valve lift of 15 mm. Fig.17. Number of modes needed to reconstruct 95% of the total kinetic energy(symbols) and cumulative sum of the relative energy content of the modes(symbols connected with lines). Results are shown for the twin-port cylinderhead for moving (circles) and fixed valves of 15 mm (squares) as well as thesingle-port (diamonds) cylinder head for moving valves. 5.4. Flow field variations between the cycles In the following section the variations in the flow from cycle to cyclewill be investigated for various fixed valve lifts as well as for the twodifferent cylinder heads. The aim is to gain a better understanding how various flow parameters affect the variations, that unavoidably occur insuch flows in the different cycles. Such findings can be of particularinterest to the CFD community, since as already mentioned it iscommon practise that the whole timing profile of the valves cannot besimulated or that simulations are run under fixed valve conditions.Moreover, it gives an insight into the flow physics of the in-cylinderflow under different conditions, which could be exploited in futureinlet-port designs. First, flow fields at various fixed valve lifts are compared to the flowfield captured when the valves are moving according to the diagram inFig. 3, in order to show the effect of valve lift on the flow structures inthe tumble plane. Fig. 18, shows flow fields acquired at the 0° plane andfor a field-of-view capturing up to approximately 0.1 m of the totalcylinder height. This was done in order to focus on a smaller area closerto the valves and obtain better-resolved data for the various cases inorder to identify the difference in the flow structures there. Flow fieldsof the vertical velocity component, such as the background contourmap and the in-plane motion as vectors, are shown for moving valves aswell as fixed valve lift of 5 mm, 10 mm and 15 mm at various instancesduring the intake stroke. The larger differences between the cases areobserved mainly at the end of the stroke, whereas at the beginning allcases are quite similar, probably due to the strong jets entering thecylinder which dominate in the flow field. The biggest discrepancies areshown also between the moving valves and the fixed valve case of 5 mmat the end of the stroke, which is probably expected since for the lattercase the area from where the fluid enters the cylinder is for most of the Fig. 18. Flow fields showing the tumble plane at 0°of plane rotation for different timings. The grey rectangle indicates the piston location, whereas the y-axisindicates the stroke length in meters. Background contour map indicates the vertical velocity scaled by the mean piston speed, whereas vectors show the in-planevelocity. Results here are shown for the twin-port and for a smaller field of view closer to the valves (up to a height of approximately 0.1 m) for (a) moving valves andfixed valve lift of (b) 5 mm, (c) 10 mm, (d) 15 mm. cycle smaller than in the first case, and consequently larger velocitiesand higher levels of turbulence are expected to occur. On the contrary,similar characteristics throughout the whole cycle are observed be-tween the moving valve case and the fixed valve case of 15 mm.However, since again at the end of the stroke the valves are closing andthe flow is entering the cylinder through a smaller area for the movingvalve case, higher velocities are observed in that case. The created flowstructures are nevertheless similar between the two cases. In order to investigate in which of the above cases the flow varia-tions between the 50 obtained cycles have the largest spread, theprobability density function (pdf) distributions of the out-of-planecomponent at a cross-plane height of 0.06 m and for each cycle wascalculated. The pdf distributions (scaled with each maximum) areplotted as grey contours along with the corresponding mean (red line)and root-mean-square (r.m.s. ) distributions (magenta line) in Fig. 19,for each case shown in Fig. 18 at a timing corresponding to t=0.82 s.Note that the statistics were calculated on the POD reconstructed timeseries based on the first five modes corresponding to more than 75% ofthe total energy of the flow field. This was done in order to filter out some of the small-scale turbulence which could not be resolved by thePIV and appears as noise in the final results. It is clear that the pdf in the 5 mm fixed valve case is wider than inthe other cases. The r.m.s. distribution is also at a higher level along thecylinder diameter for that case compared to the rest of the cases. For themoving valves and 15 mm valve case the pdf distributions are quitesimilar and denote the least variations with the pdfs being accumulatedaround the mean profile. For the 15 mm fixed valve case, slightly lessvariations are indicated by the spread of the pdfs. This is also inagreement with the flow fields in Fig. 11, where it can be seen thatwhen the valves are fixed at 15 mm, the flow field in the cylinder isoccupied faster by organised coherent structures, such as swirl, whichleads to less turbulence and hence cycle-to-cycle variations. This canalso be related to what the POD analysis showed for the two cases, seeSection 5.3, i.e. that for the 15 mm case the swirl is more well-definedand higher in energy occupying the flow field to a larger extent than forthe moving valve case. Looking at the plots for the 5, 10 and 15 mmfixed valve cases, it is obvious that the more the valves close, the largerthe spread of the pdf and the variations from the mean value. This could PDF 0.8 0.6 0.4 0.2 0 b) x[m] 1 0.8 0.6 0.4 0.2 0 c) x[m Fig. 19. Contour plots of the probability density function of the out-of-plane velocity component along the horizontal axis corresponding to a cylinder cross-section of0.06 m, at the timing of 0.82 s (see previous figure). Plotted together with its mean (red line) and r.m.s. (magenta line) value scaled by the mean piston speed. Resultshere are shown for the 0° plane of rotation, twin-port inlet cylinder head and for a smaller field of view closer to the valves (up to a height of approximately 0.1m, seeprevious figure) for (a) moving valves and fixed valve lift of (b) 5 mm, (c)10 mm, (d) 15 mm. Note that the PDFs have been scaled to unity in order to easecomparison between the cases. Grey dashed lines ease comparison of the various r.m.s. values between the cases. (For interpretation of the references to colour in thisfigure legend, the reader is referred to the web version of this article.) The same type of analysis as above is also performed to investigatewhich one of the two inlet port designs gives larger cycle-to-cyclevariations and the results are shown in Fig. 20.It is obvious that the pdfdistributions for the single-port cylinder head have more spread,whereas the r.m.s. is always at much higher levels compared to the one b) x[m] Fig. 20. Contour plots of the probability density function of the out-of-plane velocity component along the horizontal axis corresponding to a cylinder cross-section of0.06 m, at the timing of 0.82 s (see previous figure). Plotted together with its mean (red line) and r.m.s. (magenta line) value scaled by the mean piston speed. Resultshere are shown for the 0° plane of rotation, moving valves and for (a) the twin-port and (b) single-port inlet cylinder head. Note that the PDFs have been scaled tounity in order to ease comparison between the cases. Grey dashed lines ease comparison of the various r.m.s. values between the cases. (For interpretation of thereferences to colour in this figure legend, the reader is referred to the web version of this article.) for the twin-port cylinder head. That means that designing ports in sucha way as to create coherent structures in the flow such as swirl, give lessvariations in the flow from cycle to cycle. Compared to small-scaleturbulence that varies highly from cycle-to-cycle an organised motionwill probably provide better mixing since it will take a longer time for itto dissipate as compared to small-scale turbulence and will retain itsenergy in the mixing process longer. 6. Summary and conclusions The present work presents for the first time a quantitative andqualitative study of the in-cylinder flow field created by two differentinlet port designs. Visualisations of the three-dimensional flow field aswell as modal and statistical analysis has been employed in order tofully understand the flow physics in the cylinder of a specially-designedwater-analogue engine. This is also the first time that such an apparatusof generic nature is being built and put into operation, where essentialparts that affect the created flow field in the cylinder, such as inlet port,timing profiles and piston geometry can easily be changed and tested.The unique apparatus allows for highly resolved, whole-field mea-surements and the acquisition of the three-dimensional flow fieldduring the intake stroke either with multi-planar measurements as donein this work or with tomographic measurements in the future, as itprovides easy optical access. Within the present work frame, the water-analogue engine wasmodified in order to test two prototype inlet port designs. One of theports (twin-port) was designed in such a way as to create high swirl,whereas the other one (single-port) was expected to create mainlytumble. Multi-planar SPIV measurements performed at 21 equally-spaced tumble planes around the cylinder made it possible to re-construct the volumetric flow field by a 3D3C reconstruction usinglinear interpolation between the acquired planes. Furthermore, one ofthe main goals of this work was to assess for the first time the commonpractise made in tests in industry but also in simulations, that the valvesare fixed at some position. Visualisations of 2D flow fields acquired incertain tumble planes around the cylinder showed small differencesbetween the fixed and moving valve case for the twin-port, howeverwhen the whole three-dimensional flow field was reconstructed it wasclear that for the fixed valve case a more well-organised swirling mo-tion was established through the whole cylinder at the end of thestroke. This was further supported by circulation statistics, where it wasshown that the circulation along the cylinder is higher at the end of thestroke when the valves are fixed, compared to when the valves aremoving. Furthermore, POD analysis performed at the end of the strokeand for 50 cross-planes along the cylinder height, showed that the mostdominant structure with 80% of the total energy when the valves arefixed, is a swirling motion with its centre almost coinciding with thecylinder’s centre. On the other hand for the moving valve case, theswirling motion is not as energetic and it appears to exist together withother, not as well-organised, structures that have the same level ofenergy as the swirl. The above analysis is used to additionally in-vestigate in which case higher cyclic variations in the flow are ex-pected. Results also included the pdf distributions of the out-of-planecomponent velocity profile at a certain height of the cylinder at a timingiust before the stroke ends. It was shown that due to the coherent flowfield when the valves are fixed at 15 mm, the pdfs are less spread andaccumulated mostly around the mean profile, whereas the r.m.s. levelwas lower as compared to the moving valve case. On the contrary, if thevalves are kept fixed at lower lifts (10 and 5 mm), the pdfs becomewider with decreasing lift. The r.m.s. values are also higher comparedto the moving valve case, showing larger cycle-to-cycle variations in theflow. The largest variations in the flow were however found for the single-port, where both visualisations and POD analysis revealed an in-coherent and highly turbulent flow field. No clear dominant structure was shown from the POD but rather the first two POD modes werealmost identical in energy content and the third one was also high. Insuch a case, the mean field would provide a wrong impression of themost dominant structure throughout the cylinder at the end of thestroke, which shows the superiority of POD compared to classical sta-tistics. Comparing the pdfs for the two cylinder heads the differences ofthe distributions are profound, with the pdfs for the single-port showingmuch more spread than for the twin-port. From the above it is madeclear that the twin-port cylinder head with the valves fixed at 15 mmwill give less cycle-to-cycle variations. It gives rise to a more coherentflow field consisting of a well-formed strong swirling motion as com-pared to the moving valves case. The results of this study are believed to be of utmost importance toindustry as well as to the CFD community, when tests or simulations arerun for studying various inlet port designs for fixed valve lift or whenthe timing profile of the valves cannot be fully simulated. Furthermore,the unique water-analogue engine is made to serve as a generic testbench to obtain flow fields created by other inlet port designs as well asfor investigating parameters, such as valve lift timings, piston geo-metry, that also contribute to a better mixing and combustion processand in consequence, into producing more efficient engines. Acknowledgements The present work is part of a vehicle-strategic research and innovation(in Swedish: Fordonstrategisk Forskning och Innovation, FFI) projectentitled Experimental Investigation of the In-Cylinder Flow During theIntake Stroke. This project is a cooperation between the Swedish EnergyAgency, Scania CV AB, Volvo GTT and KTH. Dr. Bjorn Lindgren fromScania CV AB is particularly thanked for providing the cylinder heads.The authors thank Dr. N. Tillmark for playing a key role in the design ofthe setup. The authors would also like to thank the Odqvist laboratoryfor experimental mechanics at KTH Mechanics that provided the PIVequipment. The first author would also like to thank Bengt Ingestromsstipend for the financial support during her visit to Tohoku university.The second author would like to thank the Graduate School ofEngineering, Tohoku University for the financial support during his 10-months stay at KTH and JSPS Core to Core Program for giving him anopportunity of discussion with KTH members. ( References ) Abrahamson, S., Yang, X., Gupta, S., Kuo,T.W., Reuss, D., Sick, V., 2015. Flow-patternswitching in a motored spark ignition engine. Int. J. Eng. Res. 16, 323-339. Arcoumanis, C., Bicen, A.F., 1983. Squish and swirl-squish interaction in motored modelengines. J. Fluids Eng. 105, 105-112. Arcoumanis, C., Vatidis, C., Whitelaw, J.H., 1987. Valve and in-cylinder flow generatedby a helical port in a production diesel engine. J. Fluids Eng. 109,368-475. Baum, E., Peterson, B., Bohm, B.,Dreizler, A., 2013. On the validation of LES applied tointernal combustion engine flows: Part 1: comprehensive experimental database.Flow Turbul. Comb. 92, 269-297. Baumann,M., Mare, F.d., Janicka, J., 2013. On the validation of large eddy simulationapplied to internal combustion engine flows part II: numerical analysis. Flow Turbul.Comb.92, 299-317. Berkooz, G., Holmes, P., Lumley, J.L., 1993. The proper orthogonal decomposition in theanalysis of turbulent flows. Annu. Rev. Fluid Mech. 25, 539-575. Boree, J., Maurel, S., Bazile, R., 2002. Disruption of a compressed vortex. Phys. Fluids 14.2543 Boree, J., Miles, P.C., 2014. In-Cylinder Flow. John Wiley & Sons, Ltd, Chichester, UK. Biicker, I., Karhoff, D., Dannemann, J., Pielhop, K., Klaas, M., Schroder, W., 2013. Comparison of PIV measured flow structures in two four-valve piston engines.Springer, Berlin, Heidelberg, pp. 633-640. Biicker,I., Karhoff, D.C., Klaas, M.,Schroder, W., 2012. Stereoscopic multi-planar PIVImeasurements of in-cylinder tumbling flow. Exp. Fluids 53, 1993-2009. Celik, I.B., Yanuz, I., Smirnov, A., 2001. Large eddy simulations of in-cylinder turbulencefor internal combustion engines: a review. Int. J. Eng. Res.2. 119 Chatterjee, A., 2000. An introduction to the proper orthogonal decomposition. Curr. Sci.78,808-817. Corcione, F.E.,Valentino, G., 1994. Analysis of in-cylinder flow processes by LDA. Comb.Flame 99, 387-394. Cosadia, I., Boree, J., Charnay, G., Dumont,P., 2006. Cyclic variations of the swirling flowin a diesel transparent engine. Exp. Fluids 41, 115-134. Cosadia, I., Boree,J., Dumont, P., 2007. Coupling time-resolved PIV flow-fields and phase-invariant proper orthogonal decomposition for the description of the para-meters space in a transparent diesel engine. Exp. Fluids 43, 357-370. Dannemann, J., Klaas, M., Schroder, W., 2010a. Three dimensional flow field within afour-valve combustion engine measured by particle image velocimetry. ISFV14-14thInt. Symp. Flow Vis., June 21-24, EXCO Daegu, Korea. Dannemann, J., Pielhop, K., Klaas, M., Schroder, W., 2010b.Cycle resolved multi-planarflow measurements in a four-valve combustion engine. Exp. Fluids 50, 961-976. Erdil, A., Kodal, A., Aydin,K., 2002. Decomposition of turbulent velocity fields in an SIengine. Flow Turbul. Comb.68,91-110. Fogleman, M., Lumley, J., Rempfer, D., Haworth, D., 2004. Application of the properorthogonal decomposition to datasets of internal combustion engine flows. J.Turbul.5. N23 Freudenhammer,D., Baum, E., Peterson, B., Bohm, B., Jung, B., Grundmann, S., 2014.Volumetric intake flow measurements of an IC engine using magnetic resonancevelocimetry. Exp. Fluids 55. 1724-18.m HessD., Britsch, H., Briicker, C.,2010.3-d scanning PIV of the flow within a two-strokewater analogue combustion engine. 15th Int. Symp. Appl. Laser Techniq. Fluid Mech,Lisbon,Portugal, 5-8 July. Hess, D., Tag,S., Bruicker, C., 2012. Volumetric flow studies in a 4-stroke water-analogueIC-engine using high-speed scanning-PIV. 16th Int. Symp. Appl. Laser Techniq. FluidMech, Lisbon, Portugal, 9-12 July. Heywood,J.,1987.Fluid motion within the cylinder of internal combustion engines-the1986 freeman scholar lecture. J. Fluids Eng. 109, 3-35. Kalpakli, A., Orlu, R., Alfredsson, P.H., 2013. Vortical patterns in turbulent flow down-stream a 90° curved pipe at high womersley numbers. Int. J. Heat Fluid Flow 44,692-699. Kalpakli Vester, A.,Nishio, Y., Alfredsson, P.H., 2018. Unraveling tumble and swirl in aunique water-analogue engine model. J. Vis. 21, 557-568. Kalpakli Vester, A., Orlu, R., Alfredsson, P.H., 2015. Pulsatile turbulent flow in straightand curved pipes -interpretation and decomposition of hot-wire signals. FlowTurbul. Comb. 94, 305-321. Kapitza, L., Imberdis, O., Bensler, H.P.,Willand, J., Thevenin, D., 2009. An experimentalanalysis of the turbulent structures generated by the intake port of a DISI-engine. Exp.Fluids 48, 265-280. Karhoff, D.C., Buicker, I., Klaas, M., Schroder, W,, 2013. Time-resolved stereoscopic PIVmeasurements ofS OcIy Gclic variations in an internal combustion engine. 10th Int. Symp.Particle Image Velocimetry-PIV13,July 1-3 2013, Delft, The Netherlands. Khalighi, B., 1991. Study of the intake tumble motion by flow visualization and particletracking velocimetry. Exp. Fluids 10, 230-236. Khalighi, B., Huebler, M.S., 1988. A Transient Water Analog of a Dual-Intake-Valve Engine for Intake Flow Visualization and Full-Field Velocity Measurements. SAET1a pech. rep., Warrendale, PA Koehler, M., Hess, D., Briicker, C., 2015. Flying PIV measurements in a 4-valve IC enginewater analogue to characterize the near-wall flow evolution. Meas. Sci. Technol. 26,125302. Koehler, M., Hess, D., Kratzsch, C., Bricker, C., 2014. Flying PIV measurements in adriven IC engine flow. 17th Int. Symp. Appl. Laser Techniq. Fluid Mech., Lisbon,Portugal, 7-10 July. Lumley, J.L.,1999. Engines-An Introduction. Cambridge Univ. Press. Lumley, J.L., 1970. Stochastic Tools in Turbulence. Academic Press, New York. Lumley, J.L., 2001. Early work on fluid mechanics in the IC engine. Annu. Rev. FluidMech. 33, 319-338. Meyer, K., Pedersen, J.M., Ozcan, O., 2007. A turbulent jet in crossflow analysed withproper orthogonal decomposition. J. Fluid Mech. 583, 199-227. Morse, A.P., Whitelaw, J.H., Yianneskis, M., 1979. Turbulent flow measurements by laser-doppler anemometry in motored piston-cylinder assemblies. J. Fluids Eng. 101,208-216. van Overbriggen, T., Bahl, B., Dierksheide, U., Klaas, M., Schroder, W., 2013. Tomographic particle image velocimetry in an IC engine. 10th Int. Symp. ParticleImage Velocimetry-PIV13, Delft, The Netherlands, July 1-3, 2013. pp. 1-7. van Overbriiggen, T., Dannemann, J., Klaas, M., Schroder, W., 2013. Holographic particleimage velocimetry measurements in a four-valve combustion engine. Exp. Fluids 55.1634-13 Rabault, J., Vernet, J.A., Lindgren, B., Alfredsson, P.H., 2016. A study using PIV of the intake flow in a diesel engine cylinder. Int. J. Heat Fluid Flow 62, 56-67.Semeraro, O., Bellani, G., Lundell, F., 2012. Analysis of time-resolved PIV measurements of a confined turbulent jet using POD and Koopman modes. Exp. Fluids 53,1203-1220. Soder, M., 2015. Creation and Destruction of In-Cylinder Flows; Large Eddy Simulationsof the Intake and the Compression Strokes, Stockholm, Sweden. Phd Thesis. Towers, D.P., Towers, C.E., 2004. Cyclic variability measurements of in-cylinder engineflows using high-speed particle image velocimetry. Meas. Sci. Technol. 15,1917-1925. V. Pajkovic, R., S. Petrovic, V., 2008. Spatial flow velocity distribution around an inletport/valve annulus. Therm. Sci. 12, 73-83. Voisine, M., Thomas, L., Boree, J., Rey, P., 2010. Spatio-temporal structure and cycle tocycle variations of an in-cylinder tumbling flow. Exp. Fluids 50, 1393-1407. Yu, R., Bai, X.S., Hildingsson, L., Hultqvist, A., Miles, P., 2006. Numerical and Experimental Investigation of Turbulent Flows in a Diesel Engine. SAE Tech. paper.01-3436 https://doi.org/j.ijheatfluidflow. Flow structures created during the intake stroke of an engine were investigated by means of multi-planar particle image velocimetry (PIV). A unique water-analogue engine model has been developed, where all essential parts and parameters, such as the cylinder head, valve timing, piston geometry and motion, etc. can easily be modified. Two cylinder heads with geometrically different inlet ports were investigated and experiments were performed with both moving and fixed valves. Three-dimensional visualisations of the flow field, mode decomposition through proper orthogonal decomposition, circulation as well as classical statistics were obtained and evaluated in order to gain an understanding of the flow structures, i.e. tumble and swirl, created by the two cylinder heads. It was clearly shown that one of the cylinder heads created a strong swirling motion in the cylinder. Three different fixed valve positions were investigated and the fully opened valve gave the strongest large-scale structures, whereas with smaller openings a larger amount of the kinetic energy was converted into small-scale turbulence. Results showed a more organised and stable flow field consisting of a well-defined swirl motion occupying the whole cylinder at the end of the intake stroke when the valves were fixed at the highest position. The moving valve case gave results similar to the fully open case but with slightly higher turbulence. Cycle-to-cycle variations were found to be less pronounced for these two cases as compared to the smaller fixedvalve lifts. The second cylinder head showed a flow field that was more turbulent and much less coherent. Statistical analysis showed that this had a direct effect on cyclic variations in the flow where this head showed more profound variations.
确定

还剩14页未读,是否继续阅读?

产品配置单


北京欧兰科技发展有限公司为您提供《发动机进气道模型中涡流和滚流场检测方案(CCD相机)》,该方案主要用于其他中涡流和滚流场检测,参考标准--,《发动机进气道模型中涡流和滚流场检测方案(CCD相机)》用到的仪器有Imager sCMOS PIV相机、时间分辨粒子成像测速系统(TR-PIV)、PLIF平面激光诱导荧光火焰燃烧检测系统、LaVision DaVis 智能成像软件平台
推荐专场


相关方案
更多
该厂商其他方案
更多