


方案详情
文
采用德国LaVision公司的SprayMaster喷雾测量分析系统和美国Artium Technologies 公司的相位多普勒粒子分析仪PDI-200MD对喷雾的几何形态和液滴的粒径速度进行了测量获得了组合液滴尺寸分布信息。
方案详情

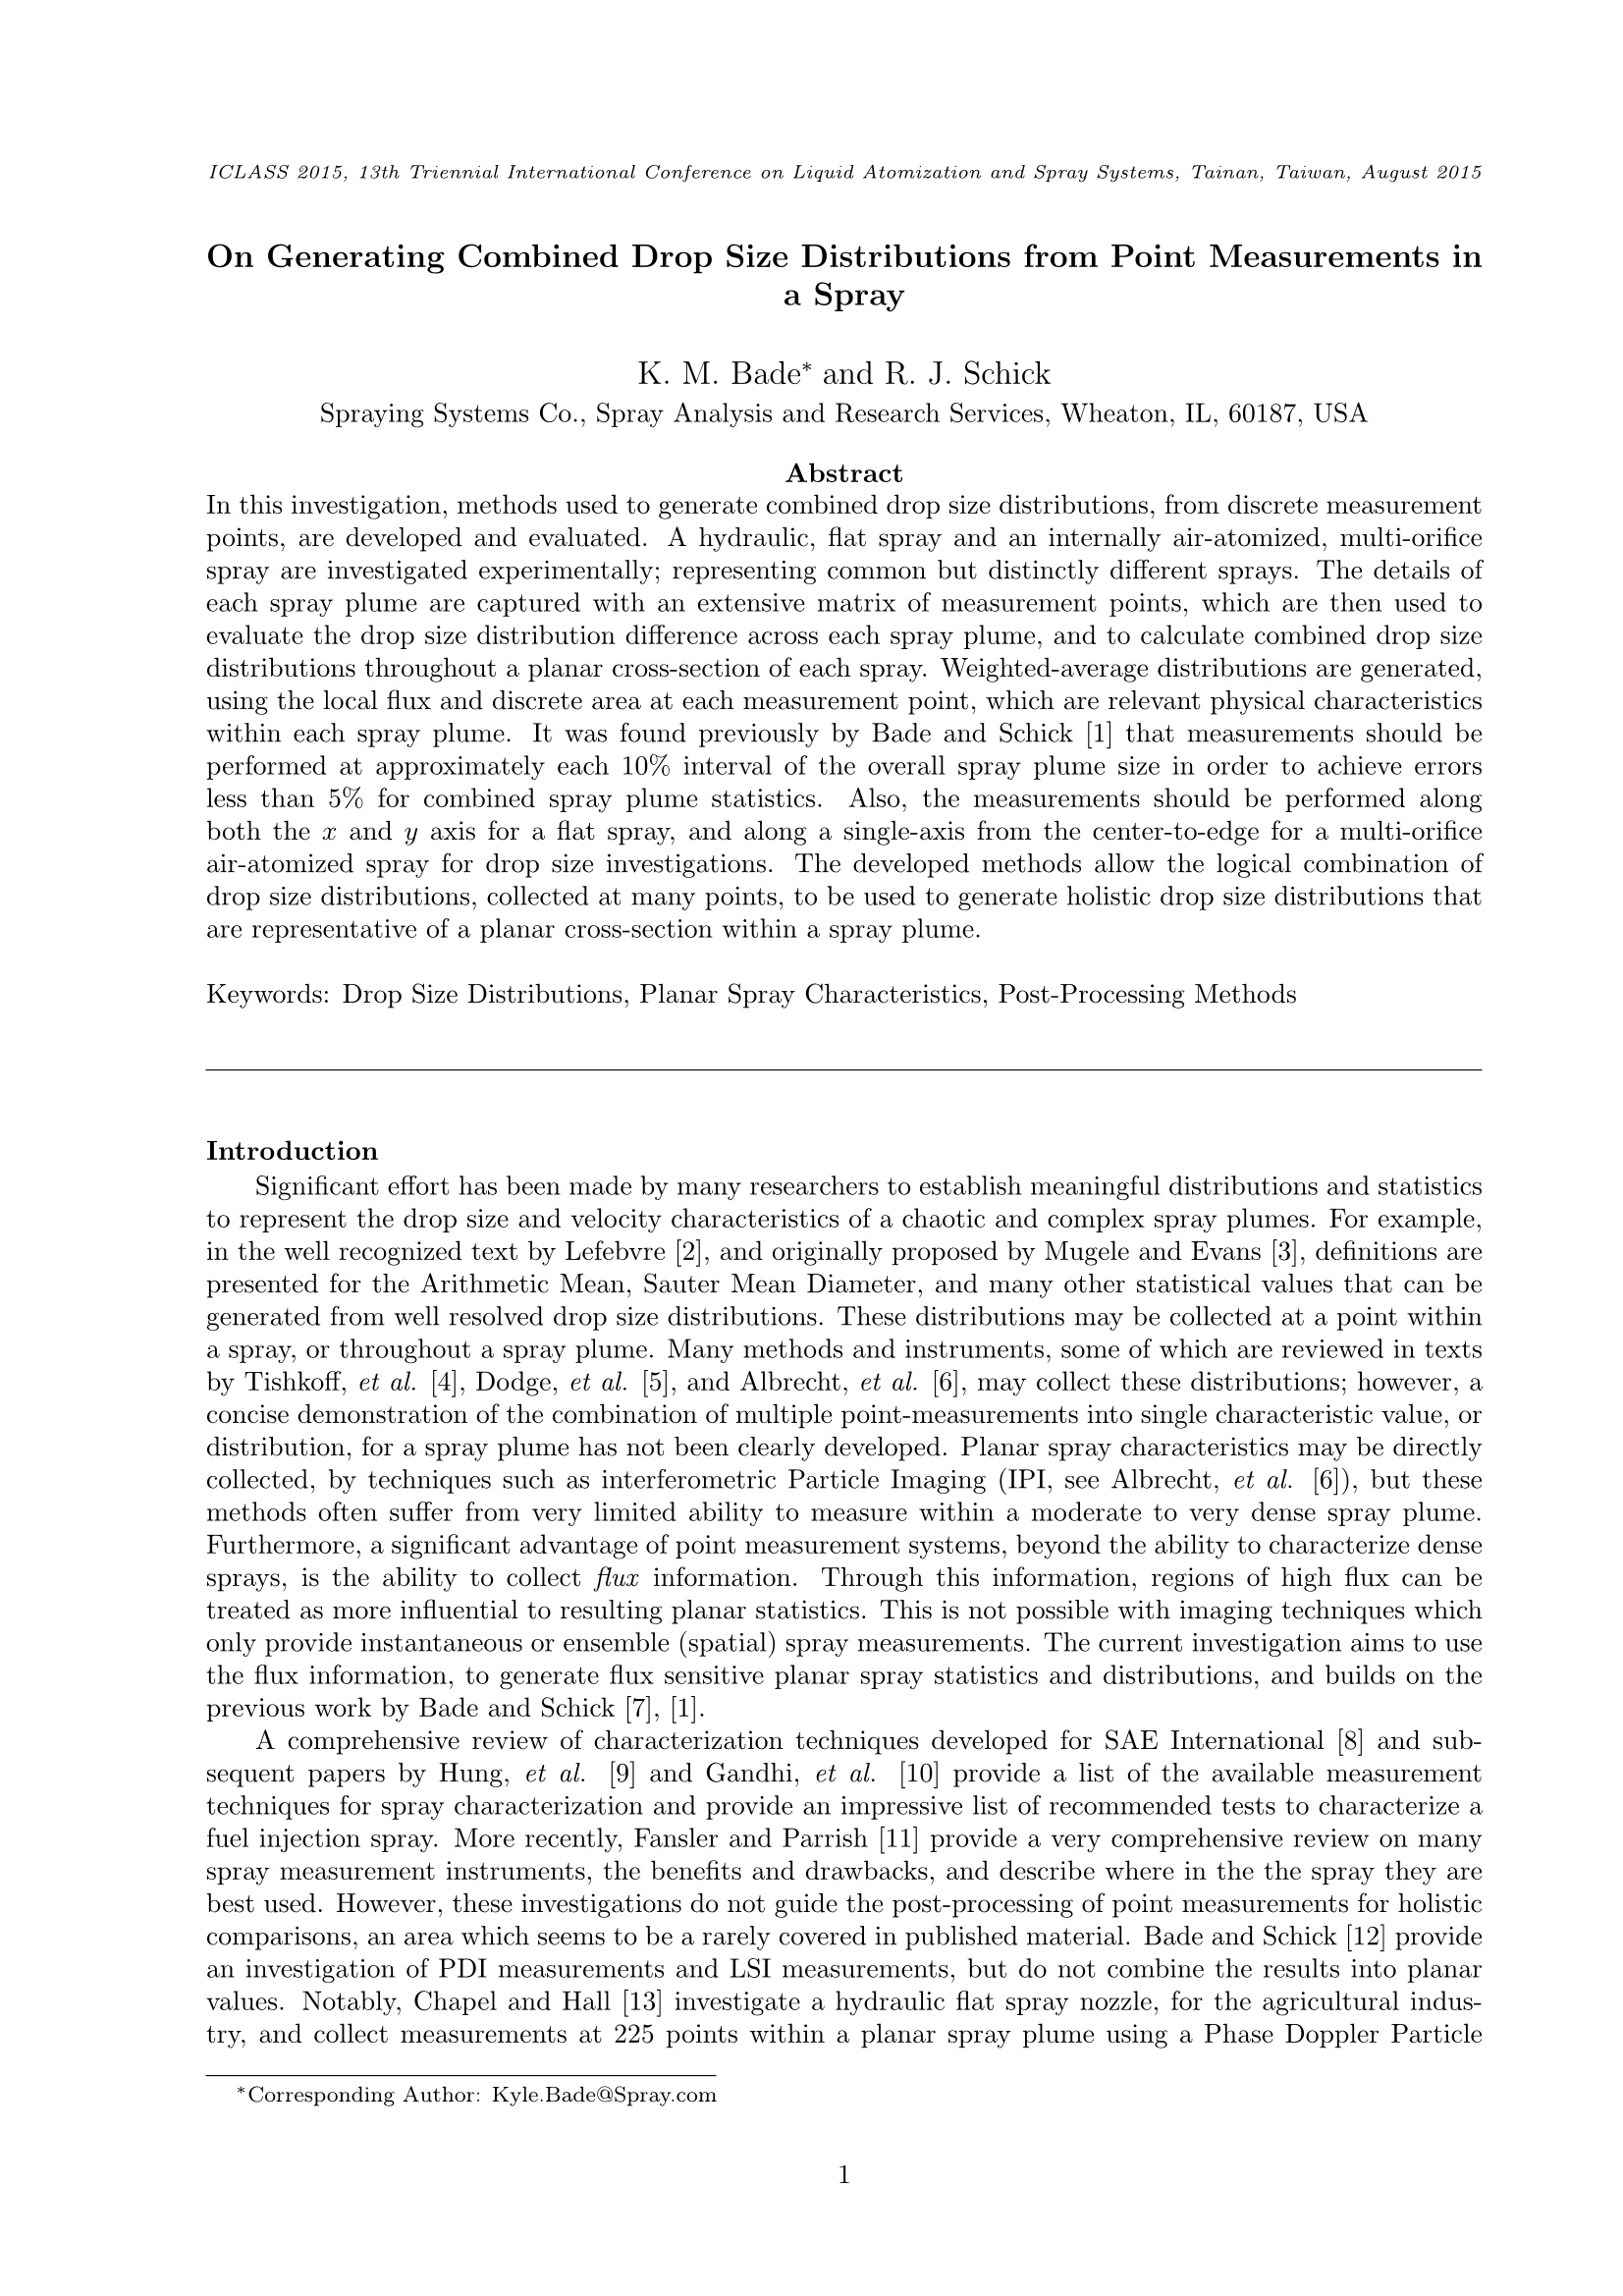
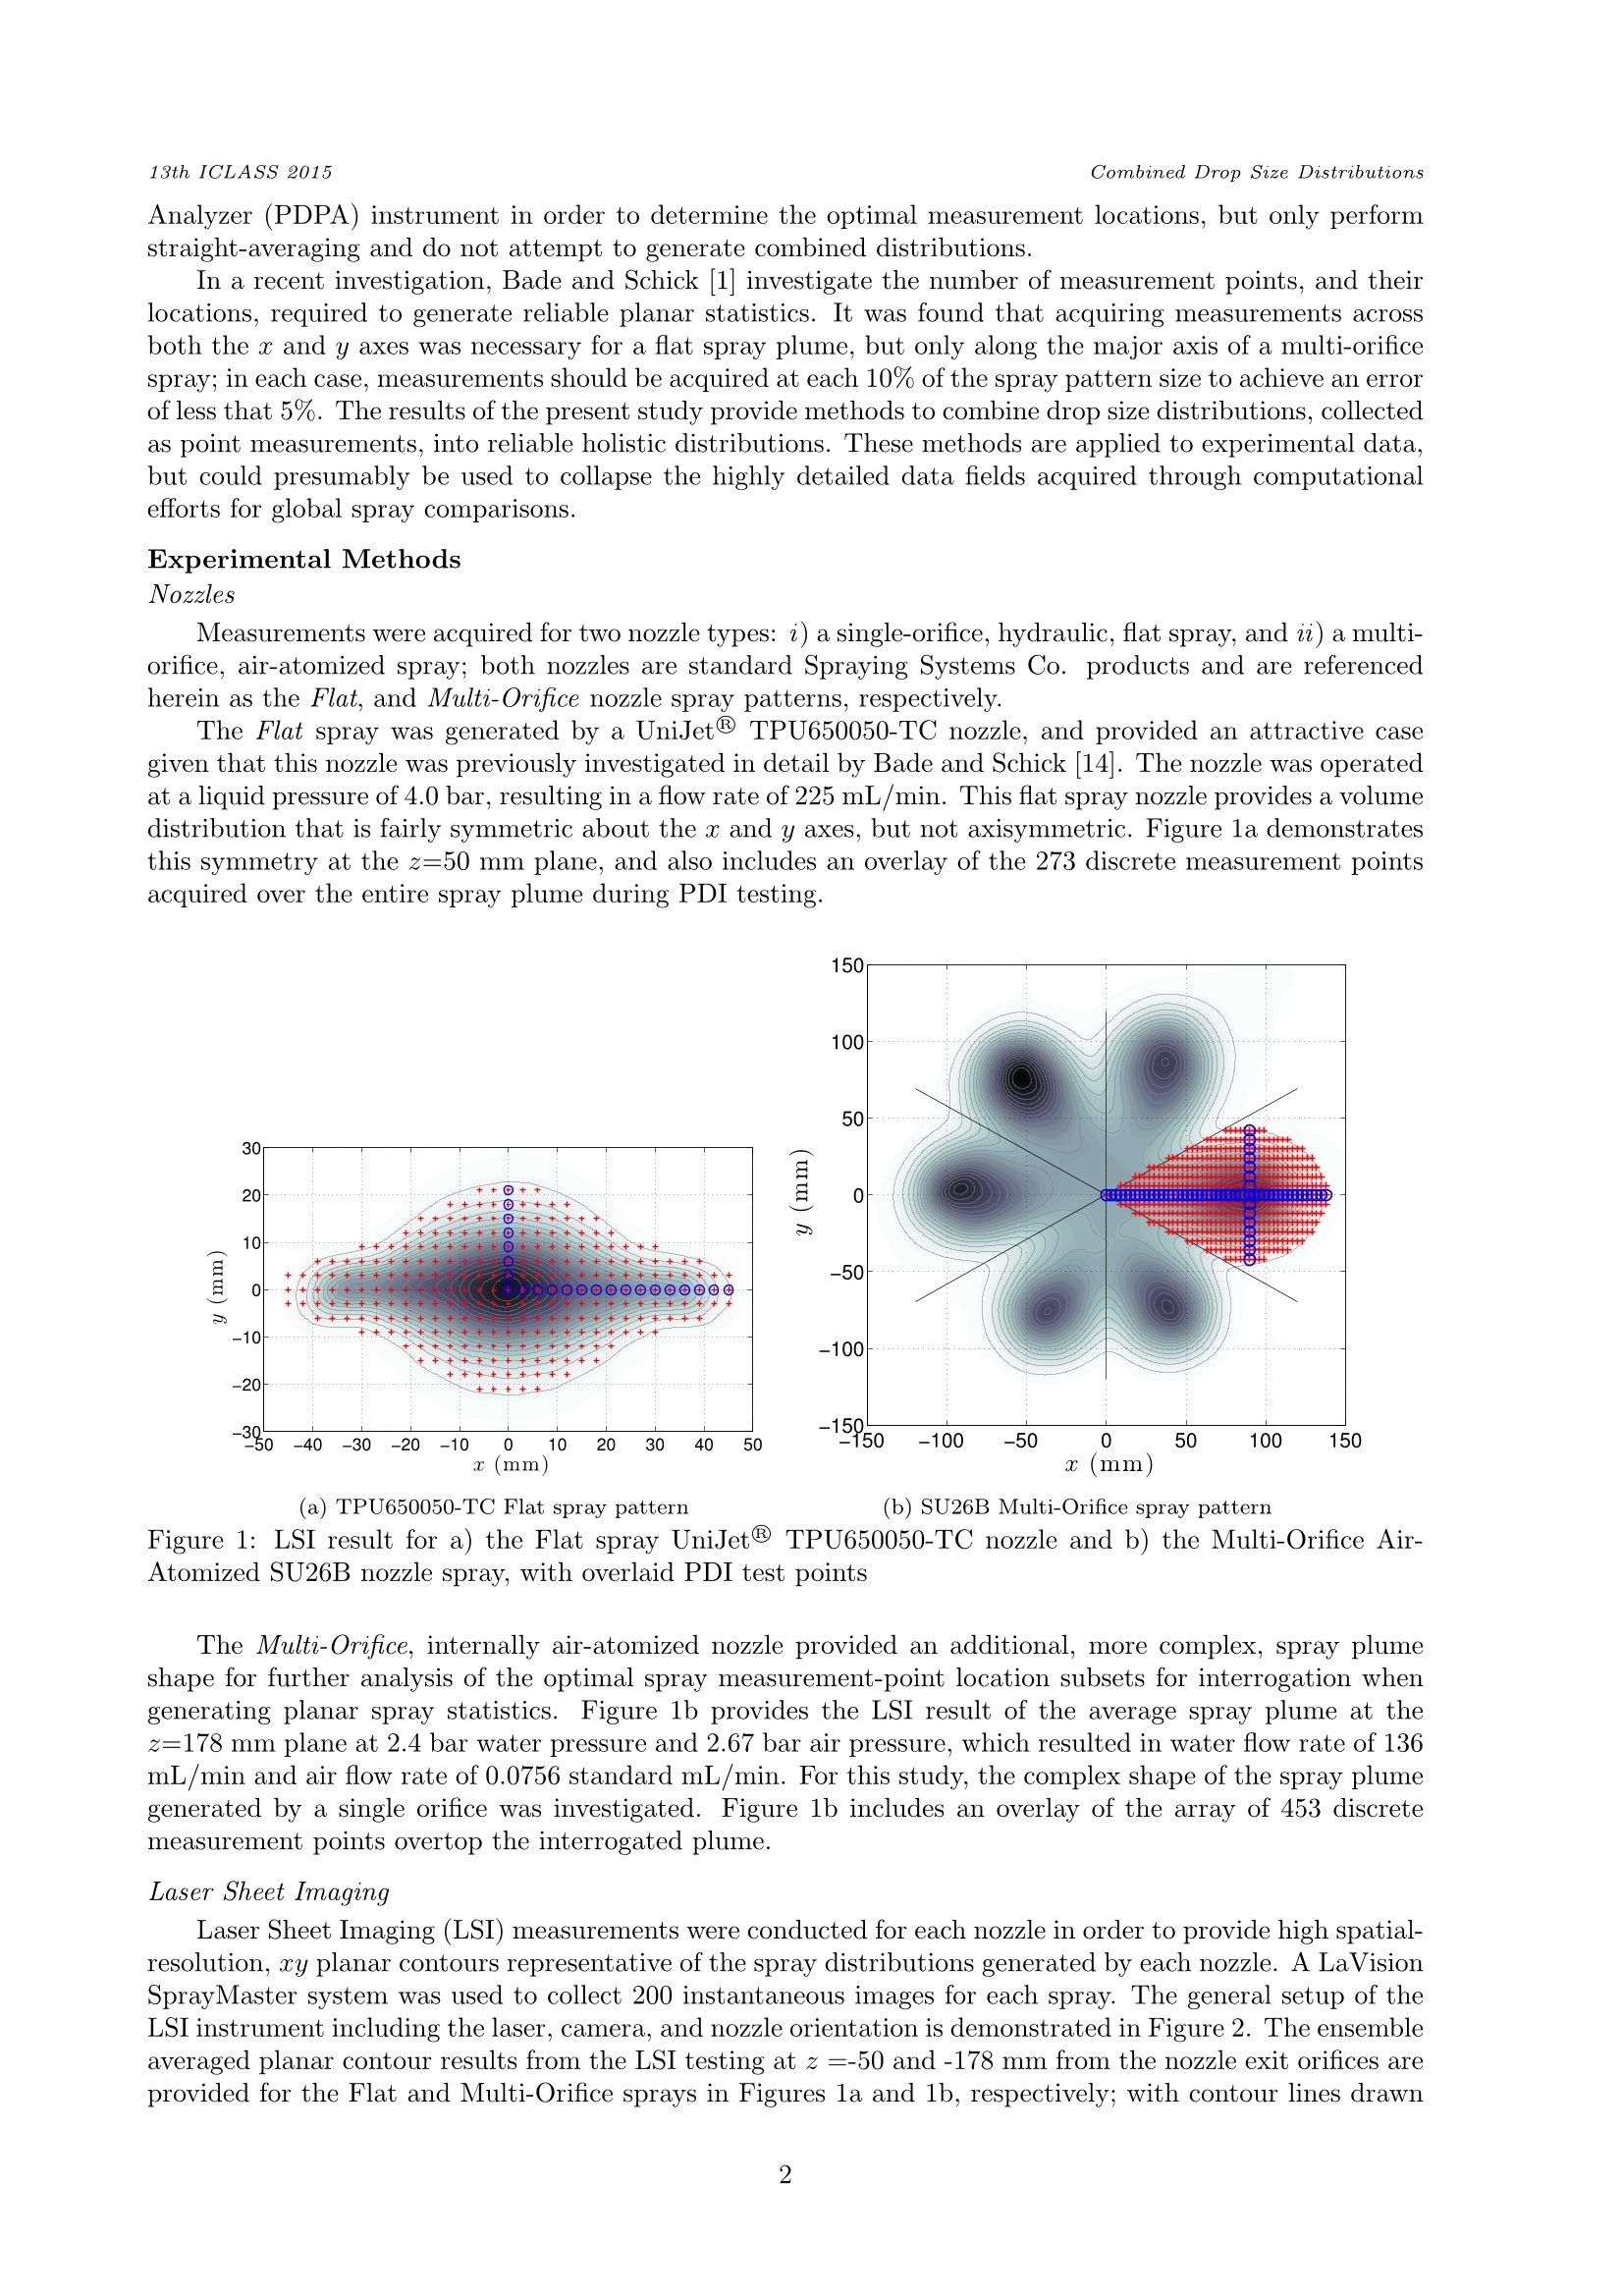
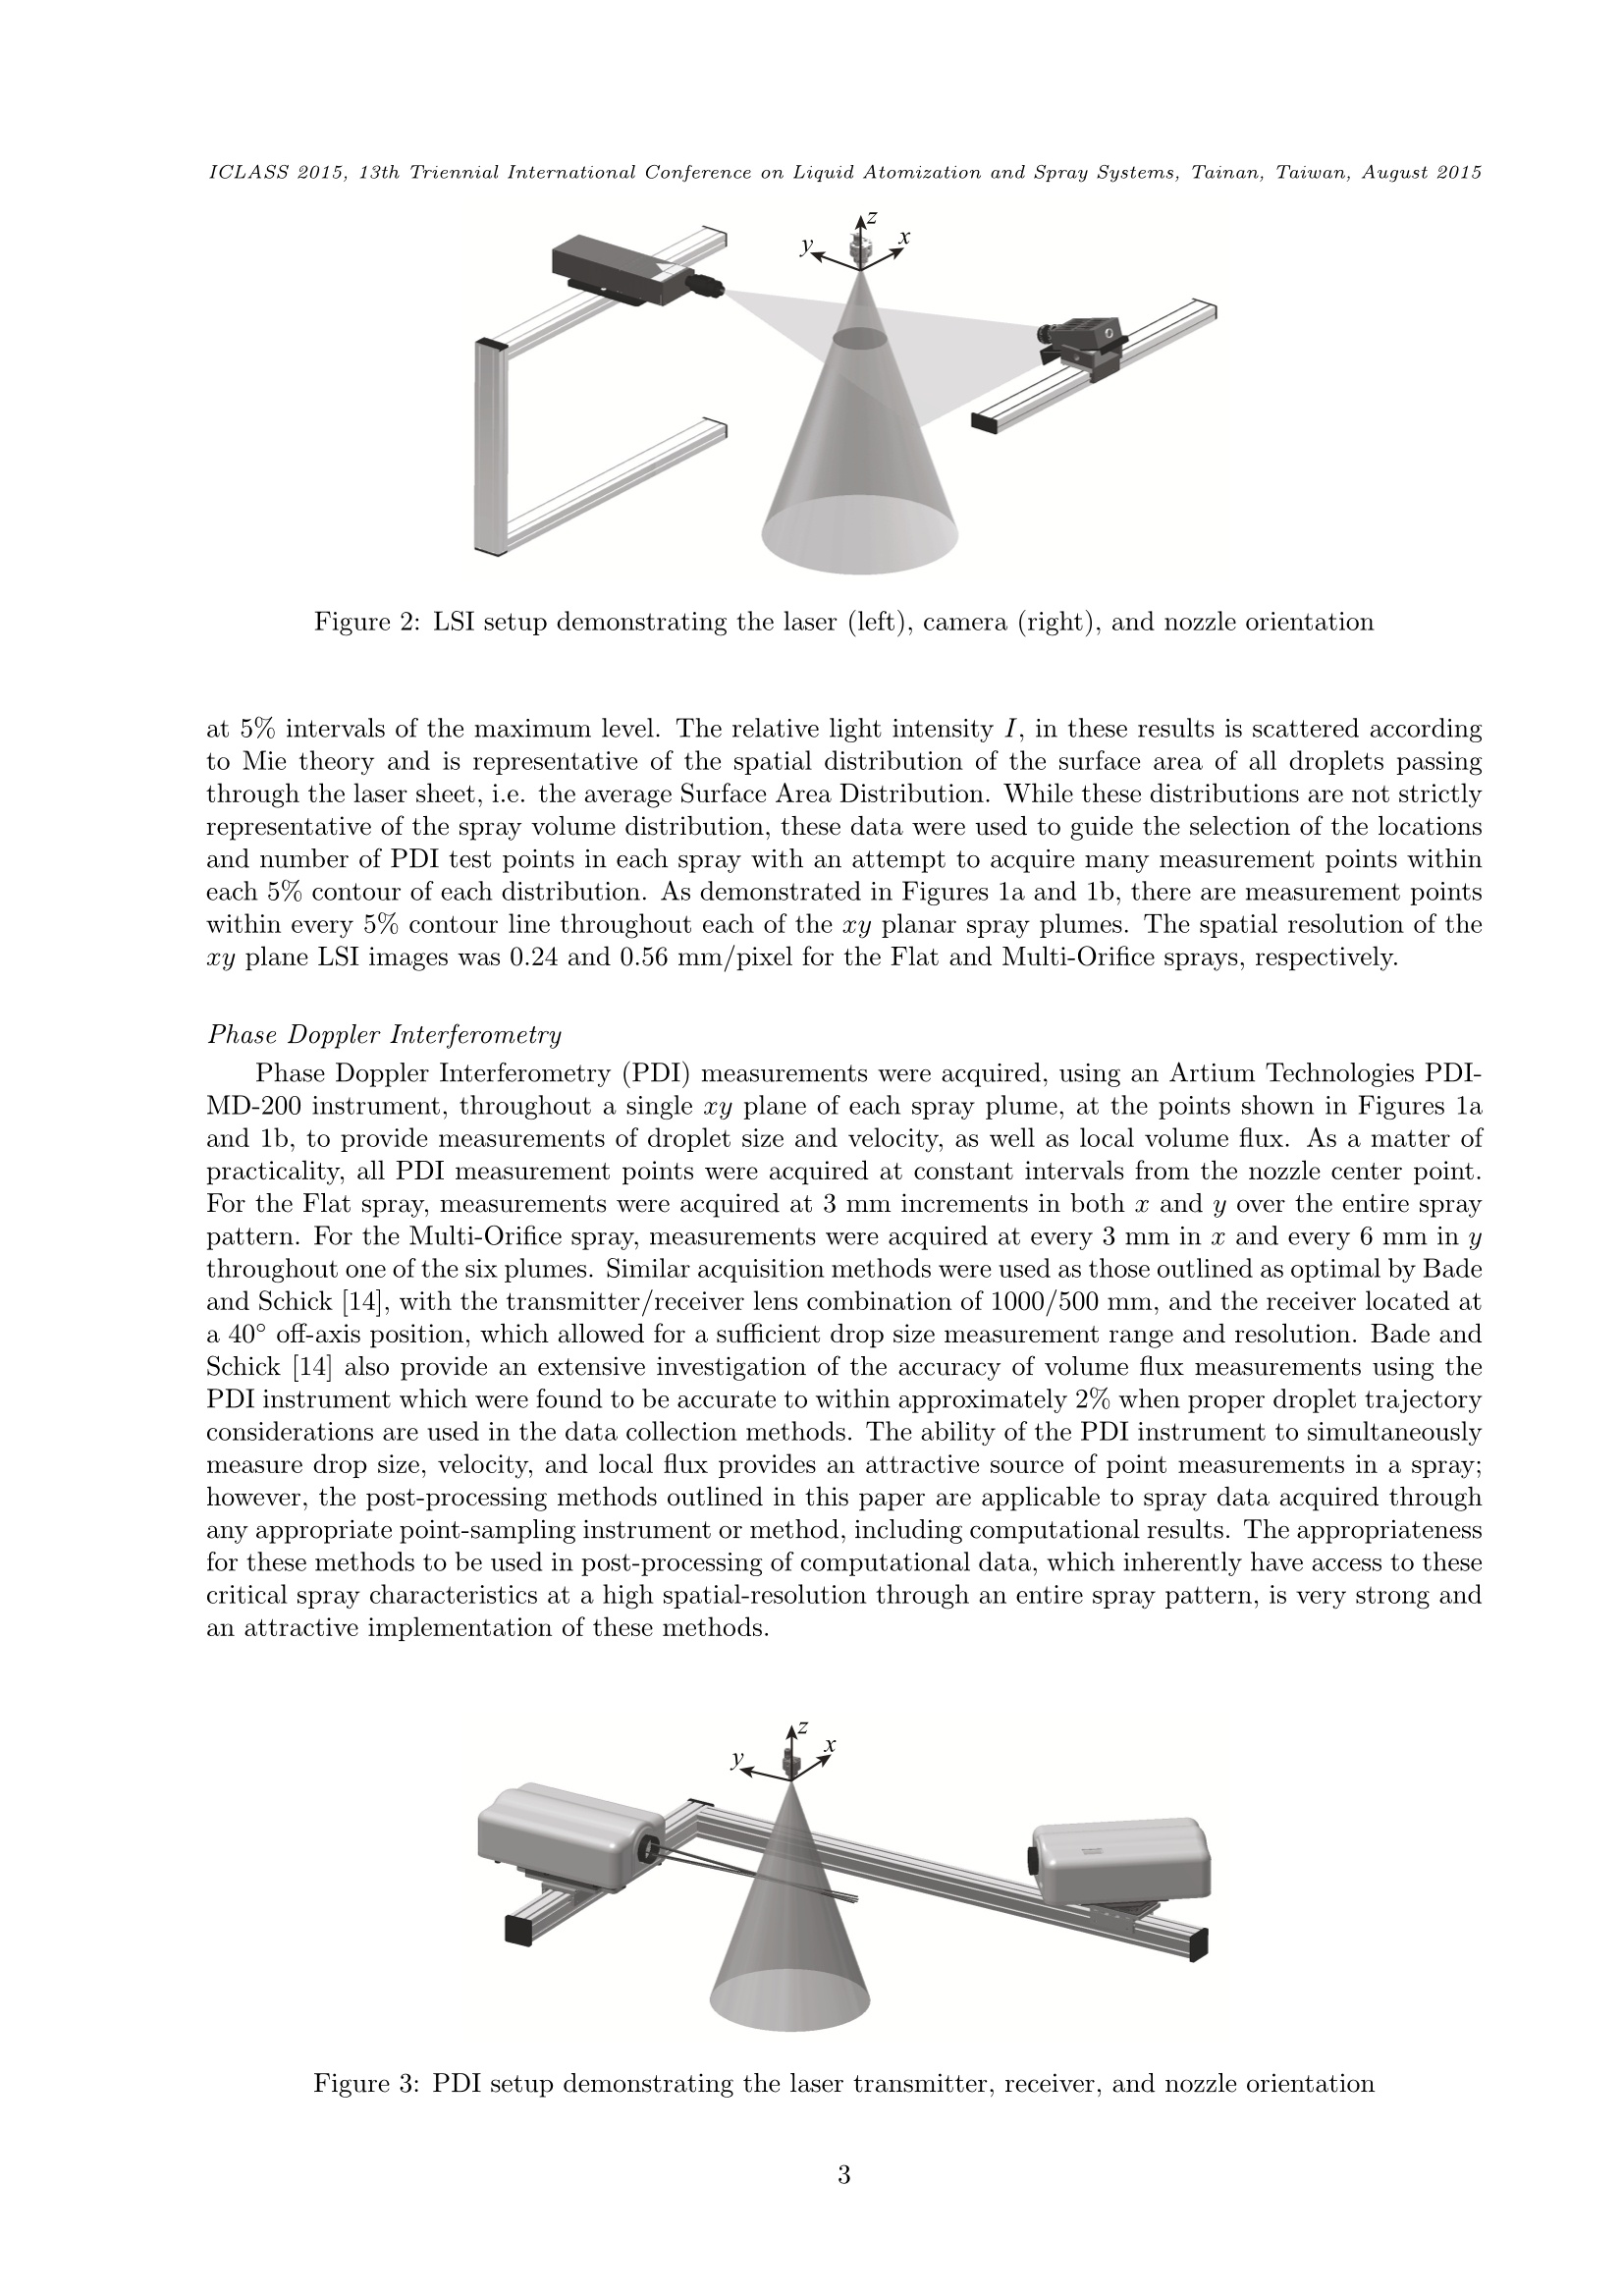
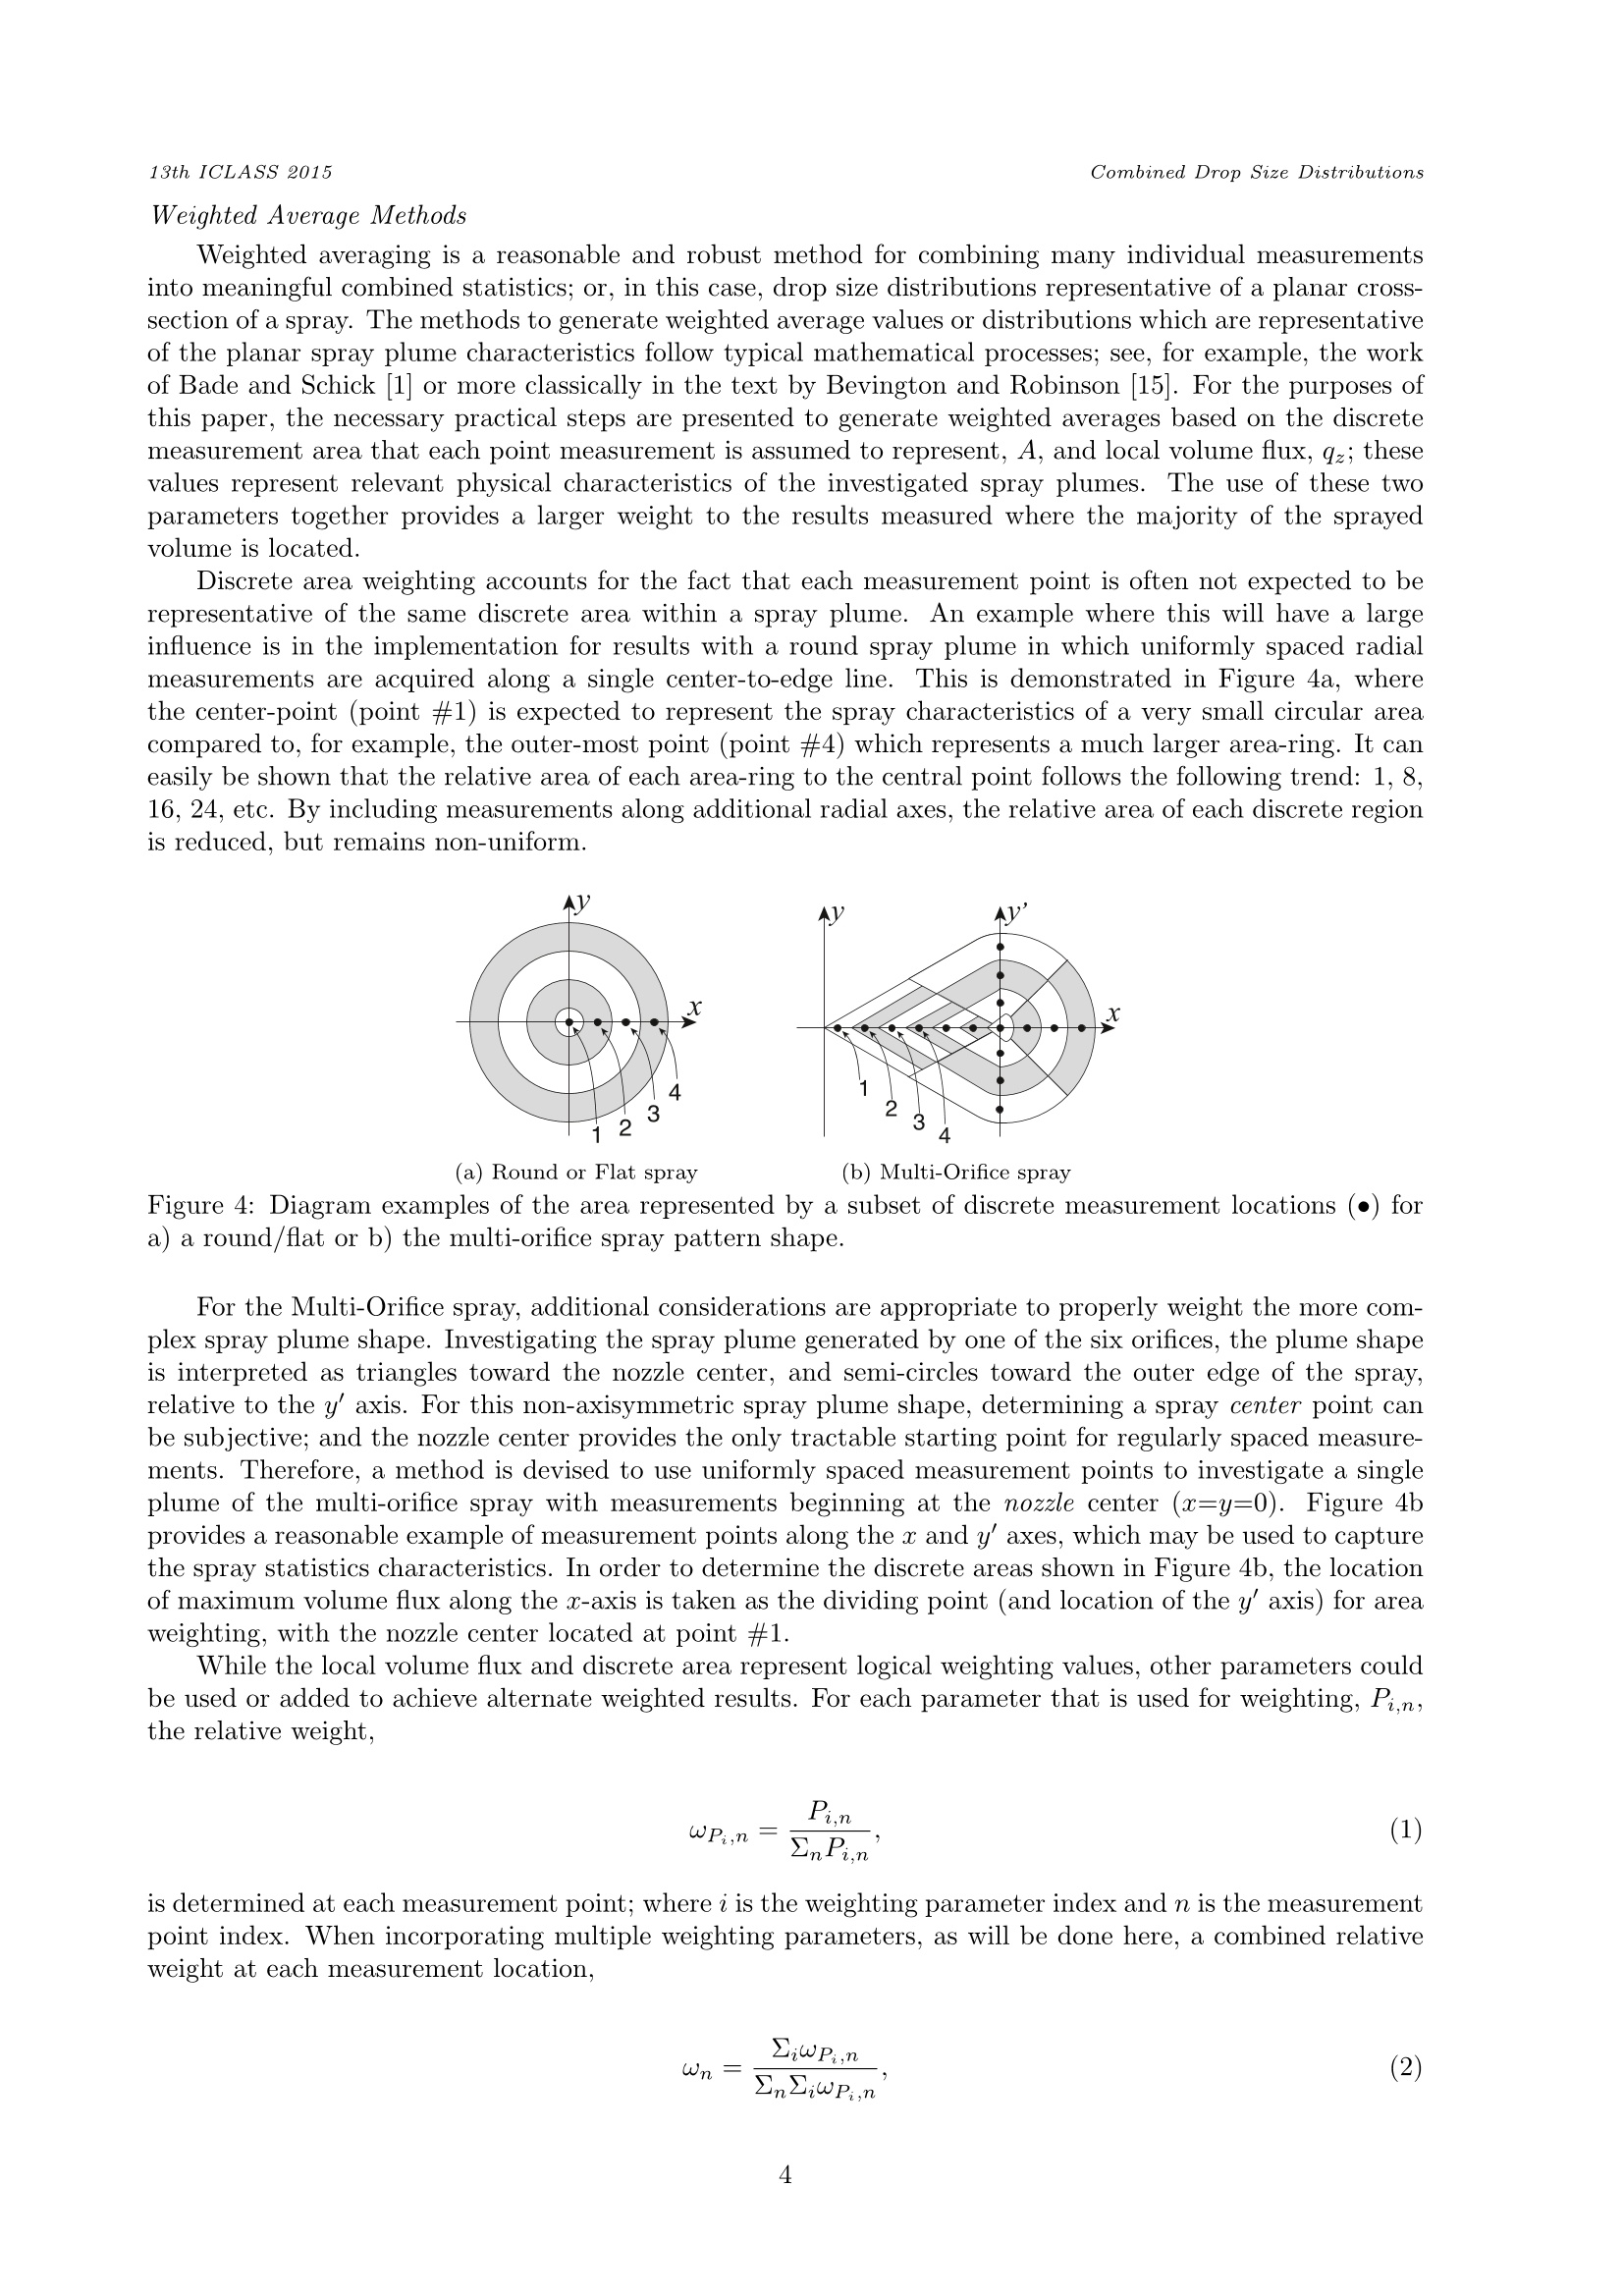
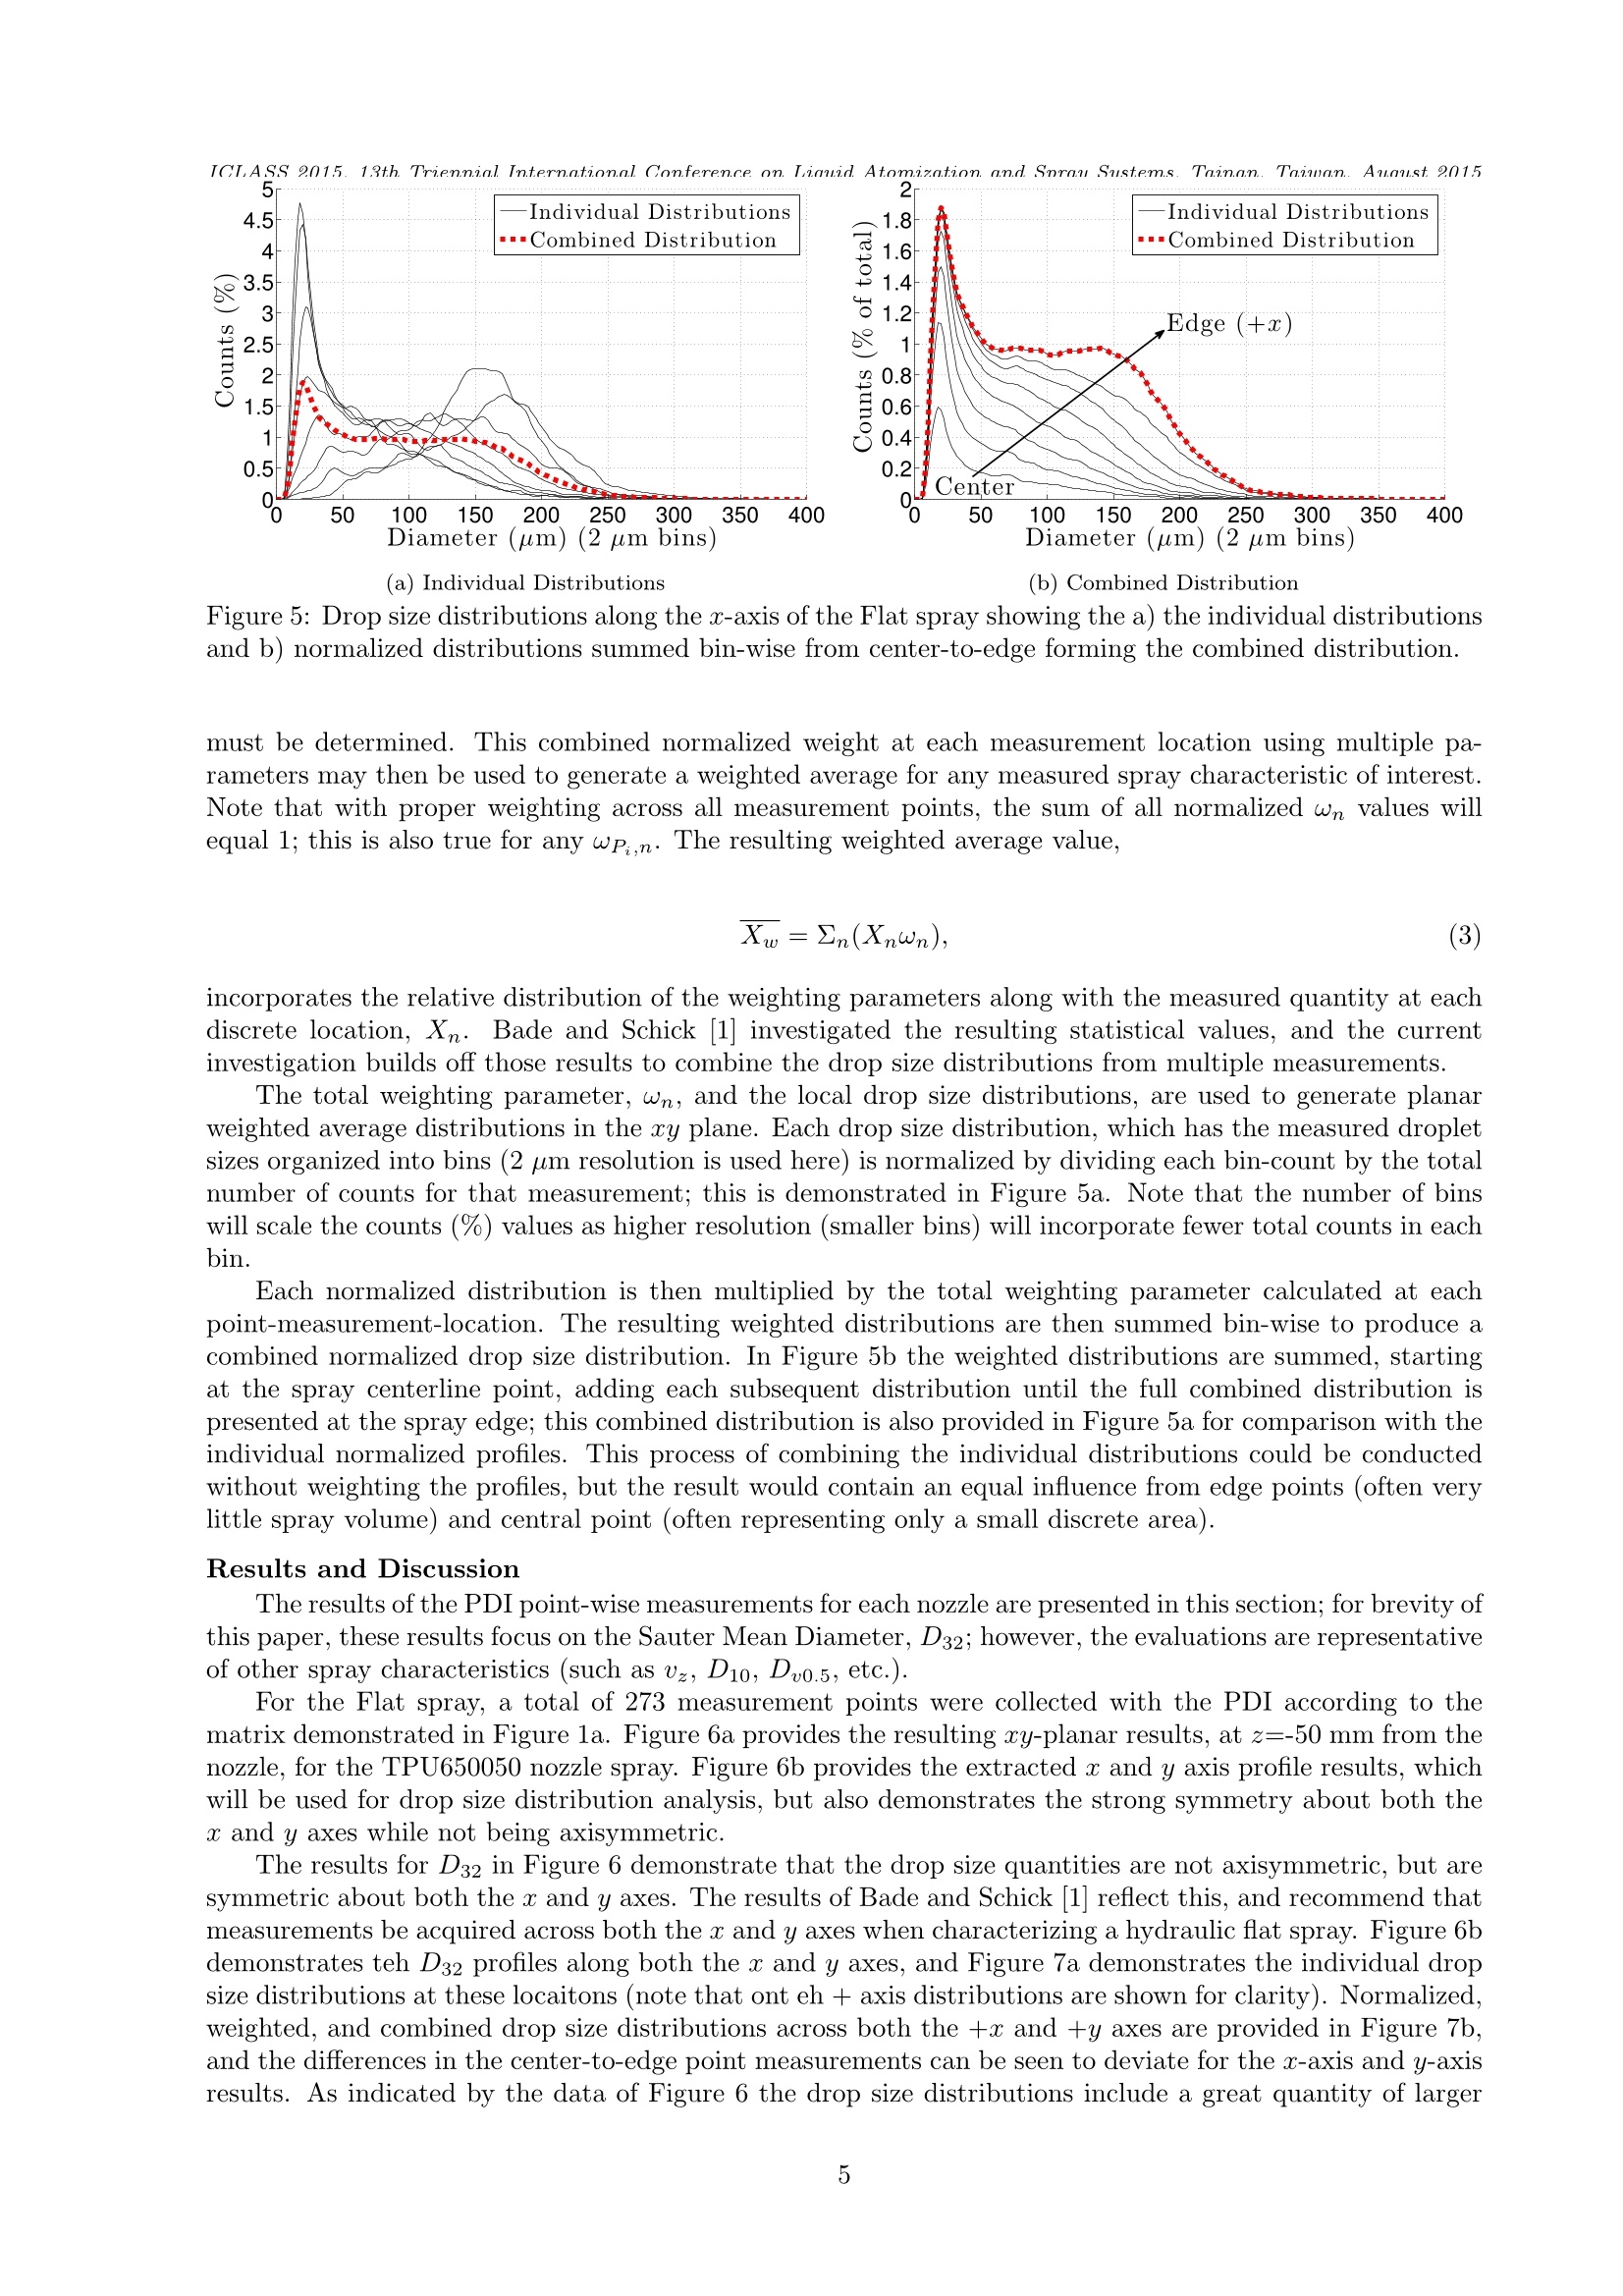
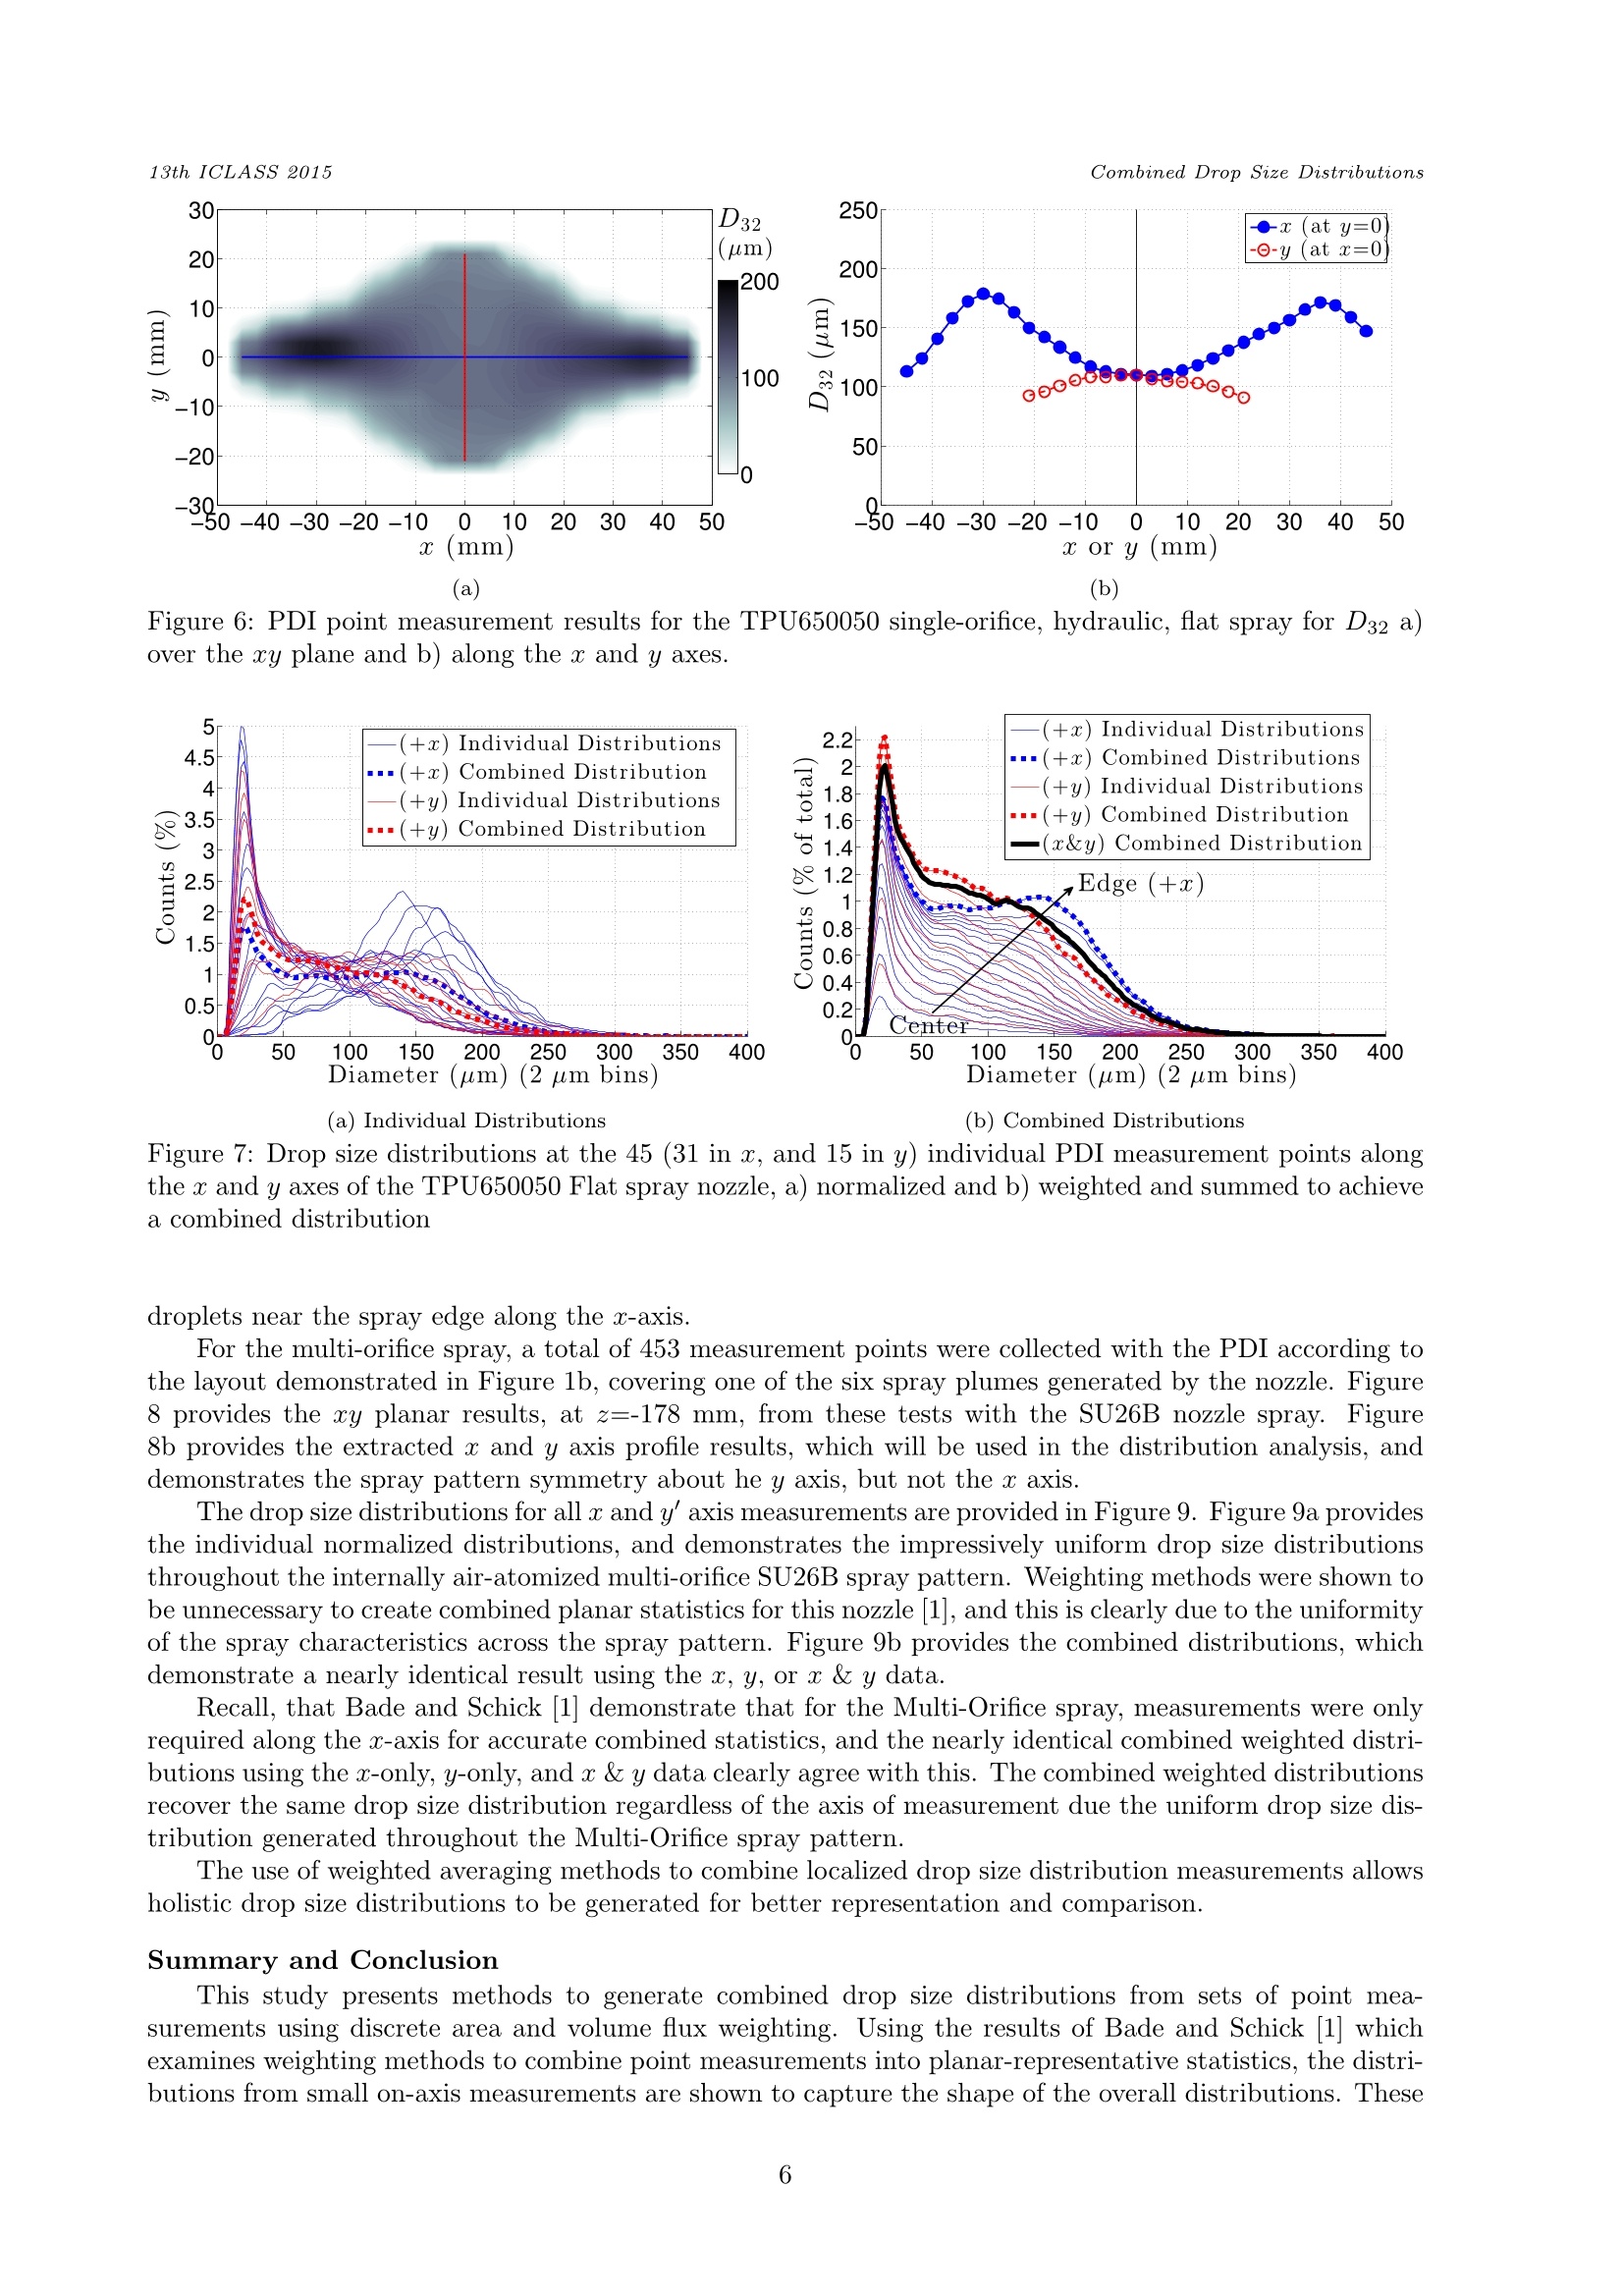
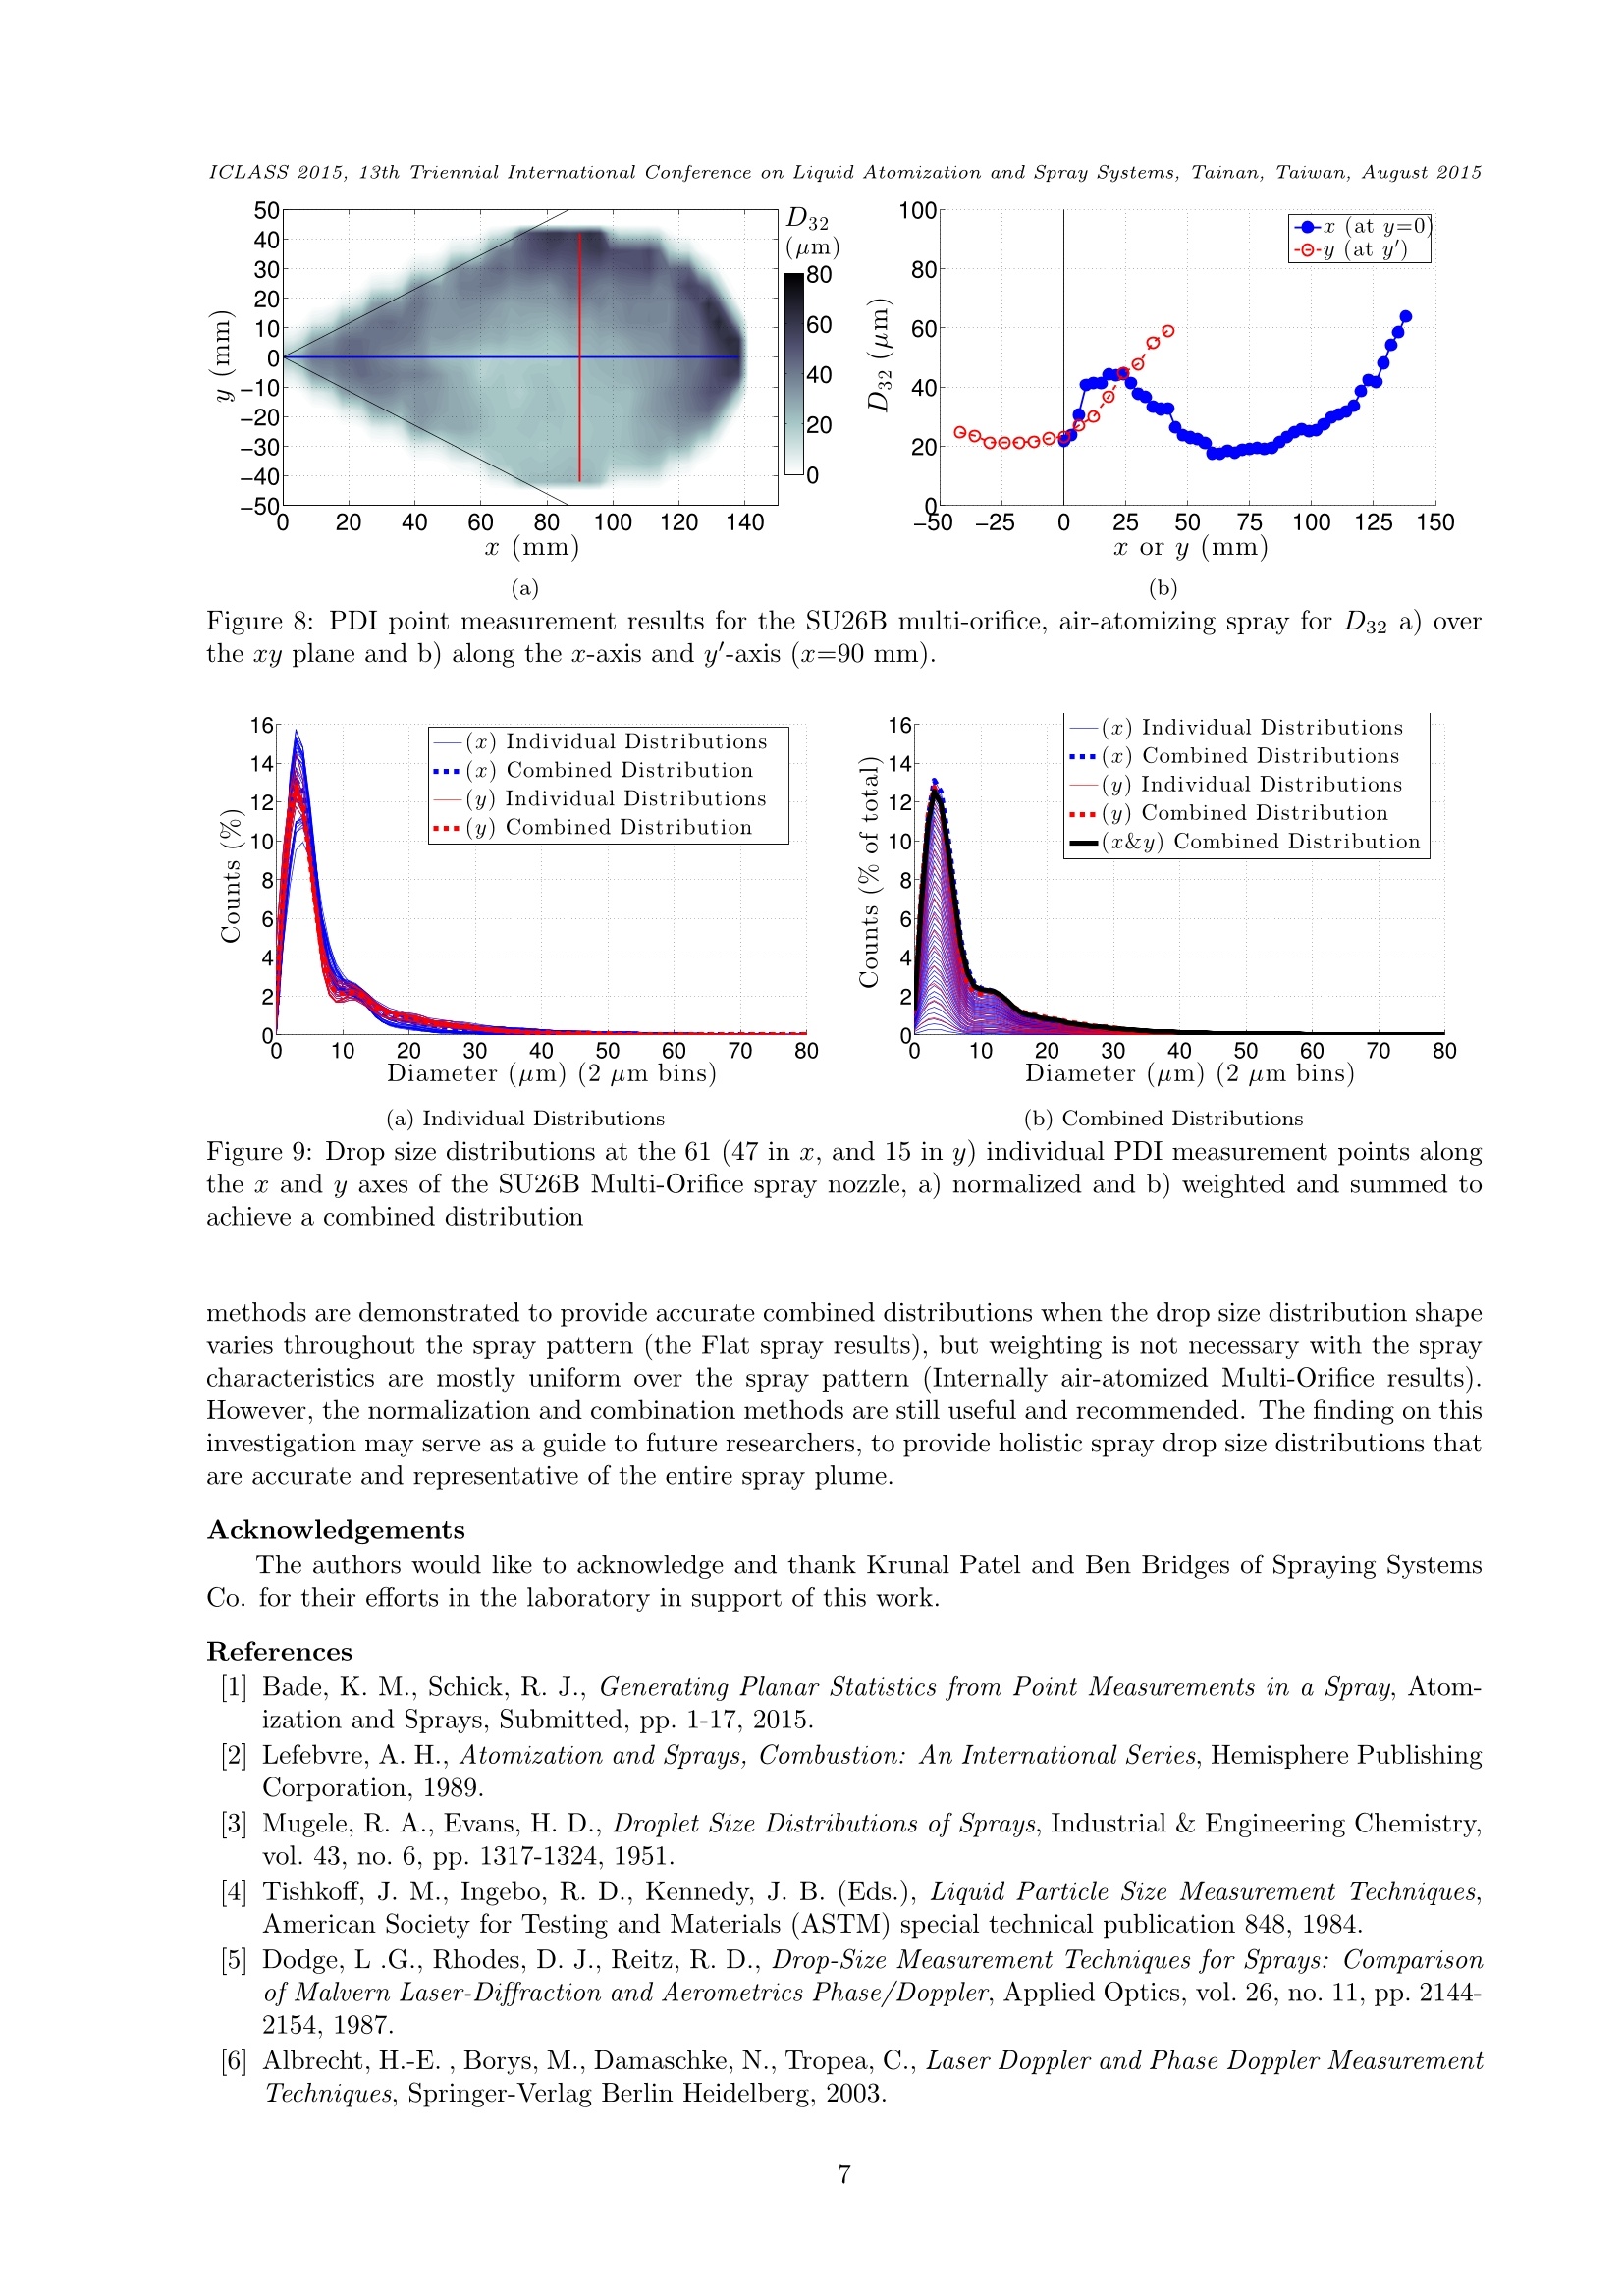
ICLASS 2015, 13th Triennial International Conference on Liquid Atomization and Spray Systems, Tainan, Taiwan, August 2015 13th ICLASS 2015Combined Drop Size Distributions On Generating Combined Drop Size Distributions from Point Measurements ina Spray K. M. Bade* and R. J. Schick Spraying Systems Co., Spray Analysis and Research Services, Wheaton, IL, 60187, USA Abstract In this investigation, methods used to generate combined drop size distributions, from discrete measurementpoints, are developed and evaluated. A hydraulic, flat spray and an internally air-atomized, multi-orificespray are investigated experimentally; representing common but distinctly different sprays. The details ofeach spray plume are captured with an extensive matrix of measurement points, which are then used tcevaluate the drop size distribution difference across each spray plume, and to calculate combined drop size.distributions throughout a planar cross-section of each spray. Weighted-average distributions are generated,using the local flux and discrete area at each measurement point, which are relevant physical characteristicswithin each spray plume. It was found previously by Bade and Schick [1] that measurements should beperformed at approximately each 10% interval of the overall spray plume size in order to achieve errorsless than 5% for combined spray plume statistics.Also, the measurements should be performed alongboth the s and y axis for a flat spray, and along a single-axis from the center-to-edge for a multi-orificeair-atomized spray for drop size investigations. 'The developed methods allow the logical combination ofdrop size distributions, collected at many points, to be used to generate holistic drop size distributions thatare representative of a planar cross-section within a spray plume. Keywords: Drop Size Distributions, Planar Spray Characteristics, Post-Processing Methods Introduction Significant effort has been made by many researchers to establish meaningful distributions and statisticsto represent the drop size and velocity characteristics of a chaotic and complex spray plumes. For example.in the well recognized text by Lefebvre 2], and originally proposed by Mugele and Evans 3], definitions arepresented for the Arithmetic Mean, Sauter Mean Diameter, and many other statistical values that can begenerated from well resolved drop size distributions. These distributions may be collected at a point withina spray, or throughout a spray plume. Many methods and instruments, some of which are reviewed in textsby Tishkoff, et al. [4], Dodge, et al. [5], and Albrecht, et al. [6], may collect these distributions; however, aconcise demonstration of the combination of multiple point-measurements into single characteristic value, ordistribution, for a spray plume has not been clearly developed. Planar spray characteristics may be directlycollected, by techniques such as interferometric Particle Imaging (IPI, see Albrecht, et al..[6]), but thesemethods often suffer from very limited ability to measure within a moderate to very dense spray plumeFurthermore, a significant advantage of point measurement systems, beyond the ability to characterize densesprays, is the ability to collect fux information.1.Through this information, regions of high flux can betreated as more influential to resulting planar statistics. This is not possible with imaging techniques whichonly provide instantaneous or ensemble (spatial) spray measurements. The current investigation aims to usethe flux information, to generate flux sensitive planar spray statistics and distributions, and builds on theprevious work by Bade and Schick [7], [1]. A comprehensive review of characterization techniques developed for SAE International [8] and sub-sequent papers by Hung, et al.[9] and Gandhi, et al.[10] provide a list of the available measurementtechniques for spray characterization and provide an impressive list of recommended tests to characterize afuel tion sprayy.. More recently, Fansler and Parrish [11] provide a very comprehensive review on manyspray measurement instruments, the benefits and drawbacks, and describe where in the the spray they arebest used. However, these investigations do not guide the post-processing of point measurements for holisticcomparisons, an area which seems to be a rarely covered in published material. Bade and Schick [12] providean investigation of PDI measurements and LSI measurements, but do not combine the results into planarvalues. Notably, Chapel and Hall [13 investigate a hydraulic flat spray nozzle, for the agricultural indus-try, and collect measurements at 225 points within a planar spray plume using a Phase Doppler Particle Analyzer (PDPA) instrument in order to determine the optimal measurement locations, but only performstraight-averaging and do not attempt to generate combined distributions. In a recent investigation, Bade and Schick [1] investigate the number of measurement points, and theirlocations, required to generate reliable planar statistics. It was found that acquiring measurements acrossboth the a and y axes was necessary for a flat spray plume, but only along the major axis of a multi-orificespray; in each case, measurements should be acquired at each 10% of the spray pattern size to achieve an errorof less that 5%. The results of the present study provide methods to combine drop size distributions, collectedas point measurements, into reliable holistic distributions. These methods are applied to experimental data,but could presumably be used to collapse the highly detailed data fields acquired through computationalefforts for global spray comparisons. Experimental Methods Nozzles Measurements were acquired for two nozzle types: i a single-orifice, hydraulic, flat spray, and ii) a multi-orifice, air-atomized spray; both nozzles are standard Spraying Systems Co. products and are referencedherein as the Flat, and Multi-Orifice nozzle spray patterns, respectively. The Flat spray was generated by a UniJet@ TPU650050-TC nozzle, and provided an attractive casegiven that this nozzle was previously investigated in detail by Bade and Schick [14]. The nozzle was operatedat a liquid pressure of 4.0 bar, resulting in a flow rate of 225 mL/min. This flat spray nozzle provides a volumedistribution that is fairly symmetric about the s and y axes, but not axisymmetric. Figure 1a demonstratesthis symmetry at the z=50 mm plane, and also includes an overlay of the 273 discrete measurement pointsacquired over the entire spray plume during PDI testing. (a) TPU650050-TC Flat spray pattern (b) SU26B Multi-Orifice spray pattern Figure 1: LSI result for a) the Flat spray UniJet@ TPU650050-TC nozzle and b) the Multi-Orifice Air-Atomized SU26B nozzle spray, with overlaid PDI test points The Multi-Orifice, internally air-atomized nozzle provided an additional,more complex, spray plumeshape for further analysis of the optimal spray measurement-point location subsets for interrogation whengenerating planar spray statistics.Figure 1b provides the LSI result of the average spray plume at thez=178 mm plane at 2.4 bar water pressure and 2.67 bar air pressure, which resulted in water flow rate of 136mL/min and air flow rate of 0.0756 standard mL/min. For this study, the complex shape of the spray plumegenerated by a single orifice was investigated. Figure 1b includes an overlay of the array of 453 discretemeasurement points overtop the interrogated plume. Laser Sheet Imaging Laser Sheet Imaging (LSI) measurements were conducted for each nozzle in order to provide high spatial-resolution, sy planar contours representative of the spray distributions generated by each nozzle. A LaVisionSprayMaster system was used to collect 200 instantaneous images for each spray. The general setup of theLSI instrument including the laser, camera, and nozzle orientation is demonstrated in Figure2. The ensembleaveraged planar contour results from the LSI testing at z=-50 and-178 mm from the nozzle exit orifices areprovided for the Flat and Multi-Orifice sprays in Figures 1a and 1b, respectively; with contour lines drawn Figure 2: LSI setup demonstrating the laser (left), camera (right), and nozzle orientation at 5% intervals of the maximum level. The relative light intensity I, in these results is scattered accordingto Mie theory and is representative of the spatial distribution of the surface area of all droplets passingthrough the laser sheet, i.e. the average Surface Area Distribution. While these distributions are not strictlyrepresentative of the spray volume distribution, these data were used to guide the selection of the locationsand number of PDI test points in each spray with an attempt to acquire many measurement points withineach 5% contour of each distribution. As demonstrated in Figures la and 1b, there are measurement pointswithin every 5% contour line throughout each of the oy planar spray plumes. The spatial resolution of thesy plane LSI images was 0.24 and 0.56 mm/pixel for the Flat and Multi-Orifice sprays, respectively. Phase Doppler Interferometry Phase Doppler Interferometry (PDI) measurements were acquired, using an Artium Technologies PDI-MD-200 instrument, throughout a single y plane of each spray plume, at the points shown in Figures laand 1b, to provide measurements of droplet size and velocity, as well as local volume flux. As a matter ofpracticality, all PDI measurement points were acquired at constant intervals from the nozzle center point.For the Flat spray, measurements were acquired at 3 mm increments in both c and y over the entire spraypattern. For the Multi-Orifice spray, measurements were acquired at every 3 mm in a and every 6 mm in ythroughout one of the six plumes. Similar acquisition methods were used as those outlined as optimal by Badeand Schick 14, with the transmitter/receiver lens combination of 1000/500 mm, and the receiver located ata 40°off-axis position, which allowed for a sufficient drop size measurement range and resolution. Bade andSchick [14 also provide an extensive investigation of the accuracy of volume flux measurements using thePDI instrument which were found to be accurate to within approximately 2% when proper droplet trajectoryconsiderations are used in the data collection methods. The ability of the PDI instrument to simultaneouslymeasure drop size, velocity, and local flux provides an attractive source of point measurements in a spray;however, the post-processing methods outlined in this paper are applicable to spray data acquired throughany appropriate point-sampling instrument or method, including computational results. The appropriatenessfor these methods to be used in post-processing of computational data, which inherently have access to thesecritical spray characteristics at a high spatial-resolution through an entire spray pattern, is very strong andan attractive implementation of these methods. Figure 3: PDI setup demonstrating the laser transmitter, receiver, and nozzle orientation Weighted Average Methods Weighted averaging is a reasonable and robust method for combining many individual measurementsinto meaningful combined statistics; or, in this case,drop size distributions representative of a planarcross-section of a spray. The methods to generate weighted average values or distributions which are representativeof the planar spray plume characteristics follow typical mathematical processes; see, for example, the workof Bade and Schick [1] or more classically in the text by Bevington and Robinson [15]. For the purposes ofthis paper, the necessary practical steps are presented to generate weighted averages based on the discretemeasurement area that each point measurement is assumed to represent, A, and local volume flux, qz; thesevalues represent relevant physical characteristics of the investigated spray plumes. The use of these twoparameters together provides a larger weight to the results measured where the majority of the sprayedvolume is located. Discrete area weighting accounts for the fact that each measurement point is often not expected to berepresentative of the same discrete area within a spray plume. An example where this will have a largeinfluence is in the implementation for results with a round spray plume in which uniformly spaced radialmeasurements are acquired along a single center-to-edge line. This is demonstrated in Figure 4a, wherethe center-point (point #1) is expected to represent the spray characteristics of a very small circular areacompared to, for example, the outer-most point (point #4) which represents a much larger area-ring. It caneasily be shown that the relative area of each area-ring to the central point follows the following trend: 1,8,16, 24, etc. By including measurements along additional radial axes, the relative area of each discrete regionis reduced, but remains non-uniform. (a) Round or Flat spray (b) Multi-Orifice spray Figure 4: Diagram examples of the area represented by a subset of discrete measurement locations() fora) a round/flat or b) the multi-orifice spray pattern shape. For the Multi-Orifice spray, additional considerations are appropriate to properly weight the more com-plex spray plume shape. Investigating the spray plume generated by one of the six orifices, the plume shapeis interpreted as triangles toward the nozzle center, and semi-circles toward the outer edge of the spray,relative to the y axis. For this non-axisymmetric spray plume shape, determining a spray center point canbe subjective; and the nozzle center provides the only tractable starting point for regularly spaced measure-ments. Therefore, a method is devised to use uniformly spaced measurement points to investigate a singleplume of the multi-orifice spray with measurements beginning at the nozzle center (s=y=0). Figure 4bprovides a reasonable example of measurement points along the a and y'axes,which may be used to capturethe spray statistics characteristics. In order to determine the discrete areas shown in Figure 4b, the locationof maximum volume flux along the s-axis is taken as the dividing point (and location of the y' axis) for areaweighting, with the nozzle center located at point #1. While the local volume flux and discrete area represent logical weighting values,other parameters couldbe used or added to achieve alternate weighted results. For each parameter that is used for weighting, Pi,n,the relative weight, is determined at each measurement point;where i is the weighting parameter index and n is the measurementpoint index. When incorporating multiple weighting parameters, as will be done here, a combined relativeweight at each measurement location, (a) Individual Distributions Figure 5: Drop size distributions along the x-axis of the Flat spray showing the a) the individual distributionsand b) normalized distributions summed bin-wise from center-to-edge forming the combined distribution. must be determined. This combined normalized weight at each measurement location using multiple pa-rameters may then be used to generate a weighted average for any measured spray characteristic of interest.Note that with proper weighting across all measurement points, the sum of all normalized wn values willequal 1; this is also true for any wp,n. The resulting weighted average value, incorporates the relative distribution of the weighting parameters along with the measured quantity at eachdiscrete location, Xn. Bade and Schick 1 investigated the resulting statistical values, and the currentinvestigation builds off those results to combine the drop size distributions from multiple measurements. The total weighting parameter, wn, and the local drop size distributions, are used to generate planarweighted average distributions in the ay plane. Each drop size distribution, which has the measured dropletsizes organized into bins (2 um resolution is used here) is normalized by dividing each bin-count by the totalnumber of counts for that measurement; this is demonstrated in Figure 5a. Note that the number of binswill scale the counts (%) values as higher resolution (smaller bins) will incorporate fewer total counts in eachbin. Each normalized distribution is then multiplied by the total weighting parameter calculated at eachpoint-measurement-location. The resulting weighted distributions are then summed bin-wise to produce acombined normalized drop size distribution. In Figure 5b the weighted distributions are summed, startingat the spray centerline point, adding each subsequent distribution until the full combined distribution ispresented at the spray edge; this combined distribution is also provided in Figure 5a for comparison with theindividual normalized profiles. This process of combining the individual distributions could be conductedwithout weighting the profiles, but the result would contain an equal influence from edge points (often verylittle spray volume) and central point (often representing only a small discrete area). Results and Discussion The results of the PDI point-wise measurements for each nozzle are presented in this section; for brevity ofthis paper, these results focus on the Sauter Mean Diameter, D32; however, the evaluations are representativeof other spray characteristics (such as uz, D10, Dv0.5,etc.). For the Flat spray, a total of 273 measurement points were collected with the PDI according to thematrix demonstrated in Figure la. Figure 6a provides the resulting cy-planar results, at z=-50 mm from thenozzle, for the TPU650050 nozzle spray. Figure 6b provides the extracted s and y axis profile results, whichwill be used for drop size distribution analysis, but also demonstrates the strong symmetry about both theand y axes while not being axisymmetric. The results for D32 in Figure 6 demonstrate that the drop size quantities are not axisymmetric, but aresymmetric about both the x and y axes. The results of Bade and Schick 1]reflect this, and recommend thatmeasurements be acquired across both the andy axes when characterizing a hydraulic flat spray. Figure 6bdemonstrates teh D32 profiles along both the c and y axes, and Figure 7a demonstrates the individual dropsize distributions at these locaitons (note that ont eh + axis distributions are shown for clarity). Normalized,weighted, and combined drop size distributions across both the + and +y axes are provided in Figure 7b,and the differences in the center-to-edge point measurements can be seen to deviate for the s-axis and y-axisresults. As indicated by the data of Figure 6 the drop size distributions include a great quantity of larger (a) (b) Figure 6: PDI point measurement results for the TPU650050 single-orifice, hydraulic, flat spray for D32 a)over the ry plane and b) along the a and y axes. (a) Individual Distributions (b) Combined Distributions Figure 7: Drop size distributions at the 45 (31 in s, and 15 in y) individual PDI measurement points alongthe a and y axes of the TPU650050 Flat spray nozzle, a) normalized and b) weighted and summed to achievea combined distribution droplets near the spray edge along the s-axis. For the multi-orifice spray, a total of 453 measurement points were collected with the PDI according tothe layout demonstrated in Figure 1b, covering one of the six spray plumes generated by the nozzle. Figure8 provides the y planar results, at z=-178 mm, from these tests with the SU26B nozzle spray. Figure8b provides the extracted s and y axis profile results, which will be used in the distribution analysis, anddemonstrates the spray pattern symmetry about he y axis, but not the s axis. The drop size distributions for all o and y'axis measurements are provided in Figure 9. Figure 9a providesthe individual normalized distributions, and demonstrates the impressively uniform drop size distributionsthroughout the internally air-atomized multi-orifice SU26B spray pattern. Weighting methods were shown tobe unnecessary to create combined planar statistics for this nozzle 1], and this is clearly due to the uniformityof the spray characteristics across the spray pattern. Figure 9b provides the combined distributions, whichdemonstrate a nearly identical result using the a, y, or x & y data. Recall, that Bade and Schick 1 demonstrate that for the Multi-Orifice spray, measurements were onlyrequired along the x-axis for accurate combined statistics, and the nearly identical combined weighted distri-butions using the s-only, y-only, and a & y data clearly agree with this. The combined weighted distributionsrecover the same drop size distribution regardless of the axis of measurement due the uniform drop size dis-tribution generated throughout the Multi-Orifice spray pattern. The use of weighted averaging methods to combine localized drop size distribution measurements allowsholistic drop size distributions to be generated for better representation and comparison. Summary and Conclusion This study presents methods to generate combined drop size distributions from sets of point mea-surements using discrete area and volume flux weighting. Using the results of Bade and Schick [1] whichexamines weighting methods to combine point measurements into planar-representative statistics, the distri-butions from small on-axis measurements are shown to capture the shape of the overall distributions. These (a) (b) Figure 8: PDI point measurement results for the SU26B multi-orifice, air-atomizing spray for D32 a) overthe cy plane and b) along the a-axis and y'-axis (c=90 mm). (a) Individual Distributions (b) Combined Distributions Figure 9: Drop size distributions at the 61 (47 in c, and 15 in y) individual PDI measurement points alongthe a and y axes of the SU26B Multi-Orifice spray nozzle,a) normalized and b) weighted and summed to.achieve a combined distribution methods are demonstrated to provide accurate combined distributions when the drop size distribution shapevaries throughout the spray pattern (the Flat spray results), but weighting is not necessary with the spraycharacteristics are mostly uniform over the spray pattern (Internally air-atomized Multi-Orifice results).However, the normalization and combination methods are still useful and recommended. The finding on thisinvestigation may serve as a guide to future researchers, to provide holistic spray drop size distributions thatare accurate and representative of the entire spray plume. Acknowledgements The authors would like to acknowledge and thank Krunal Patel and Ben Bridges of Spraying SystemsCo. for their efforts in the laboratory in support of this work. ( References ) [1] Bade, K.M., Schick, R. J., Generating Planar Statistics from Point Measurements in a Spray, Atom-ization and Sprays, Submitted, pp. 1-17, 2015. ( [2] Lefebvre, A. H., Atomization and Sprays, C ombustion: An International Series, Hemisphere PublishingCorporation,1989. ) ( [3] Mugele, R. A., Evans, H . D . , D r oplet Size Distributions of Sprays, In d ustrial & Engineering Chemistry,vol. 43, no. 6, p p .1317-1324,1951 ) ( [4] Tishkoff, J. M., Ingebo, R. D ., K ennedy, J. B . (Eds.), Liquid Particle Size Measurement Tech n iques,American Society for Testing and Materials ( A STM) special technical publication 848, 1984. ) ( [5] Dodge, L .G., Rhodes,D. J.,Reitz, R. D. , Drop-Siz e Measurement Techniques for Sprays : Comparisonof Malvern Laser-Diffraction and Aerometrics Phase/Doppler, Applied Optics, vol. 2 6 , no. 1 1 , p p . 2144-2154,1987. ) ( 6] A lbrecht, H.-E. , Borys, M., Damaschke, N., Tropea, C., Laser Doppler and Phase Doppler MeasurementTechniques, S pringer-Verlag B e rlin H e idelberg, 2003. ) ( 13th ICLASS 2015 ) ( [7] Bade, K. M ., S chick, R. J ., Post-Processing of Phase D oppler Interferometry Data for P l anar SprayCharacteristics, ILASS-Americas 25th Annual Conference on Li q uid Atomization and Spray Systems,Pittsburgh, PA, May 5 - 8, 2 013. ) ( 3] G asoline F uel Injector Spray Measurement and Characterization, SAE Standards Document J2715, SAEInternational, Warrendale, PA, 2007. ) ( [9] Hung, D . L. S . , Harrington, D. L. , Ga n dhi, A. H., Markle, L. E. , Parri s h, S. E. , Shakal, J. S. , S a yar,H., Cummings, S. D., Kramer, J. L. , Ga s oline Fuel Injector Spray Measurement and Characterization-A N e w SA E J27 1 5 Recommended Practi c e, SAE Intern a tional, SAE T e chni c al Paper Series , paper2008-01 - 1068,2008. ) ( [10] Gandhi, A . H., S h akal, J. S . , Markle, L. E.,Hung, D. L. S. , Cummings, S. D., Parrish, S. E., Harrington, D. L ., Sayar, H., Kramer, J. L. , Meinhart , M. A., A New Measurement Standard for the Characterizationof Automotive Fuel S prays, ILASS-Americas 21st Annual Conference in Liquid Atomization and SpraySystems, O rlando, FL, May 18-21, 2 0 08. ) ( [11] Falser, T. D., Parrish, S. E., Spray Measurement T echnology: A R e view, Measurement Science an d Technology, v o l. 26, p p. 1-3 4 , 2 015. ) ( 12 Bade, K. M., Schick, R . J . , Volume D istribution Comparison Methods for 1 D , 2 D , and Point Measure-ment T echniques, ILASS-Americas 21st A nnual Conference on Liquid Atomization and Spray Systems,Orlando, F L, M ay 5-8, 2 008. ) ( [13] Chapple, A . C ., H all, F . R., A D e scription of the D r oplet Spectra Produced by a Fla t -Fan Noz z le,Atomization and Sp r ays, vo l . 3, issue 4 , pp. 4 7 7-488, 1 9 93. ) ( [14] Bade, K. M., Schick, R. J., P hase Doppler Interferometry Volume Fluc Sensitivity to Parametric Settingsand Droplet T r ajectory, Atomization and Spr a ys, vol. 21, issue 7, pp . 53 7 -551,2011. ) ( [15] Bevington, P . R ., R obinson, D. K . , Data Re d uction and Erro r Anal y sis for the P hys i cal Sciences,McGraw-Hill, 3rd Ed., 2003. ) *Corresponding Author: Kyle.Bade@Spray.com In this investigation, methods used to generate combined drop size distributions, from discrete measurement points, are developed and evaluated. A hydraulic, at spray and an internally air-atomized, multi-orifice spray are investigated experimentally; representing common but distinctly difierent sprays. The details of each spray plume are captured with an extensive matrix of measurement points, which are then used to evaluate the drop size distribution difierence across each spray plume, and to calculate combined drop sizedistributions throughout a planar cross-section of each spray. Weighted-average distributions are generated, using the local flux and discrete area at each measurement point, which are relevant physical characteristics within each spray plume. It was found previously by Bade and Schick [1] that measurements should be performed at approximately each 10% interval of the overall spray plume size in order to achieve errors less than 5% for combined spray plume statistics. Also, the measurements should be performed along both the x and y axis for a flat spray, and along a single-axis from the center-to-edge for a multi-orifice air-atomized spray for drop size investigations. The developed methods allow the logical combination ofdrop size distributions, collected at many points, to be used to generate holistic drop size distributions that are representative of a planar cross-section within a spray plume.
确定
还剩6页未读,是否继续阅读?

产品配置单


北京欧兰科技发展有限公司为您提供《喷雾中喷雾几何分布,液滴粒径和速度分布检测方案(激光粒度仪)》,该方案主要用于其他中喷雾几何分布,液滴粒径和速度分布检测,参考标准--,《喷雾中喷雾几何分布,液滴粒径和速度分布检测方案(激光粒度仪)》用到的仪器有LaVision SprayMaster 喷雾成像测量系统、激光相位多普勒干涉仪LDV,PDI,PDPA,PDA、LaVision DaVis 智能成像软件平台
推荐专场


相关方案
更多
该厂商其他方案
更多