


方案详情
文
采用LaVision公司的SprayMaster系统,利用SLIPI技术有效抑制致密喷雾下的照明光束吸收和非照明区域粒子的散射。可以获得喷雾对象中液滴粒径和浓度的分布图。 Artium公司的PDI设备可以为上述测量提供验证和标定参考。
方案详情

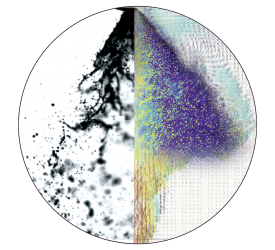
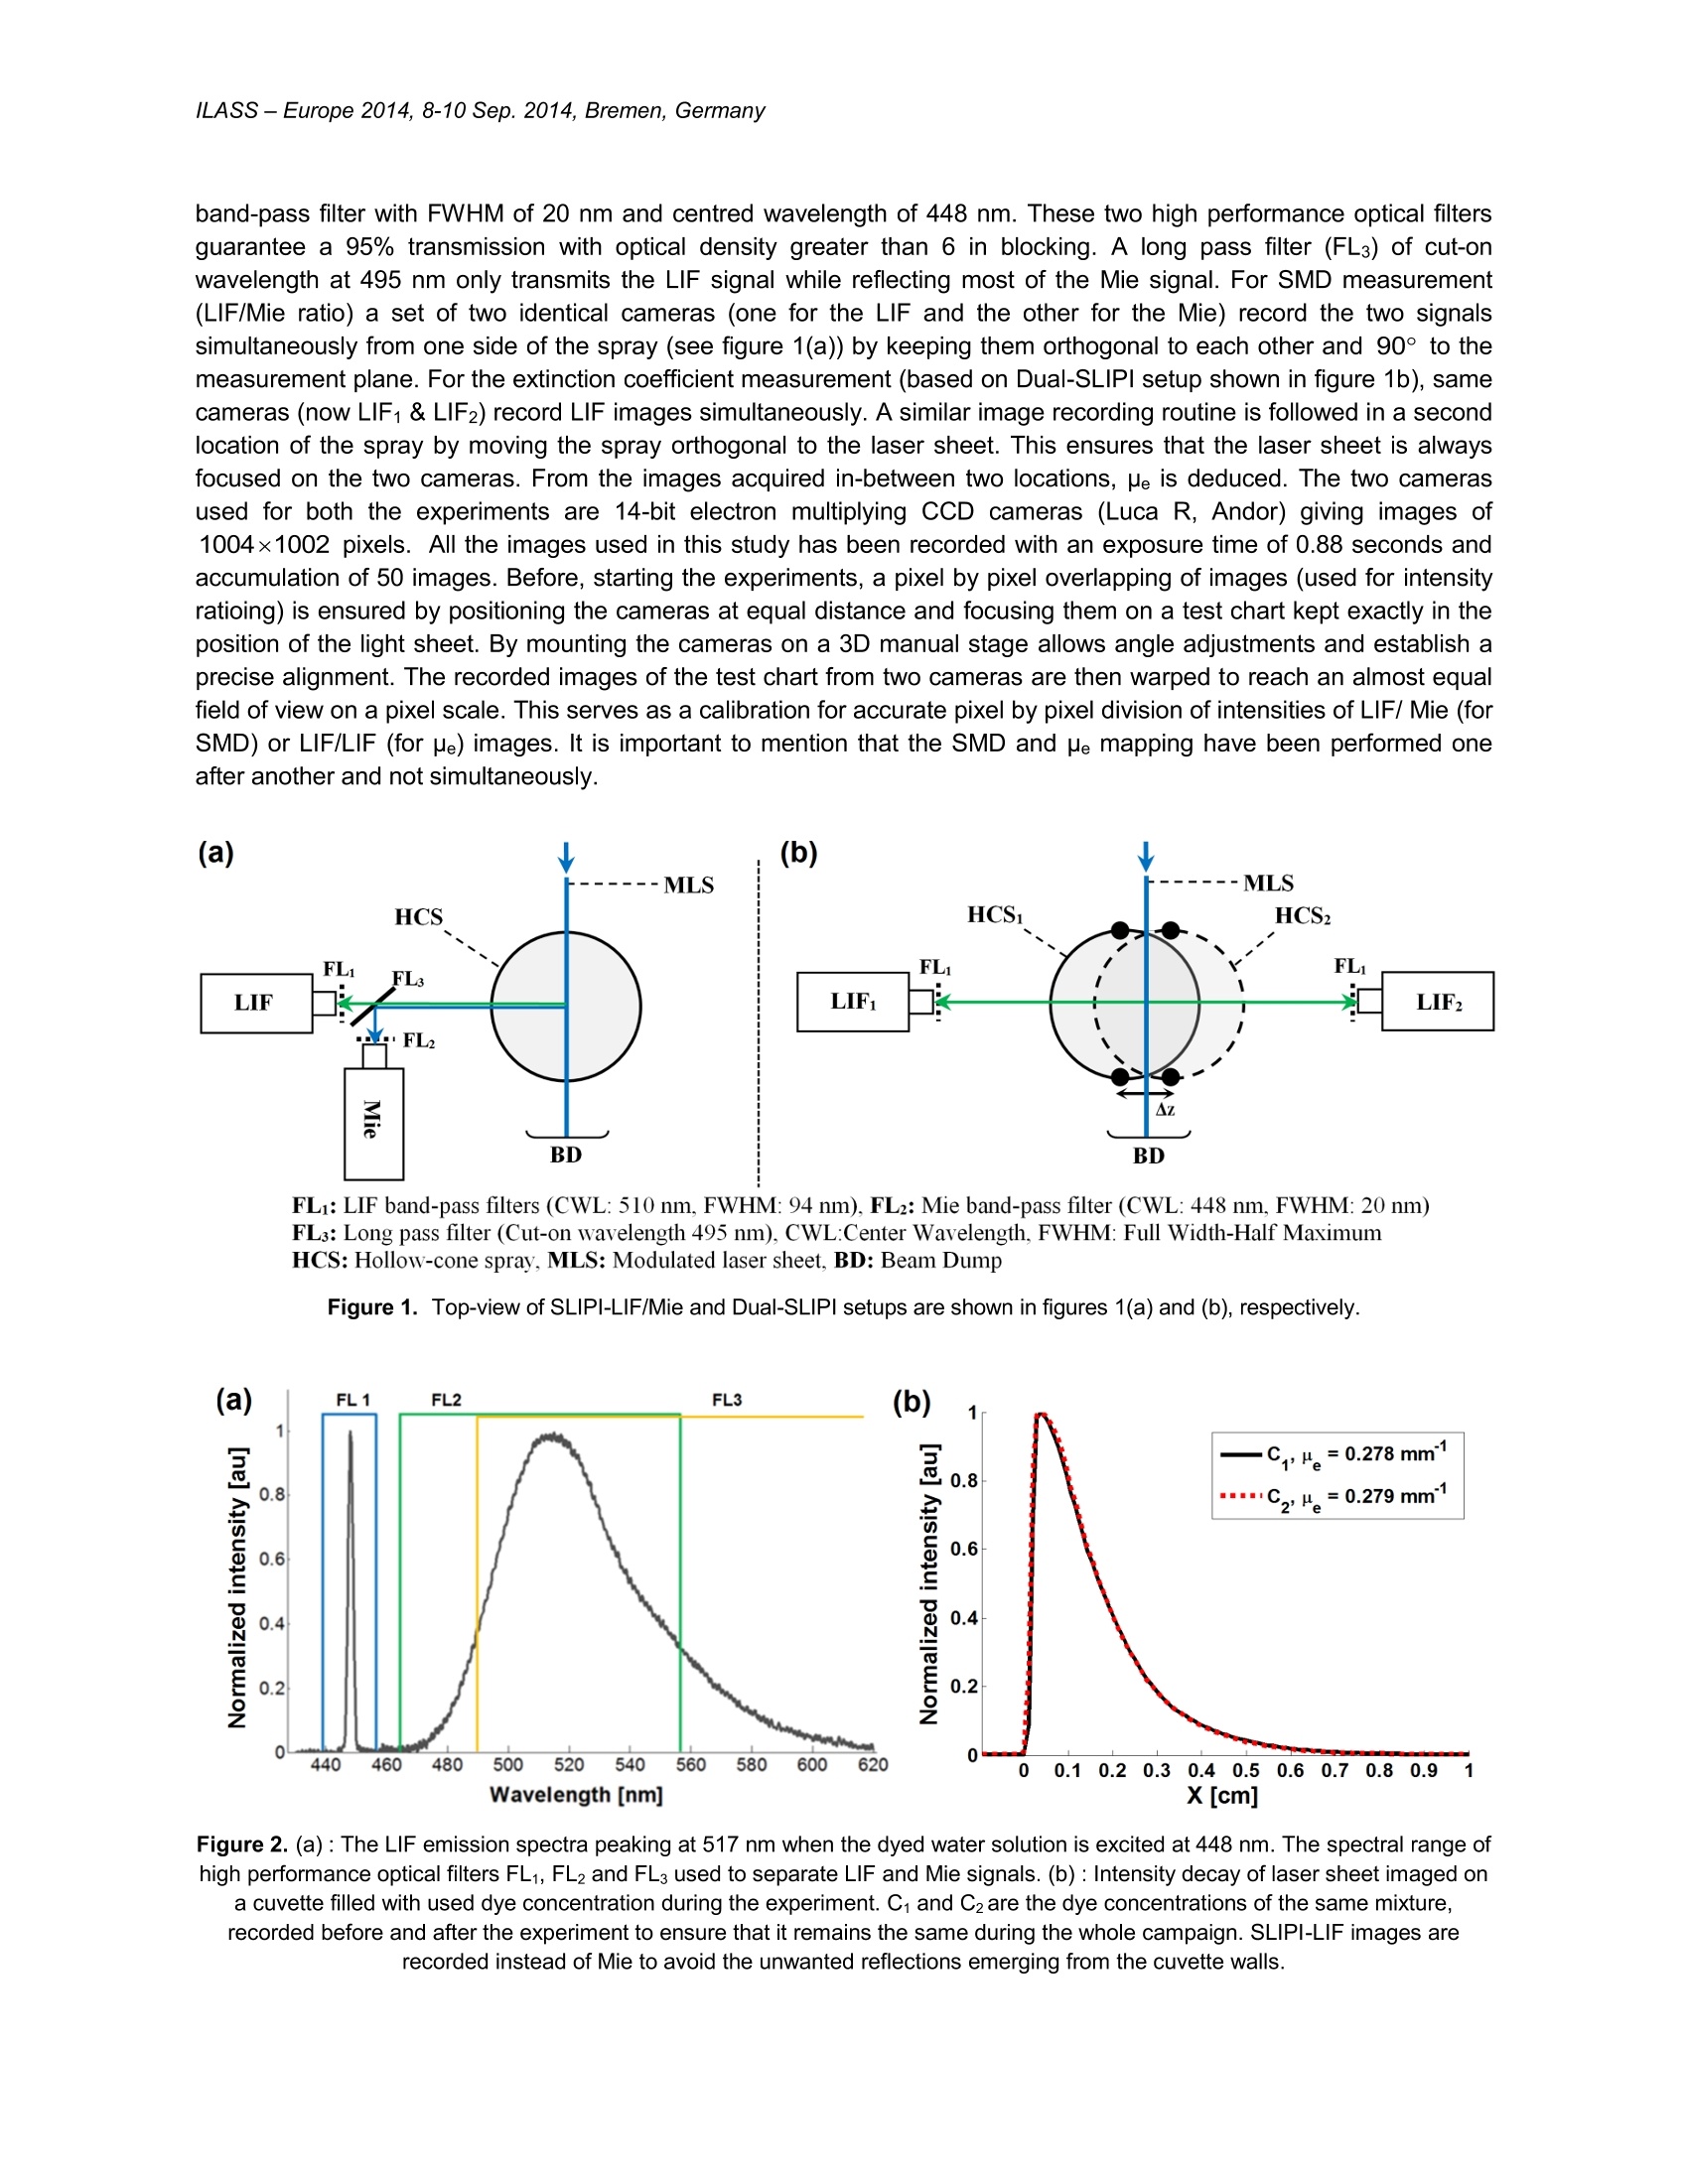
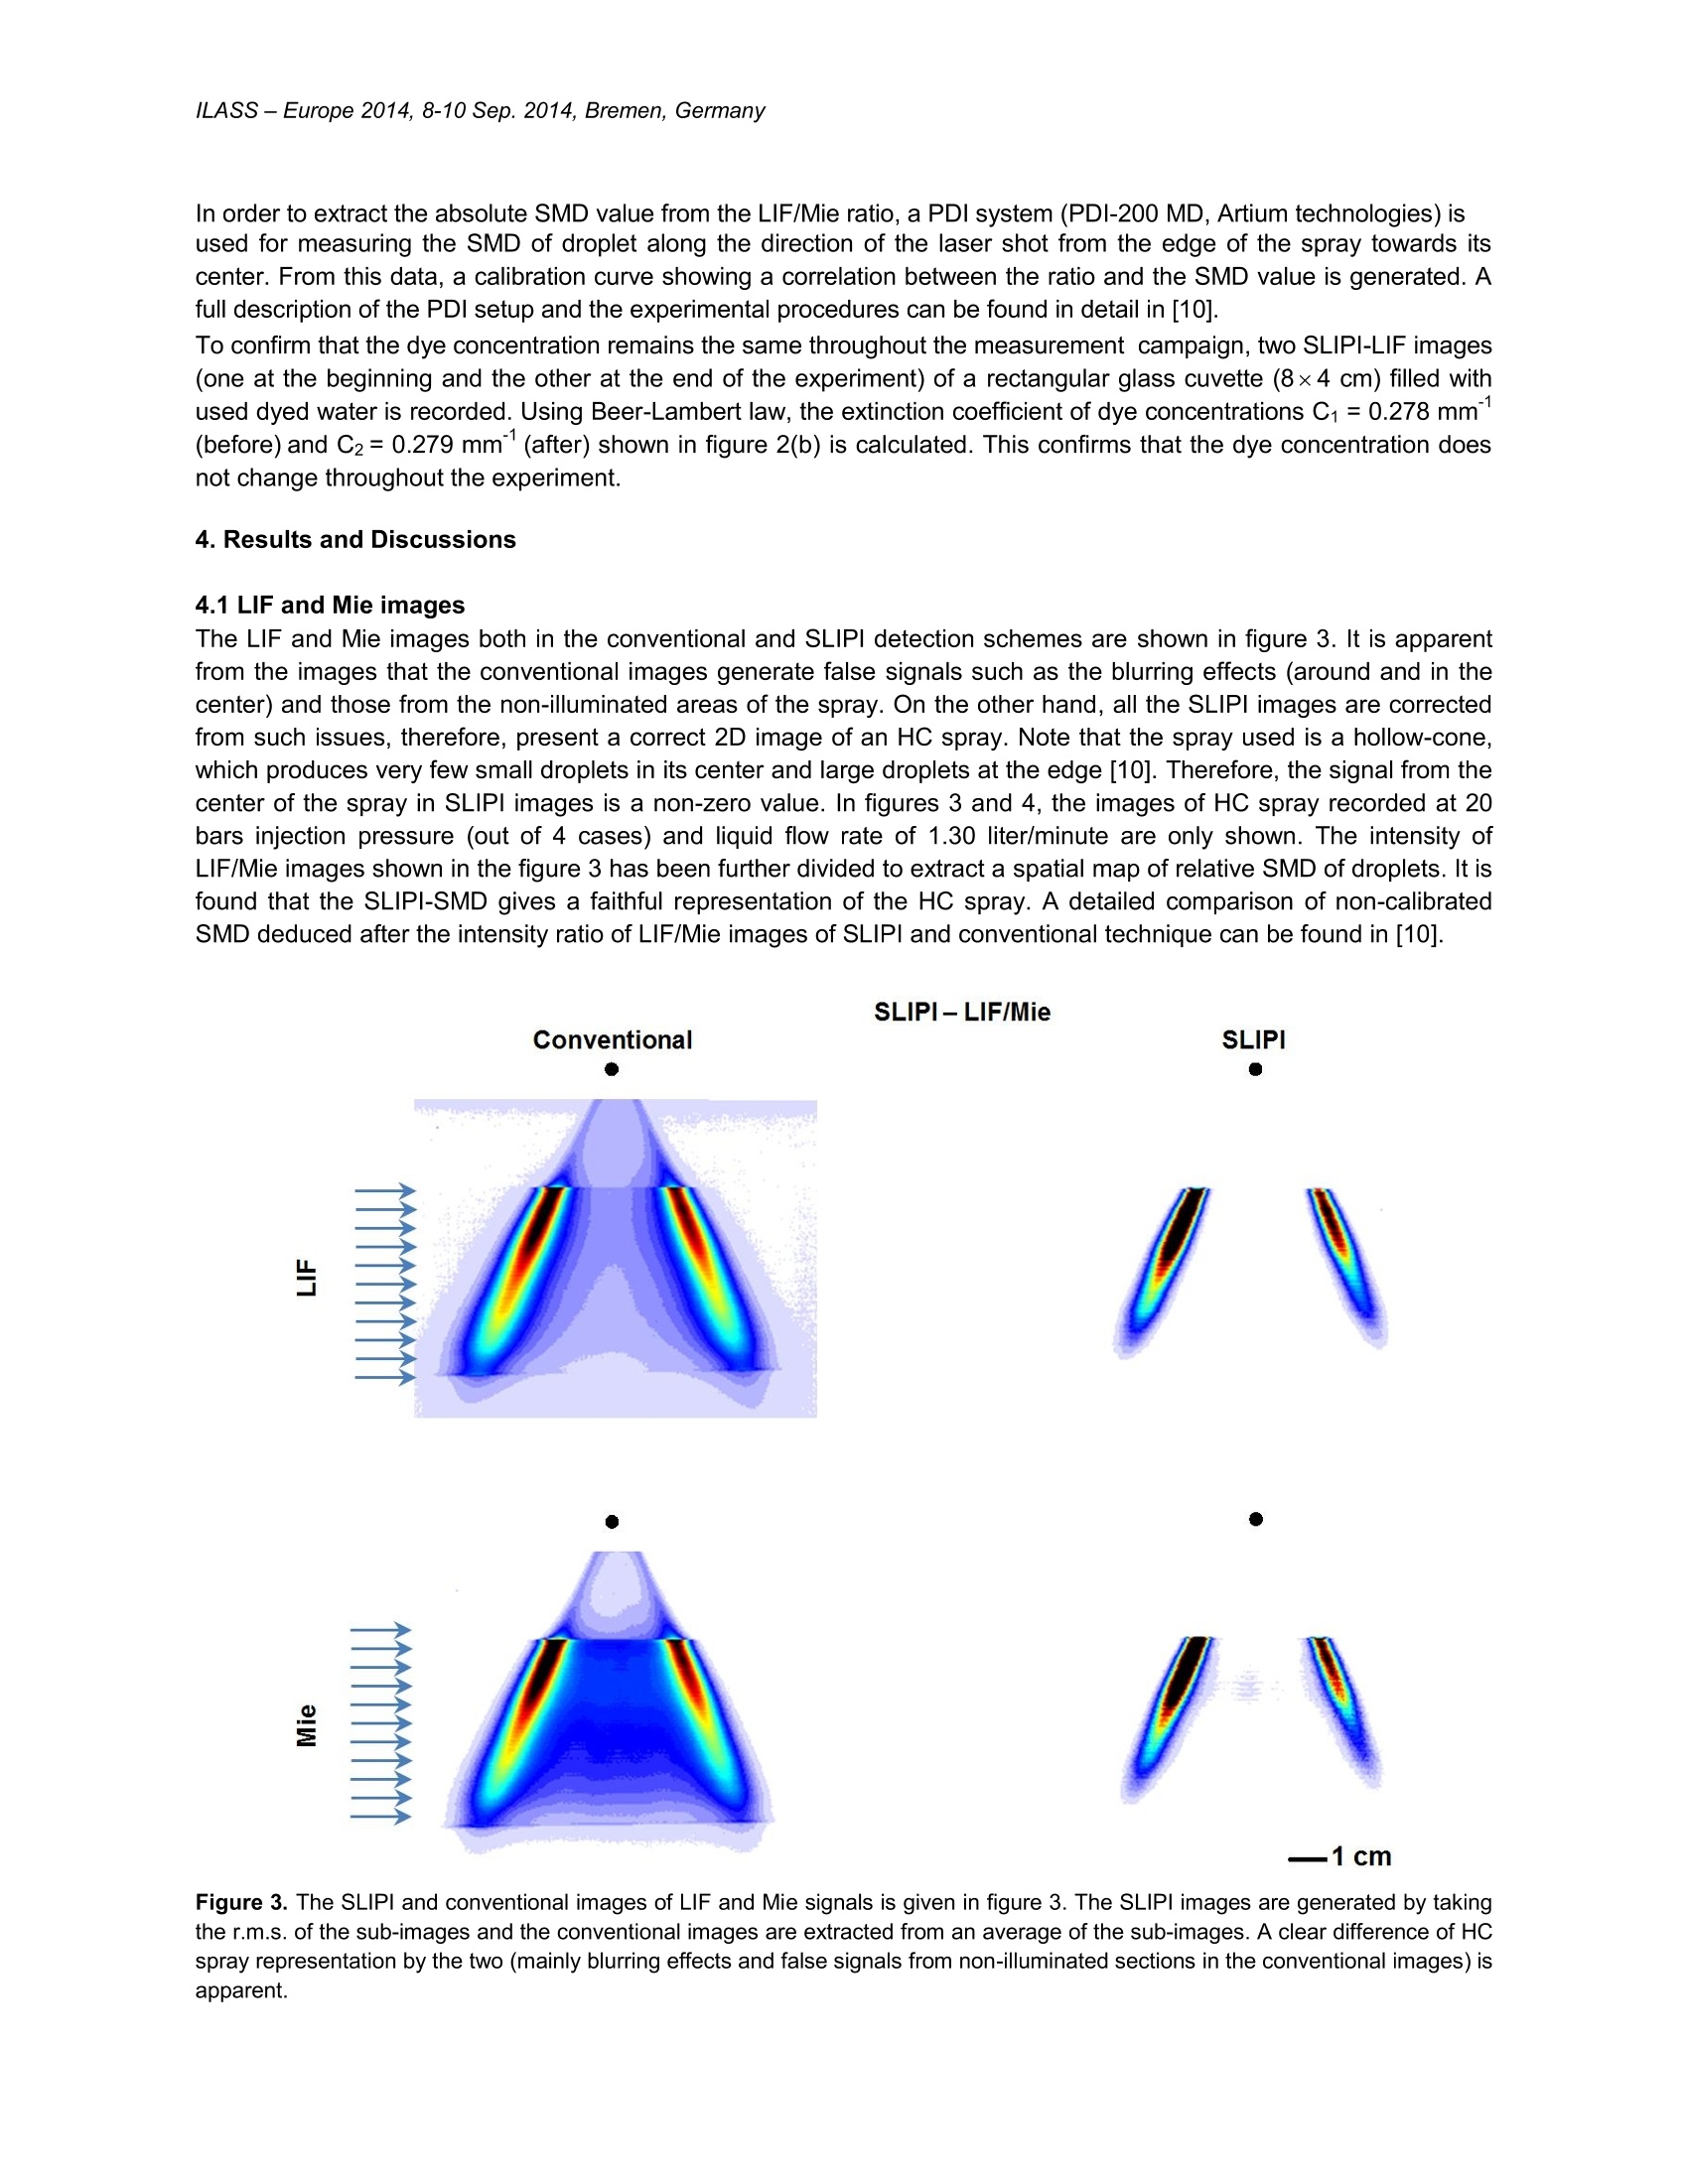
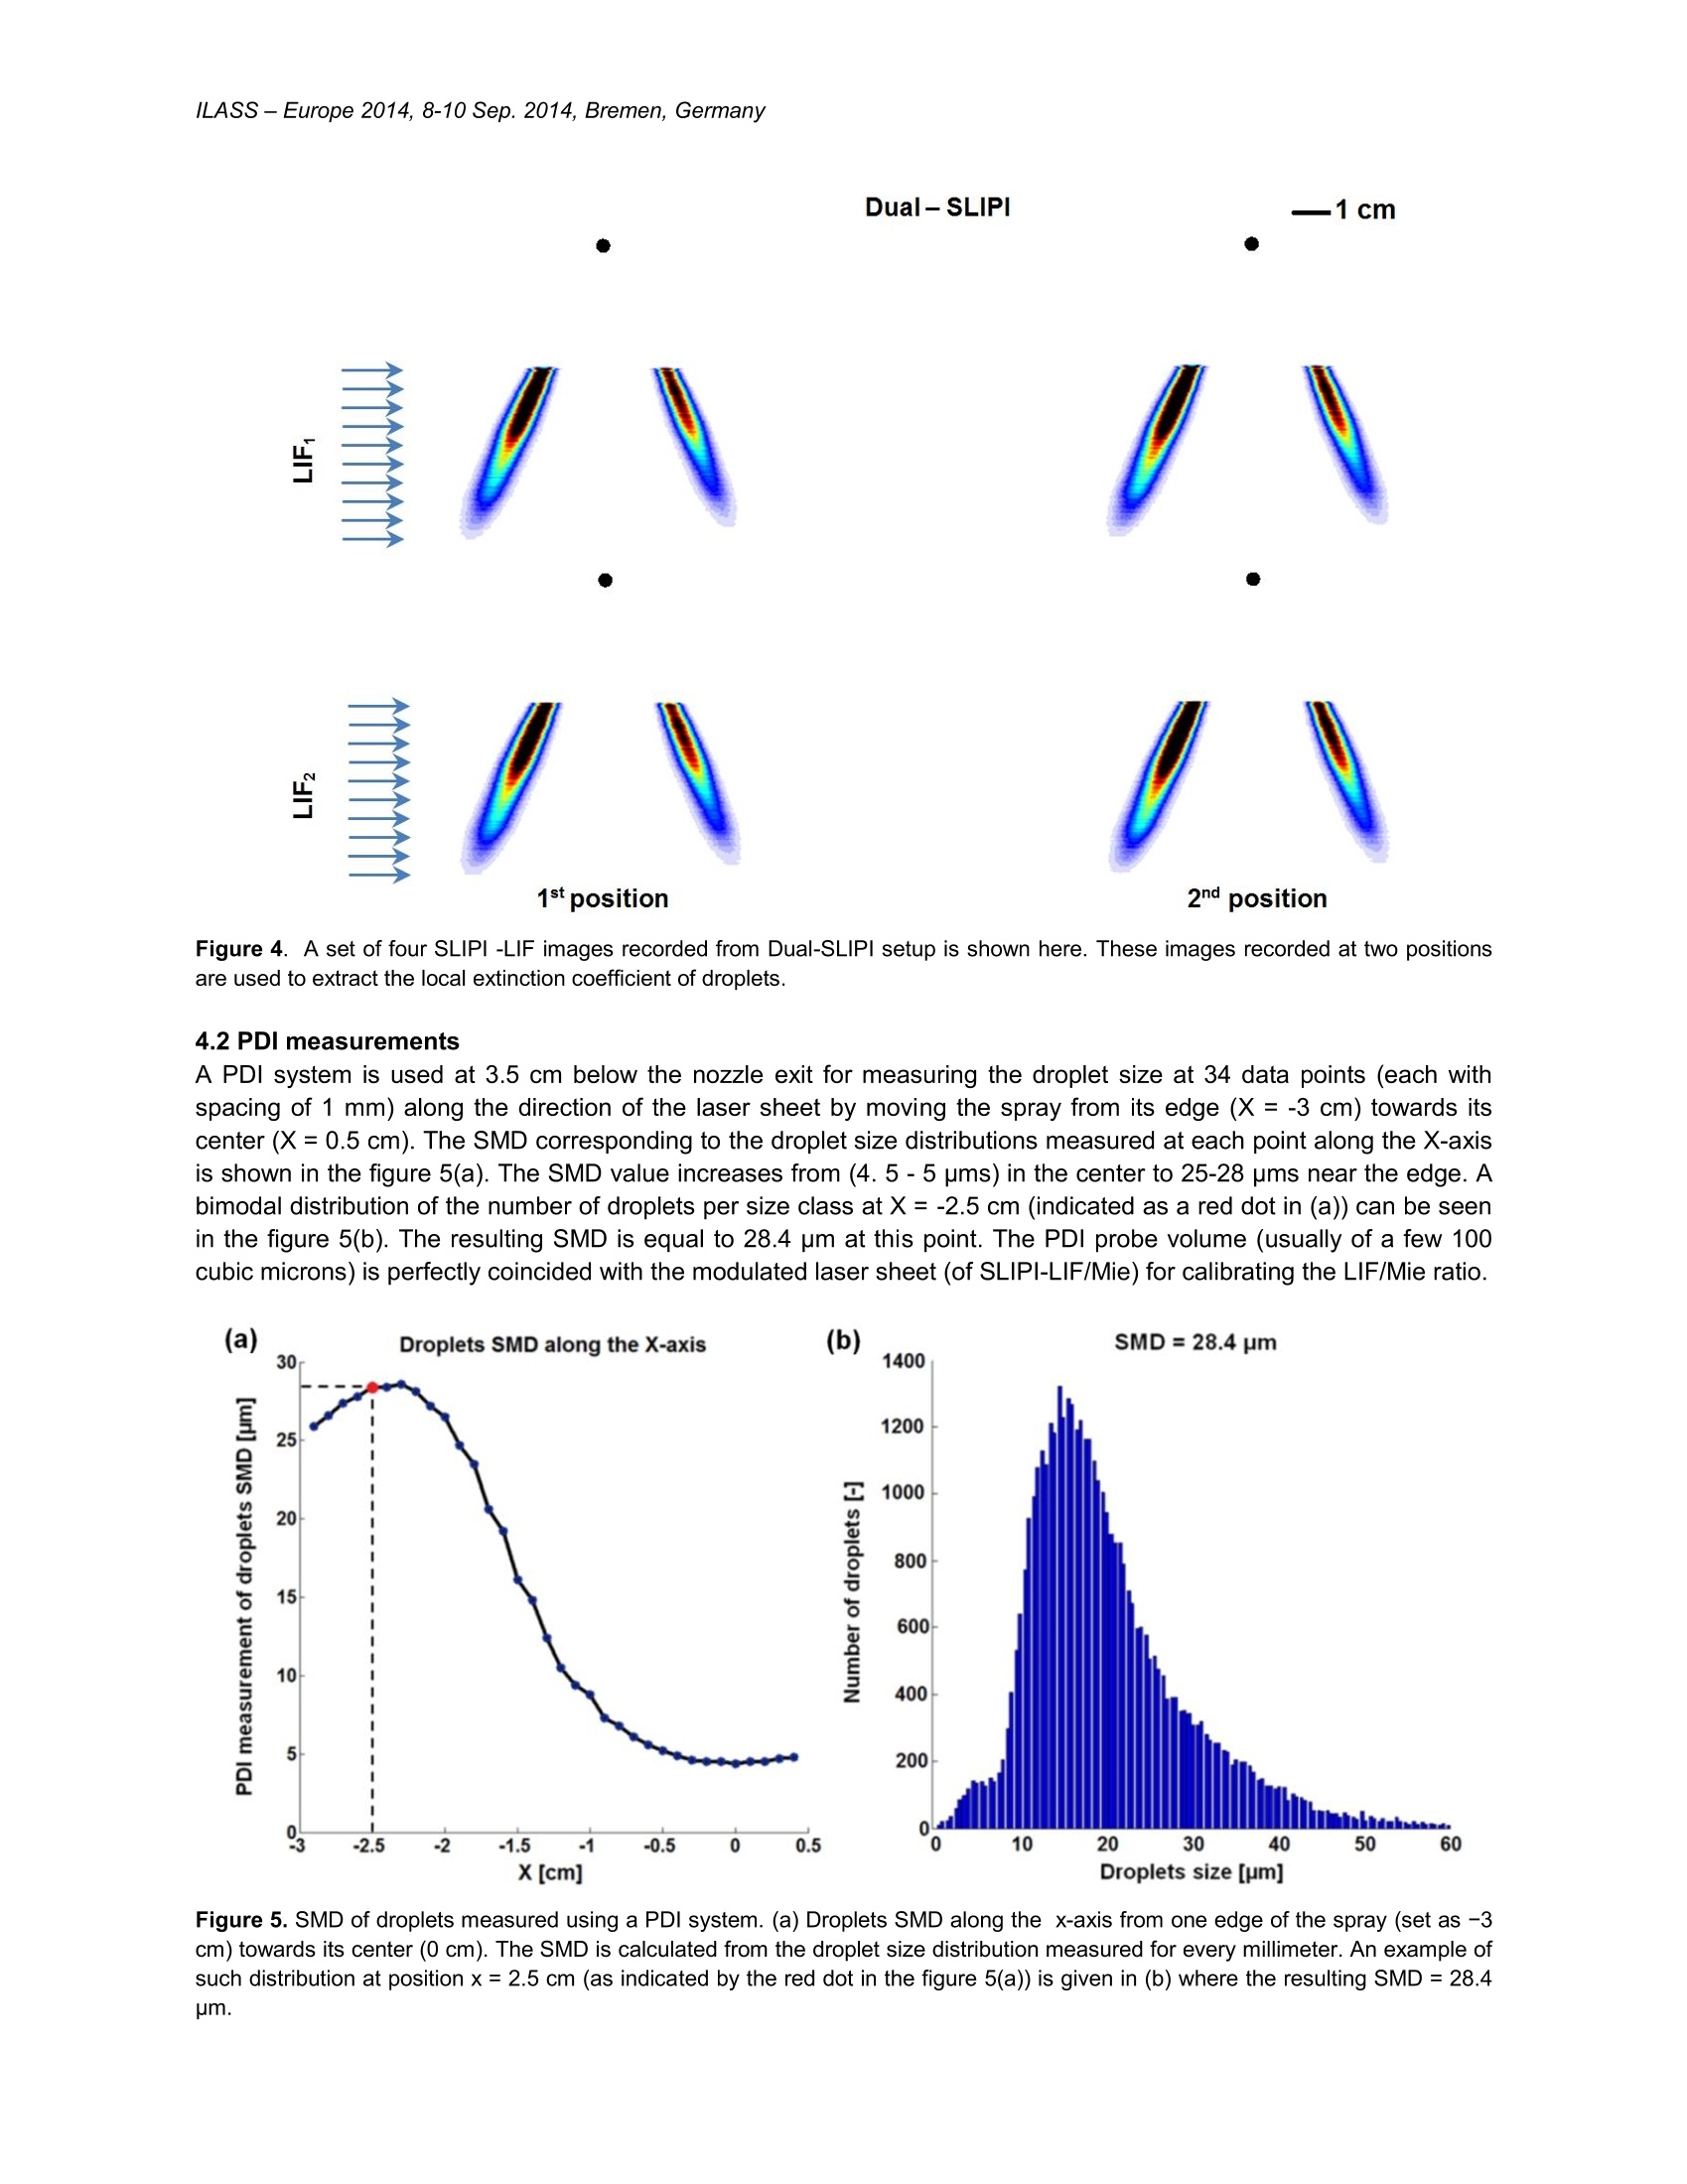
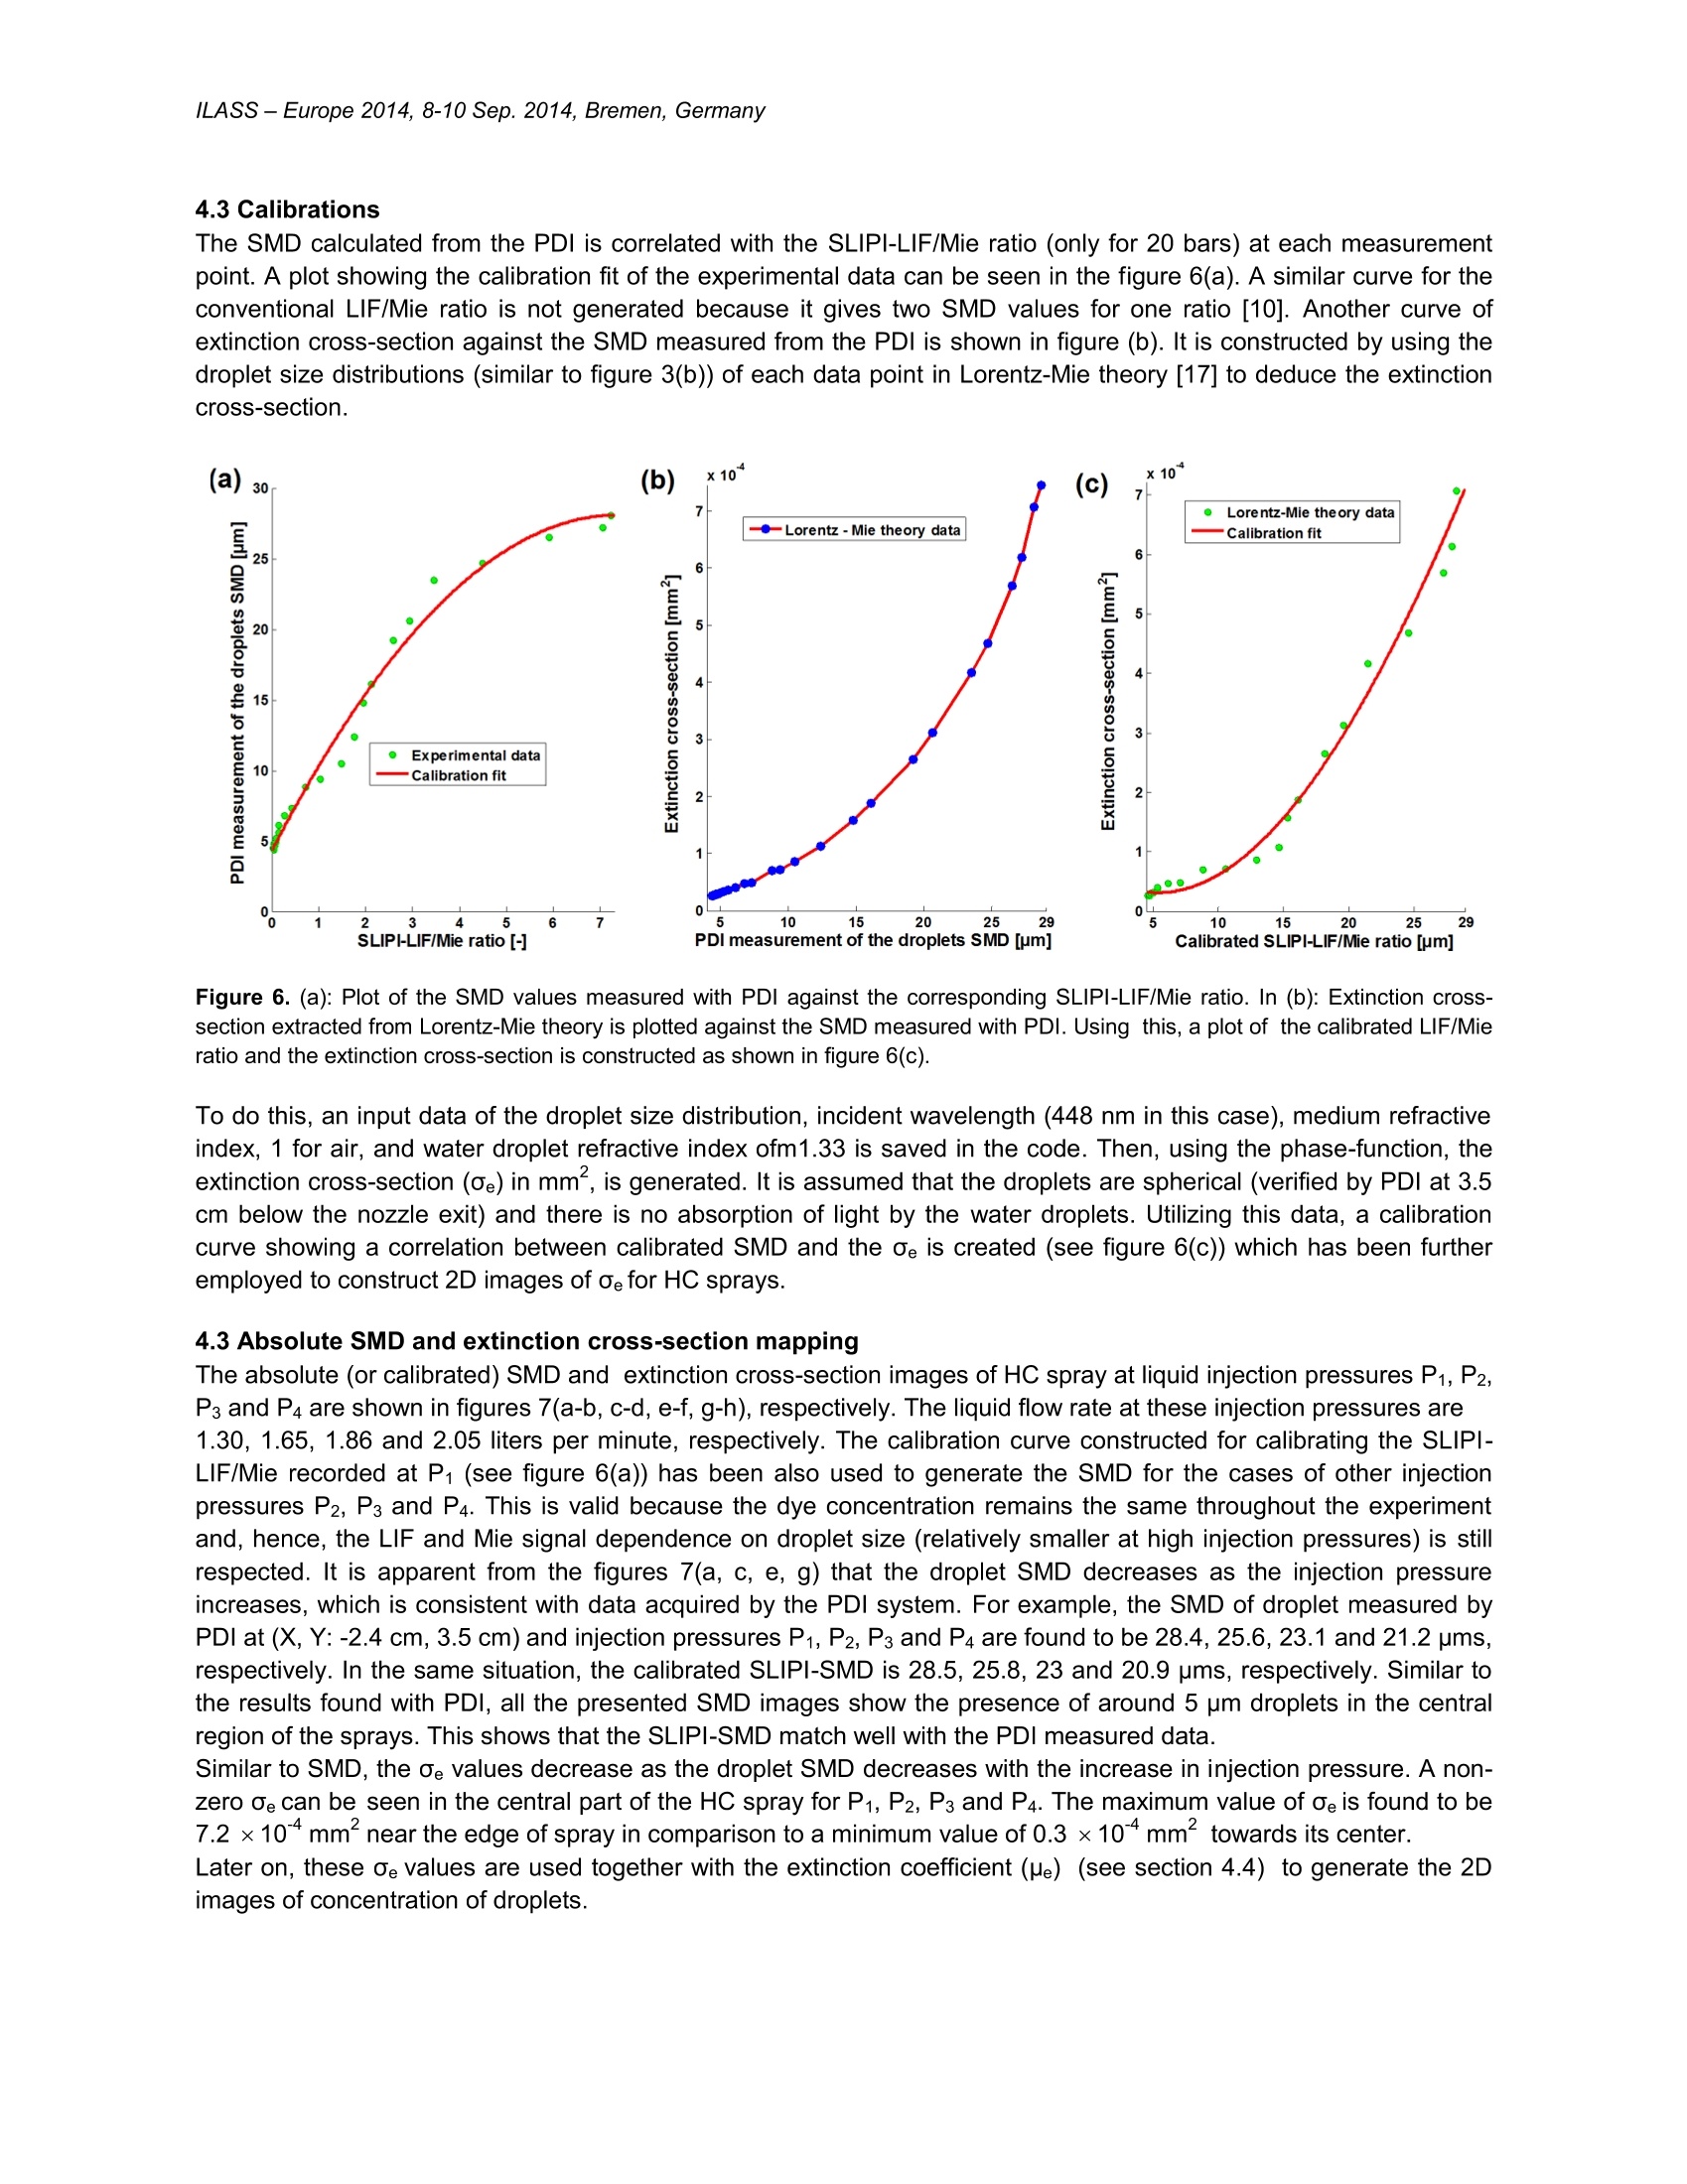
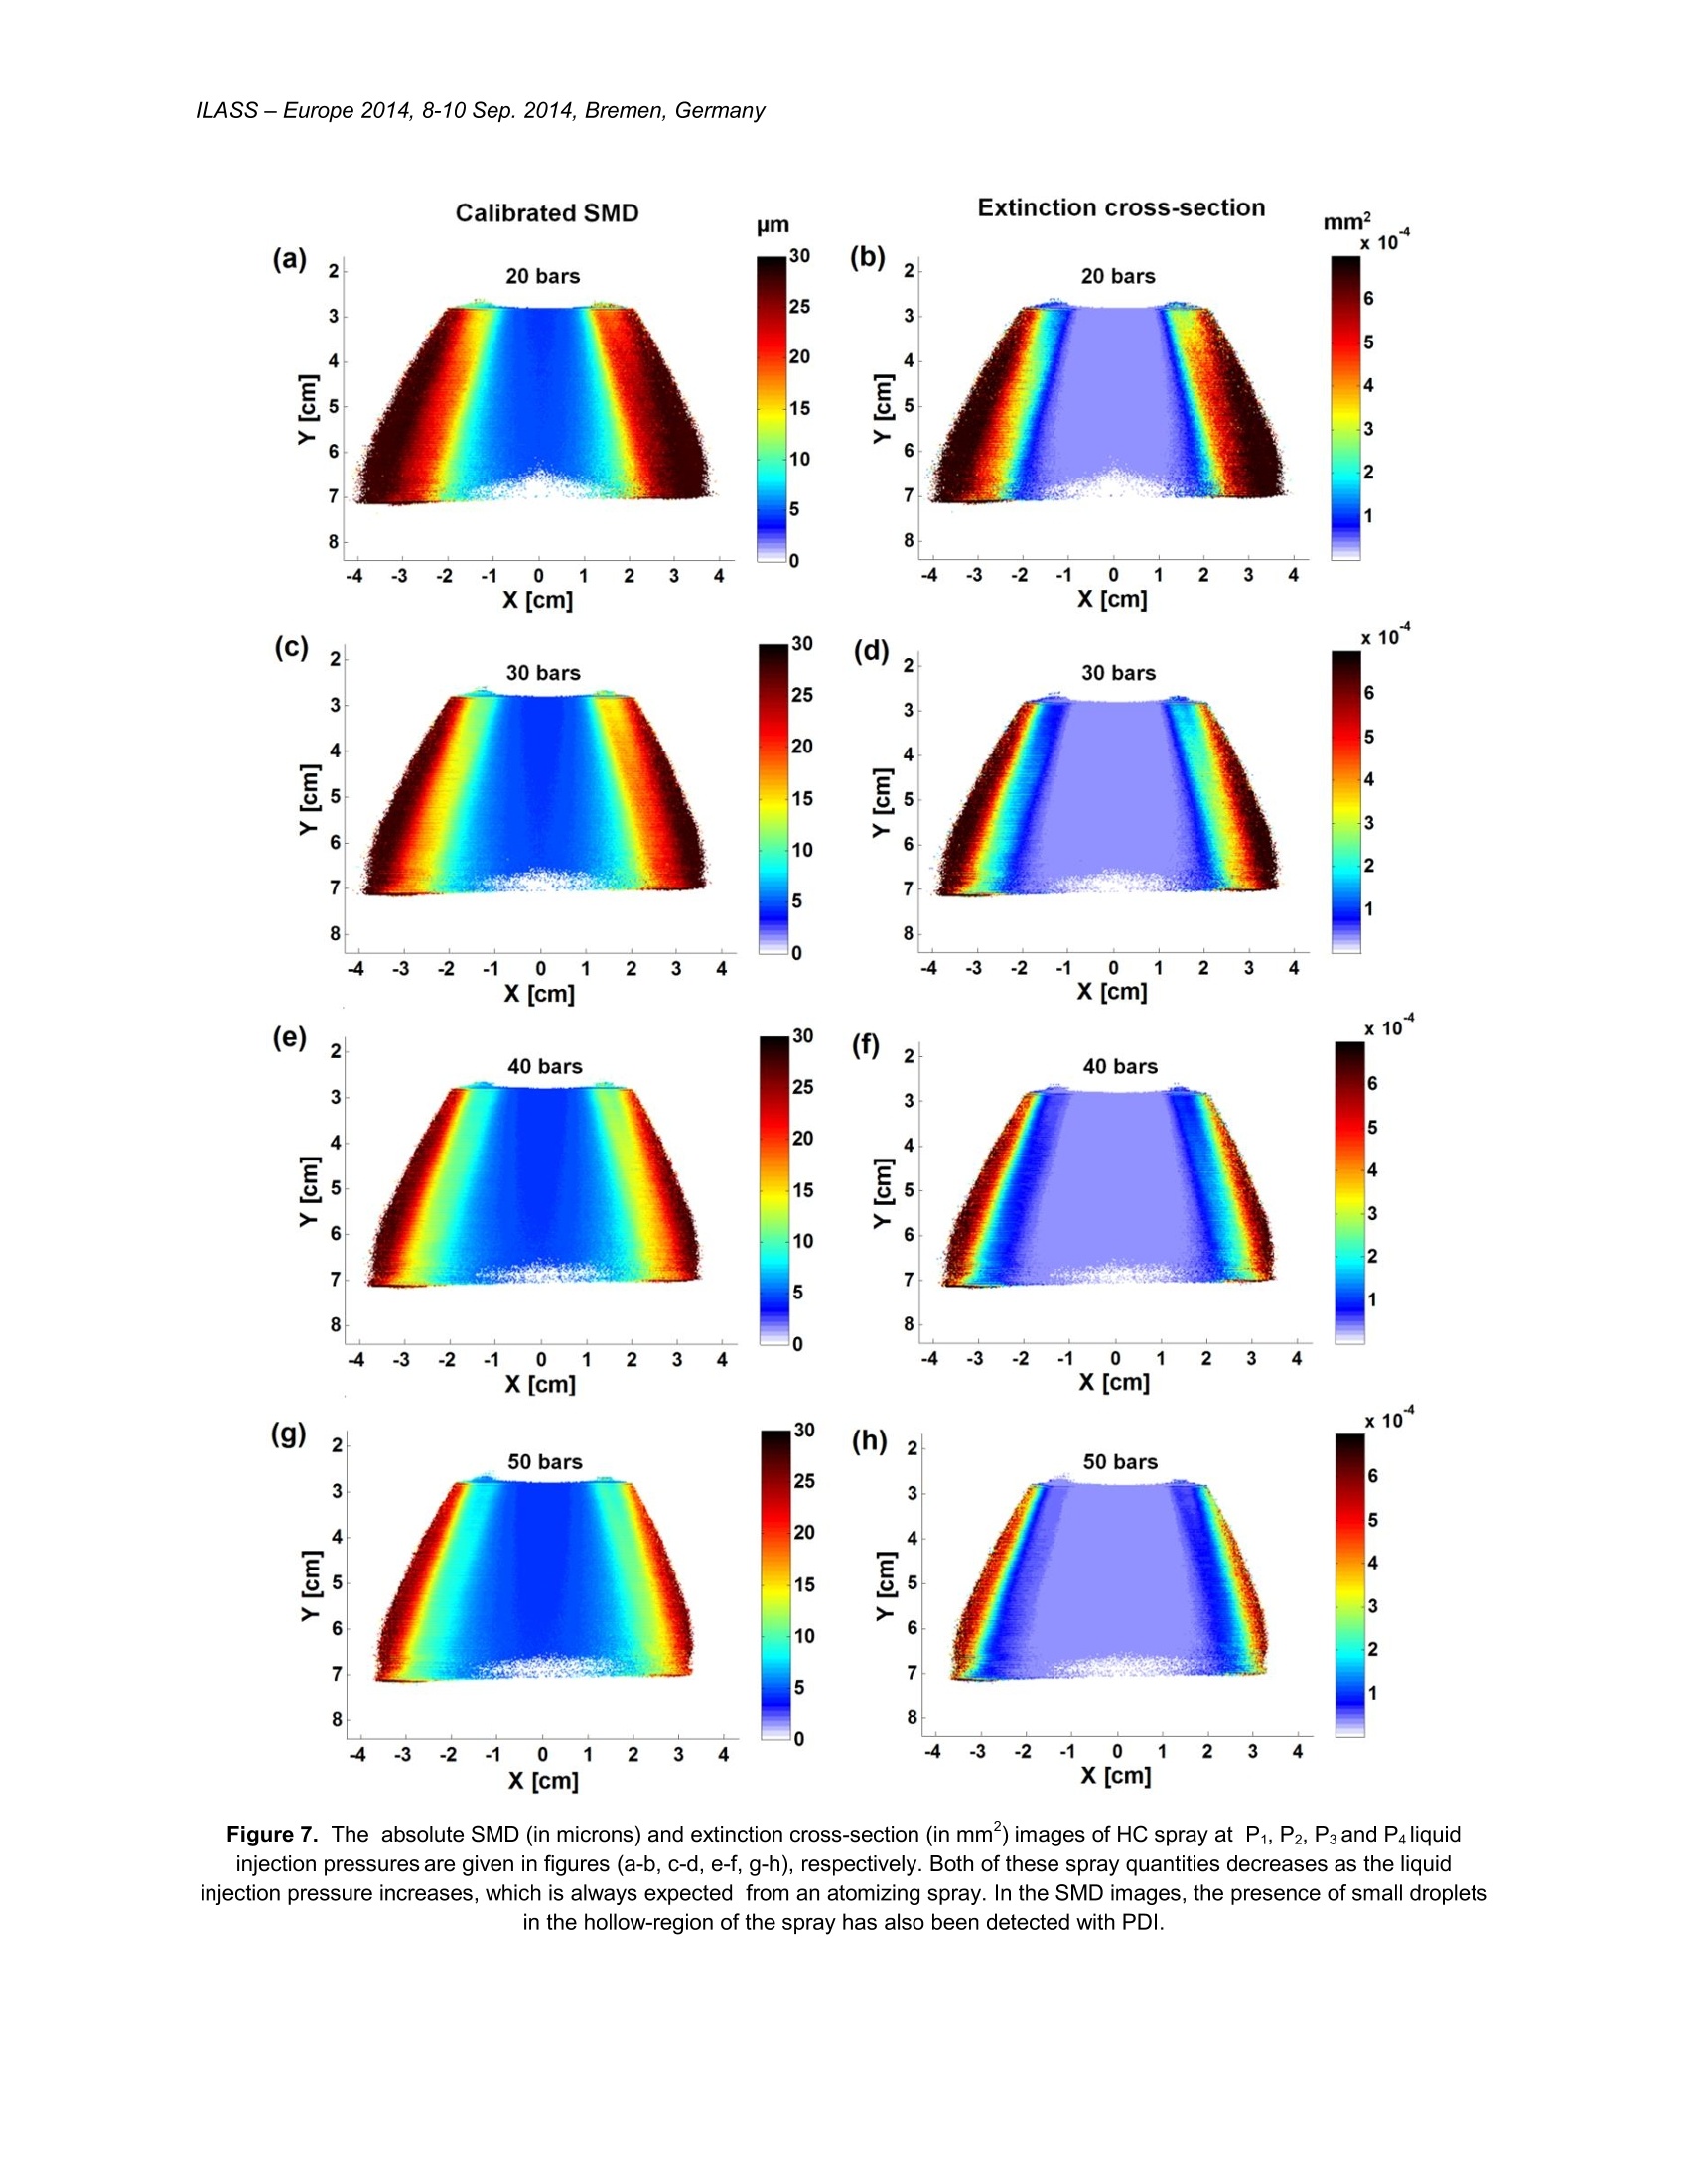
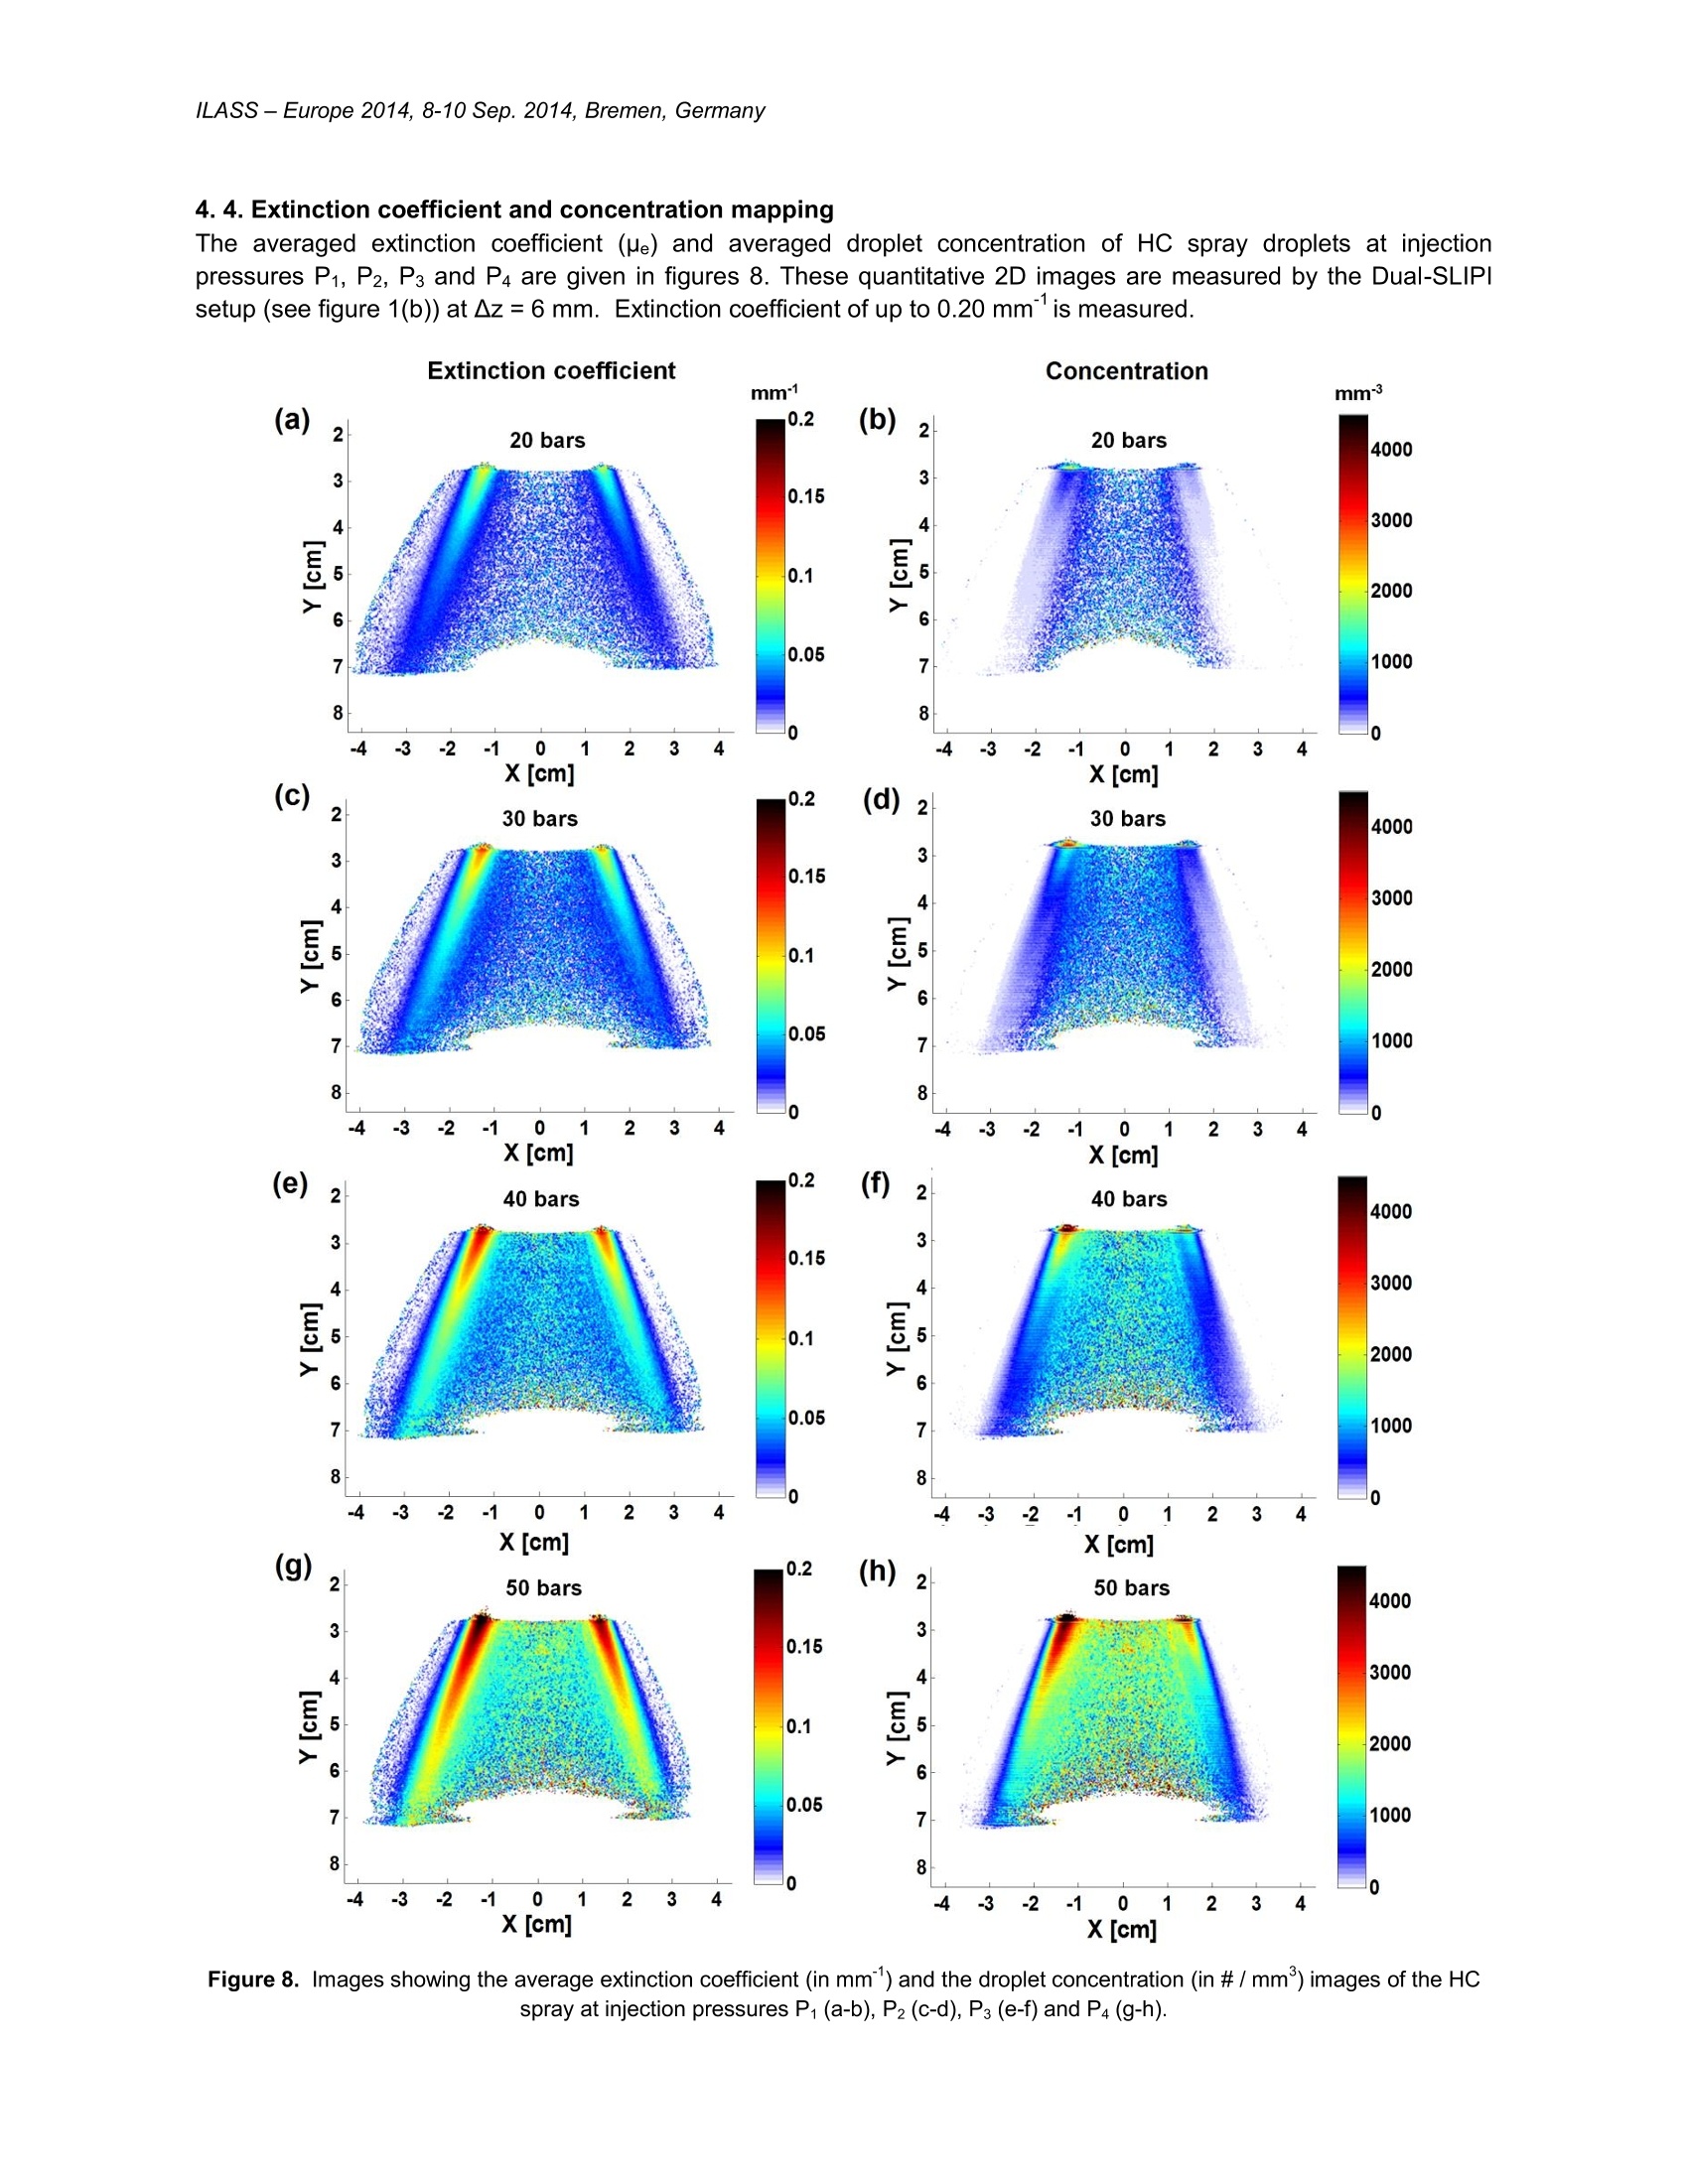
ResearchGateSee discussions, stats, and author profiles for this publication at: https://www.researchgate.net/publication/321864863 ILASS- Europe 2014, 26th Annual Conference on Liquid Atomization and Spray Systems, Sep. 2014, Bremen, Germany Droplet size and concentration mapping in sprays using SLIPI based techniques Conference Paper·September 2014 CITATIONS0 READS 4 authors: SEE PROFILE Some of the authors of this publication are also working on these related projects: Project Spray research using laser diagnostics View project Project Combustion diagnostic via backward lasing effect View project Droplet size and concentration mapping in sprays usingSLIPI based techniques Yogeshwar Nath Mishra*, Elias Kristensson, Marcus Alden and Edouard Berrocal Division of Combustion Physics, Lund University, Box 118, SE-22100,Lund, Sweden *Corresponding author: yogeshwar.mishra@forbrf.Ith.se Abstract Laser diagnostics have become state of the art tools for locally measuring droplet size, velocity and temperature inatomizing sprays. However, when applied in optically dense situations, these techniques suffer from measurementerrors induced by unwanted effects such as laser intensity reduction along the path of propagation (light extinction),attenuation in signal intensity collected by the detector (signal attenuation) and multiple light scattering emerging fromnon-illuminated sections. It has been recently demonstrated that such issues can be addressed by means of imagingtechniques based on structured illumination. Therefore, in this article, Structured Laser Illumination Planar Imaging(SLIPI) is applied in combination with the LIF/Mie ratio method and with the dual configuration (Dual-SLIPI) to extracta reliable 2D map of the Sauter Mean Diameter (SMD) and of the extinction coefficient (re), respectively. This hasbeen applied for the characterization of a hollow-cone water spray at injection pressures ranging between 20 and 50bars. The SLIPI-LIF/Mie ratio is calibrated with measurement data from Phase-Doppler Interferometry (PDI).Furthermore, the measured droplet size distributions have been used to deduce the corresponding averaged dropletextinction cross-section (ae) using the Lorenz-Mie theory. Consequently, by dividing the 2D images of pe by ae amapping of the droplet concentration could also be obtained. The changes of droplets size and concentration as afunction of injection pressure are shown in this article. 1.Introduction For each spray application, the delivery of required droplet size and concentration at a desired location is of primaryimportance. These two quantities play a deciding role in the performance and suitability of any given spray systems.For example, in a liquid fuel combustion device, the evaporation and burning of the droplets are largely affected by thespatial and temporal distribution of droplet size and concentration. Also, the production of subsequent emission ofpollutants is influenced by the initial distribution of droplet size and the fuel-air mixing. Hence, prior to their utilization,there is a clear need for a reliable two-dimension (2D) or even 3D characterization of the spray region,where most ofthe droplets are assumed to be spherical and the spray is fully developed. Such characterization consists in extractinga map of both the droplet size and concentration,preferably with high spatial resolution. In the past, various laser sheet based imaging techniques have been developed; for example the LIF/Mie intensityratio (also referred as Planar Droplet Sizing, PDS) technique proposed by Yeh et al. [1] can rapidly extract dropletrelative SMD in 2D.This has been further developed as an Optical patternator by Sankar et al. [2] and otherresearchers to extract droplet SMD combined with laser extinction measurements [3]. Other planar measurementtechniques based on the intensity ratio(s) are Raman/Mie ratio [4], Exciplex based LIF of vapour/liquid ratio [5],polarization ratio [6] which extract a full-field mapping of spray characteristics (droplet size and liquid-phasedistributions) compared to one-dimensional data provided by PDI [7] and/or rainbow refractometry [8]. However, whilemapping scattering media like sprays, all these techniques do not take into account induced effects from multiple lightscattering in the fluorescence and the elastic scattering signals. The SLIPI technique presents a solution to efficientlysuppress the intensity from multiple light scattering [9]. The effect of multiple light scattering on the PDSmeasurements has been recently demonstrated by Mishra et. al [10]. It is found that the intensity ratio performedwithout multiple scattering removal can induce large errors in SMD extracted even in the case of a fairly dilute spray ofoptical depth (OD) -1 (see [11] for a definition of optical depth). Using Monte-Carlo simulations, Berrocal et al. haveshown that the majority of photons emerging from a spray of OD more than two are multiply scattered [12].In addition,light sheet imaging of sprays is also affected by light extinction issues which must be accounted for (e.g.compensation using a bidirectional illumination, correction scheme based on the Beer-Lambert law [13] or division otofimages such as in the LIF/Mie ratio). The Dual-SLIPI technique [14] circumvents these issues and is capable ofmeasuring the local extinction coefficient (pe), a quantity that is directly related to droplet size and number density. Toverify this technique, Kristensson and co-workers tested it with a homogeneous mixture of water and polystyrenespheres of 0.5 pm in diameters and further applied it on air-assisted solid cone and one six-hole injector water sprays. Similar work was extended for pe imaging in 3D by SLIPI-scan [15] or Tomo-SLITI [16] in sprays. Later on, Dual-SLIPIexperimental results were correlated with numerical calculations based on Large-Eddy Simulation combined withLagrangian Particle Tracking for a non-combusting Diesel spray [17]. Here, Dual-SLIPI measurements (which give pe)are performed in the central region of a hollow-cone (HC) water spray along with the further extension of our previouswork [10] for SLIPI-PDS (which give the droplet SMD) at various injection pressures. Moreover, droplet sizedistributions for each SMD measured by the PDI is used through a Lorenz-Mie code to deduce the correspondingaveraged extinction cross-section(0e). This has been further used to construct a calibration curve by correlating it withthe calibrated SMD. Based on this,2D images of ae are depicted. Finally, the droplet concentration could be deducedin 2D based on the knowledge of Oe and pe. 2. Description of the Imaging Techniques 2.1 SLIPI Structured Laser Illumination Planar Imaging (SLIPI) technique is inspired from the structured illumination microscopy[19]. Berrocal and co-workers developed it for imaging dense spray systems (where the majority of photons leavingthe medium suffers from the multiple scattering)[9]. It is based on introducing a spatial intensity modulation(sinusoidal) in conventional laser sheet imaging. In order to imprint this modulation along the vertical direction of thelight sheet, a Ronchi grating and a spatial filter are used. When the incident illumination from the SLIPI setup crossesa scattering medium like an atomizing spray, the photons that scatters only once (known as singly scattered) whileexiting the spray do“remember” this signature while the photons which interact with the droplets more than once(known as multiply scattered photons) “forget" this modulation.Thus, using a post processing computation algorithm ,a conventional image (comprising both the singly and multiply scattered photons) and a SLIPl image represented onlyby the amplitude of singly scattered photons can be extracted. If a sinusoidal pattern is impressed on a light sheet,the resultant intensity of the image l(x,y) is described as: /(x,y)=c(x,y)+ls(x,y) sin(2trxv+0) (1) where, v represent the modulation frequency anddo, the spatial phase. Here, le(x,y)is the intensity correspondingto singly and multiply scattered photons and, Is(x,y) represents the amplitude of the modulation from the singlyscattered photons only. In order to tag the signature of this modulation over a full image and to experimentally extract the intensity componentof /s(x,y) in Equation 1, a minimum of three intensity modulated recordings (sub-images)1, 120 , and l240 each with aspatial phase difference of 120° are required. A SLIPI image is constructed by means of taking the root-mean square(r.m.s.) of the sub-images, mathematically described as: Similarly, a conventional image can be constructed by averaging the sub-images, given mathematically as: (3) To maintain the very high spatial resolution of the images and to remove all the identical components in subsequentrecordings, a minimum of three sub-images are always needed. However, the recent work of Kristensson et. al [20]have demonstrated that by judiciously choosing the intensity modulation, it is possible to extract a SLIPI image fromtwo recordings which will serve to image the fast transient processes. A detailed description of the SLIPI techniqueand its uses in 2D imaging of sprays can be found in [11]. 2.2 Planar Droplet Sizing (LIF/Mie ratio) The relative SMD (D32) of spray droplets of a dye-doped liquid can be calculated from the ratio of the laser Inducedfluorescence (LIF) and the Mie scattered signal (Mie), where, the SLiF and SMie signals are proportional to the dropletvolume (d’) and surface area (d*), respectively [1, 10]. However, three main conditions need to be fulfilled in order toperform LIF/Mie ratio imaging: (I) Spray droplets must be spherical, (l) all detected photons should be singly scattered and (II) the fluorescence contribution from the gaseous phase should be minimum. If those conditions are respectedwhile using this technique, then, the SMD of droplets, for each camera pixel can be expressed as: Here, Kur and KMie are the measurement components such as detector response, signal collection angle, dyeconcentration and laser power. Initially, it was assumed that the simultaneous detection of LIF and Mie signals at 90 degrees to the measurementplane cancel out or at least keeps the ratio of KLIr/KMie constant. However, Charalampous et al. [21] have shown thatthis ratio should not be considered as constant specifically at side scattering detection. It is found in [21] that theparameters such as the dye concentration, scattering angle, real refractive index strongly affects the d dependence ofthe SMie. The relation between the two was more respected when keeping the detector at 60°. The recent work [10], has demonstrated that a reliable qualitative and quantitative distribution of droplet SMD can beobtained in sprays by combining the SLIPI and PDS techniques. It is shown that even LIF and Mie signals recordedfrom a fairly dilute hollow-cone water spray needs to be corrected from multiple light scattering effects. Previously, asimilar experimental study using SLIPI is performed during the late injection time of a non-combusting diesel enginespray and has emphasized on addressing this issue before employing the intensity ratio [22]. 2.3 Dual-SLIPI Dual-SLIPI is the further extension of the SLIPI technique for the extinction coefficient (pe) imaging by means of theside scattering detection of Mie or LIF signal from both sides of the spray. Two cameras are kept at the same distancefrom the illuminated plane and the measurement is performed by moving the spray in-between two positions.Consequently, this allows the simultaneous view of of the probed sample from both sides of the laser sheet and takesadvantage of the symmetrical scattering properties of light. However, the Dual-SLIPI measurements are performed onthe basis of the following assumptions: (I) spray droplets are assumed to be spherical, (II) the light scattering signalscollected by two cameras is proportionate, (III) signal (all photons) reaching at the two cameras are singly scattered.Considering the Dual-SLIPI setup (see figure 1 (b)) used in this study, two cameras denoted as LIF1 and LIF2 recordthe LIF signals simultaneously, resulting in two SLIPI images. Following this, two more images are recorded aftermoving the spray by a distance of Az. Thus, a total of four acquired images can be denoted as LIF1,P1, LIF1,P2, LIF2,P1and LIF2,P2. P1 and P2 are recording performed at two positions by two LIF cameras. Using these images, pe can bedirectly deduced as: Here, Az is the separation between the two illuminated planes of spray defined by the laser sheet. More details of thetechnique, its theory and the practical applications in rapid 2D mapping of pe can be found in [6]. 3. Description of the experiment 3.1 SLIPI-LIF/Mie and Dual-SLIPI setups The schematic of the SLIPI-LIF/Mie and Dual-SLIPI experimental setup is shown in figures 1(a) and (b),respectively.The center of the spray is illuminated by a modulated light sheet (入~ 448 nm) created by the SLIPI setup [10]. Thelaser system used in the experiment is a collimated continuous wave diode laser giving a maximum output power of1000 milli Watts (mW). The actual laser power reaching at the spray is reduced down to 5% of the initial output powerbecause of light losses incorporated by the grating and the spatial filter. The height and the width of the incident lightsheet traversing the spray is 4.5 ×0.1 centimeters (cm) and initial laser output power is fixed at 950 mW during theexperiments. A steady HC water spray formed from a nozzle of 1 mm orifice diameter (Ordering no. 216.324, Lechler)is investigated at room temperature and atmospheric pressure conditions with injection pressures set at P1= 20 bars,P2=30 bars, P3= 40 bars and P4 = 50 bars, respectively. The water is mixed with Pyranine dye from yellow highlighter’sink which is non-toxic in nature and gives high quantum efficiency at 448 nm. When excited with this wavelength, itgives a broad-band LIF signal peaking at 517 nm. The emission spectra of the dye and the range of a set of threeoptical filters FL1,FL2, and F3 used for spectrally separating the two (LIF/Mie)signals are given in figure 2(a). Filter FL isa LIF band-pass filter of centered wavelength 510 nm and full width at half maximum (FWHM) 94 nm, while FL2 is a Mie band-pass filter with FWHM of 20 nm and centred wavelength of 448 nm. These two high performance optical filtersguarantee a 95% transmission with optical density greater than 6 in blocking. A long pass filter (FL3) of cut-onwavelength at 495 nm only transmits the LIF signal while reflecting most of the Mie signal. For SMD measurement(LIF/Mie ratio) a set of two identical cameras (one for the LIF and the other for the Mie) record the two signalssimultaneously from one side of the spray (see figure 1(a)) by keeping them orthogonal to each other and 90°to themeasurement plane. For the extinction coefficient measurement (based on Dual-SLIPI setup shown in figure 1b), samecameras (now LIF1 & LIF2) record LIF images simultaneously. A similar image recording routine is followed in a secondlocation of the spray by moving the spray orthogonal to the laser sheet. This ensures that the laser sheet is alwaysfocused on the two cameras. From the images acquired in-between two locations, pe is deduced. The two camerasused for both the experiments are 14-bit electron multiplying CCD cameras (Luca R, Andor) giving images of1004×1002 pixels. All the images used in this study has been recorded with an exposure time of 0.88 seconds andaccumulation of 50 images. Before, starting the experiments, a pixel by pixel overlapping of images (used for intensityratioing) is ensured by positioning the cameras at equal distance and focusing them on a test chart kept exactly in theposition of the light sheet. By mounting the cameras on a 3D manual stage allows angle adjustments and establish aprecise alignment. The recorded images of the test chart from two cameras are then warped to reach an almost equalfield of view on a pixel scale. This serves as a calibration for accurate pixel by pixel division of intensities of LIF/ Mie (forSMD) or LIF/LIF (for pe) images. It is important to mention that the SMD and pe mapping have been performed oneafter another and not simultaneously. FLi: LIF band-pass filters (CWL: 510 nm, FWHM: 94 nm), FLz: Mie band-pass filter (CWL: 448 nm, FWHM: 20 nm)FLs: Long pass filter (Cut-on wavelength 495 nm), CWL:Center Wavelength, FWHM: Full Width-Half MaximumHCS: Hollow-cone spray, MLS: Modulated laser sheet, BD: Beam Dump Figure 1. Top-view of SLIPI-LIF/Mie and Dual-SLIPI setups are shown in figures 1(a) and (b), respectively. X[cm] Figure 2. (a): The LIF emission spectra peaking at 517 nm when the dyed water solution is excited at 448 nm. The spectral range ofhigh performance optical filters FLi, FL2 and FLs used to separate LIF and Mie signals. (b): Intensity decay of laser sheet imaged ona cuvette filled with used dye concentration during the experiment. C and C2 are the dye concentrations of the same mixture,recorded before and after the experiment to ensure that it remains the same during the whole campaign. SLIPI-LIF images arerecorded instead of Mie to avoid the unwanted reflections emerging from the cuvette walls. In order to extract the absolute SMD value from the LIF/Mie ratio, a PDI system (PDI-200 MD, Artium technologies) isused for measuring the SMD of droplet along the direction of the laser shot from the edge of the spray towards itscenter. From this data, a calibration curve showing a correlation between the ratio and the SMD value is generated. Afull description of the PDI setup and the experimental procedures can be found in detail in [10]. To confirm that the dye concentration remains the same throughout the measurement campaign, two SLIPI-LIF images(one at the beginning and the other at the end of the experiment) of a rectangular glass cuvette (8×4 cm) filled withused dyed water is recorded. Using Beer-Lambert law, the extinction coefficient of dye concentrations C1 =0.278 mm'(before) and C2= 0.279 mm"(after) shown in figure 2(b) is calculated. This confirms that the dye concentration doesnot change throughout the experiment. 4. Results and Discussions 4.1 LIF and Mie images The LIF and Mie images both in the conventional and SLIPI detection schemes are shown in figure 3. It is apparentfrom the images that the conventional images generate false signals such as the blurring effects (around and in thecenter) and those from the non-illuminated areas of the spray. On the other hand, all the SLIPI images are correctedfrom such issues, therefore, present a correct 2D image of an HC spray. Note that the spray used is a hollow-cone,which produces very few small droplets in its center and large droplets at the edge [10]. Therefore, the signal from thecenter of the spray in SLIPI images is a non-zero value. In figures 3 and 4, the images of HC spray recorded at 20bars injection pressure (out of 4 cases) and liquid flow rate of 1.30 liter/minute are only shown. The intensity ofLIF/Mie images shown in the figure 3 has been further divided to extract a spatial map of relative SMD of droplets. It isfound that the SLIPI-SMD gives a faithful representation of the HC spray. A detailed comparison of non-calibratedSMD deduced after the intensity ratio of LIF/Mie images of SLIPI and conventional technique can be found in [10]. Figure 3. The SLIPI and conventional images of LIF and Mie signals is given in figure 3. The SLIPI images are generated by takingthe r.m.s. of the sub-images and the conventional images are extracted from an average of the sub-images. A clear difference of HCspray representation by the two (mainly blurring effects and false signals from non-illuminated sections in the conventional images) isapparent. Dual-SLIPI 1st position 2d position Figure 4. A set of four SLIPI -LIF images recorded from Dual-SLIPI setup is shown here. These images recorded at two positionsare used to extract the local extinction coefficient of droplets. 4.2 PDI measurements A PDI system is used at 3.5 cm below the nozzle exit for measuring the droplet size at 34 data points (each withspacing of 1 mm) along the direction of the laser sheet by moving the spray from its edge (X=-3 cm) towards itscenter (X=0.5 cm). The SMD corresponding to the droplet size distributions measured at each point along the X-axisis shown in the figure 5(a). The SMD value increases from (4. 5-5 pms) in the center to 25-28 pms near the edge. Abimodal distribution of the number of droplets per size class at X=-2.5 cm (indicated as a red dot in (a)) can be seenin the figure 5(b). The resulting SMD is equal to 28.4 pm at this point. The PDI probe volume (usually of a few 100cubic microns) is perfectly coincided with the modulated laser sheet (of SLIPI-LIF/Mie) for calibrating the LIF/Mie ratio. Figure 5. SMD of droplets measured using a PDI system. (a) Droplets SMD along the x-axis from one edge of the spray (set as -3cm) towards its center (0 cm). The SMD is calculated from the droplet size distribution measured for every millimeter. An example ofsuch distribution at position x=2.5 cm (as indicated by the red dot in the figure 5(a)) is given in (b) where the resulting SMD= 28.4pm. 4.3 Calibrations The SMD calculated from the PDI is correlated with the SLIPI-LIF/Mie ratio (only for 20 bars) at each measurementpoint. A plot showing the calibration fit of the experimental data can be seen in the figure 6(a). A similar curve for theconventional LIF/Mie ratio is not generated because it gives two SMD values for one ratio [10]. Another curve ofextinction cross-section against the SMD measured from the PDI is shown in figure (b). It is constructed by using thedroplet size distributions (similar to figure3(b))of each data point in Lorentz-Mie theory [17] to deduce the extinctioncross-section. 29 Figure 6. (a): Plot of the SMD values measured with PDI against the corresponding SLIPI-LIF/Mie ratio. In (b): Extinction cross-section extracted from Lorentz-Mie theory is plotted against the SMD measured with PDI.Using this, a plot of the calibrated LIF/Mieratio and the extinction cross-section is constructed as shown in figure 6(c). To do this, an input data of the droplet size distribution, incident wavelength (448 nm in this case), medium refractiveindex, 1 for air, and water droplet refractive index ofm1.33 is saved in the code. Then, using the phase-function, theextinction cross-section (ae) in mm², is generated. It is assumed that the droplets are spherical (verified by PDI at 3.5cm below the nozzle exit) and there is no absorption of light by the water droplets. Utilizing this data, a calibrationcurve showing a correlation between calibrated SMD and the oe is created (see figure 6(c)) which has been furtheremployed to construct 2D images of ae for HC sprays. 4.3 Absolute SMD and extinction cross-section mapping The absolute (or calibrated) SMD and extinction cross-section images of HC spray at liquid injection pressures P1, P2,Ps and P4 are shown in figures 7(a-b, c-d, e-f,g-h), respectively. The liquid flow rate at these injection pressures are1.30, 1.65,1.86 and 2.05 liters per minute, respectively. The calibration curve constructed for calibrating the SLIPI-LIF/Mie recorded at P1 (see figure 6(a)) has been also used to generate the SMD for the cases of other injectionpressures P2, P3 and P4. This is valid because the dye concentration remains the same throughout the experimentand, hence, the LIF and Mie signal dependence on droplet size (relatively smaller at high injection pressures) is stillrespected. It is apparent from the figures 7(a, c, e, g) that the droplet SMD decreases as the injection pressureincreases, which is consistent with data acquired by the PDI system. For example, the SMD of droplet measured byPDI at (X, Y:-2.4 cm, 3.5cm) and injection pressures P1, P2, P3 and P4 are found to be 28.4, 25.6,23.1 and 21.2 pms,respectively. In the same situation, the calibrated SLIPI-SMD is 28.5, 25.8, 23 and 20.9 pms, respectively. Similar tothe results found with PDI, all the presented SMD images show the presence of around 5 pm droplets in the centralregion of the sprays. This shows that the SLIPI-SMD match well with the PDI measured data. Similar to SMD, the ae values decrease as the droplet SMD decreases with the increase in injection pressure. A non-zero Oe can be seen in the central part of the HC spray for P1, P2, P3 and P4. The maximum value of oe is found to be7.2×10mm²near the edge of spray in comparison to a minimum value of 0.3×10 mm’ towards its center. Later on, these ae values are used together with the extinction coefficient (ve) (see section 4.4) to generate the 2Dimages of concentration of droplets. Calibrated SMD um 30 25 20 15 10 5 x10 X [cm] x10° 30 (f) 2 40 bars 6 25 3 5 20 4 4 15 3 10 6 2 7 5 8 0 -4 -3 -2 -1 0 1 2 3 4 X [cm] x 10~ (g) 30 2 (h)2 50 bars 50 bars 6 25 3 3 5 20 4 4 4 15 5 3 6 10 6 2 7 7 5 8 8 0 -1 0 2 3 4 4 -3 -2 -1 0 -3 -2 2 3 4 4 X[cm] X [cm] Figure 7. The absolute SMD (in microns) and extinction cross-section (in mm²) images of HC spray at Pi, P2, Ps and P4liquid injection pressures are given in figures (a-b, c-d,e-f, g-h), respectively. Both of these spray quantities decreases as the liquidinjection pressure increases, which is always expected from an atomizing spray. In the SMD images, the presence of small droplets in the hollow-region of the spray has also been detected with PDI. 4. 4. Extinction coefficient and concentration mapping The averaged extinction coefficient (pe) and averaged droplet concentration of HC spray droplets at injectionpressures P1, P2, P3 and P4 are given in figures 8. These quantitative 2D images are measured by the Dual-SLIPIsetup (see figure 1(b)) at Az =6 mm. Extinction coefficient of up to 0.20 mm" is measured. Extinction coefficient Concentration Figure 8. Images showing the average extinction coefficient (in mm") and the droplet concentration (in #/ mm) images of the HCspray at injection pressures P1 (a-b), P2 (c-d), Ps (e-f) and P4 (g-h). The increase in pe values at higher injection pressure is expected because in those conditions the droplet size reduces(confirmed by SLIPI-SMD images and PDI data) while the concentration increases.For example, at 40 and 50 bars, thenumber of droplets increases from 1700 to 1850 for the same size (13.2 pm) class (measured by PDI), therefore, anincrease in pe can be seen in the center of the spray and near the two tails of HC spray. As extinction coefficient, pe,can be theoretically extracted from the product of the concentration and to the extinction cross-section, Oe, it isdesirable to achieve a reliable and quantitative 2D map of concentration of droplets using the current setup. Hence,the concentration of droplets of HC sprays is shown in figures 8(b, d, g, h) for injection pressures P1, P2, P3 and P4,respectively. These are extracted by dividing the 2D images of pe (deduced from Dual-SLIPI) and the oe (using theLorenz-Mie theory on the measured SMD). The concentration values depict the number of droplets of per size class inper mm’ volume. The images show that the concentration of small droplets increases as the injection pressureincreases. However, a lower concentration of relatively larger droplets (near the spray edge) is apparent. Forexample, the number of droplets of diameter 7-8 pms are around 5000 in per mm in comparison to only 50-150droplets of size ranging between 20-25 pms. Thus, low values of number of droplet of large diameter towards theboundary of HC spray and very high values of concentration (small droplets) in the midway can be seen. As theinjection pressure increases, the larger droplets break into smaller droplets, therefore, the size class of larger dropletsdiffers significantly (reduces as well) in a unit volume, while the number of smaller droplets increases significantly.This has been confirmed by the PDI measurements (reduction of droplet size distributions with increase in liquidinjection pressure). 5. Conclusions In this study, SLIPI LIF/Mie and Dual-SLIPI have been applied for the characterization of a hollow-cone water spray.When applying these two techniques together, the diagnostic is capable of revealing a faithful two-dimensionaldistribution of droplets SMD, extinction cross-section, extinction coefficient and droplets concentration. Theseation provides valuable insights regarding the structure of the droplet field from the spray region. It is also veryanalyzing and evaluating the performance of an injector at various conditions of operations. The next stepwill now focus on the precision and accuracy of the measurement. Finally, 3D tomographic reconstructions of thespray structure will, in a near future, be operated by performing the same measurements while rotating the spraynozzle. Acknowledgements The authors would like to thank Dr. H. Voges from LaVision GmbH and Dr. W. Bachalo from Artium Technologies Inc.for loaning the PDI system. The Swedish Research Council is acknowledged for providing the financial support forthe Project 2011-4272. Funding support from the European Research Council Advanced Grant DALDECS is alsohighly appreciated. References ( [1] Yeh, C. N., Kosaka, H. and Kamimoto, T., 1993, Proceedings of the 3rd Congress on Optical P a rticle Sizing. ) ( [2] Sankar, S. V., Maher, K. E. , Robart, D. M. and Bachalo,W.D., 1999, J. Eng. Gas Turbines Power, 121 (3), pp. 409-414. ) [3] Koh, H., Kim, D., Shin, S. and Yoon, Y., 2006,Measurement Science & Technology, 17,pp. 2159-2167. ]Malarski, A., Schurer, B., Schmitz, I., Zigan, L.,Flugel, A., and Leipertz, A., 2009, Applied Optics, 48, pp. 1853-1860. | Zeng, W., Xu, M., Zhang,Y., Wang. Z., 2013,Proceeding of Combustion Institute, 34 (1), pp. 1677-1685. [6] Hofeldt, D. L., 1993, Applied Optics 32, pp.7559-67. [7] Bachalo, W. D. and Houser, M. J., 1984, Optical Engineering, 23, pp. 583-590. [8] Roth, N.,Anders, K. and Frohn, A. 1990,Journal of Laser Applications, 2, pp. 37-42. ( [9] Berrocal, E ., Kristensson E., Richter, M., L inne, M. a nd Alden, M., 2008, Optics Express 16, pp. 17870-17881. ) ( [10] Mishra, Y. N., Kristensson,E. and Berrocal, E. , 2014, Op t ics Express, 22, pp. 4480-4492. ) ( [11] Kristensson, E., 2012,"Structured Laser Ill u mination Planar Imaging: Applications for spray diagnostics". ) ( [12] E. Berrocal, l.Meglinski, M. Jermy, 2005, Optics Express, 13 (23), pp. 9181-9195. ) ( [13] Koh, H., Jeon, J., Kim, D., Yoon, Y. and Koo, J.Y.,2003, Measurement Science & Technology, 14, pp . 1829-39. ) ( [14] Kristensson,E., Berrocal E. a n d Alden, M., 20 1 1, Optics Letters, 36, pp. 1656-1658. ) ( [15]Wellander R., B errocal, E., Kristensson E., Richter, M. and Alden, M., 2011, Measurement Science & Technology, 22, 855-861(2011). ) ( [16] Kristensson,E., Berrocal E. and Alden, M., 2012, Optics Express, 20, pp. 14437-14450. ) ( [17] Grosshans, H., Berrocal E. , Kristensson, E., Szasz, R.-Z. and Fuchs, L., Sep. 2.-6. 2012, 12th International Conference onLiquid Atomization and Spray Systems. ) ( [ 18] B errocal, E., 2006, “Multiple sc a ttering of light in optical diagnostics of dense sprays and other complex turbid media". ) ( [19] Neil, M. A. A.,Juskaitis, R. and Wilson, T., 1997, Optics Letters, 22, pp. 1905-1907. ) ( [20] Kristensson, E., Berrocal E . and Alden, M.,2014, Optics Letters 3 9 , pp.2584-2587. ) [21] Charalampous, G. and Hardalupas, Y., 2011, Applied Optics, 50,pp. 1197-1209. ( [22] Berrocal, E., Kristensson E., Hottenbach, P., Alden, M., and Grunefeld, G., 2012, Applied Physics B, 109, pp. 683-94. ) All content following this page was uploaded by Edouard Berrocal on December The user has requested enhancement of the downloaded file. View publication stats Laser diagnostics have become state of the art tools for locally measuring droplet size, velocity and temperature in atomizing sprays. However, when applied in optically dense situations, these techniques suffer from measurement errors induced by unwanted effects such as laser intensity reduction along the path of propagation (light extinction), attenuation in signal intensity collected by the detector (signal attenuation) and multiple light scattering emerging from non-illuminated sections. It has been recently demonstrated that such issues can be addressed by means of imaging techniques based on structured illumination. Therefore, in this article, Structured Laser Illumination Planar Imaging (SLIPI) is applied in combination with the LIF/Mie ratio method and with the dual configuration (Dual-SLIPI) to extract a reliable 2D map of the Sauter Mean Diameter (SMD) and of the extinction coefficient (μe), respectively. This has been applied for the characterization of a hollow-cone water spray at injection pressures ranging between 20 and 50 bars. The SLIPI-LIF/Mie ratio is calibrated with measurement data from Phase-Doppler Interferometry (PDI). Furthermore, the measured droplet size distributions have been used to deduce the corresponding averaged droplet extinction cross-section (σe) using the Lorenz-Mie theory. Consequently, by dividing the 2D images of μe by σe a mapping of the droplet concentration could also be obtained. The changes of droplets size and concentration as a function of injection pressure are shown in this article.
确定


还剩10页未读,是否继续阅读?

产品配置单


北京欧兰科技发展有限公司为您提供《喷雾中液滴粒径和浓度检测方案(激光粒度仪)》,该方案主要用于其他中液滴粒径和浓度检测,参考标准--,《喷雾中液滴粒径和浓度检测方案(激光粒度仪)》用到的仪器有LaVision SprayMaster 喷雾成像测量系统、激光相位多普勒干涉仪LDV,PDI,PDPA,PDA、LaVision DaVis 智能成像软件平台
推荐专场


相关方案
更多
该厂商其他方案
更多