
方案详情
文
This application note demonstrates how to determine a sample’s excitation and emission maxima for obtaining more indepth fluorescence measurements using the 3-D Fluorescence Measurement Program.
方案详情

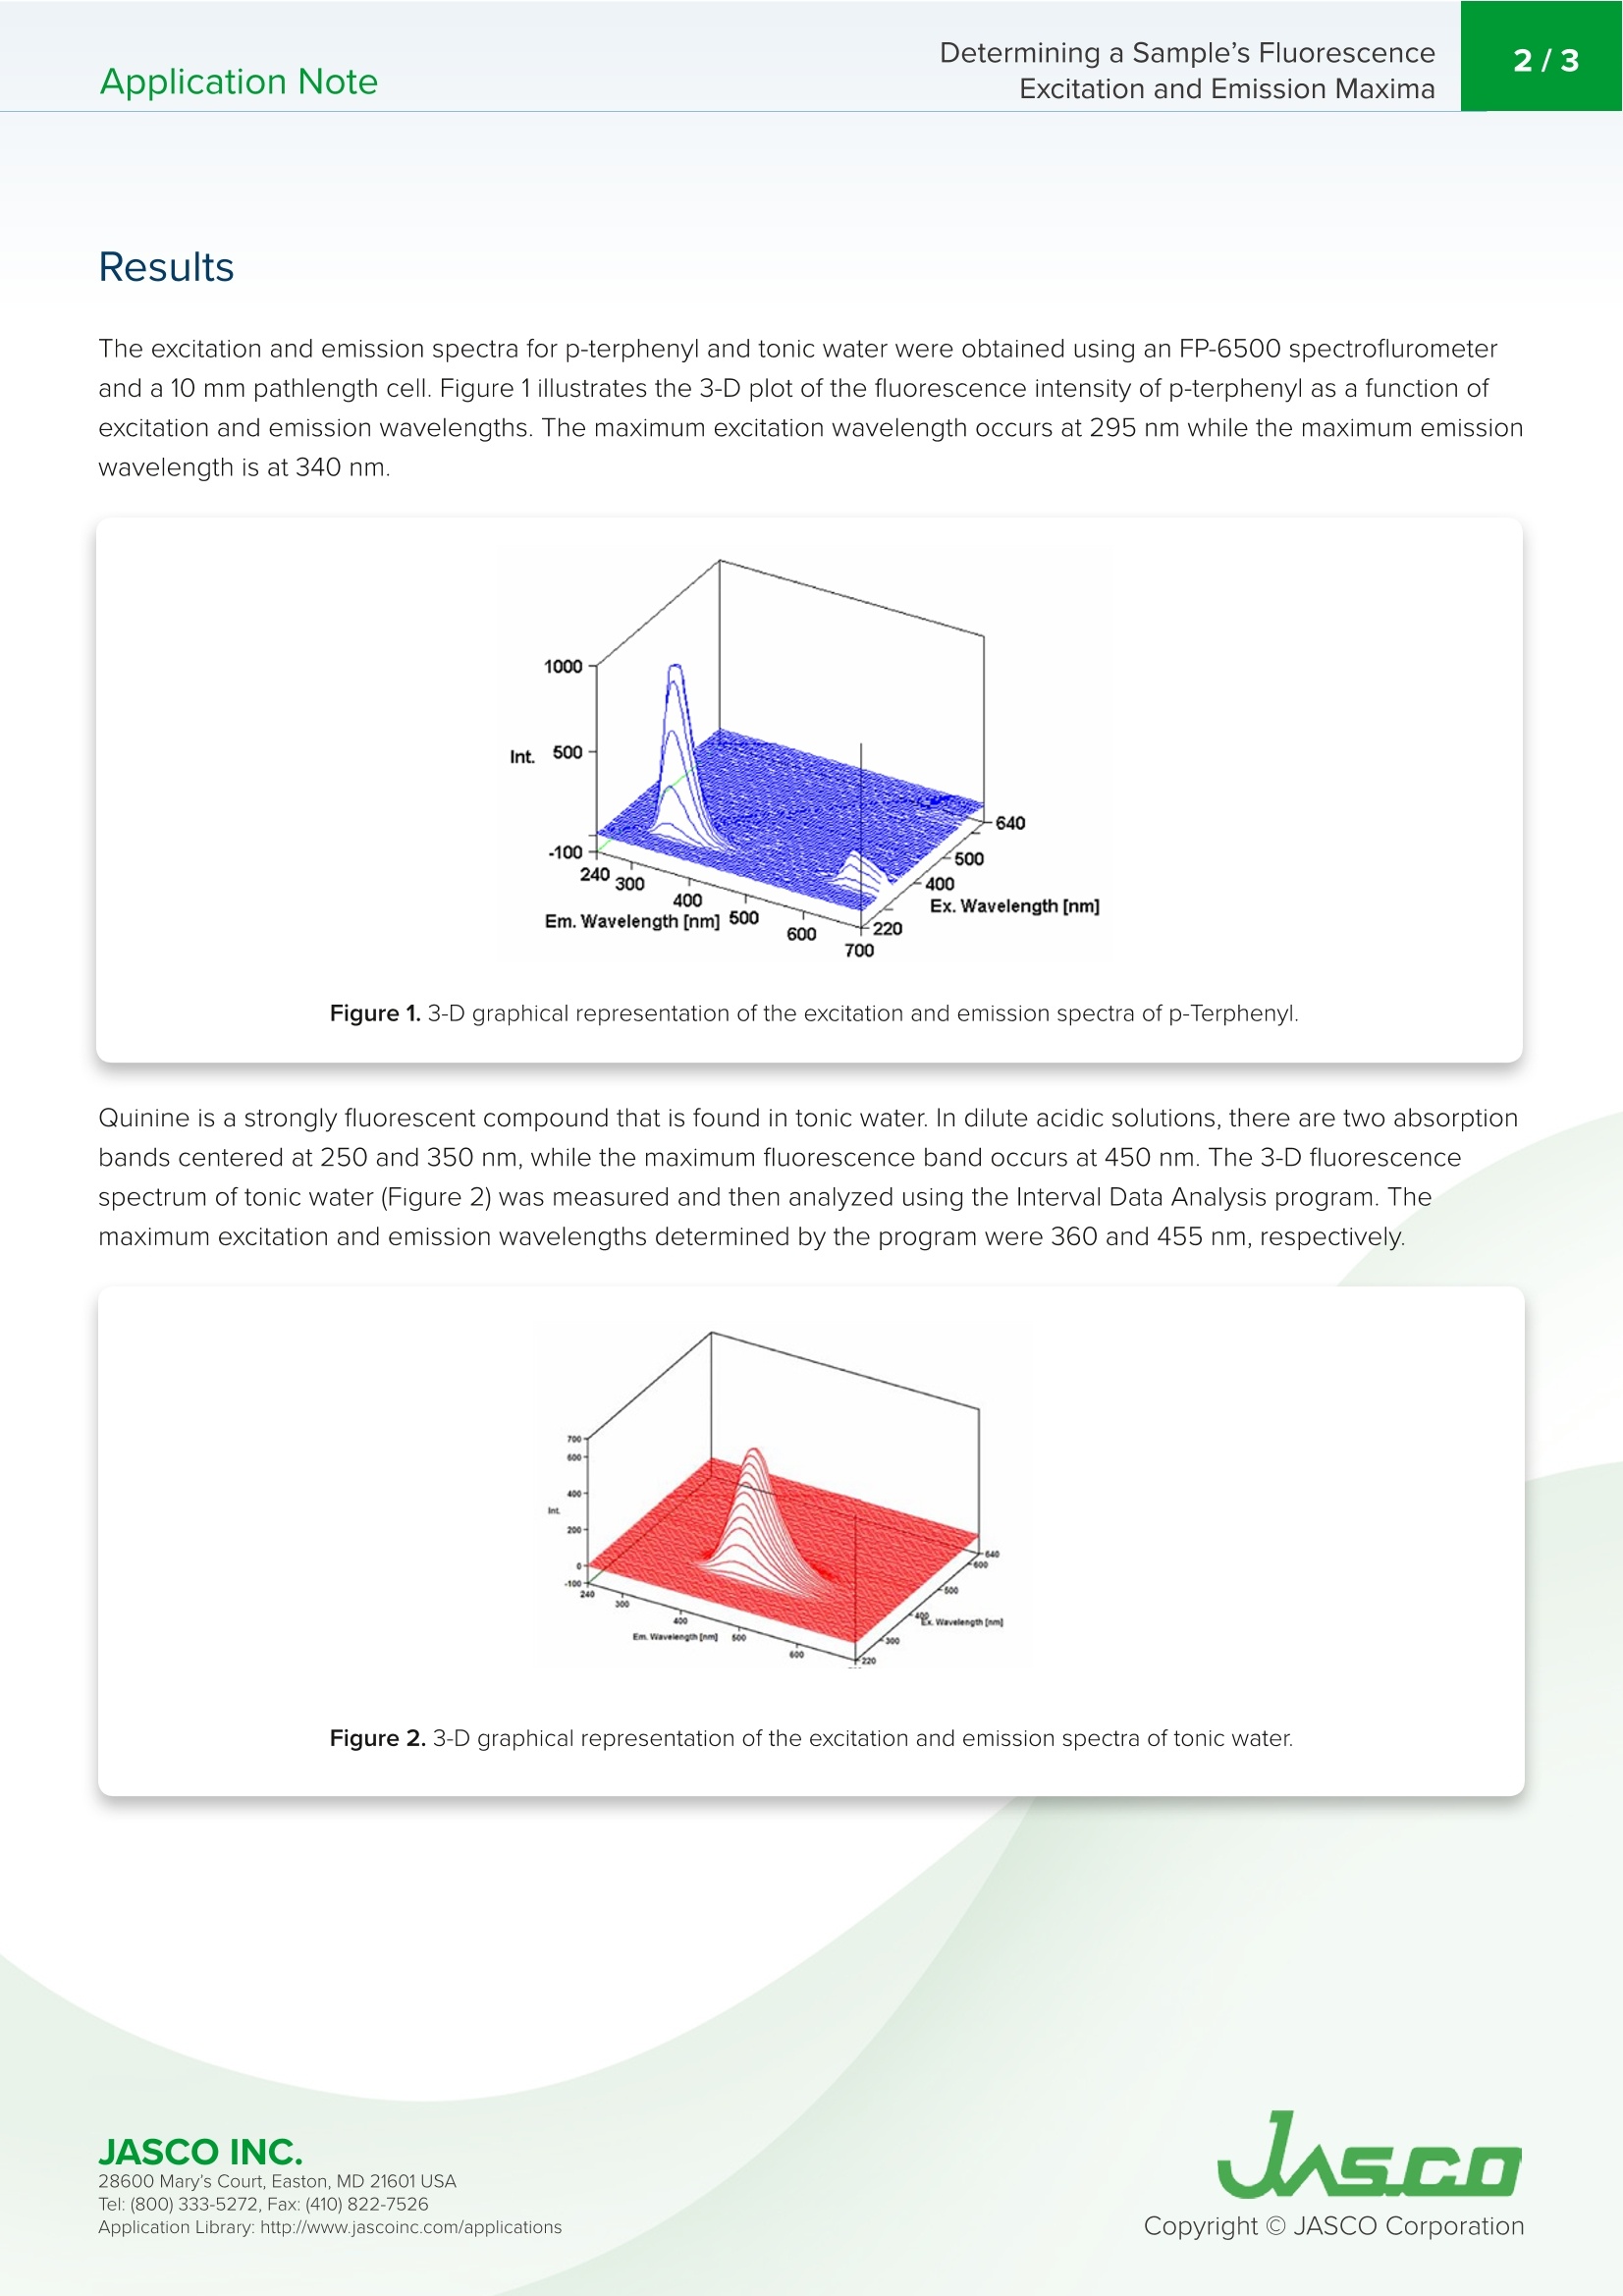
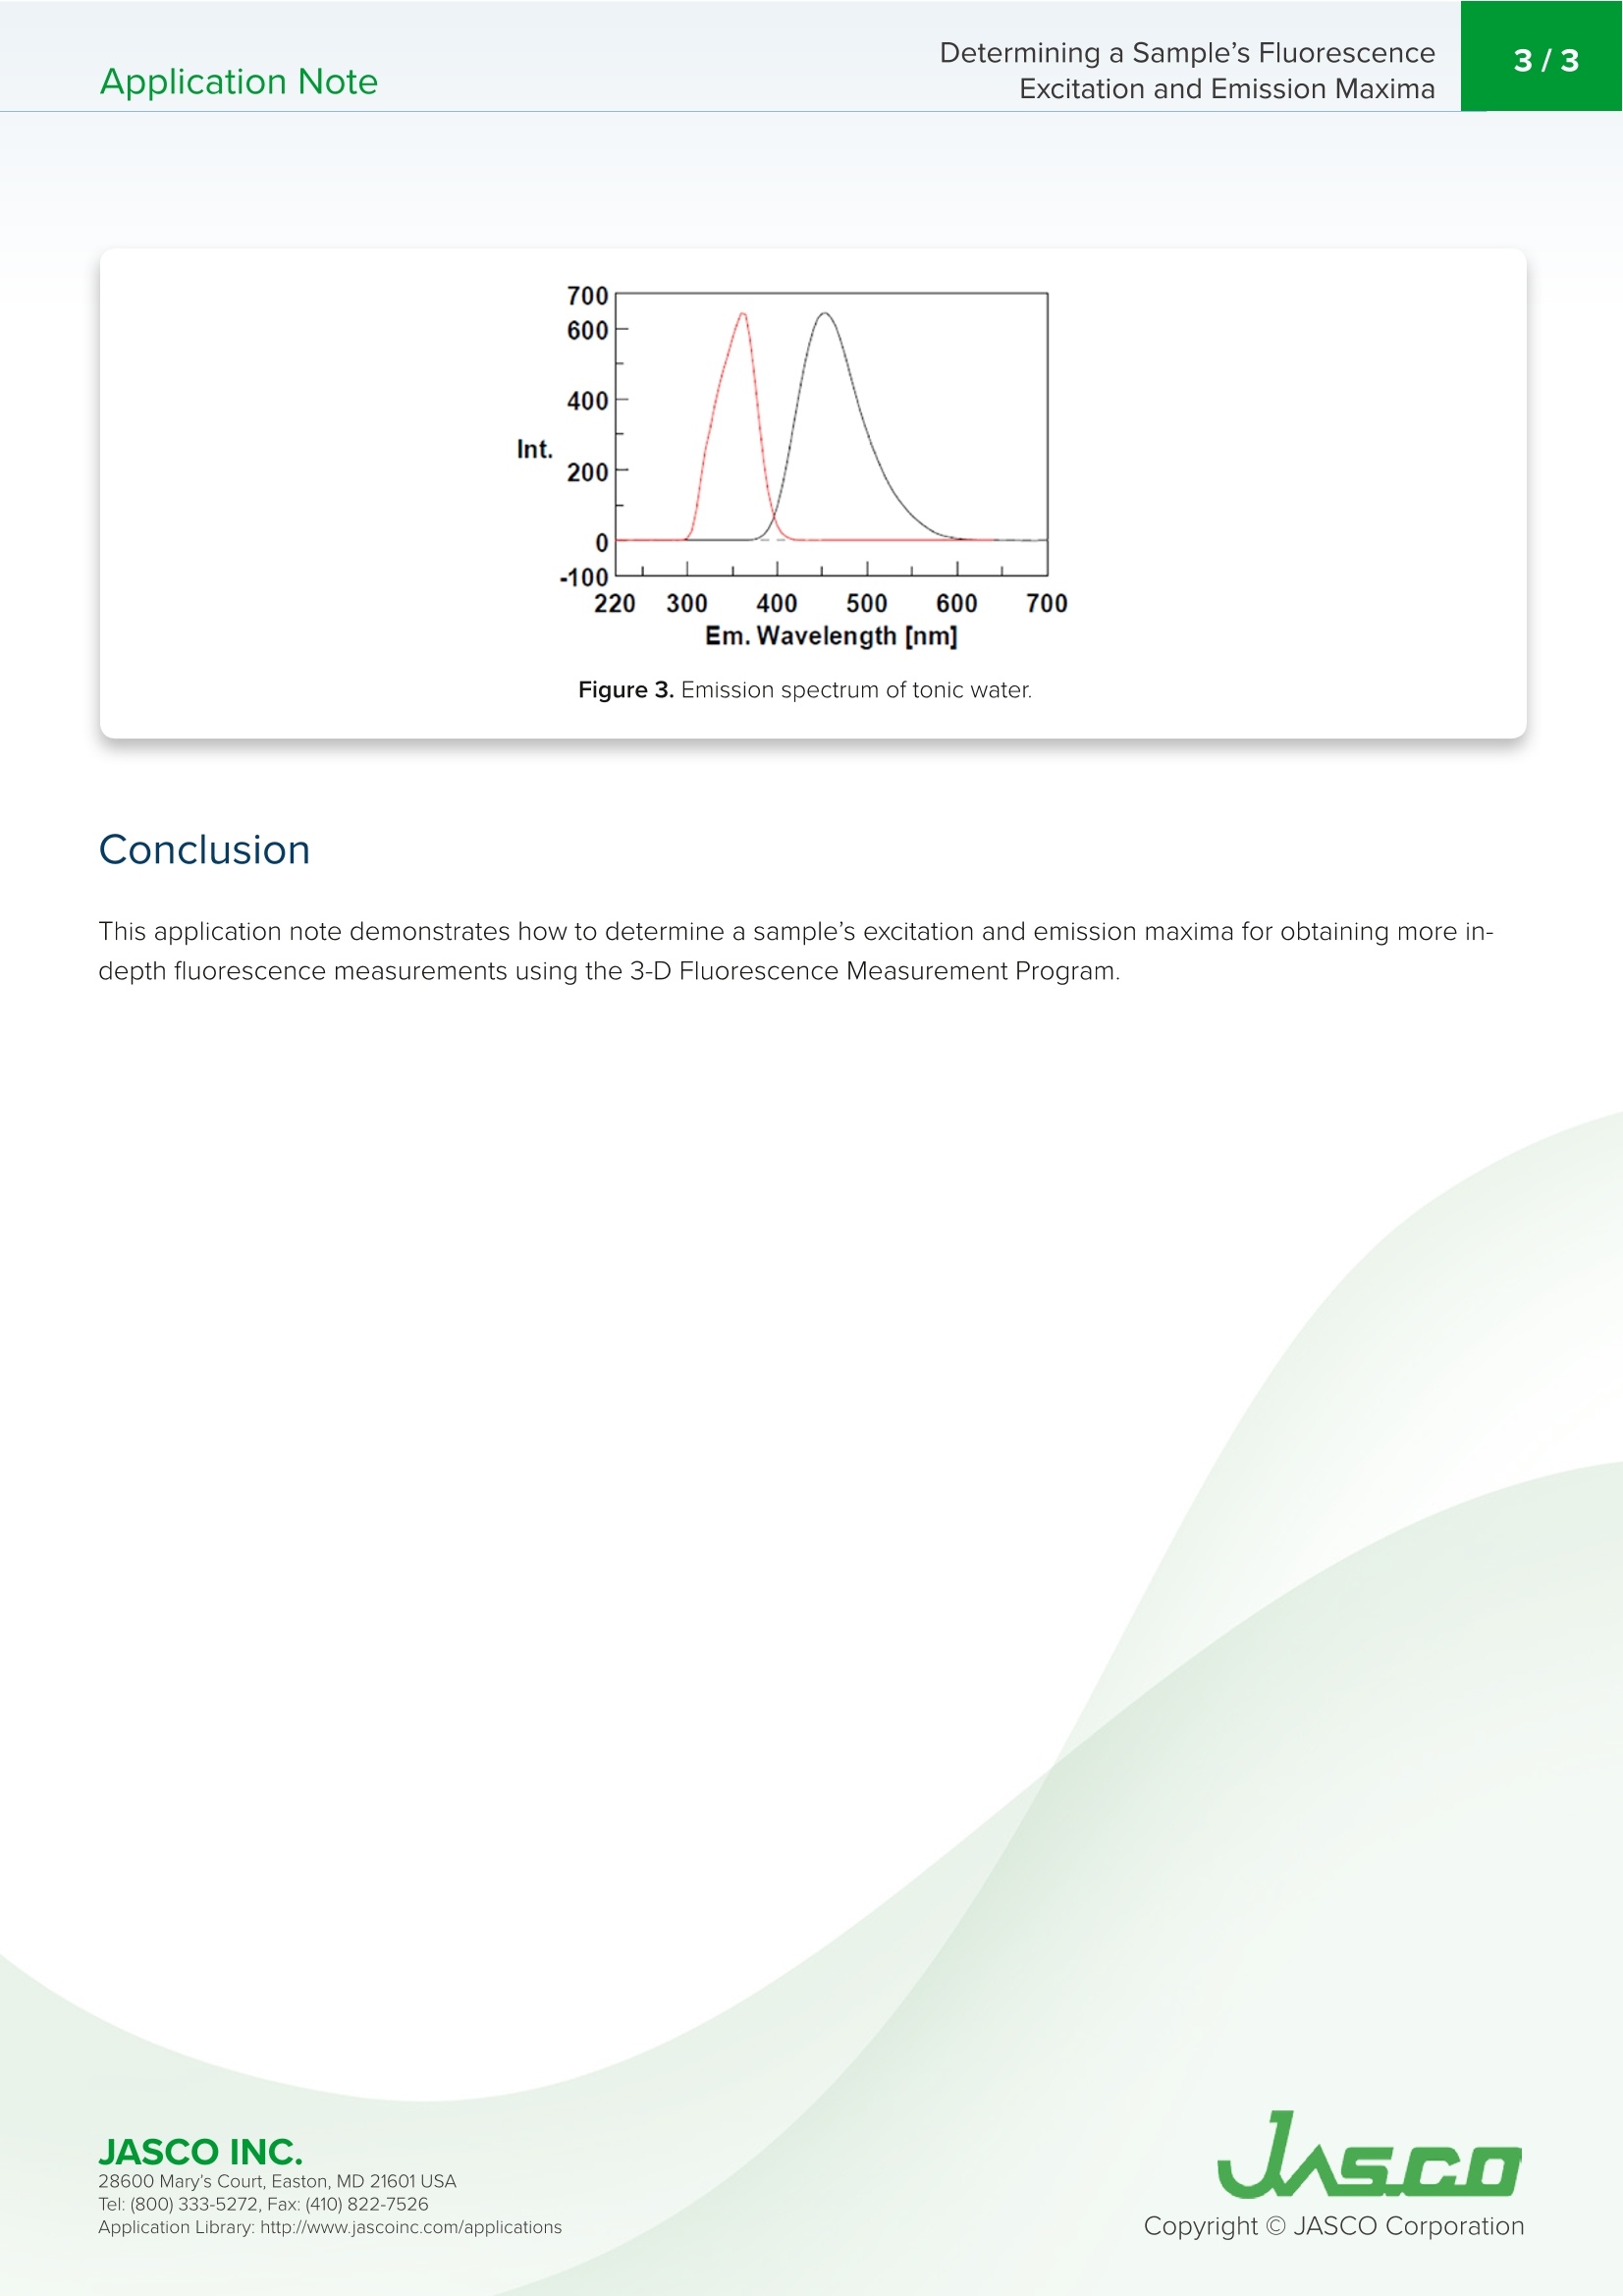
Application Note 2/3 Determining a Sample's Fluorescence Excitationand Emission Maxima Introduction One of the challenges in performing fluorescence measurements is determining theoptimum excitation and emission wavelengths for a new sample. With the vastamount of information that can be obtained using fluorescence techniques, it iscritical to optimize the measurement parameters to obtain the best possible data.Jasco has developed a 3-D fluorescence measurement program that will searchfor the optimum peak excitation and emission wavelengths to use for unknownsamples. This is accomplished by measuring the emission spectrum of a samplewhile changing its excitation wavelength or, conversely, by measuring the excitationspectrum as the emission wavelength is changed. This application note shows the 3-D fluorescence spectra of p-terphenyl and tonic water using a FP-6500. Keywords FP-6500,Fluorescence Experimental Data Acquisition Interval 1nm Response Time 4 seconds Spectral Bandwidth 1nm Scan Speed 20 nm/min Determining a Sample’s FluorescenceApplication Note Excitation and Emission Maxima Results The excitation and emission spectra for p-terphenyl and tonic water were obtained using an FP-6500 spectroflurometerand a 10 mm pathlength cell. Figure 1 illustrates the 3-D plot of the fluorescence intensity of p-terphenyl as a function ofexcitation and emission wavelengths. The maximum excitation wavelength occurs at 295nm while the maximum emissionwavelength is at 340 nm. Figure 1.3-D graphical representation of the excitation and emission spectra of p-Terphenyl. Quinine is a strongly fluorescent compound that is found in tonic water. In dilute acidic solutions,there are two absorptionbands centered at 250 and 350 nm, while the maximum fluorescence band occurs at 450 nm. The 3-D fluorescencespectrum of tonic water (Figure 2) was measured and then analyzed using the Interval Data Analysis program. Themaximum excitation and emission wavelengths determined by the program were 360 and 455 nm, respectively. Figure 2. 3-D graphical representation of the excitation and emission spectra of tonic water. 28600 Mary's Court, Easton, MD 21601 USA s日o Figure 3. Emission spectrum of tonic water. Conclusion This application note demonstrates how to determine a sample’s excitation and emission maxima for obtaining more in-depth fluorescence measurements using the 3-D Fluorescence Measurement Program. 28600 Mary's Court, Easton, MD 21601 USA JASCO INC.Mary’s Court, Easton, MD USATel: ( Fax: (pplication Library: http://www.jascoinc.com/applications JASCO INC.Tel:( Fax: ( pplication Library: http://www.jascoinc.com/applicationsCopyright O JASCO Corporation This application note demonstrates how to determine a sample’s excitation and emission maxima for obtaining more indepth fluorescence measurements using the 3-D Fluorescence Measurement Program.
确定
还剩1页未读,是否继续阅读?

产品配置单
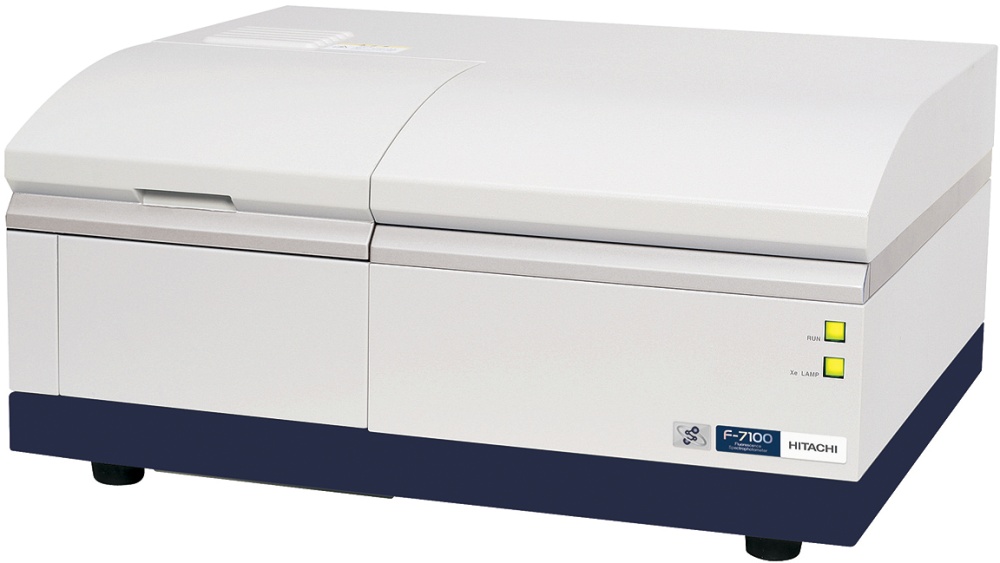
JASCO 公司为您提供《奎宁水和对三苯中荧光检测方案(分子荧光光谱)》,该方案主要用于苯及其衍生物中理化分析检测,参考标准--,《奎宁水和对三苯中荧光检测方案(分子荧光光谱)》用到的仪器有JASCOFP-8000荧光光谱仪
推荐专场