
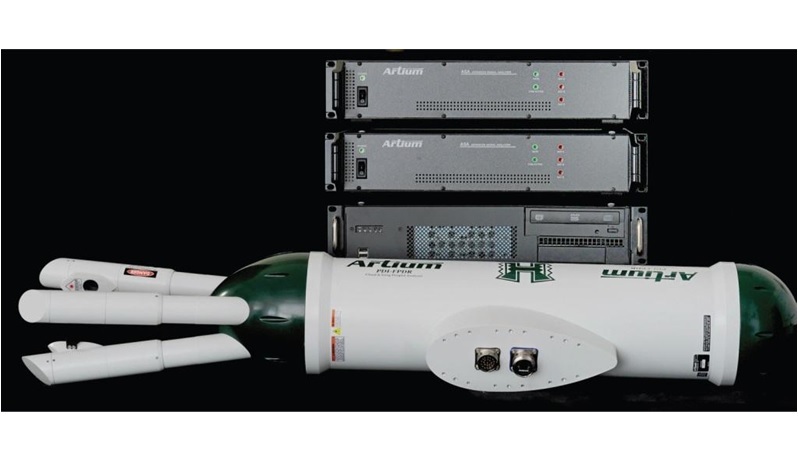


采用LaVision公司的ParticleMaster-Shadow系统,以及Artium公司的PDI设备对结冰风洞云模拟中的液滴粒径分布进行了测量。测量能力拓展到过冷大液滴。
方案详情

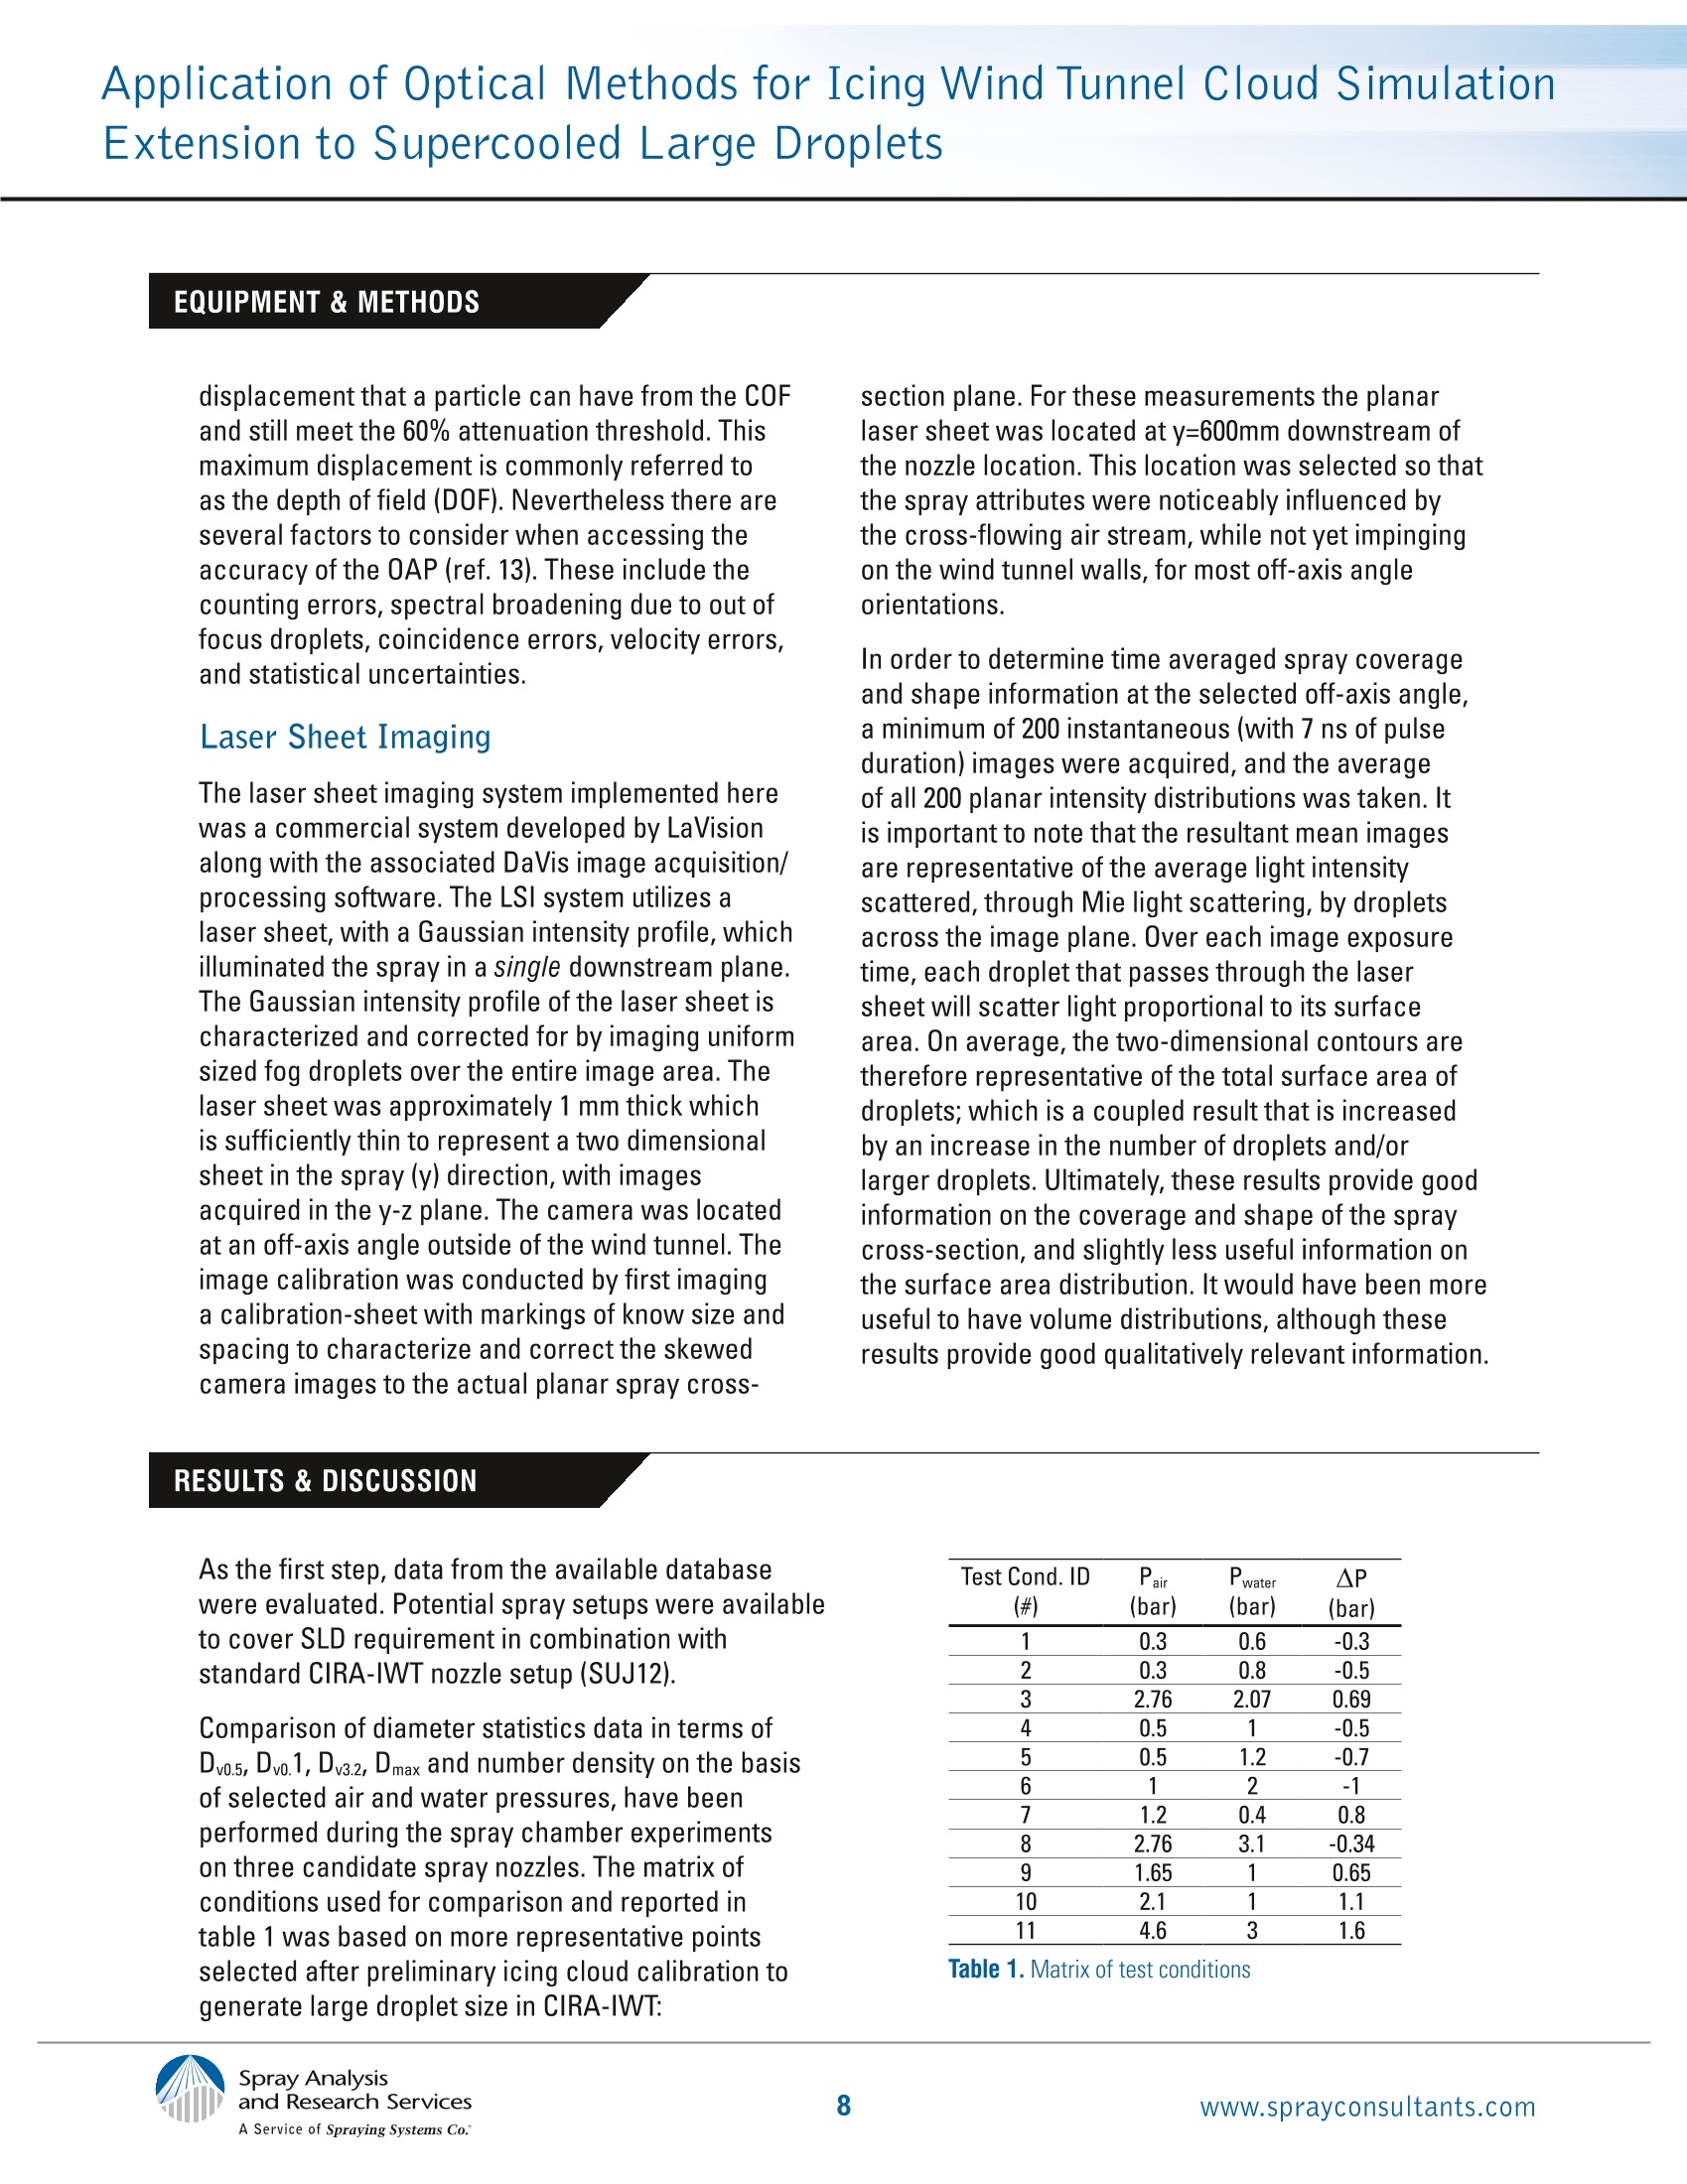
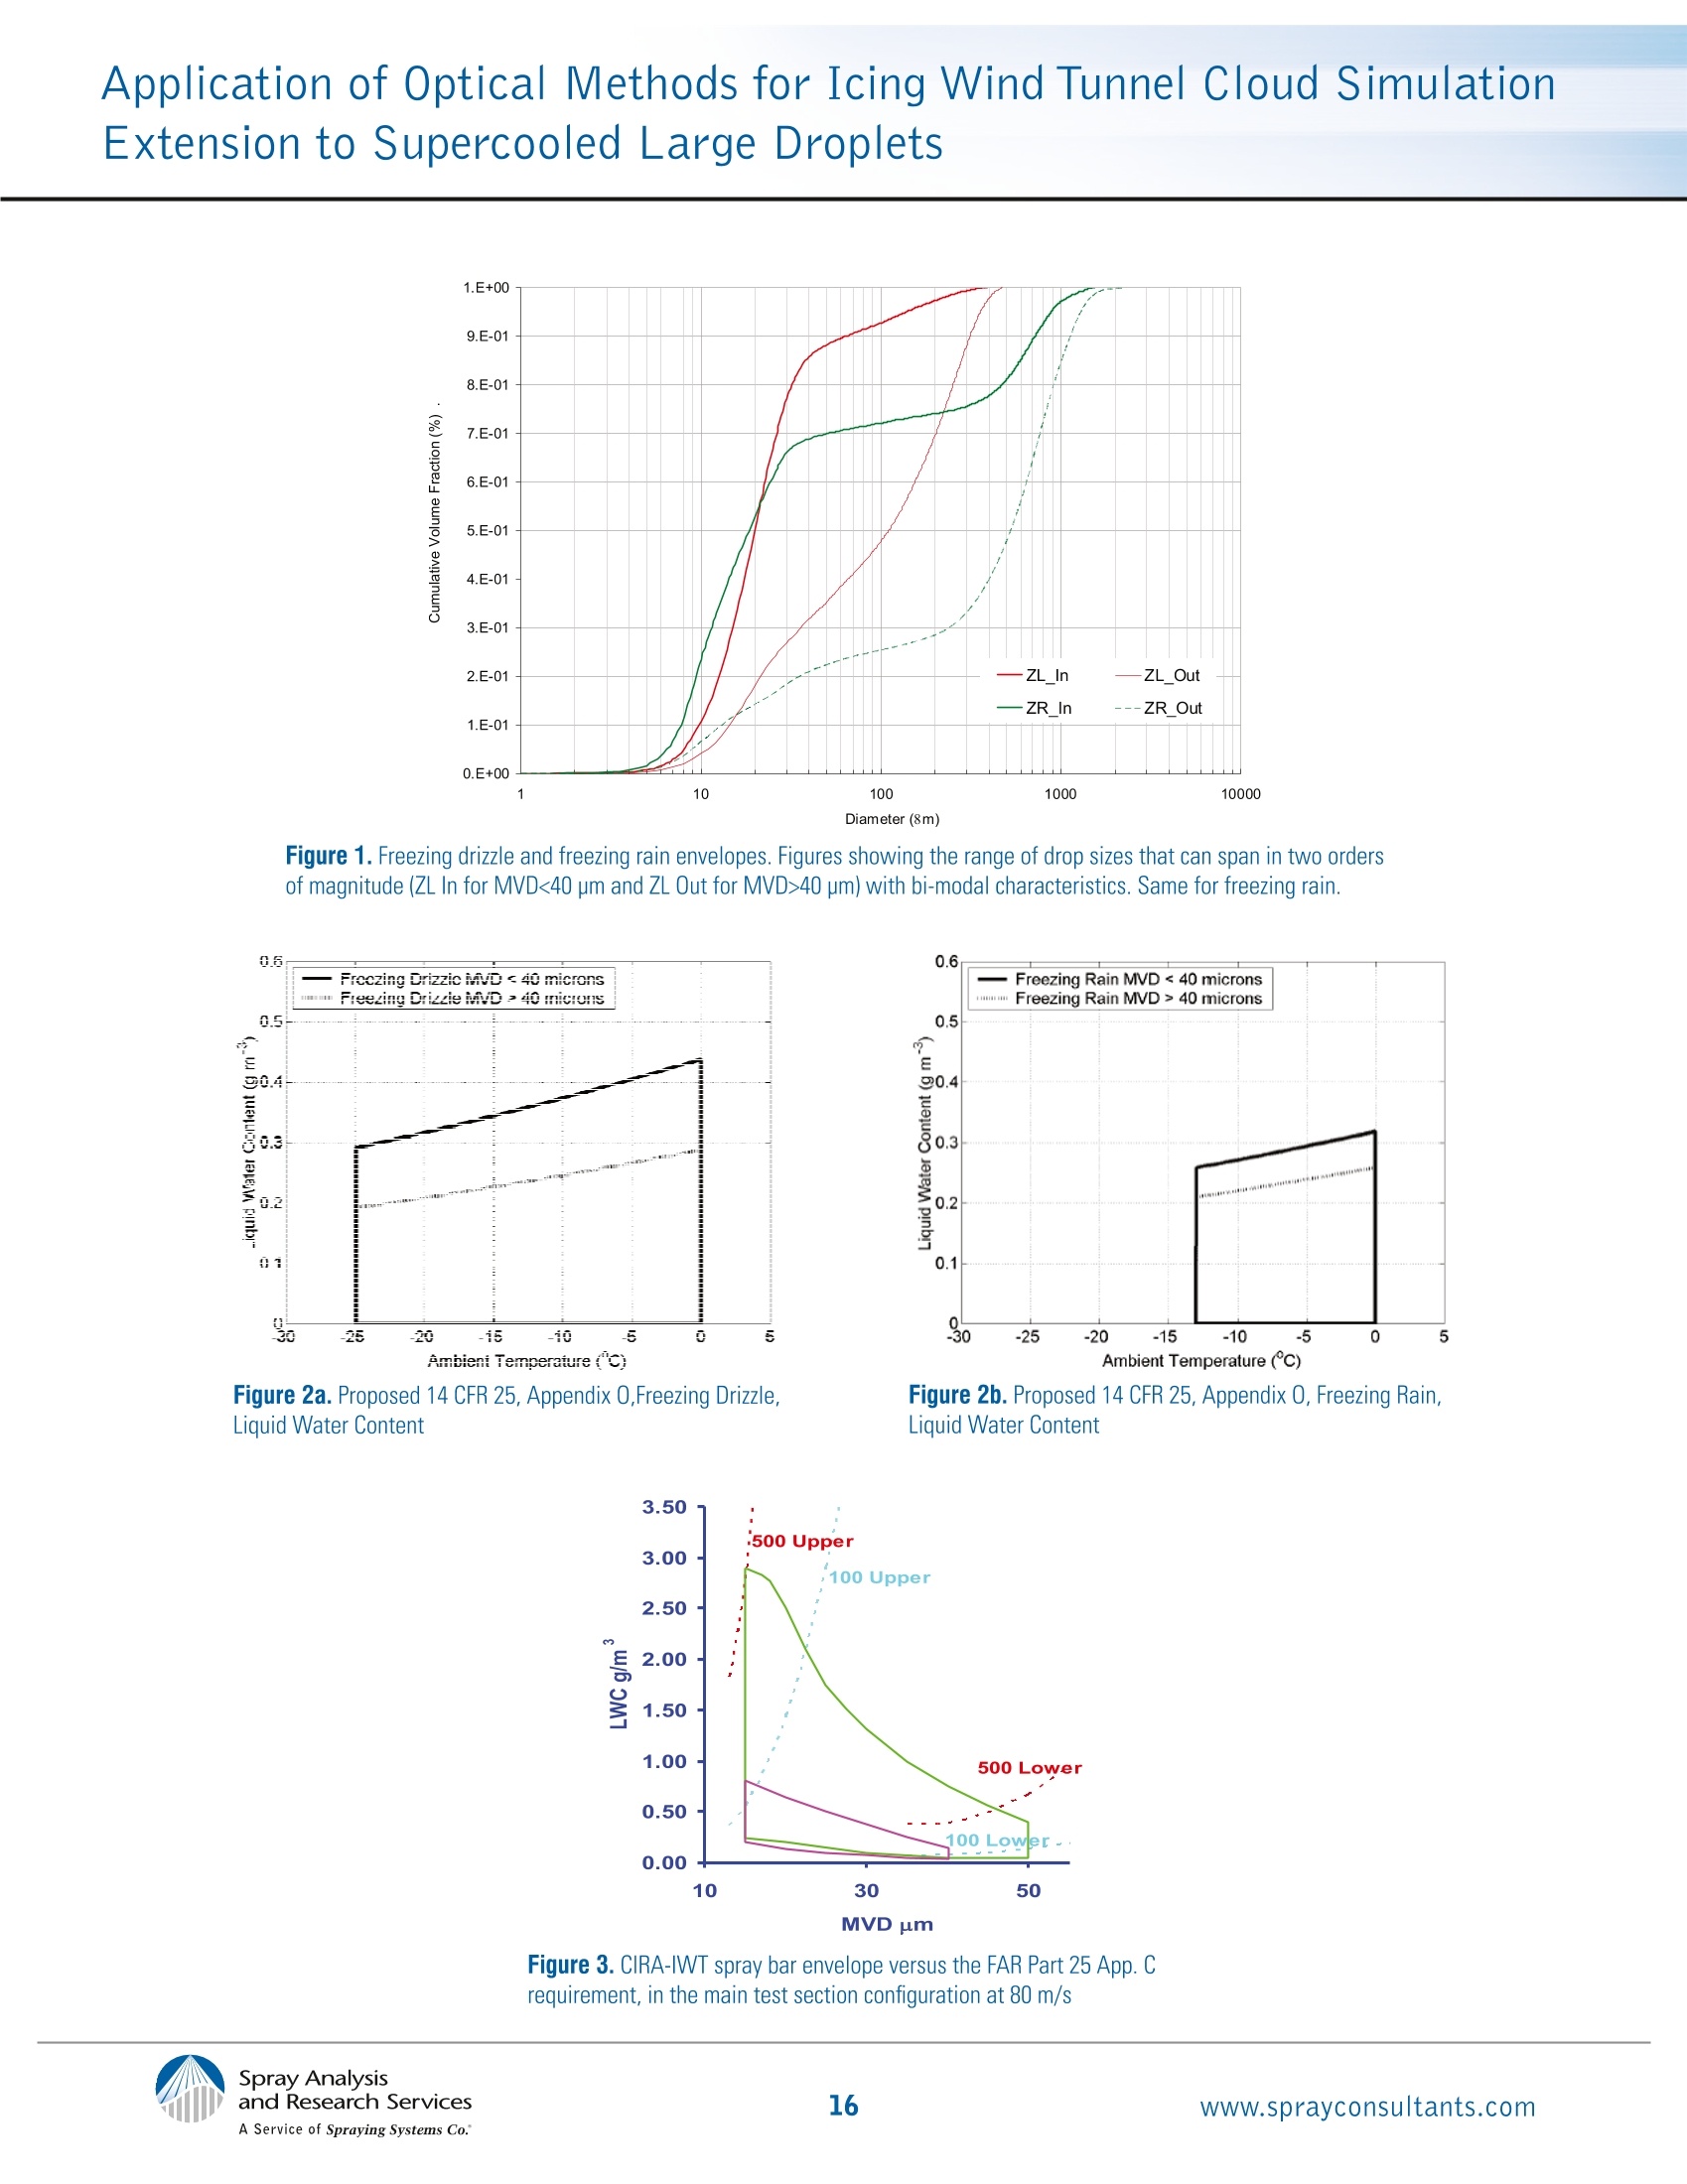
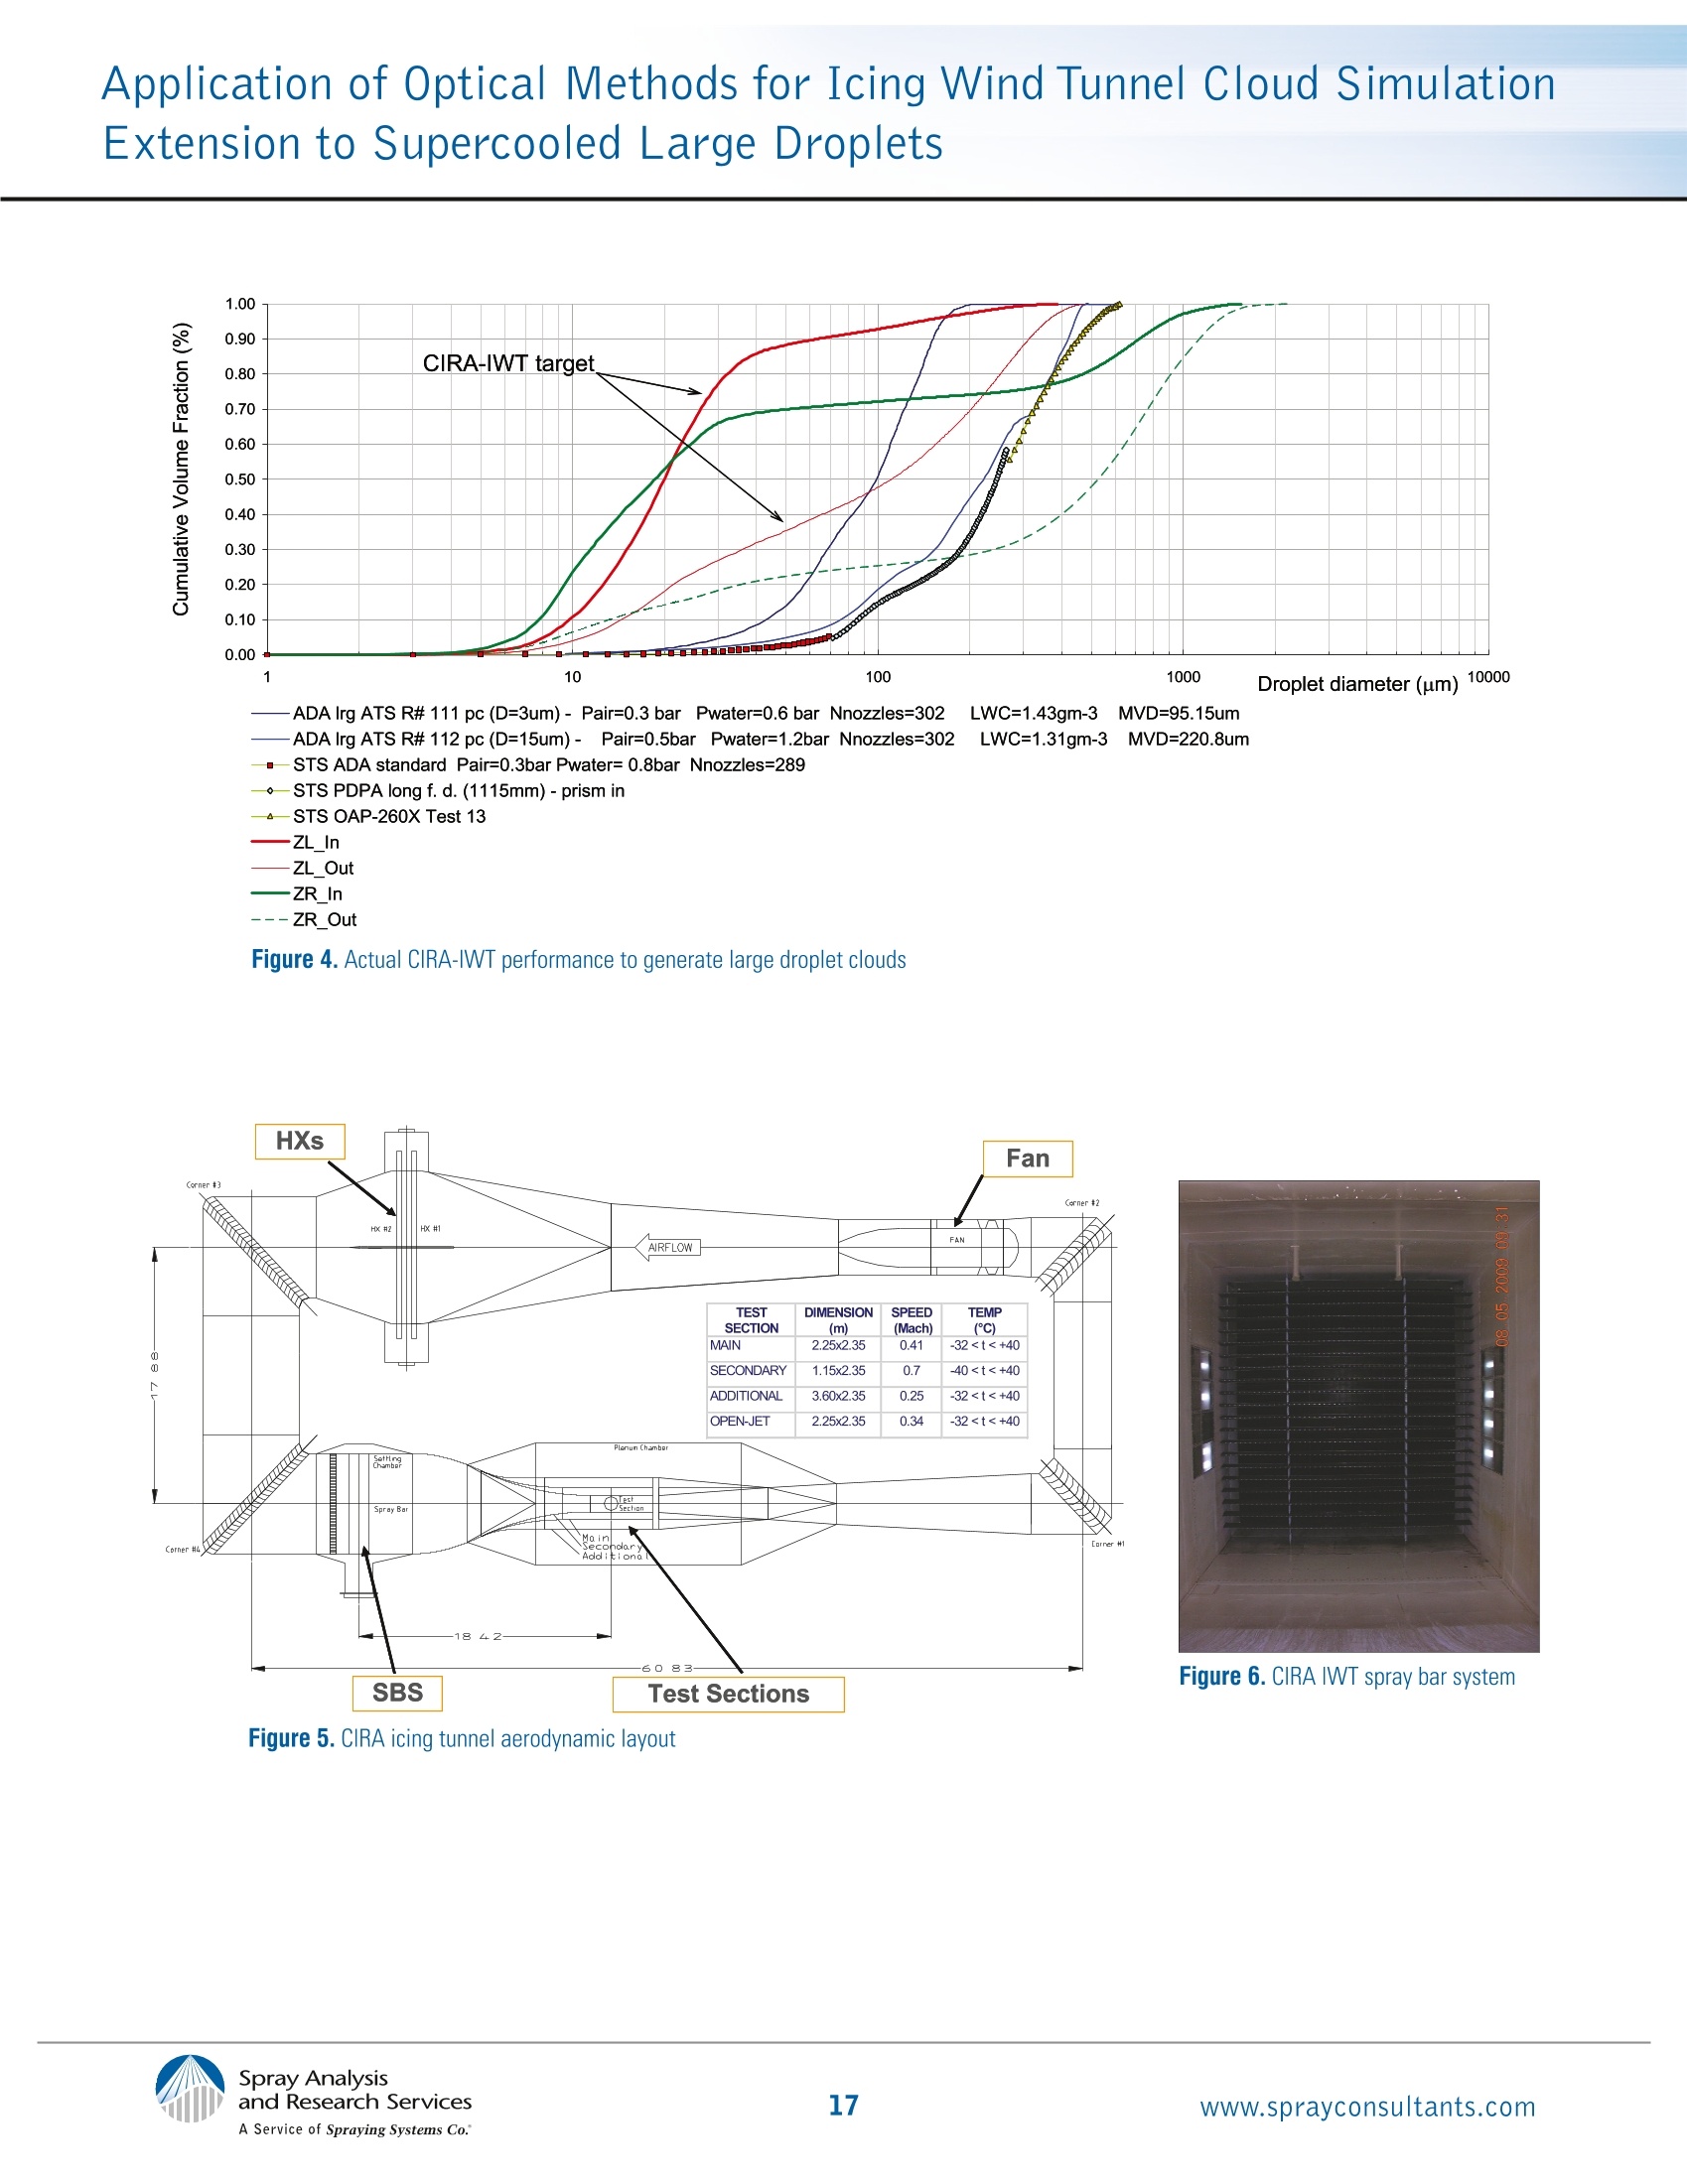
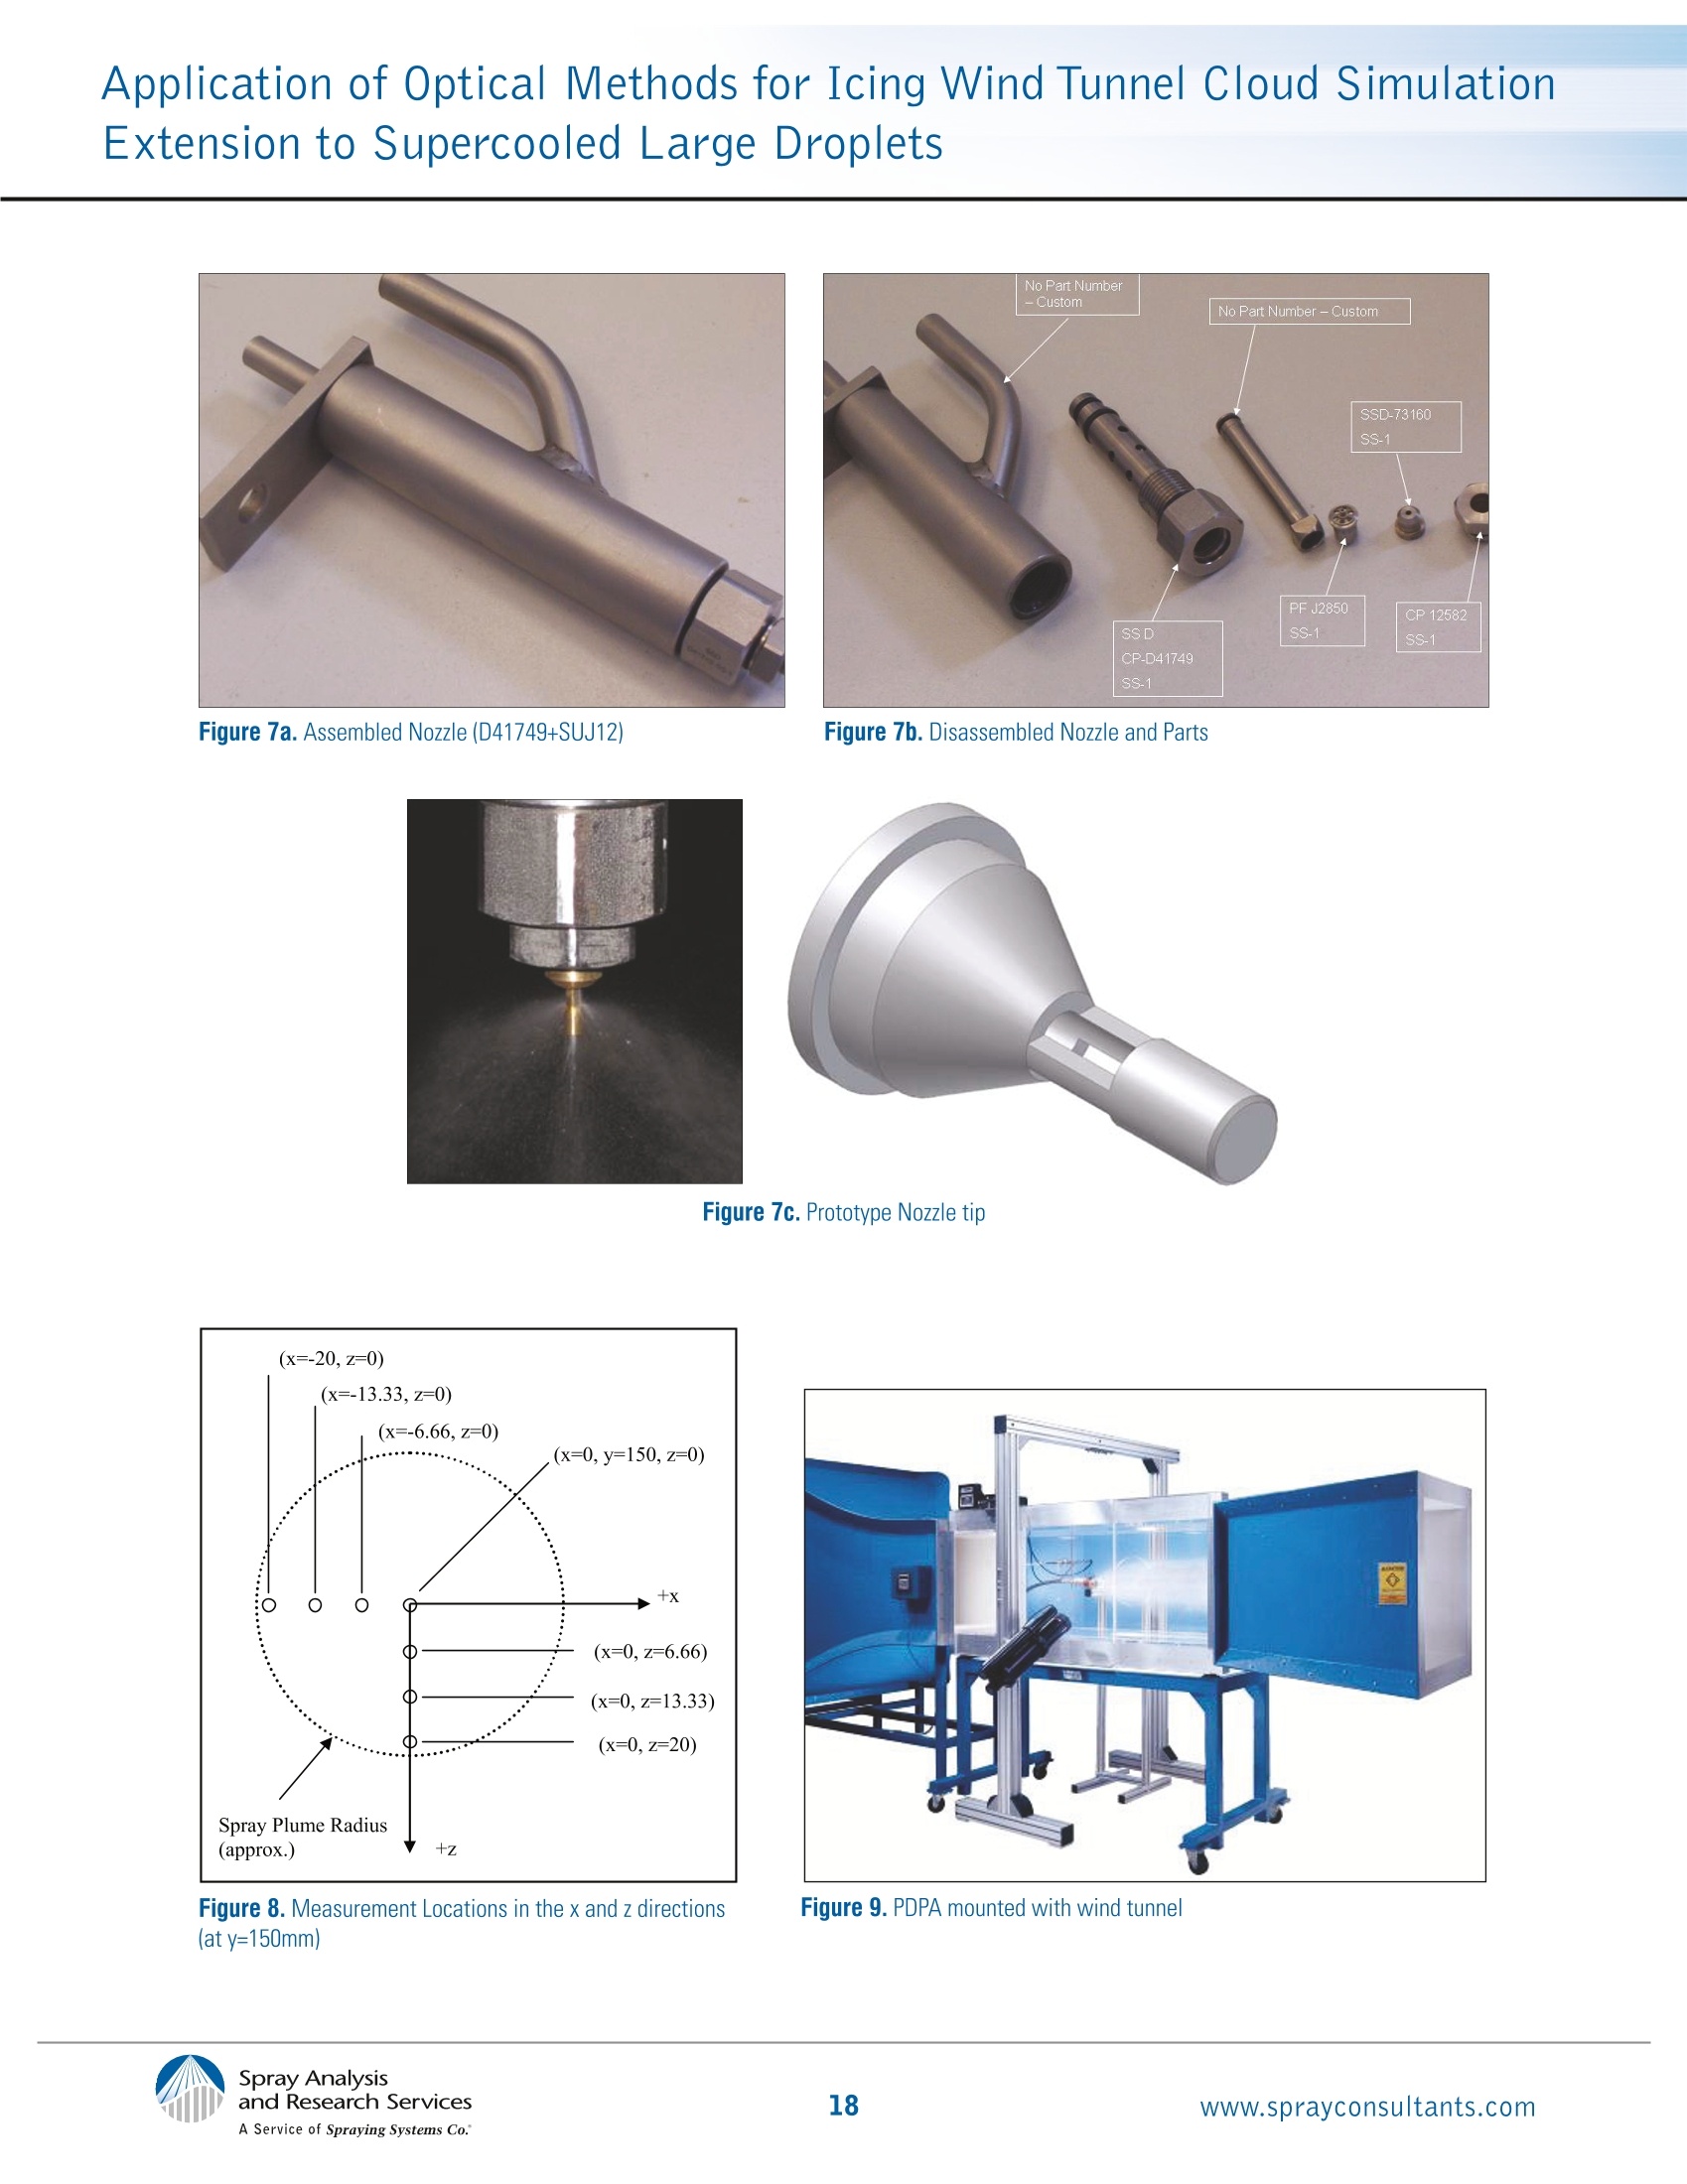
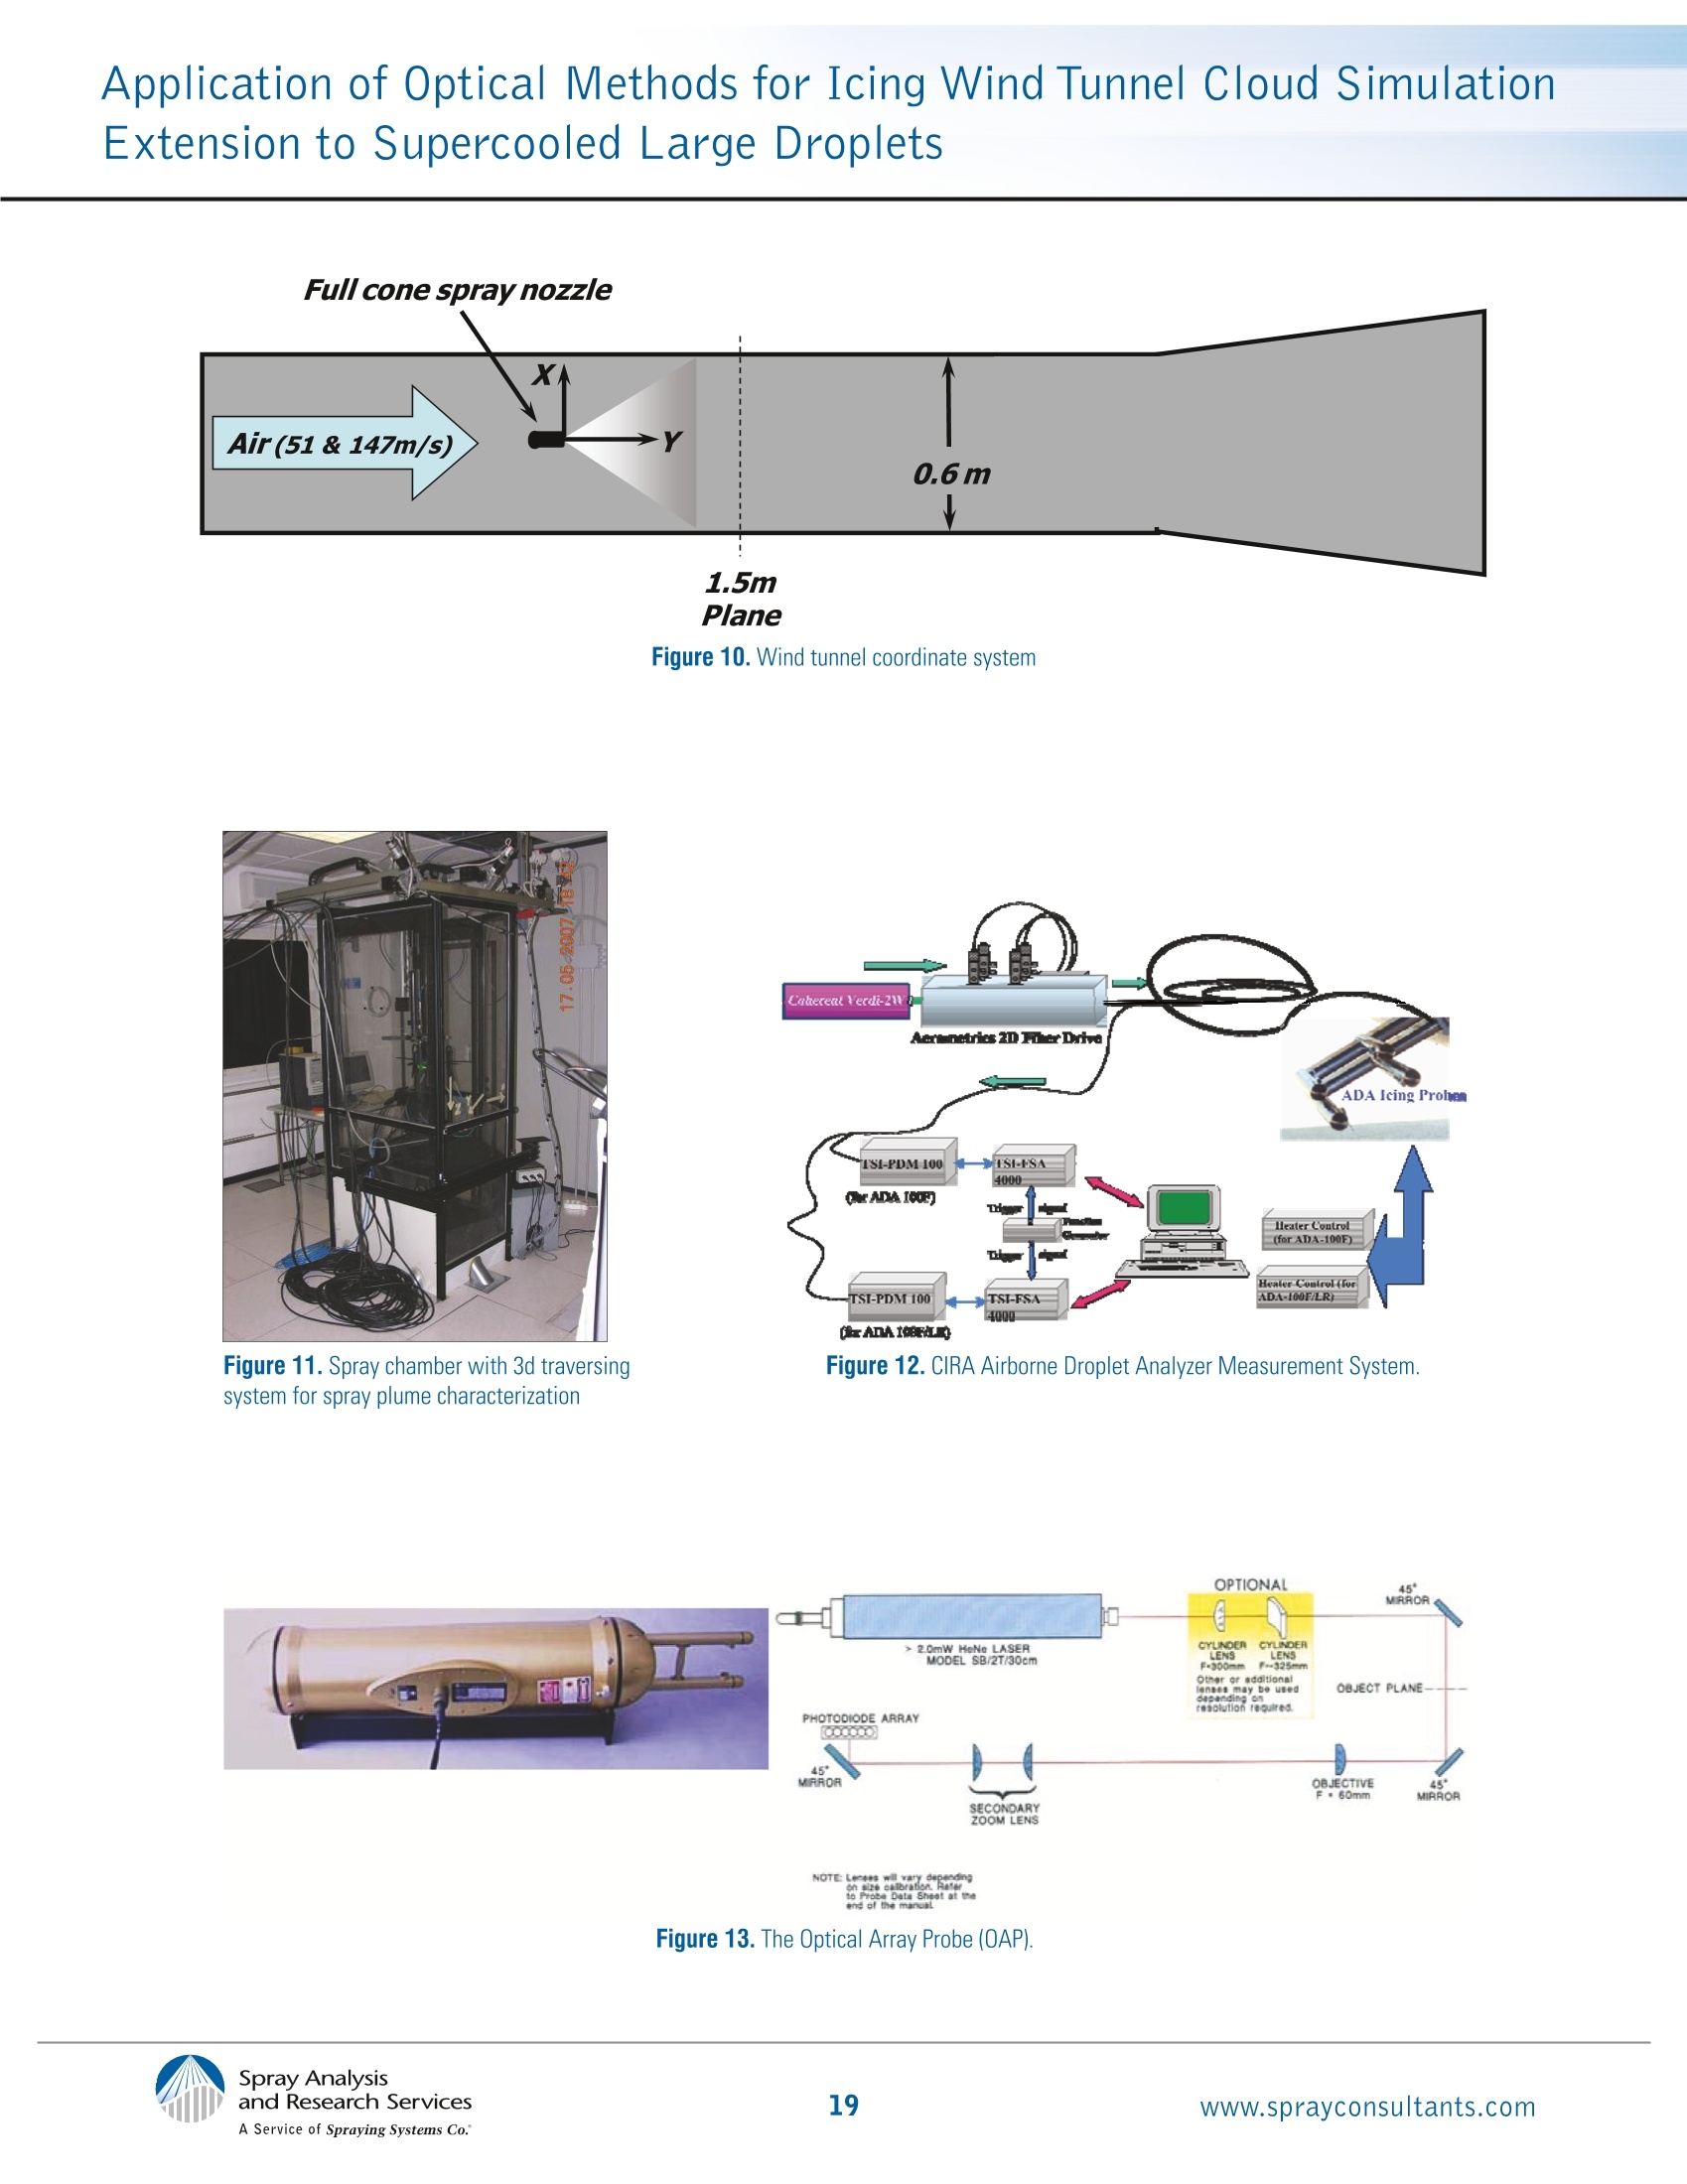
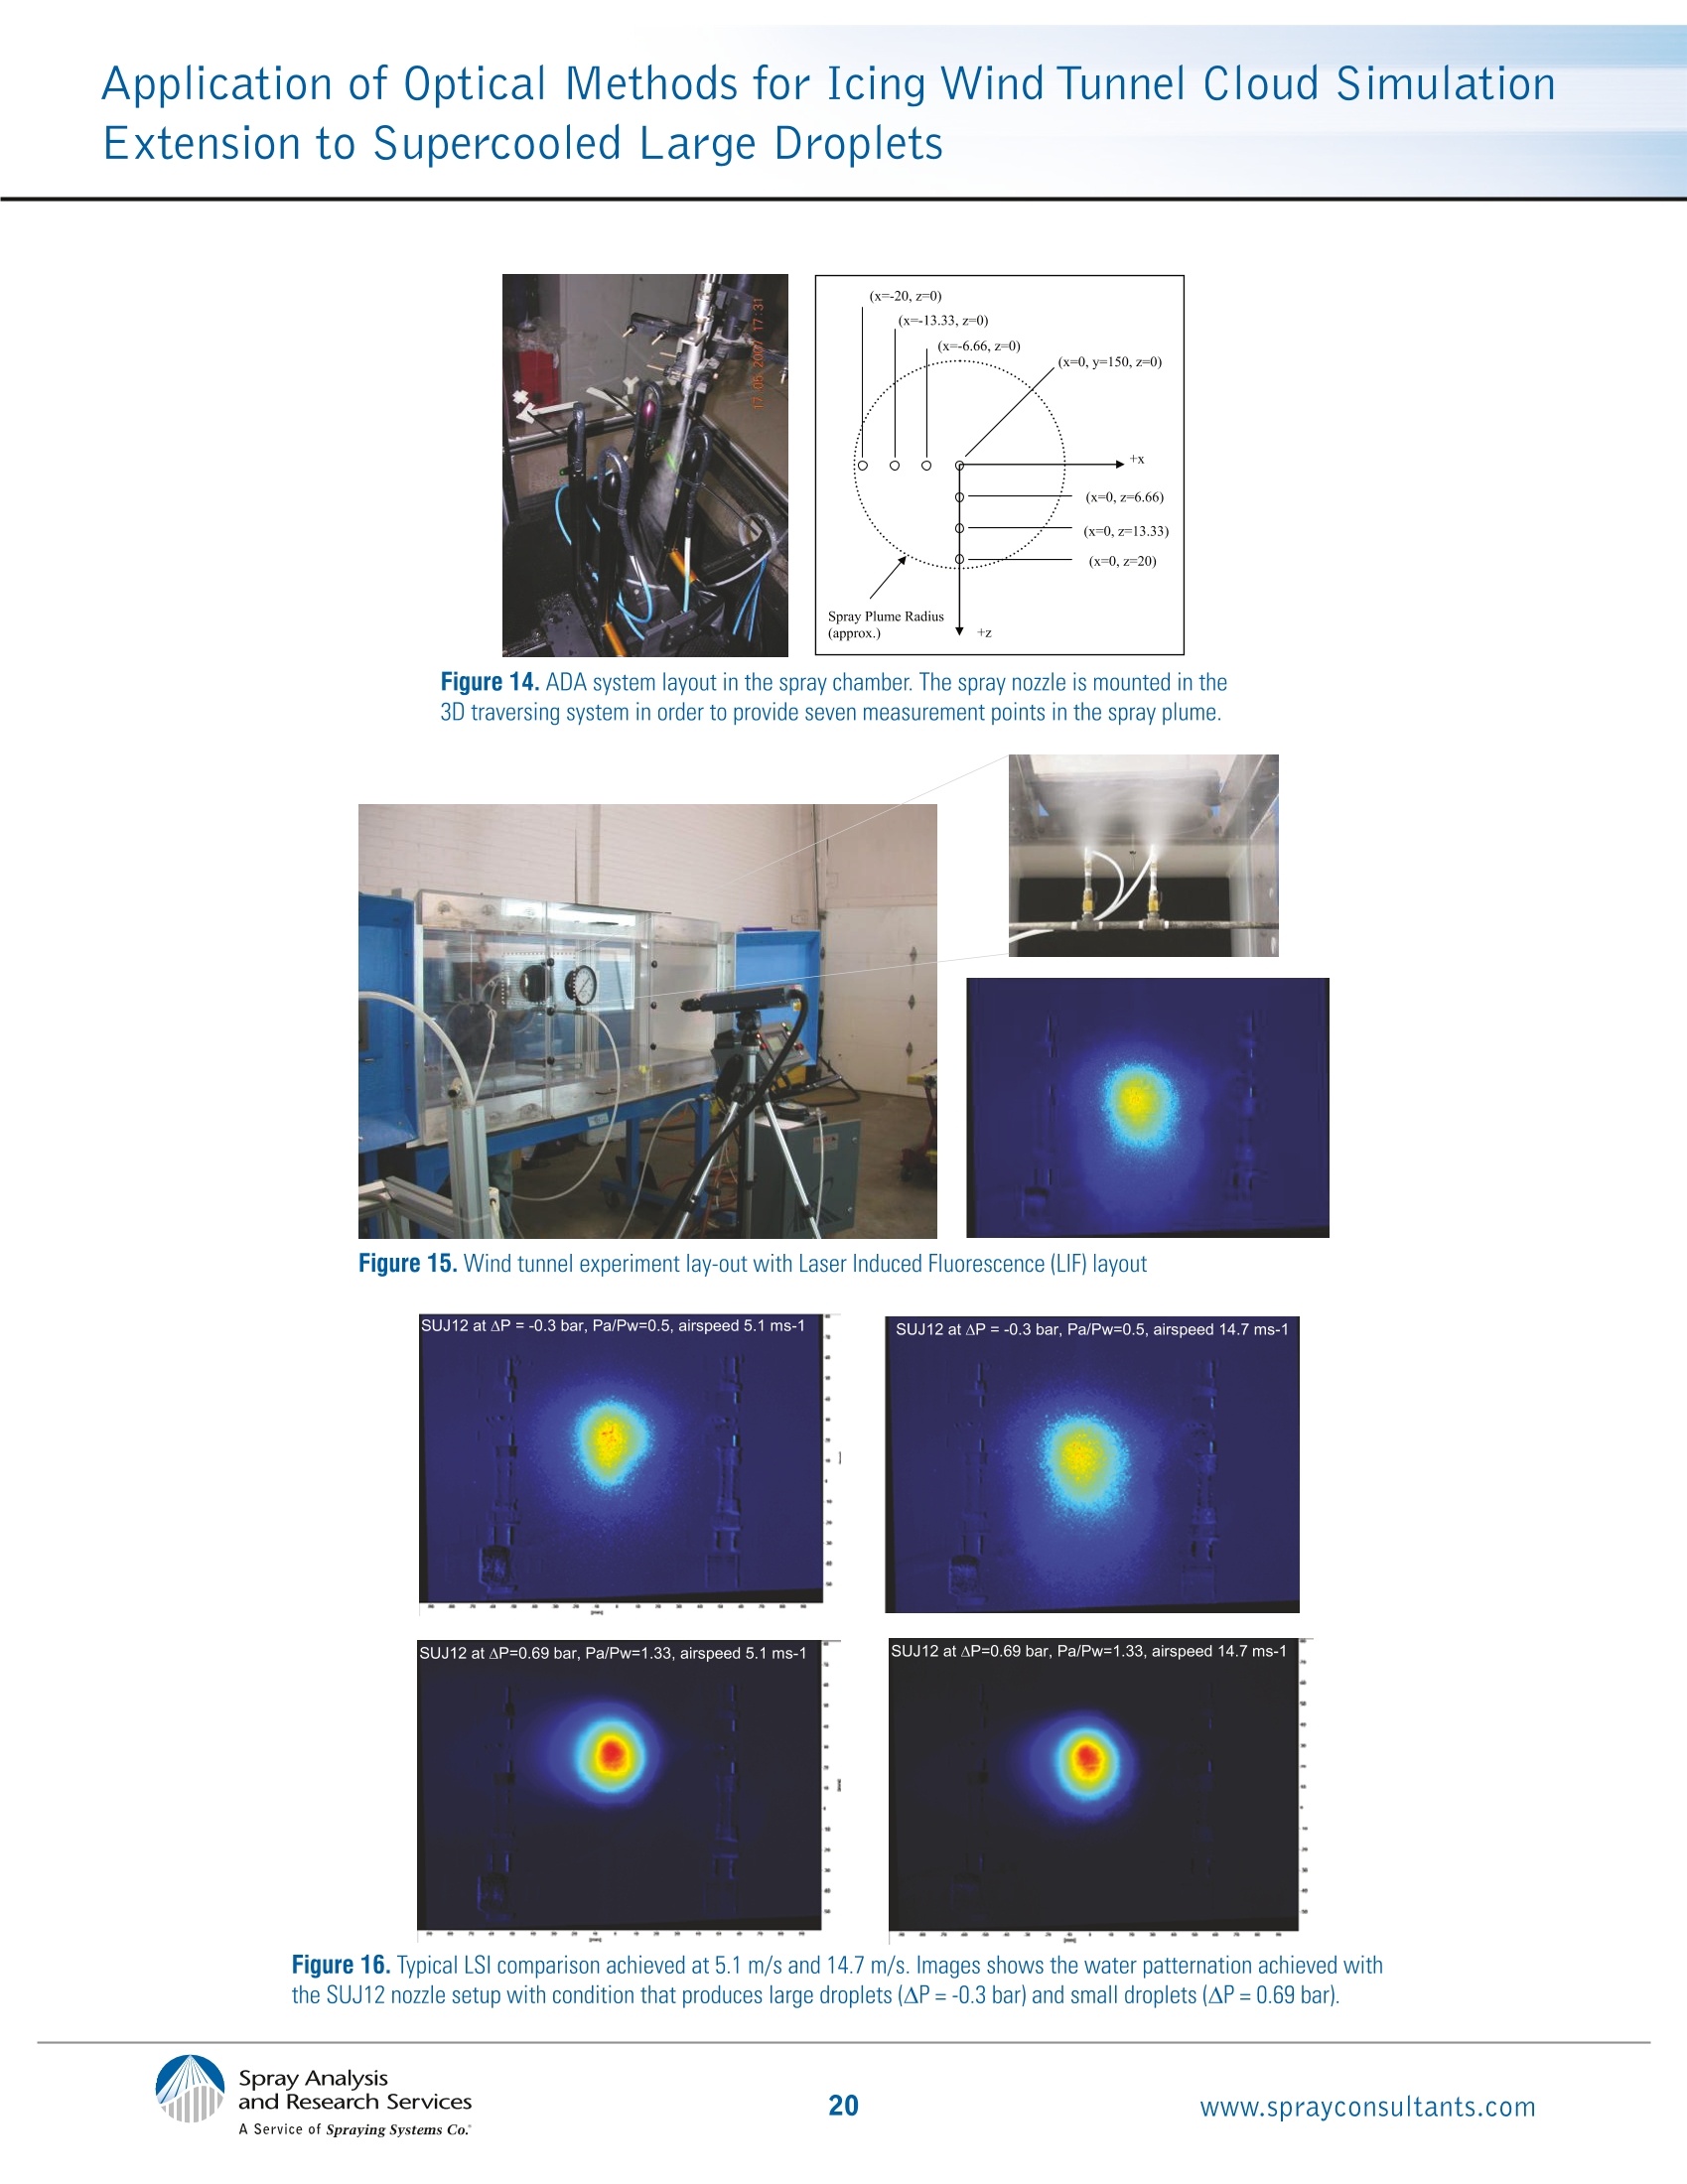
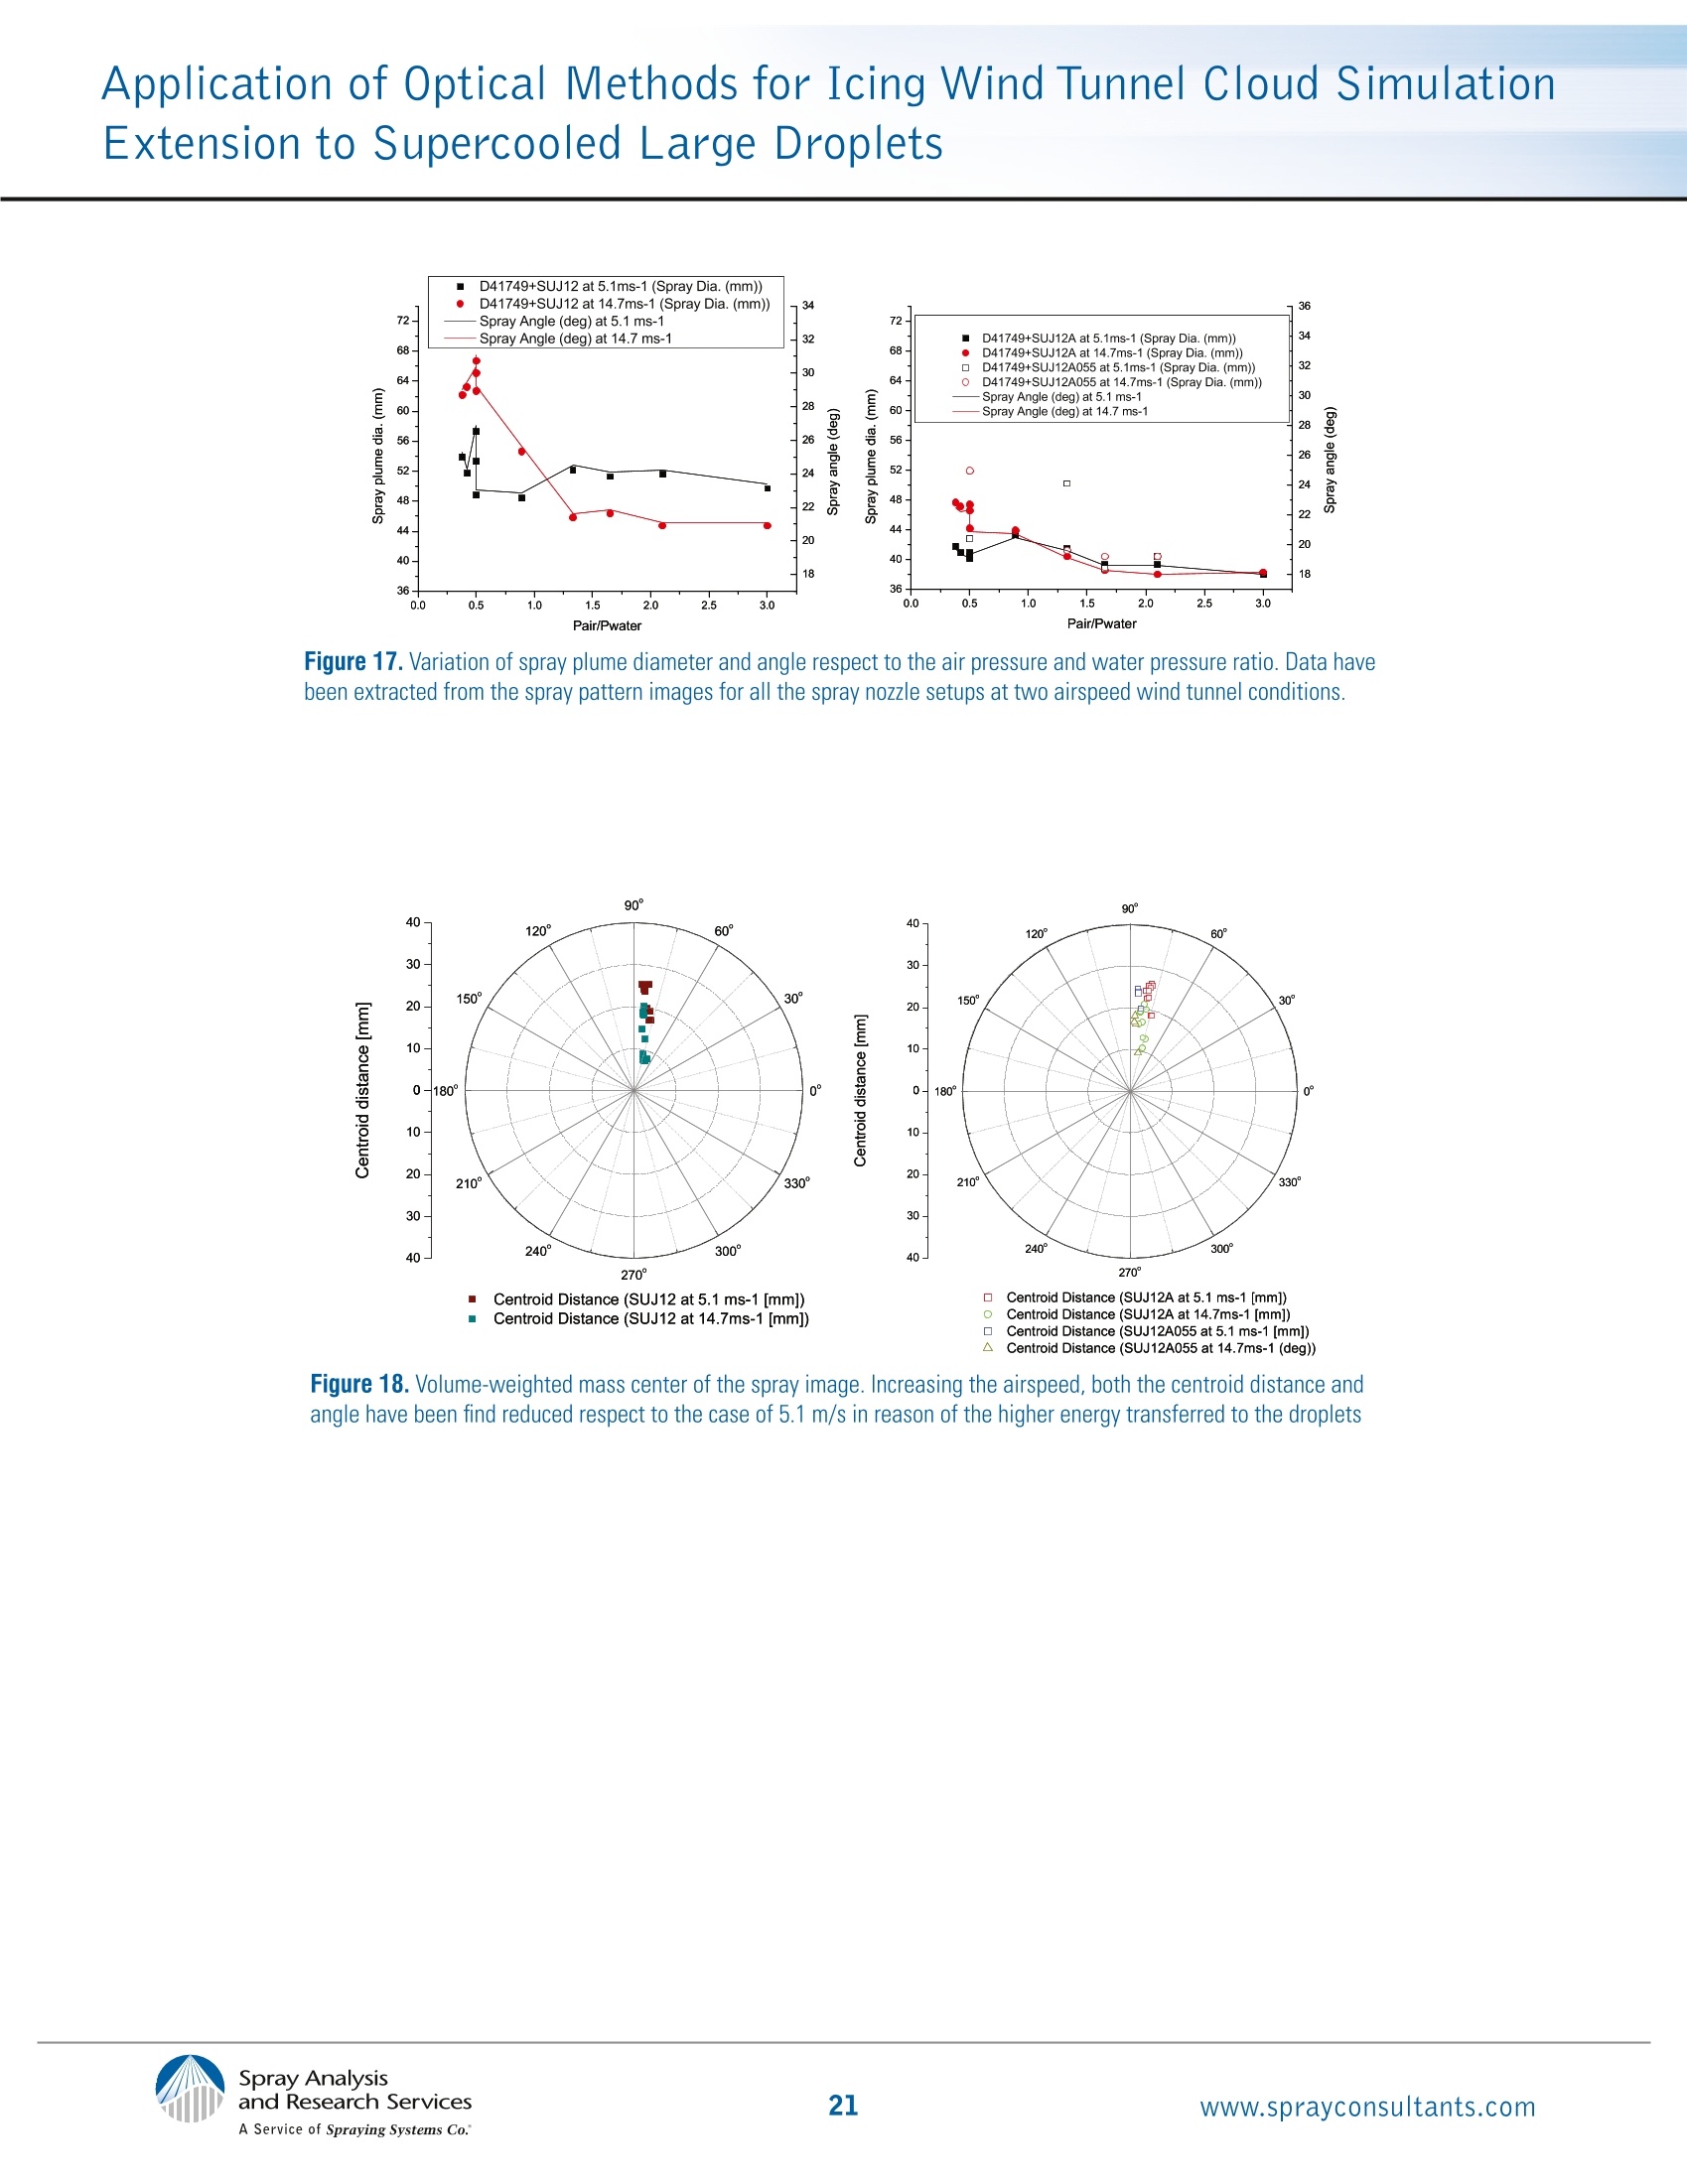
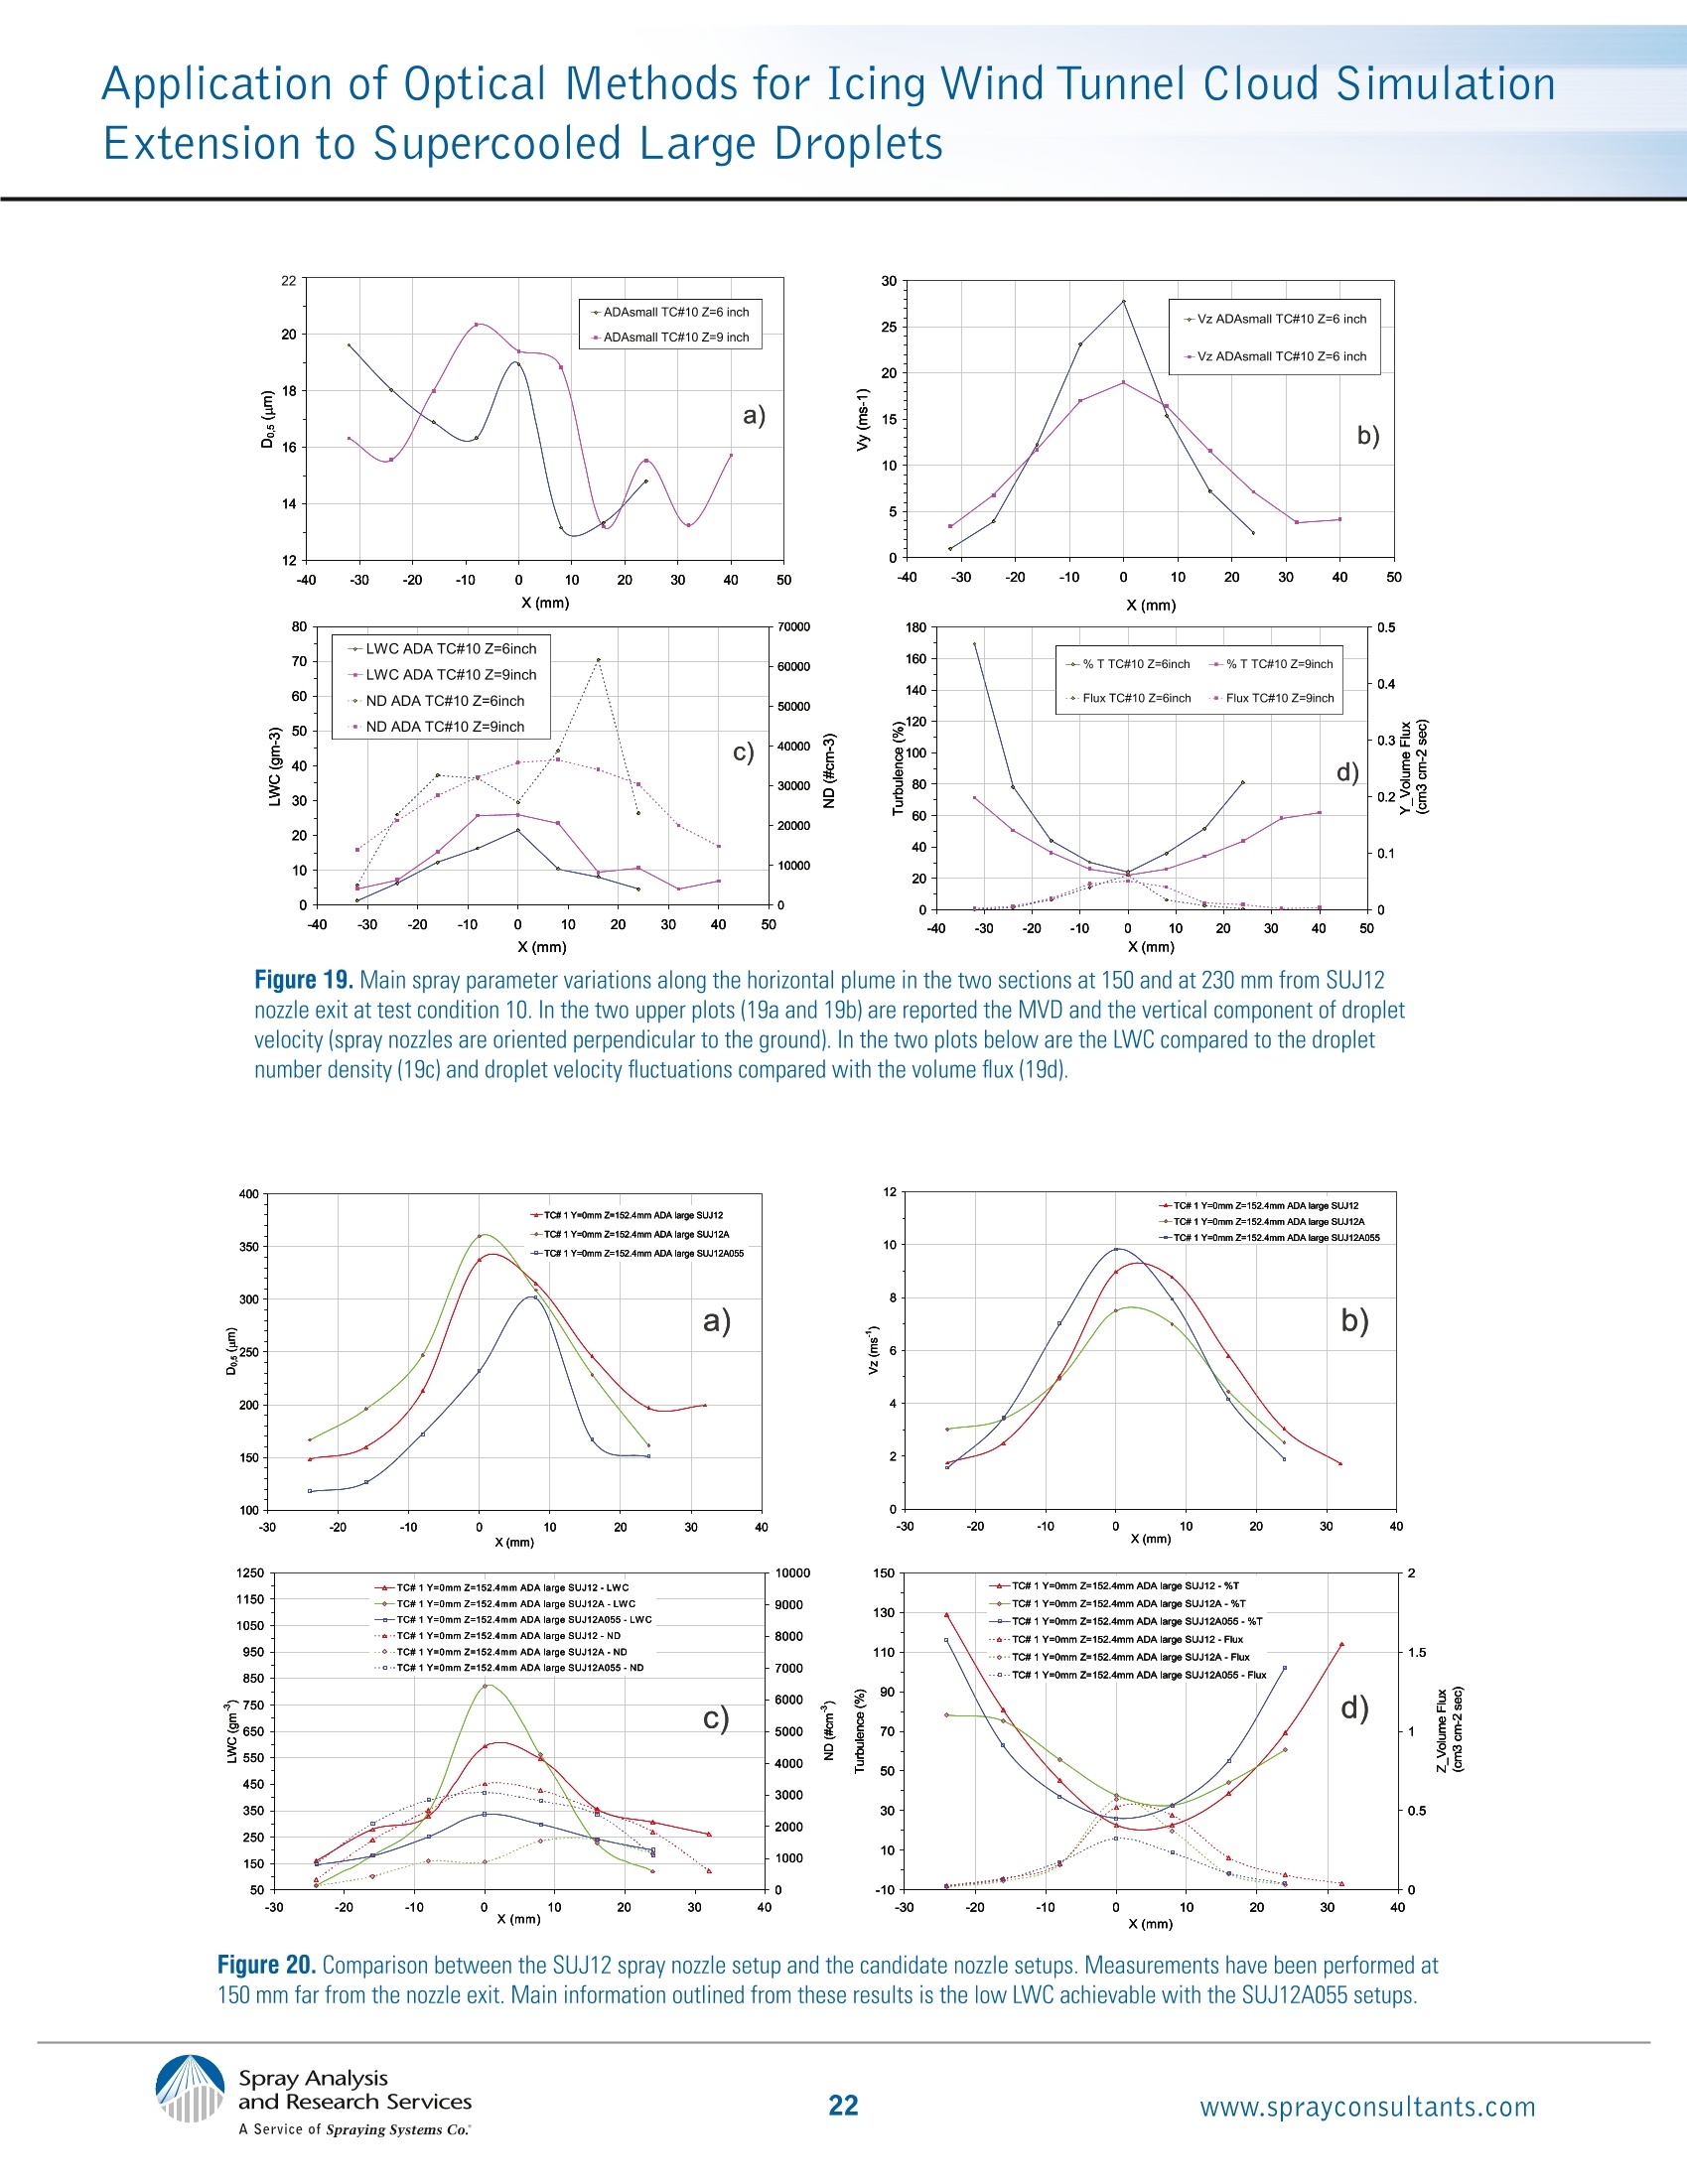
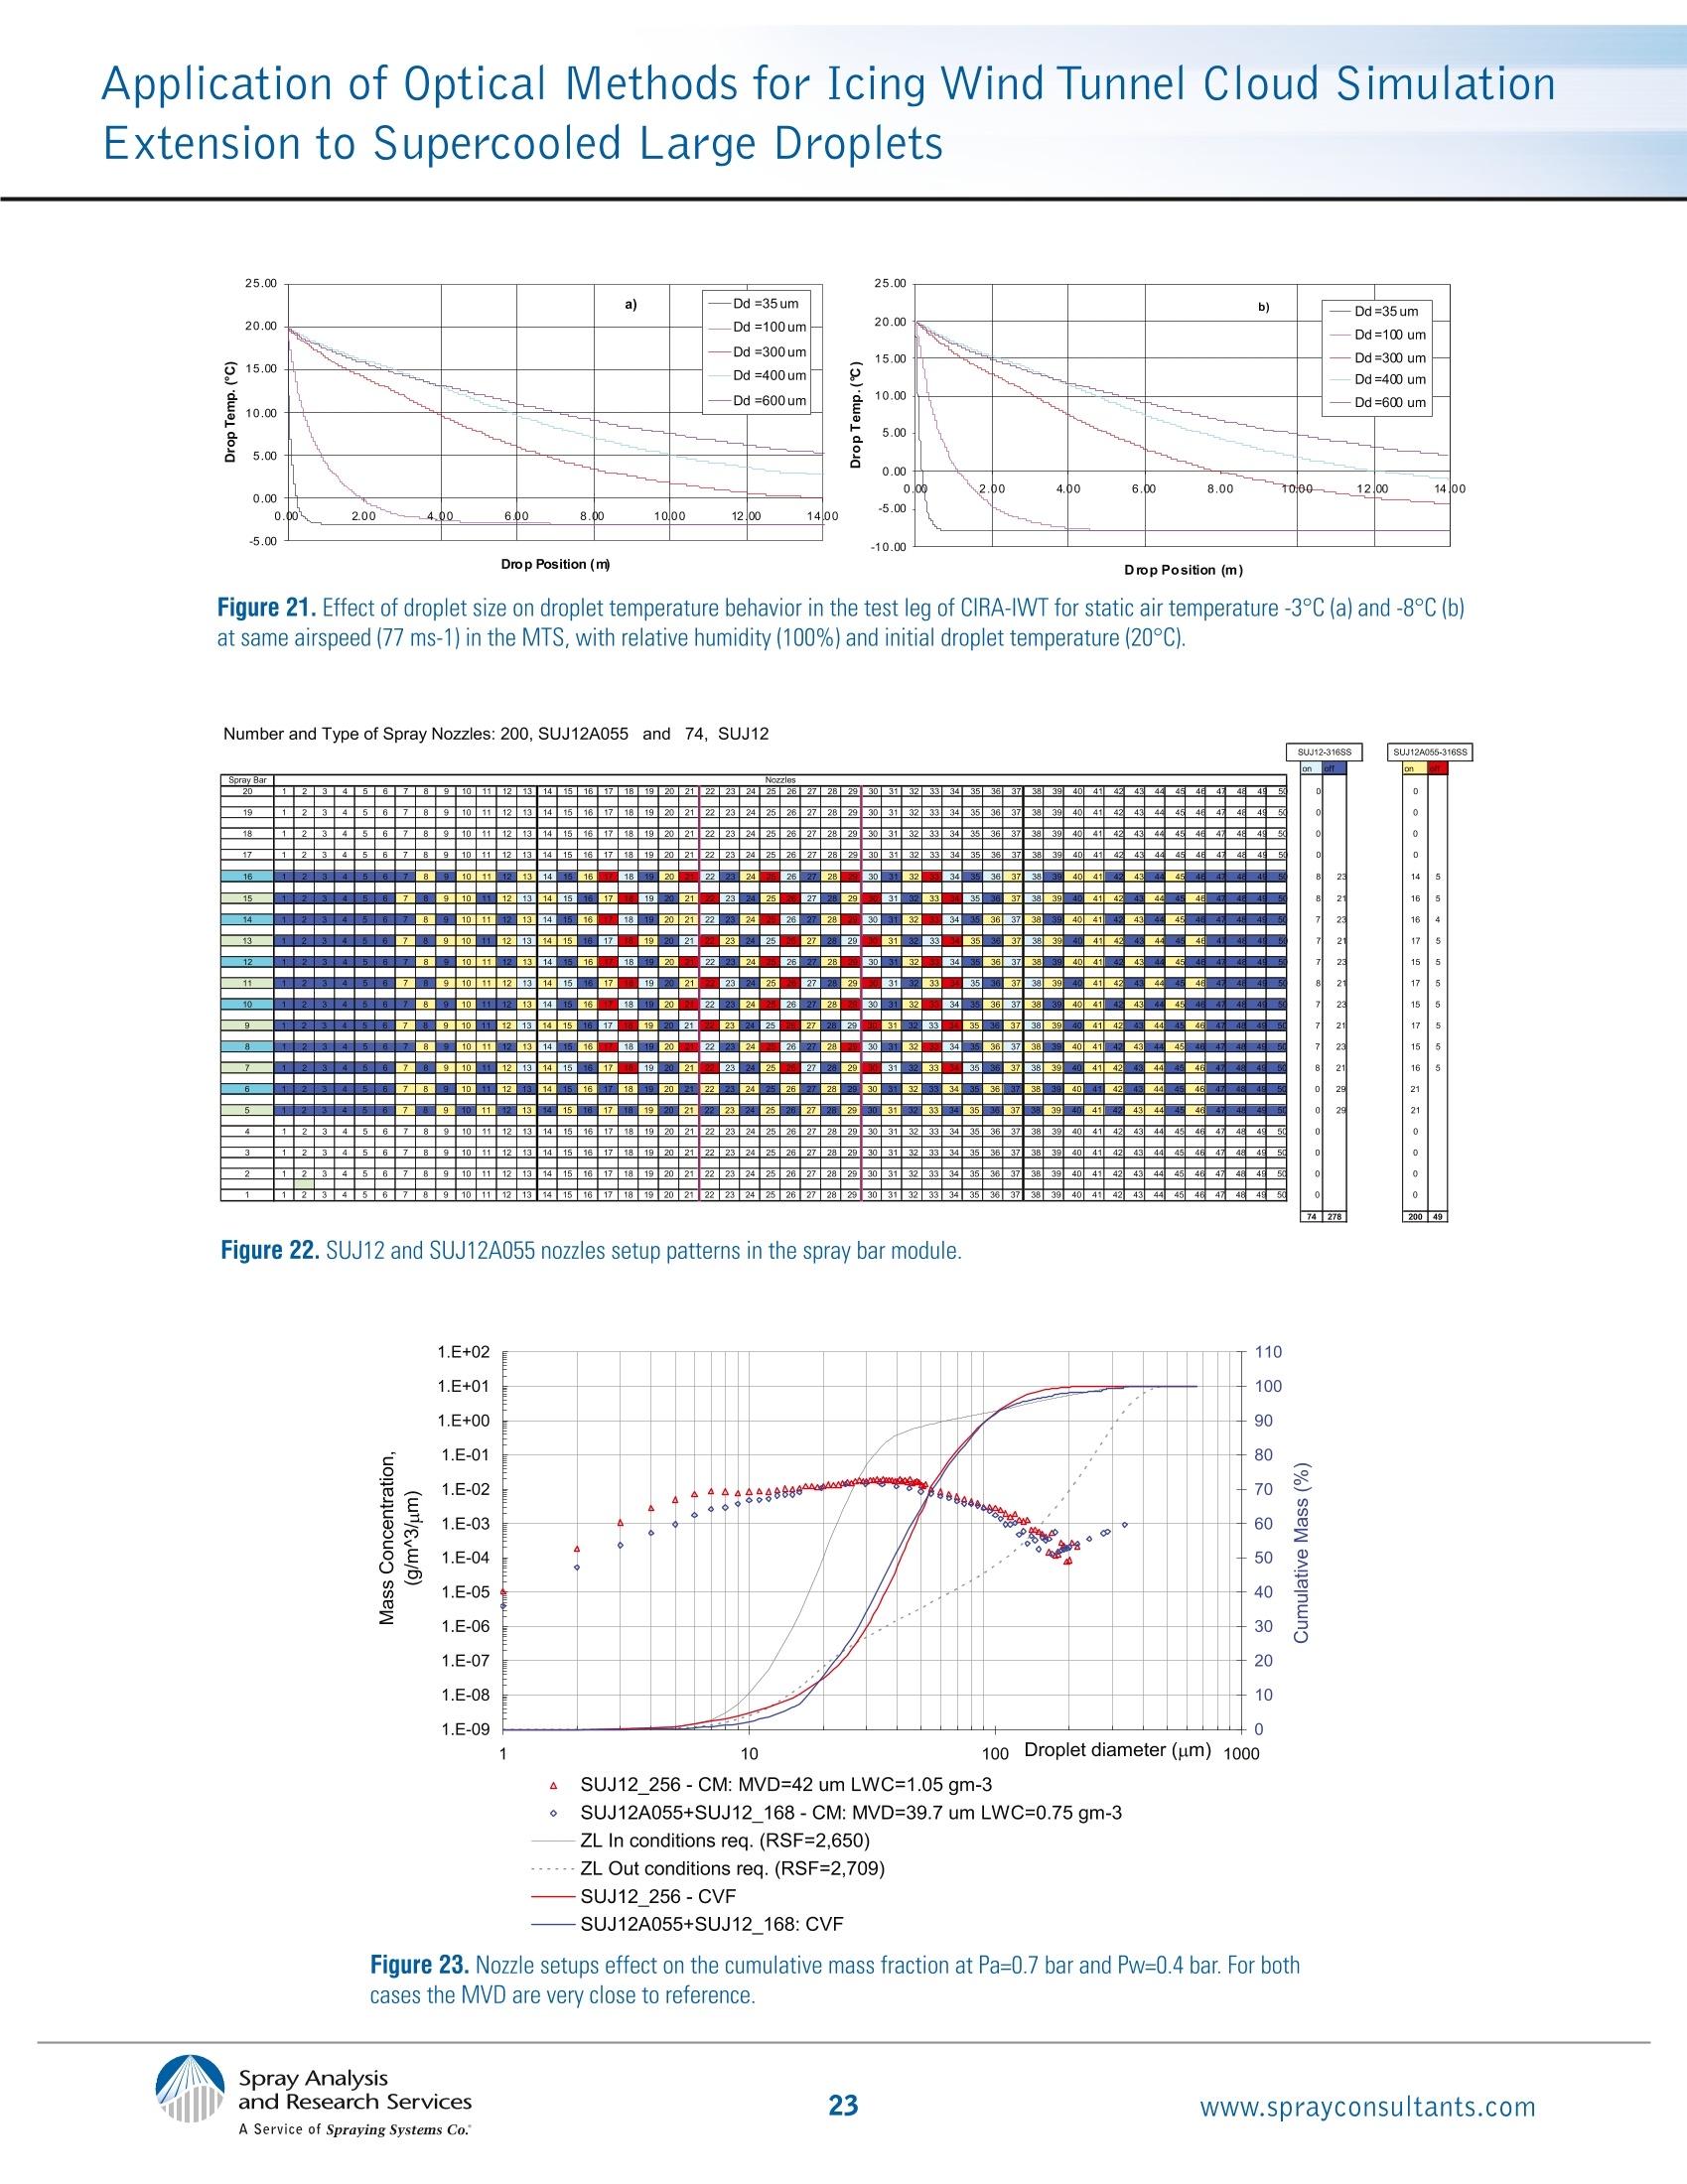
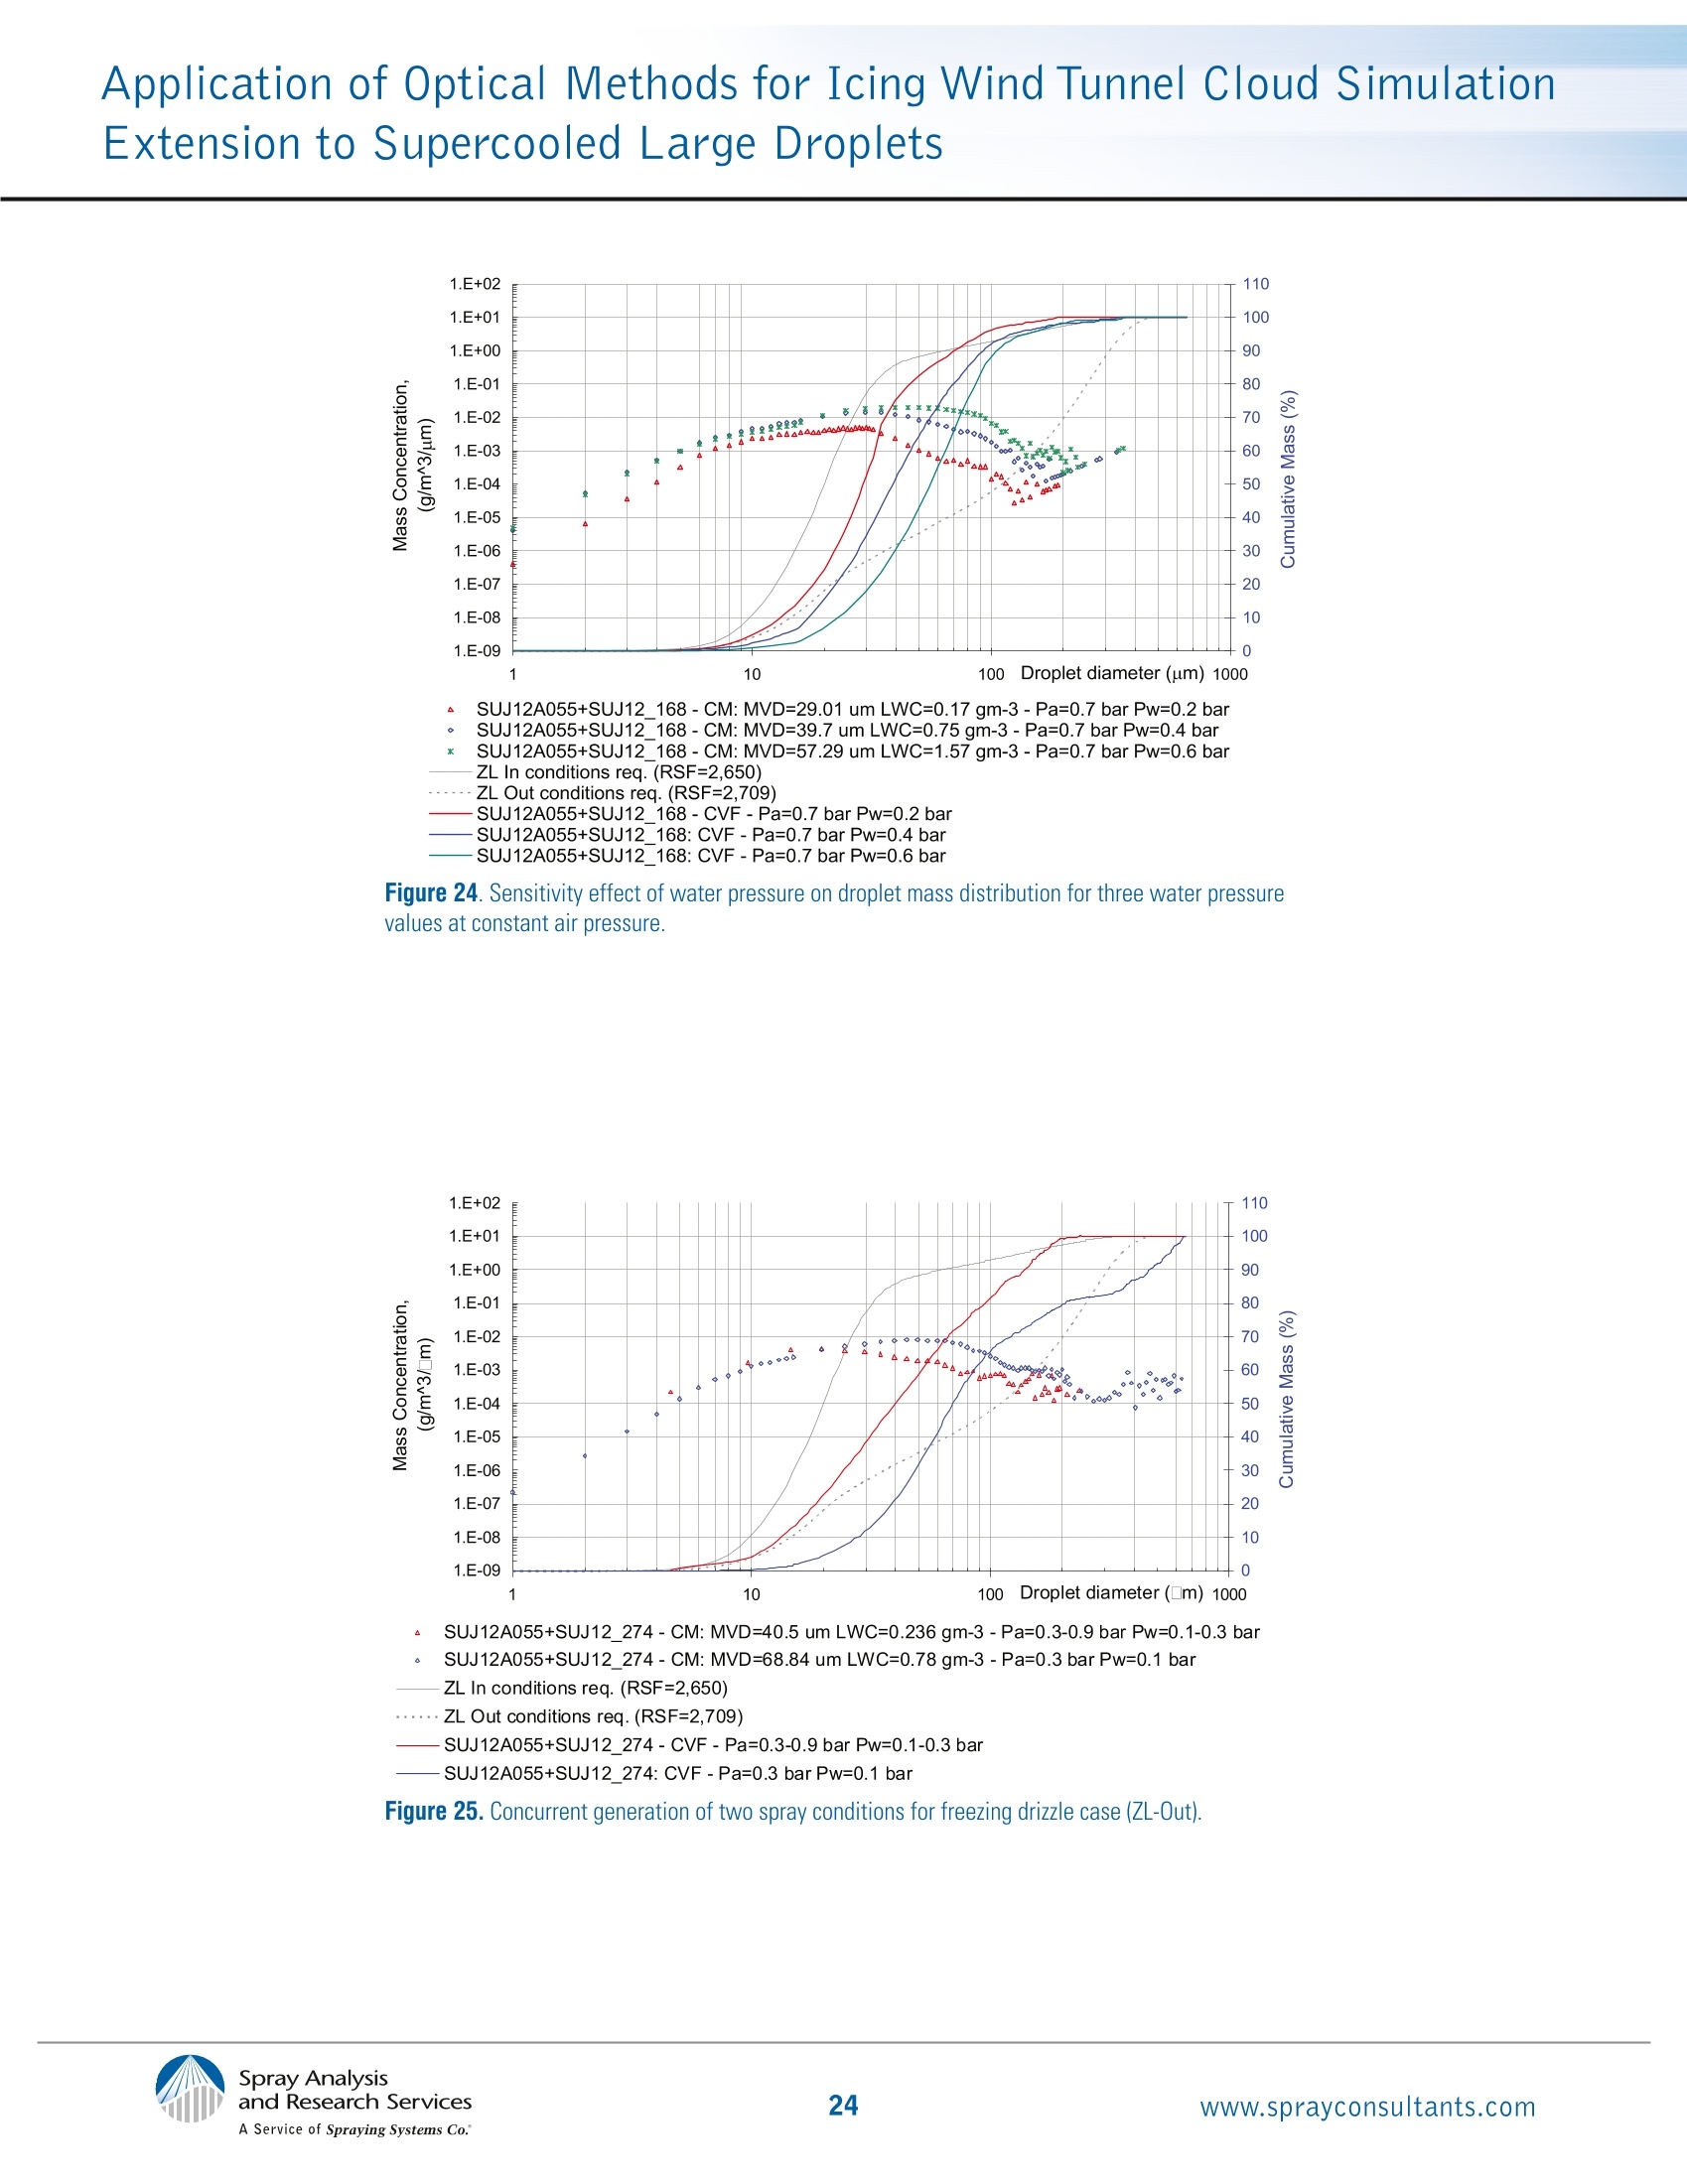
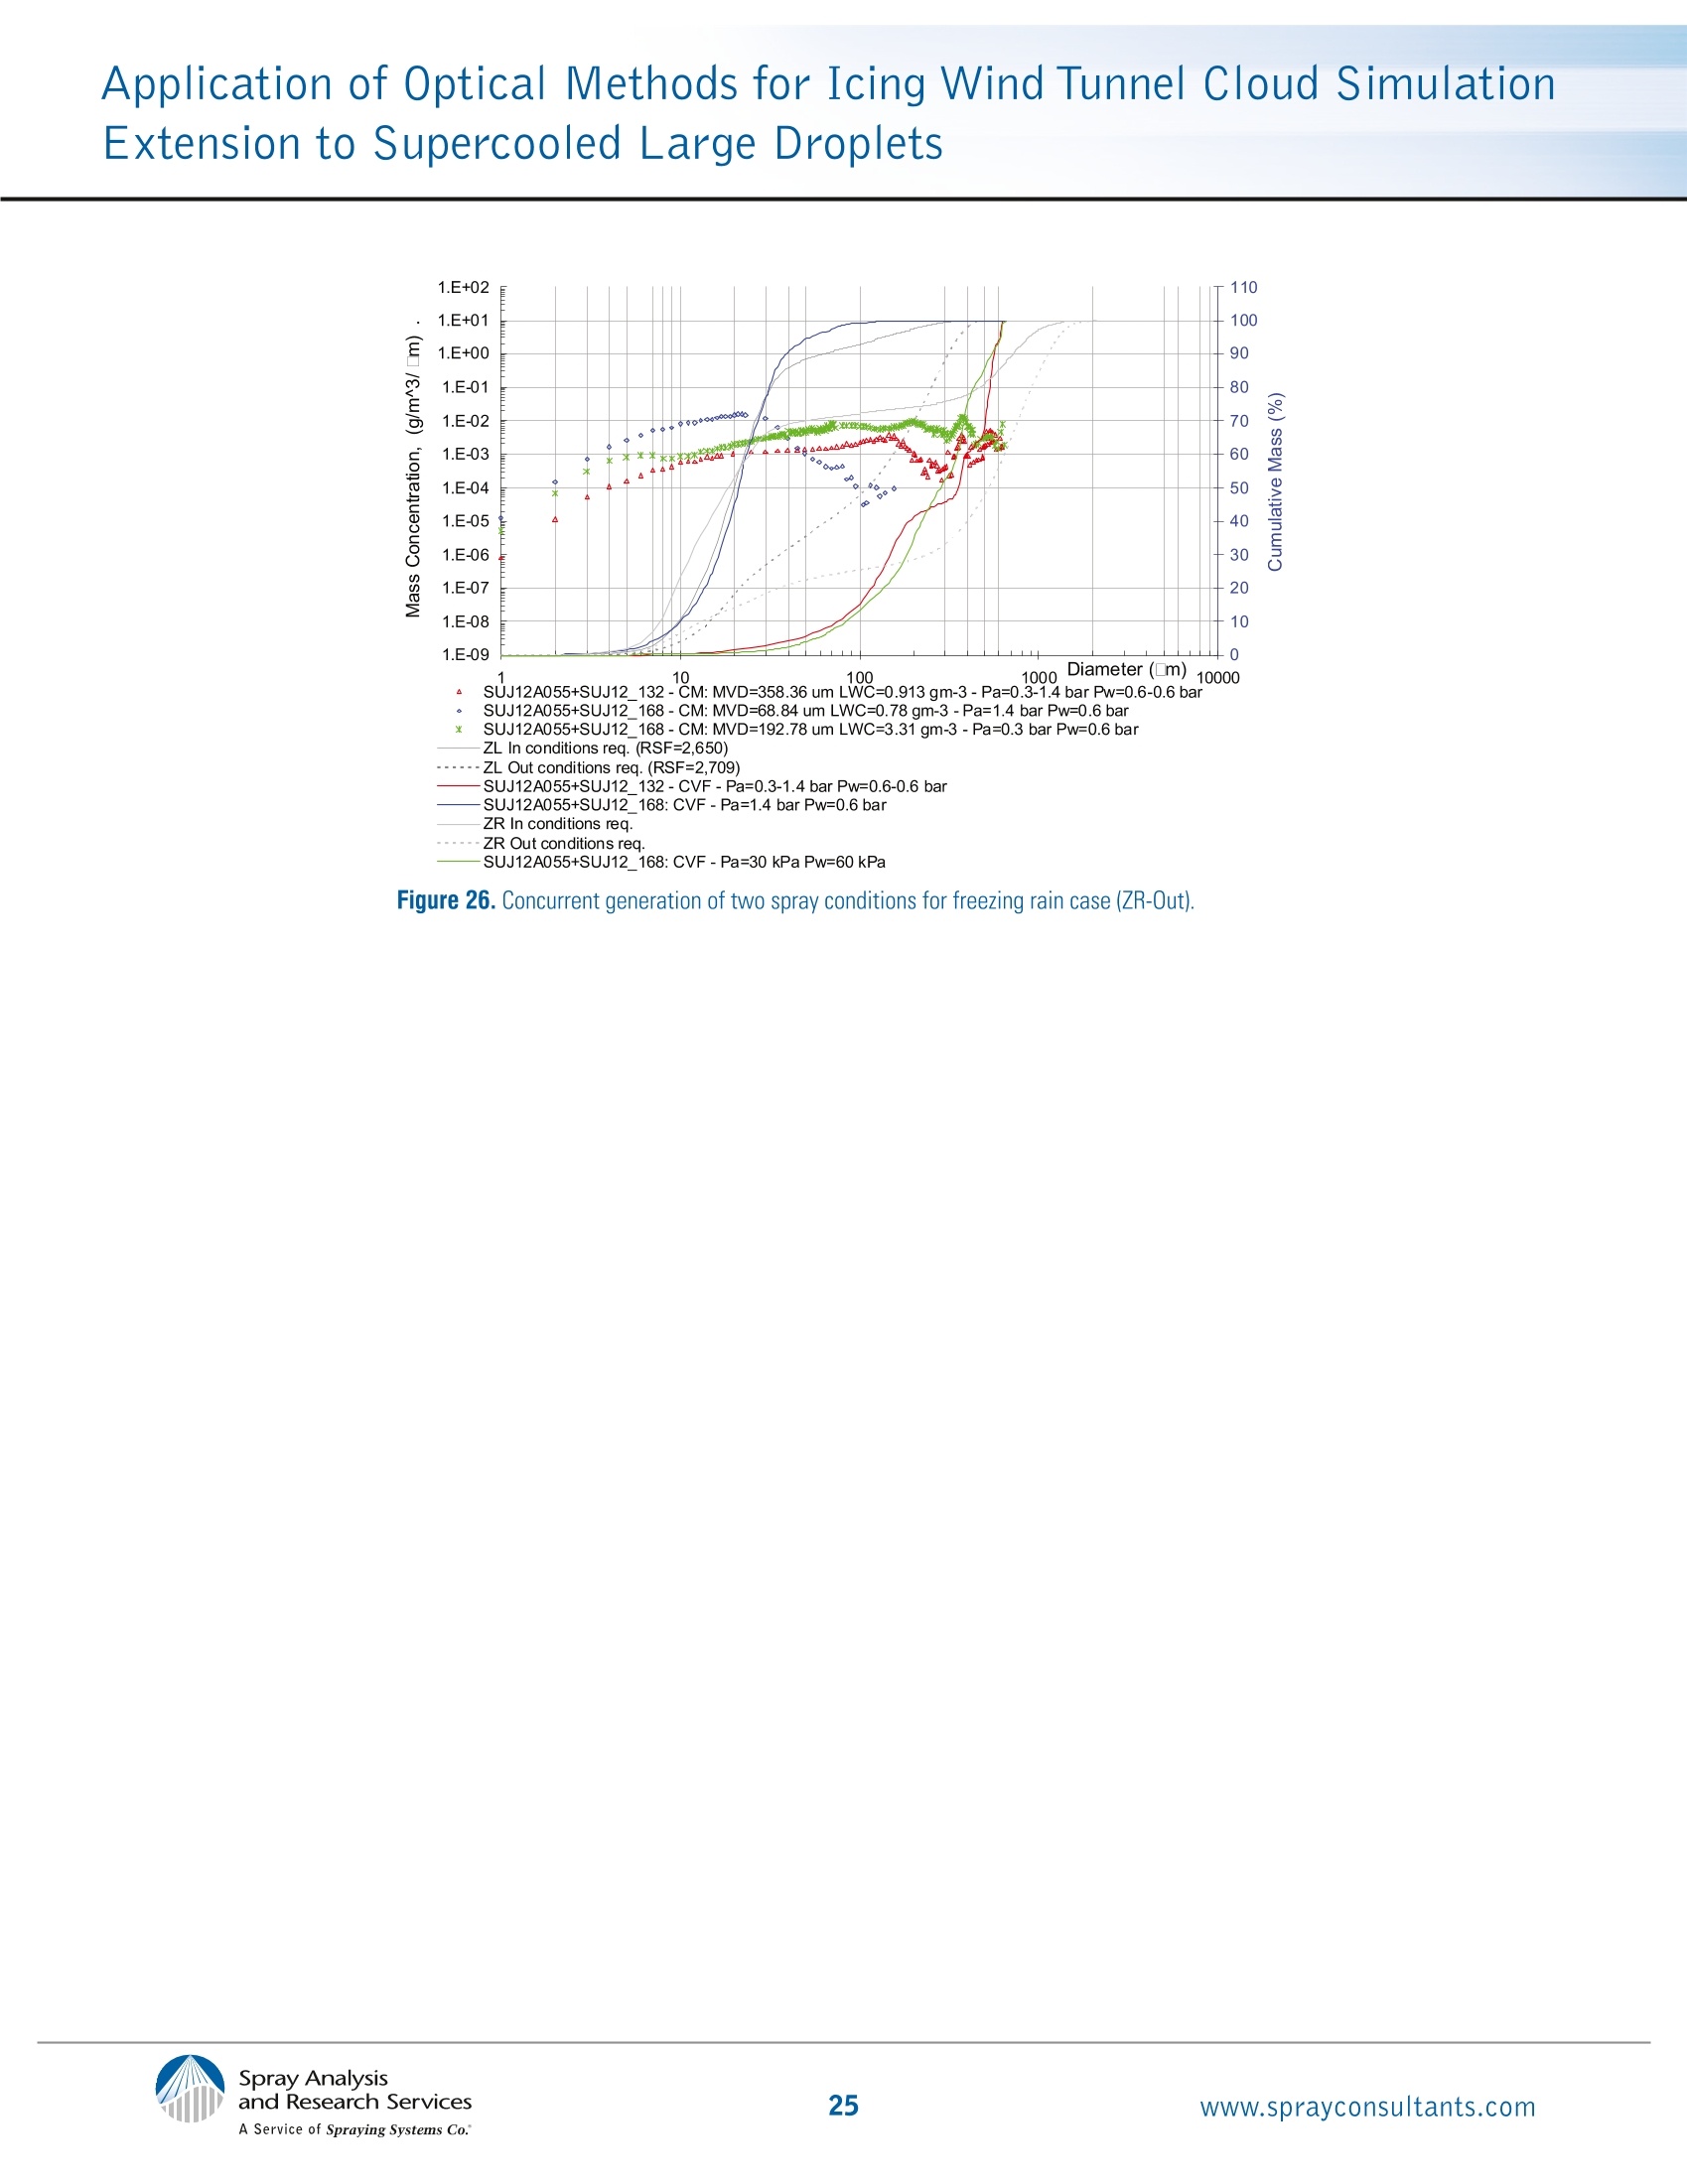
Application of Optical Methods for Icing Wind Tunnel Cloud SimulationExtension to Supercooled Large Droplets A Service of Spraying Systems Co. Application of Optical Methods for IcingWind Tunnel Cloud Simulation Extensionto Supercooled Large Droplets As presented at: ILASS-Americas, 23rd Annual Conference on Liquid Atomization and Spray Systems,Ventura, CA, May 2011 Biagio M. Esposito* Icing Methodology Branch CIRA, Centro Italiano Ricerche Aerospaziali Capua, Italy Kathleen J. Brown Spray Analysis and Research Services Spraying Systems Co. Wheaton, IL 60187 USA William D. Bachalo Artium Technologies,Inc. Sunnyvale, CA 94086 USA The icing wind tunnel (IWT) is one of most importantmeans of compliance testing, providing controlled andrepeatable simulations of aircraft in-flight icing encountersfor a variety of evaluations and studies. In addition toconventional aerodynamic wind tunnel components, IWT'smust have refrigeration systems with heat exchangers(HXs) to cool the air to controlled temperatures belowfreezing. These facilities also require a system forspraying nebulised water (Spray Bar System, SBS) into theairstream. A further requirement is careful control of bothdrop size and concentration to generate an icing cloud in the test chamber. Taking into account the two-phaseflow, the aerodynamic line of the icing wind tunnel testleg is designed to function as a means for producing thedesired droplet thermo-kinetic behaviour. The requirementis to better simulate a uniform spatial distribution ofwater droplets together with velocity and temperaturevalues that are as close as possible to the correspondingconditions of the air flow especially, for large dropletsize. Test conditions produced in icing tunnels must berepresentative of the present aircraft icing certificationcriteria published in Appendix C of the Federal Aviation Regulations, Part 25. Due to aviation accidentsand incidents created by large droplet icing cloudconditions, it is expected that the current certificationcriteria will be reviewed. From the following cloudmicrophysics studies, it has been determined thatsome clouds with large droplet diameters containdrop size spectra with bi-modal behaviour that is quitedifficult to reproduce in an icing tunnel with currentspray nozzle technologies. Recent additions to theregulation "Appendix O" defines supercooled largedroplet (SLD) icing conditions that consist of freezingdrizzle and freezing rain (at ground level or aloft) andforeseen precipitation in or below stratiform clouds.These icing conditions are defined by the parametersof altitude, vertical and horizontal extent, temperature,liquid water content, and water mass distributionas a function of drop diameter distribution. Aviationaccidents and incidents in SLD conditions haveinitiated a number of ice accretion and performancestudies. Several University of Wyoming King Air flightsthrough icing conditions have been analysed.Theseexperiments reported that freezing drizzle exposureresulted in the maximum rate of performancedegradation. On the other hand,to limit theconcentration of large droplets (>300pm) for thermo-kinetic reasons and taking into account the SLDtemperature envelopes, freezing drizzle environmentsrepresent the only conditions that can be generatedin conventional icing tunnels to produce realistic ice Introduction Background In-flight icing research studies designed to charac-terize clouds with large droplet environment havebeen performed in both US and Europe in order todefine a database from which the Ice ProtectionHarmonization Working Group (IPHWG) of the AviationRulemaking Advisory Committee has developed draftregulations and guidance materials (ref. 1 and 2). Priorto considering the expansion of FAR 25 Appendix C toSLD conditions (Appendix 0), the aviation authoritiespointed out that research shall be done to develop thecapability for the icing wind tunnel needed for aircraftdesign and certification under these conditions. The available SLD icing database (ref. 3 and 4)indicates there can be a very large variety of drop accretion shapes on the test models. The overall goal of the current work is to extend theavailable CIRA icing wind tunnel cloud simulationenvelope to Freezing Drizzle conditions by means ofan upgrade of the CIRA Spray Bar System (SBS) byinstalling additional spray nozzle setups to generatethe spray cloud jointly with the actual spray nozzletypes. From preliminary measurements performedto assess CIRA-IWT freezing drizzle capability forthe larger (ATS) and shorter (STS) test sectionconfigurations, the requirements have been definedfor the spray bar system upgrade consideringthe different wind tunnel contraction ratios. Themeasurements have been performed with PMSoptical array probe (0AP-260X) and the AirborneDroplet Analyser (ADA) based on phase Dopplermethod. This paper will describe the results acquired withoptical methods (PDPA/PDI and LIF systems) duringthe feasibility study developed in collaboration withSpraying Systems Co., in order to determine the bestspray nozzle set-up to integrate in the actual CIRA-IWT SBS to match the Freezing Drizzle criteria forthe simulation of these icing events. Wind tunnelmeasurements will be presented together with thebasic results obtained by optical methods in bothCIRA's spray chamber and Spraying Systems’windtunnel experiments. distribution conditions. In-situ data (ref.5) havebeen segregated into distinct subsets by varying twoparameters, namely Dmax and MVD. They identified fivecategories included in the following table: ZC <40 um Dmax <100 um ZL-In <40 um 100 pm < Dmax <500 pm ZL-0ut <40 pm 100 um 500 pm ZR-Out < 40 pm Dmax >500 um The ZC referred to data that were equivalent to thosein FAR 25 Appendix C. ZL and ZR referred to freezingdrizzle and freezing rain respectively."In" and “Out"referred to whether the MVD values were smaller or larger than the maximum MVD value considered in FAR 25 App. C. The MVD threshold of 40 pm was based on the upper limit of FAR 25 App. C for continu- ous maximum (stratiform clouds) icing conditions. The Dmax threshold of 100 um was based on assuminga Langmuir D distribution for all drop distribution thatwould fall within FAR 25 App. C. The 500 pm thresholdbetween ZL and ZR was based on the meteorologicaldefinition for distinguishing drizzle and rain. Figure 1, summarized the cloud categories reported inthe above table and shows typical cumulative volumefraction representative of possible freezing drizzlewith MVD<40 pm(ZL_In) and MVD>40 pm (ZL_Out)cases (cf. Cober S. G. and Strapp W. personalcommunication) that shall be considered as SLDrequirements in icing tunnels. Same plots are alsoreported for the freezing rain conditions. These conditions are mainly defined by liquid watercontent and water mass distribution as a function ofdrop diameter distribution. Cumulative water massdistribution for specific liquid water content may bedetermined by multiplying the water content by thecumulative mass distribution fraction. Water massdistribution may be determined from the cumulativewater mass distribution by subdividing the drop+hadiameters into size intervals and determining theaverage mass fraction content contained in eachinterval. The average drop diameter of each intervalshould be used as the drop size of the average massfraction for that interval. To generate such icing clouds in the icing tunnel,an important role is attributed to the spray nozzlethat should be able to simulate the main naturalcloud characteristics taking into account of thedrop thermo-kinetic equilibrium with the air-streamespecially in the tunnel test-leg region where thecontraction section influences the droplet trajectoriesdepending upon the drop inertia parameter (ref.6). To better represent the attribute of bimodal clouddistribution characterized by freezing drizzle clouds,ref. 7 consider the 80% Volumetric Diameter (80VD)as more appropriate to measure the hazardoushydrometeor diameters when considering aircrafticing compared to the standard (50VD) MVD.80VDincludes the drizzle-sized drops, which may causedramatic aircraft performance degradation, and assuch shall be weighted more when freezing drizzlerequirements are to be reproduced in the icing tunnel. Together with the 80VD, the Relative SpanFactor (RSF), a dimensionless parameter indicativeof the uniformity of the drop size distribution, willalso be useful. Measured composite cumulativevolume fraction should be within the envelopedefined in figure 1. As reported in the same plot,the red and green continuous curves represent theupper limit to be achieved within respectively theZL and ZR envelopes. The lower dashed curves (thered dashed line for ZL and the green dashed line forZR) represents the minimum limits of the cumulativemass fraction to be achieved as a function of SBSair/water pressures and nozzle number selection.Figure 2a and Figure 2b reports the total liquid watercontent (cloud and precipitation) variation withrespect to the ambient temperature respectively forZL(In/Out) and ZR (In/Out) conditions foreseen in theproposed Appendix0 (ref.2). The amount of liquidwater content to generate in the wind tunnel with newAppendix 0 is significantly lower with respect to theachievable values provided in the tunnels for largedrop icing clouds. The CIRA SBS is equipped with commercial SS1/8JJ air atomizing spray nozzle type with SUJ12set-up that are able to generate a wide range ofdroplet size and concentration included in the FAR 25Appendix C envelope (figure 3). This plot shows thedashed line with different color indicating distinctnumber of active spray nozzles used to achieve aslice of Appendix C envelope. These curves havebeen achieved within SBS calibration programs withstandard spray nozzles using the MTS configurationat 80 m/s and minimizing the number of the activespray nozzles to 100 in order to avoid poor clouduniformity and coverage area in the test section whengenerating large drop sizes up to 50 pm of MVD. To define the technical specification for a newspray nozzle setup able to generate appropriateSLD conditions, information from the comparisonbetween the actual CIRA-IWT SLD generation and thefreezing drizzle envelope has been extracted. Figure 4provides a guide as to the amount of the mass fractionneeded for each spectrum’s size bin in both MTSand STS configurations considering the typical largedroplet cloud generation respect to the ZL (In/Out)requirement (CIRA IWT target). Data were collected in the ATS configuration witha phase Doppler icing probe (Airborne Droplet Analyzer-ADA) using the large optical configurationfor two different SBS's pressures conditions. The firstcondition (blue curve), with air and water pressuresrespectively 0.3 bar and 0.6 bar, approaches 95.2 pmof MVD that is very close to the maximum ZL_0utlimit (114pm). The cumulative curve behavior isnot bimodal and crosses just within 50% of thecumulative volume fraction (CVF) requirement from95.4 pm to 169 pm respectively for ZL_Out and ZL_Incurves. In the same plot, Freezing Rain requirement(ZR_In and ZR_Out curves) has been included toprovide an indication about the coverage of thisenvelope but without the intention to consider theseas requirements for the reasons explained before,due to the largedroplet thermal-kinetic equilibriumwith the tunnel airstreams. Also in this case, thecondition crosses the envelope for a value thatis very close to the ZL case, 49.4%, from 62 pm to130 um respectively for ZR_Out and ZR_In curves.To guarantee an acceptable cloud coverage anduniformity in the test section, up to 302 active spraynozzles have been used.Unfortunately, that producedliquid water content that was too high in comparisonto the expected values (figure 2a and 2b). The resultsshow a very low number of concentrations in thesize range 3 pm to 80 um but with values of total LWC(1.3gm3-1.4 gm) that are too high. The LWC canbe decreased reducing the number of active spraynozzles but this solution typically provides poor clouddistribution and coverage in the test section. The LWCvalues have been achieved optimizing the number andlocation of active spray nozzles in the SBS to achievebetter cloud uniformity results in the test section.Additional comparisons with ZR requirement havebeen reported in the figure 4 for larger MVD for bothATS and STS configurations. As for the previous testcondition, data were collected with the ATS installedand using the ADA probe with large range while forthe STS, both phase Doppler instruments, with smalland large droplet size range, and PMS Optical ArrayProbe (0AP-260X) were employed. Collectively, thesedata still showed CVF distributions too far from therequirements with just 50% of the concentrationoverlapped by ZR envelope and with liquid watercontents still too high in comparison to the maximumexpected value foreseen in the ZR envelope(figure 2b). Objective of Spray Plume Characterization From these and other similar data, the requirements have been defined for the new spray nozzle setupto be installed in the SBS in order to operate bothas a retrofit with the standard unit and as the onlyactive spray nozzle type. The CIRA SLD requirementcorresponds to the freezing drizzle conditions (ZL_In/ZL_Out) and is illustrated in figure 4 in terms of CVF.As reported in the same plot, the red continuous curverepresents the target to be achieved with the newspray nozzle setup. The lower curve (red dashed line)represents the minimum limit of the cumulative massfraction to be achieved as a function of SBS air/waterpressures and nozzle number selection. The bimodaldroplet spectra distributions have to be in agreementwith the expected liquid water content defined by ZLconditions (figure 2a). lt is expected that the base requirements for theselected spray nozzle setups shall be able to achievethe required performance in conjunction with currentCIRA-IWT spray nozzle setup: -The actual LWC shall be reduced by 60% usingthe same active spray nozzles number (300 to 500)to avoid the reduction of cloud uniformity andcoverage area in the test section. The achievableLWC value shall be in a range of within 0.2 g/m to0.65 g/m. - The droplet concentration/mass shall be increasedin the low diameter size range (from 3 pm to 80 pm)to fit the SLD boundary requirement. - The cumulative mass fraction shall range withinthe ZL_In-ZL_Out boundaries described in figure1 and figure 4 as shown by continuous and dashedred curves. A joint collaboration between CIRA-IWT and SprayingSystems Co. (SS) was developed to identify spraynozzle setups to be selected on the basis of technicalrequirements through the means of experimentalactivities addressed to characterize their sprayplume performance using company facilities (spraychambers and wind tunnels) and instrumentation.This collaboration has been conducted between 2007and 2008 and was developed by means of activitiesdescribed in the following sections. A plan view of the CIRA IWT closed-loop designis shown in figure 5. There are three test sectionconfigurations with dimensions, maximum achievablespeed, and temperature ranges reported in the table of figure 5. The tunnel fan is powered by a 4 MWelectric motor, which can compensate for pressurelosses due to extensive icing runtime with a 35%power margin. Maximum achievable speeds are afunction of test section configuration. The tunnelcontains a twin flat-faced heat exchanger in theback-leg circuit downstream the wide-angle diffuser,which allows testing over a temperature range of+40°℃ to -40C. One important feature of this tunnel isthe ability to control the relative humidity (RH) duringthe tests from 70% to 100% in function of the static airtemperature. The tunnel water spray bar system (SBS), consistsof 20 spray bars (figure 6), which are located in thesettling-chamber of the tunnel two meters upstreamof the contraction. Each spray bar has positions forup to 50 air-assist spray nozzles. Each nozzle locationis supplied by water manifolds through individuallycontrollable electrically activated solenoid valves.A local control of individual spray bars is achieved EQUIPMENT & METHODS Experimental Setup and Methods The experimental setup consisted of a spray nozzle,wind tunnel, phase Doppler interferometer (PDI)system with traverse, and laser light sheet imaging(LSI) system. All tests were carried out with thecross-flow air and spray liquid (water) at ambienttemperature,~20C. The nozzles were operated witha steady clean water supply and dry air supply for alltests. Spray Nozzle Setups The SS model D41749+SUJ12 spray nozzle setup wasused for this testing. This setup provides a full conespray with relatively small drop sizes. This nozzle wasfit to a custom mounting/installation fixture whichcan be seen in Figure 5; the assembled as well as thedisassembled nozzle setup may be seen in Figures 7aand 7b. In addition to the SUJ12 nozzle,three alternatenozzles were fully tested: 1. D41749+SUJ12A-standard setup withPFJ2050+PAJ73160 using control boxes, with the main task of controllingthe air and water pressures, and the spray nozzles'activation. A closed loop control system managed bythe Facility Management System (FMS) can maintainconstant values for air and water pressure at the lWTSpray Bar respectively within the maximum of 3%and 5% for very low set points. As a consequence,both droplet size and concentration stability andreproducibility can be assured. Additional relevantfeatures such as the humidity control system andpressure altitude simulation up to 7000 m characterizethe performance of this facility. The SBS is fed by pressurized demineralized water(up to 10 bar)with electrical resistance higher than2Mega Ohm x cm and controllable temperature (upto 80°℃) achieving the maximum flow rate of about2 kg/s. With dry compressed hot air (up to 150°C dewpoint -40°C) with maximum flow rate of 2.3 kg/s, theSBS air pressure of 0.1 bar (abs) to 11.5 bar (abs) canbe achieved. 2. D41749+SUJ12A055-modified setup withPFJ2050+.055 air cap3. D41749+prototype-prototype nozzle tip as shownin Figure 7c. Prior to testing, a test fixture was fabricated by SS.This test fixture was mounted to a 3-axis traverse,which was designed and controlled to be used withthe drop size measurement system on the tunnel. Thenozzle assembly was held in place on the traverse andthe axial spray distance was maintained at 150 mm (+ydirection) throughout testing. Drop size testing wasperformed at adequate radial intervals at the locationsdemonstrated in Figure 8. In order to characterize thespray distributions or patternation, measurementswere acquired in both the x and z directions. Due tothe spray plume variations of the prototype comparedto the standard nozzle setups, an alternate matrixof points was used in the characterization of theprototype nozzle tip. Application of Optical Methods for Icing Wind Tunnel Cloud SimulationExtension to Supercooled Large Droplets Wind Tunnel The wind tunnel utilized in these experiments wascapable of producing a uniform co-flow wind speed(vwt) range of 2.51 bar), asecondary flow produced by the suction of a blowerwas activated. The spray chamber was provided bya 3d traversing system that could range within theavailable 800 mm x 780 mm cross section area. Boththe air and water pressure can range from 0.1 to 20bar-g with 1% accuracy at the full scale condition.The nozzle assembly was held in place on the traverseand the axial spray distance was maintained at150 mm throughout testing. Drop size testing was thenperformed at adequate radial intervals at the locationsdemonstrated in Figure 8. In order to characterize thehorizontal spray drop symmetry, measurements wereacquired in the spray chamber (see figure 11) in boththe x and z directions. De-mineralised liquid flow to the system was suppliedvia a pressurized vessel. In both CIRA and SS spraychambers the flow rate was monitored and controlledthrough a Khrone flow meter and standard regulator. Air flow rate was monitored by a MicroMotion CMF-10flow meter. The MicroMotion flow meter is a Coriolismass flow meter that measures the density of the fluidto determine the mass flow. This meter is accurate to±0.4% of the reading. Phase Doppler Interferometry The phase Doppler Interferometry system used inthis study was an Artium PDI 2D MD instrument withthe integrated AIMS software used for automatedprocessor setup. This system measures the size,velocity, total count of each particle passing throughan optical measurement volume formed by pairs ofintersecting laser beams. The optical measurementvolume is also reliably sampled in situ to providehighly accurate droplet concentration and volumeflux measurements, as described in Bade (ref.8). Thetechnical explanation of the Phase Doppler techniquecan be reviewed in a number of publications includingBachalo and Houser (ref.9) and Bachalo 1985 (ref. 10).The ability to measure accurately requires the reliablecharacterization of the size, velocity, and transit timeof each droplet. The Artium AIMS software, which was utilized inthese experiments, incorporates an auto-setup featurethat serves to optimize the frequency and phase shiftprocessing. The auto-setup feature acquires a smallnumber of signals produced by droplets passingthrough the measurement volume and is discussedin detail in Bachalo, et al. [U.S. Patent 7,564,564].User-to-user setup differences that have been knownto produce varying results and uncertainty in PDIdata results have been significantly reduced with thisapproach. The laser transmitting lens focal lengthwas 500 mm for all tests; the receiving unit focallength was 500 mm for all tests and was orientedat the 40°off-axis forward scatter position. Thisprovided an effective measureable drop size range ofapproximately 1.0 to 180 pm. Airborne Droplet Analyzer (ADA) System A schematic of CIRA's phase Doppler based onAirborne Droplet Analyzer (ADA) system is shownin Figure 12. The system uses two probes havingslightly overlapped but different measurement ranges. Application of Optical Methods for Icing Wind Tunnel Cloud SimulationExtension to Supercooled Large Droplets The system was originally provided by Aerometricsin 1996 but some changes have been made to thelaser source, probe optics, signal conditioning andprocessing electronics. A 532 nm diode-pumped solidstate (DPSS) laser system with 2 Watts of maximumoutput has replaced the original air-cooled Argonlaser to help maintain a more stable laser beam withGaussian intensity distribution (TEMoo), reduce theelectrical power supply, and increase the outputbeam light power from 10 mW to 35 mW per channelwith maximum Argon output power of 300 mW andat 650 mW of DPSS respectively. Optical changeshave been performed on the ADA 100F/LR (large sizerange) replacing the original mirror pack, installed inthe transmitter side to reduce the beam separation,with small prisms (beam contractor) positioned afterthe collimation lens. With this solution the transmittercan create two probe volume sizes thus giving abilityto measure two size and velocity ranges. ADA 100F/LR allows the possibility to measure droplet sizes from1.92 um to 662 pm with a 287 pm beam waist diameterand 9.6 pm fringe spacing. With the beam contractorthe measurable droplet size range becomes 4.3 pm to1426 pm. The ADA 100F (small size range) allows thepossibility to measure droplet size within the range of0.5 pm- 148 pm. An eight-bit signal processor with up to 800 MHzsampling rate (TSI FSA-4000) has been used for theADA system. As shown in Figure 12, the optical signalsfrom the phase Doppler receiver are transferred tothe photo-detector module (TSI PDM 1000) whichincludes a calibration diode, to correct any phasedelays caused by receiving optics and electronics,and an intensity measurement circuit. One advantageof this unit is the intensity circuit that measures thepedestal amplitude of one of the Doppler burst signalsto be used as additional independent validationcriteria [Bachalo, U.S. Patent 4,986,659]. The FSAprocessor receives its input signals directly fromthe PDM (photo-detector module). It performs thedown-mixing and band-pass filtering of the signalbefore sending it to the burst detector. When burstsare detected, the signal is sampled and processed toextract frequency, phase and transit time, which aresent to the personal computer. The FSA uses 12 bitand 16 bit digitalization, respectively, to obtain phase and frequency measurements and burst-by-burstsampling rate optimization to maintain the highestpossible resolution (ref. 11). Optical Array Probe (0AP) The 0AP is a widely used instrument in themeteorological and icing communities to measure thediameter of larger (>100 um) cloud droplets originallymanufactured by Particle Measuring Systems (PMS).The CIRA OAP comes in 1D (0AP-260X) and 2D (0AP-2DC-greyscale)models. The 1D model measures onlydiameter, but the 2D version also provides images sothat the shape of the particles can be determine. TheOAP is a self-contained probe that is approximately1 m in length (Figure 13). The optical sensing systemof an 0AP consists of a laser beam with an ellipticalcross section and Gaussian intensity distribution thatis projected between extended arms through whichparticle-laden air flows. The laser illuminates a linear array of photodiodes,where the number of diodes for both CIRA 0AP is64 elements in the array. A particle in the beam willform a shadow that is imaged onto the diode arrayand results in light attenuation on some of the dianoftha nAp2n araverodes.With the exception of the 0AP-2DC grayscale probe,all OAPs requires that the light level on an individualdiode decrease by 50% from ambient before the diodeis registered as shadowed. In the case of OAP-260X,an attenuation of at least 67% is required for at leastone of the diodes. Attenuation is defined here as (lo-I)/lo, where lo is thebackground light intensity and I is the light intensityat the diode. The selection of the 50% attenuationcriterion is used as a method for constraining errorsdue to miss-sizing (ref. 12). The amount of lightattenuation is a function of the wavelength of thelight, the size of the particle, and its displacementfrom the center of focus (COF). In general, as thedisplacement from COF increases, the shadow areaincreases and attenuation decreases. Reference 12measures the attenuation as a function of distancefrom COF of a 300-pm drop and finds that the diameterof the shadow image was within 10% of the particlediameter when the light attenuation was greaterthan 60%. This criterion establishes the maximum Application of Optical Methods for Icing Wind Tunnel Cloud SimulationExtension to Supercooled Large Droplets displacement that a particle can have from the COFand still meet the 60% attenuation threshold. Thismaximum displacement is commonly referred toas the depth of field (DOF). Nevertheless there areseveral factors to consider when accessing theaccuracy of the OAP (ref. 13). These include thecounting errors, spectral broadening due to out offocus droplets, coincidence errors, velocity errors,and statistical uncertainties. Laser Sheet Imaging The laser sheet imaging system implemented herewas a commercial system developed by LaVisionalong with the associated DaVis image acquisition/iprocessing software. The LSI system utilizes alaser sheet, with a Gaussian intensity profile, whichilluminated the spray in a single downstream plane.The Gaussian intensity profile of the laser sheet ischaracterized and corrected for by imaging uniformsized fog droplets over the entire image area.Thelaser sheet was approximately 1 mm thick whichis sufficiently thin to represent a two dimensionalsheet in the spray (y) direction, with imagesacquired in the y-z plane. The camera was locatedat an off-axis angle outside of the wind tunnel. Theimage calibration was conducted by first imaginga calibration-sheet with markings of know size andspacing to characterize and correct the skewedcamera images to the actual planar spray cross- RESULTS & DISCUSSION As the first step, data from the available databasewere evaluated. Potential spray setups were availableto cover SLD requirement in combination withstandard CIRA-IWT nozzle setup (SUJ12). Comparison of diameter statistics data in terms ofDv0.5, Dvo.1, Dv3.2, Dmax and number density on the basisof selected air and water pressures, have beenperformed during the spray chamber experimentson three candidate spray nozzles. The matrix ofconditions used for comparison and reported intable 1 was based on more representative pointsselected after preliminary icing cloud calibration togenerate large droplet size in CIRA-IWT: section plane. For these measurements the planarlaser sheet was located at y=600mm downstream ofthe nozzle location. This location was selected so thatthe spray attributes were noticeably influenced bythe cross-flowing air stream, while not yet impingingon the wind tunnel walls, for most off-axis angleorientations. In order to determine time averaged spray coverageand shape information at the selected off-axis angle,a minimum of 200 instantaneous (with 7 ns of pulseduration) images were acquired, and the averageof all 200 planar intensity distributions was taken. Itis important to note that the resultant mean imagesare representative of the average light intensityscattered, through Mie light scattering, by dropletsacross the image plane. Over each image exposuretime, each droplet that passes through the lasersheet will scatter light proportional to its surfacearea. On average, the two-dimensional contours aretherefore representative of the total surface area ofdroplets;which is a coupled result that is increasedby an increase in the number of droplets and/orlarger droplets. Ultimately, these results provide goodinformation on the coverage and shape of the spraycross-section, and slightly less useful information onthe surface area distribution. It would have been moreuseful to have volume distributions, although theseresults provide good qualitatively relevant information. Test Cond. ID Pair Pwater AP (#) (bar) (bar) (bar) 1 0.3 0.6 -0.3 2 0.3 0.8 -0.5 3 2.76 2.07 0.69 4 0.5 1 -0.5 5 0.5 1.2 -0.7 6 1 2 -1 7 1.2 0.4 0.8 8 2.76 3.1 -0.34 9 1.65 1 0.65 10 2.1 1 1.1 11 4.6 3 1.6 Application of Optical Methods for Icing Wind Tunnel Cloud SimulationExtension to Supercooled Large Droplets The conditions with negative values of AP (Pair -Pwater),generated large drops (ZL_In/ZR_In) while thepositive AP produced smaller drop diameters for highAP (ZL_Out/ZR_Out). Spray plume characterisation were performed forboth CIRA and SS nozzles using a suitable spraychamber to integrate the available nozzle setupdata with new measurements and harmonise thecomparison between the selected spray nozzlesetups and the SUJ12. The measurements have beenperformed in the spray plume at 150 mm and at 230mm from the nozzle exit. In figure 14, the ADA systemsetup is described along with the indication of themeasurement points performed in each section of thespray plume (figure 8). Drop size data were collected from both CIRA andSS in their spray chambers using the ADA and PDIsystems respectively, for two identical nozzlesassembled as shown in figure 7. The optical layout ofboth SS and CIRA phase Doppler instruments wereset to examine respectively small (ZL_In/ZR_In) andlarge (ZL_0ut/ZR_Out) droplet size ranges identifiedin table 1 with positive and negative differentialpressures. Large differences were not expectedin the measurement of ADA's small size range ofdroplet spray (-11.8% for MVD, -1% for axial velocity,and +4.97% for concentration) respect to the PDI.However, larger differences between the two systemswere expected for large droplet spray (>60% forboth MVD and LWC) due to the available PDI dropletsize range. For this reason, in the following sectionsthe results of spray plume characterization will bepresented for small and large MVD by CIRA data.In this way, instrumentation-related measurementuncertainty were avoided during the spray nozzlesetup selection process since the ADA system wasused for the CIRA IWT icing cloud calibration. In bothcases up to 125,000 samples were acquired in eachposition in the spray plume section. The results indicate the relative flux of drops throughthe measurement area.Information on the volume-weighted mass center (centroid), spray plumespread angle and diameter have also been analyzed for all the spray nozzle setups at the operatingconditions reported in table 1, that have a knownperformance under stationary, ambient air conditionsas determined during the spray chamber experiments.The Spraying System Co. wind tunnel measurementshave been performed at 5.4 m/s and 14.7 m/s of co-flow velocities at 120 mm downstream from the nozzleexit.These velocities were representative of thoseachieved at the upstream of the CIRA icing tunnelspray bar system. Liquid pressure was measuredcontinually for all tests and liquid flow rate wasmeasured twice during testing, each time with threerepeatable measurements. The liquid pressure and airpressure was measured at the inlet to the liquid feedand air feed to the lance. Figure 15 shows the lay outused during the experiments with spray configurationrepresented by two active spray nozzles. The distancebetween the two nozzles was 136 mm as in CIRAspray bar system. All data presented here have beencollected for a single plume due to laser intensityand the sheet profile available. In the same figure 15it is also represented a typical laser sheet imagingcontour measurement which represents the relativespray distribution for an operating condition. The redarea represents a high concentration (large dropsizes and/or large number of drops) while the blueone represents the lowest concentration. Figure 16shows the comparison of SUJ12 raw data output forconditions 1 and 3 (table 1) corresponding to the largeand small droplets diameter generation at two airflowconditions. To compare the nozzle setups'performance, thespray plume diameters and the spray angles havebeen extracted from spray pattern images and resultsreported in figure 17 with spray plume diameter asfunction of the air and water pressure ratio. All thespray nozzle setups shows a higher spray plumediameter at high airspeed (14.7 m/s) for Pa/Pw<1.This attitude should improve the cloud uniformityrequirement for large droplet case (mainly for ZRrequirement) where a lower number of active spraynozzles shall be used to achieve the liquid watercontent requirement. SUJ12 shows ~30% high ofspray plume diameter respect to the candidate nozzlesetups. Differently from SUJ12 setup, for Pa/Pw>1both candidate nozzle setups shows an equivalent Application of Optical Methods for Icing Wind Tunnel Cloud SimulationExtension to Supercooled Large Droplets spray angle (~18 deg) for either the airspeeds. Figure 18 provides the polar plots that represent thecentroid distance and the centroid angle for all thespray nozzle setups at both the airspeeds consideredduring the experiment. This plot shows the differencebetween the geometric center and the mass centerof the spray for all the operating pressures conditionsreported in table 1. Both the plots shows very similarresults where increasing the airspeed, both thecentroid distance and centroid angle have been findreduced respect to the lower speed case in reason ofthe higher energy transmitted to the droplets. PDI and ADA Results - Small and LargeDroplet Size Conditions While the LSl results provide a relatively qualitativeassessment of the spray character, the PDI resultsprovide the quantitative means for assessing thesuitability of each nozzle option to fulfill the desiredresults. Figure 19 reports a typical set of data extracted fromthe measurements and used to analyze and comparethe behavior of the main spray nozzle performancein terms of spray uniformity in the section’s plume.The test condition considered is the number 10 (Pair= 2.1 bar, Pwater =1.0 bar) of the table 1 to generatesmall drops and the plots show the comparison in twosections of the SUJ12 spray plume (Z=152.4 mm andZ=228.6 mm). The Median Volumetric Diameter (Dvo,5) together withliquid water content (LWC) and its mass spectrumdistribution in the size bins represents the principalfactors to investigate for the icing wind tunnelapplication. In the plot 19a is shown that the distancefrom the nozzle exit reduced the droplet coalescenceeffect due to the boundary vortex at the border ofthe spray plume (for x<-10 mm and x>10 mm) andincreases the drops size uniformity in the spray core(-10 mm 0) of the spray plume for all thespray nozzle setups except for the SUJ12A. CIRA Icing Wind Tunnel Results Experiments have been conducted at CIRA icingtunnel with different test section configurationsin order to assess the tunnel contraction effecton the droplet spectrum due to different droplets'trajectories. Within April- August 2009, it wasconsidered the Main Test Section (MTS) equipping thespray bars with both SUJ12 and SUJ12A055 setupssimultaneously activated during the cloud generation.In this stage it was shown that the new spraynozzle setup was able to improve the ZL distributionespecially for the portion of the ZL_In envelope (MVD<40 pm). With this configuration it was also defined anew methodology for cloud generation and assessed the cloud attitude to reproduce the ZL requirement.Lastly, with same SBS configuration it was alsocompared the performance respect to the ZR_Outenvelope (MVD>40 pm). In the period June -October 2010 the SLDperformance was evaluated in the Secondary TestSection (STS) configuration. The SUJ12A055 setupbehavior was evaluated first and than compared withthe standard SUJ12 setup. Droplet trajectory effectson drop size spectra were also compared with datacollected in MTS. The results, reported in below, will be limited to thefirst part of experiments conducted in the MTS. The airflow conditions have been defined (ref. 14)taking into account the instrumentation limits (0AP-2DG grayscale probe) in terms of droplet speed,droplet temperatures and the constraint due to thelarge droplet re-circulation issues in the tunnel circuit.To predict the super-cooling regime especially forlarger droplets, it has been executed a parametricanalysis to determine the influence of the tunnel testleg on droplet temperature. A 1-D model based onheat and mass balance equations (ref. 15 and 16)was used to determine the temperature of a singledroplet released from the spray nozzle located in thespray bar section at 18.0 m upstream of the centreof the test section. The results, reported in the figure21a, show for the larger droplets diameter (≥ 300 pm)a strong dependence with the test section static airtemperature to achieve the thermal equilibrium at-3℃. For this reason during the experiments the airtemperature in the test section has been fixed to -8°C(figure 21b) for which, except for drops larger than400 pm, all the other drop diameters should be able toachieve the supercooling regime. The air-speed of 77m/s in the test section was defined to have the totalair temperature warmed enough (~-5C) to avoid theprobes anti-icing limitations that involves to the icingbuildups on the probe’s windows. For larger droplets (>400 um), the evaporation shouldallow both further cooling process and the reductionof the concentration for very small droplets in theclouds (< 10pm). As showed in reference 14 and13 for 200 um, droplet temperature achieves 0°C Application of Optical Methods for Icing Wind Tunnel Cloud SimulationExtension to Supercooled Large Droplets for static air temperature equal to -5°C without theevaporation. Setting to 70% the relative humidityat the upstream of the spray bar module, dropletevaporation occurs from SBS to the test sectionallowing the super-cooling regime (Td~-3.5℃) forlarger droplets and the diameter reduction up to~70% for smaller drops (< 20 pm) respect to theirinitial diameter. Unfortunately due to some technicalissues on humidity control system, it was not possibleto set the RH during the experiment to prove thetheoretical prevision but just to monitor the valuebefore and during the runs. Due to the low dropletnumber density, the RH was approximately stable at85% before the spray increasing up to 93% at the endof each run. Both SUJ12 and SUJ12A055 nozzle setups havebeen mounted from the bar #5 to the bar #16 of theSBS. To have the maximum flexibility in terms ofcloud concentration, uniformity and droplet spectrabehavior generation, a baseline of nozzle setupspatterns on the spray grid has been defined for thisexperiment. The nozzles amounts and their locationshave been represented in the figure 22. The laboratorymeasurements on the candidate spray nozzle setupsalso provided some information on spray plumegeometries allowing an estimation of overlap requiredto get the better cloud coverage area in the MTS.Analyzing the spray plume radius for each spraynozzles setups, it has been showed as this parameterrange form 19 mm to 33 mm at 5.1 m/s of airspeed atthe upstream of each single nozzle in the SBS section.To reduce the gaps between the nozzles, 1:2 nozzlesdistribution ratio has been used for the spray barmodule. To take into account of the two-dimensionalnozzle contraction and since the SUJ12 are able toprovide a larger particles (MVD>70%) and volume flux(>70%) than the SUJ12A055 at same "SLD pressuresconditions", in the figure 22 it is possible to note thatthe SUJ12 nozzles’density has been reduced fromthe settling-chamber’s centreline to the sidewalls inconsideration of the droplets thermo-kinetic inertiathat occurs through the IWT contraction length. The results reported in below for some key cases,are mainly defined by water mass distribution asa function of drop diameter distribution and as thecumulative water mass fraction distribution (CMD). Nozzle setups and Pw sensitivity effects In this case a total of 168 active spray nozzles of bothsetups have been considered. The ratio betweendifferent nozzle setups is 1.1 (68 nozzles with SUJ12setup and 90 nozzles with SUJ12A055 setups). Thespray bar air and water pressures were set to 0.7 barand 0.4 bar respectively. The result showed in figure23 was compared with the available data collectedat same conditions but with 278 active SUJ12 spraynozzles. This comparison suggests that changes inLWC do not appear to cause any big change in theshape of the spectra or cumulative mass curves.Even if there is a different LWC due to the highernumber of active nozzles, in both cases the MVD arevery close to 40 pm (ZC limit). It is possible to see alight improvement of CMD using the combination ofnozzle setups in comparison to the ZL requirementespecially for the high diameter range (from 105 umto 340 pm) where droplets concentration fits theZL_In limit curve. Otherwise, due to high active nozzlenumber (>30%), the case with only SUJ12 producesa higher droplet number density (+64%) between thediameter range 5 pm to 19 pm which LWC incrementcan be see on the mass concentration behavior forthe same diameter range. Nevertheless for both thecases, it is evident that the number density is still toolow (145 cm3) for small particle range (8 pm to 27 pm)if compared to the ZL_In requirement (959x103cm3).Even if both CMD are within the ZL requirement, thereis no evident bimodal distribution represented in thedata as also the RSF value (~1.85) obtained for bothcases confirm. A sensibility analysis using different water pressurewith same combination of active 168 nozzles patterngrid, at constant air pressure of 0.7 bar, has beenreported with the plots of the figure 24. For Pw=0.2bar both MVD (29 pm) and LWC (0.17 gm3) values arerepresentative of ZL_In conditions (see figure 2a forLWC). Respect to the same condition (blue curve withPa=0.7 bar and Pw=0.4 bar) of figure 23, the CMD arewithin the two ZL envelopes for an extender diameterrange (5 pm to 75 pm). After the crossing point theCMD exceed the ZL_In threshold a little bit due toa higher droplet number density that becomes 33%higher than the natural clouds for same diameter Application of Optical Methods for Icing Wind Tunnel Cloud SimulationExtension to Supercooled Large Droplets range. Setting the water pressure to Pw=60 bar(green curve in the figure 24), both the MVD and LWCincrease and even if an improvement on the largediameter range (125 pm to 470 pm) can be found witha good overlap with the ZL_In threshold, it can beseen a crossing at 44 pm where the CMD goes belowthe ZL_Out curve as droplet diameter decreases. Several other cases have been analyzed and entail tothe same conclusion: the simultaneously activationof two different nozzle setups generate CMD enoughsimilar to the ZL_In for MVD<40 um. As the MVDincreases, both LWC and CMD become outsidesfrom the reference ZL conditions. Figure 24 suggeststhat the best CMD behavior could be obtained bythe simultaneous generation of both Pw=0.6 bar andPw=0.2 bar conditions. Unfortunately for the higherwater pressure case, 1.57 g/mof liquid water is toomuch outside of the correspondent ZL values andthe reduction of the active spray nozzles to a numberbelow the 168 (around 70 to obtain 0.4 gm3for thesame conditions), certainly will affect on the clouduniformity and coverage area in the test section. Concurrent generation of two sprayconditions A new methodology for cloud generation has beendefined and foreseen the simultaneously use oftwo different couples of the spray bar air and waterpressures. As above case, both spray nozzle setupshave been used which patterns foresee 274 of activenozzle (figure 22) with 2.7 of nozzle setups ratio inconsideration of LWC reduction target. As illustrated during the spray chamber tests, togenerate the high MVD and low LWC within thefreezing drizzle conditions, low water pressure has tobe considered. For this reason two single referenceconditions have been selected that represent thehigh and low MVD in this analysis. The air and waterpressure for the first condition was set to 0.3 bar and0.1 bar respectively that provides 69 pm of MVD atliquid water equal to 0.78 g/m. The second conditionfor the smaller MVD (25 pm) was determined at 0.9bar and 0.3 bar of air and water pressures supply. Forthis last single condition the LWC achieved was 0.18g/m3. Figure 25 shows both mass spectra and CMD. It is important to see that the maximum measureddiameter (Dmax) for the 0.1 bar of Pw (blue curve)achieve 648 pm that is very close to the maximummeasurable diameter for the ADA 100F/LR (ADA largerange). In this case the mass concentration reportedin the same plot (see the right vertical axes), showsthe data roll-off at 205 pm. At this diameter cumulativevolume fraction changes its gradient and crossesthe ZL-0ut CMD at 277 pm. The irregular behaviorof CMD after this diameter is explained by massconcentration scattering. This result can be justifiedby the hypothesis that phase Doppler threshold (ref.17) has been achieved in this condition for possiblelarge droplet deformation due to the presence of theairflow acceleration in correspondence of the windtunnel contraction section. To improve the massconcentration for all the diameters below 58 pm, boththe after mentioned conditions were simultaneouslygenerated with the spray bar system. In particular,for the bars with the even number from 6 to 16 the airand water pressure were set respectively at 0.3 barand 0.1 bar. For all the odd bars numberfrom 5 to 15air and water pressures were set to 0.9 bar and 0.3bar. The result of this setup is showed in the samefigure 25 with the red curve. It is now evident thatthe CMD change its gradient at 99% of cumulativemass and all the behavior is well defined within the ZLenvelope. The MVD was reduced from 69 um to 40 pmand the LWC lowered to 0.24 g/m well within the ZLrequirement (figure 2a). Last condition that will be analyzed is referred tothe comparison with ZR envelope when this spraymethodology is adopted. The setup was defined toestablish which the maximum achievable MVD is tocompare with ZR envelope. From laboratory testsit was verified that to produce the higher MVD thewater pressure shall be higher than the air pressure(AP=Pa-Pw<0). For these reasons the two coupleof pressures that have been considered are: airpressure at 0.3 bar and water pressure at 0.6 bar forthe condition that generate higher MVD (285.6 pm);air pressure at 1.4 bar and water pressure at 0.6 barfor the second condition that generate lower MVD (69pm). Both these conditions were generated in singlerun with 168 active spray nozzles with 1.1 of nozzlesetup ratio (figure 26). The concurrent generation of Application of Optical Methods for Icing Wind Tunnel Cloud SimulationExtension to Supercooled Large Droplets both the conditions has been performed reducing thenumber of active spray nozzles to 132 due to the highLWC achieved for each single condition. The nozzlesetup ratio was held to 1.9 and the spray bar was setup with even bar number (from 5 to 15) to generatesmaller MVD (69 um) and the odd bar number (form6 to 16) to generate larger MVD (285.6 pm). The CMDfor this condition (red curve in figure 26) showsan improvement for the largest part of the spectraanticipating the crossing with ZR-0ut from 180 pm to140 pm changing the curve gradient at 185 pm beforethe concentration roll-off that occurs at 235 um asshowed by the mass concentration behavior. Conclusions Laboratory data collected from both CIRA andSpraying Systems Co. experiments, have been used todevelop a new spray generation methodology to applyin the icing wind tunnel to develop characteristicdrop spectra foreseen by the extension of FAR Part 25Appendix 0. Different ratios between two nozzlesetups (2.7, 1.9 and 1.1) have been used to generatebimodal distribution which attribute was found withinthe two ZL and ZR envelopes.Analysis of wind tunneldata has led to the following conclusions: 1) The SUJ12 setup provides too high liquid watercontent when operated with AP<0 attenuatingthe effect of the attempted bimodal nature in thespray cloud when used conjointly to the selectedSUJ12A055 nozzle setup. 2) The selected SUJ12A055 spray nozzle setupprovides liquid water content lower than 60%-70% of the standard SUJ12 setup. However,this nozzle setup generates large MVDs at sameSUJ12 operating conditions that are useful forboth ZL and ZR wind tunnel cloud simulation.General improvements could be achievedreplacing the SUJ12 with another new nozzlesetup to use with the selected SUJ12A055. Thissetups should improve much more the capabilityto generate a smaller MVD and LWC at sameoperating pressures with bi-modal droplet spectradistribution. 3) The new spray generation methodology providesa flexible criterion to operate with the spray barin order to simulate the bimodal mass spectradistribution with cumulative mass ranging withinthe ZL and ZR envelopes. 4) Further investigation shall be performed to betteraddress both MVD and LWC distribution andcoverage in the test section. This assessmentis necessary to better understand how the lownumber of active spray nozzles affects the clouduniformity in the test section also in considerationof the reduced SUJ12A055 spray angle anddiameter found with LSI laboratory measurements. 5) An important instrumentation issues have tobe also considered due to the lack of massconcentration information after data roll-off thatoccurs at diameter> 200 pm. New assessment hasto be performed using the 0AP-2DG gray-scaleand/or SPEC 2DS probes in order to collect 2Ddroplet image to combine with the ADA data (ref.18). Image spectrometers will provide a betterevaluation on the cloud generation methodologyreducing the measurement uncertainty to betteraddress the bimodal attribute on the simulatedcloud (e.g. the CDM gradient change at 185 pmin the figure 26). The uncertainty on the LWCmeasurements shall be also resolved due tothe lack of absolute reference system for LWCmeasurement in SLD conditions. Acknowledgements Funding for this research was provided by the ItalianGovernment by means of ACADEMIA project andPRO.R.A. program. The authors thank J. W. Strappand S. G. Cober from Science and Technology Branchof Environment Canada, for their helpful commentsand to provide on 2006 the SLD requirement usedas reference during the course of this project andpost-project analysis and acknowledge A. Ragni forhis significant contributions in planning the CIRA IWTactivities. Application of Optical Methods for Icing Wind Tunnel Cloud SimulationExtension to Supercooled Large Droplets 1.Aircraft Accident Report In-flight Icing Encounter and Loss of Control Simmons Airlines, d.b.a. AmericanEagles Flight 4184 Avions de Transport Regional (ATR) Model 72-212, N401AM Roselawn, Indiana October31,1994", National Transportation Safety Board, Volume 1: Safety Board Report PB96-91040I NTSB/AAR-96/01DCA95MA001, Washington,D.C. 1996. 2. "Terms of Reference for Aviation Rulemaking Advisory Committee Ice Protection Harmonization Working Group"U. S. Federal Register, December 8, 1997, Volume 62, Number 235; pgs. 64621 -64623. 3. Miller, D., T. Ratvasky, B. Bernstein, F. McDonough, and J.W. Strapp, 1998:"NASA/FAA/NCAR SupercooledLarge DropletIcing Flight Research: Summary of Winter 96-97 Flight Operations". AIAA 36th Aerospace Sci.Meeting and Exhibit, Reno,Nevada,AIAA Paper 98-0577. 4. Stewart G. Cober, George A. Isaac, and J. Walter Strapp,"Characterizations of Aircraft Icing Environments thatInclude Supercooled Large Drops". Journal of Applied Meteorology, November 2001, vol. 40, pp 1984-2002. 5. 3 Cober, S. G, Isac, G. A., Shah,A. D., Jeck, R.,"Defining Characteristic Cloud Drop Spectra from in-SituMeasurements",AIAA 41st Aerospace Sci. Meeting and Exhibit,Reno,Nevada, AIAA Paper 2003-0561. 6. 4 F. De Gregorio, B. Esposito, G. Mingione, A. Vicini, "Experimental and Computational AerodynamicsApplications for an Icing Wind Tunnel Design", AGARD fluid dynamics panel symposium on"Aerodynamic ofWind Tunnel Circuits and their Components", AGARD-CP-585, October 1996 Moscow. 7. 5 Ashenden, R., Lindburg, W., and Marwitz, J., "Airfoil Performance Degradation by Super Cooled Cloud Drizzleand Rain Drop Icing,"Journal of Aircraft, Vol. 33, No.6, Nov.-Dec., 1996,pp.1040-1046. 8. 6 Bade, K.M., Schick, R.J., "Phase Doppler Interferometry Volume Flux Calculation Optimization and Comparisonwith Nominally Point Mechanical Patternation Techniques", ICLASS Intl. 2009, Vail, CO, July 2009. 9. 7 Bachalo, W.D. and Houser, M.J., "Phase Doppler Spray Analyzer for Simultaneous Measurements of Drop Sizeand Velocity Distributions," Optical Engineering, Volume 23, Number 5, September-October, 1984. 10. 8 Bachalo, W.D. and Houser, M.J., “Spray Drop Size and Velocity Measurements Using the Phase/DopplerParticle Analyzer", Proceedings of the ICLASS (3rd Intl.), July 1985. 11. 9"LDV/PDPA System: Model FSA3500/4000 Signal Processor Model PDM1000 Photo Detector Module", TSIInstruction Manual, July,2001. 12. Knollenberg, R. G., 1970,"The Optical Array: An Alternative to Scattering and Extinction for Airborne ParticleSizing Determination", J.Appl. Meteor., 9, 86-103. 13.5.10 Korolev, A. V., J. W. Strapp, and G. A. Isaac, 1998: "Evaluation of Accuracy of PMS Optical Array Probes".J. Atmos. Oceanic Technol., 15,708-720. 14. 11 Esposito, B. M.,"Validation and Calibration of CIRA-SBS Upgrade to SLD cloud simulation: Test Plan", ACAD-0032/CIRA-CF-08-0648, Capua, June 2008. 15.12 Bragg, M. B., "A Similaity Analysis of the Droplet Trajectory Equation", AIAAA Journal Vol. 20, No. 12, Dec.,1982, pp.1681-1686. 160..13 Smolik, J., Dzumbova,L., Schwarz, J.,Kulmala, M.,"Evaporation of Ventilated Water Droplet: ConnectionBetween Heat and Mass Transfer", Journal of Aerosol Science Vol. 32 (2001) pp. 739-748. 17.14 Alexander, D.R., Wiles, K.J., Seeman, M., and Schuab, S.A., "Effects of Non-Spherical Drops on a PhaseDoppler Analyzer, Paper No. 57308, in Proceedings, Conference on Particle Sizing and Spray Analysis, Society ofPhoto-Optical Engineers, San Diego, 1985. 18. Strapp,J.W., Oldenburg, J., Ide, R., Lilie, L., Bacic, S., Vucovic, Z.,Olesckiw, M., Miller, D., Emery, E., and Leone,G., 2003:“Wind Tunnel Measurements of the Response of Hot-Wire Liquid Water Content Instruments to LargeDroplets". J. Atmos.Oceanic Technol., 20,791-806. Application of Optical Methods for Icing Wind Tunnel Cloud SimulationExtension to Supercooled Large Droplets Diameter (8m) Figure 1. Freezing drizzle and freezing rain envelopes. Figures showing the range of drop sizes that can span in two ordersof magnitude (ZL In for MVD<40 um and ZL Out for MVD>40 um) with bi-modal characteristics. Same for freezing rain. Figure 2a. Proposed 14 CFR 25, Appendix O,Freezing Drizzle,Liquid Water Content Figure 2b. Proposed 14 CFR 25,Appendix O, Freezing Rain,Liquid Water Content Figure 3. CIRA-IWT spray bar envelope versus the FAR Part 25 App. Crequirement, in the main test section configuration at 80 m/s ( Spray Analysis and Research Services A S ervice of Spraying Systems Co. ) Application of Optical Methods for Icing Wind Tunnel Cloud SimulationExtension to Supercooled Large Droplets ZR_Out Figure 4. Actual CIRA-IWT performance to generate large droplet clouds Figure 6. CIRA IWT spray bar system Figure 5. CIRA icing tunnel aerodynamic layout Application of Optical Methods for Icing Wind Tunnel Cloud SimulationExtension to Supercooled Large Droplets Figure 7a. Assembled Nozzle (D41749+SUJ12) Figure 7b. Disassembled Nozzle and Parts Figure 7c. Prototype Nozzle tip Figure 8. Measurement Locations in the x and z directions(at y=150mm) Figure 9. PDPA mounted with wind tunnel 1.5m Plane Figure 10. Wind tunnel coordinate system Figure 11. Spray chamber with 3d traversingsystem for spray plume characterization Figure 12. CIRA Airborne Droplet Analyzer Measurement System. Figure 13. The Optical Array Probe (OAP). Application of Optical Methods for Icing Wind Tunnel Cloud SimulationExtension to Supercooled Large Droplets Figure 14. ADA system layout in the spray chamber. The spray nozzle is mounted in the3D traversing system in order to provide seven measurement points in the spray plume. Figure 15. Wind tunnel experiment lay-out with Laser Induced Fluorescence (LIF) layout Figure 16. Typical LSI comparison achieved at 5.1 m/s and 14.7 m/s. Images shows the water patternation achieved withthe SUJ12 nozzle setup with condition that produces large droplets (AP=-0.3 bar) and small droplets (^P=0.69 bar). Application of Optical Methods for Icing Wind Tunnel Cloud SimulationExtension to Supercooled Large Droplets 一可c>a Figure 17. Variation of spray plume diameter and angle respect to the air pressure and water pressure ratio. Data havebeen extracted from the spray pattern images for all the spray nozzle setups at two airspeed wind tunnel conditions. Figure 18. Volume-weighted mass center of the spray image. Increasing the airspeed, both the centroid distance andangle have been find reduced respect to the case of 5.1 m/s in reason of the higher energy transferred to the droplets Application of Optical Methods for Icing Wind Tunnel Cloud SimulationExtension to Supercooled Large Droplets 50 X(mm) (E-Wo#)aN X(mm) x(mm) Figure 19. Main spray parameter variations along the horizontal plume in the two sections at 150 and at 230 mm from SUJ12nozzle exit at test condition 10. In the two upper plots (19a and 19b) are reported the MVD and the vertical component of dropletvelocity (spray nozzles are oriented perpendicular to the ground). In the two plots below are the LWC compared to the dropletnumber density (19c) and droplet velocity fluctuations compared with the volume flux (19d). 10000 -9000 -8000 7000 6000 5000 4000 N' 3000 2000 -1000 40 x(mm) Figure 20. Comparison between the SUJ12 spray nozzle setup and the candidate nozzle setups. Measurements have been performed at150 mm far from the nozzle exit. Main information outlined from these results is the low LWC achievable with the SUJ12A055 setups. .00 Figure 21. Effect of droplet size on droplet temperature behavior in the test leg of CIRA-IWT for static air temperature -3℃ (a)and -8℃ (b)at same airspeed (77 ms-1) in the MTS, with relative humidity(100%) and initial droplet temperature (20℃). 74 278 20049 Figure 22. SUJ12 and SUJ12A055 nozzles setup patterns in the spray bar module. 8 8 Figure 23. Nozzle setups effect on the cumulative mass fraction at Pa=0.7 bar and Pw=0.4 bar. For bothcases the MVD are very close to reference. ( Spray Analysis and Research Services A S ervice of Spraying Systems Co. ) Application of Optical Methods for Icing Wind Tunnel Cloud SimulationExtension to Supercooled Large Droplets Figure 24. Sensitivity effect of water pressure on droplet mass distribution for three water pressurevalues at constant air pressure. …ZL Out conditions req. (RSF=2,709) SUJ12A055+SUJ12 274-CVF-Pa=0.3-0.9 bar Pw=0.1-0.3 bar SUJ12A055+SUJ12 274:CVF-Pa=0.3 bar Pw=0.1 bar Figure 25. Concurrent generation of two spray conditions for freezing drizzle case (ZL-0ut). Application of Optical Methods for Icing Wind Tunnel Cloud SimulationExtension to Supercooled Large Droplets Figure 26. Concurrent generation of two spray conditions for freezing rain case (ZR-0ut). *Corresponding authorSpraying Systems Co.°_Experts in Spray Technology Spray Analysisand Research ServicesA Service of Spraying Systems Co.www.sprayconsultants.com The icing wind tunnel (IWT) is one of most important means of compliance testing, providing controlled and repeatable simulations of aircraft in-flight icing encounters for a variety of evaluations and studies. In addition to conventional aerodynamic wind tunnel components, IWT’s must have refrigeration systems with heat exchangers (HXs) to cool the air to controlled temperatures below freezing. These facilities also require a system for spraying nebulised water (Spray Bar System, SBS) into the airstream. A further requirement is careful control of both drop size and concentration to generate an icing cloud in the test chamber. Taking into account the two-phase flow, the aerodynamic line of the icing wind tunnel testleg is designed to function as a means for producing the desired droplet thermo-kinetic behaviour. The requirement is to better simulate a uniform spatial distribution of water droplets together with velocity and temperature values that are as close as possible to the corresponding conditions of the air flow especially, for large droplet size.
确定


还剩23页未读,是否继续阅读?

产品配置单


北京欧兰科技发展有限公司为您提供《结冰风洞中喷雾液滴粒径检测方案(气溶胶检测)》,该方案主要用于航空中喷雾液滴粒径检测,参考标准--,《结冰风洞中喷雾液滴粒径检测方案(气溶胶检测)》用到的仪器有Artium PDI-FP 双量程可机载飞行探头、LaVision SprayMaster 喷雾成像测量系统、LaVision DaVis 智能成像软件平台
推荐专场


相关方案
更多
该厂商其他方案
更多