


方案详情
文
用DEHS发烟机生成示踪粒子。一对1百万像素CMOS相机作成像部件。工作频率16.6KHz。用LaVision的DaVis8.3如件来分析所记录的图像。对结果进行了本征正交分解POD分析。对S-型进气道扰动流场的不稳定性,进行了实验测量和分析。
方案详情

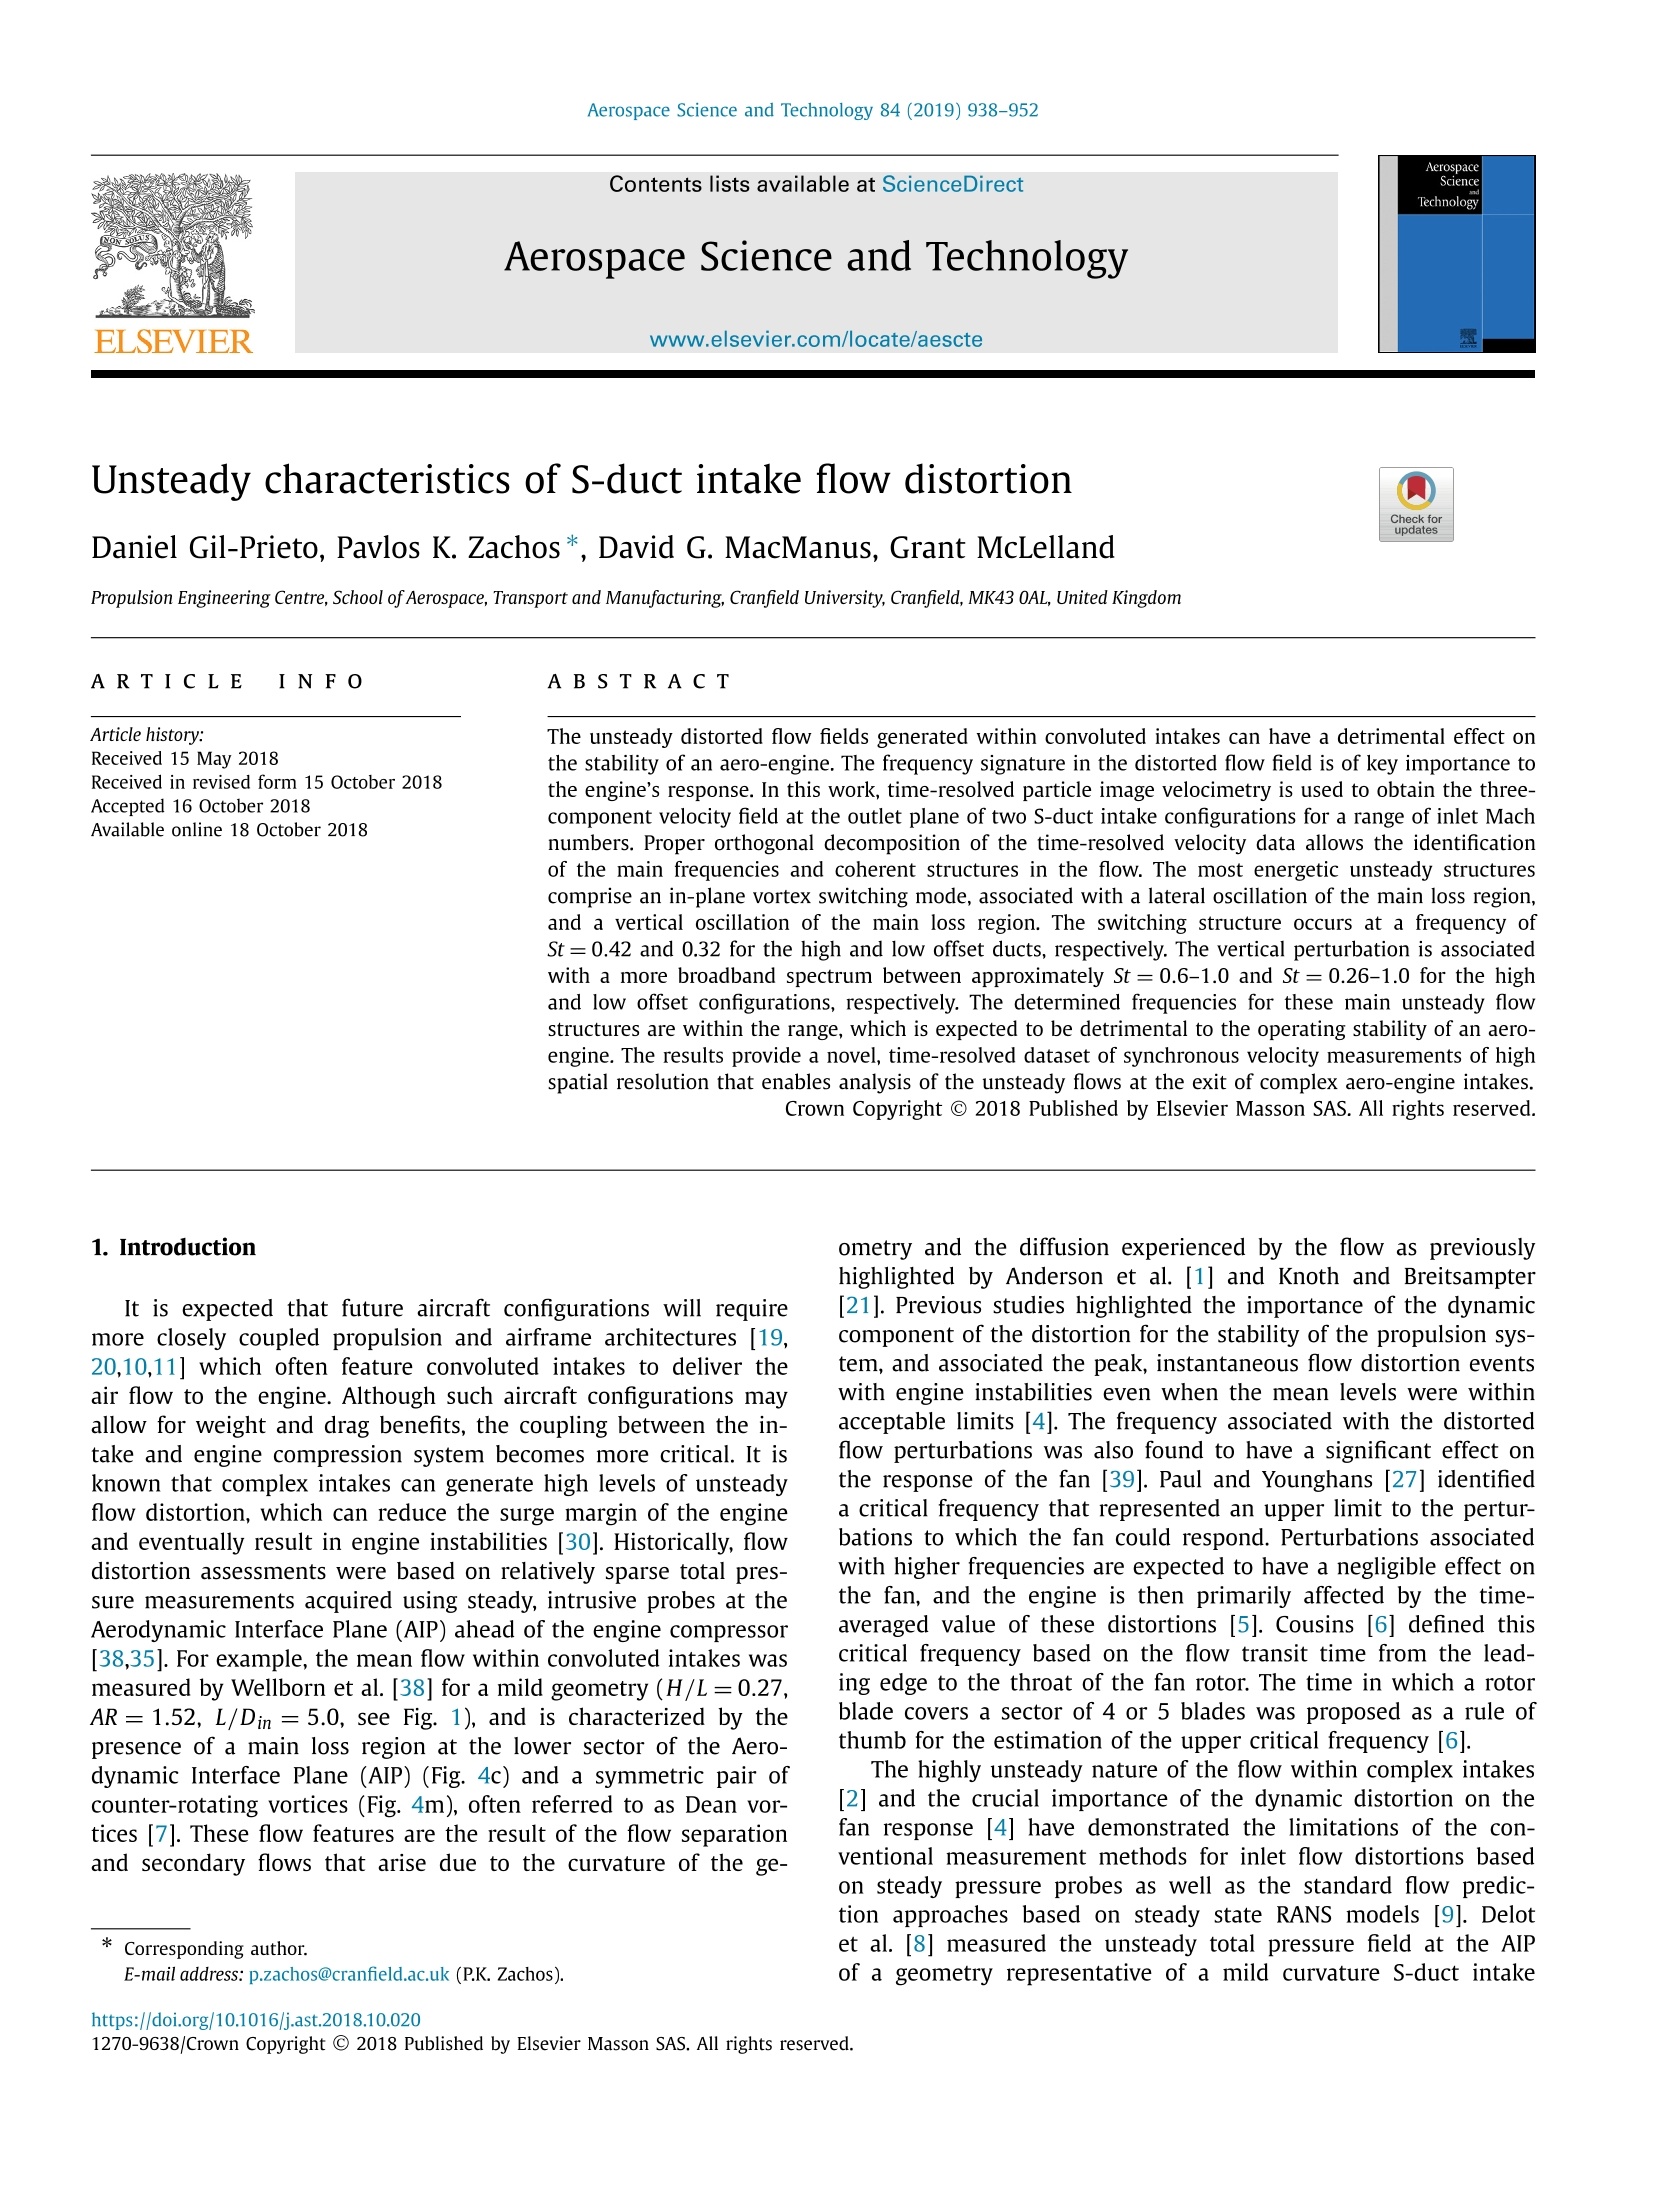
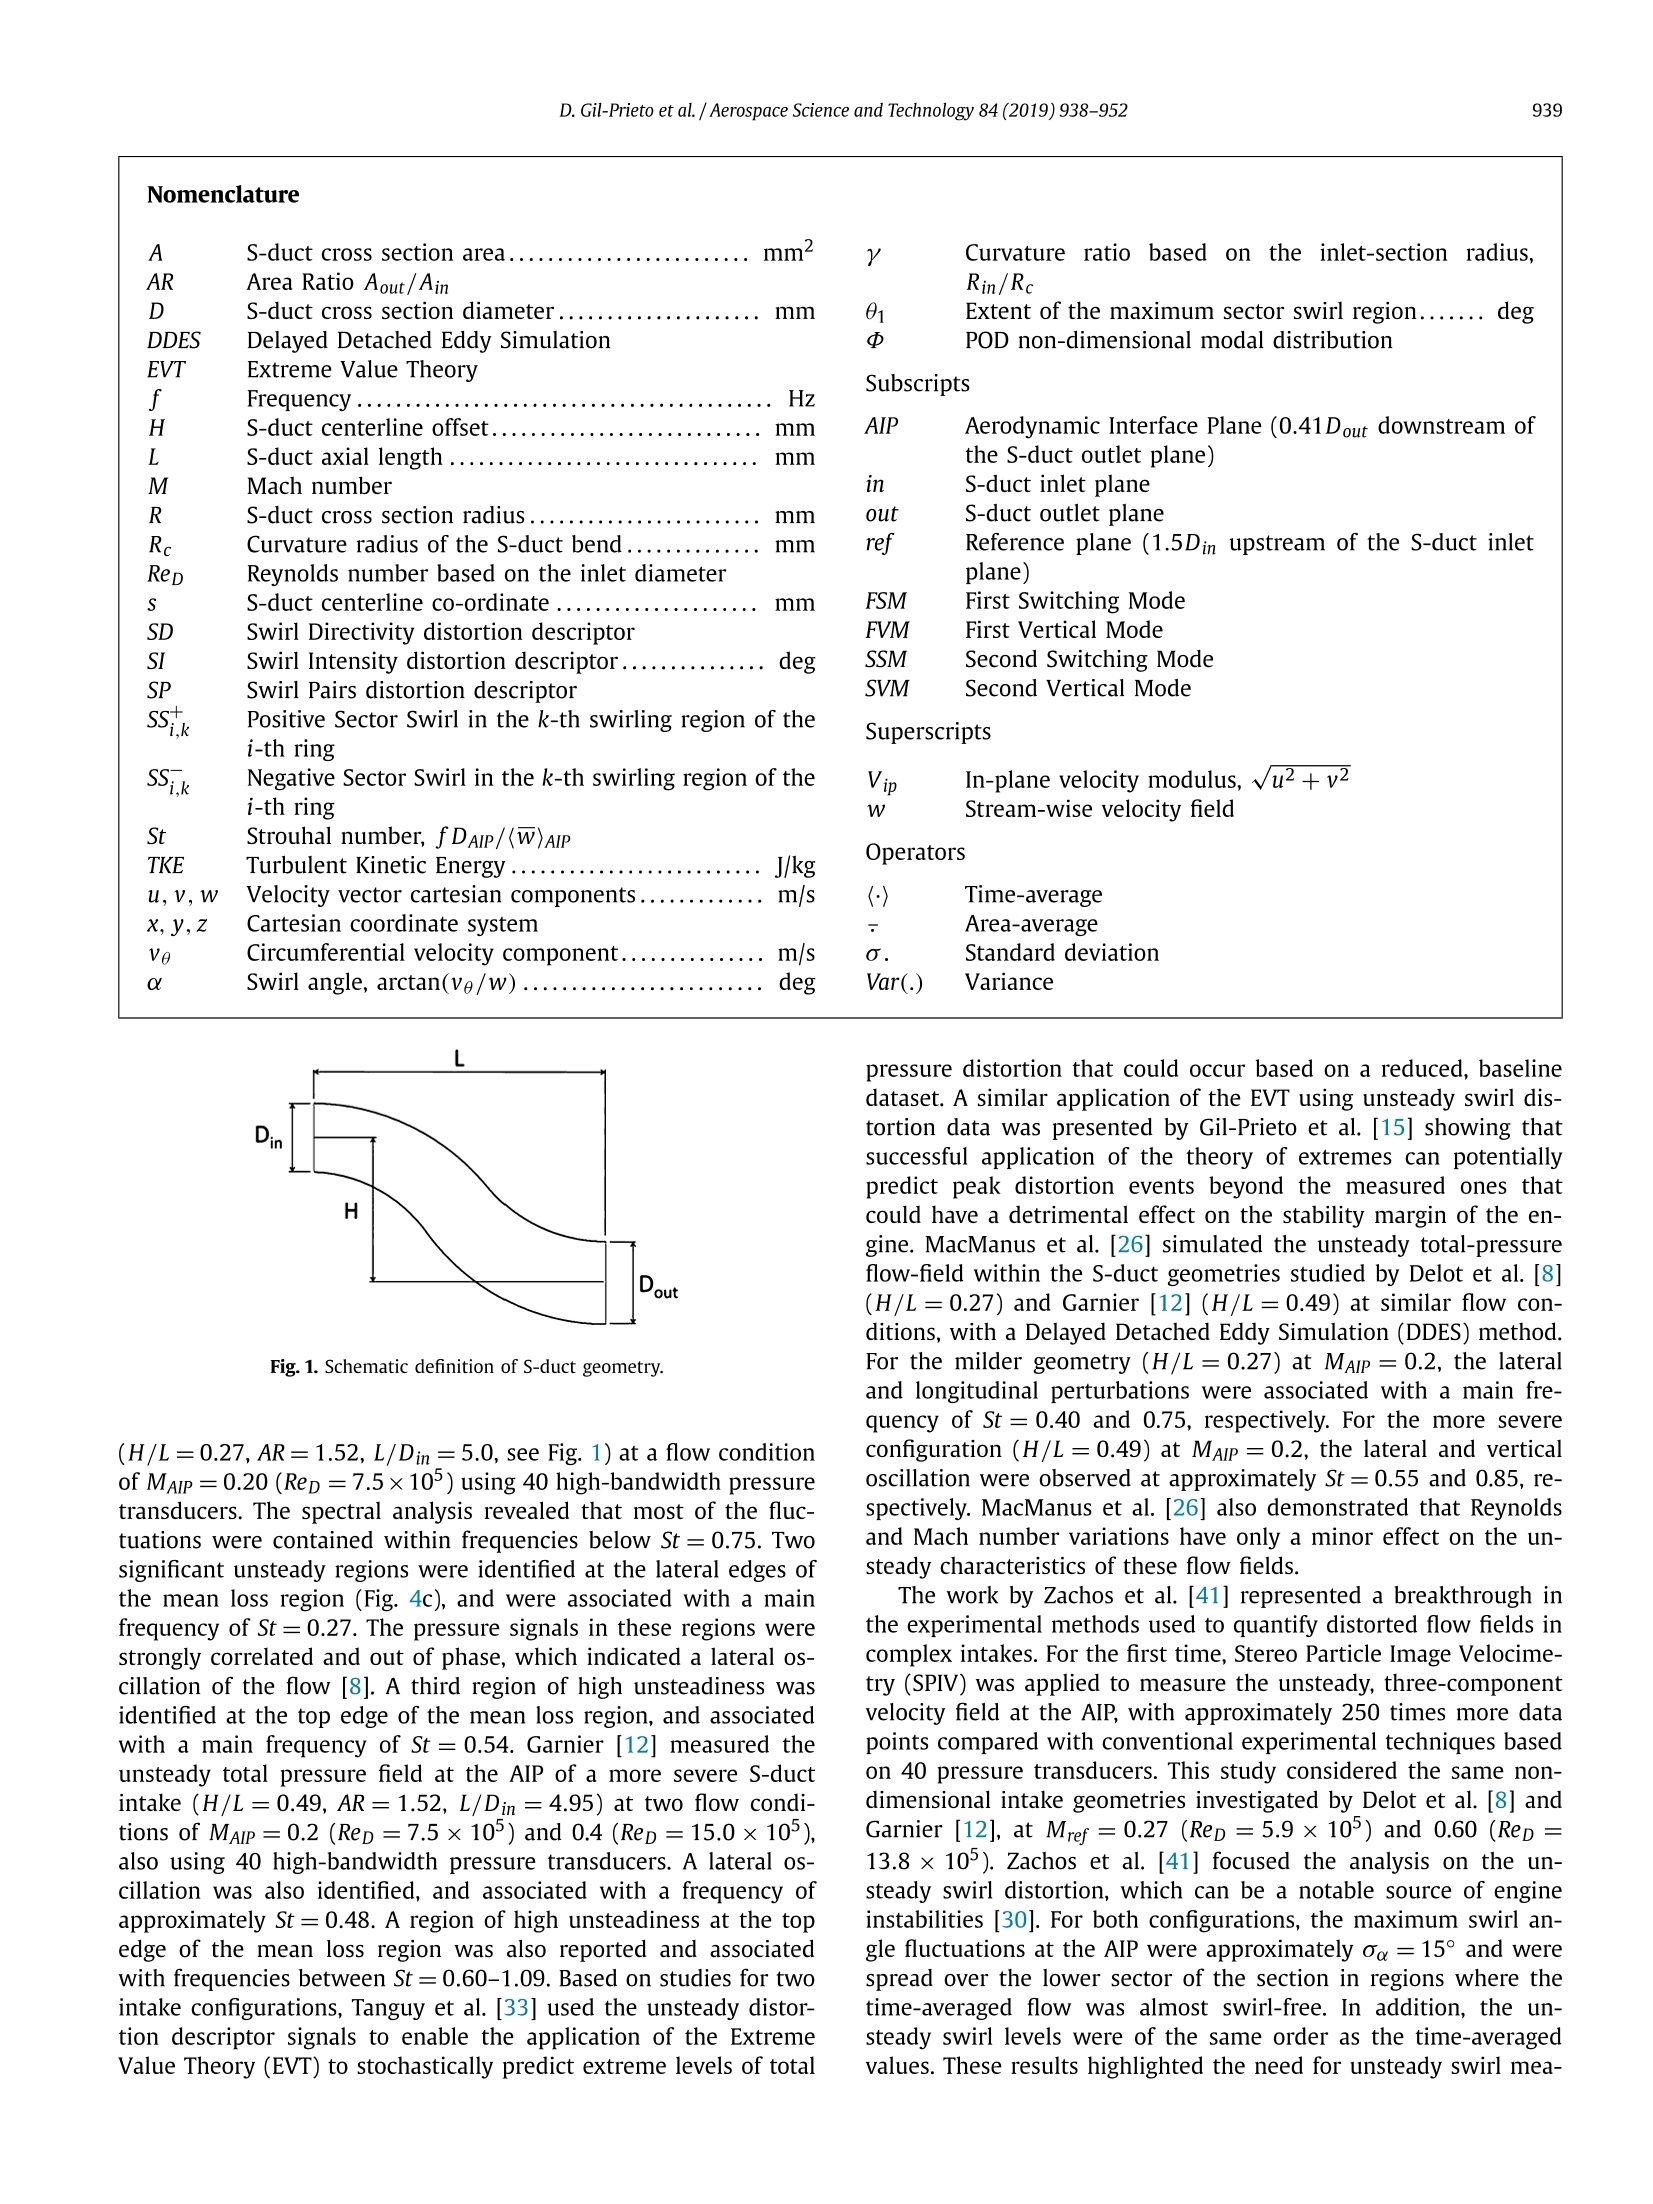
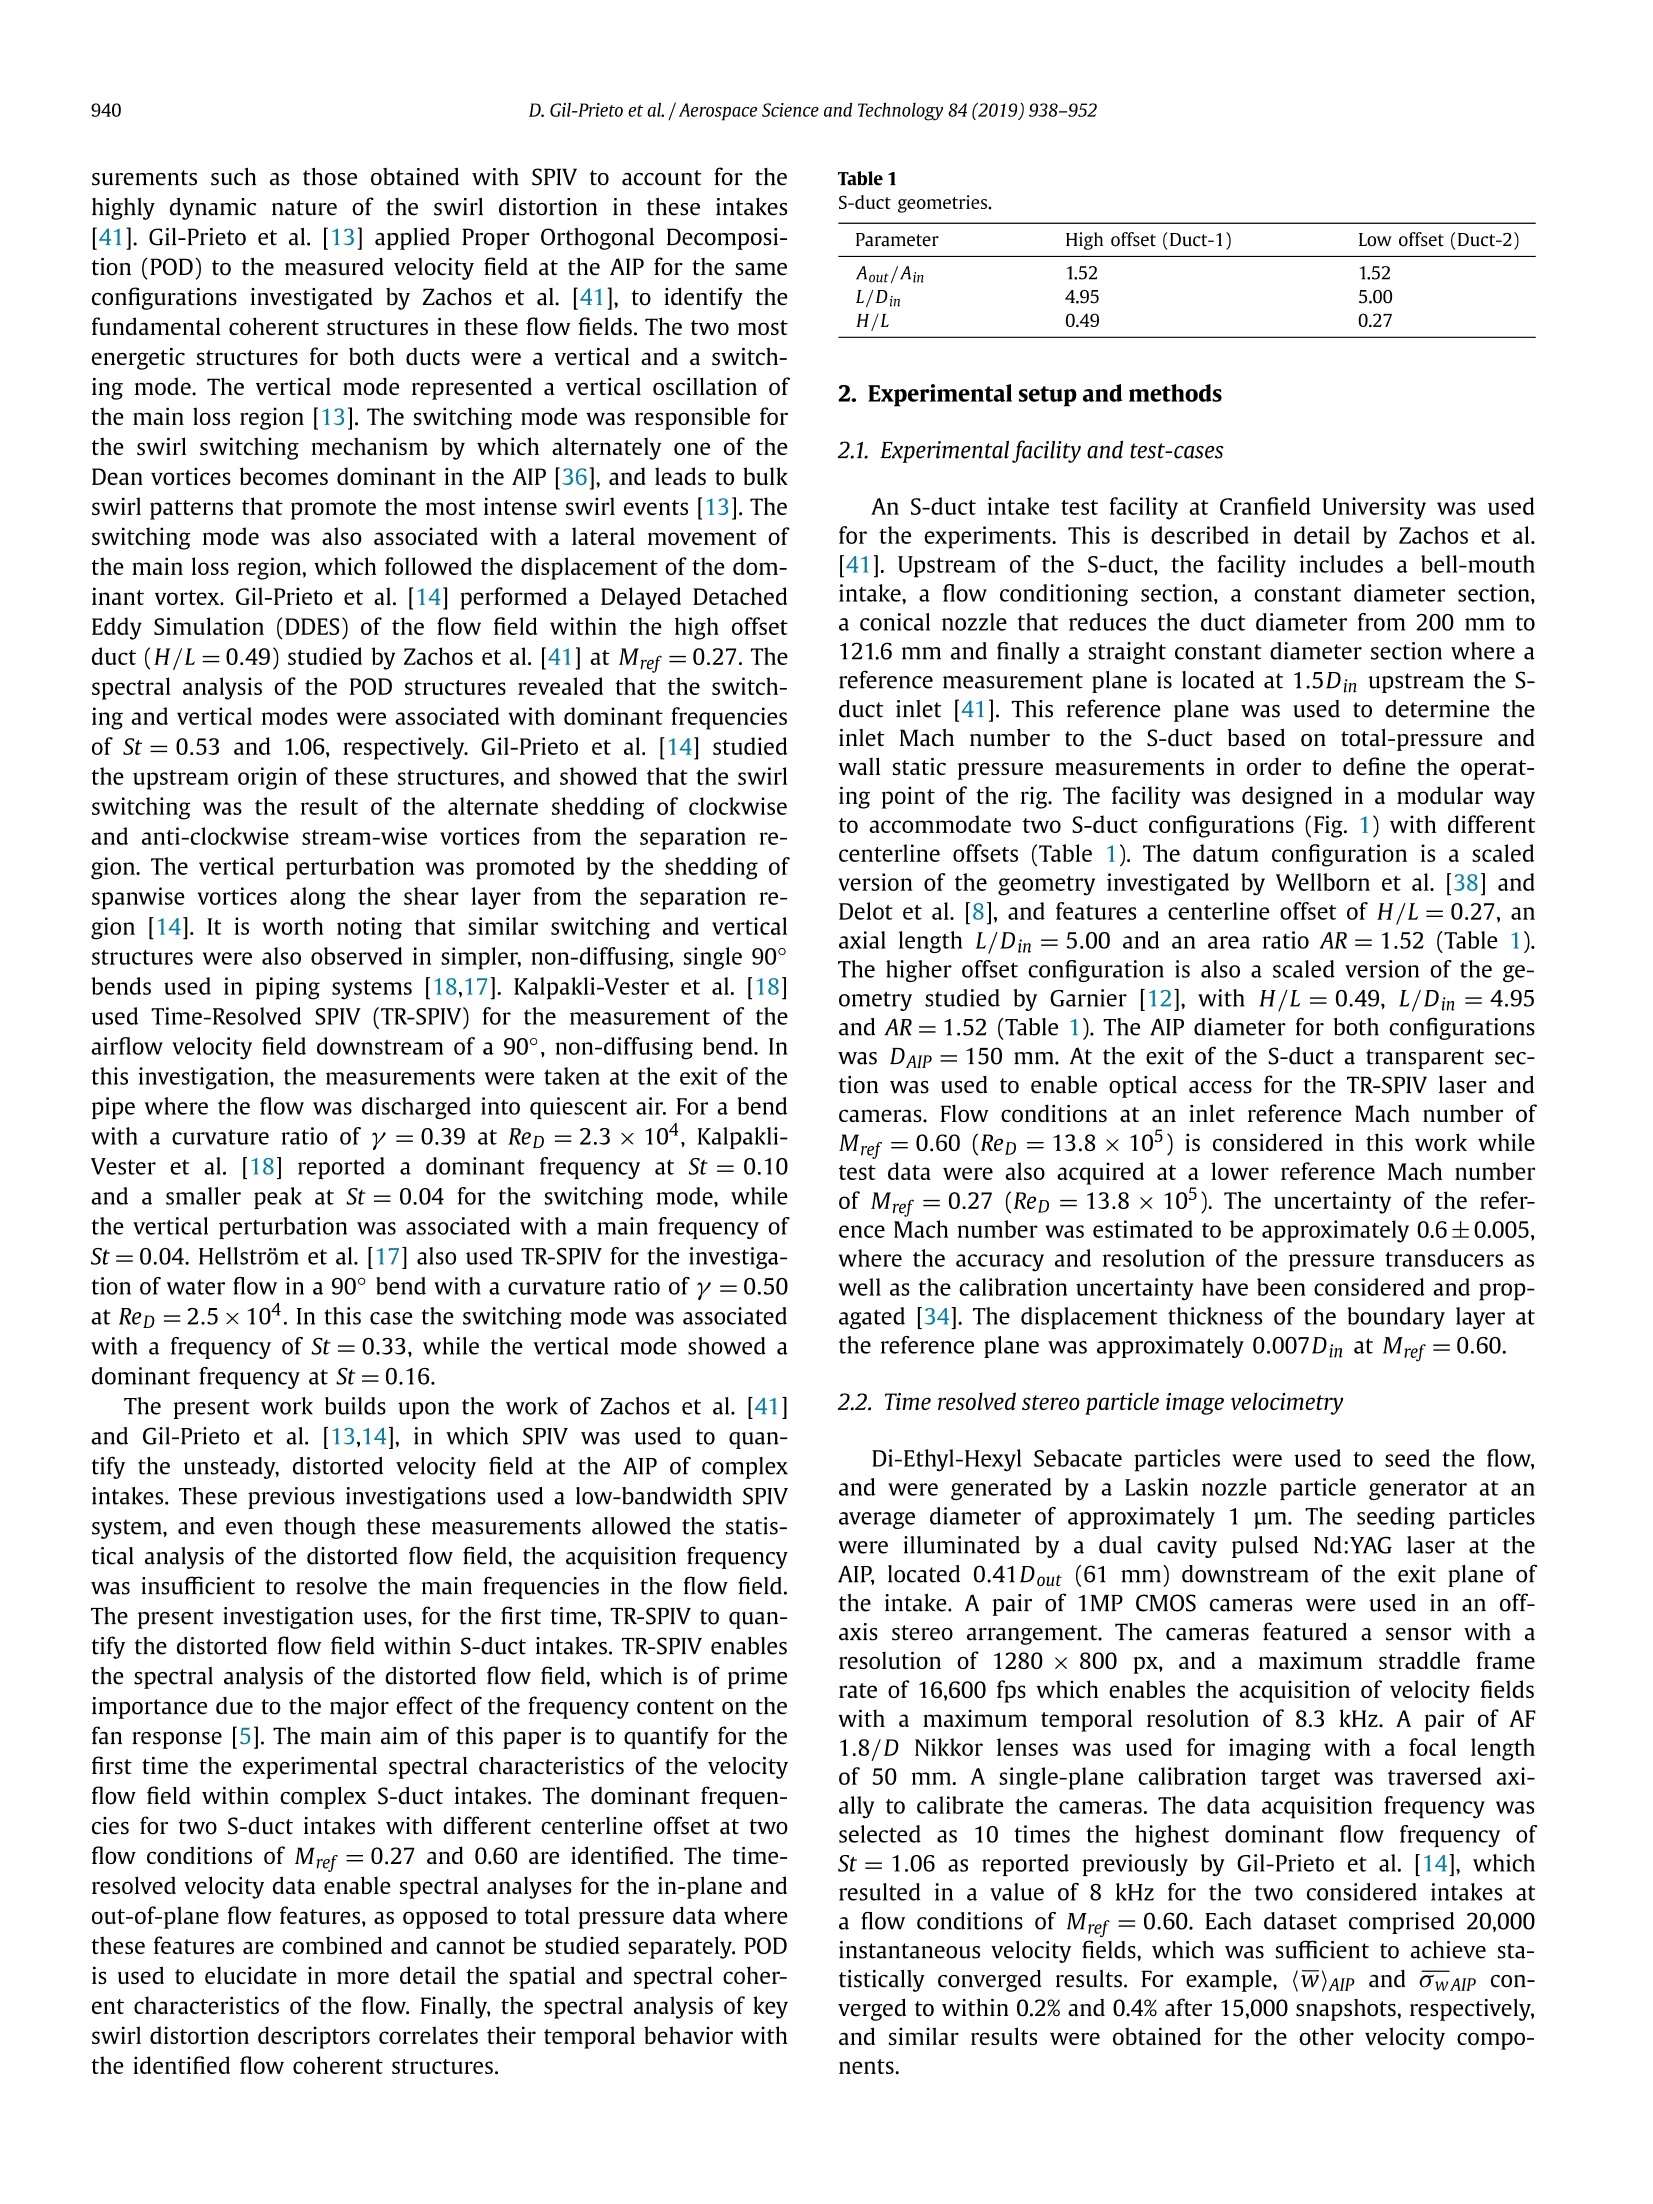
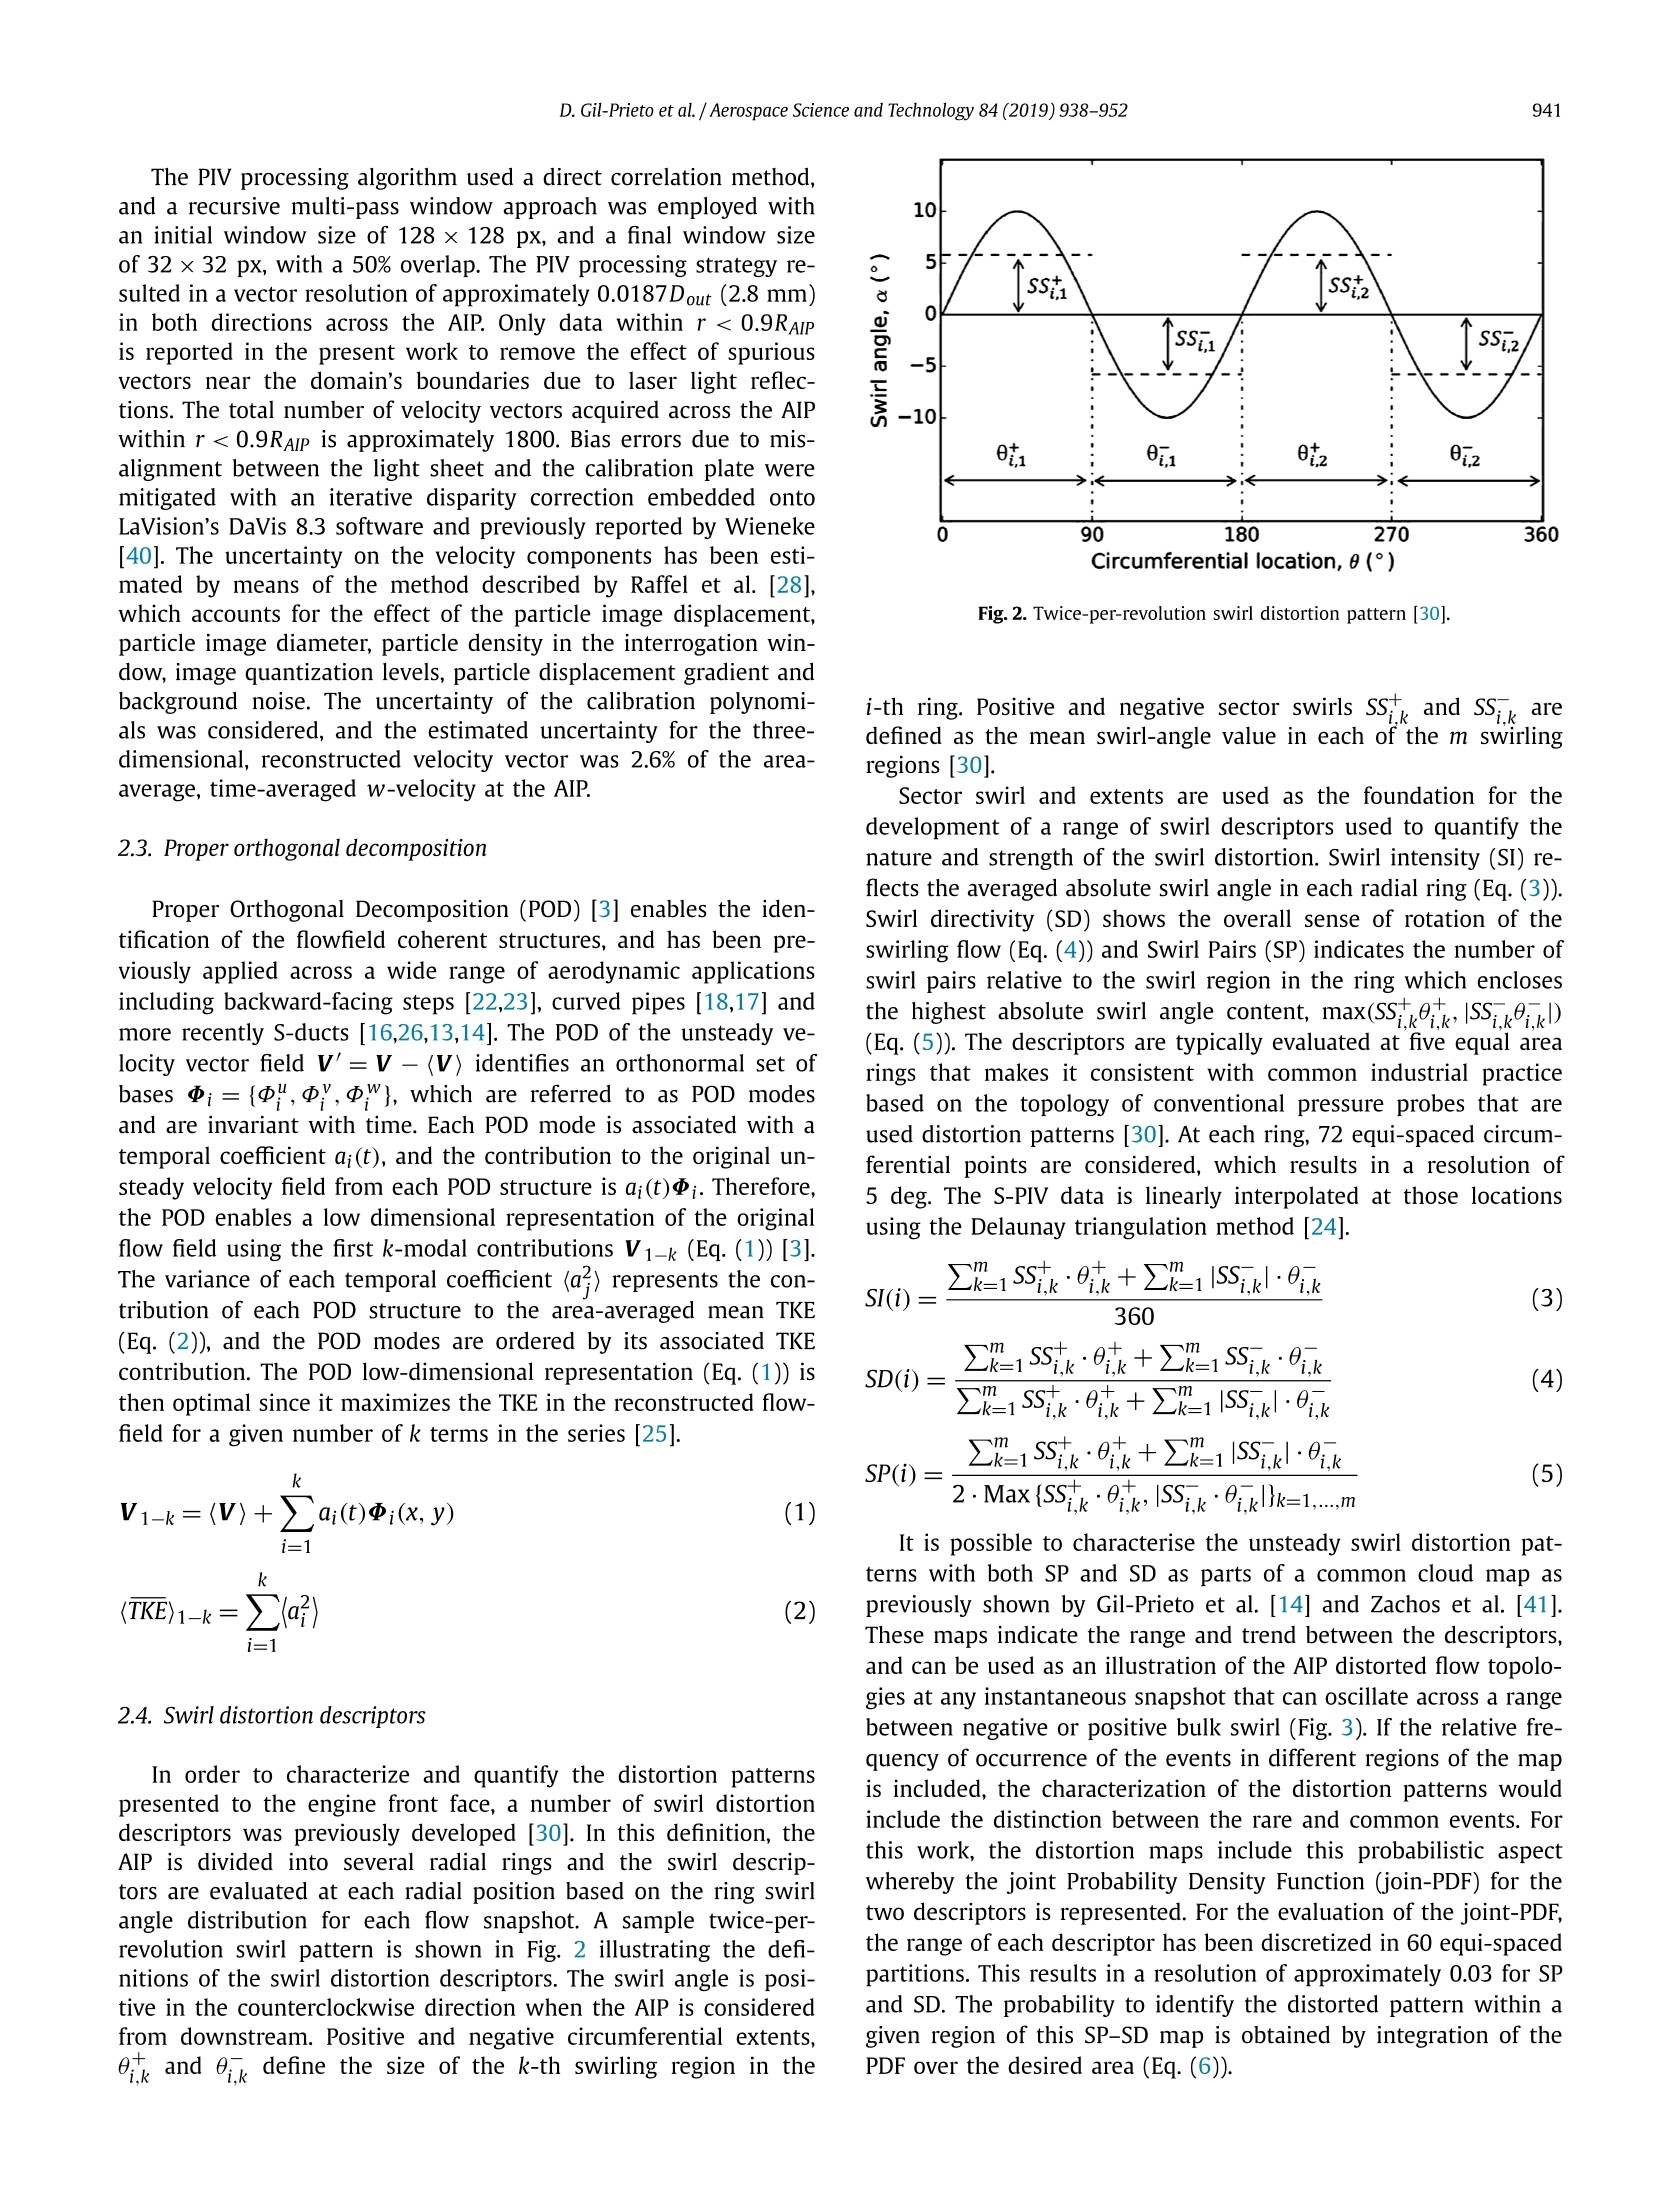
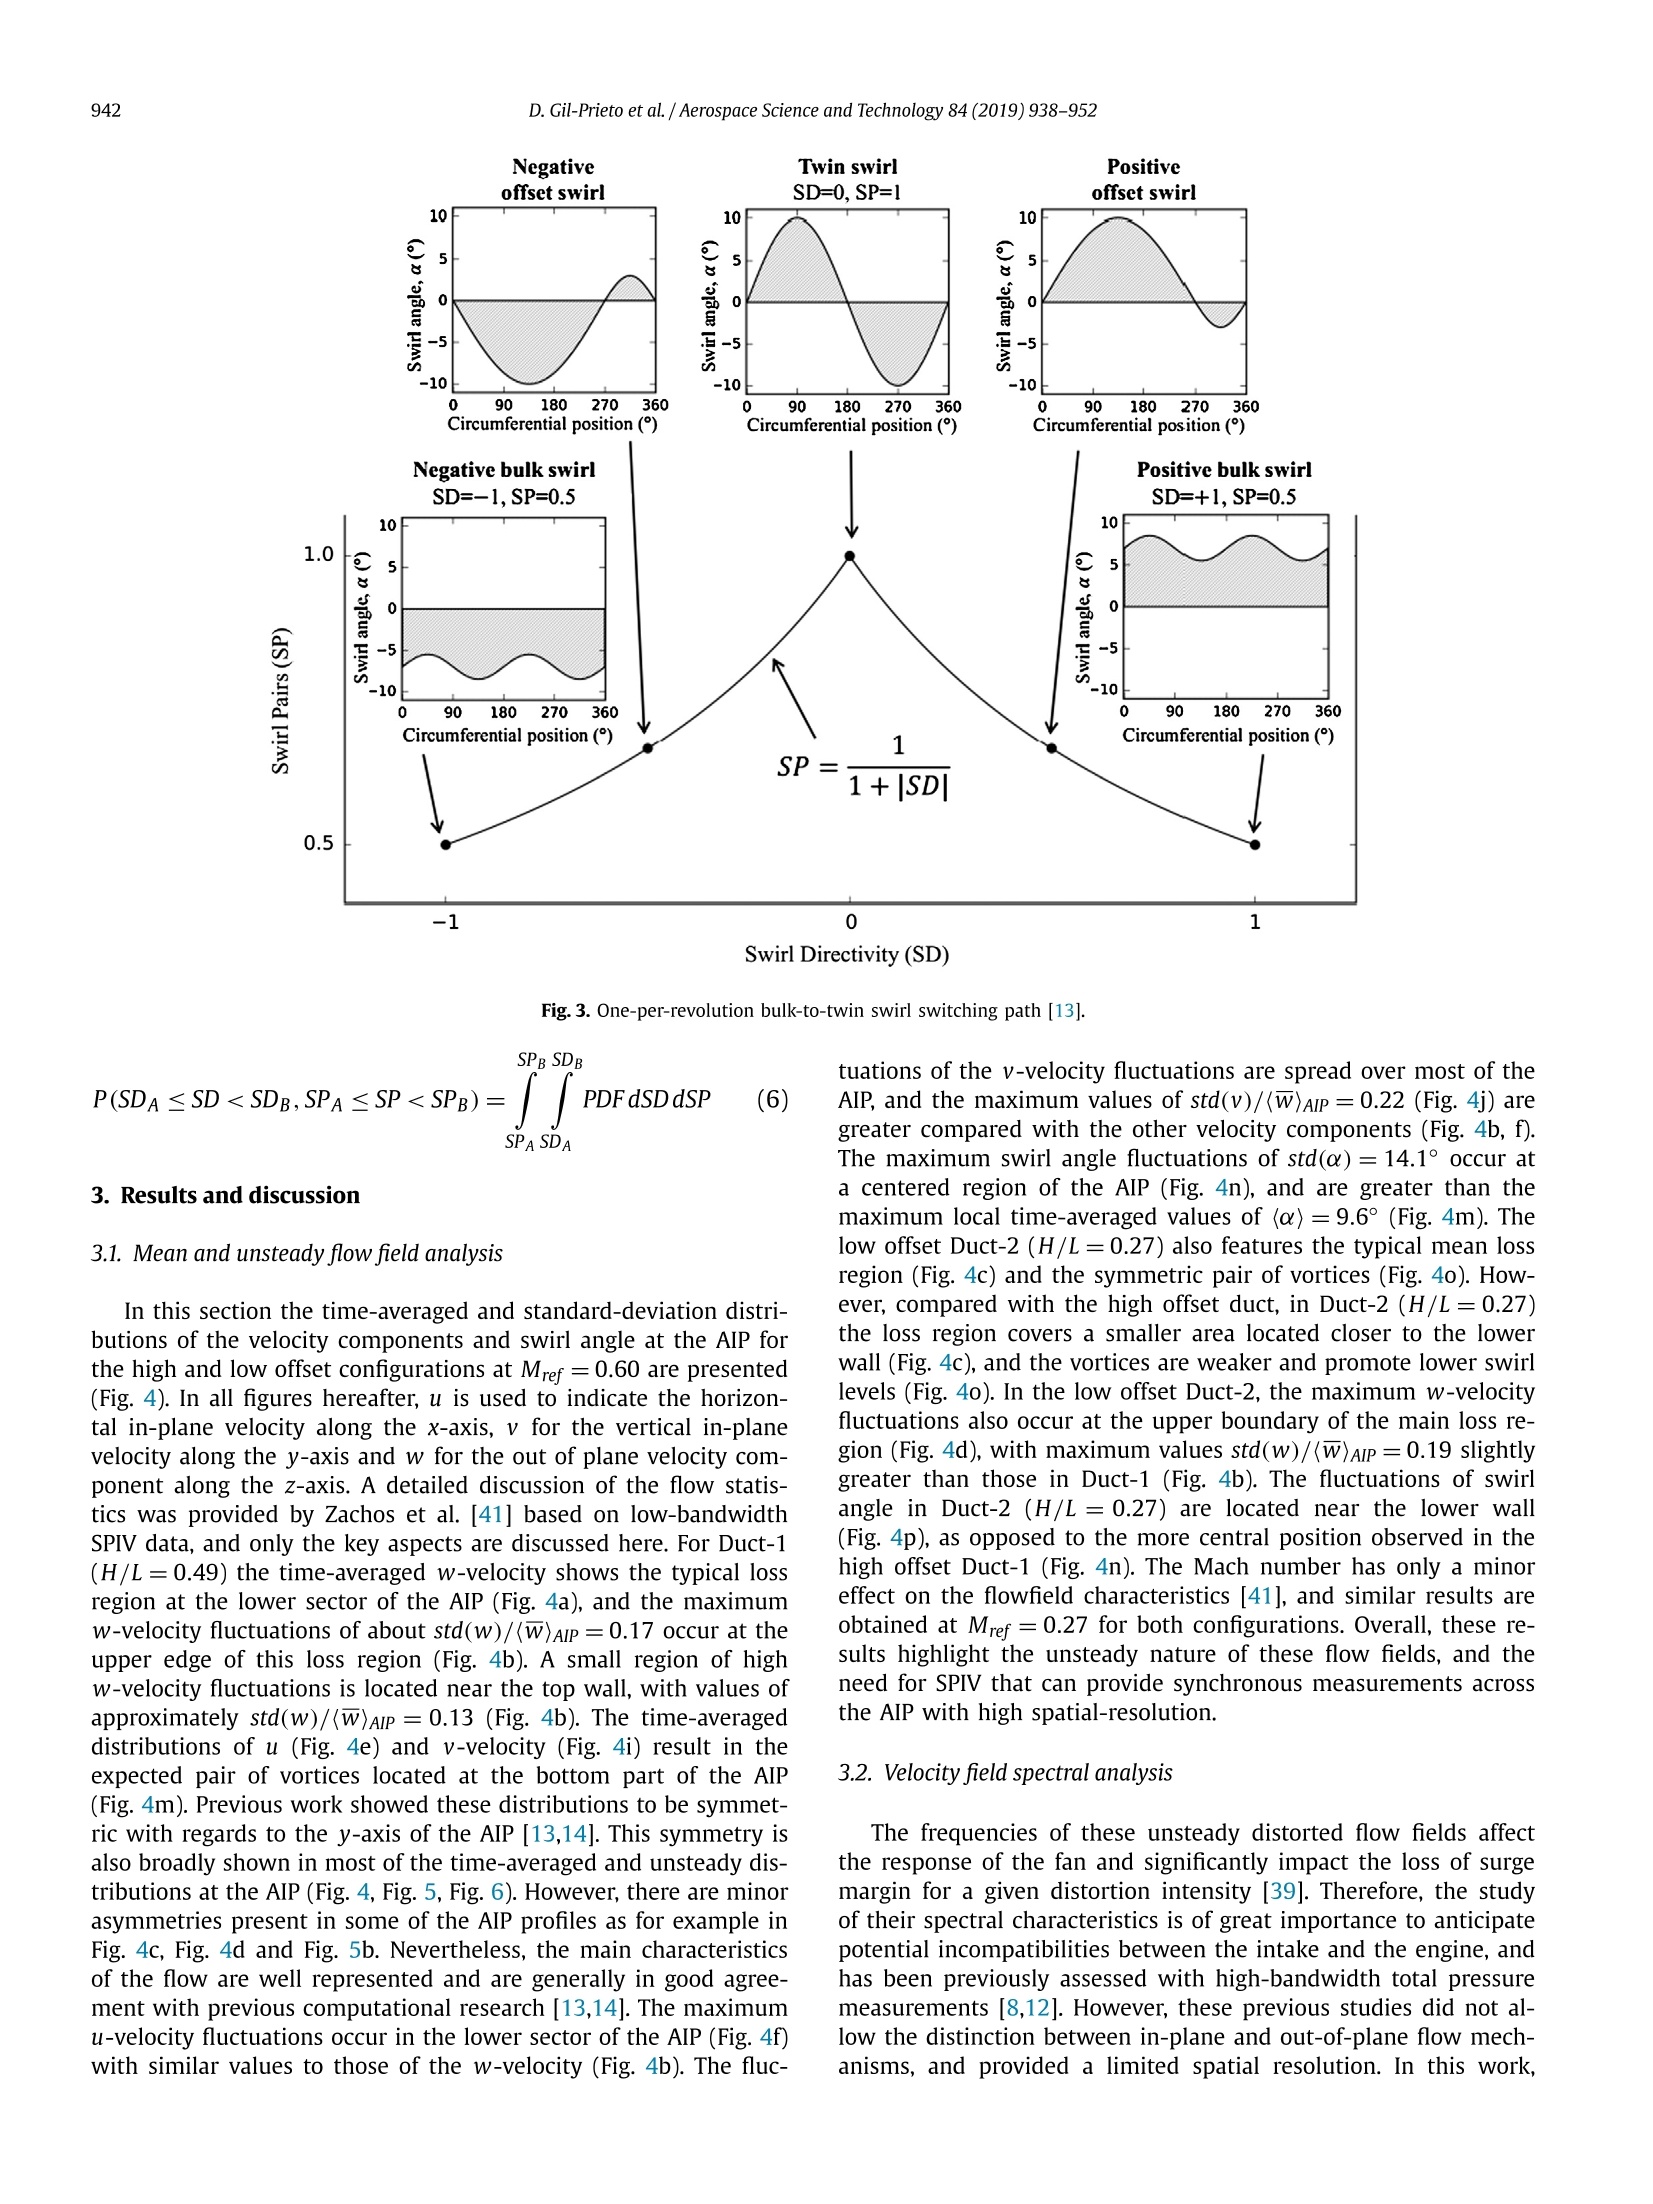
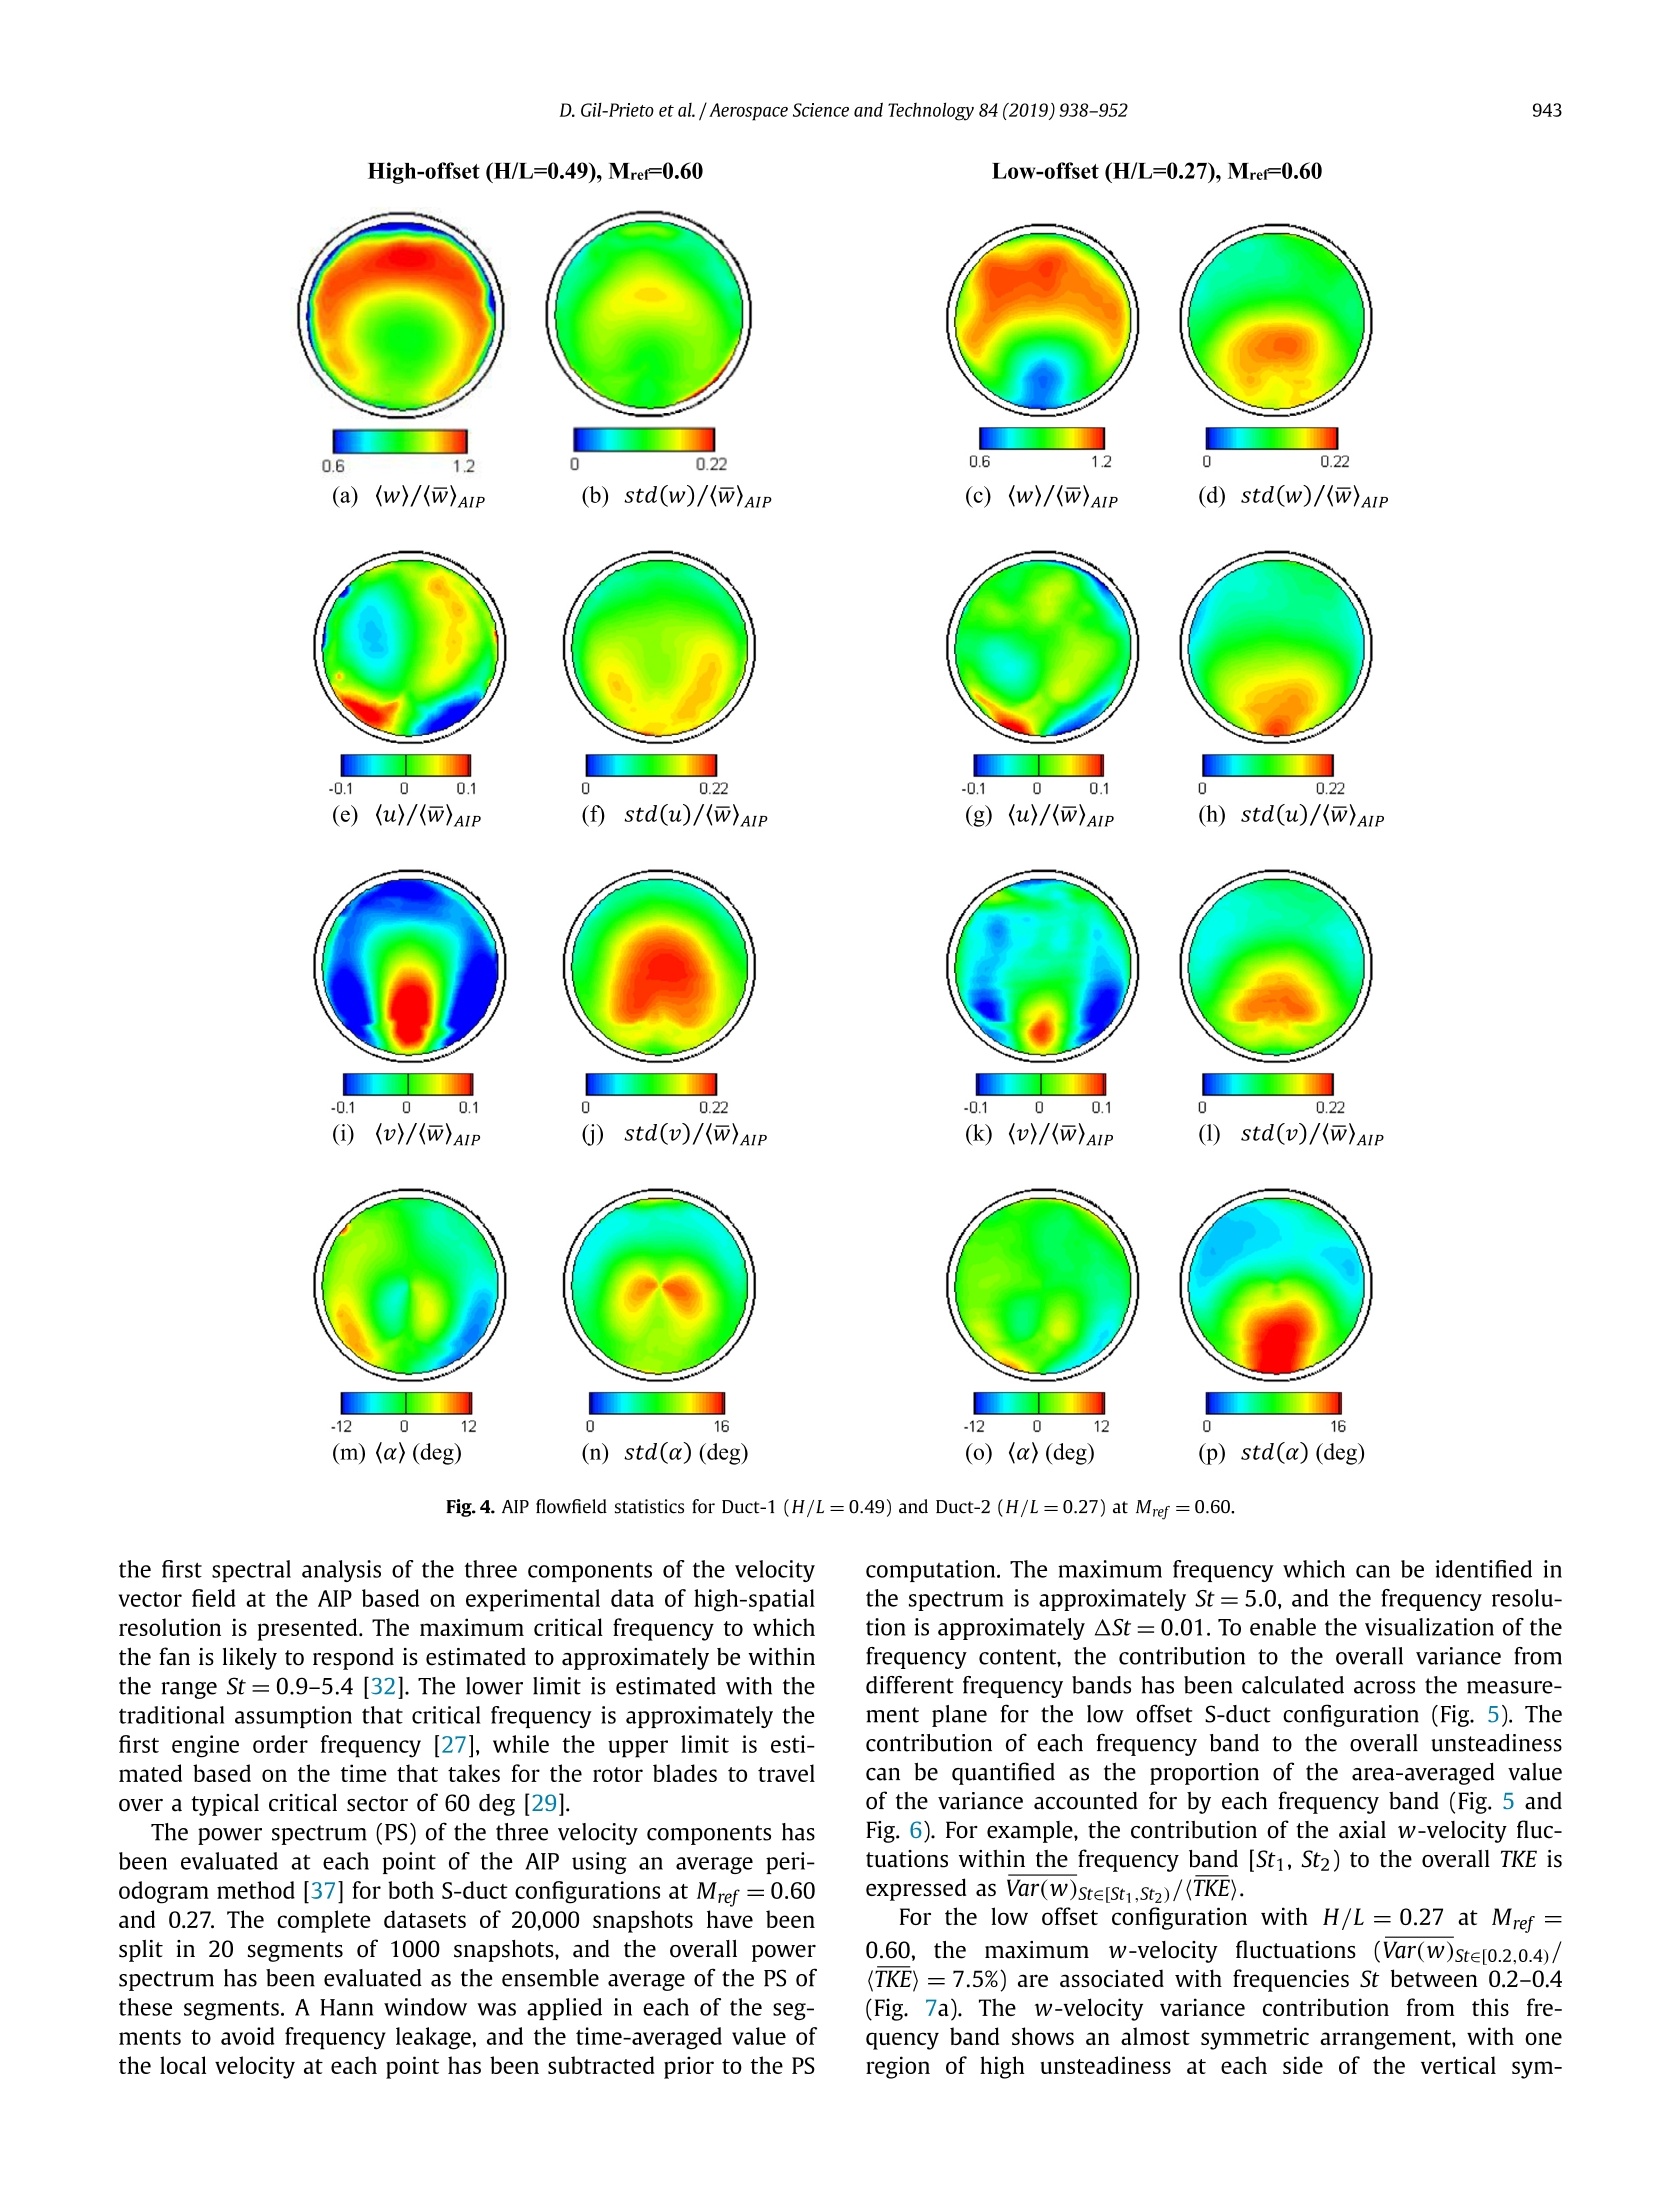
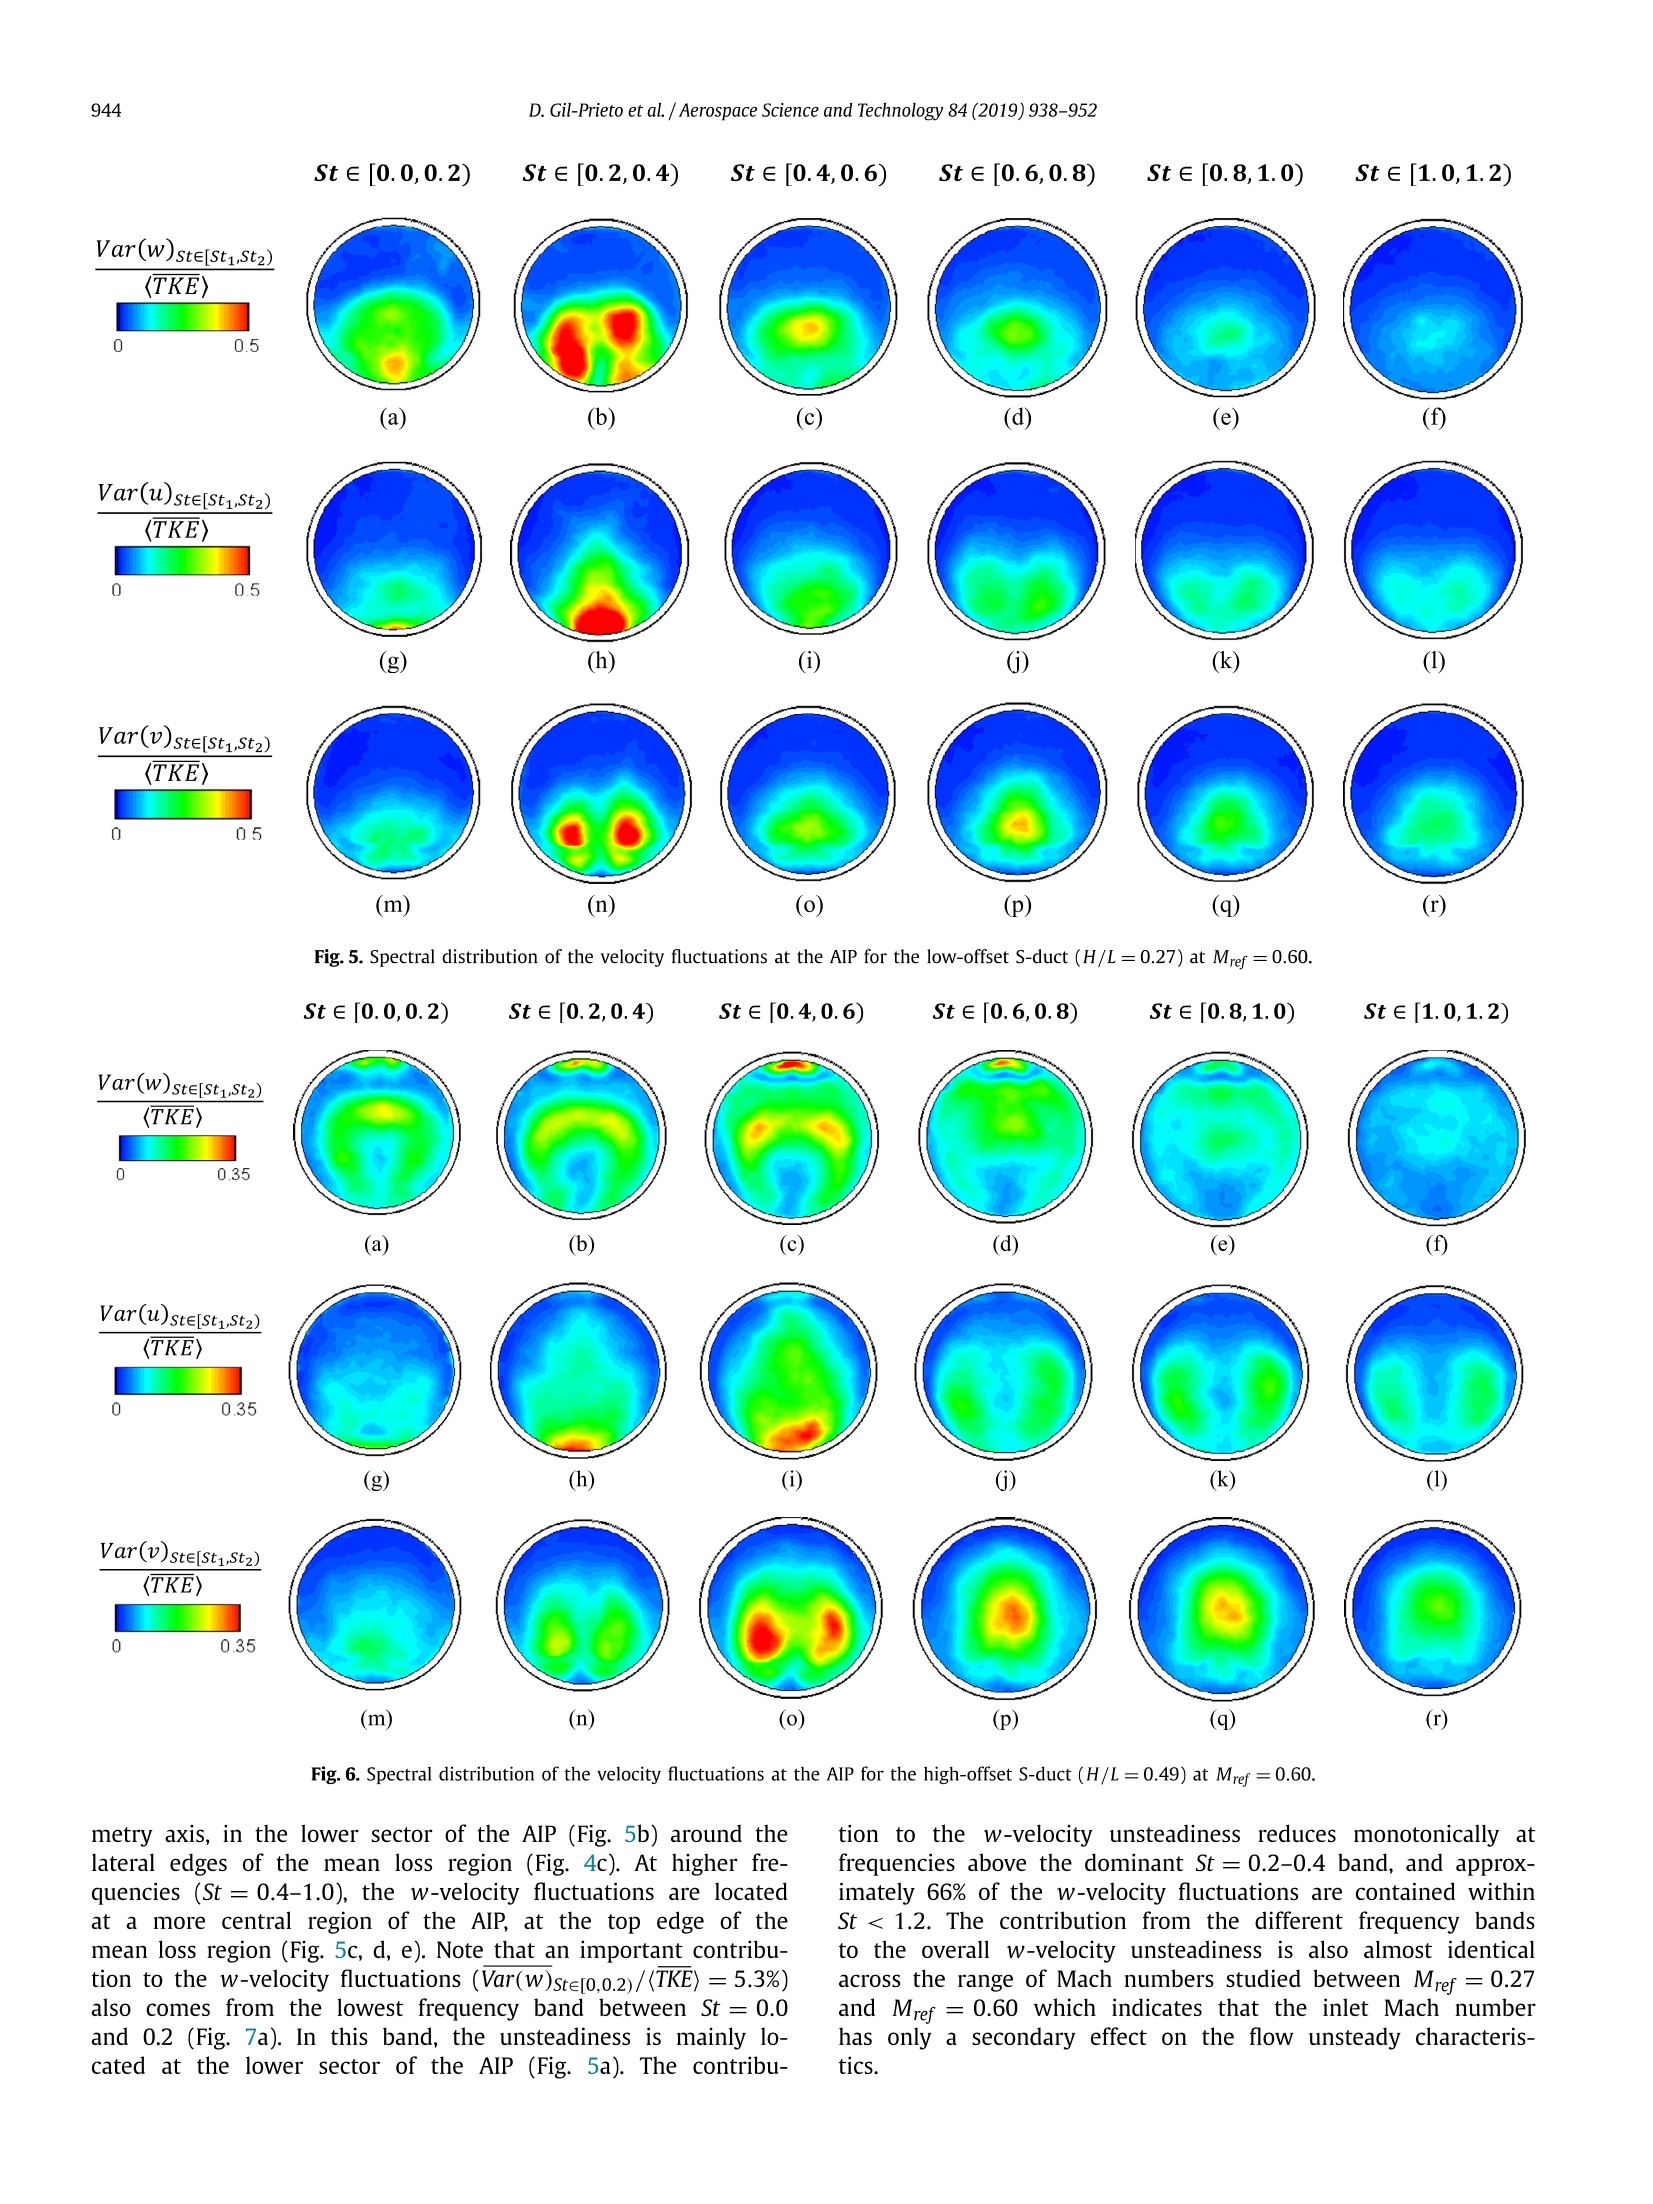
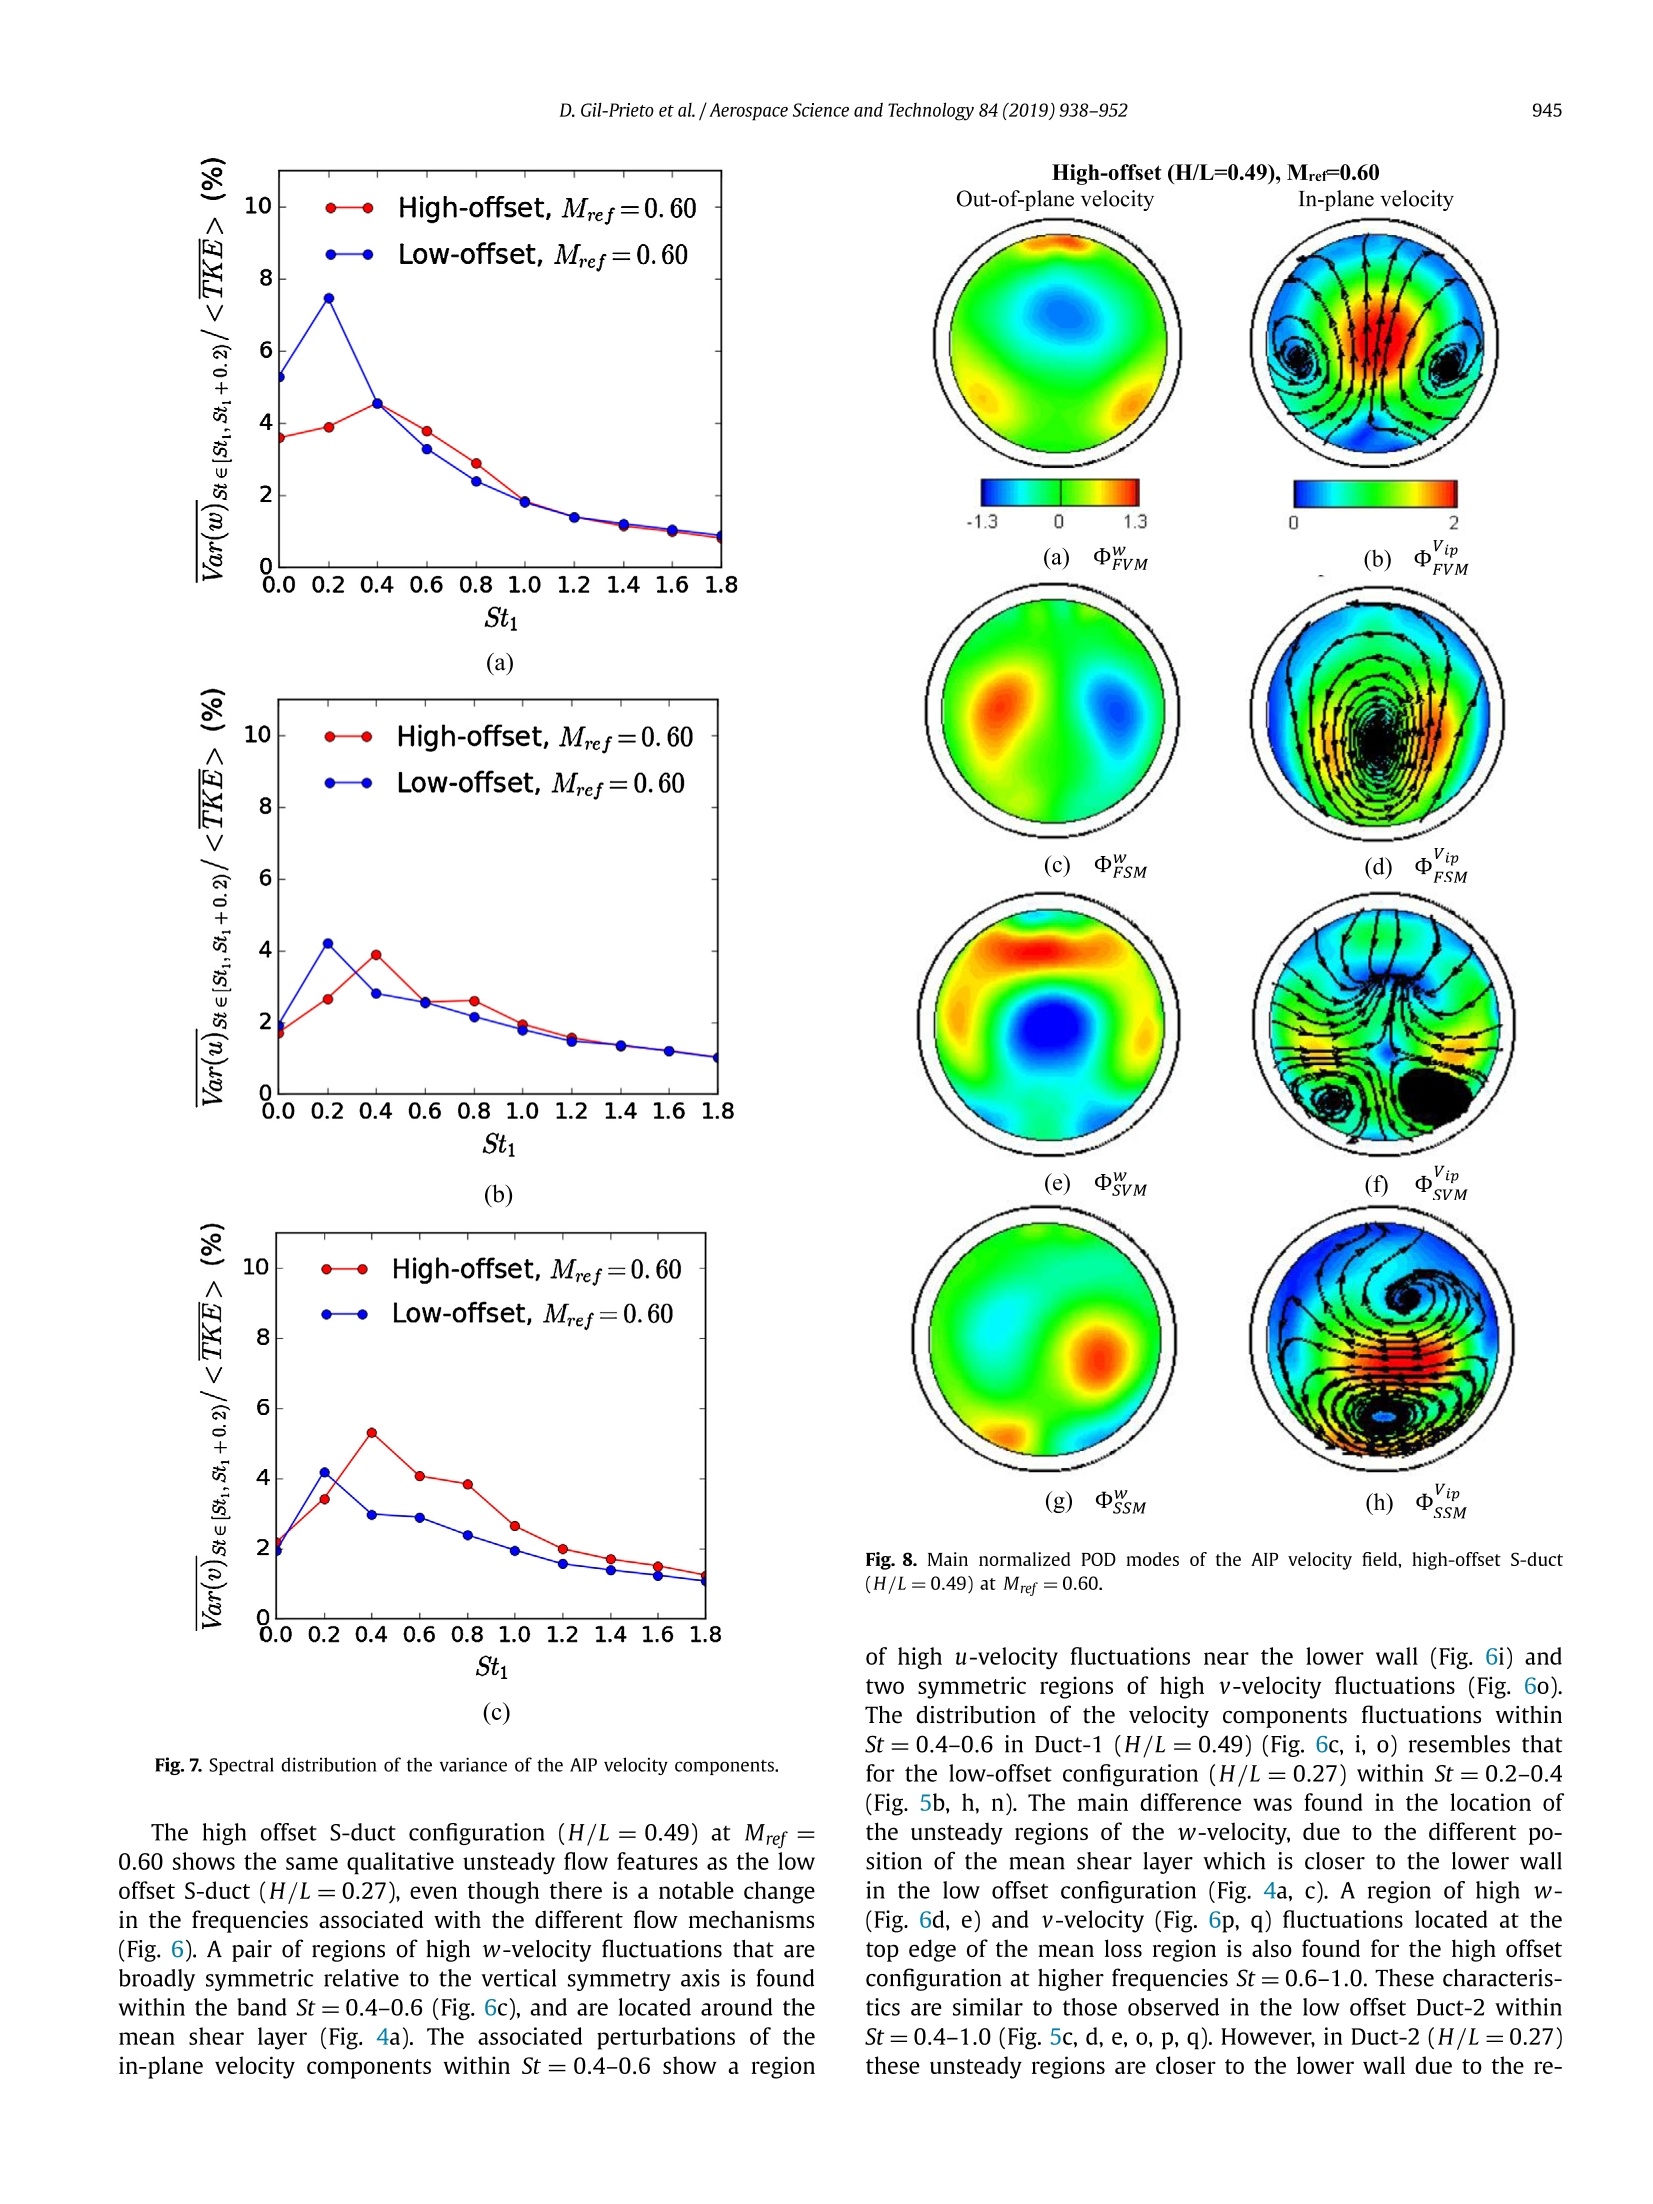
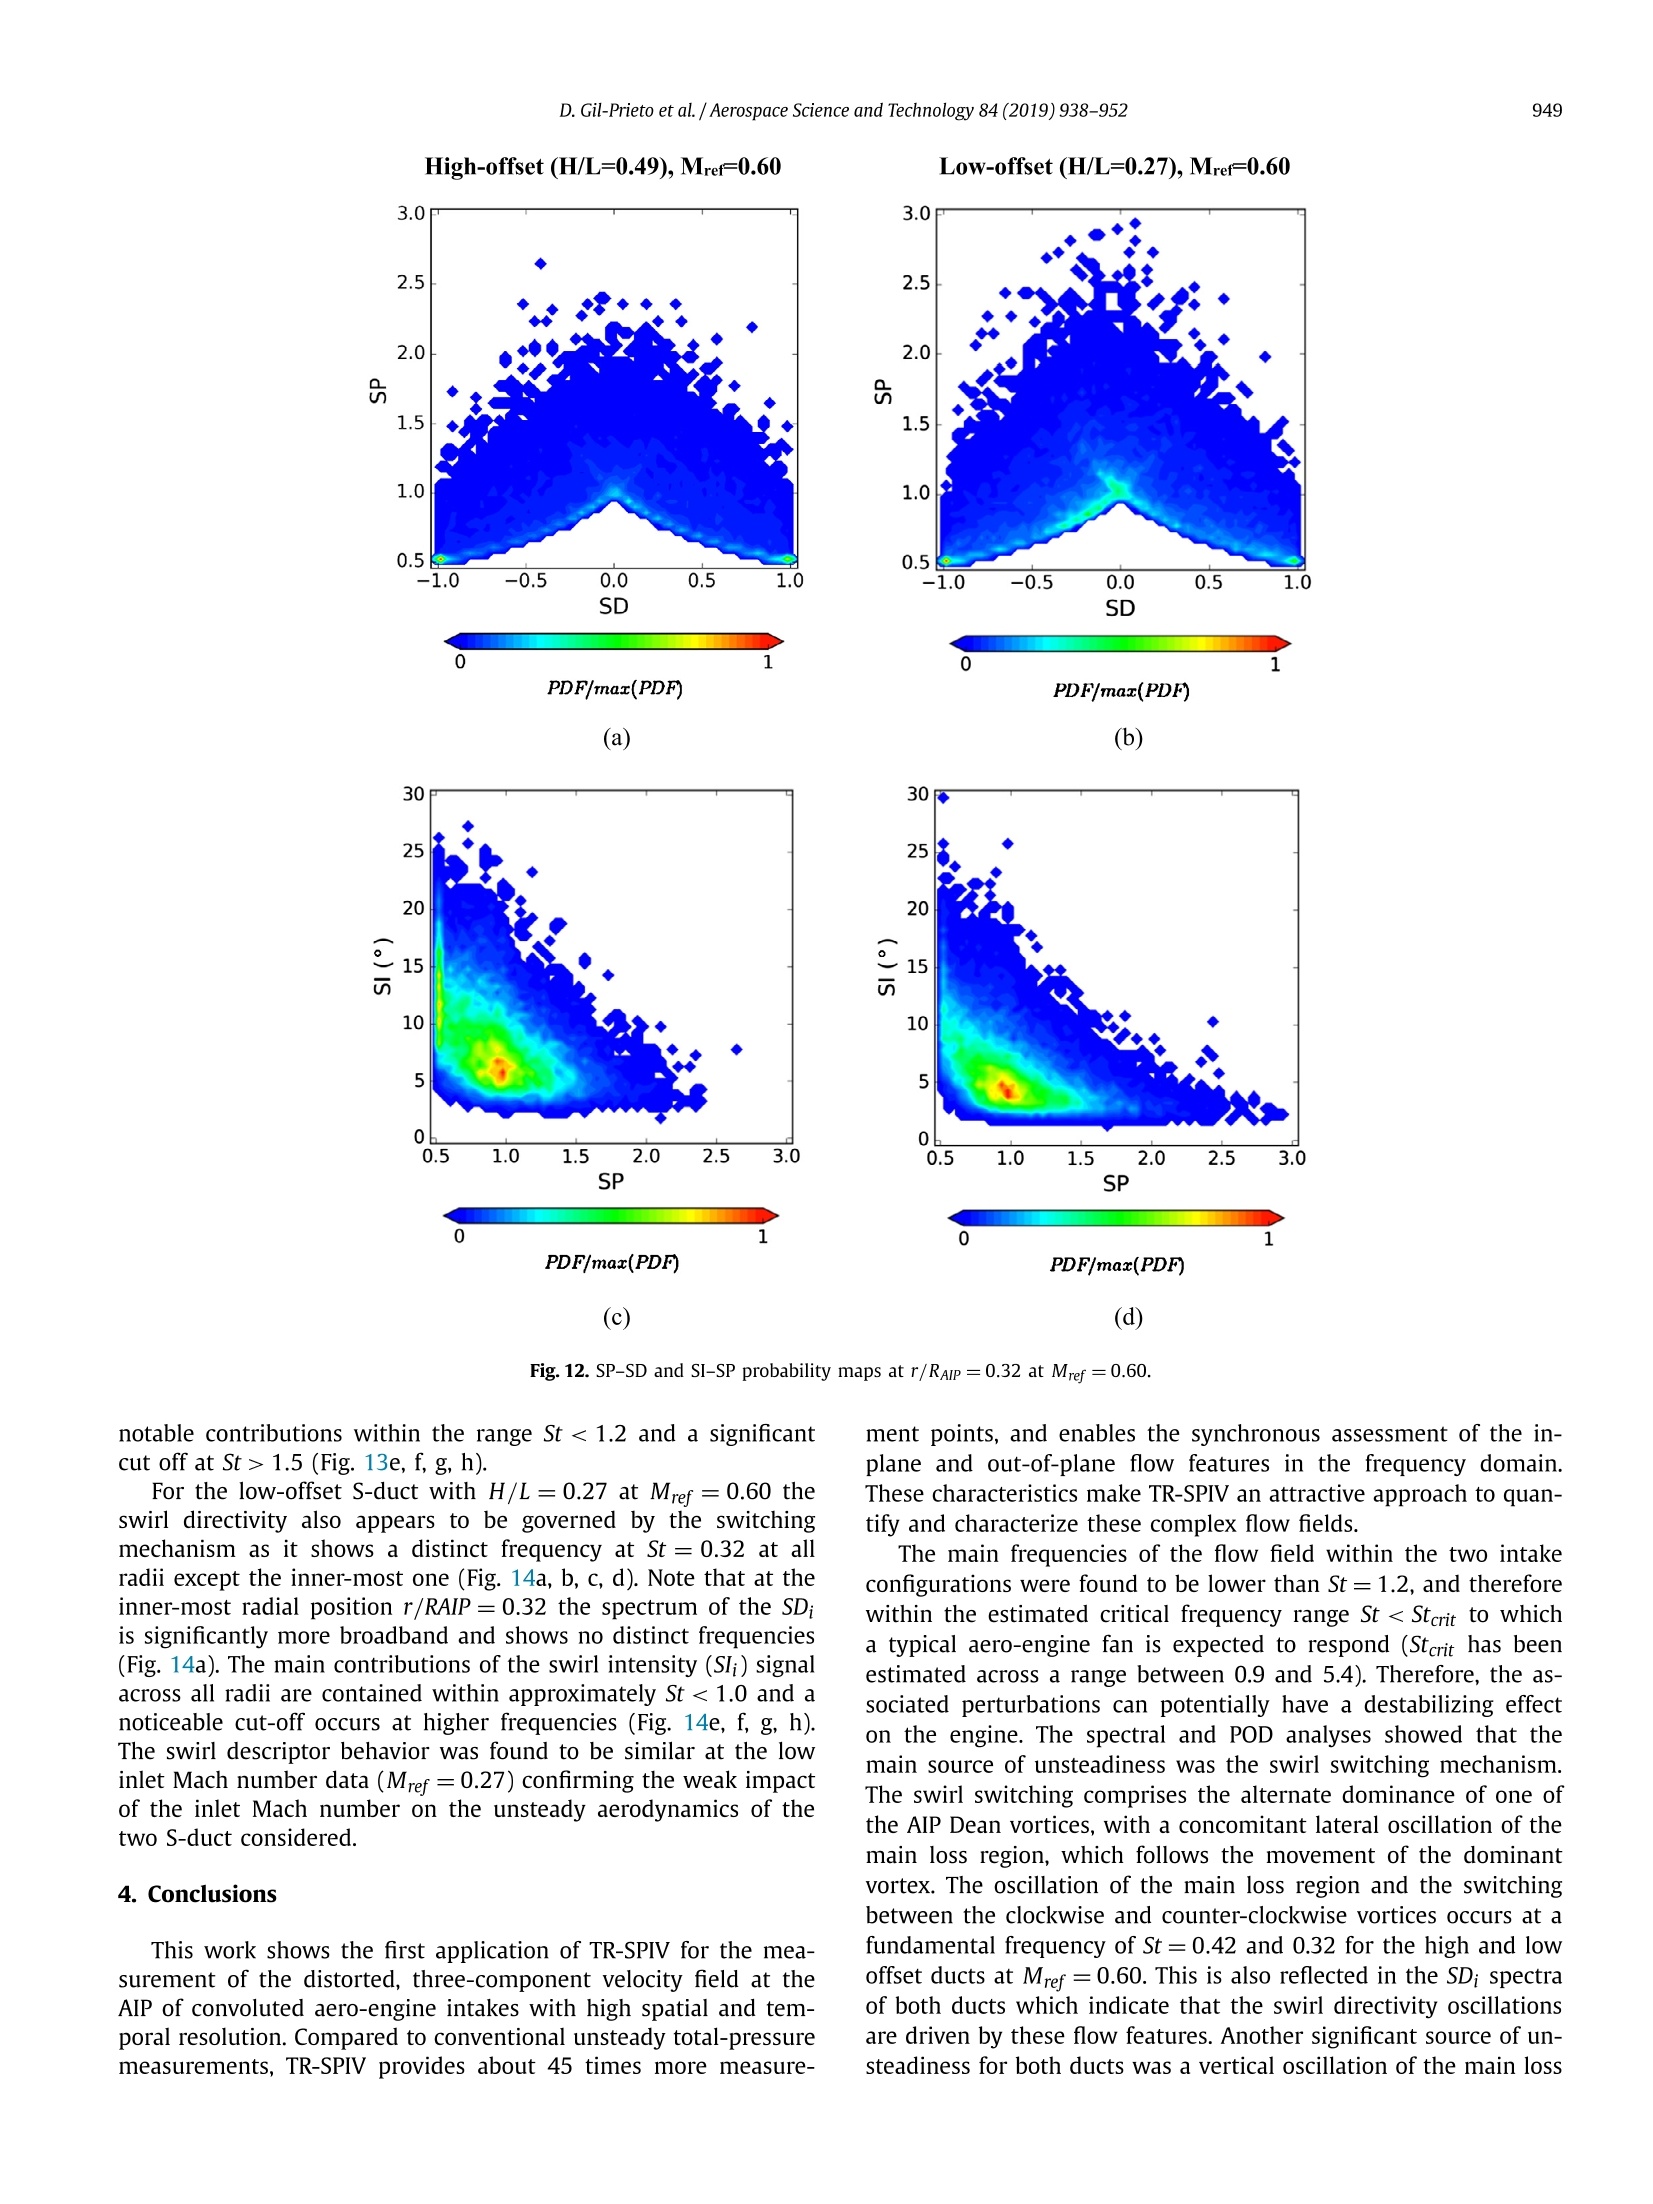
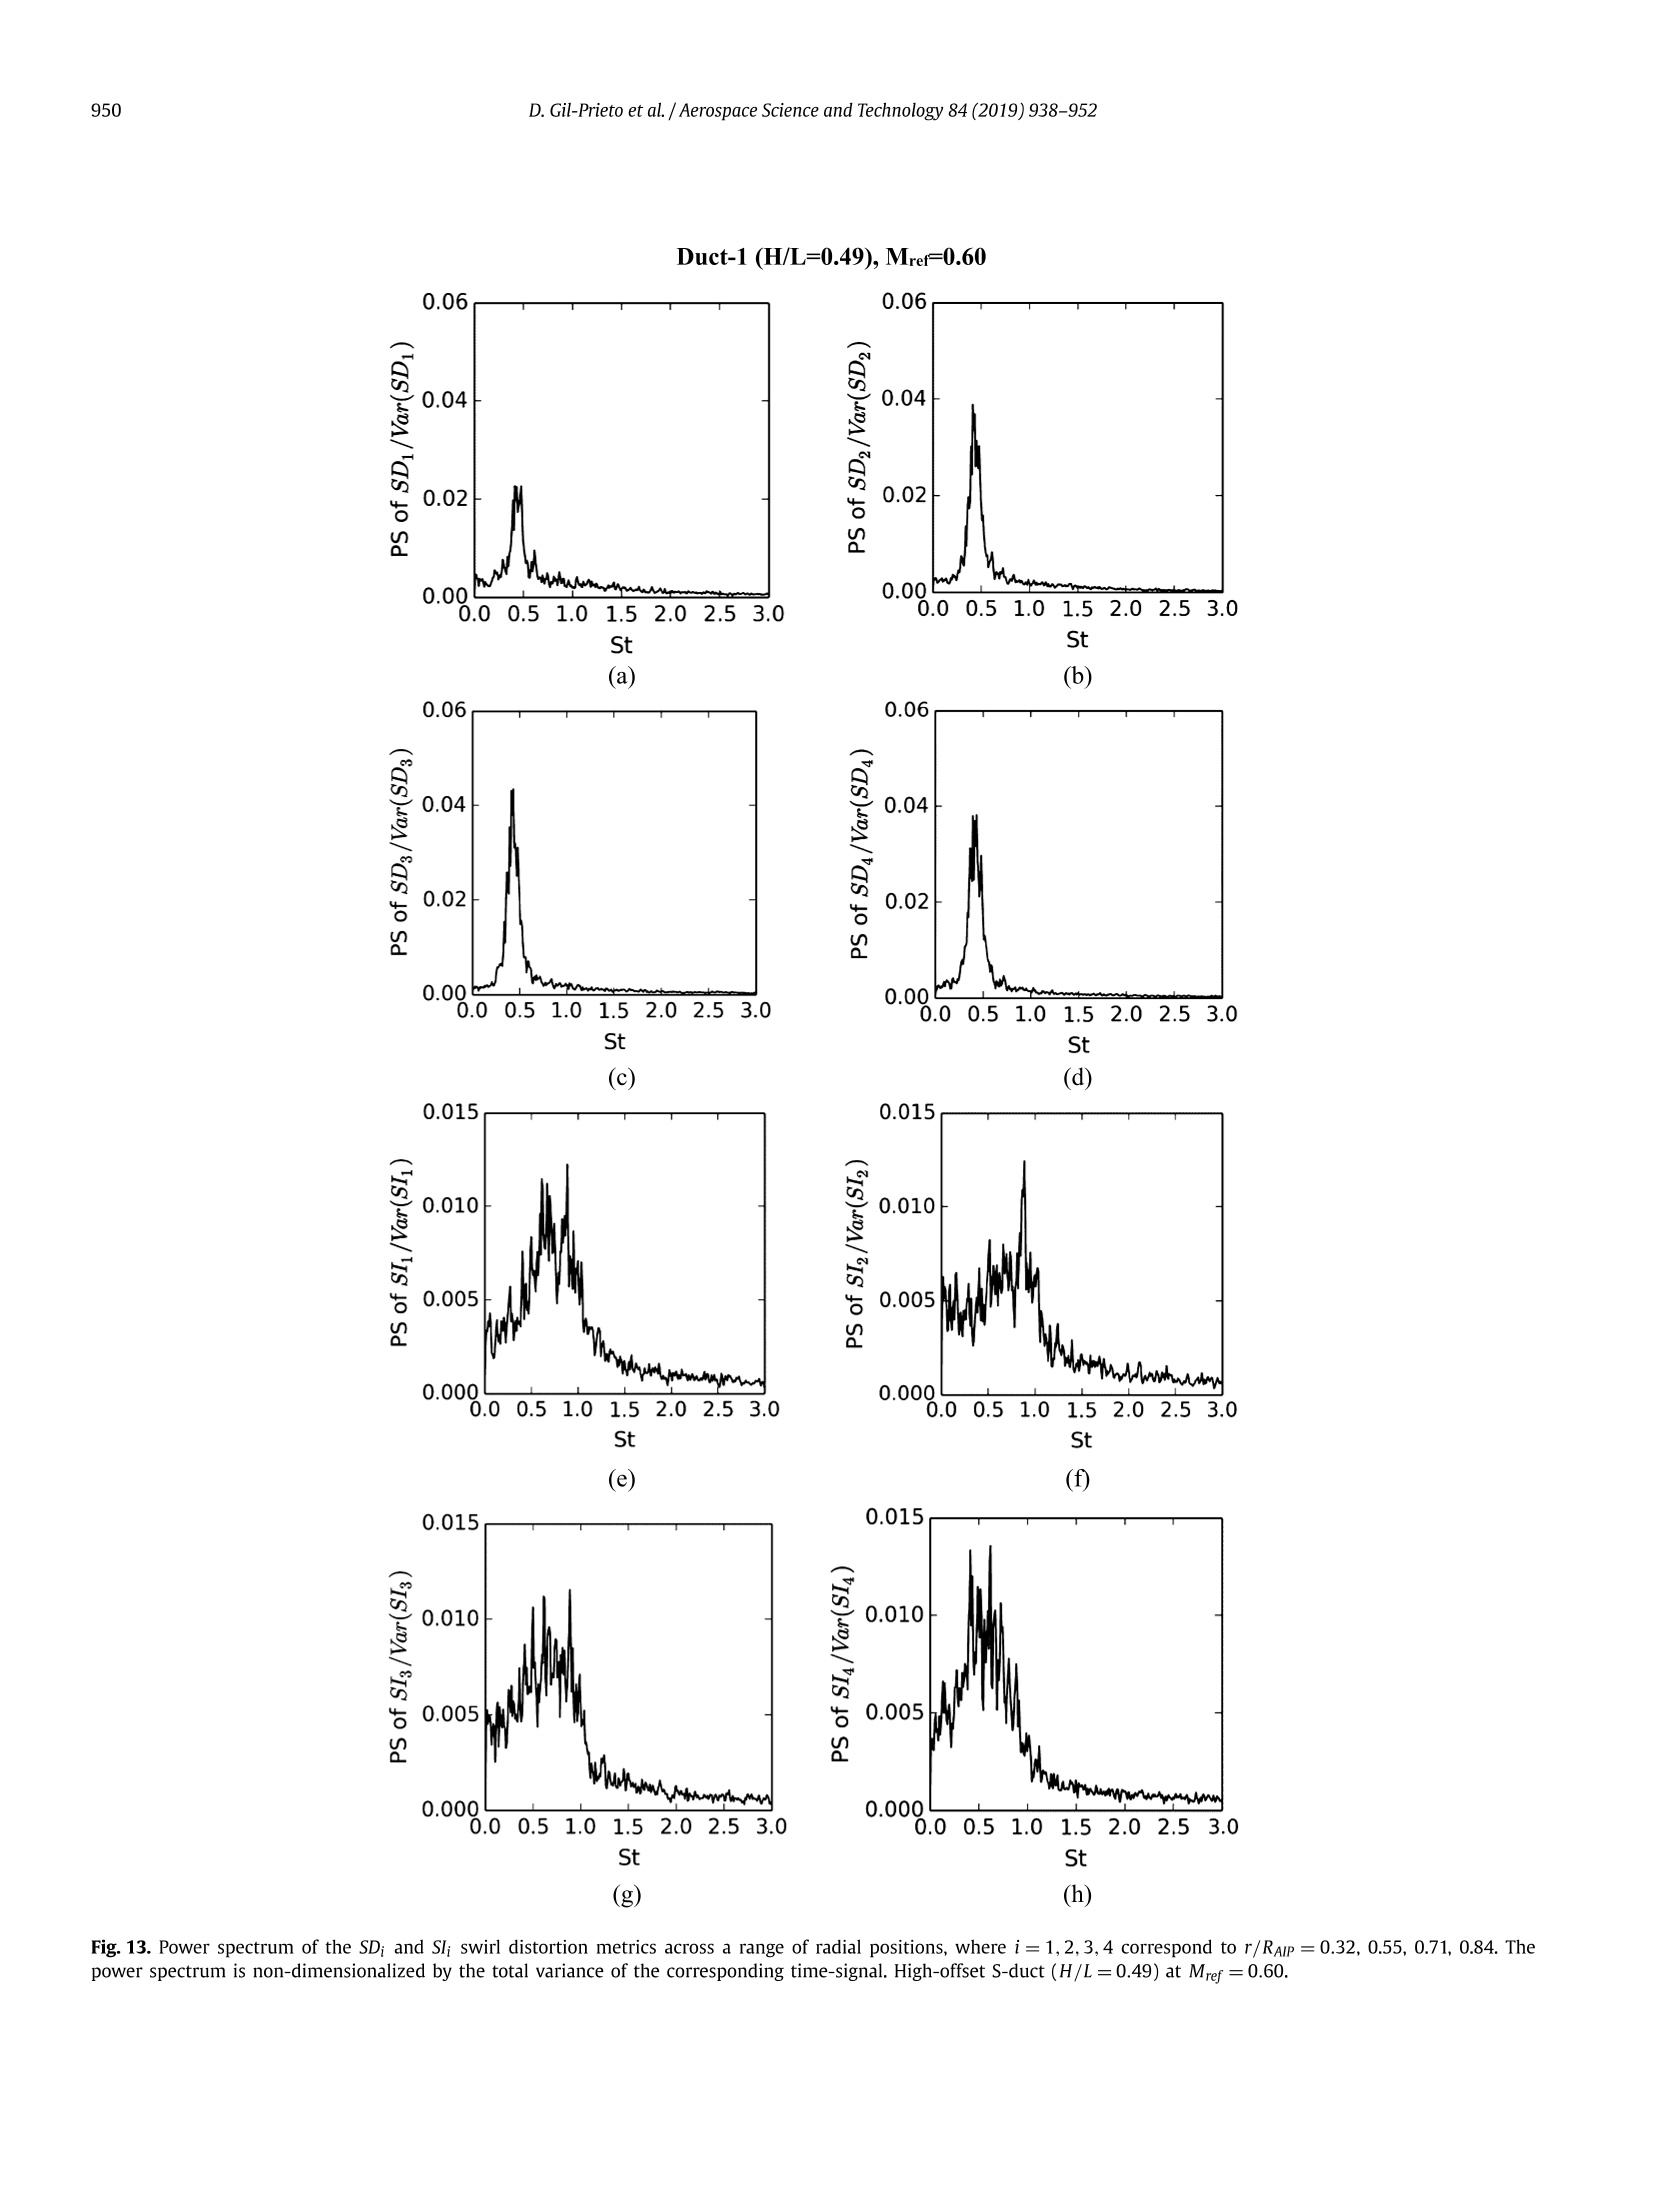
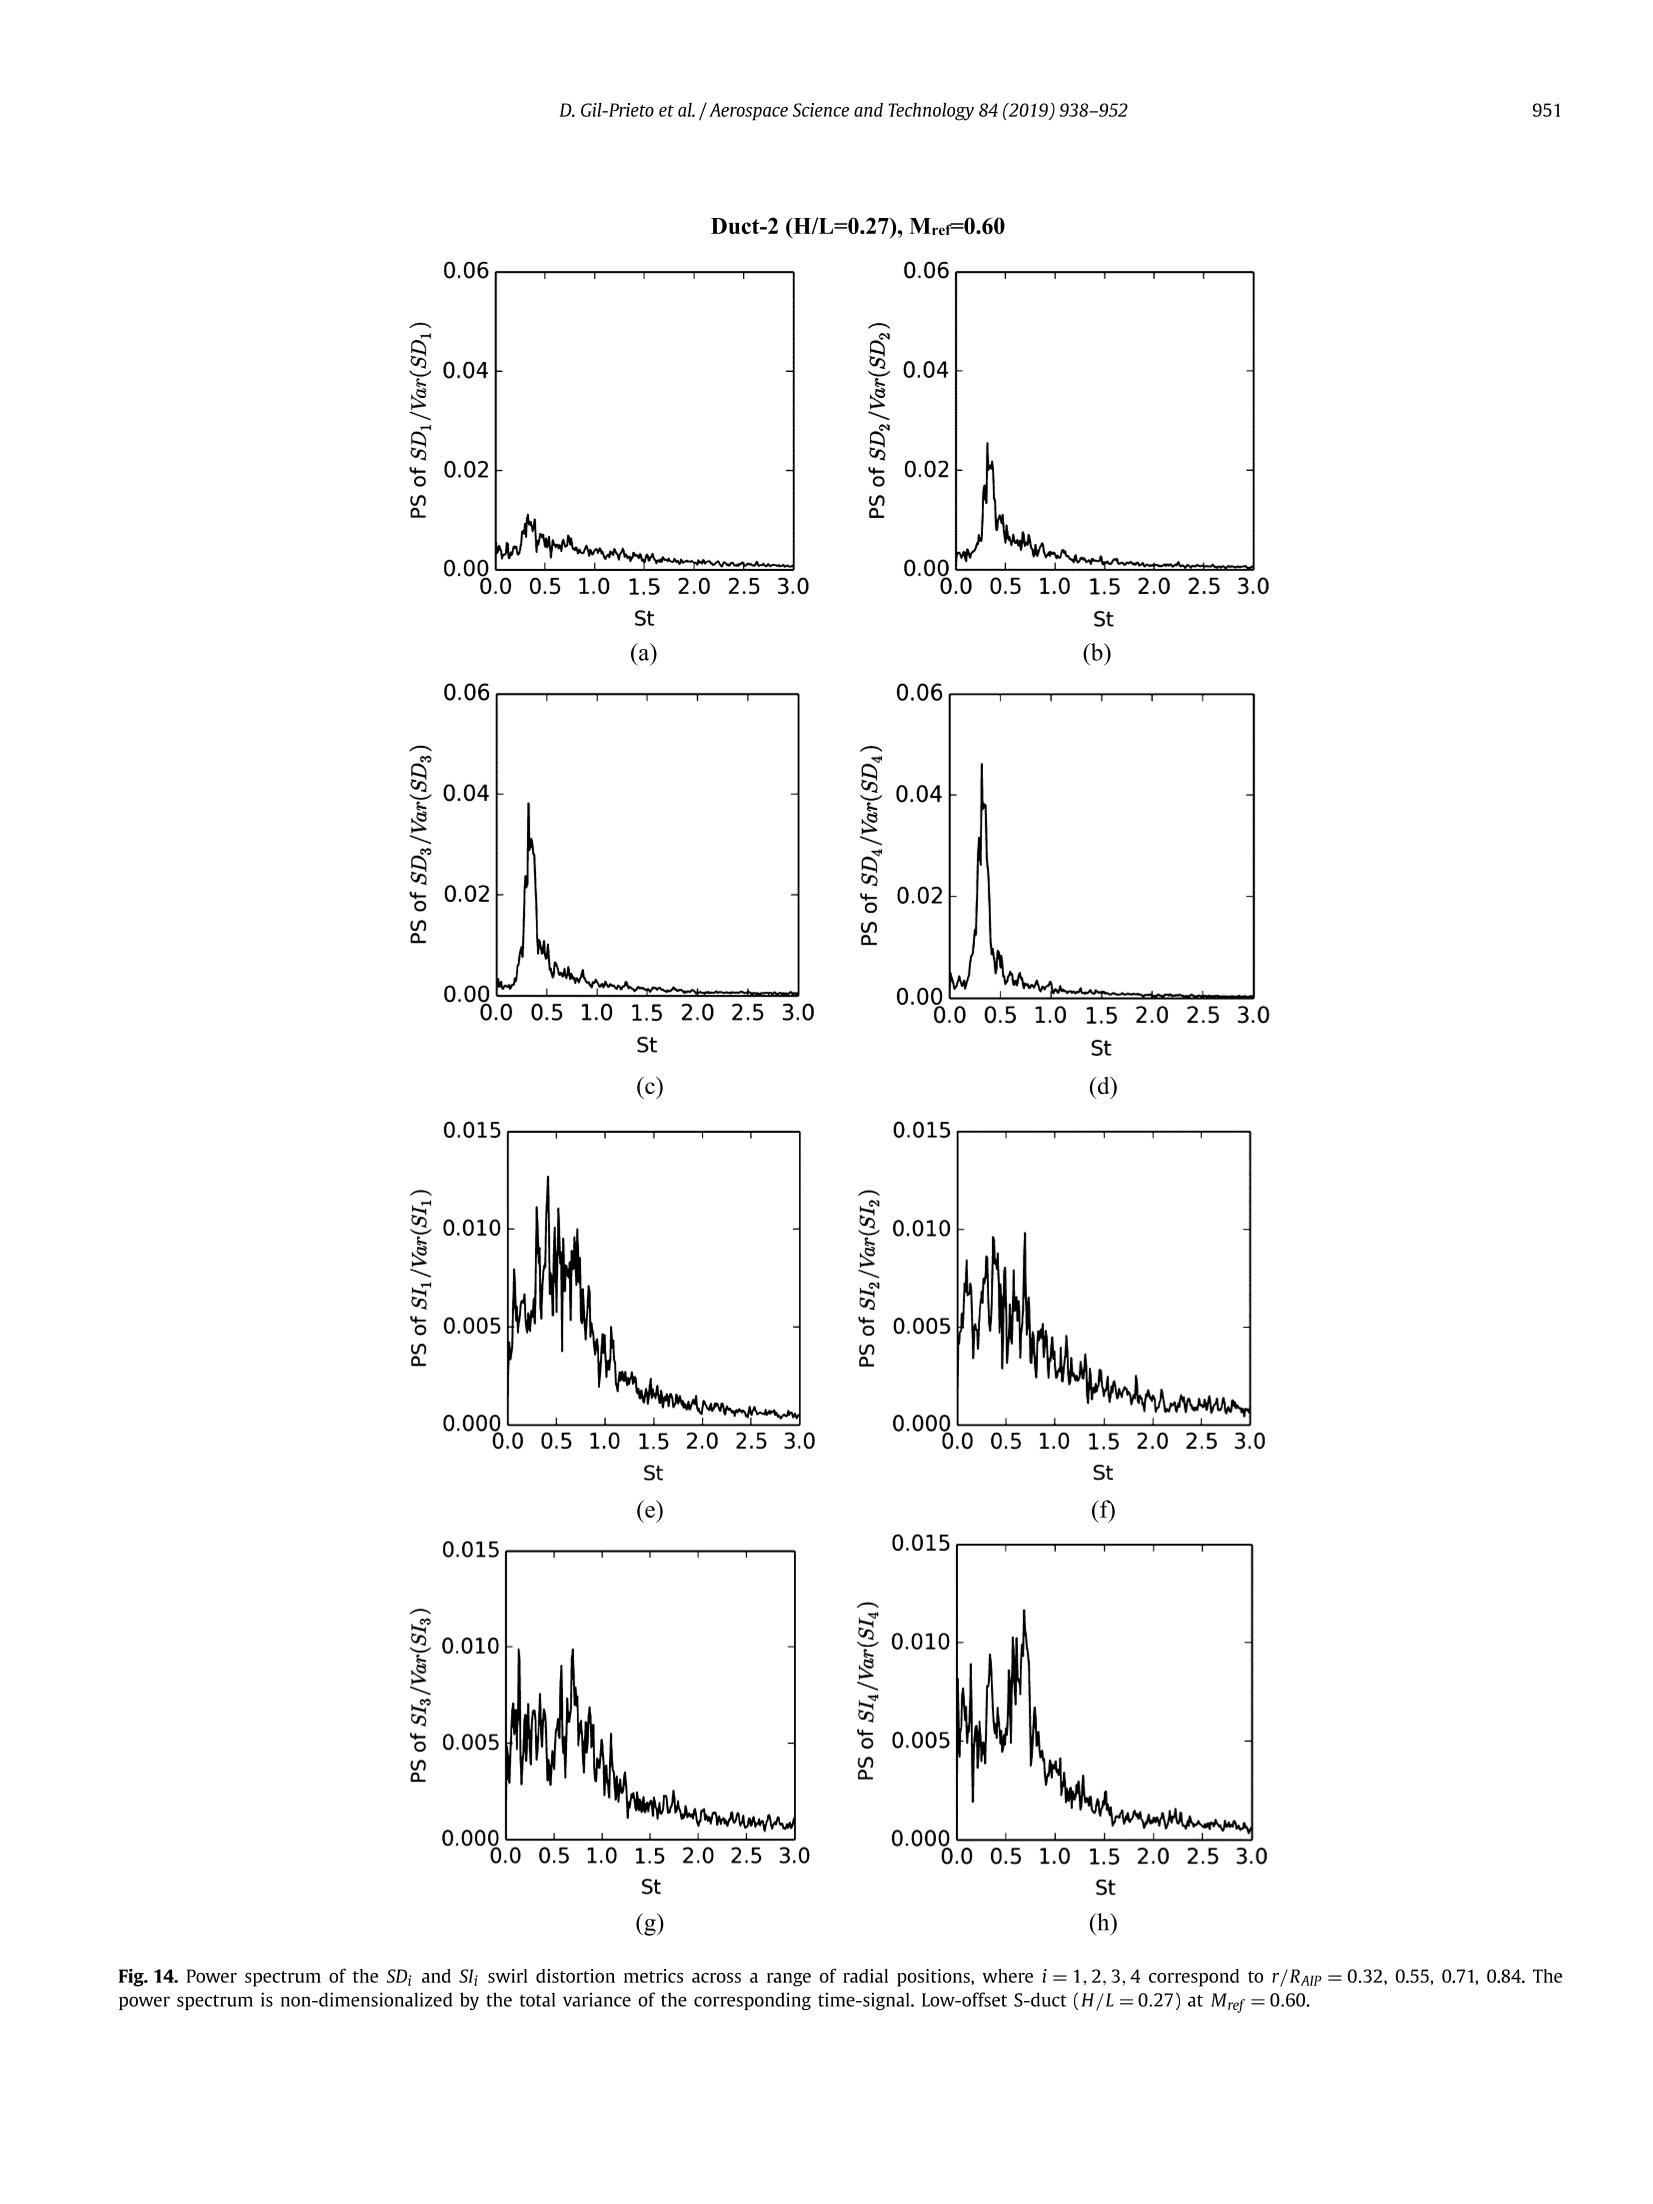
Aerospace Science and Technology 84 (2019) 938-952Aerospace Science and Technology D. Gil-Prieto et al. / Aerospace Science and Technology 84 (2019) 938-952939 Corresponding author.https://doi.org/10.1016/j.ast.2018.10.0201270-9638/Crown Copyright C 2018 Published by Elsevier Masson SAS. All rights reserved. Contents lists available at ScienceDirect www.elsevier.com/locate/aescte Unsteady characteristics of S-duct intake flow distortion Daniel Gil-Prieto, Pavlos K. Zachos*, David G. MacManus, Grant McLelland Propulsion Engineering Centre, School of Aerospace, Transport and Manufacturing, Cranfield University, Cranfield, MK43 0AL, United Kingdom ARTICLE INF O A BSTRACT Article history: Received 15 May 2018 Received in revised form 15 October 2018 Accepted16 October 2018 Available online 18 October 2018 The unsteady distorted flow fields generated within convoluted intakes can have a detrimental effect onthe stability of an aero-engine. The frequency signature in the distorted flow field is of key importance tothe engine’s response. In this work, time-resolved particle image velocimetry is used to obtain the three-component velocity field at the outlet plane of two S-duct intake configurations for a range of inlet Machnumbers. Proper orthogonal decomposition of the time-resolved velocity data allows the identificationof the main frequencies and coherent structures in the flow. The most energetic unsteady structurescomprise an in-plane vortex switching mode, associated with a lateral oscillation of the main loss region,and a vertical oscillation of the main loss region. The switching structure occurs at a frequency ofSt=0.42 and 0.32 for the high and low offset ducts, respectively. The vertical perturbation is associatedwith a more broadband spectrum between approximately St=0.6-1.0 and St=0.26-1.0 for the highand low offset configurations, respectively. The determined frequencies for these main unsteady flowstructures are within the range, which is expected to be detrimental to the operating stability of an aero-engine. The results provide a novel, time-resolved dataset of synchronous velocity measurements of highspatial resolution that enables analysis of the unsteady flows at the exit of complex aero-engine intakes.Crown Copyright C 2018 Published by Elsevier Masson SAS. All rights reserved. 1. Introduction It is expected that future aircraft configurations will requiremore closely coupled propulsion and airframe architectures [19,20,10,11] which often feature convoluted intakes to deliver theair flow to the engine. Although such aircraft configurations mayallow for weight and drag benefits, the coupling between the in-take and engine compression system becomes more critical. It isknown that complex intakes can generate high levels of unsteadyflow distortion, which can reduce the surge margin of the engineand eventually result in engine instabilities [30]. Historically, flowdistortion assessments were based on relatively sparse total pres-sure measurements acquired using steady, intrusive probes at theAerodynamic Interface Plane (AIP) ahead of the engine compressor[38,35]. For example, the mean flow within convoluted intakes wasmeasured by Wellborn et al. [38]for a mild geometry(H/L=0.27,AR= 1.52, L/Din=5.0, see Fig. 1), and is characterized by thepresence of a main loss region at the lower sector of the Aero-dynamic Interface Plane (AIP) (Fig. 4c) and a symmetric pair ofcounter-rotating vortices (Fig. 4m), often referred to as Dean vor-tices [7]. These flow features are the result of the flow separationand secondary flows that arise due to the curvature of the ge- E-mail address: p.zachos@cranfield.ac.uk (P.K. Zachos). ometry and the diffusion experienced by the flow as previouslyhighlighted by Anderson et al. [1] and Knoth and Breitsampter[21]. Previous studies highlighted the importance of the dynamiccomponent of the distortion for the stability of the propulsion sys-tem, and associated the peak,instantaneous flow distortion eventswith engine instabilities even when the mean levels were withinacceptable limits [4]. The frequency associated with the distortedflow perturbations was also found to have a significant effect onthe response of the fan [39]. Paul and Younghans [27] identifieda critical frequency that represented an upper limit to the pertur-bations to which the fan could respond. Perturbations associatedwith higher frequencies are expected to have a negligible effect onthe fan, and the engine is then primarily affected by the time-averaged value of these distortions [5]. Cousins [6] defined thiscritical frequency based on the flow transit time from the lead-ing edge to the throat of the fan rotor. The time in which a rotorblade covers a sector of 4 or 5 blades was proposed as a rule ofthumb for the estimation of the upper critical frequency [6]. The highly unsteady nature of the flow within complex intakes[2] and the crucial importance of the dynamic distortion on thefan response [4] have demonstrated the limitations of the con-ventional measurement methods for inlet flow distortions basedon steady pressure probes as well as the standard flow predic-tion approaches based on steady state RANS models [9]. Delotet al. [8] measured the unsteady total pressure field at the AIPof a geometry representative of a mild curvature S-duct intake Fig. 1. Schematic definition of S-duct geometry. (H/L=0.27, AR=1.52, L/Din=5.0, see Fig. 1) at a flow conditionof MAp=0.20 (Rep=7.5×10⁵) using 40 high-bandwidth pressuretransducers. The spectral analysis revealed that most of the fluc-tuations were contained within frequencies below St=0.75. Twosignificant unsteady regions were identified at the lateral edges ofthe mean loss region (Fig. 4c), and were associated with a mainfrequency of St=0.27. The pressure signals in these regions werestrongly correlated and out of phase,which indicated a lateral os-cillation of the flow [8]. A third region of high unsteadiness wasidentified at the top edge of the mean loss region, and associatedwith a main frequency of St=0.54. Garnier [12] measured theunsteady total pressure field at the AIP of a more severe S-ductintake (H/L=0.49, AR=1.52, L/Din =4.95) at two flow condi-tions of MAlP=0.2 (Rep=7.5×10) and 0.4 (Rep=15.0×10),also using 40 high-bandwidth pressure transducers. A lateral os-cillation was also identified, and associated with a frequency ofapproximately St=0.48. A region of high unsteadiness at the topedge of the mean loss region was also reported and associatedwith frequencies between St =0.60-1.09. Based on studies for twointake configurations, Tanguy et al.[33] used the unsteady distor-tion descriptor signals to enable the application of the ExtremeValue Theory (EVT) to stochastically predict extreme levels of total A S-duct cross sectionarea.. mm2 Y Curvature ratio based on the inlet-section radius, AR Area Ratio Aout/Ain Rin/Rc D S-duct cross section diameter.... ,. mm 01 Extent of the maximum sector swirl region....... d deg DDES Delayed Detached Eddy Simulation POD non-dimensional modal distribution EVT Extreme Value Theory Subscripts f Frequency....... .. Hz H S-duct centerline offset...... ... mm AIP Aerodynamic Interface Plane (0.41Dout downstream of L S-duct axial length . Imm the S-duct outlet plane) M Mach number in S-duct inlet plane R S-duct cross section radius .m.. .· Imm out S-duct outlet plane Rc Curvature radius of the S-duct bend.............. mm ref Reference plane (1.5Din upstream of the S-duct inlet Rep Reynolds number based on the inlet diameter plane) S S-duct centerline co-ordinate...... mm FSM First Switching Mode SD Swirl Directivity distortion descriptor FVM First Vertical Mode SI Swirl Intensity distortion descriptor.... deg SSM Second Switching Mode SP Swirl Pairs distortion descriptor SVM Second Vertical Mode SS Positive Sector Swirl in the k-th swirling region of the Superscripts i-th ring SSk Negative Sector Swirl in the k-th swirling region of the Vip In-plane velocity modulus, √u+v2 i-th ring W Stream-wise velocity field St Strouhal number, fDAlP/(w)AIP TKE Turbulent Kinetic Energy....... J/kg Operators u,v,w Velocity vector cartesian components... ...1m/s () Time-average x,y,z Cartesian coordinate system Area-average Vo Circumferential velocity component. . m/s O. Standard deviation O Swirl angle, arctan(ve/w)...... ... Qdeg Var(.) Variance pressure distortion that could occur based on a reduced, baselinedataset. A similar application of the EVT using unsteady swirl dis-tortion data was presented by Gil-Prieto et al. [15] showing thatsuccessful application of the theory of extremes can potentiallypredict peak distortion events beyond the measured ones thatcould have a detrimental effect on the stability margin of the en-gine. MacManus et al. [26] simulated the unsteady total-pressureflow-field within the S-duct geometries studied by Delot et al. [8](H/L=0.27) and Garnier [12] (H/L=0.49) at similar flow con-ditions, with a Delayed Detached Eddy Simulation (DDES) method.For the milder geometry (H/L=0.27) at MAIP=0.2, the lateraland longitudinal perturbations were associated with a main fre-quency of St=0.40 and 0.75, respectively. For the more severeconfiguration (H/L=0.49) at MAIP=0.2, the lateral and verticaloscillation were observed at approximately St=0.55 and 0.85, re-spectively. MacManus et al. [26] also demonstrated that Reynoldsand Mach number variations have only a minor effect on the un-steady characteristics of these flow fields. The work by Zachos et al. [41] represented a breakthrough inthe experimental methods used to quantify distorted flow fields incomplex intakes. For the first time, Stereo Particle Image Velocime-try (SPIV) was applied to measure the unsteady, three-componentvelocity field at the AIP, with approximately 250 times more datapoints compared with conventional experimental techniques basedon 40 pressure transducers. This study considered the same non-dimensional intake geometries investigated by Delot et al. [8] andGarnier [12], at Mref= 0.27 (Rep=5.9×10) and 0.60 (Rep=13.8×10). Zachos et al. [41] focused the analysis on the un-steady swirl distortion, which can be a notable source of engineinstabilities [30]. For both configurations, the maximum swirl an-gle fluctuations at the AIP were approximately oo =15° and werespread over the lower sector of the section in regions where thetime-averaged flow was almost swirl-free. In addition, the un-steady swirl levels were of the same order as the time-averagedvalues. These results highlighted the need for unsteady swirl mea- surements such as those obtained with SPIV to account for thehighly dynamic nature of the swirl distortion in these intakes[41]. Gil-Prieto et al. [13] applied Proper Orthogonal Decomposi-tion (POD) to the measured velocity field at the AIP for the sameconfigurations investigated by Zachos et al. [41], to identify thefundamental coherent structures in these flow fields. The two mostenergetic structures for both ducts were a vertical and a switch-ing mode. The vertical mode represented a vertical oscillation ofthe main loss region [13]. The switching mode was responsible forthe swirl switching mechanism by which alternately one of theDean vortices becomes dominant in the AIP [36], and leads to bulkswirl patterns that promote the most intense swirl events [13]. Theswitching mode was also associated with a lateral movement ofthe main loss region, which followed the displacement of the dom-inant vortex. Gil-Prieto et al. [14] performed a Delayed DetachedEddy Simulation (DDES) of the flow field within the high offsetduct(H/L=0.49) studied by Zachos et al.[41] at Mref=0.27. Thespectral analysis of the POD structures revealed that the switch-ing and vertical modes were associated with dominant frequenciesof St=0.53 and 1.06, respectively. Gil-Prieto et al. [14] studiedthe upstream origin of these structures, and showed that the swirlswitching was the result of the alternate shedding of clockwiseand anti-clockwise stream-wise vortices from the separation re-gion. The vertical perturbation was promoted by the shedding ofspanwise vortices along the shear layer from the separation re-gion [14]. It is worth noting that similar switching and verticalstructures were also observed in simpler, non-diffusing, single 90°bends used in piping systems [18,17]. Kalpakli-Vester et al. [18]used Time-Resolved SPIV (TR-SPIV) for the measurement of theairflow velocity field downstream of a 90°, non-diffusing bend. Inthis investigation, the measurements were taken at the exit of thepipe where the flow was discharged into quiescent air. For a bendwith a curvature ratio of y = 0.39 at Rep =2.3×10⁴, Kalpakli-Vester et al. [18] reported a dominant frequency at St = 0.10and a smaller peak at St= 0.04 for the switching mode, whilethe vertical perturbation was associated with a main frequency ofSt=0.04. Hellstrom et al. [17] also used TR-SPIV for the investiga-tion of water flow in a 90° bend with a curvature ratio ofy=0.50at Rep=2.5×10⁴. In this case the switching mode was associatedwith a frequency of St=0.33, while the vertical mode showed adominant frequency at St=0.16. The present work builds upon the work of Zachos et al. [41]and Gil-Prieto et al. [13,14], in which SPIV was used to quan-tify the unsteady, distorted velocity field at the AIP of complexintakes. These previous investigations used a low-bandwidth SPIVsystem, and even though these measurements allowed the statis-tical analysis of the distorted flow field, the acquisition frequencywas insufficient to resolve the main frequencies in the flow field.The present investigation uses, for the first time, TR-SPIV to quan-tify the distorted flow field within S-duct intakes. TR-SPIV enablesthe spectral analysis of the distorted flow field, which is of primeimportance due to the major effect of the frequency content on thefan response [5]. The main aim of this paper is to quantify for thefirst time the experimental spectral characteristics of the velocityflow field within complex S-duct intakes. The dominant frequen-cies for two S-duct intakes with different centerline offset at twoflow conditions of Mref=0.27 and 0.60 are identified. The time-resolved velocity data enable spectral analyses for the in-plane andout-of-plane flow features, as opposed to total pressure data wherethese features are combined and cannot be studied separately. PODis used to elucidate in more detail the spatial and spectral coher-ent characteristics of the flow. Finally, the spectral analysis of keyswirl distortion descriptors correlates their temporal behavior withthe identified flow coherent structures. S-duct geometries. Parameter High offset (Duct-1) Low offset (Duct-2) Aout/Ain 1.52 1.52 L/Din 4.95 5.00 H/L 0.49 0.27 2. Experimental setup and methods 2.1. Experimental facility and test-cases An S-duct intake test facility at Cranfield University was usedfor the experiments. This is described in detail by Zachos et al.[41]. Upstream of the S-duct, the facility includes a bell-mouthintake, a flow conditioning section, a constant diameter section,a conical nozzle that reduces the duct diameter from 200 mm to121.6 mm and finally a straight constant diameter section where areference measurement plane is located at 1.5Din upstream the S-duct inlet [41]. This reference plane was used to determine theinlet Mach number to the S-duct based on total-pressure andwall static pressure measurements in order to define the operat-ing point of the rig. The facility was designed in a modular wayto accommodate two S-duct configurations (Fig. 1) with differentcenterline offsets (Table 1). The datum configuration is a scaledversion of the geometry investigated by Wellborn et al. [38] andDelot et al. [8], and features a centerline offset of H/L=0.27, anaxial length L/Din =5.00 and an area ratio AR=1.52 (Table 1).The higher offset configuration is also a scaled version of the ge-ometry studied by Garnier [12], with H/L=0.49, L/Din =4.95and AR=1.52 (Table 1). The AIP diameter for both configurationswas DAIP =150 mm. At the exit of the S-duct a transparent sec-tion was used to enable optical access for the TR-SPIV laser andcameras. Flow conditions at an inlet reference Mach number ofMref=0.60 (Rep=13.8×10⁵) is considered in this work whiletest data were also acquired at a lower reference Mach numberof Mref=0.27 (Rep=13.8×10⁵). The uncertainty of the refer-ence Mach number was estimated to be approximately 0.6±0.005,where the accuracy and resolution of the pressure transducers aswell as the calibration uncertainty have been considered and prop-agated [34]. The displacement thickness of the boundary layer atthe reference plane was approximately 0.007Din at Mref=0.60. 2.2. Time resolved stereo particle image velocimetry Di-Ethyl-Hexyl Sebacate particles were used to seed the flow,and were generated by a Laskin nozzle particle generator at anaverage diameter of approximately 1 um. The seeding particleswere illuminated by a dual cavity pulsed Nd:YAG laser at theAIP, located 0.41Dout (61 mm) downstream of the exit plane ofthe intake. A pair of 1MP CMOS cameras were used in an off-axis stereo arrangement. The cameras featured a sensor with aresolution of 1280×800 px, and a maximum straddle framerate of 16,600 fps which enables the acquisition of velocity fieldswith a maximum temporal resolution of 8.3 kHz. A pair of AF1.8/D Nikkor lenses was used for imaging with a focal lengthof 50 mm. A single-plane calibration target was traversed axi-ally to calibrate the cameras. The data acquisition frequency wasselected as 10 times the highest dominant flow frequency ofSt = 1.06 as reported previously by Gil-Prieto et al. [14], whichresulted in a value of 8 kHz for the two considered intakes ata flow conditions of Mref =0.60. Each dataset comprised 20,000instantaneous velocity fields, which was sufficient to achieve sta-tistically converged results. For example, (w)Aip and owAlp con-verged to within 0.2% and 0.4% after 15,000 snapshots, respectively,and similar results were obtained for the other velocity compo-nents. The PIV processing algorithm used a direct correlation method,and a recursive multi-pass window approach was employed withan initial window size of 128 ×128 px, and a final window sizeof 32 ×32 px, with a 50% overlap. The PIV processing strategy re-sulted in a vector resolution of approximately 0.0187Dout (2.8 mm)in both directions across the AIP. Only data within r<0.9RApis reported in the present work to remove the effect of spuriousvectors near the domain’s boundaries due to laser light reflec-tions. The total number of velocity vectors acquired across the AIPwithin r< 0.9RAip is approximately 1800. Bias errors due to mis-alignment between the light sheet and the calibration plate weremitigated with an iterative disparity correction embedded ontoLaVision’s DaVis 8.3 software and previously reported by Wieneke[40]. The uncertainty on the velocity components has been esti-mated by means of the method described by Raffel et al. [28],which accounts for the effect of the particle image displacement,particle image diameter, particle density in the interrogation win-dow, image quantization levels, particle displacement gradient andbackground noise. The uncertainty of the calibration polynomi-als was considered, and the estimated uncertainty for the three-dimensional, reconstructed velocity vector was 2.6% of the area-average, time-averaged w-velocity at the AIP. 2.3. Proper orthogonal decomposition Proper Orthogonal Decomposition (POD) [3] enables the iden-tification of the flowfield coherent structures, and has been pre-viously applied across a wide range of aerodynamic applicationsincluding backward-facing steps [22,23], curved pipes [18,17] andmore recently S-ducts [16,26,13,14]. The POD of the unsteady ve-locity vector field V'=V-(V) identifies an orthonormal set ofbases d;={",y,dw}, which are referred to as POD modesand are invariant with time. Each POD mode is associated with atemporal coefficient ai(t), and the contribution to the original un-steady velocity field from each POD structure is ai(t)j. Therefore,the POD enables a low dimensional representation of the originalflow field using the first k-modal contributions V1-k (Eq.(1))[3].The variance of each temporal coefficient (a-) represents the con-tribution of each POD structure to the area-averaged mean TKE(Eq. (2)), and the POD modes are ordered by its associated TKEcontribution. The POD low-dimensional representation (Eq.(1)) isthen optimal since it maximizes the TKE in the reconstructed flow-field for a given number of k terms in the series [25]. 2.4. Swirl distortion descriptors In order to characterize and quantify the distortion patternspresented to the engine front face, a number of swirl distortiondescriptors was previously developed [30]. In this definition, theAIP is divided into several radial rings and the swirl descrip-tors are evaluated at each radial position based on the ring swirlangle distribution for each flow snapshot. A sample twice-per-revolution swirl pattern is shown in Fig. 2 illustrating the defi-nitions of the swirl distortion descriptors. The swirl angle is posi-tive in the counterclockwise direction when the AIP is consideredfrom downstream. Positive and negative circumferential extents,o and 0define the size of the k-th swirling region in the Fig. 2. Twice-per-revolution swirl distortion pattern [30]. i-th ring. Positive and negative sector swirls Ss and Ss aredefined as the mean swirl-angle value in each of the m swirlingregions [30]. Sector swirl and extents are used as the foundation for thedevelopment of a range of swirl descriptors used to quantify thenature and strength of the swirl distortion. Swirl intensity (SI) re-flects the averaged absolute swirl angle in each radial ring (Eq. (3)).Swirl directivity (SD) shows the overall sense of rotation of theswirling flow (Eq. (4)) and Swirl Pairs (SP) indicates the number ofswirl pairs relative to the swirl region in the ring which enclosesthe highest absolute swirl angle content, max(SSk,ISS)(Eq. (5)). The descriptors are typically evaluated at five equal arearings that makes it consistent with common industrial practicebased on the topology of conventional pressure probes that areused distortion patterns [30]. At each ring, 72 equi-spaced circum-ferential points are considered, which results in a resolution of5 deg. The S-PIV data is linearly interpolated at those locationsusing the Delaunay triangulation method [24]. It is possible to characterise the unsteady swirl distortion pat-terns with both SP and SD as parts of a common cloud map aspreviously shown by Gil-Prieto et al. [14] and Zachos et al. [41].These maps indicate the range and trend between the descriptors,and can be used as an illustration of the AIP distorted flow topolo-gies at any instantaneous snapshot that can oscillate across a rangebetween negative or positive bulk swirl (Fig. 3). If the relative fre-quency of occurrence of the events in different regions of the mapis included, the characterization of the distortion patterns wouldinclude the distinction between the rare and common events. Forthis work, the distortion maps include this probabilistic aspectwhereby the joint Probability Density Function (join-PDF) for thetwo descriptors is represented. For the evaluation of the joint-PDF,the range of each descriptor has been discretized in 60 equi-spacedpartitions. This results in a resolution of approximately 0.03 for SPand SD. The probability to identify the distorted pattern within agiven region of this SP-SD map is obtained by integration of thePDF over the desired area (Eq. (6)). Swirl Directivity (SD) Fig.3. One-per-revolution bulk-to-twin swirl switching path [13]. SPB SDBP(SDA ≤ SD 1.5 (Fig. 13e, f, g, h). For the low-offset S-duct with H/L=0.27 at Mref=0.60 theswirl directivity also appears to be governed by the switchingmechanism as it shows a distinct frequency at St=0.32 at allradii except the inner-most one (Fig. 14a, b, c,d). Note that at theinner-most radial position r/RAIP=0.32 the spectrum of the SDiis significantly more broadband and shows no distinct frequencies(Fig.14a). The main contributions of the swirl intensity (SIi) signalacross all radii are contained within approximately St <1.0 and anoticeable cut-off occurs at higher frequencies (Fig. 14e, f, g, h).The swirl descriptor behavior was found to be similar at the lowinlet Mach number data (Mref=0.27) confirming the weak impactof the inlet Mach number on the unsteady aerodynamics of thetwo S-duct considered. 4. Conclusions This work shows the first application of TR-SPIV for the mea-surement of the distorted, three-component velocity field at theAIP of convoluted aero-engine intakes with high spatial and tem-poral resolution. Compared to conventional unsteady total-pressuremeasurements, TR-SPIV provides about 45 times more measure- ment points, and enables the synchronous assessment of the in-plane and out-of-plane flow features in the frequency domain.These characteristics make TR-SPIV an attractive approach to quan-tify and characterize these complex flow fields. The main frequencies of the flow field within the two intakeconfigurations were found to be lower than St=1.2, and thereforewithin the estimated critical frequency range St < Stcrit to whicha typical aero-engine fan is expected to respond (Stcrit has beenestimated across a range between 0.9 and 5.4). Therefore, the as-sociated perturbations can potentially have a destabilizing effecton the engine. The spectral and POD analyses showed that themain source of unsteadiness was the swirl switching mechanism.The swirl switching comprises the alternate dominance of one ofthe AIP Dean vortices, with a concomitant lateral oscillation of themain loss region, which follows the movement of the dominantvortex. The oscillation of the main loss region and the switchingbetween the clockwise and counter-clockwise vortices occurs at afundamental frequency of St=0.42 and 0.32 for the high and lowoffset ducts at Mref=0.60. This is also reflected in the SDi spectraof both ducts which indicate that the swirl directivity oscillationsare driven by these flow features.Another significant source of un-steadiness for both ducts was a vertical oscillation of the main loss Duct-1 (H/L=0.49),Mrer=0.60 0.06 Fig. 13. Power spectrum of the SD and Sl; swirl distortion metrics across a range of radial positions, where i=1,2,3,4 correspond to r/Rap =0.32, 0.55, 0.71, 0.84. The Duct-2 (H/L=0.27), Mrer=0.60 region around the center of the AIP, promoted by the unsteadinessofthe shear layer and associated with a more broadband spectrum.For the low offset duct at Mref=0.60, important contributions tothis flow feature were observed between St =0.26-1.0. For thehigh offset duct at Mref=0.60, this vertical perturbation showedcontributions mainly between St=0.6 and 1.0. These fundamen-tal frequencies of the velocity field were also reflected on the swirlintensity (SIi) temporal behavior, which represents an indicator ofpotential engine instabilities. For example, the maximum unsteadylevels of swirl distortion were found to be approximately 5-timesgreater than the time-averaged values. The inlet Mach number hadonly a minor impact on the flow field spectrum and main flowfeatures across the investigated range between Min =0.27 and 0.6,which is a representative operating regime for a subsonic intake. Overall, the main frequencies and the associated coherent struc-tures of the distorted flow field in two S-shaped intakes have beenquantified. The effect of the S-duct centerline offset and Machnumber on the unsteadiness distribution and spectral content wereshown. Compared with conventional unsteady total-pressure mea-surements, TR-SPIV offers a greater spatial resolution and the pos-sibility to discern between in- and out-of-plane flow features,which is of major importance to understand the unsteady flowfield structures that are delivered to the aero-engine fan. Conflict of interest statement No conflict of interested declared. References ( [ 1 ] B.H. Anderson, D .R. R eddy, K . K apoor, Study o n computing sep a rating flo w s within a d i ffusion i n let S - duct, J . P ropuls. Power 10 (5) (1 9 94) 661 - 667, https :// doi.o rg/ 10.2514/ 3 .23777. ) ( [2] T . M. B erens, A . L . Delot, M. C h evalier, J . V an M u ijden, Nu m eric a l s i mula t ions for h igh offset intake diffuser flows , in : 5 2 n d AIAA A erospace Sciences M e eting - A IAA SciTech 2 014, N ational Harbor, Maryland, USA, 2014, AIAA 2 014-0371. ) ( [3] G. B erkooz, P. Holmes, J.L. Lumley, The proper orthogonal de c omposition in t h e a nalysis of turbulent flows, Annu. Rev. Fluid Mech.25 (1993) 5 3 9-575, ht tps:// doi.org/10.1146/annurev.fl.2 5 ,010193.002543 . ) ( [4] D .N. Bowditch, R . E. C o ltrin, A Survey of I n let/Engine D istortion Co m patibil i ty, N ASA TM- 8 3421 , 1 983. ) [5] T. Breuer, N.C. Bissinger, Basic Principles: Gas Turbine Compatibility - Gas Tur-bine Aspects. Encyclopedia of Aerospace Engineering, 2010. [6] W.T. Cousins, History, philosophy, physics and future directions of aircraftpropulsion system/inlet integration, in: Proceedings of ASME Turbo Expo 2004:Power for Land, Sea, and Air, vol. 2, 2004, pp. 305-320, GT2004-54210. [7] W.R. Dean, Note on the motion of fluid in a curved pipe, Lond. Edinb.Dublin Philos. Mag. J. Sci. 4 (20) (1927) 208-223, https://doi.org/10.1080/14786440708564324. ( [8] A.-L . Delot, E . Garnier , D. Pagan, F low control in a h i g h-offset su b sonic air in- t ak e , in: 47th AIAA/AS M E /S AE/ASEE J o int P ropulsion C o nfer e n c e & E xhibi t , SanDie g o,California, 2011, A I AA 2011- 5 569. ) ( [ 9] C. Fiola, R.K. Agarwal, Simulation o f secondary and se p arated flo w in diffus- i ng S -ducts, J. Propuls. Power 3 1 ( 1)(2015) 1 8 0-191, ht t ps : // d oi.org/10.2514/1.B35275 . ) ( [10] R .V. Florea, C. Matalanis, L.W. Hardin, M . S tucky, A . Shabbir, P arametric anal- y sis and d esign f or e mbedded en g ine inl e ts, J. Propuls. P ower 31 (3 ) (2015) 8 43-850, h t tps:/ / doi.org/10.2514/1. B 34804. ) ( [1 1 ] G. Gan, X. Zhang, Design optimization o f a three-dimensional d iffusing S-duct using a modified S S T t u rbulence model, Aerosp. Sci. Technol. 6 3 (2 0 17) 63-72, h ttps://doi . org / 10.1016/j.ast.20 1 6.12.016. ) ( [12] E . Garnier, Flow c ontrol b y pulsed j e t i n a c u rved S-duct: a sp e ctral an a lysis, A IAA J. 53 (10)(2015)2 8 13 - 2827, ht t ps:/ / doi. o rg/ 1 0.2514/1J053 4 22. ) ( [1 3 ] D . Gil-Prieto, D.G. MacManus, P . K. Z achos, G. Tanguy, K.R. Menzies, Convoluted i ntake distortion measurements using s t ereo particle i mage velocimetry, A IAA J . 5 5(6) (2017) 1 8 78-1892, htt ps://do i .org/10.2514/1.J055467. ) ( [ 1 4] D . Gil-Prieto, D.G. MacManus, P . K.Z a chos, G. Ta n guy, F. W i lson, N. Chiereghin, Delayed d etached-eddy simulation an d par t icle im a ge vel o cimetry investiga- tion o f S -duct f low d i stortion, A IAA J . 55 ( 6 ) ( 2 017)18 9 3 -1908, http s :// d oi.org/ 1 0.2514/ 1 .J055468. ) ( [15] D. Gil-Prieto , D.G.MacManus, P.K. Zachos, A. Bautista, Assessment methods for u nsteady f l ow d i stortion in a ero-engine i n takes, Aerosp. Sci. Technol. 72 ( 2018) 292-304, ht tps:/ /do i.org /10 .1016/j. ast .2017 . 10.029. ) ( [ 1 6] A.N. Gissen, B. Vukasinovic, A. Glezer, Dynamics of flow control in an em-ulated b oundary l a yer-ingesting offset d iffuser, Exp. Fluids 55 (1794) (2014) 1-19, h ttps :/ /doi.o r g/10 . 1007/s00348-014- 1 794-5. ) ( [ 1 7] L .H.O. H ellstrom, M.B. Z l atinov, G . C a o, A.J. Smits, T u rbulent pi p e flow dow n - s tream of a 9 0 ° b e nd, J.Fl u id Mech. 735 (R7 ) (20 1 3) 1-12 , http s ://doi.org/10. 1 01 7 /jfm.2013.534. ) ( [ 1 8] A . Kalpakli V ester, R. Orlu, P.H. Alfredsson, POD analysis of the turbulent f low downstream a mild an d sh a rp bend, Exp . Fluids 56 (3) (2015) 57, ht t ps : //doi . org/10.1007/s00348 - 0 1 5-1926-6. ) ( [ 1 9] R . T . Kawai, D . M . Fr i ed m an, L. Serrano , Blen d ed Wing B o dy ( B WB) Bou n dary L a yer Ingestion ( BLI) I n l et Configuration a nd System S t udies, N A SA Techni c al Report CR-2006-214534, 2 006. ) [20] H. Kim, M-S. Liou, Shape design optimization of embedded engine inlets forN2B hybrid wind-body configuration, Aerosp. Sci. Technol. 30 (2013) 128-149,https://doi.org/10.1016/j.ast.2013.07.011. ( [21] F . Knoth, C. B reitsampter, F low analysis of a helicopter engine side air intake, J . Propuls. Power 3 3 (5)( 2 017) 1230-1244, htt p s://doi. o rg/10. 2 514/1.B36285. ) ( 2 ] J . Kostas, J. Soria , M.S . Chong, Particle image velocimetry m e asurements of a backward-facing step flow, E xp. Fluids 33 (6)(2002) 838-853, h tt ps://doi. o r g/ 1 0.1007/s00348-002-0521-9. ) ( [ 2 3] J. Kostas , J. Sor i a, M . S. Chong, A compariso n between snapshot POD a nalysis o f P IV v elocity a nd vorticity d ata, Exp. F luids 3 8 ( 2) ( 2005) 1 4 6-160, ht t ps: / / doi.o r g/10.1007/s00348-004-0873-4. ) ( [ 24] D .T. L e e, B.J. Schachter, Two a lgorithms f o r c o nstructing a De l aunay tri a ngu- l ation, Int. J . Comput. Inf. Sci . 9 (3 ) (1980) 2 19-242, h t tps://doi.org/10.1 0 07/ B FO0977785. ) ( [25] J . L . Lumley, Stochastic Too l s i n Tu r bulence, Dover P ublications, I nc., New Y ork, USA, 2007, pp. 57 - 5 9 ( Chap. 3 ). ) ( [ 2 6] D .G.MacManus, N. C hiereghin, D. G il-Prieto, P.Za c hos, Co m plex aeroengine in- t ake d ucts and d y namic distortion, AIAA J. 55 (7) (2017) 2395-2409, http s: / / doi.o r g/10.2514/1.J054905 . ) ( [271 D . L . P a u l , J . L . You n ghans, I nlets and i nlet engine integration, in: G .C. O a tes (E d .), T he A erothermodynamics of Aircraft Gas Turbine Engines, U niversity of Wash- i ngton S eattle, 1978, Chap. 13, Report AFAPL T R 7 8 -5 2 . ) [28] M. Raffel, C. Willert, S. Wereley, J. Kompenhans, Particle Image Velocimetry:A Practical Guide, 2nd ed., Springer-Verlag, Berlin, 2007, pp. 164-176 (Chap. 5). [29] C. Reid, The Response of Axial Flow Compressors to Intake Flow Distortion,ASME 1969 Gas Turbine Conference and Products Show, Paper No. 69-GT-29,https://doi.org/10.1115/69-GT-29. [30] SSociety of Automotive Engineers, A Methodology for Assessing Inlet Swirl Dis-tortion, SAE Aerospace Information Report 5686, Warrendale, PA, USA, 2007. [31]Society of Automotive Engineers, Inlet Total-Pressure-Distortion Considerations for Gas-Turbine Engines, SAE AIR 1419c, Warrendale, PA, US, Nov. 2017. [32] A.J. Strazisar, J.R. Wood, M.D. Hathaway, K.L. Suder, Laser Anemometer Mea-surements in a Transonic Axial-Flow Fan Rotor, NASA Technical Paper 2879,1989. ( [ 3 3] G . Tanguy, D .G. MacManus, E. Ga r nier, P. G . Martin, Ch a racteristics of unsteady t otal pressure distortion for a complex a ero-engine intake, A erosp. S ci. Technol. 78 ( 2018)297-311, htt ps://d oi .org/ 10 . 10 1 6/ j .ast.2018 . 04.031. ) [34] J.R. Taylor, An Introduction to Error Analysis. The Study of Uncertainties inPhysical Measurements, 2nd ed., University Science Books, Sausalito, CA, USA,1997, pp.73-75 (Chap. 3). ( [35] T .D. Toge, A.M. Pradeer, E x perimental investigation of sta l l in c eption of a low s peed c o ntra r o tating a x ial f low fan under c i rcumferential di s torted fl o w con- dition, Aerosp. S ci. T echnol. 70 (2017) 534-548, htt ps: / /doi.or g /10.10 1 6/j.as t . 201 7 .08.041 . ) ( [36] M .J. T unstall, J.K . Harvey, On the effect of a shar p bend i n a f u lly d e veloped turbulent p ipe-flow, J. Fluid Mech. 34 (3)(1968) 59 5 -608, htt p s://d o i.or g /10. 1 01 7 /S0022112068002107. ) ( [ 3 7] P .D. Welch, The use of fast Fourier transform f or t he e stimation o f power s p ec- t ra: a method based o n time averaging ov e r sh o rt, modified pe r iodograms, IEE E T rans. Audio E lectroacoust. 15 (2) ( 1967) 70-73, h ttps://doi.org/10 .1 109/TAU. 1 967.1161901 . ) ( [ 3 8] S .R. Wellborn, B . A. Reichert, T.H. Okiishi, S tudy o f t h e compressible flo w in a d iffusing S -duct, AIAA J. P ropuls. P ower 10 (5) (1994) 668-675, http s://doi.org/ 10.2514 /3 .23778. ) ( [39] I L .M. W enzel, R . J. B laha, A nal y sis o f D ynamic I n le t D i stortion A p p l ied to a Par- allel Compressor M o del, NASA T M X -3 5 22. 1 977. ) [40] B. Wieneke, Stereo-PIV using self-calibration on particle images, Exp. Fluids39(2)(2005)267-280, https://doi.org/10.1007/s00348-005-0962-z. -Z.[41] P.K. Zachos, D.G. MacManus, D. Gil-Prieto, N. Chiereghin, Flow distortion mea-surements in convoluted aeroengine intakes, AIAA J. 54 (9) (2016) 2819-2832,https://doi.org/10.2514/1.J054904. The unsteady distorted flow fields generated within convoluted intakes can have a detrimental effect on the stability of an aero-engine. The frequency signature in the distorted flow field is of key importance to the engine’s response. In this work, time-resolved particle image velocimetry is used to obtain the three-component velocity field at the outlet plane of two S-duct intake configurations for a range of inlet Mach numbers. Proper orthogonal decomposition of the time-resolved velocity data allows the identification of the main frequencies and coherent structures in the flow. The most energetic unsteady structures comprise an in-plane vortex switching mode, associated with a lateral oscillation of the main loss region, and a vertical oscillation of the main loss region. The switching structure occurs at a frequency of St=0.42and 0.32 for the high and low offset ducts, respectively. The vertical perturbation is associated with a more broadband spectrum between approximately St=0.6–1.0and St=0.26–1.0for the high and low offset configurations, respectively. The determined frequencies for these main unsteady flow structures are within the range, which is expected to be detrimental to the operating stability of an aero-engine. The results provide a novel, time-resolved dataset of synchronous velocity measurements of high spatial resolution that enables analysis of the unsteady flows at the exit of complex aero-engine intakes.
确定
还剩13页未读,是否继续阅读?

产品配置单


北京欧兰科技发展有限公司为您提供《S型进气道中流动扰动的非稳定特性检测方案(CCD相机)》,该方案主要用于航空中流动扰动的非稳定特性检测,参考标准--,《S型进气道中流动扰动的非稳定特性检测方案(CCD相机)》用到的仪器有LaVision HighSpeedStar 高帧频相机、时间分辨粒子成像测速系统(TR-PIV)、LaVision DaVis 智能成像软件平台
推荐专场
CCD相机/影像CCD
更多


相关方案
更多
该厂商其他方案
更多