


采用LaVision公司独有的可以应用到大体积空间的时间分辨层析粒子成像测速技术(Time-resolved Tomographyic PIV)对沙漠蝗虫在风洞环境下的复杂空气动力学行为进行了研究。
方案详情

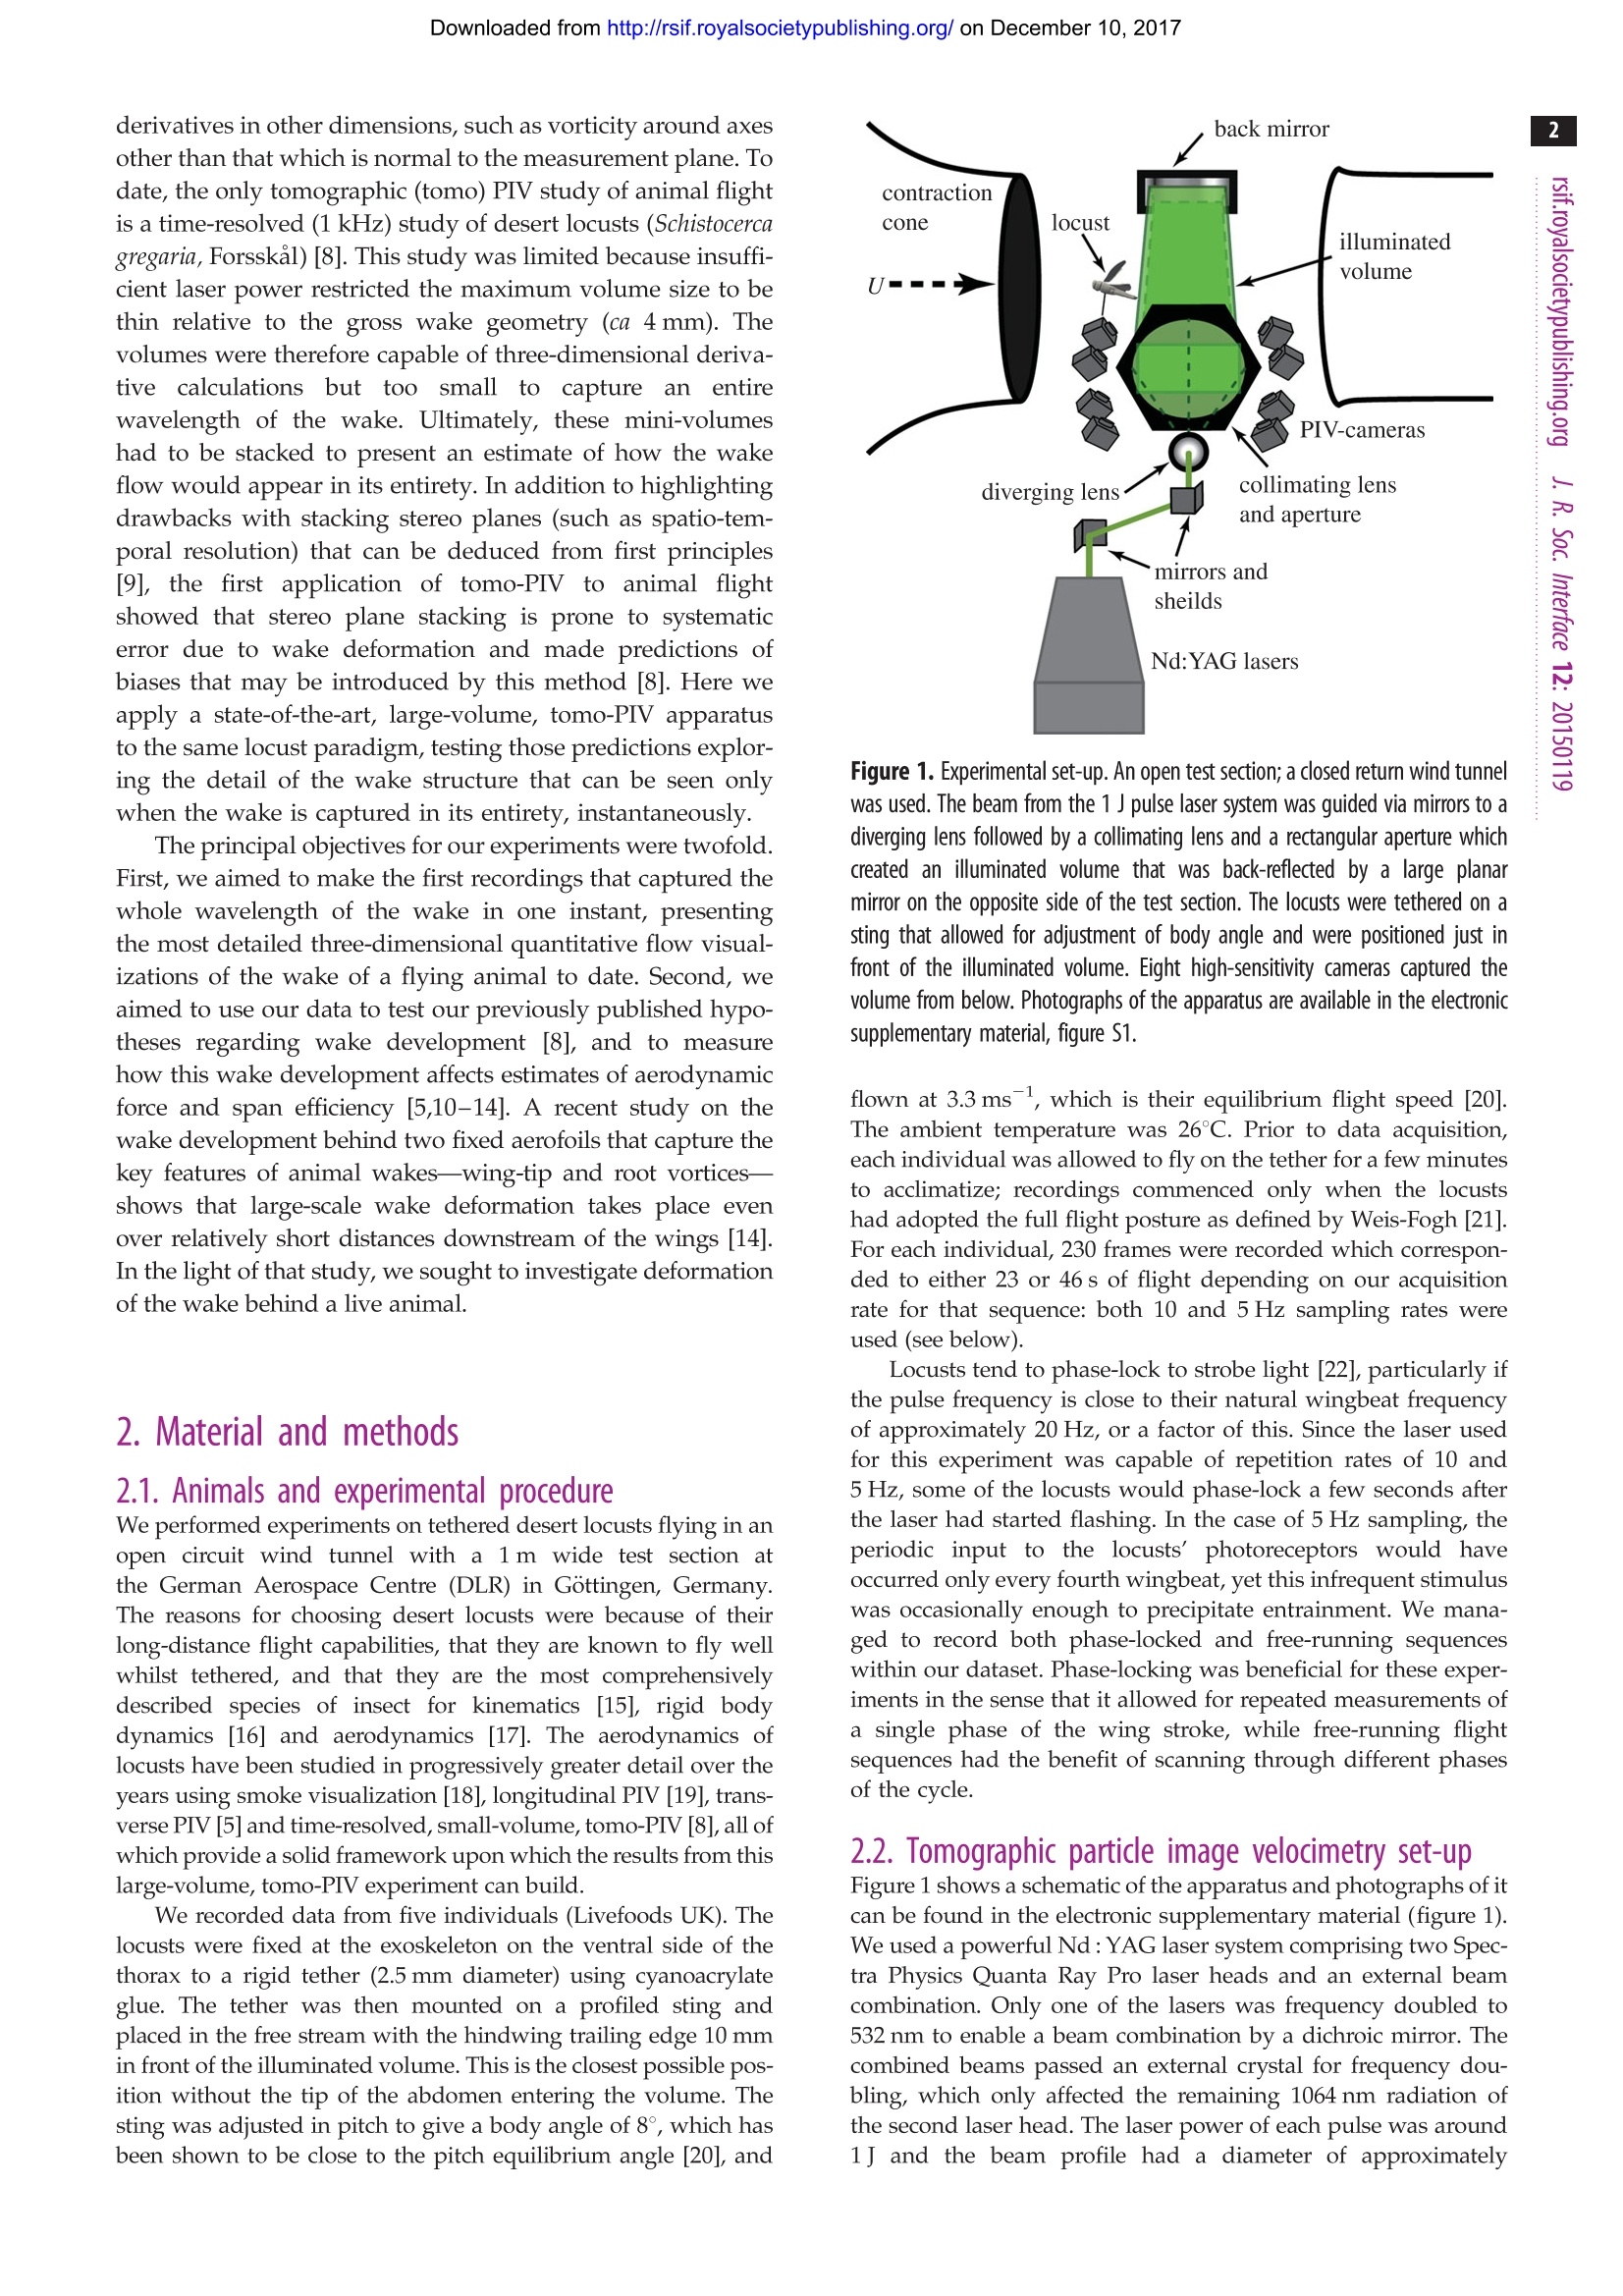
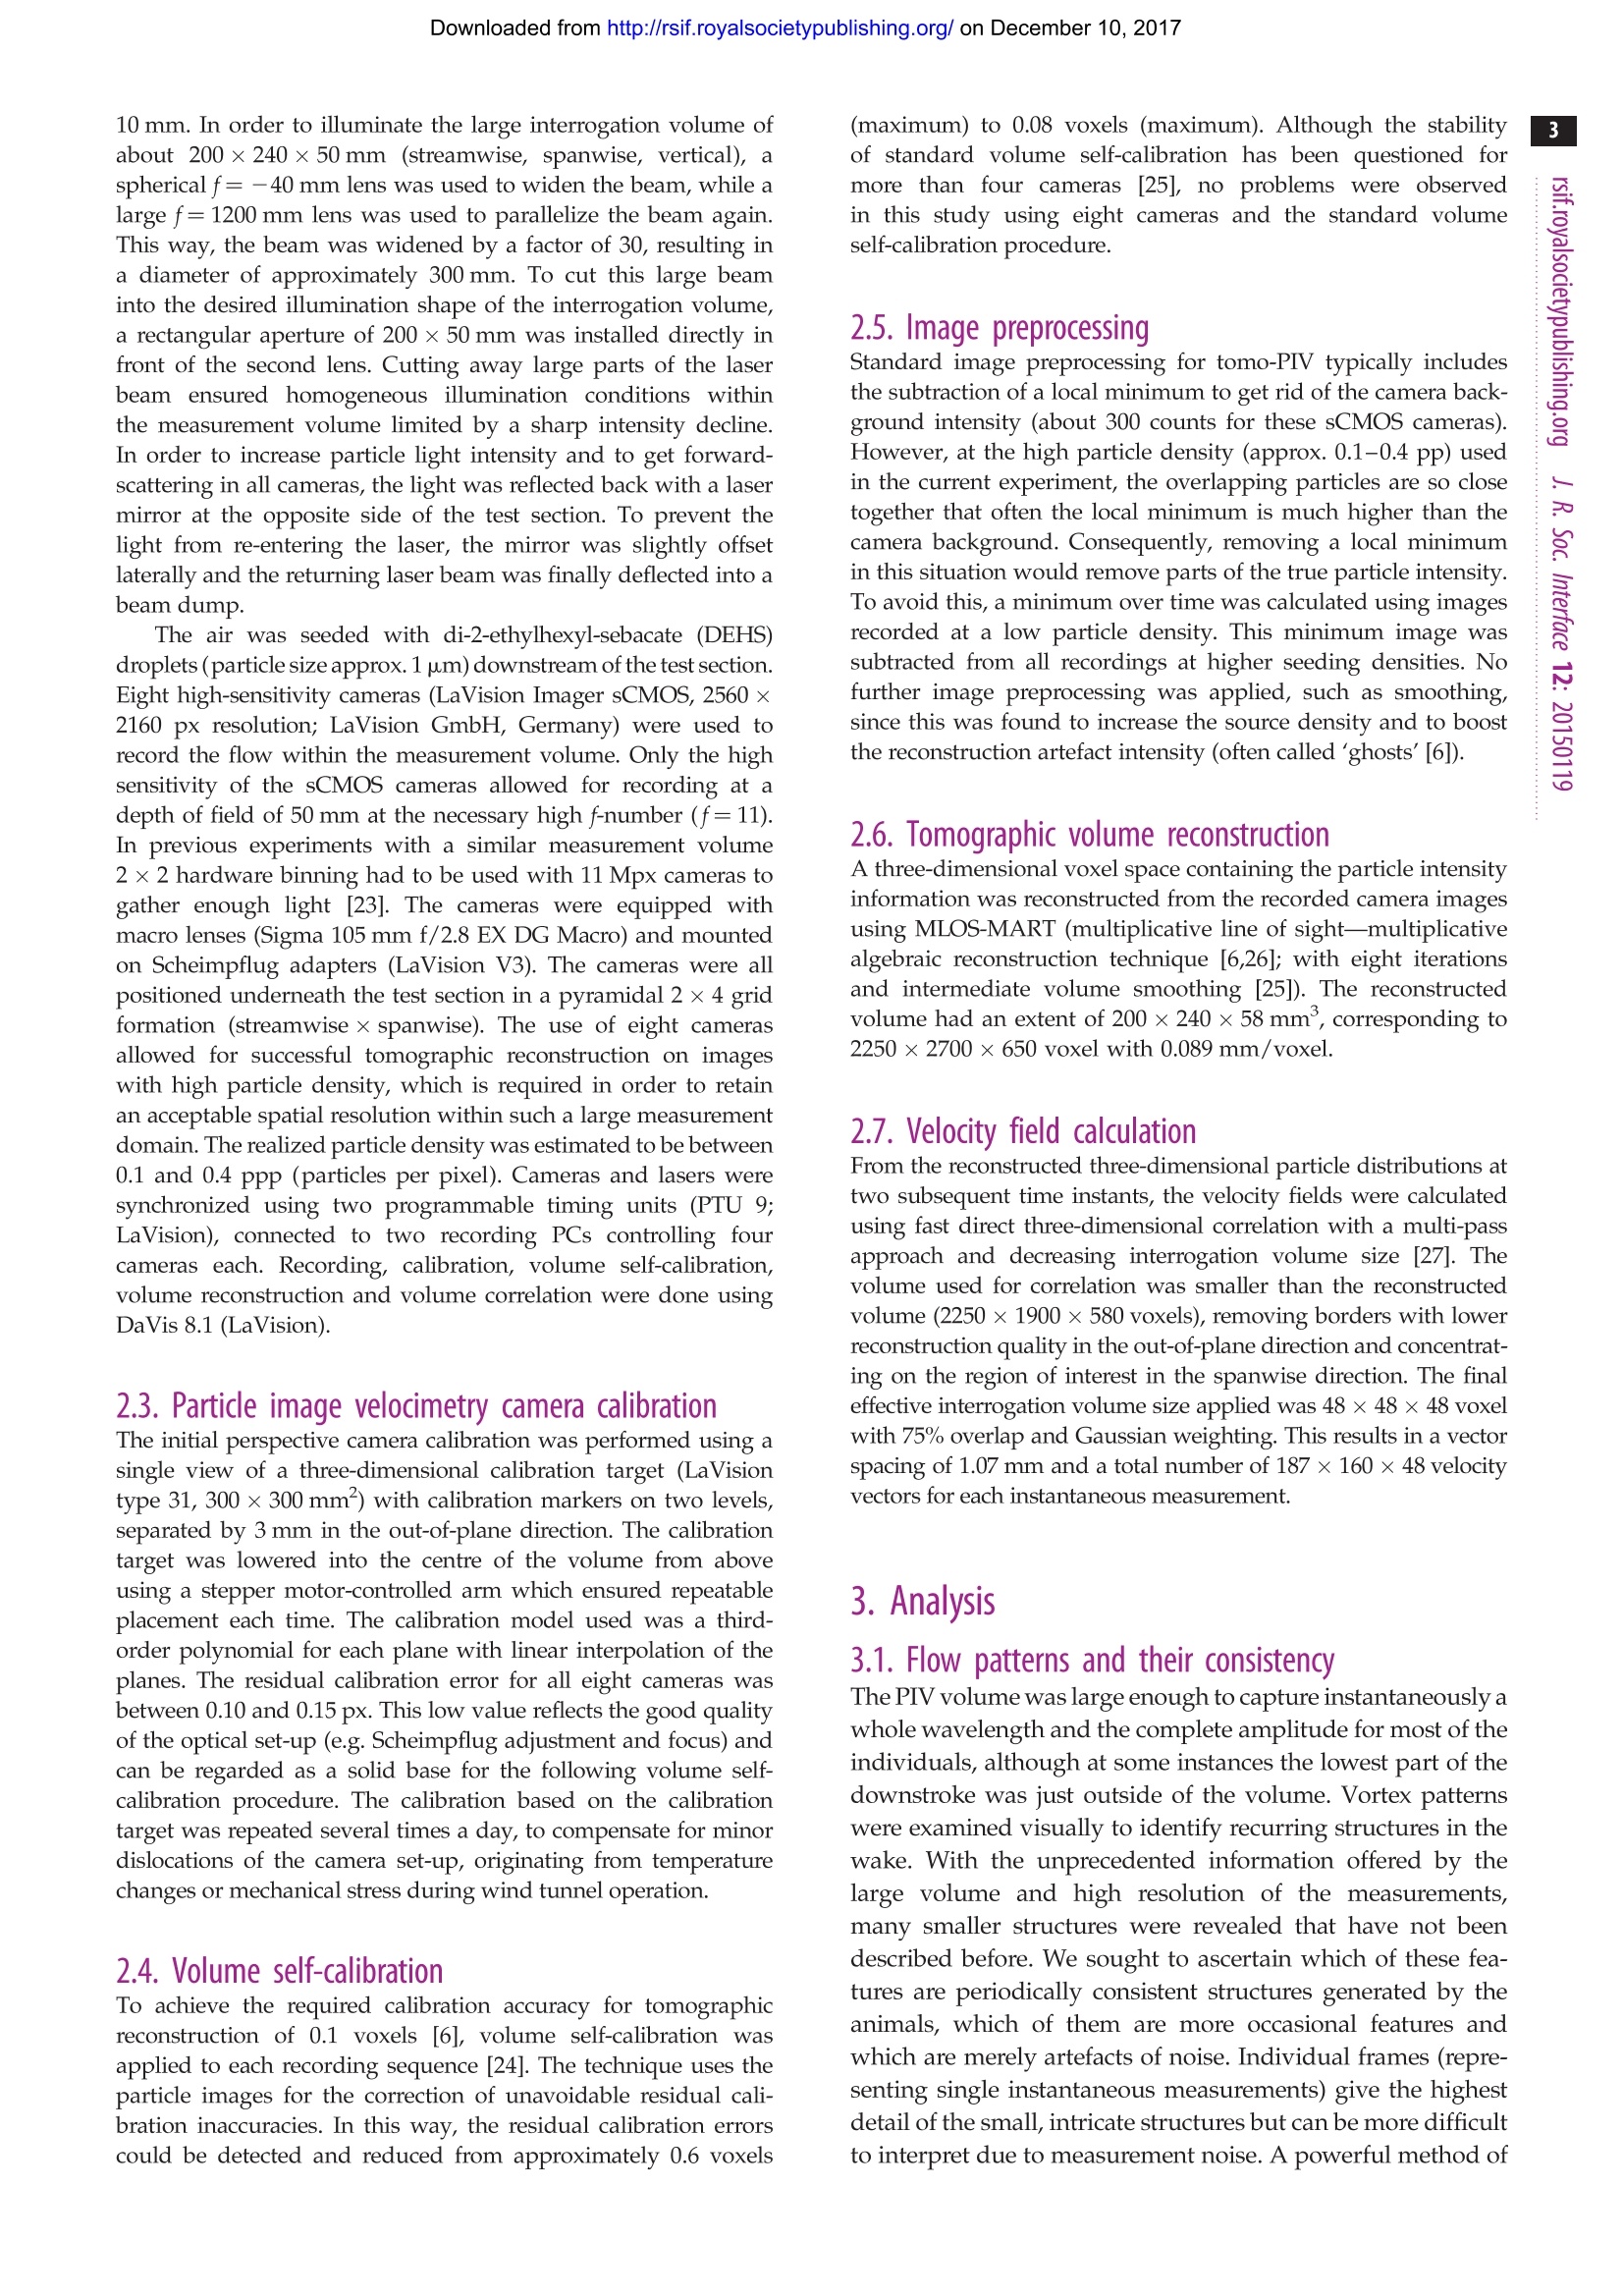
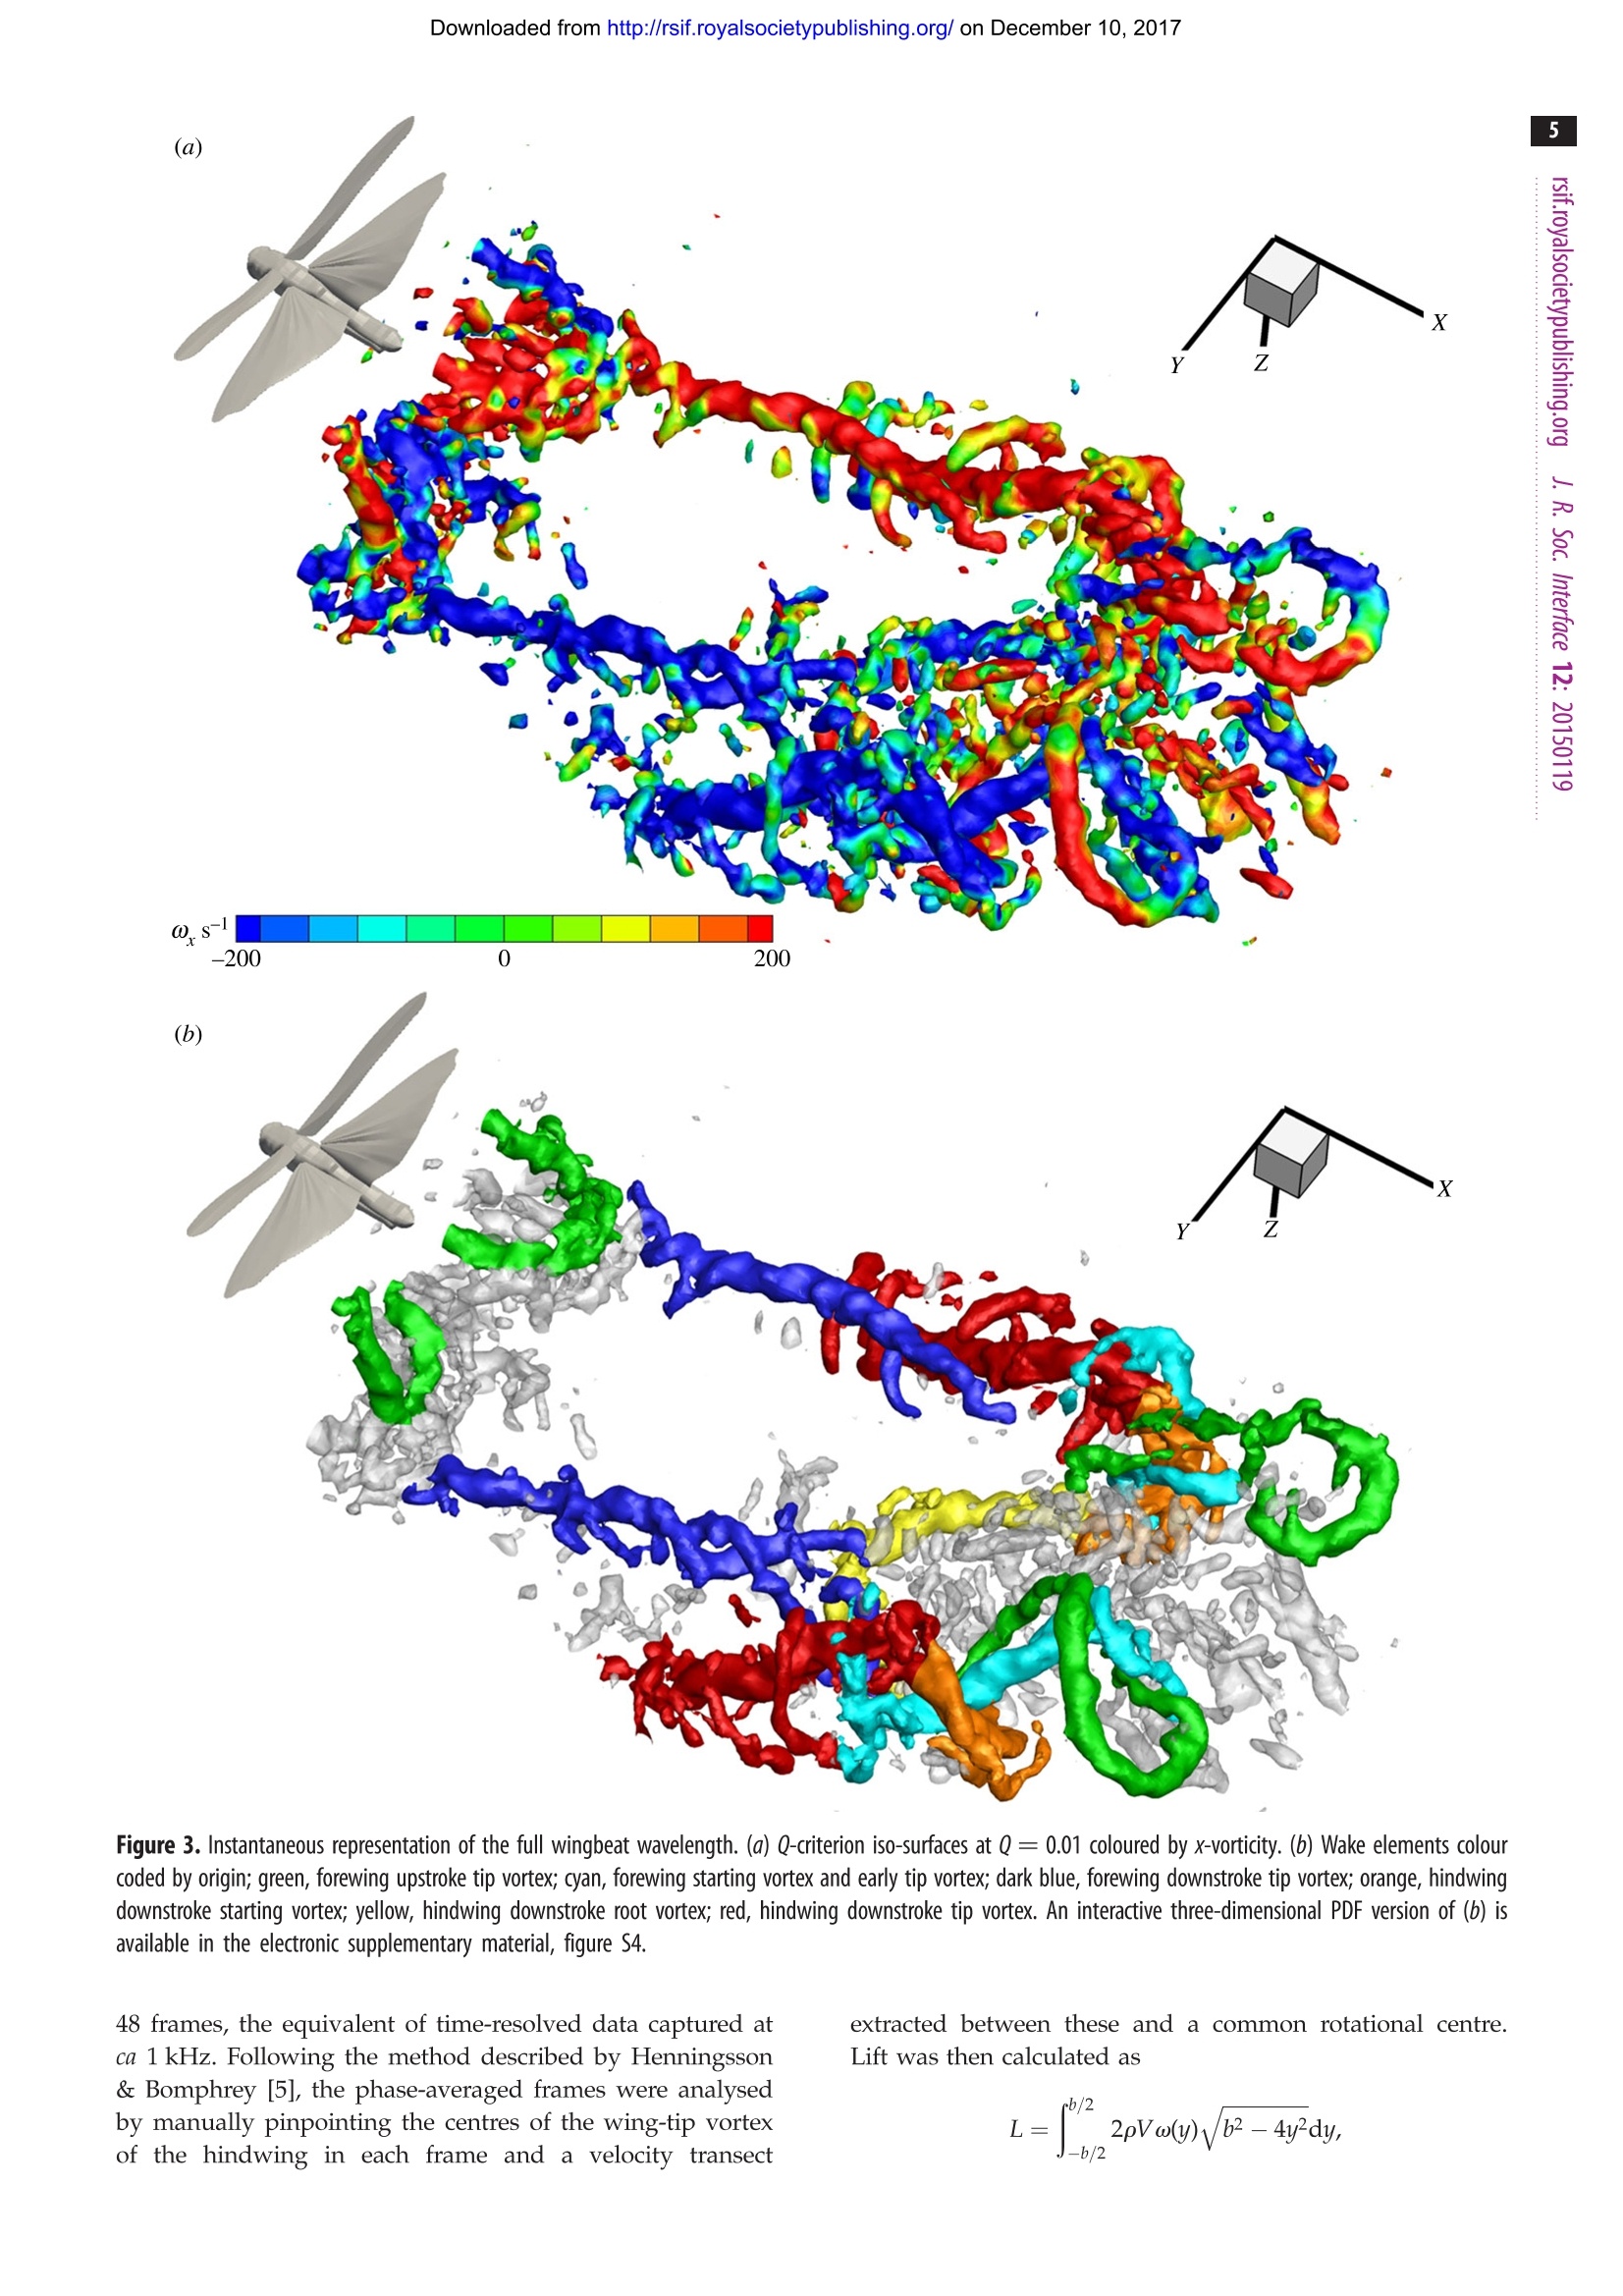
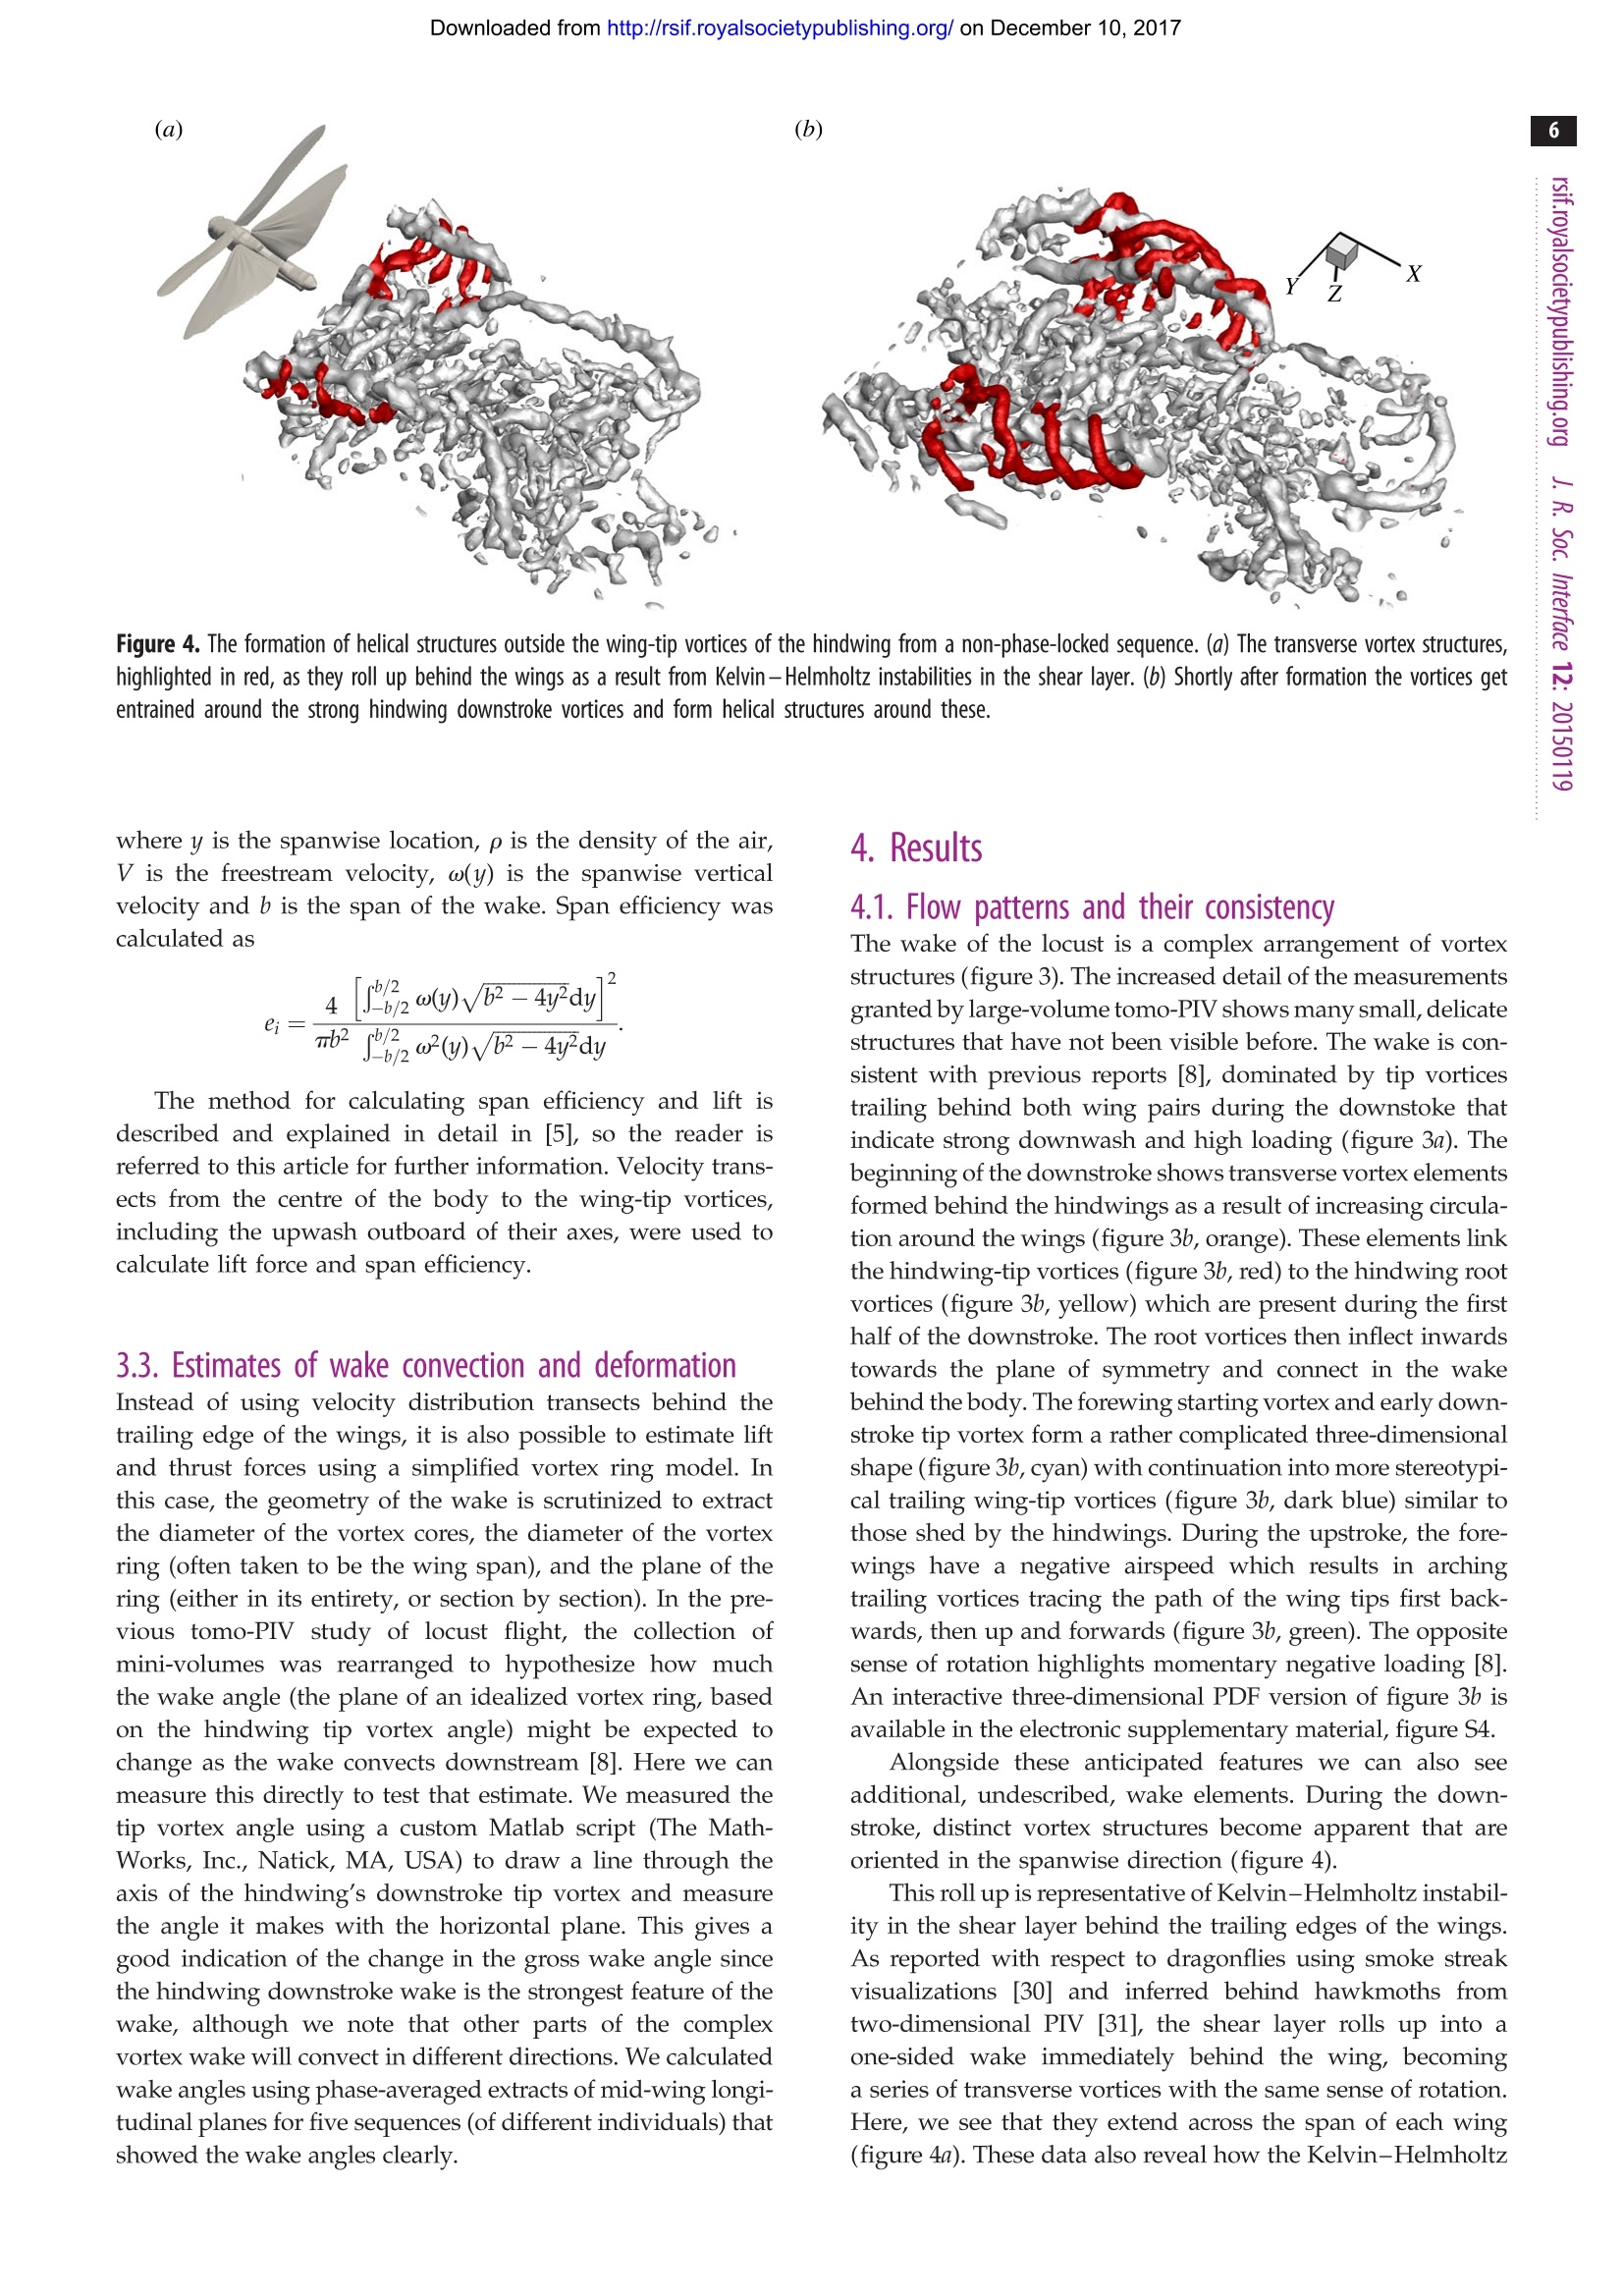
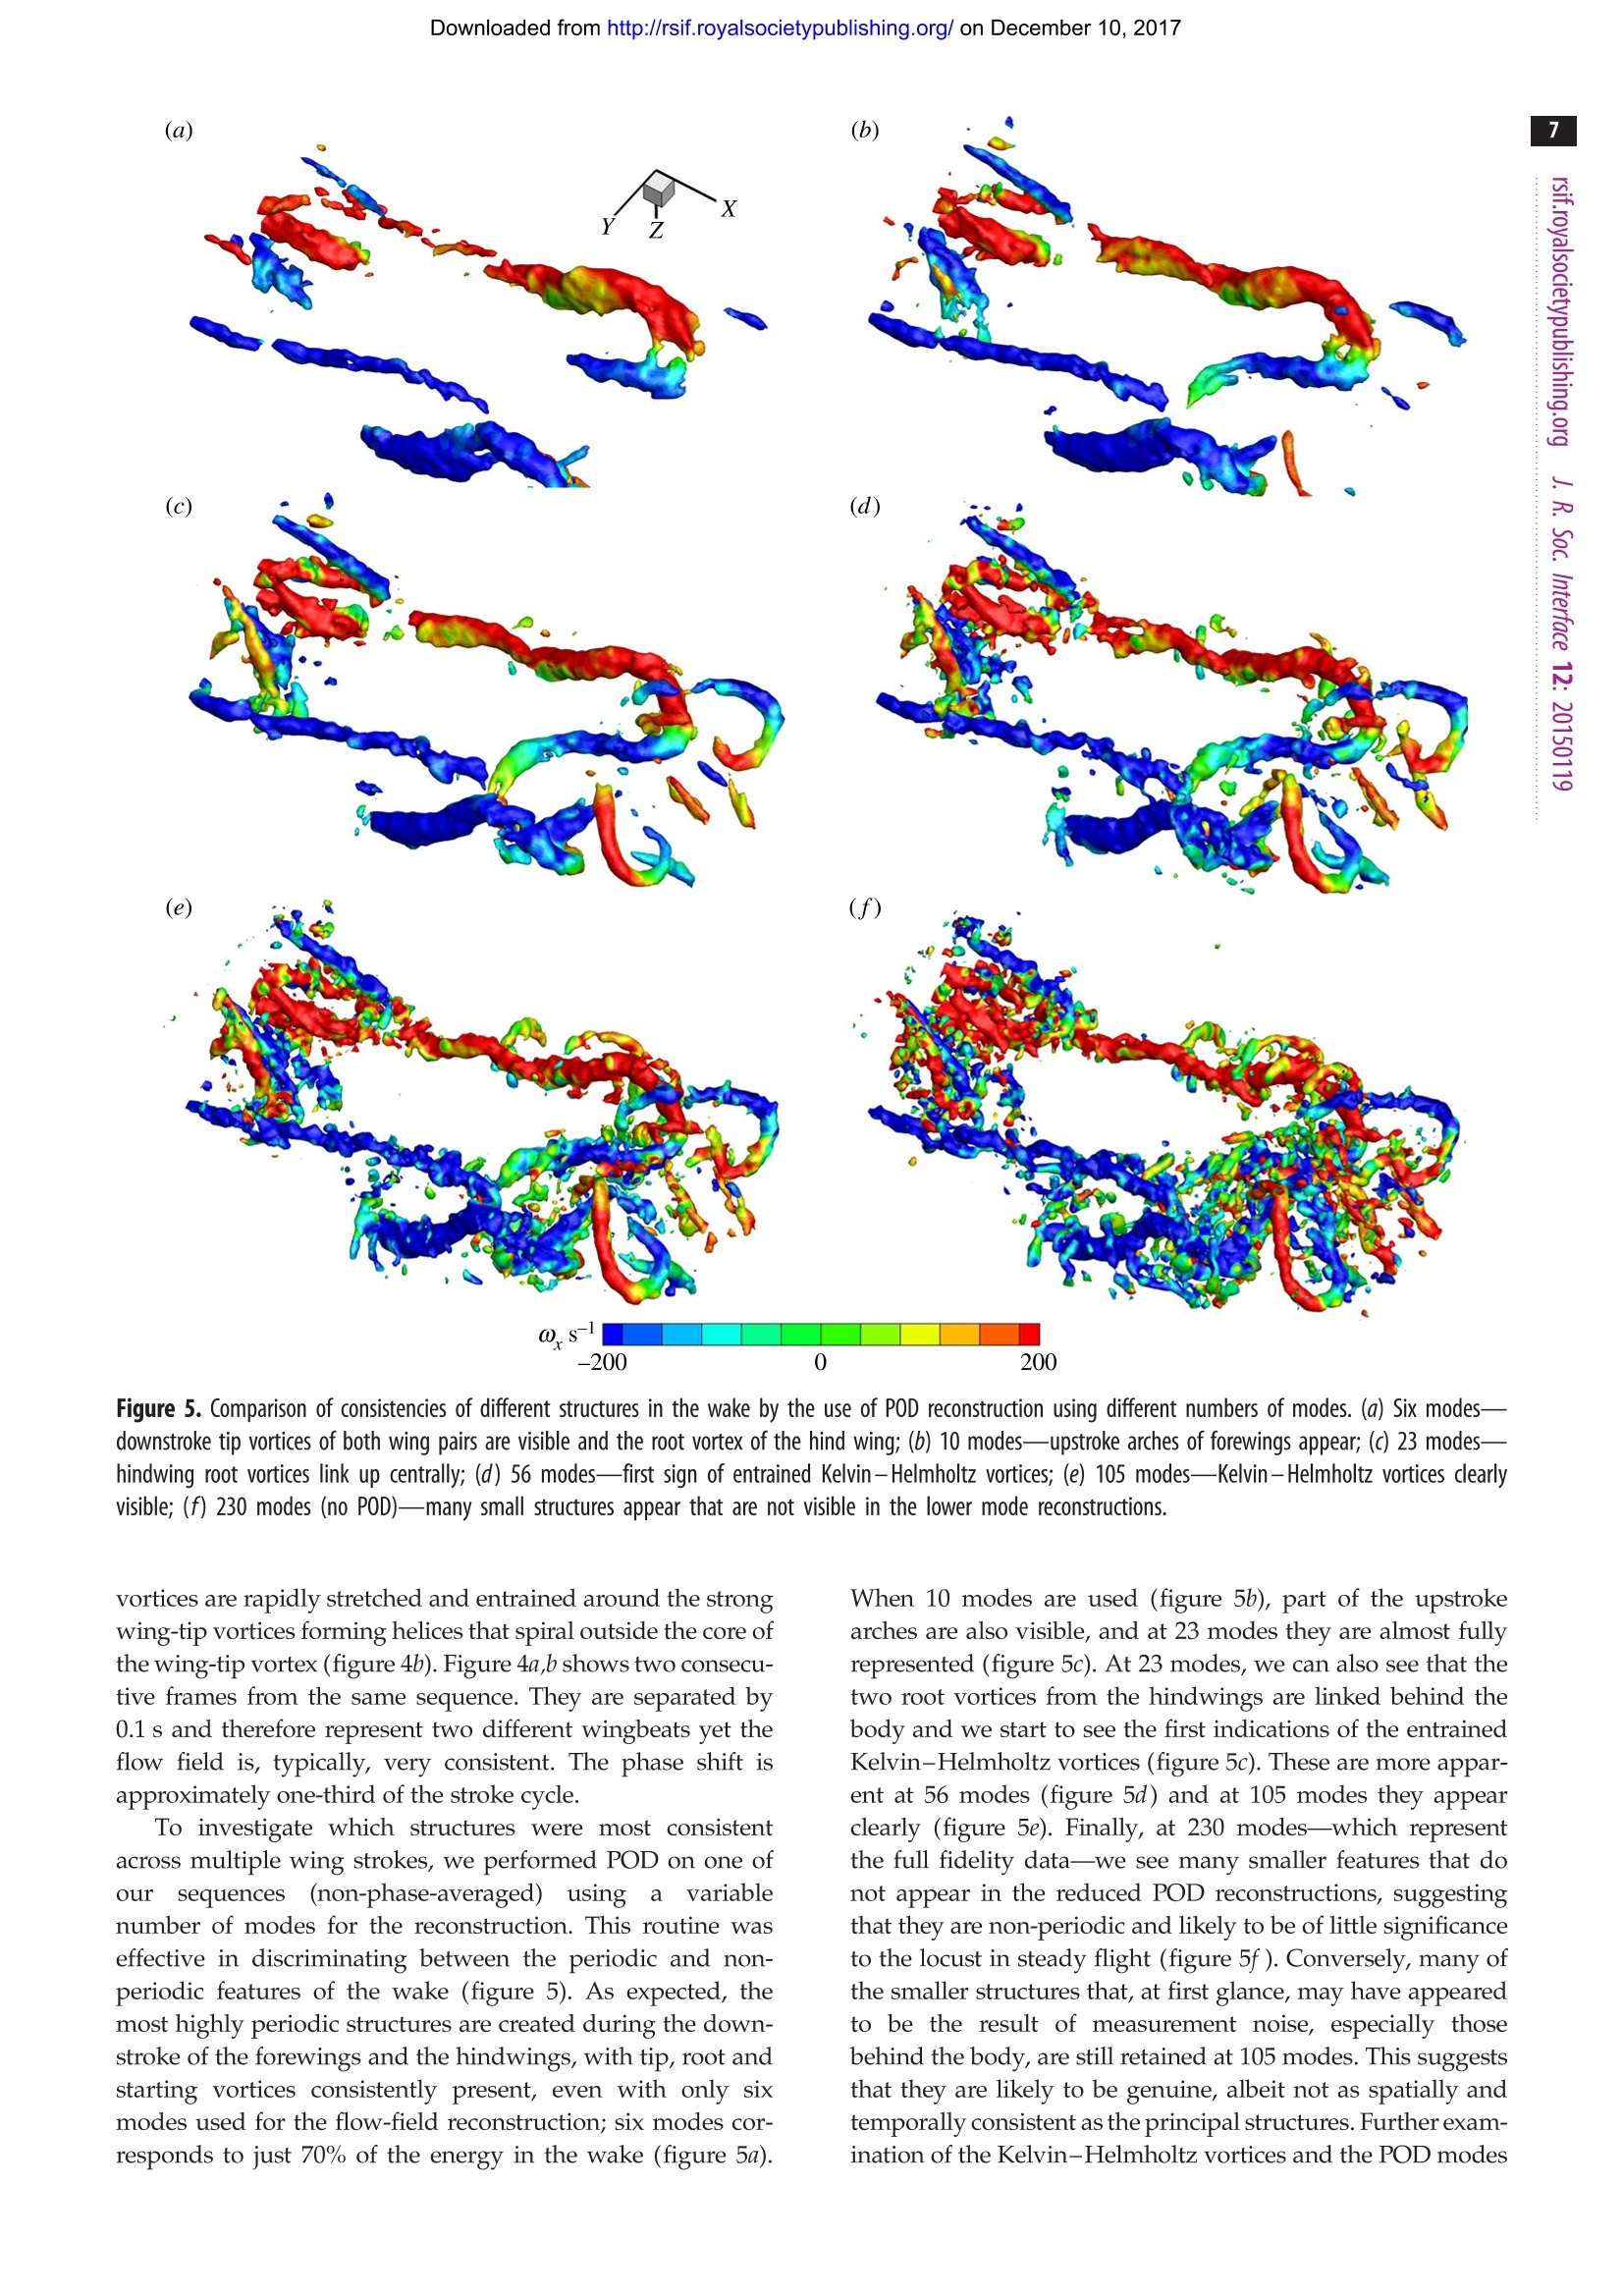
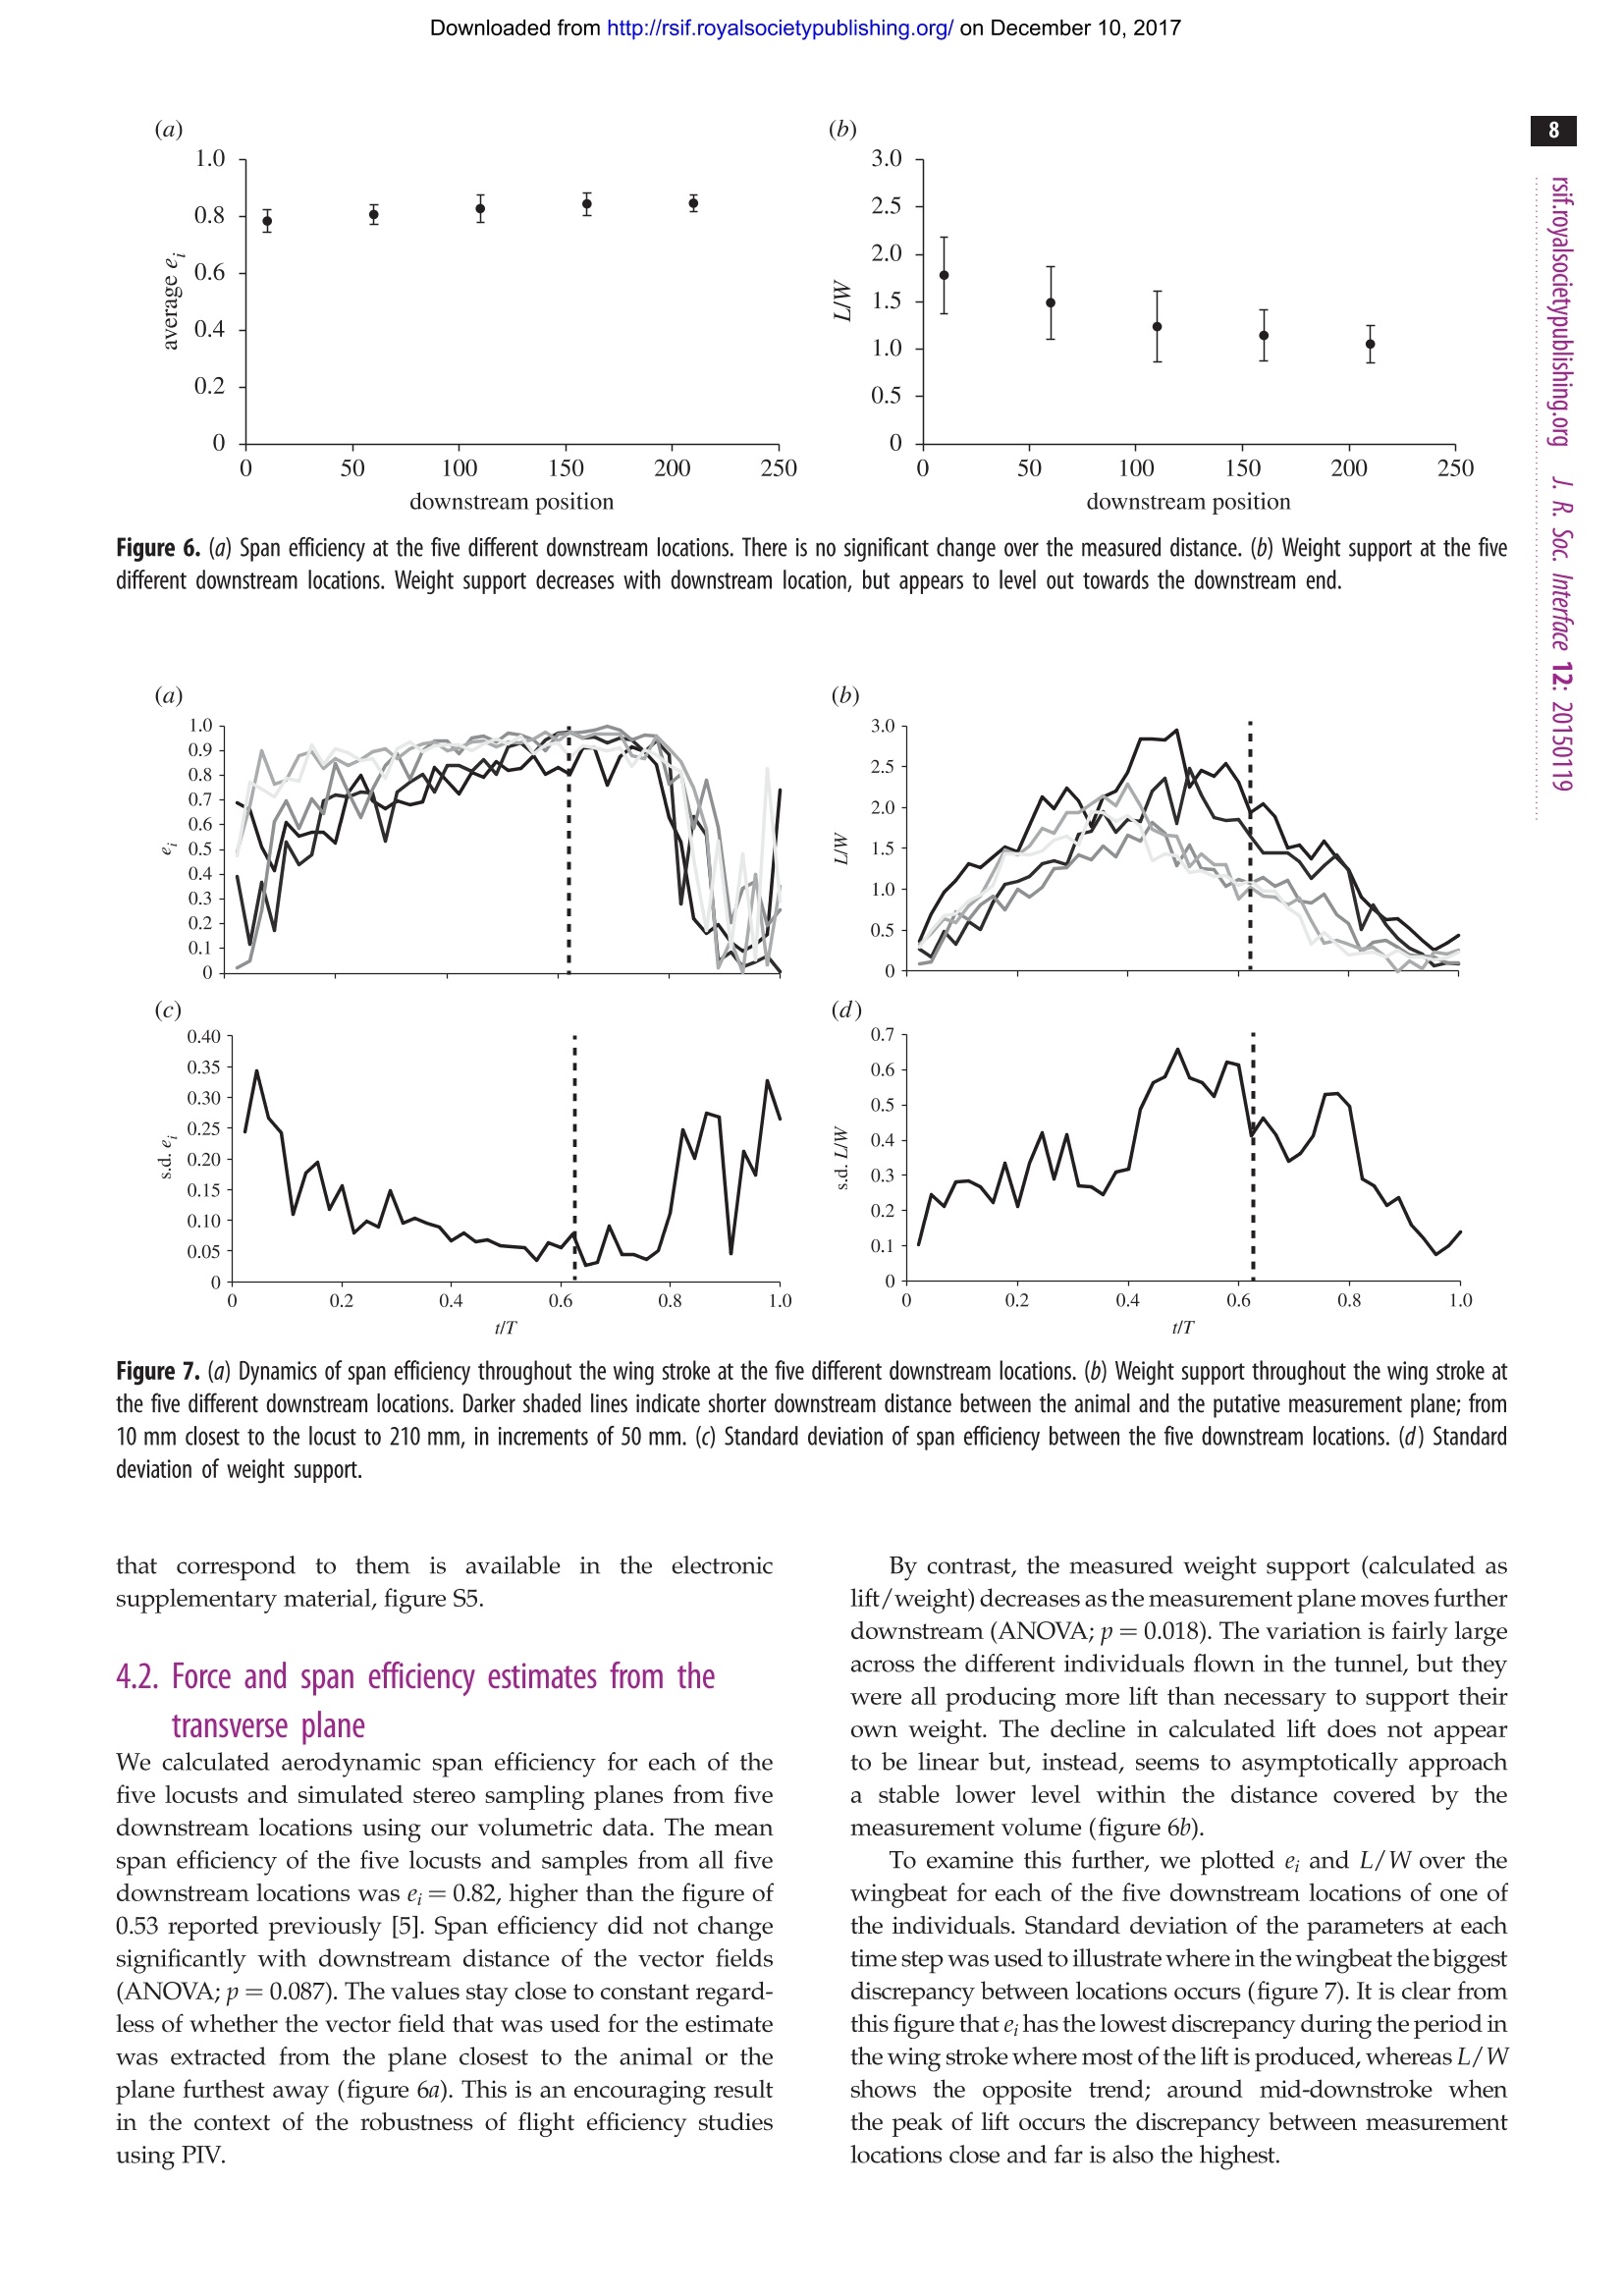
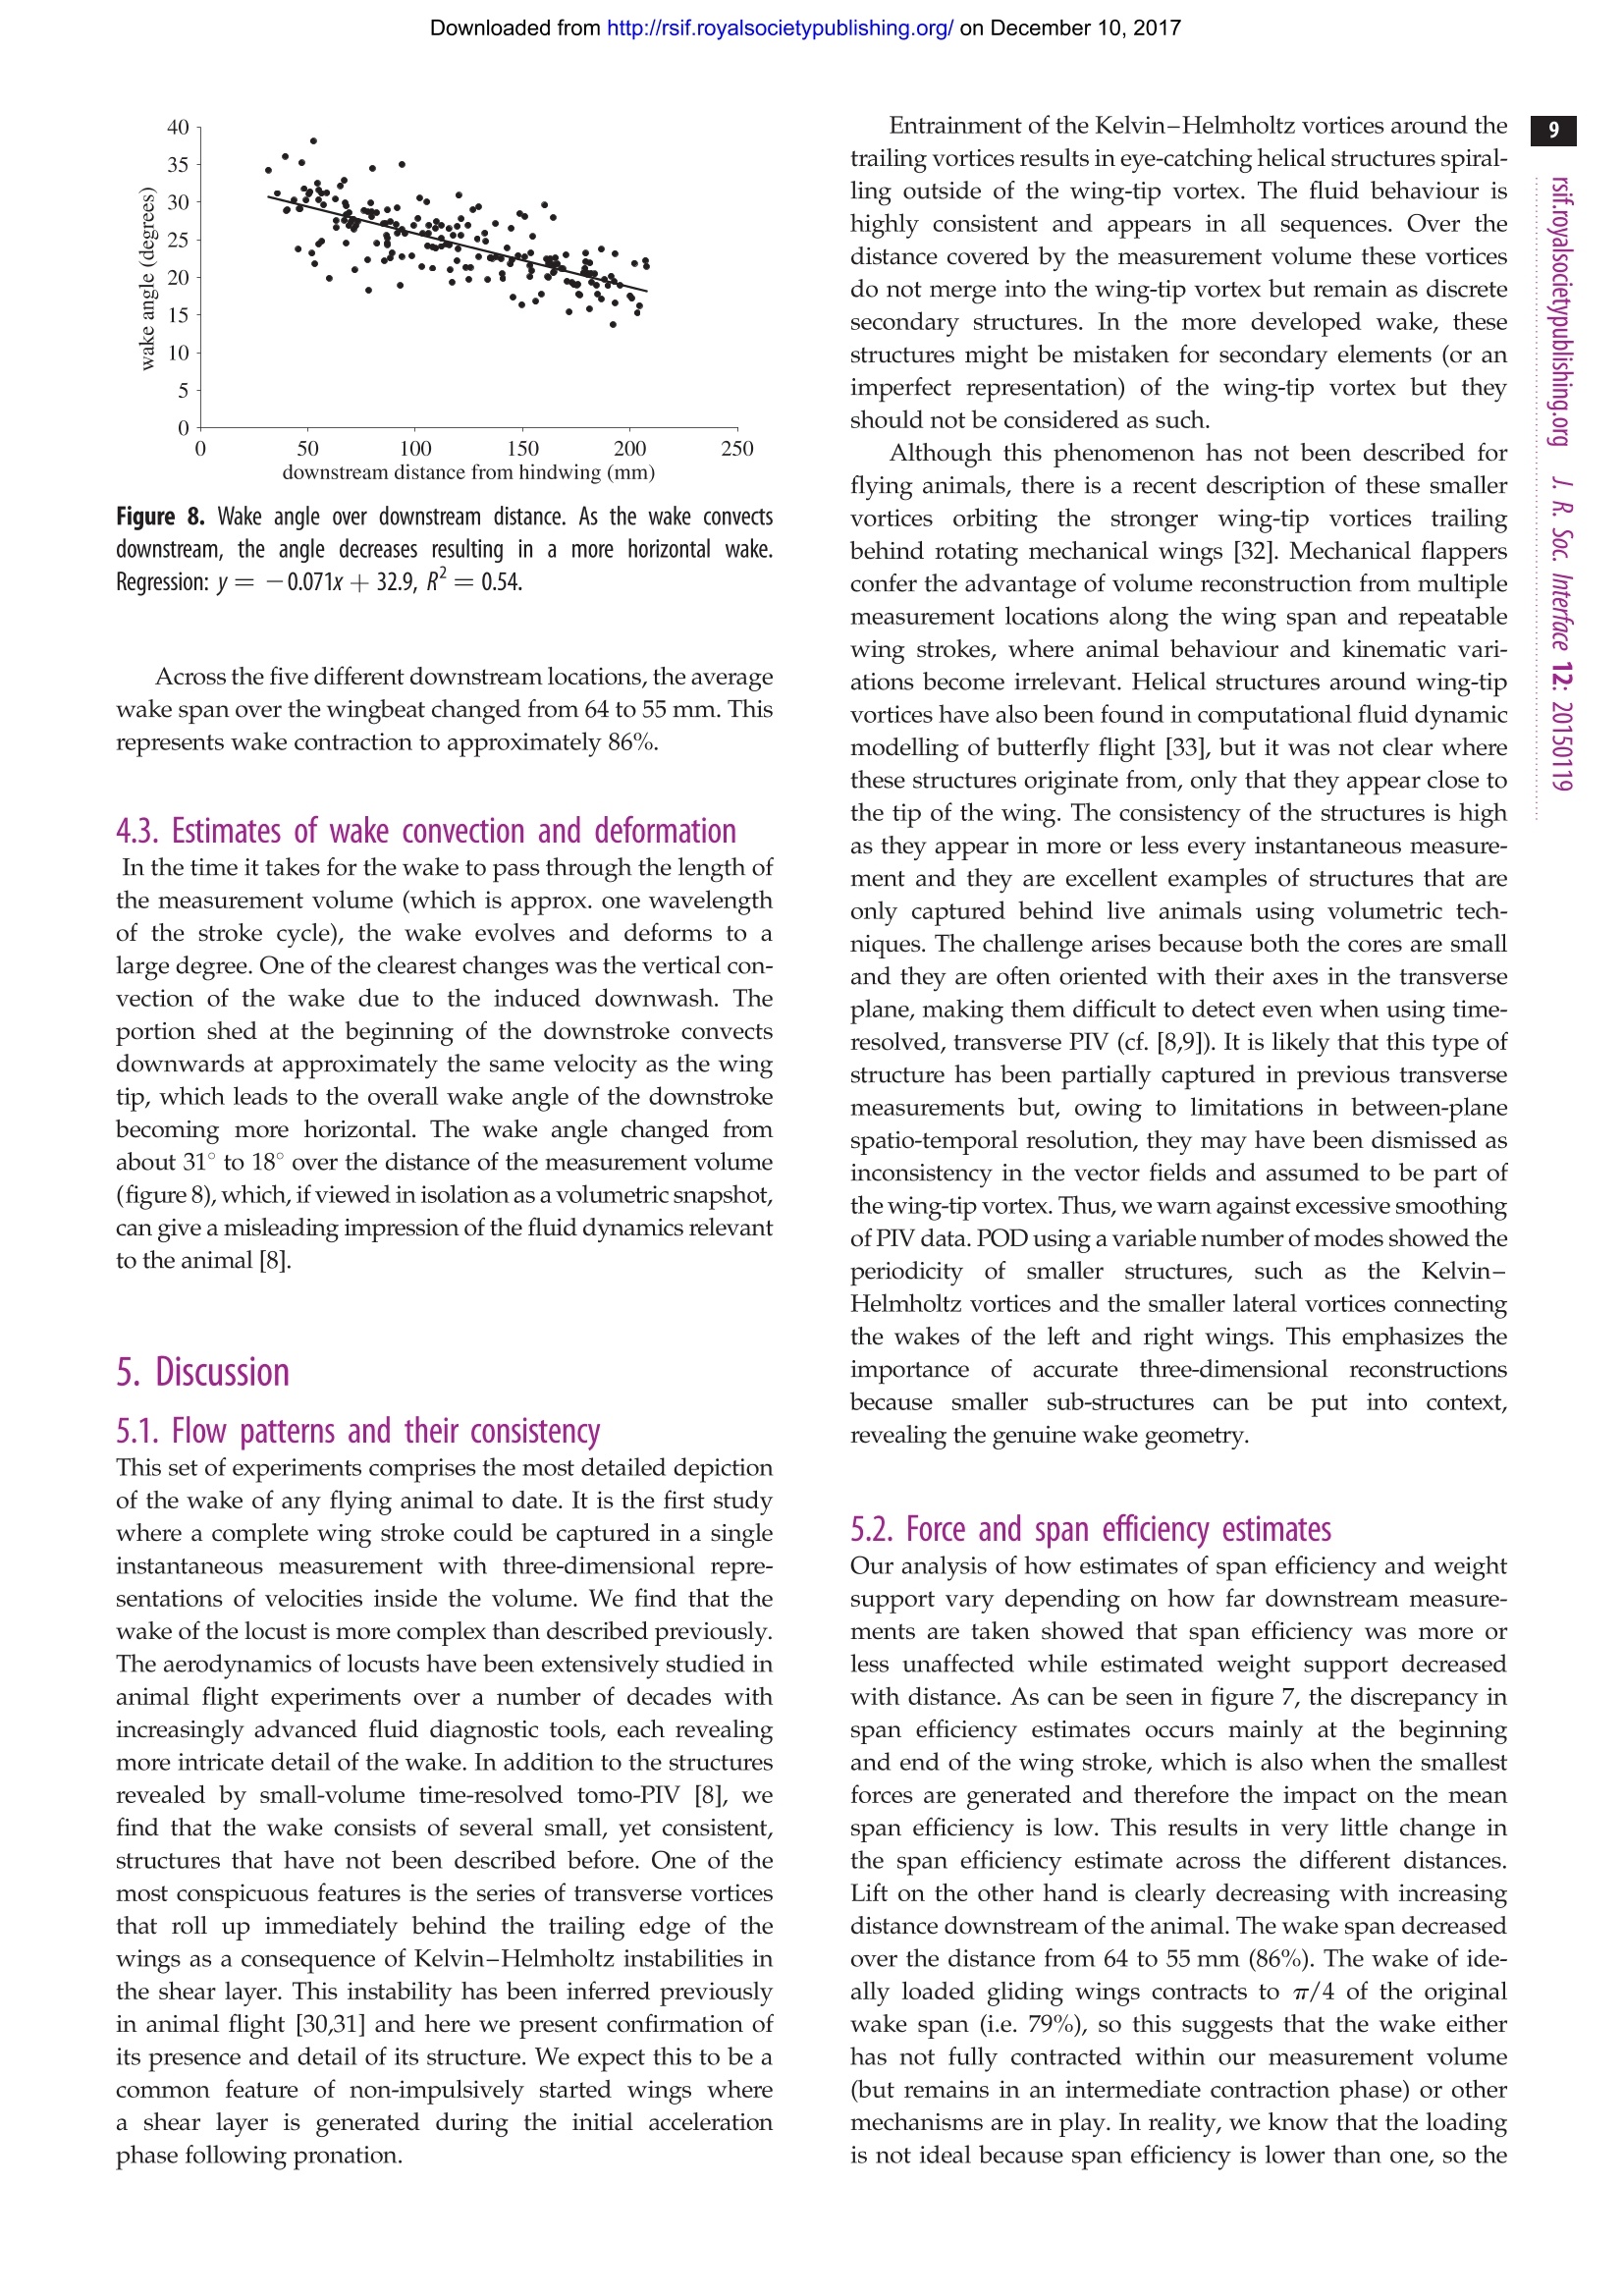
Downloaded from http://rsif.royalsocietypublishing.org/ on December 10, 2017 THE ROYAL SOCIETYPUBLISHING INTERFACE rsif.royalsocietypublishing.org Research C r o ssMark click for updates Cite this article: Henningsson P, Michaelis D,Nakata T, Schanz D, Geisler R, Schroder A,Bomphrey RJ. 2015 The complex aerodynamicfootprint of desert locusts revealed bylarge-volume tomographic particle imagevelocimetry.J.R. Soc. Interface 12: 20150119.http://dx.doi.org/10.1098/rsif.2015.0119 Received: 10 February 2015 Subject Areas: biomechanics Keywords: aerodynamics, tomographic particle imagevelocimetry, desert locust, animal flight,wake deformation, span efficiency Electronic supplementary material is availableat http://dx.doi.org/10.1098/rsif.2015.0119 orvia http://rsif.royalsocietypublishing.org. The complex aerodynamic footprint ofciistsdesert locusts revealed by large-volumenanetomographic particle image velocimetry Per Henningssonl, Dirk Michaelis, Toshiyuki Nakata, Daniel Schanz,Reinhard Geisler4, Andreas Schroder and Richard J. Bomphrey3 Department of Biology, Lund University, Lund, SwedenLaVision GmbH, Gottingen, GermanyStructure and Motion Laboratory, Royal Veterinary College, University of London, London, UK“German Aerospace Centre (DLR), Gottingen, Germany Particle image velocimetry has been the preferred experimental technique withwhich to study the aerodynamics of animal flight for over a decade. In thattime, hardware has become more accessible and the software has progressedfrom the acquisition of planes through the flow field to the reconstruction ofsmall volumetric measurements. Until now, it has not been possible to capturelarge volumes that incorporate the full wavelength of the aerodynamic track leftbehind during a complete wingbeat cycle. Here, we use a unique apparatus toacquire the first instantaneous wake volume of a flying animal’s entire wing-beat. We confirm the presence of wake deformation behind desert locustsand quantify the effect of that deformation on estimates of aerodynamic forceand the efficiency of lift generation. We present previously undescribedvortex wake phenomena, including entrainment around the wing-tip vorticesof a set of secondary vortices borne of Kelvin-Helmholtz instability in theshear layer behind the flapping wings. 1. Introduction In order to understand the mechanics by which animals fly, it is importantto understand their interaction with the air. This interaction, mediated by theflapping wings, leaves behind a wake or aerodynamic footprint that can becaptured, quantified and subsequently assessed within the framework of aero-dynamic theory. The utility of animal flight investigations using a quantitativeflow imaging technique known as particle image velocimetry (PIV) has increasedin recent times, mirroring advances in the technology available to researchers.The first experiments were limited to two-dimensional measurement slicesthrough the wake, and could only calculate two-component velocity vectorswithin that plane. Laser power restricted the experiments to small measurementareas and low acquisition rates, typically lower than the wingbeat frequency ofthe animals flying in the wind tunnel [1,2]. The step to time-resolved data,where sampling rate is in excess of the wingbeat frequency, came some timelater [3-5]. These studies marked the introduction to animal flight experimentsof stereo-PIV, where three-component vectors could be arranged on the illumi-nated measurement plane through the wake. Until then, out-of-plane velocitieshad to be inferred from the flow structure and conservation of mass, ordata drop-out due to particles leaving the illumination plane [2]. In studies ofanimal wakes, it has become commonplace to reconstruct wakes into a pseudo-three-dimensional arrangement by assembling, or stacking, stereo planes [3-5]. PIV measurements and processing can now be fully three-dimensional [6].This new generation of techniques comes with the appealing prospect of cap-turing flow volumes. Time-resolved applications followed soon after [7]. Thesignificant advantage of capturing wakes instantaneously is to dispense withthe requirement of reconstructing pseudo-volumes in order to calculate flow ( C 2015 Th e Authors. Pu b lished by the Royal So c iety un d er th e te r ms of the Creative C o mmons Attribution L icense h t tp://creativecommons.org/licenses/by/4.0/, w h ich pe r mits unr e stricted use, pro v ided the o rig i nal a uthor and s o urce a r e c r edited. ) derivatives in other dimensions, such as vorticity around axesother than that which is normal to the measurement plane. Todate, the only tomographic (tomo) PIV study of animal flightis a time-resolved(1kHz) study of desert locusts (Schistocercagregaria, Forsskal) [8]. This study was limited because insuffi-cient laser power restricted the maximum volume size to bethin relative to the gross wake geometry (ca 4 mm). Thevolumes were therefore capable of three-dimensional deriva-tive calculations but too smallto capture an entirewavelength of the wake. Ultimately, these mini-volumeshad to be stacked to present an estimate of how the wakeflow would appear in its entirety. In addition to highlightingdrawbacks with stacking stereo planes (such as spatio-tem-poral resolution) that can be deduced from first principles[9], the first application of tomo-PIV to animal flightshowed that stereo plane stacking is prone to systematicerror due to wake deformation and made predictions ofbiases that may be introduced by this method [8]. Here weapply a state-of-the-art, large-volume, tomo-PIV apparatusto the same locust paradigm, testing those predictions explor-ing the detail of the wake structure that can be seen onlywhen the wake is captured in its entirety, instantaneously. The principal objectives for our experiments were twofold.First, we aimed to make the first recordings that captured thewhole wavelength of the wake in one instant, presentingthe most detailed three-dimensional quantitative flow visual-izations of the wake of a flying animal to date. Second, weaimed to use our data to test our previously published hypo-theses regarding wake development [8], and to measurehow this wake development affects estimates of aerodynamicforce and span efficiency [5,10-14]. A recent study on thewake development behind two fixed aerofoils that capture thekey features of animal wakes-wing-tip and root vortices-shows that large-scale wake deformation takes place evenover relatively short distances downstream of the wings [14].In the light of that study, we sought to investigate deformationof the wake behind a live animal. 2. Material and methods 2.1. Animals and experimental procedure We performed experiments on tethered desert locusts flying in anopen circuit wind tunnel with a 1m wide test section atthe German Aerospace Centre (DLR) in Gottingen, Germany.The reasons for choosing desert locusts were because of theirlong-distance flight capabilities, that they are known to fly wellwhilst tethered, and that they are the most comprehensivelydescribed species of insect for kinematics [15], rigid bodydynamics [16] and aerodynamics [17]. The aerodynamics oflocusts have been studied in progressively greater detail over theyears using smoke visualization [18], longitudinal PIV [19], trans-verse PIV [5] and time-resolved,small-volume, tomo-PIV [8], all ofwhich provide a solid framework upon which the results from thislarge-volume, tomo-PIV experiment can build. We recorded data from five individuals (Livefoods UK). Thelocusts were fixed at the exoskeleton on the ventral side of thethorax to a rigid tether (2.5 mm diameter) using cyanoacrylateglue. The tether was then mounted on a profiled sting andplaced in the free stream with the hindwing trailing edge 10 mmin front of the illuminated volume. This is the closest possible pos-ition without the tip of the abdomen entering the volume. Thesting was adjusted in pitch to give a body angle of 8°, which hasbeen shown to be close to the pitch equilibrium angle [20], and Figure 1. Experimental set-up. An open test section; a closed return wind tunnelwas used. The beam from the 1 J pulse laser system was guided via mirrors to adiverging lens followed by a collimating lens and a rectangular aperture whichcreated an illuminated volume that was back-reflected by a large planarmirror on the opposite side of the test section. The locusts were tethered on asting that allowed for adjustment of body angle and were positioned just infront of the illuminated volume. Eight high-sensitivity cameras captured thevolume from below. Photographs of the apparatus are available in the electronicsupplementary material, figure S1. flown at 3.3ms, which is their equilibrium flight speed [20].The ambient temperature was 26℃. Prior to data acquisition,each individual was allowed to fly on the tether for a few minutesto acclimatize; recordings commenced only when the locustshad adopted the full flight posture as defined by Weis-Fogh [21].For each individual, 230 frames were recorded which correspon-ded to either 23 or 46s of flight depending on our acquisitionrate for that sequence: both 10 and 5 Hz sampling rates werused (see below). Locusts tend to phase-lock to strobe light [22], particularly ifthe pulse frequency is close to their natural wingbeat frequencyof approximately 20 Hz, or a factor of this. Since the laser usedfor this experiment was capable of repetition rates of 10 and5 Hz, some of the locusts would phase-lock a few seconds afterthe laser had started flashing. In the case of 5 Hz sampling, theperiodic input to the locusts’ photoreceptors would haveoccurred only every fourth wingbeat, yet this infrequent stimuluswas occasionally enough to precipitate entrainment. We mana-ged to record both phase-locked and free-running sequenceswithin our dataset. Phase-locking was beneficial for these exper-iments in the sense that it allowed for repeated measurements ofa single phase of the wing stroke, while free-running flightsequences had the benefit of scanning through different phasesof the cycle. 2.2. Tomographic partice image velocimetry set-upFigure 1 shows a schematic of the apparatus and photographs of itcan be found in the electronic supplementary material (figure 1).We used a powerful Nd : YAG laser system comprising two Spec-tra Physics Quanta Ray Pro laser heads and an external beamcombination. Only one of the lasers was frequency doubled to532 nm to enable a beam combination by a dichroic mirror. Thecombined beams passed an external crystal for frequency dou-bling, which only affected the remaining 1064 nm radiation ofthe second laser head. The laser power of each pulse was around1J and the beam profile had a diameter of approximately 10 mm. In order to illuminate the large interrogation volume ofabout 200×240×50mm (streamwise, spanwise, vertical), aspherical f=-40 mm lens was used to widen the beam, while alarge f= 1200 mm lens was used to parallelize the beam again.This way, the beam was widened by a factor of 30, resulting ina diameter of approximately 300 mm. To cut this large beaminto the desired illumination shape of the interrogation volume,a rectangular aperture of 200 ×50 mm was installed directly infront of the second lens. Cutting away large parts of the laserbeam ensured homogeneous illumination conditions withinthe measurement volume limited by a sharp intensity decline.In order to increase particle light intensity and to get forward-scattering in all cameras, the light was reflected back with a lasermirror at the opposite side of the test section. To prevent thelight from re-entering the laser, the mirror was slightly offsetlaterally and the returning laser beam was finally deflected into abeam dump. The air was seeded with di-2-ethylhexyl-sebacate (DEHS)droplets (particle size approx. 1 u.m) downstream of the test section.Eight high-sensitivity cameras (LaVision Imager sCMOS, 2560×2160 px resolution; LaVision GmbH, Germany) were used torecord the flow within the measurement volume.Only the highsensitivity of the sCMOS cameras allowed for recording at adepth of field of 50 mm at the necessary high f-number (f=11).In previous experiments with a similar measurement volume2×2 hardware binning had to be used with 11 Mpx cameras togather enough light [23]. The cameras were equipped withmacro lenses (Sigma 105 mm f/2.8 EX DG Macro) and mountedon Scheimpflug adapters (LaVision V3). The cameras were allpositioned underneath the test section in a pyramidal 2x4 gridformation (streamwise xspanwise). The use of eight camerasallowed for successful tomographic reconstruction on imageswith high particle density, which is required in order to retainan acceptable spatial resolution within such a large measurementdomain. The realized particle density was estimated to be between0.1 and 0.4 ppp (particles per pixel). Cameras and lasers weresynchronized using two programmable timing units (PTU9;LaVision), connected to two recording PCs controlling fourcameras each. Recording, calibration, volume self-calibration,volume reconstruction and volume correlation were done usingDaVis 8.1 (LaVision). 2.3. Particle image velocimetry camera calibration The initial perspective camera calibration was performed using asingle view of a three-dimensional calibration target (LaVisiontype 31, 300×300 mm²) with calibration markers on two levels,separated by 3 mm in the out-of-plane direction. The calibrationtarget was lowered into the centre of the volume from aboveusing a stepper motor-controlled arm which ensured repeatableplacement each time. The calibration model used was a third-order polynomial for each plane with linear interpolation of theplanes. The residual calibration error for all eight cameras wasbetween 0.10 and 0.15 px. This low value reflects the good qualityof the optical set-up (e.g. Scheimpflug adjustment and focus) andcan be regarded as a solid base for the following volume self-calibration procedure. The calibration based on the calibrationtarget was repeated several times a day, to compensate for minordislocations of the camera set-up, originating from temperaturechanges or mechanical stress during wind tunnel operation. 2.4. Volume self-calibration To achieve the required calibration accuracy for tomographicreconstruction of 0.1 voxels [6], volume self-calibration wasapplied to each recording sequence [24]. The technique uses theparticle images for the correction of unavoidable residual cali-bration inaccuracies. In this way, the residual calibration errorscould be detected and reduced from approximately 0.6 voxels (maximum) to 0.08 voxels (maximum). Although the stabilityof standard volume self-calibration has been questioned formore than four cameras[25], no problems were observedin this study using eight cameras and the standard volumeself-calibration procedure. 2.5. Image preprocessing Standard image preprocessing for tomo-PIV typically includesthe subtraction of a local minimum to get rid of the camera back-ground intensity (about 300 counts for these sCMOS cameras).However, at the high particle density (approx. 0.1-0.4 pp) usedin the current experiment, the overlapping particles are so closetogether that often the local minimum is much higher than thecamera background. Consequently, removing a local minimumin this situation would remove parts of the true particle intensity.To avoid this, a minimum over time was calculated using imagesrecorded at a low particle density. This minimum image wassubtracted from all recordings at higher seeding densities. Nofurther image preprocessing was applied, such as smoothing,since this was found to increase the source density and to boostthe reconstruction artefact intensity (often called 'ghosts’[6]). 2.6. Tomographic volume reconstruction A three-dimensional voxel space containing the particle intensityinformation was reconstructed from the recorded camera imagesusing MLOS-MART (multiplicative line of sight—multiplicativealgebraic reconstruction technique [6,26]; with eight iterationsand intermediate volume smoothing [25]). The reconstructedvolume had an extent of 200 × 240×58 mm, corresponding to2250×2700×650 voxel with 0.089 mm/voxel. 2.7. Velocity field calculation From the reconstructed three-dimensional particle distributions attwo subsequent time instants, the velocity fields were calculatedusing fast direct three-dimensional correlation with a multi-passapproach and decreasing interrogation volume size [27]. Thevolume used for correlation was smaller than the reconstructedvolume (2250×1900×580 voxels), removing borders with lowerreconstruction quality in the out-of-plane direction and concentrat-ing on the region of interest in the spanwise direction. The finaleffective interrogation volume size applied was 48×48×48 voxelwith 75% overlap and Gaussian weighting. This results in a vectorspacing of 1.07 mm and a total number of 187 ×160×48 velocityvectors for each instantaneous measurement. 3. Analysis 3.1. Flow patterns and their consistency The PIV volume was large enough to capture instantaneously awhole wavelength and the complete amplitude for most of theindividuals, although at some instances the lowest part of thedownstroke was just outside of the volume. Vortex patternswere examined visually to identify recurring structures in thewake. With the unprecedented information offered by thelarge volume and high resolution of the measurements,many smaller structures were revealed that have not beendescribed before. We sought to ascertain which of these fea-tures are periodically consistent structures generated by theanimals, which of them are more occasional features andwhich are merely artefacts of noise. Individual frames (repre-senting single instantaneous measurements) give the highestdetail of the small, intricate structures but can be more difficultto interpret due to measurement noise. A powerful method of Figure 2. The position of the five extracted planes from the volume used for examining wake development and deformation. The wake is presented as Q-criterioniso-surfaces at Q=0.01 coloured by x-vorticity. removing non-periodic elements of the wake is to use pro-per orthogonal decomposition (POD). With the method ofsnapshots’ by Sirovich [28], the vector field is decomposedinto orthogonal temporal and spatial modes, assuming thatthe vector field U(x, t) can be approximated as follows: where a and d; are temporal and spatial modes, respectively,and U(x) is the mean vector field. Note that the modes aresorted in descending order by the energy in each mode. This technique is highly suited to the type of data gatheredin these tethered flight experiments because the animal is heldin place, meaning that the wake is spatially consistent. Here,we used POD as a means to determine the consistency of var-ious features of the wake. Because measurement noise is non-periodic, POD processing also had the effect of cleaning theplots and easing the task of interpretation. The fewer modesthat are used for POD reconstruction, the more elements disap-pear. We exploited this effect by examining the wake featuresof one sequence (non-phase-locked) in detail using 6, 10, 23,56, 105 and 230 modes (out of 230 in total), correspondingto 70%,75%, 80%, 85%, 90% and 100% of the total energy inthe wake. The relative energy distribution in the POD modesand the cumulative sum of energy is shown in the electronicsupplementary material (figure 2). 3.2. Force and span efficiency estimates from transverseplanes A common goal of animal flight wake studies is to calculatethe aerodynamic efficiency of flight (e.g.[10,29]); yet, there is little consistency in the position of the stereo-PIV measure-ment plane relative to the animal and this downstreamdistance is likely to affect the data if the wake is undergoingsignificant deformation as it convects away from the animal[8,14]. In order to investigate how lift and span efficiency esti-mates might be affected by how far downstream the data arerecorded, we extracted transverse planes from five locationswithin our instantaneous volumes; the first plane was closestto the animal (just behind the trailing edge), the last planewas furthest away and three more were evenly spacedbetween these (figure 2). Thus, from the five sequences corre-sponding to the five individuals, 25 new sequences each with230 frames of planar PIV vector fields (five for each individ-ual) were generated to mimic stereo-PIV planes at increasingmeasurement distances downstream of the animal. Eachsequence contained various wingbeat phases-all recordedfrom different wingbeats due to the sampling rate beinglower than the wingbeat frequency. Therefore,each sequenceand frame needed to be sorted by phase to build a pseudo-time-resolved sequence. This was done by using the first(dominant) mode of the POD reconstruction under theassumption that this mode consistently assigns the samephase to frames captured at the same phase of the wingbeat.The first mode is always dominated by the wingbeat fre-quency so it was trivial to convert the phase of each framefrom POD phase to wingbeat phase.POD in this case wasonly used to find the phase of each frame and not to makePOD approximations-the frames used for phase averagingwere raw vector fields (see the electronic supplementarymaterial (figure 3) for details on phase averaging). Thissimple method proved very effective. After each framewas sorted by phase, they were binned with respect totime to generate a phase-averaged wingbeat containing Figure 3. Instantaneous representation of the full wingbeat wavelength. (a) Q-criterion iso-surfaces at Q = 0.01 coloured by x-vorticity. (b) Wake elements colourcoded by origin; green, forewing upstroke tip vortex; cyan, forewing starting vortex and early tip vortex; dark blue, forewing downstroke tip vortex; orange, hindwingdownstroke starting vortex; yellow, hindwing downstroke root vortex; red, hindwing downstroke tip vortex. An interactive three-dimensional PDF version of (b) isavailable in the electronic supplementary material, figure S4. 48 frames, the equivalent of time-resolved data captured atca 1kHz. Following the method described by Henningsson& Bomphrey [5], the phase-averaged frames were analysedby manually pinpointing the centres of the wing-tip vortexof the hindwing in each frame and a velocity transect extracted between these and a common rotational centre.Lift was then calculated as Figure 4. The formation of helical structures outside the wing-tip vortices of the hindwing from a non-phase-locked sequence. (a) The transverse vortex structures,highlighted in red, as they roll up behind the wings as a result from Kelvin-Helmholtz instabilities in the shear layer. (b) Shortly after formation the vortices getentrained around the strong hindwing downstroke vortices and form helical structures around these. where y is the spanwise location, p is the density of the air,V is the freestream velocity, ω(y) is the spanwise verticalvelocity and b is the span of the wake. Span efficiency wascalculated as The method for calculating span efficiency and lift isdescribed and explained in detail in [5], so the reader isreferred to this article for further information. Velocity trans-ects from the centre of the body to the wing-tip vortices,including the upwash outboard of their axes, were used tocalculate lift force and span efficiency. 3.3. Estimates of wake convection and deformationInstead of using velocity distribution transects behind thetrailing edge of the wings, it is also possible to estimate liftand thrust forces using a simplified vortex ring model. Inthis case, the geometry of the wake is scrutinized to extractthe diameter of the vortex cores, the diameter of the vortexring (often taken to be the wing span), and the plane of thering (either in its entirety, or section by section). In the pre-vious tomo-PIV study of locust flight, the collection ofmini-volumes was rearranged to hypothesize how muchthe wake angle (the plane of an idealized vortex ring, basedon the hindwing tip vortex angle) might be expected tochange as the wake convects downstream [8]. Here we canmeasure this directly to test that estimate. We measured thetip vortex angle using a custom Matlab script (The Math-Works, Inc.,Natick, MA, USA) to draw a line through theaxis of the hindwing's downstroke tip vortex and measurethe angle it makes with the horizontal plane. This gives agood indication of the change in the gross wake angle sincethe hindwing downstroke wake is the strongest feature of thewake, although we note that other parts of the complexvortex wake will convect in different directions. We calculatedwake angles using phase-averaged extracts of mid-wing longi-tudinal planes for five sequences (of different individuals) thatshowed the wake angles clearly. 4. Results 4.1. Flow patterns and their consistency The wake of the locust is a complex arrangement of vortexstructures (figure 3). The increased detail of the measurementsgranted by large-volume tomo-PIV shows many small, delicatestructures that have not been visible before. The wake is con-sistent with previous reports [8], dominated by tip vorticestrailing behind both wing pairs during the downstoke thatindicate strong downwash and high loading (figure 3a). Thebeginning of the downstroke shows transverse vortex elementsformed behind the hindwings as a result of increasing circula-tion around the wings (figure 3b, orange). These elements linkthe hindwing-tip vortices (figure 3b, red) to the hindwing rootvortices (figure 3b, yellow) which are present during the firsthalf of the downstroke. The root vortices then inflect inwardstowards the plane of symmetry and connect in the wakebehind the body. The forewing starting vortex and early down-stroke tip vortex form a rather complicated three-dimensionalshape (figure 3b, cyan) with continuation into more stereotypi-cal trailing wing-tip vortices (figure 3b, dark blue) similar tothose shed by the hindwings. During the upstroke, the fore-wings have a negative airspeed which results in archingtrailing vortices tracing the path of the wing tips first back-wards, then up and forwards (figure 3b, green). The oppositesense of rotation highlights momentary negative loading [8].An interactive three-dimensional PDF version of figure 3b is available in the electronic supplementary material, figure S4. Alongside these anticipated features we can also seeadditional, undescribed, wake elements. During the down-stroke, distinct vortex structures become apparent that areoriented in the spanwise direction (figure 4). This roll up is representative of Kelvin-Helmholtz instabil-ity in the shear layer behind the trailing edges of the wings.As reported with respect to dragonflies using smoke streakvisualizations [30] and inferred behind hawkmoths fromtwo-dimensional PIV [31], the shear layer rolls up into aone-sided wake immediately behind the wing, becominga series of transverse vortices with the same sense of rotation.Here, we see that they extend across the span of each wing(figure 4a). These data also reveal how the Kelvin-Helmholtz Figure 5. Comparison of consistencies of different structures in the wake by the use of POD reconstruction using different numbers of modes. (a) Six modes-downstroke tip vortices of both wing pairs are visible and the root vortex of the hind wing; (b) 10 modes-upstroke arches of forewings appear; (c) 23 modes-hindwing root vortices link up centrally; (d) 56 modes-first sign of entrained Kelvin-Helmholtz vortices; (e) 105 modes—Kelvin-Helmholtz vortices clearlyvisible; (f) 230 modes (no POD)—many small structures appear that are not visible in the lower mode reconstructions. vortices are rapidly stretched and entrained around the strongwing-tip vortices forming helices that spiral outside the core ofthe wing-tip vortex (figure 4b). Figure 4a,b shows two consecu-tive frames from the same sequence. They are separated by0.1 s and therefore represent two different wingbeats yet theflow field is, typically, very consistent. The phase shift isapproximately one-third of the stroke cycle. To investigate which structures were most consistentacross multiple wing strokes, we performed POD on one ofour sequences (non-phase-averaged))usinga variablenumber of modes for the reconstruction. This routine waseffective in discriminating between the periodic and non-periodic features of the wake (figure 5). As expected, themost highly periodic structures are created during the down-stroke of the forewings and the hindwings, with tip, root andstarting vortices consistently present, even with only sixmodes used for the flow-field reconstruction; six modes cor-responds to just 70% of the energy in the wake (figure 5a). When 10 modes are used (figure 5b), part of the upstrokearches are also visible, and at 23 modes they are almost fullyrepresented (figure 5c). At 23 modes, we can also see that thetwo root vortices from the hindwings are linked behind thebody and we start to see the first indications of the entrainedKelvin-Helmholtz vortices (figure 5c). These are more appar-ent at 56 modes (figure 5d) and at 105 modes they appearclearly (figure 5e). Finally, at 230 modes-which representthe full fidelity data-we see many smaller features that donot appear in the reduced POD reconstructions, suggestingthat they are non-periodic and likely to be of little significanceto the locust in steady flight (figure 5f). Conversely, many ofthe smaller structures that, at first glance, may have appearedto be the result of measurement noise, especially thosebehind the body, are still retained at 105 modes. This suggeststhat they are likely to be genuine, albeit not as spatially andtemporally consistent as the principal structures. Further exam-ination of the Kelvin-Helmholtz vortices and the POD modes Figure 6. (a) Span efficiency at the five different downstream locations. There is no significant change over the measured distance. (b) Weight support at the fivedifferent downstream locations. Weight support decreases with downstream location, but appears to level out towards the downstream end. Figure 7. (a) Dynamics of span efficiency throughout the wing stroke at the five different downstream locations. (b) Weight support throughout the wing stroke atthe five different downstream locations. Darker shaded lines indicate shorter downstream distance between the animal and the putative measurement plane; from10 mm dlosest to the locust to 210 mm, in increments of 50 mm. (c) Standard deviation of span efficiency between the five downstream locations. (d) Standarddeviation of weight support. 4.2. Force and span efficiency estimates from thetransverse plane We calculated aerodynamic span efficiency for each of thefive locusts and simulated stereo sampling planes from fivedownstream locations using our volumetric data. The meanspan efficiency of the five locusts and samples from all fivedownstream locations was e;=0.82, higher than the figure of0.53 reported previously [5]. Span efficiency did not changesignificantly with downstream distance of the vector fields(ANOVA;p=0.087). The values stay close to constant regard-less of whether the vector field that was used for the estimatewas extracted from the plane closest to the animal or theplane furthest away (figure 6a). This is an encouraging resultin the context of the robustness of flight efficiency studiesusing PIV. By contrast, the measured weight support (calculated aslift/weight) decreases as the measurement plane moves furtherdownstream (ANOVA;p=0.018). The variation is fairly largeacross the different individuals flown in the tunnel, but theywere all producing more lift than necessary to support theirown weight. The decline in calculated lift does not appearto be linear but, instead, seems to asymptotically approacha stable lower level within the distance covered by themeasurement volume (figure 6b). To examine this further, we plotted ei and L/W over thewingbeat for each of the five downstream locations of one ofthe individuals. Standard deviation of the parameters at eachtime step was used to illustrate where in the wingbeat the biggestdiscrepancy between locations occurs (figure 7). It is clear fromthis figure that e;has the lowest discrepancy during the period inthe wing stroke where most of the lift is produced, whereas L/Wshows the opposite trend; around mid-downstroke whenthe peak of lift occurs the discrepancy between measurementlocations close and far is also the highest. Figure 8. Wake angle over downstream distance. As the wake convectsdownstream, the angle decreases resulting in a more horizontal wake.Regression: y= - 0.071x+32.9, R’=0.54. Across the five different downstream locations, the averagewake span over the wingbeat changed from 64 to 55 mm. Thisrepresents wake contraction to approximately 86%. 4.3. Estimates of wake convection and deformationIn the time it takes for the wake to pass through the length ofthe measurement volume (which is approx. one wavelengthof the stroke cycle), the wake evolves and deforms to alarge degree. One of the clearest changes was the vertical con-vection of the wake due to the induced downwash. Theportion shed at the beginning of the downstroke convectsdownwards at approximately the same velocity as the wingtip, which leads to the overall wake angle of the downstrokebecoming more horizontal. The wake angle changed fromabout 31° to 18°over the distance of the measurement volume(figure 8), which, if viewed in isolation as a volumetric snapshot,can give a misleading impression of the fluid dynamics relevantto the animal[8]. 5. Discussion 5.1. Flow patterns and their consistency This set of experiments comprises the most detailed depictionof the wake of any flying animal to date.It is the first studywhere a complete wing stroke could be captured in a singleinstantaneous measurement with three-dimensional repre-sentations of velocities inside the volume. We find that thewake of the locust is more complex than described previously.The aerodynamics of locusts have been extensively studied inanimal flight experiments over a number of decades withincreasingly advanced fluid diagnostic tools, each revealingmore intricate detail of the wake. In addition to the structuresrevealed by small-volume time-resolved tomo-PIV [8], wefind that the wake consists of several small, yet consistent,structures that have not been described before. One of themost conspicuous features is the series of transverse vorticesthat roll up immediately behind the trailing edge of thewings as a consequence of Kelvin-Helmholtz instabilities inthe shear layer. This instability has been inferred previouslyin animal flight [30,31] and here we present confirmation ofits presence and detail of its structure. We expect this to be acommon feature of non-impulsively started wings wherea shear layer is generated during the initial accelerationphase following pronation. Entrainment of the Kelvin-Helmholtz vortices around thetrailing vortices results in eye-catching helical structures spiral-ling outside of the wing-tip vortex. The fluid behaviour ishighly consistent and appears in all sequences. Over thedistance covered by the measurement volume these vorticesdo not merge into the wing-tip vortex but remain as discretesecondary structures. In the more developed wake, thesestructures might be mistaken for secondary elements (or animperfect representation) of the wing-tip vortex but theyshould not be considered as such. Although this phenomenon has not been described forflying animals, there is a recent description of these smallervortices orbiting the stronger wing-tip vortices trailingbehind rotating mechanical wings [32]. Mechanical flappersconfer the advantage of volume reconstruction from multiplemeasurement locations along the wing span and repeatablewing strokes, where animal behaviour and kinematic vari-ations become irrelevant. Helical structures around wing-tipvortices have also been found in computational fluid dynamicmodelling of butterfly flight [33], but it was not clear wherethese structures originate from, only that they appear close tothe tip of the wing. The consistency of the structures is highas they appear in more or less every instantaneous measure-ment and they are excellent examples of structures that areonly captured behind live animals using volumetric tech-niques. The challenge arises because both the cores are smalland they are often oriented with their axes in the transverseplane, making them difficult to detect even when using time-resolved, transverse PIV (cf. [8,9]). It is likely that this type ofstructure has been partially captured in previous transversemeasurements but, owing to limitations in between-planespatio-temporal resolution, they may have been dismissed asinconsistency in the vector fields and assumed to be part ofthe wing-tip vortex. Thus, we warn against excessive smoothingof PIV data.POD using a variable number of modes showed theperiodicity of smaller structures, such astheeKelvin-Helmholtz vortices and the smaller lateral vortices connectingthe wakes of the left and right wings. This emphasizes theimportance of accurate three-dimensionalreconstructionsbecause smaller sub-structures can be put into context,revealing the genuine wake geometry. 5.2. Force and span efficiency estimates Our analysis of how estimates of span efficiency and weightsupport vary depending on how far downstream measure-ments are taken showed that span efficiency was more orless unaffected while estimated weight support decreasedwith distance. As can be seen in figure 7, the discrepancy inspan efficiency estimates occurs mainly at the beginningand end of the wing stroke, which is also when the smallestforces are generated and therefore the impact on the meanspan efficiency is low. This results in very little change inthe span efficiency estimate across the different distances.Lift on the other hand is clearly decreasing with increasingdistance downstream of the animal. The wake span decreasedover the distance from 64 to 55 mm (86%). The wake of ide-ally loaded gliding wings contracts to m/4 of the originalwake span (i.e. 79%), so this suggests that the wake eitherhas not fully contracted within our measurement volume(but remains in an intermediate contraction phase) or othermechanisms are in play. In reality, we know that the loadingis not ideal because span efficiency is lower than one, so the full wake contraction is expected to be even more than 79%.Following Bernoulli, we would expect velocities to increaseas the wake span decreases but we find, here, that the globalmean of velocities, across the span and over the wingbeat,decreases from 0.35 to 0.27 ms-. This may be due to dissipa-tion and explains why the weight support is decreased whenestimated from planes that have been measured further down-stream in the wake. As shown by Horstmann et al. [14], we mayalso expect the root vortices that are present during parts of thedownstroke to interfere with the wing-tip vortices, causingthem to pivot downwards. The resultant wake rotation canlead to lower vertical velocity components and, consequently,a lower estimate of lift force. This may also explain why thediscrepancy in lift is highest around the time of peak lift pro-duction since this is also when the strongest root vortices arepresent and the likelihood of wake rotation is highest. 5.3. Wake deformation After the wake is shed, it continues to develop and deform andone of the clearest changes is the overall downstroke wakeangle. The angle of the downstroke wake as measured from aplane captured close to the animal (corresponding to theupstream part of our volume) is steeper than if the sameangle were to be measured from a wake plane captured farfrom the animal (corresponding to the downstream end ofour wake volume). This type of deformation or developmenthad been predicted recently based on the results of time-resolved, small-volume tomo-PIV [8]. The results confirm thequalitative prediction and closely match the quantitativeprediction. The wake angles prior to deformation and postdeformation were both consistent to a precision of 1°. Thedownstroke wake angle, here, is 31°, calculated using a fittedregression at a distance of 10 mm behind the hindwing trailingedge. Theinitial wake angle in our earlier study was 32°[8]andwas predicted to relax to 20°within one wavelength of convec-tion. Here, one wavelength behind the animal, at the furthestmeasureable distance downstream of 210 mm, the regressionanalysis yields a downstroke wake angle of 18°, confirmingthe earlier prediction (figure 8). Wake angle changes present significant challenges whenusing downstream measurements, or low temporal resolution,large-volume measurements for estimating the lift and thrustacting on an animal, because the average resultant aerodynamicforce vector also changes (in this case closer to vertical). Thismodulation can give the misleading impression of higher liftand lower thrust than was actually generated by the wings.Simply considering the change in the angle found here over thedistance of the measurement volume (13°) would result in anoverestimate of lift of 110%and an underestimate of thrust of 60%. 5.4. The benefits and limitations of large-volumetomographic particle image velocimetry Although the resulting wake reconstructions from theseexperiments are exceptionally detailed, there are somepractical limitations to the large-volume tomo-PIV method.A powerful laser system was used for these experimentsalongside eight high-resolution, high-sensitivity cameras.In addition to this study, the tomo-PIV system was usedwithin the scope of the PIV course (http://pivcourse.dlr.de)at the German Aerospace Centre (DLR) in Gottingen. Weacknowledge that the cost of this equipment means that it will not be practical to replicate this set-up in many labora-tories worldwide at this stage. A significant issue for thiswork was also the extensive processing time required to pro-gress from raw images to finished vector fields. Analysing thedataset for this study took 96 days of around-the-clock proces-sing on a server with 48 AMD cores and 64 GB of RAM. Despitethese challenges, it is possible that this technique will become astandard way of measuring aerodynamic tracks in the future,even around much larger swimming and flying animals.High-speedd(1kHz)) large-volume (200×200×100 mm’)tomo-PIV using helium-filled soap bubbles has been demon-strated recently [34] and has even been expanded to 500 x300×200 mm(F Scarano, S Ghaemi, G Caridi, J Bosbach, UDierksheide 2015, personal communication). These bubblesmay be too large for insect flight wake measurements(300-500 um) but may prove useful for bird measurements. When synthesizing our experiences from large-volume,low repetition rate tomo-PIV with those from small-volume,high repetition rate tomo-PIV [8], we conclude that, ifresources are limited, a high repetition rate should be priori-tized over a larger volume for quantitative analysis of animalflight dynamics. These parameters are often subject to atrade-off due to limitations in laser power and the conflictof frame rate versus pixel resolution in high-speed cameras.High repetition rate, in combination with a small volume, ispotentially the most useful, so long as the volume is largeenough for reliable estimates of out-of-plane vorticity andto overlap with each other if using a wind or water tunnel.The fact that this large-volume PIV captures the wholewake of the animal is in a way both its benefit and its draw-back. By capturing the complete wake instantaneously, thewake we present is a true representation of the wake leftbehind locusts flying tethered in a wind tunnel and is moreaccurate than has been possible using composite recon-structions of planar PIV images. However, in terms ofaerodynamic analysis, such as inferring forces acting on theanimal, this is best done using the vector fields closest to theanimal that have had little time to deform.While the additionalinformation added by capturing the older’ parts of the wakefurther downstream is less relevant in the context of the ani-mal's aerodynamics, tomo-PIV still has the significantadvantage over planar PIV that flow derivatives in any axiscan be calculated from adjacent vectors that were captured sim-ultaneously. If the aerodynamic forces acting on the animal arenot the primary concern, then the full wake pattern is of par-ticular importance. Such situations include investigations ofinteractive behaviour, for example flocking flight in birds[35,36], swarming in insects [18,37], the schooling of fish [38],predator-prey dynamics [39] or the control of multipleunmanned air systems. Data accessibility. The dataset has been uploaded to the Dryad DigitalRepository:http://dx.doi.org/10.5061/dryad.1cn55. ( Authors’ contribution s. P.H . and R.J.B. did the conceptual and experimental design. D .M., D.S.,R.G. and A.S. prepared the ap p aratus. P.H., D. M ., D .S., R .G. a nd A . S. collected t he data. D.M., D.S., R.G . and A.S. pro- cessed the data. P.H. and T.N. performed t he aerodynamic a nd statistica l analyses . P.H., T .N.,D.M. a n d R.J.B. authored the manuscript.All authors were i nvolved in manuscript revisions. ) ( Competi n g interes t s. D. M . is a n employe e o f LaVision GmbH,wh i ch manufactures tomographic PIV software and ha r dware. ) Funding. P.H. was supported by the Swedish Research Council (www.vr.se; 2013-4838).R.J.B. was supported by the EPSRC (EP/H004025/1)and the BBSRC (BB/J001244/1). T.N. was supported by the BBSRC(BB/J001244/1). ( 1. Spedding GR, Rosen M, Hedenstrom A. 2003A family of vortex wakes g enerated b y a t hrush n ightingale i n free f l ight i n a w ind tu n nel over its entire natural r ange o f f l ight speeds. J. E xp. Biol.206, 2313-2344. ( d oi:10. 1 242/jeb.00423) ) ( 2. B omphrey RJ, Lawson NJ, Harding NJ, Tay l or GK,Thomas A LR. 2005 The aerodynamics of Manducasexta: d igital particle image velocimetry an a lysis ofthe leading-edge vortex.J. Exp. Biol. 208,1079-1094. ( d oi:10.1242/jeb.01471) ) ( 3. Hubel T , H ristov N, S wartz S, Breuer K . 2009 T ime-resolved wake structure and k inematics o f bat flight. Exp. Fluids 46, 933-943. ( d oi:10.1007/ s00348-009-0624-7) ) ( 4. Johansson L C, Hedenstrom A . 2009 The vortex wake of b lackcaps (Sylvia atricapilla L.) measured u s ing h igh-speed digital p artide i m age ve l ocimetry ( DPIV).J. Exp. Biol . 212, 3365-3376.(doi:10.1242/ jeb.034454) ) 5. Henningsson P, Bomphrey RJ. 2011 Time-varyingspan efficiency through the wingbeat of desertlocusts. J. R. Soc. Interface 9, 1177-1186. (doi:10.1098/rsif.2011.0749) ( 6 Elsinga GE, Scarano F, Wieneke B, van OudheusdenBW. 2 006 Tomographic p a rtidle i mage velocimetry.Exp. Fluids 41, 933-947. (doi:10. 1 007/s00348-006- 0212-Z) ) ( 7. S chroder A , G e isler R, E l singa G, Scarano F, Di e rksheide U . 2 008 I n vestigation o f a turbulent s p ot and a t ripped t urbulent b oundary l a yer flow u s ing time-resolvedtomographic PIV. Exp. Fluids 44, 3 05-316. (doi:10. 1007/s00348-007-0403-2) ) ( 8. B omphrey RJ , He n ningsson P, Michaelis D, Holl i s D.2012 T omographic partidle image v elocimetry of desert l ocust wakes: i nstantaneous volumes combine to reveal hidden vortex elements and rapidwake deformation. J . R. S oc. Interface 9 , 3378-3386.(d o i:10.1098/rsif.2012.0418) ) ( 9. Bomphrey RJ. 2011 A dvances i n animal flight aerodynamics through f low m easurement. Evol. Biol. 38, 1-1 1 . (doi:10.1007/s11692-011- 9134-7) ) 10. HeHnningsson P, Bomphrey RJ. 2013 Span efficiencyin hawkmoths. J. R. Soc. Interface 10, 20130099.(doi:10.1098/rsif.2013.0099) ( 1 1 . Henningsson P , Hedenstrom A, Bomphrey RJ. 20 1 4 E fficiency of lift production in flapp i ng and glidingflight of swifts . PLoS ONE 9, e90170. (doi:10.1371/ j ournal.pone.0090170) ) ( 12 . M u N ijres F T, Bowlin M S, Johansson L C , H e d enstrom A. 2011 V ortex w ake, downwash distribution, aerodynamic p e rformance and wi n gbeat kinematics i n s low-flying pied f l ycatchers. J. R. S oc. Interface 9,292-303. (doi:10.1098/rsif.2011.0238) ) ( 13. M u N ijres F T, Johansson LC, Bowlin MS, Winter Y ,Hedenstrom A . 201 2 Comparing aerodynamicefficiency in birds and b ats suggests better fl i ght ) performance in birds. PLoS ONE 7, e37335. (doi:10.1371/journal.pone.0037335) ( 14. +. Horstmann JT, Henningsson P, Thomas ALR, Bomphrey RJ. 2014 Wake development behind p aired w ings w i th ti p and roo t trailing vortices: consequences for a n imal flight force e stimates. PLoS O NE 9 , e91040. (d o i:10.1371/journal.pone.0091040) ) ( 15. Walker SM, Thomas ALR, Taylor GK. 2009Deformable w i ng kinematics in t he des e rt loc u st:how and why do camber, twist and topography v ary through t h e st r oke? J. R. S o c. I n terface 6, 7 35-747. (d o i:10.1098/rsif.2008.0435) ) ( 16. T aylor GK, Zbikowski R. 2005 Nonlinear time- p eriodic m odels o f t h e l o ngitudinal flight dynamics o f desert locusts Schistocerca gregaria. J. R . S oc . Interface 2, 197-221. ( d oi:10.1098/rsif.2005.0036) ) ( 17. / . Y oung J, Walker S M, Bomphrey RJ, T a ylor GK, T homas ALR. 2009 D e tails o f i nsect wing design and d eformation enhance a erodynamic function and f light efficienc y. Scien c e 325 , 1549-1552.( d oi:10. 1126/science.1175928) ) ( 1 8. Kutsch W, C amhi J, S umbre G . 1 9 94 C l ose e ncounters a mong f l ying locusts produce wing-beat c oupling. J. Comp. P hysiol. A 174, 6 43-649. (doi:10.1007/BF00217385) ) ( 19. Bomphrey RJ, T aylor GK, Lawson NJ, Thomas A LR. 2 006 D i gital particle i mage velocimetry measurements of t h e d o wnwash dis t ribution of a d esert locust S c histocerca g r egaria.J. R. So c . Interface 3, 311-317. ( d oi:10.1098/rsif.2005.0090) ) ( 20. Taylor G K, T homas ALR. 20 0 3 Dynamic flig h t sta b ility i n t he desert locust Sc h istocerca gregaria. J. Exp. Biol. 206, 2 803-2829. (d o i:10.1242/jeb.00501) ) ( 21. We is-Fogh T . 1 9 56 Biology a n d p h ysics o f l o cust f light. Ⅱl . Flight performance o f the de s ert locust(Schistocerca gregaria). P hil. T rans. R. Soc. L ond. B 239,4 5 9-510. (d o i:10.1098/rstb.1956.0008) ) ( 22 . W eis-Fogh T. 1 9 73 Quick estimates of f li g ht fitness i n h overing a nimals, induding novel m e chanisms for lif t production.J . Exp. Bio l . 5 9 , 169-230. ) ( 23. F F ukuichi Y. 2012 I nfluence of number of cameras a n d p reprocessing for thick volume tomographic PIV. I n P roc. 16th Int. Symp. o n A p plications o f L a serTechniques t o F luid Mechanics, Lisbon, Portugal , 9-12July 2 012. L i sbon, Po r tugal: Instituto Superior Tecn i co. ) ( 24. W ieneke B . 2008 V o lume se l f-calibration for 3D p artice i mage ve l ocimetry. Exp. Fluids 45 , 549-556. ( d oi:10.1007/s00348-008-0521-5) ) ( 25. Discetti S , N atale A , A s tarita T . 2 0 13 Sp a tial filtering i mproved t o mographic PI V . Exp. Fluids 5 4 , 1 - 1 3 . (doi:10.1007/s00348-013-15 0 5-7) ) ( 26. 6 . A tkinson C, S oria J . 2009 A n efficient simultaneous reconstruction technique for tomographic p artid e i mage v e locimetry. E xp. Fluids 47, 5 53- 5 68. (doi:10.1007/s00348-009-0728-0) ) ( 27. Discetti S, Astarita T. 2012 Fast 3D P IV w ith direct sparse cr o ss-correlations. Exp . ) ( Fluids 53, 1437-1451. (doi:10.1007/s00348-012- 1370-9) ) ( 28. S S irovich L. 1987 T urbulence a nd the dynamics of c oherent s t ructures.1. C o herent structures. Q. Ap p l. Math. 45, 561-571. ) ( 29. Mu N ijres F T , S pedding GR, Winter Y, H e denstrom A. 2 011 A c tuator disk model and s p an efficiency of f lapping f light in bats based on time-resolved P IV m easurements. Exp. F l uids 5 1 , 511-5 2 5. (do i :10. 1007/s00348-011-1067-5) ) ( 30. T T homas ALR, Taylor G K, S rygley RB, Nudds R L, B omphrey RJ . 20 0 4 Dra g onfly flight: fre e -flight and tethered f l ow visualizations re v eal a div e rse array of u nsteady l i ft-generating mechanisms, controlled p rimarily v ia a n gle of at t ack. J. E x p. B i ol. 207,4299-4323. (doi:10.1242/jeb.01262) ) ( 31. . Bo B mphrey RJ, L a wson NJ , Ta y lor G K , T h omas AL R . 2 006 A p plication o f digital particle imagevelocimetry to insect aerodynamics: measurement o f t he l eading-edge v o rtex and n e ar wake of a H awkmoth. Exp. F luids 40, 546-554. ( doi:10.1007/ s00348-005-0094-5) ) ( 32. B B ross M , Ozen CA, R ockwell D . 2013 F low s tructure o n a r o tating wing: e f fect o f s t eady i n cident f l ow.Phys. Fluids 25, 081901. (doi:10.1063/1.4816632) ) ( 33. Y Y okoyama N, Senda K, lima M , Hirai N. 2013 A erodynamic forces and vo r tical s t ructures i n f lapping butterfly’'s forward flight. Phys. Fluids 25, 021902. (doi:10.1063/1.4790882) ) ( 34. S S carano F , Ghaemi S , Caridi G , B osbach J,Dierksheide U , S ciacchitano A . 2 014 O n th e us e of h elium f i lled s oap bubbles fo r l a rge scale tomographic P I V w i nd tu n nel ex p eriments. In P ro c . 1 7th I nt. Symp. o n A pplications of Laser Techniques t o F luid Mechanics, Lisbon, Portugal, 7-1 0 July2014. Lisbon, P o rtugal: Instituto S uperior T ecnico. ) ( 35. P P ortugal S J, Hubel T Y, F ritz J, Heese S, Trobe D, V oelkl B, Hai l es S, Wilson AM, Usherwood JR. 2 014 U pwash exploitation a nd d o wnwash avoidance by f lap p hasing i n i b is formation flight. Nature 505,399-402. ( d oi:10.1038/nature12939) ) ( 36. U sherwood JR , St a vrou M, Lowe JC, Roskilly K, W ilson AM. 2 0 11 Flying in a flock comes at a c o s t inpigeons. Nature 474, 494-497.(d o i:10.1038/ nature10164) ) ( 37 . B B utail S , Manoukis N , D i allo M , Ribeiro JM, L ehmann T, P a ley DA. 20 1 2 Rec o nstructing th e flight kinematics o f swarming and mating i n wild mosquitoes. J. R . S oc. I nterface 9, 2624-2638. ( doi:10. 1 098/rsif.2012.0150) ) ( 38. L iao J C. 2007 A r eview o f fish swimming mechanics and behaviour in altered flows. Phil. Tr a ns. R. So c . B 362, 1 9 73-1993. (doi:10.1098/rstb.2007.2082) ) ( 39. K K lopsch C, Kuhlmann H C , B a rth FG. 2012 Airflow e licits a spider’s j ump towards airborne prey. 1. Airf l ow a round a flying b lowfly. . R. S oc. I nterface 9,2591- 2 602. (d o i:10.1098/rsif.2012.0186) ) Particle image velocimetry has been the preferred experimental technique withwhich to study the aerodynamics of animal flight for over a decade. In thattime, hardware has become more accessible and the software has progressedfrom the acquisition of planes through the flow field to the reconstruction ofsmall volumetric measurements. Until now, it has not been possible to capturelarge volumes that incorporate the fullwavelength of the aerodynamic track leftbehind during a complete wingbeat cycle. Here, we use a unique apparatus toacquire the first instantaneous wake volume of a flying animal’s entire wingbeat.We confirm the presence of wake deformation behind desert locustsand quantify the effect of that deformation on estimates of aerodynamic forceand the efficiency of lift generation. We present previously undescribedvortex wake phenomena, including entrainment around the wing-tip vorticesof a set of secondary vortices borne of Kelvin–Helmholtz instability in theshear layer behind the flapping wings.
确定
还剩9页未读,是否继续阅读?

产品配置单


北京欧兰科技发展有限公司为您提供《沙漠蝗虫中空气动力学特性检测方案(粒子图像测速)》,该方案主要用于航空中空气动力学特性检测,参考标准--,《沙漠蝗虫中空气动力学特性检测方案(粒子图像测速)》用到的仪器有体视层析粒子成像测速系统(Tomo-PIV)、Imager sCMOS PIV相机、PLIF平面激光诱导荧光火焰燃烧检测系统、LaVision DaVis 智能成像软件平台
推荐专场


CCD相机/影像CCD
更多


相关方案
更多
该厂商其他方案
更多