


方案详情
文
Recent advances in the performance of organic semiconductors such as organic light
emitting diodes (OLEDs), organic field-effect transistors (OFETs), and organic solar cells
have been dramatic. In particular for OLEDs, stability and durability have improved to
levels that warrant their application in everyday life. In organic devices, the charge carriers,
both electrons and holes, often have to be injected through organic/electrode interfaces.
Therefore, an understanding of the interaction between metal electrode and organic
molecules is quite important, because the electronic properties of metal/organic interface
directly affect the performance of the OLEDs.
方案详情

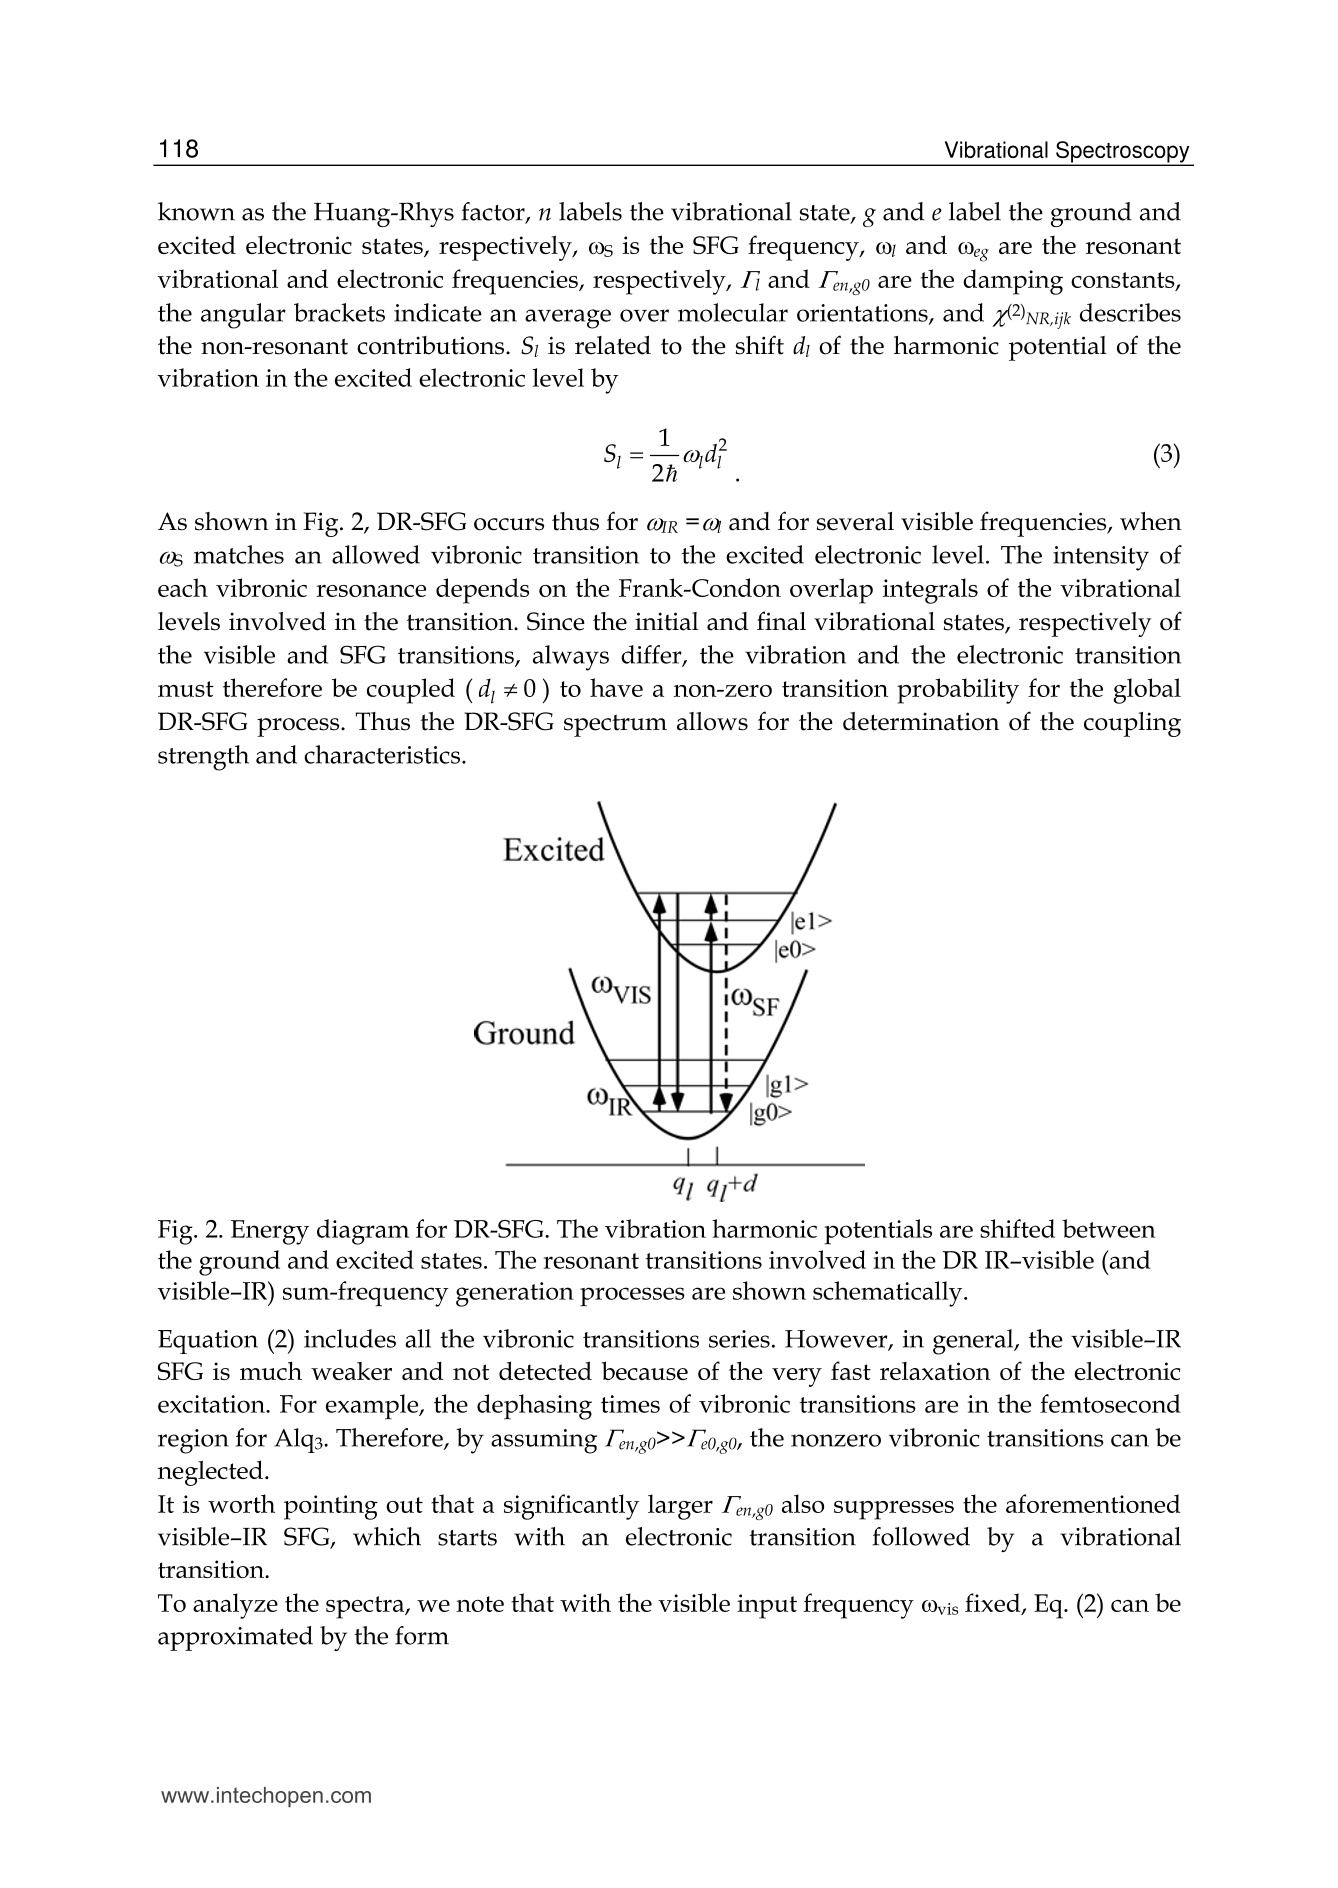
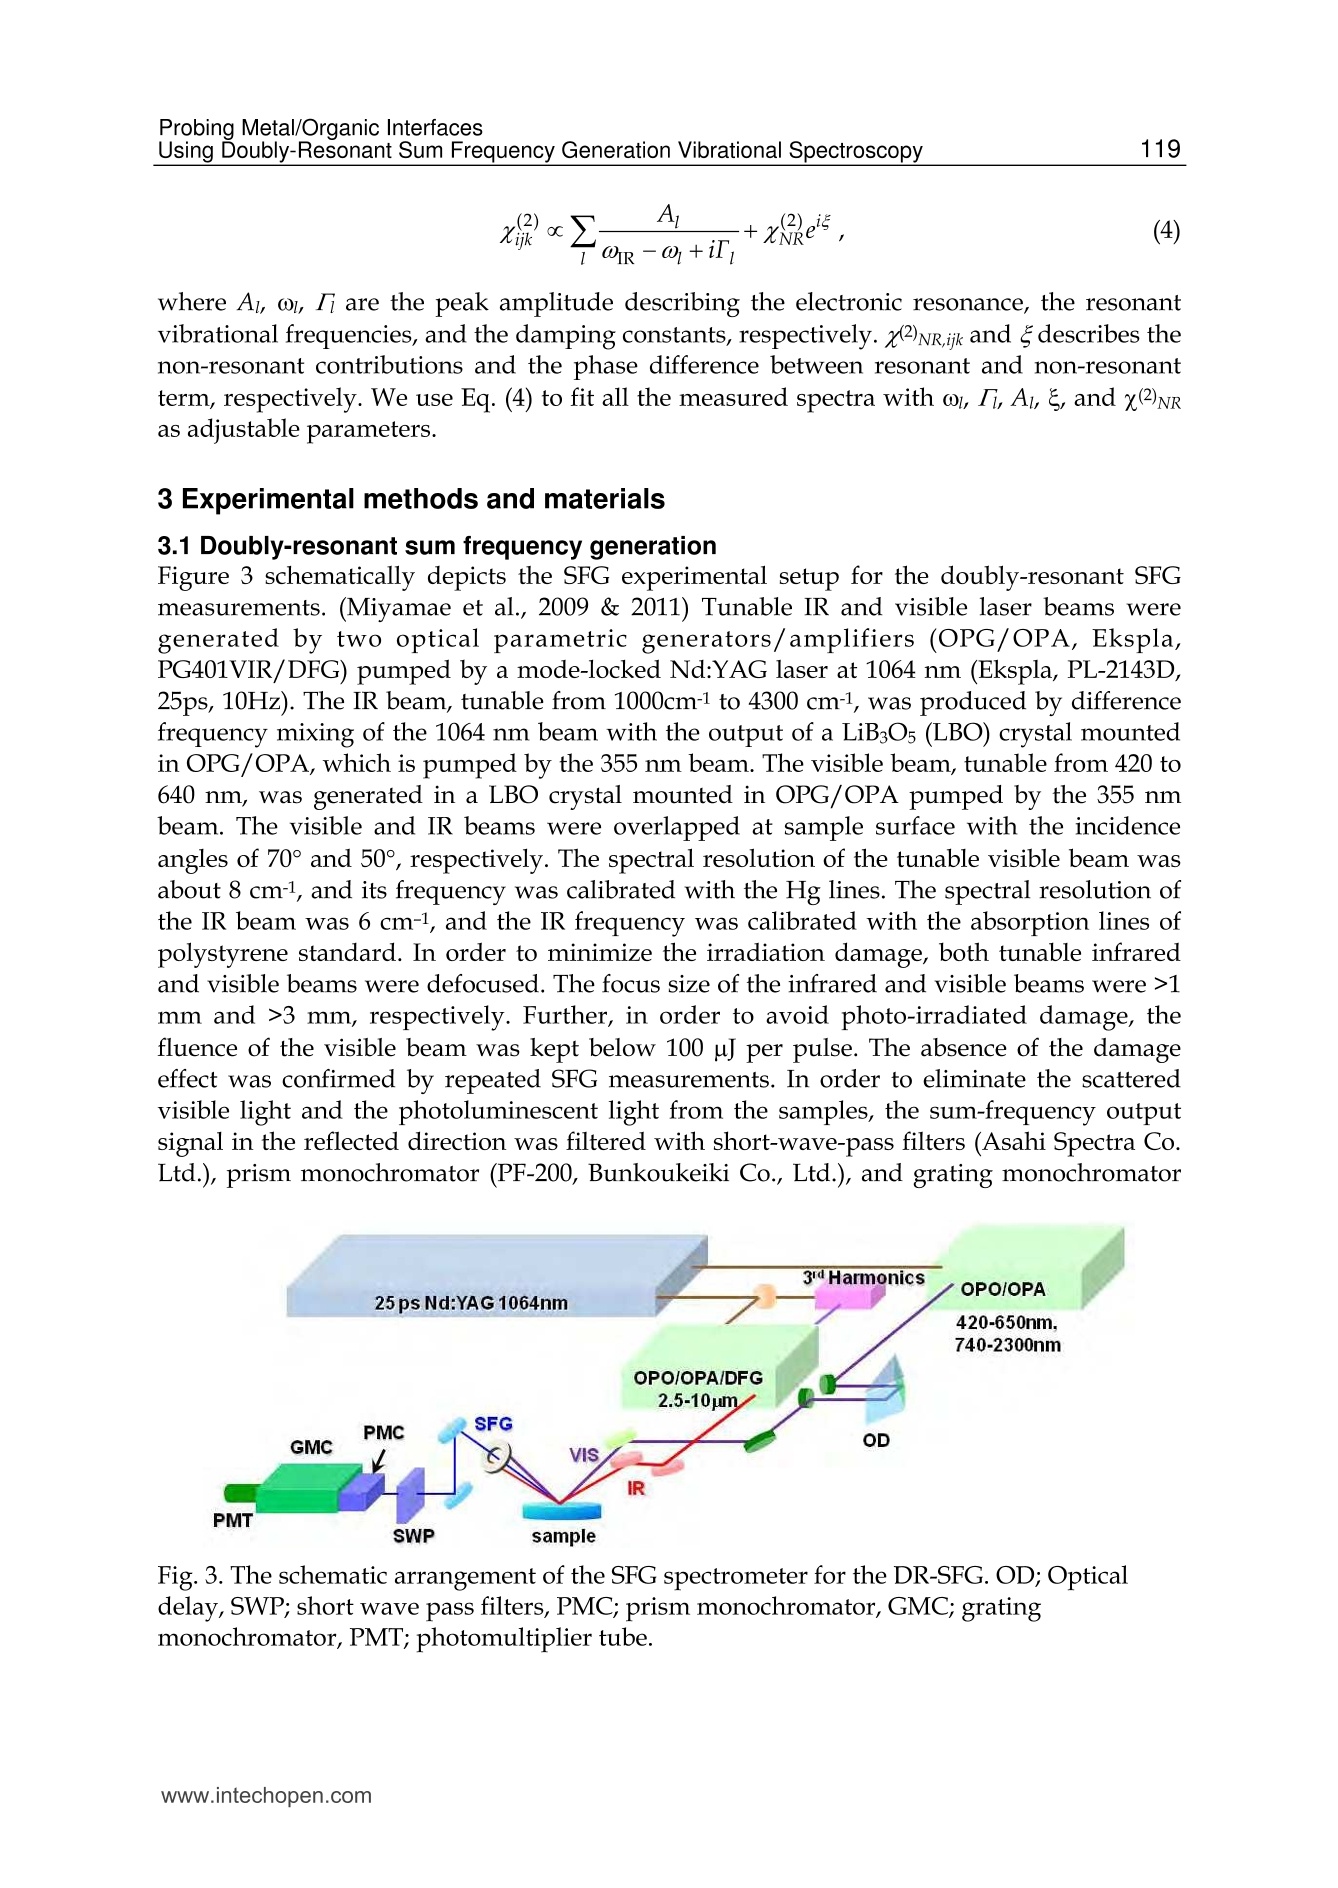
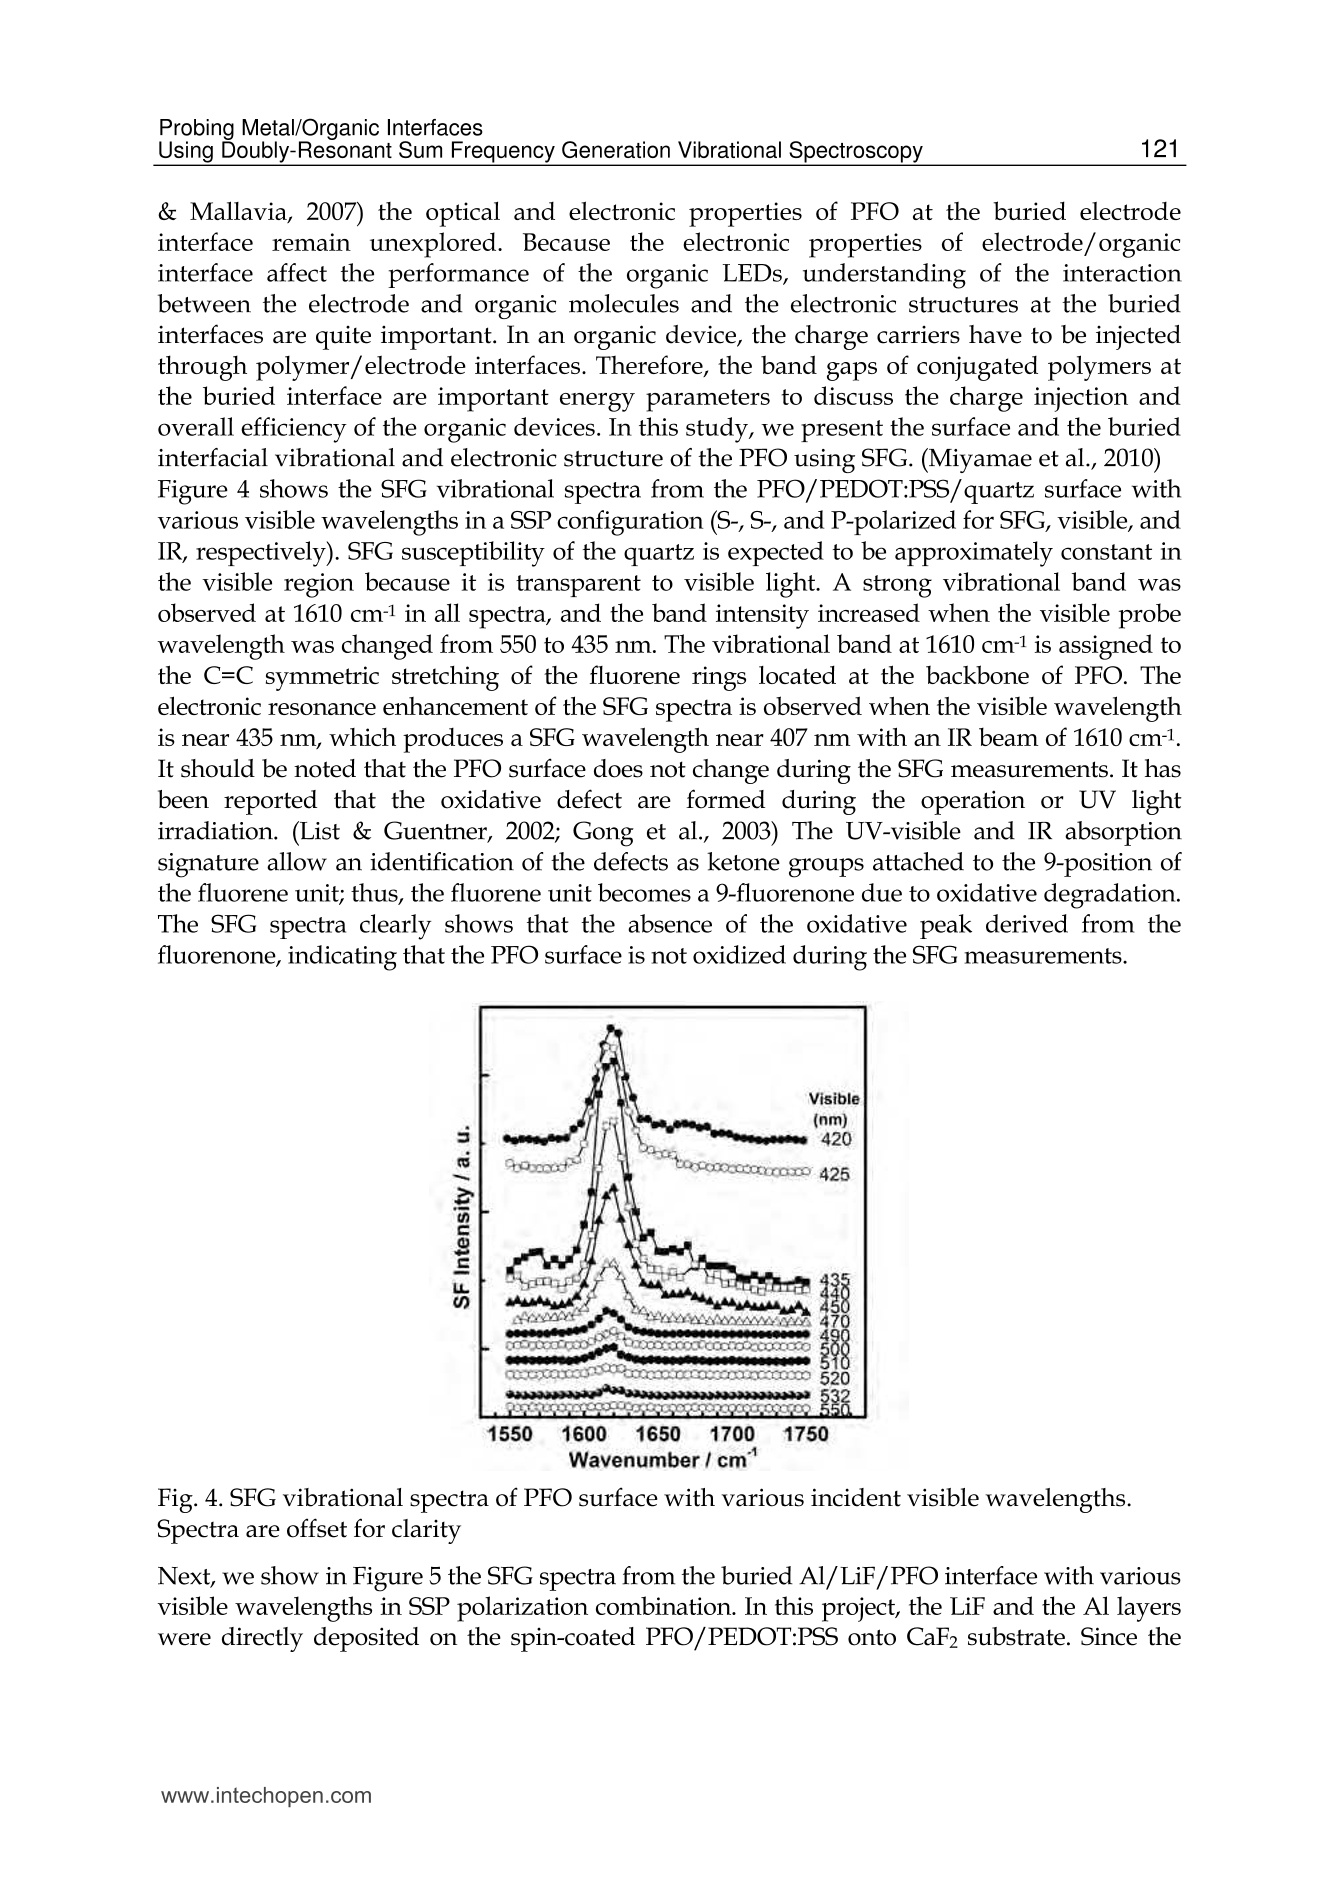
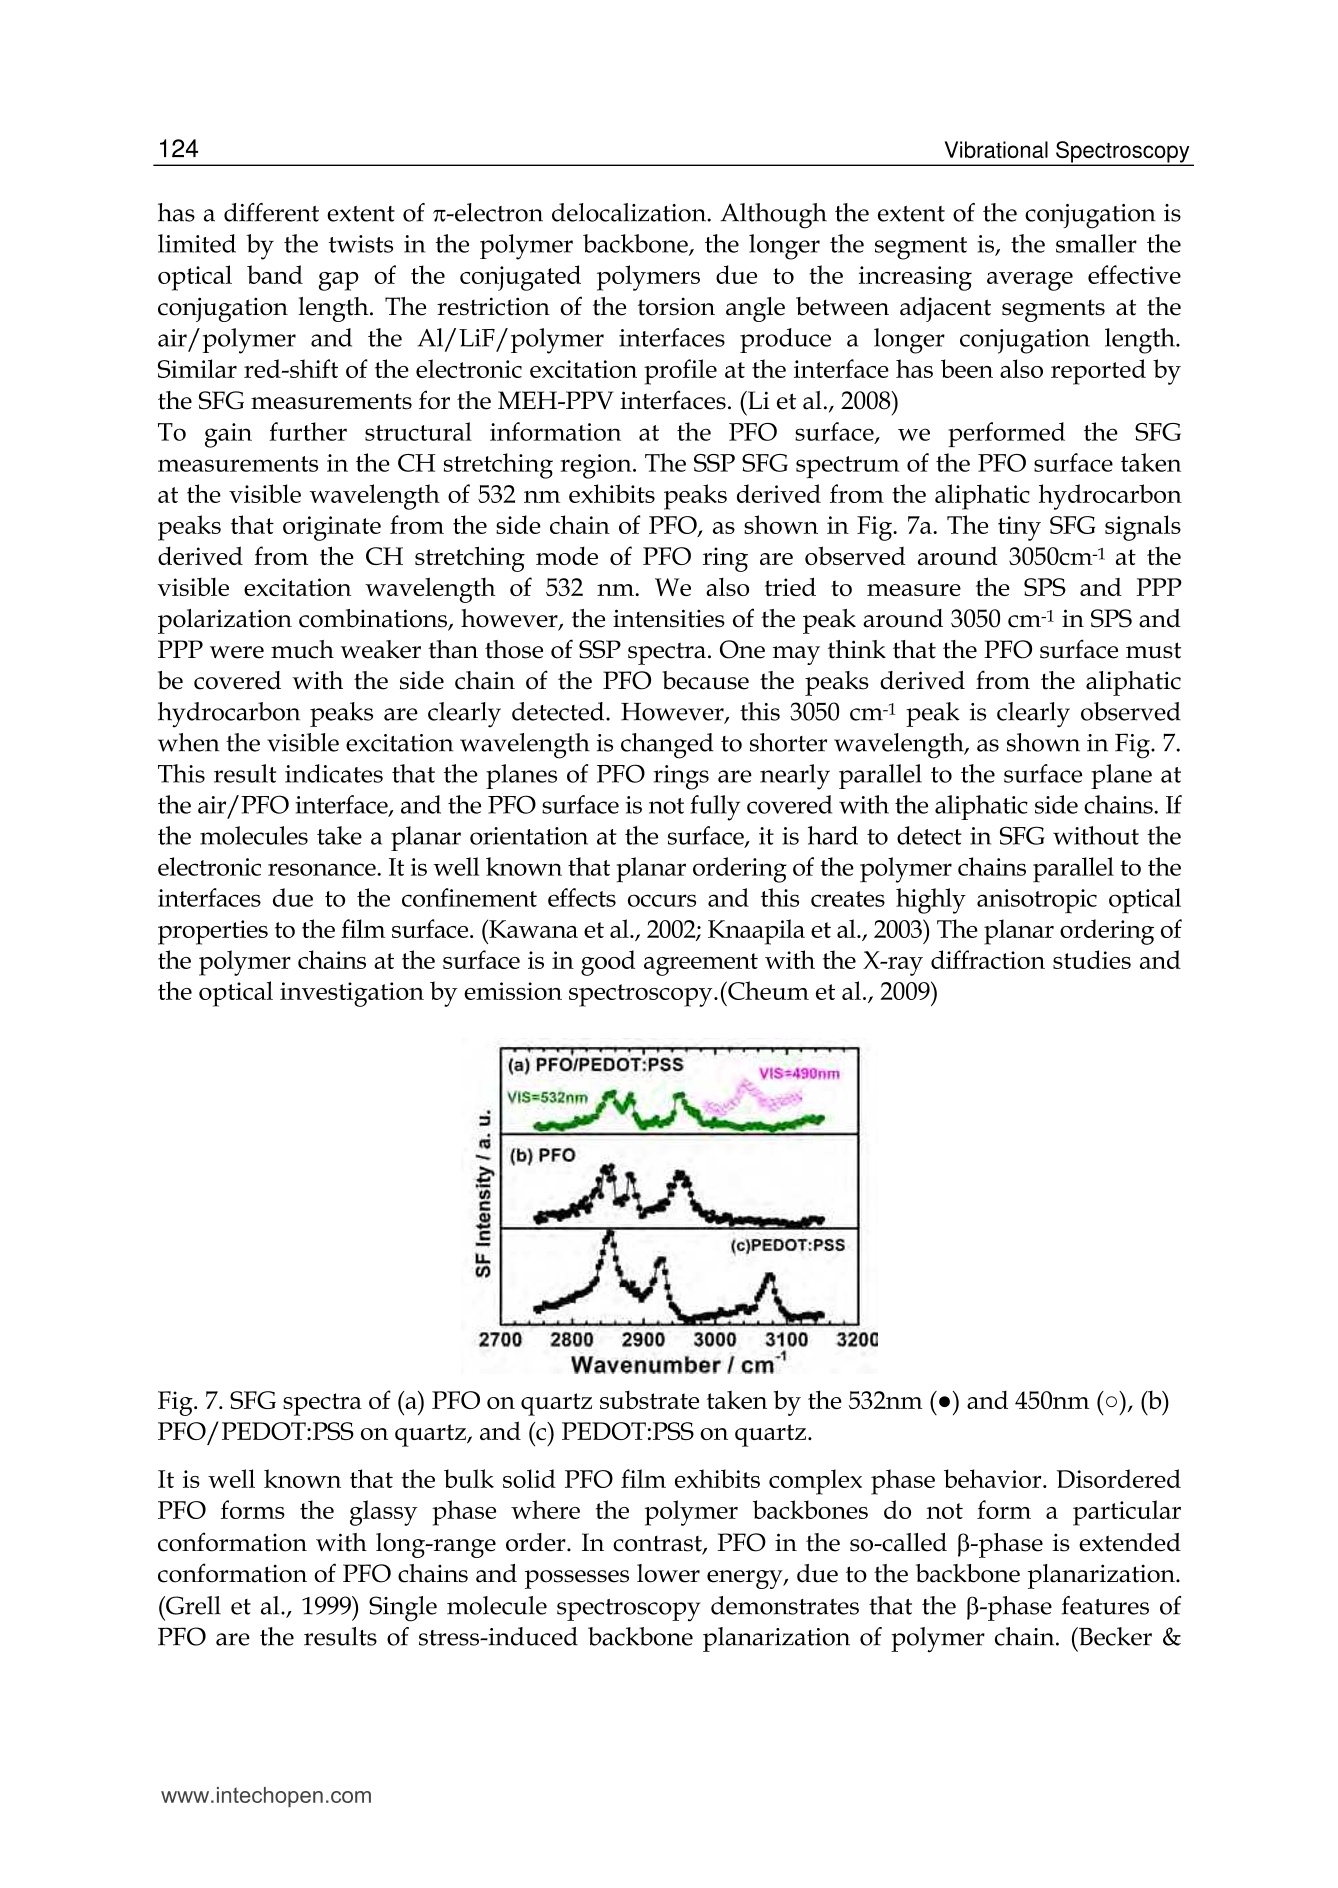
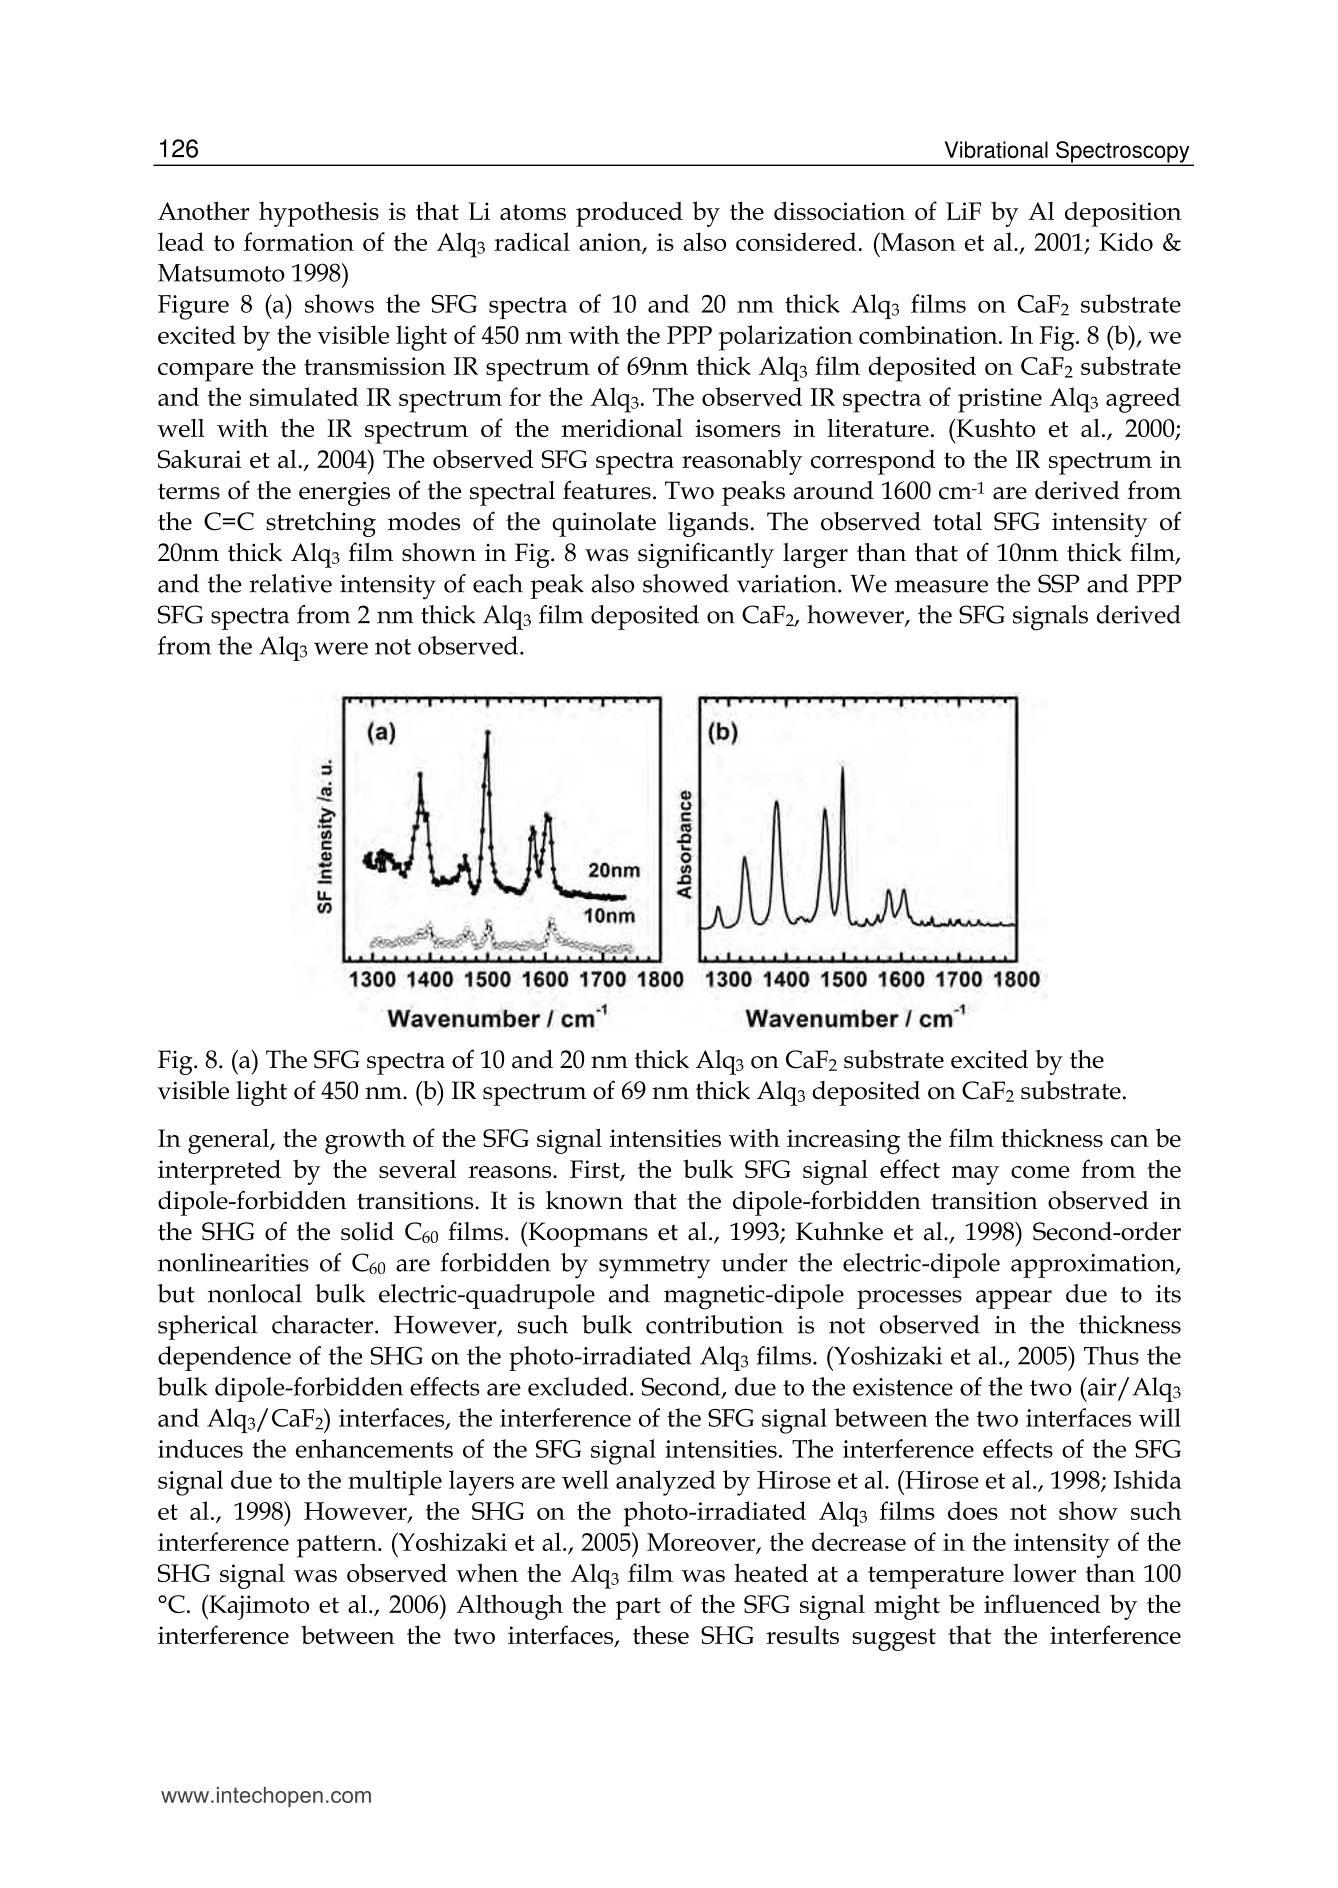
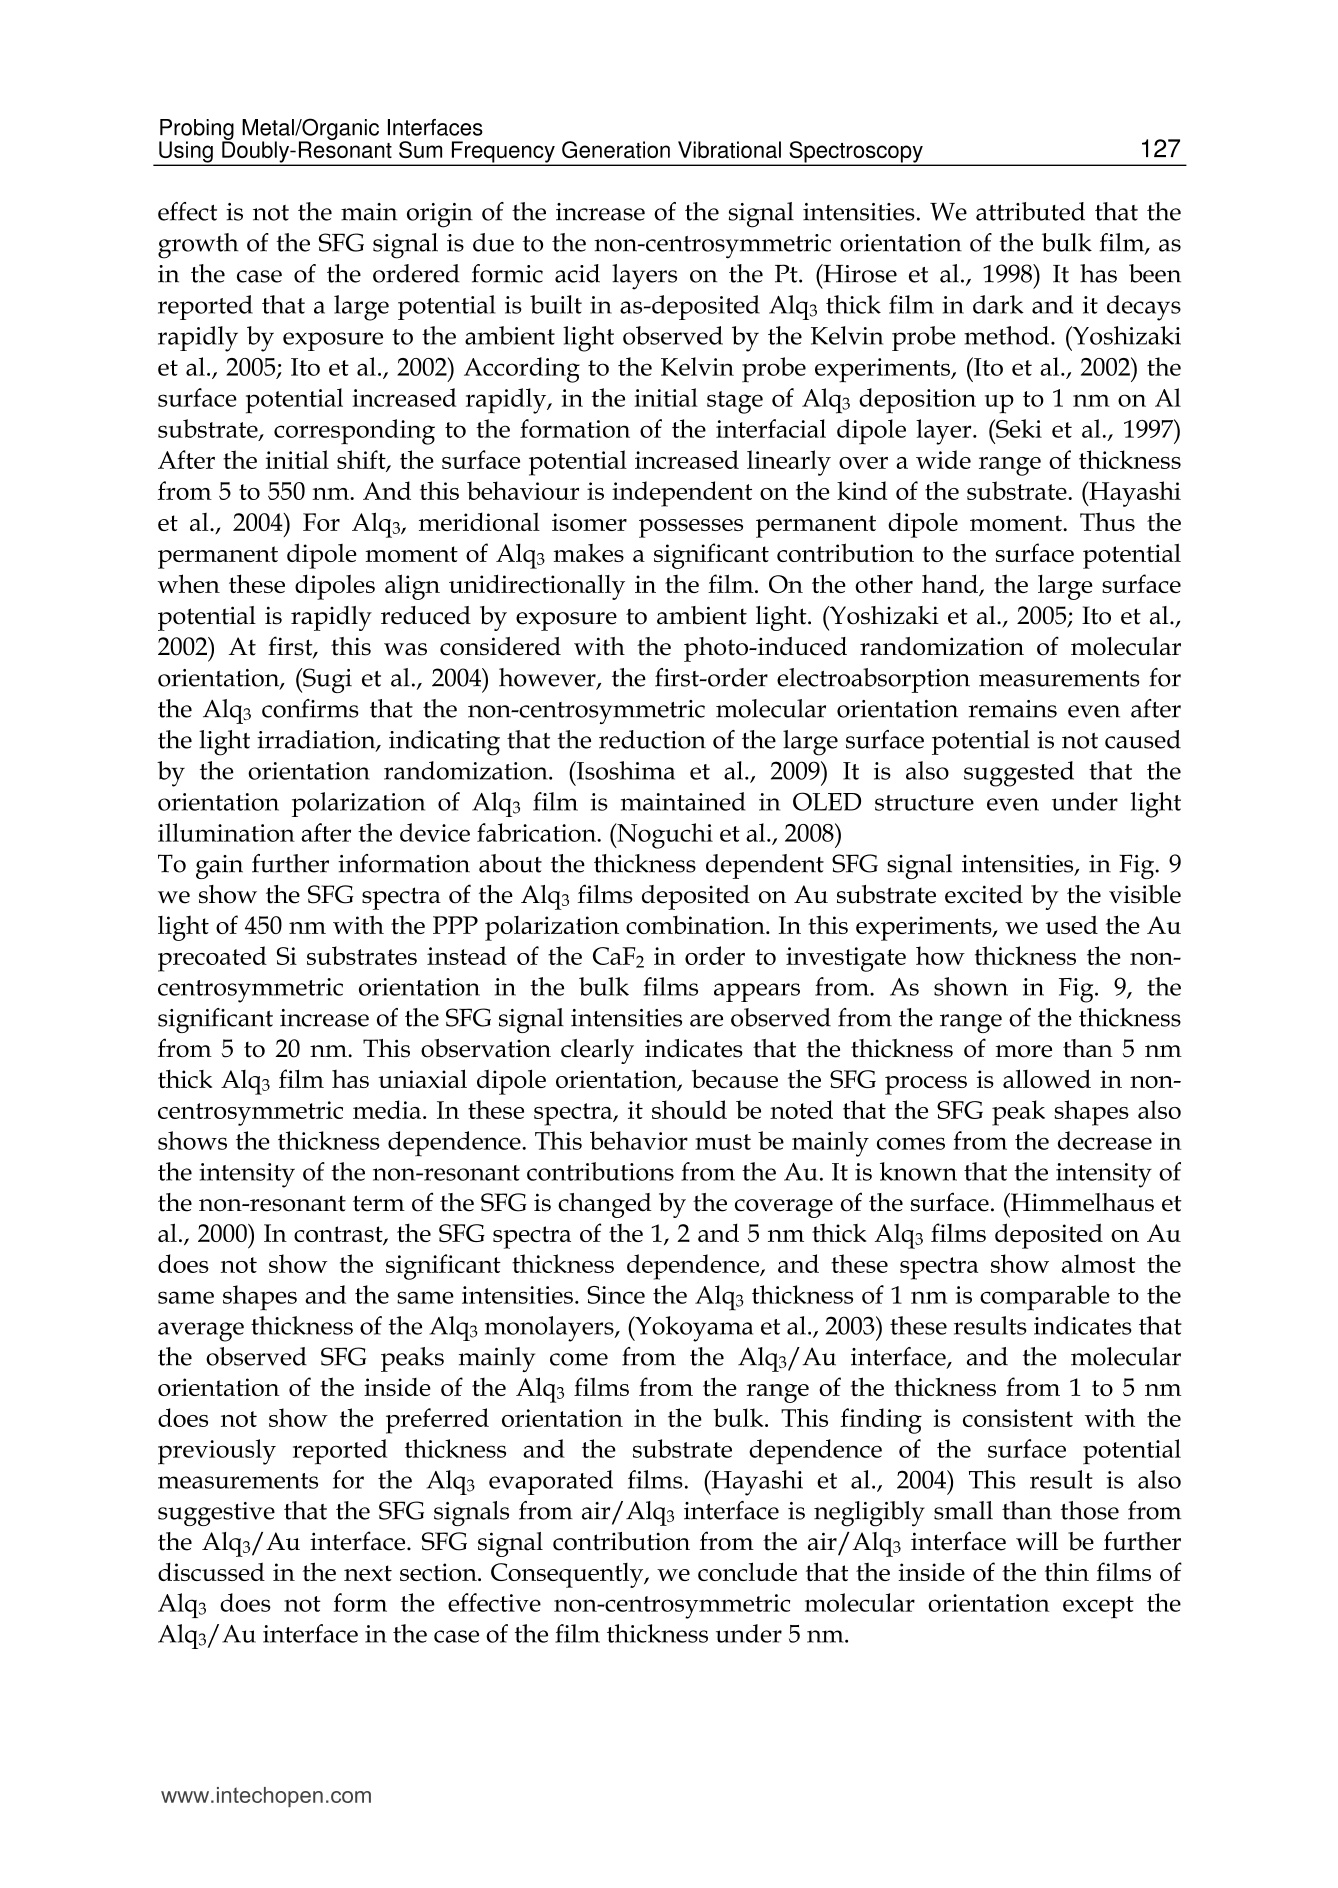
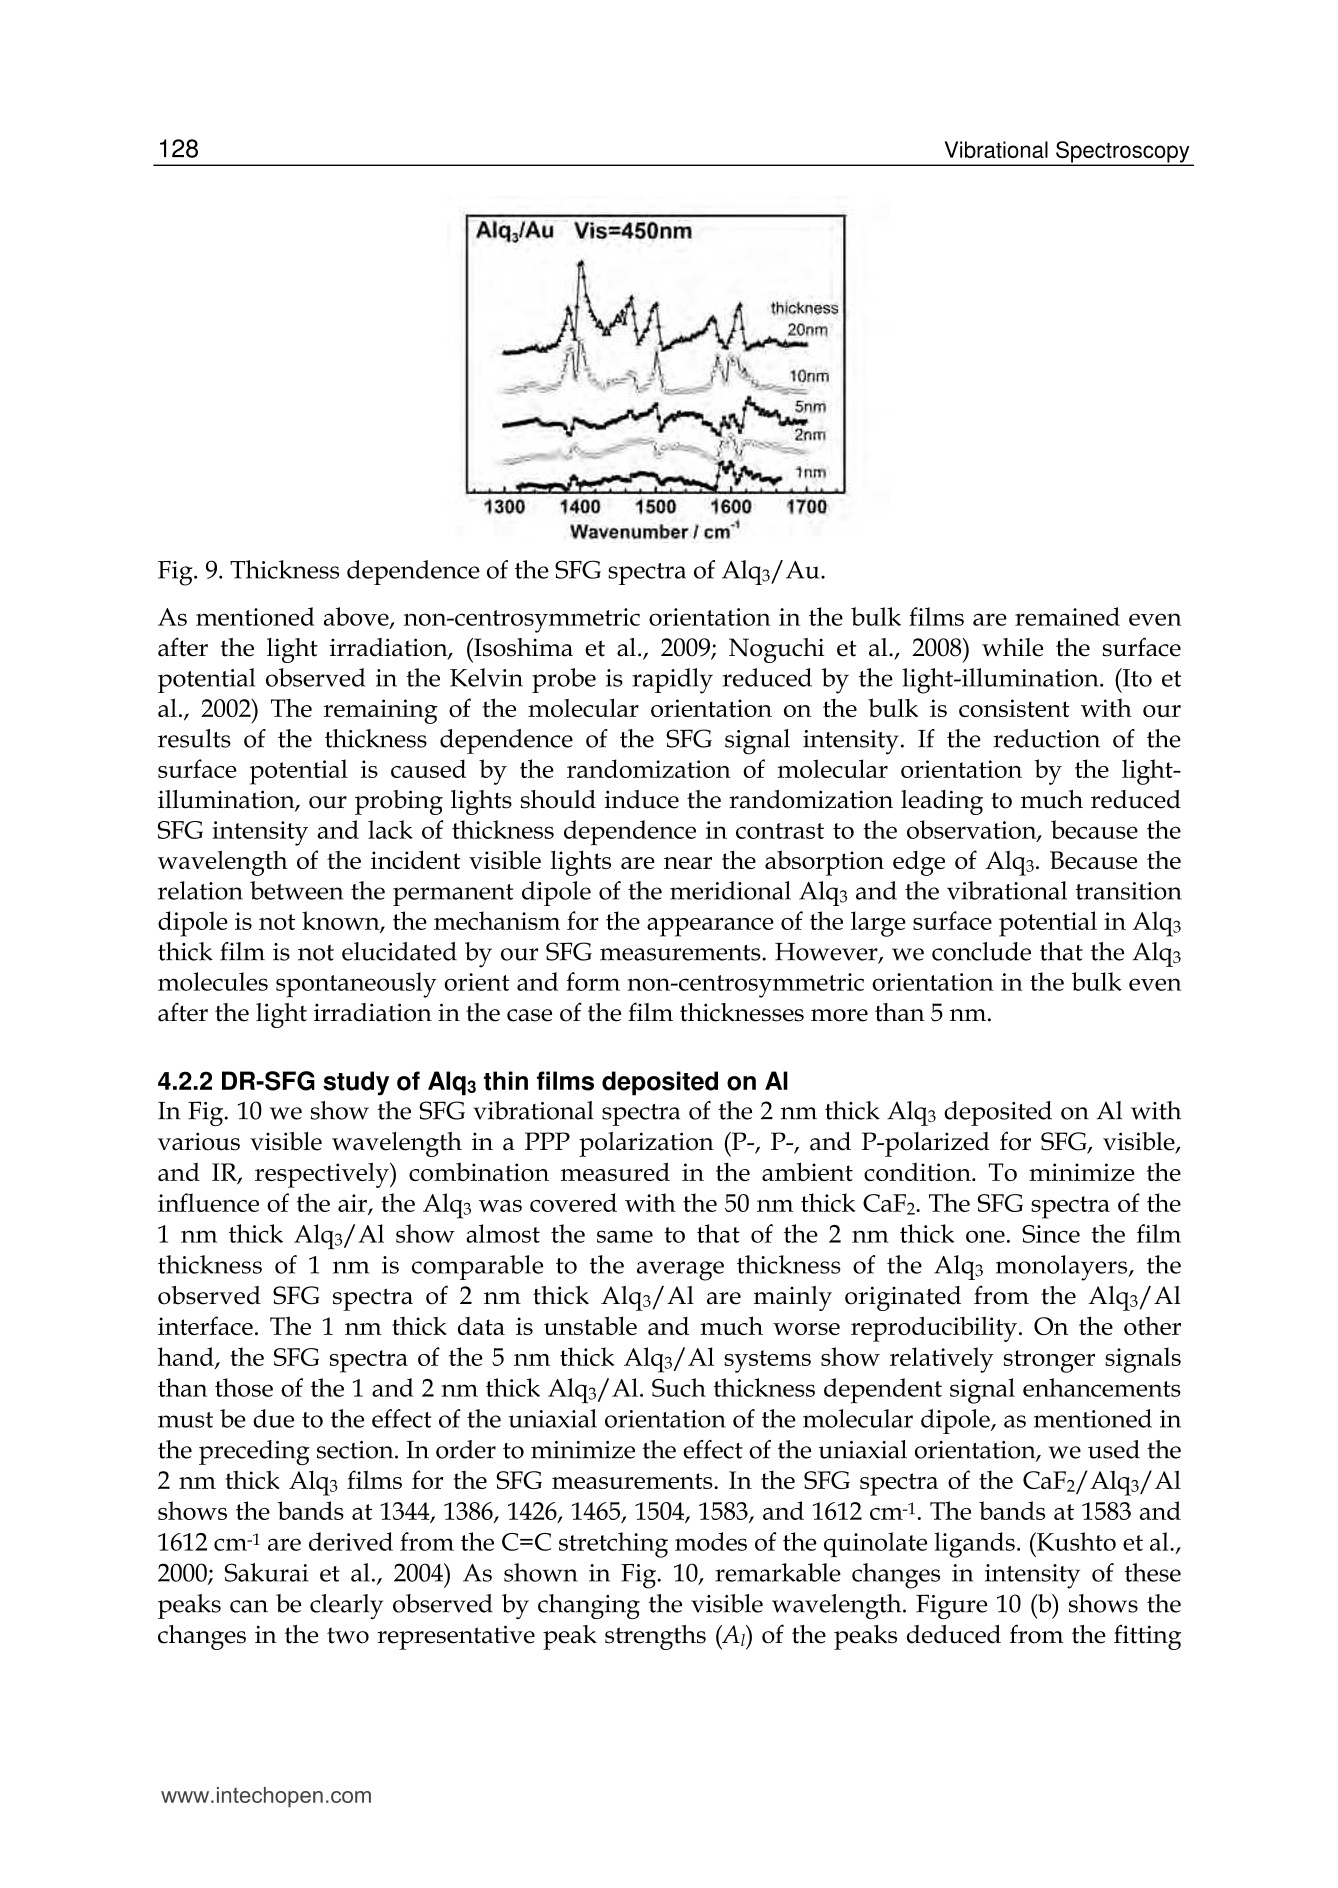
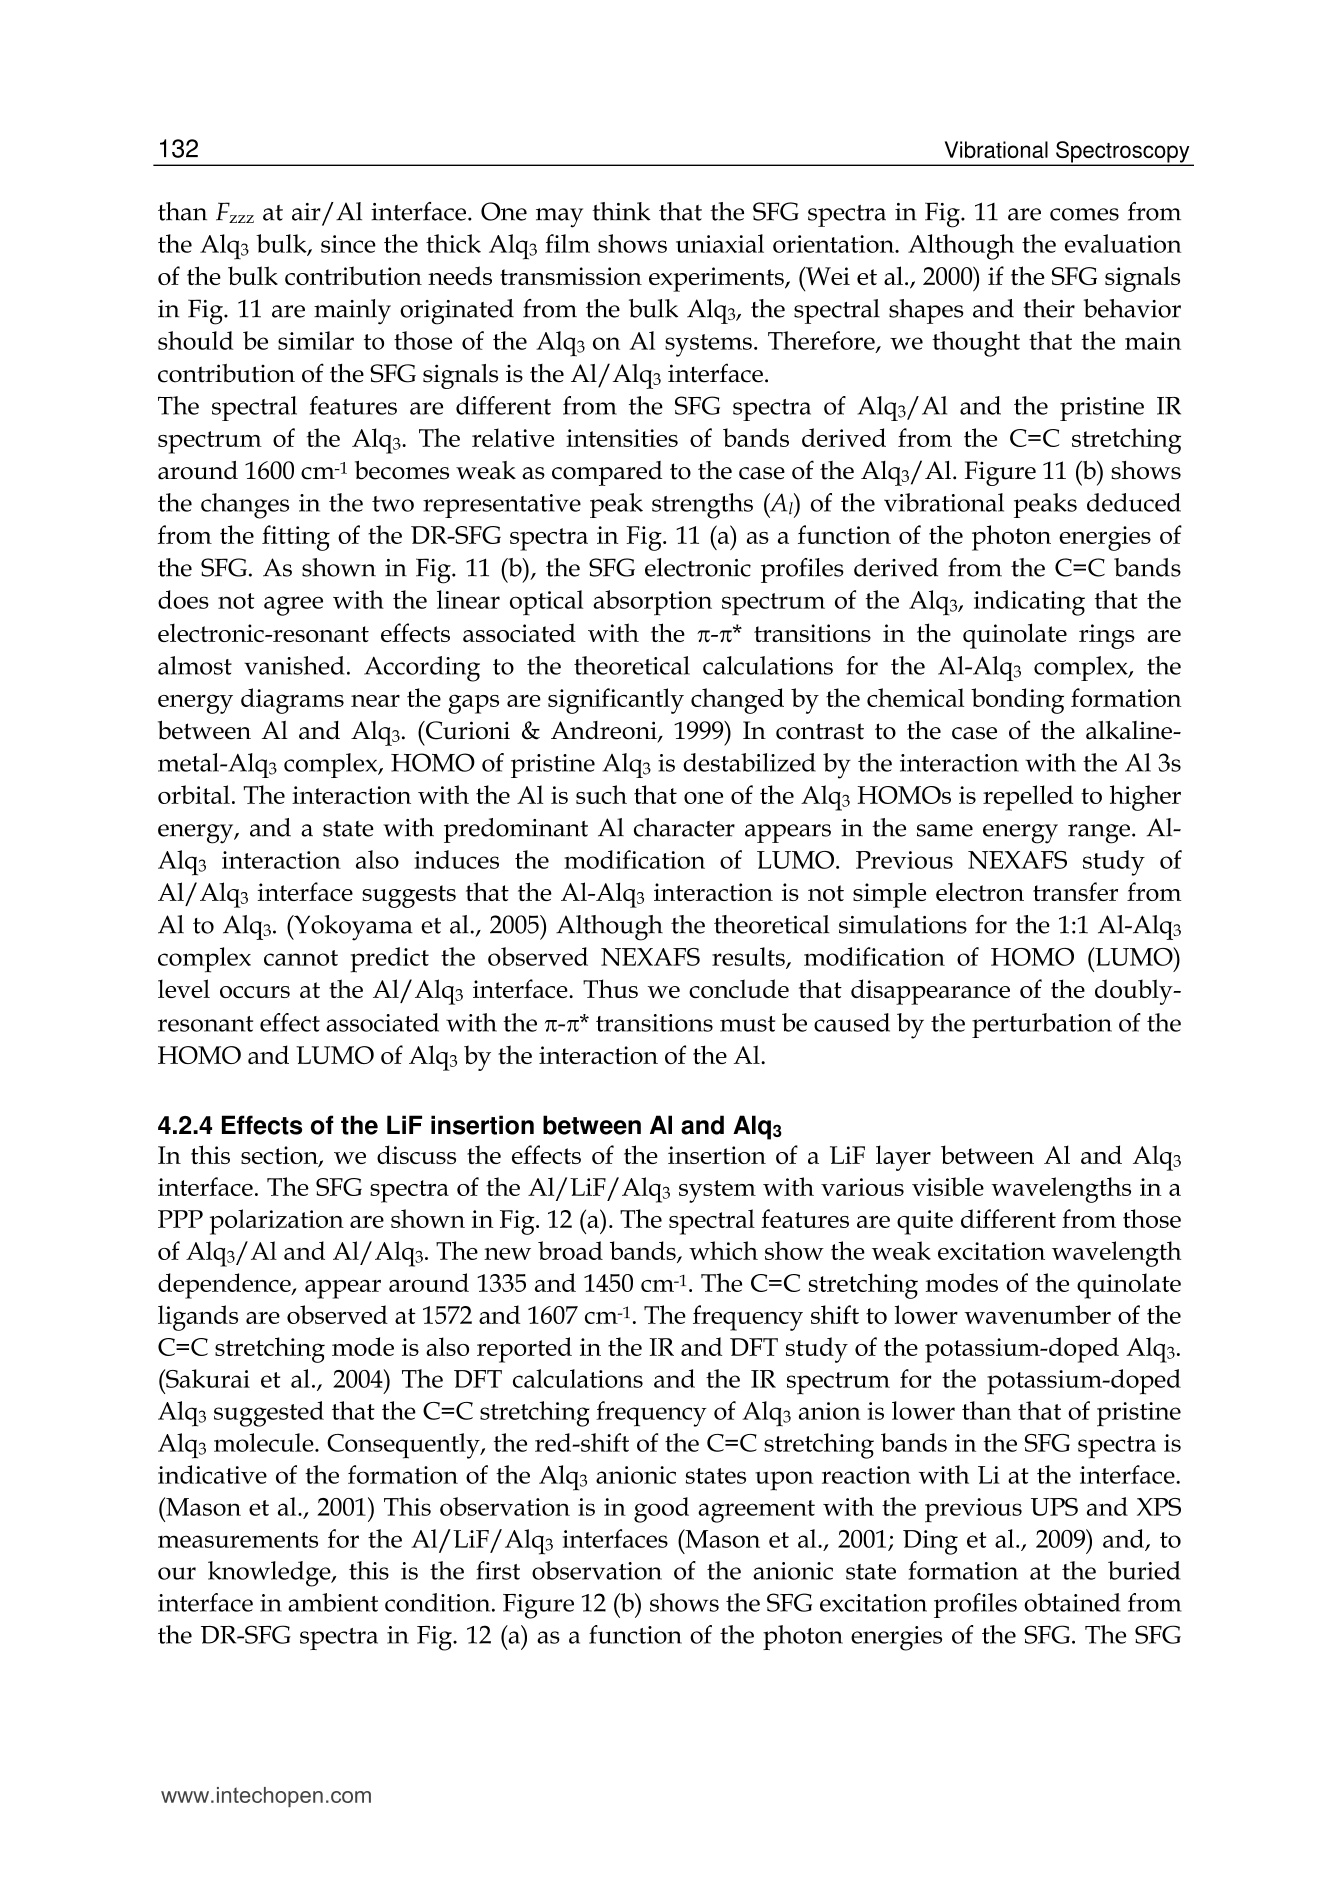
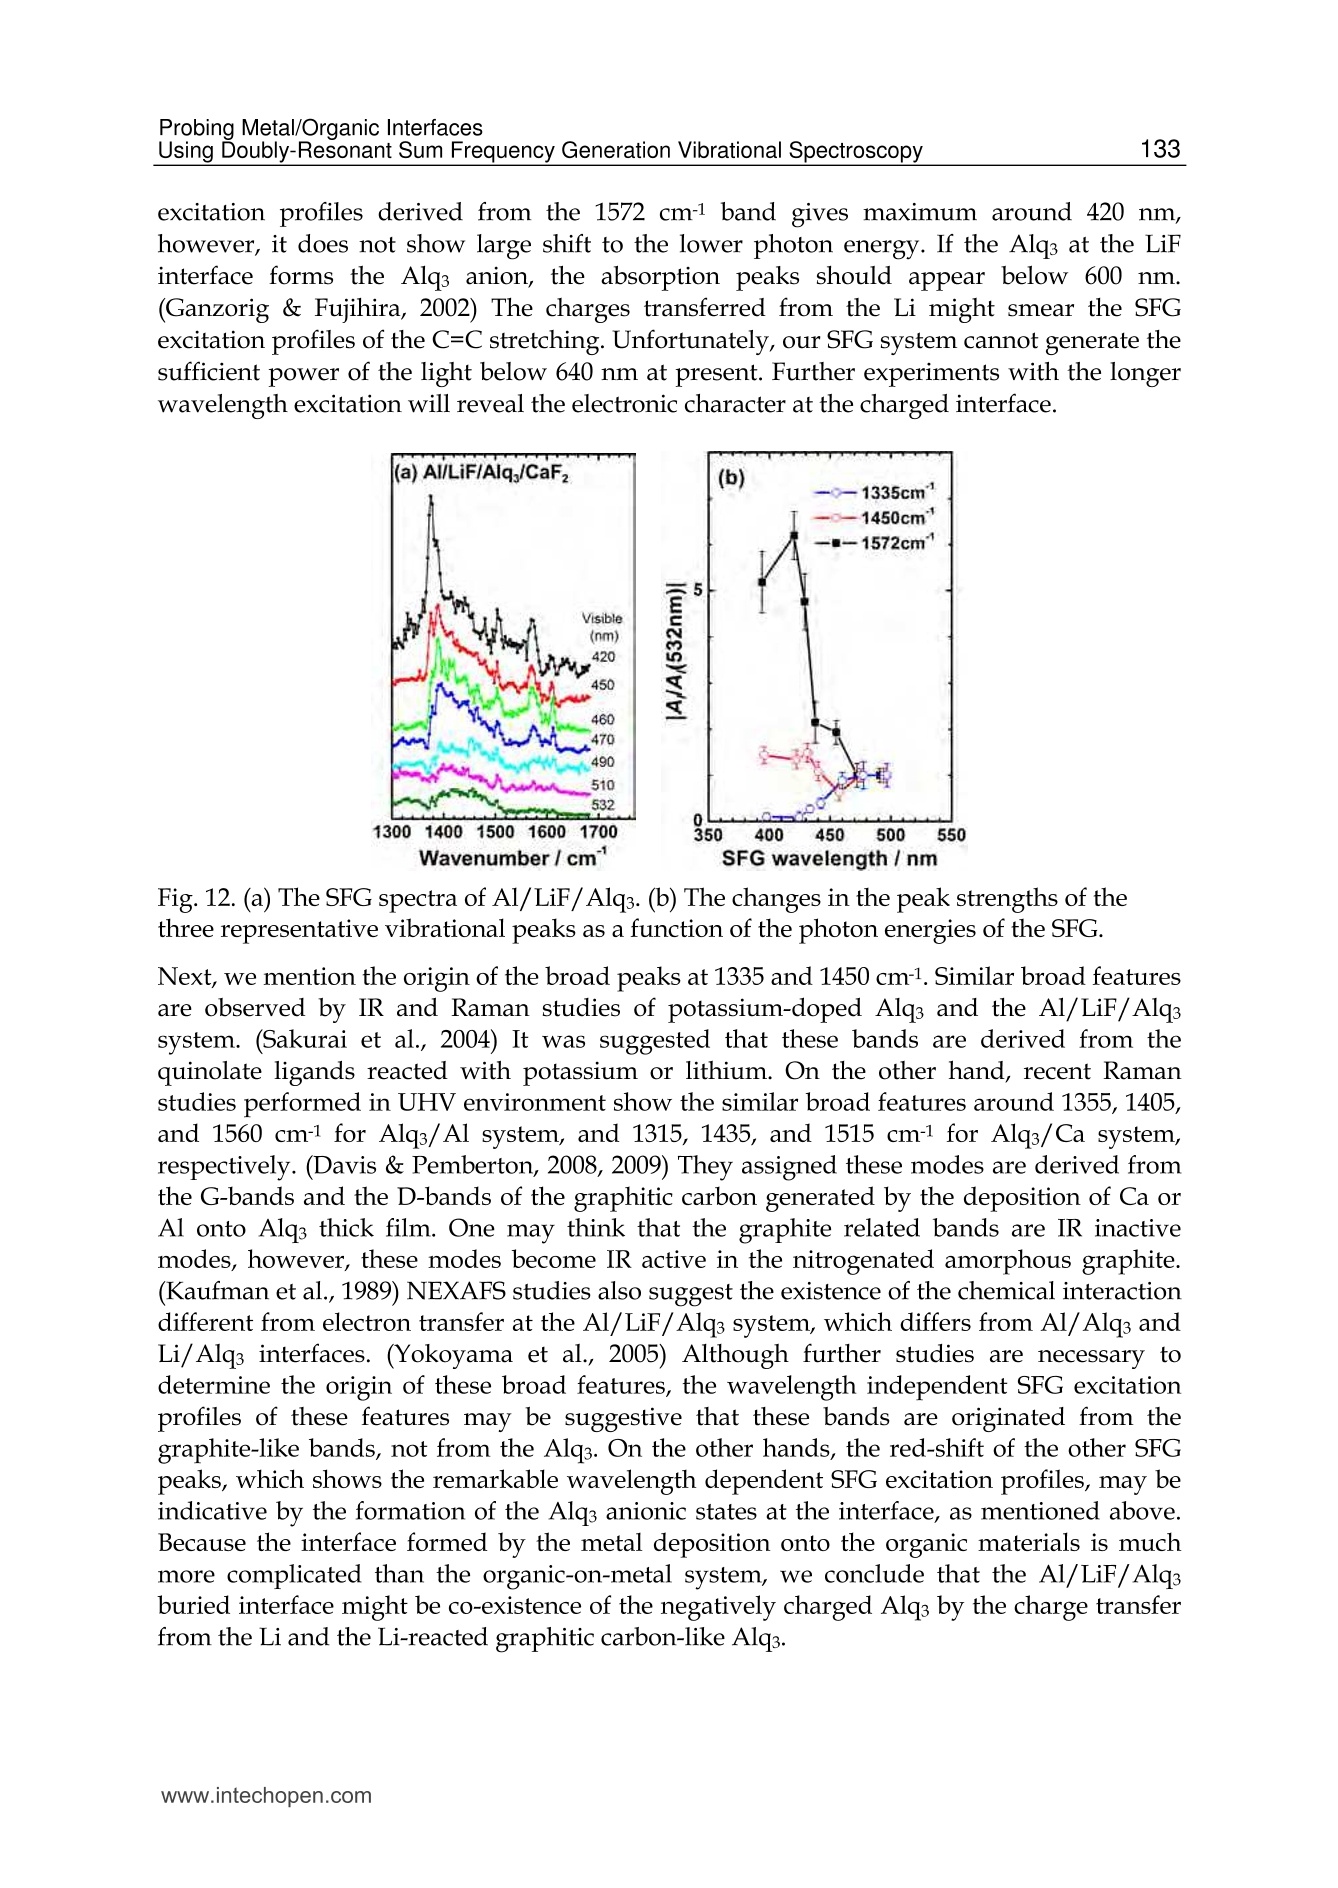
5 116Vibrational Spectroscopy Probing Metal/Organic InterfacesUsing Doubly-Resonant Sum FrequencyGeneration Vibrational Spectroscopy Takayuki Miyamae Nanosystem Research Institute,National Institute of Advanced Industrial Science and Technology (AIST), japan 1. Introduction Recent advances in the performance of organic semiconductors such as organic lightemitting diodes (OLEDs), organic field-effect transistors (OFETs), and organic solar cellshave been dramatic. In particular for OLEDs, stability and durability have improved tolevels that warrant their application in everyday life. In organic devices, the charge carriers,both electrons and holes, often have to be injected through organic/electrode interfaces.Therefore, an understanding of the interaction between metal electrode and organicmolecules is quite important, because the electronic properties of metal/organic interfacedirectly affect the performance of the OLEDs. (Tang & Slyke, 1987; Salaneck et al., 2002) But9tthese are not well examined, especially the physical and chemical properties of buriedorganic/meal interfaces have been not well investigated. In order to understand themechanisms that control the electron energetic levels of organic/metal interfaces, thedetermination of the energy barriers between the Fermi level of the metal and the HOMOand LUMO levels of organic materials across the interfaces has been main challenges tosurface and interface studies of organic thin films. For understanding the occupied states,ultraviolet photoelectron spectroscopy (UPS) is one of the powerful techniques for studyingthe valence electronic structure of material. The electron injection barrier at themetal/organic interface is significantly altered by the interfacial dipole layer, by which thevacuum level at the organic layer is shifted relative to that at the metal layer. (Ishii et al.,1999) The dipole layer has been studied for organic/metal interfaces by using photoelectronspectroscopic technique. Ishii et al. proposed various origins of the dipole layer at theorganic/metal interface: (1) charge transfer, (2) mirror force, (3) pushback effect due to thesurface rearrangement, (4) chemical interaction, (5) interface state, and (6) permanent dipoleof the adsorbate. (Ishii et al., 1999) In contrast, the band gaps of the organic materials and the energy of LUMO are oftendetermined by the optical absorption measurements of the “bulk". Because of the surfaceconfinement effect and the interaction between organic molecules and metal, the molecularconformation and the band gap at the buried interface are expected to be different fromthose in the bulk. Although the optical band gap obtained from the absorption spectroscopyis different from the corresponding charge transfer gap due to the exciton absorption to form Frenkel-type exciton, the optical band gaps at buried interfaces are still useful energyparameter to discuss the charge injection and overall efficiency of the OLED. However, ithas been a great challenge to measure the buried interfacial electronic states because of alack of a suitable probing technique. Traditional surface science techniques based onultrahigh vacuum are not applicable to a buried interface, and absorption and emissionspectroscopy do not have the necessary surface sensitivity. Nonlinear optical spectroscopy is one of the powerful techniques for the characterization ofthese issues due to its high interface sensitivity. Second harmonic generation (SHG) andsum frequency generation (SFG) have been used to investigate the molecular orientation ofthe materials at the interface. (Shen, 1984) IR-visible SFG spectroscopy has made it possibleto study the vibrational spectra of surface or interfacial species. SFG is a surface-sensitivetool because itssecond-order nonlinear opticalFprocessSisallowed only in non-centrosymmetric media under the electric dipole approximation. Recently this technique hasbeen applied to interfaces that include organic materials, allowing the interfacial structuresto be elucidated. In our SFG studies of polymer/water, (Miyamae et al.,2007polymer/oxide, (Miyamae & Nozoye, 2004) and air/liquid interfaces, (Miyamae et al., 2008;Iwahashi et al., 2008) we have found that the molecular structures, such as the orientationand orientation distribution of different chemical groups, are not the same at the differentinterfaces. IR-visible SFG spectroscopy has been traditionally carried out by using the frequency-fixedvisible and tunable IR beams to obtain a surface vibrational spectrum, which identifies thesurface chemical species. Recently, a new technique for vibrational SFG spectroscopy bytuning the incident visible and IR frequencies has attracted much attention. (Raschke et al.,2002) When the photon energy of the SFG coincides with electronic transition energies ofinterface species, the output SFG intensity is drastically enhanced when the IR light isresonant with the vibrational state and the output SFG light is resonant with the interfacialelectronic transitions. Such enhanced SFG process is called doubly-resonant (DR) SFG. Withthe capability of tuning both the incident IR and visible frequencies, doubly-resonant SFGspectroscopy becomes a powerful multi-dimensional technique for studying the interfaceelectronic states coupled to a specific vibrational mode. The SFG electronic excitationprofiles, which can be obtained by measuring the visible probe frequency dependence of thevibrational SFG band strengths, allow deduction of coupling electronic transitions andvibrational modes at the interface. (Miyamae et al., 2009) In addition, there are several advantages of the doubly-resonant SFG technique. The signalenhancement is expected only for species that have an electronic absorption at the photonenergy of the SFG. Therefore, doubly-resonant effect offers a kind of molecular selectivity toSFG.Moreover, an electronic excitation spectrum of the interface species for each vibrationalband can be obtained. Thus the SFG excitation profiles are useful to investigate mixedinterface layers where several chemical species coexist and show complex vibrationalspectra, because vibrational bands can be classified with reference to correspondingelectronic spectra. In addition, the measurement of SFG excitation profiles may be aneffective way to obtain electronic spectra of the molecules, especially at interface on opaquesubstrates where electronic absorption spectrum measurement is difficult. Furthermore, itcan be possible to measure the interface of the OLED materials that show very strongphotoluminescence in visible region, since the output SFG emerges at the Anti-Stokes side ofthe excitation wavelength. This chapter is constructed as follows: in Section 2, we describe the theoretical backgroundsof the DR-SFG processes. Section 3 describes the experimental setup for the DR-SFGmeasurements and the sample preparation. Section 4 illustrates the DR-SFG study of theelectronic and vibrational properties of the OLED interfaces. The chemical structures of allthe organic compounds involved in this chapter are sketched in Figure 1. Fig. 1. Chemical structure of the various organic compounds under study: (a)PFO, poly(9,9-dioctyl-fluorene); (b) PEDOT:PSS; (c) meridional Alq3, tris(8-hydroxyquinoline) aluminum;(d) facial Alq3. 2. Theoretical background of the doubly-resonant sum frequency generation. In the electric dipole approximation, SFG is forbidden in centrosymmetric materials, but notat their interfaces, where the inversion symmetry of the bulk is broken. For such an air-metal interface, the SFG intensity reflected from the surface is given by where x2)erf is the effective second-order nonlinear susceptibility tensor and E(ωm) andE(ωvis) are the input fields. The second-order nonlinear susceptibility contains nonresonant,singly resonant, and doubly resonant contributions. The latter dominates strongly if thevibrations (ωi) and electronic transitions (eg) probed by ωr and ωsrc are coupled. Both IR-visible (vibrational transition followed by an electronic transition) and visible-IR processes(electronic transition followed by a vibrational transition) contribute to doubly-resonantSFG.(Raschke et al., 2002; Hayashi et al., 2002) However, the IR-visible sequence is expectedto dominate,as a result of the quicker relaxation of the electronic excitation compared to thevibrational one. Assuming harmonic potential surfaces for the electronic states and theBorn-Oppenheimer and Condon approximations, the doubly-resonant x2)ijk icanbedescribedas where N is the surface molecular density, pegi represents the i component of electronictransition moment, qi is the normal coordinate, Sr is a dimensionless coupling constant known as the Huang-Rhys factor, n labels the vibrational state, g and e label the ground andexcited electronic states, respectively, ωs is the SFG frequency, ω and Weg are the resonantvibrational and electronic frequencies, respectively, Ii and Iengo are the damping constants,the angular brackets indicate an average over molecular orientations, and x?)NR,ik describesthe non-resonant contributions. Sr is related to the shift d of the harmonic potential of thevibration in the excited electronic level by As shown in Fig. 2, DR-SFG occurs thus for ω =@ and for several visible frequencies, whenωs matches an allowed vibronic transition to the excited electronic level. The intensity ofeach vibronic resonance depends on the Frank-Condon overlap integrals of the vibrationallevels involved in the transition. Since the initial and final vibrational states, respectively ofthe visible and SFG transitions, always differ, the vibration and the electronic transitionmust therefore be coupled (d=0) to have a non-zero transition probability for the globalDR-SFG process. Thus the DR-SFG spectrum allows for the determination of the couplingstrengthand characteristics. Fig. 2. Energy diagram for DR-SFG.The vibration harmonic potentials are shifted betweenthe ground and excited states. The resonant transitions involved in the DR IR-visible (andvisible-IR) sum-frequency generation processes are shown schematically. Equation (2) includes all the vibronic transitions series. However, in general, the visible-IRSFG is much weaker and not detected because of the very fast relaxation of the electronicexcitation. For example, the dephasing times of vibronic transitions are in the femtosecondregion for Alqs. Therefore, by assuming Iengo>>Ieo,go, the nonzero vibronic transitions can beneglected. It is worth pointing out that a significantly larger Iengo also suppresses the aforementionedvisible-IR SFG, which starts with an electronic transition followed by a vibrationaltransition. To analyze the spectra, we note that with the visible input frequency @vis fixed, Eq. (2) can beapproximated by the form where A, ωi, Ii are the peak amplitude describing the electronic resonance, the resonantvibrational frequencies, and the damping constants, respectively.z(2)NR,ijk and describes thenon-resonant contributions and the phase difference between resonant and non-resonantterm, respectively. We use Eq.(4) to fit all the measured spectra with ωi, Ii,A ,and x(2)NRas adjustable parameters. 3 Experimental methods and materials 3.1 Doubly-resonant sum frequency generation Figure 3 schematically depicts the SFG experimental setup for the doubly-resonant SFGmeasurements. (Miyamae et al., 2009 & 2011) Tunable IR and visible laser beams weregenerated by two optical parametric generators/amplifiers (OPG/OPA, Ekspla,PG401VIR/DFG) pumped by a mode-locked Nd:YAG laser at 1064 nm (Ekspla,PL-2143D,25ps, 10Hz). The IR beam, tunable from 1000cm-1 to 4300 cm-1, was produced by differencefrequency mixing of the 1064 nm beam with the output of a LiB3O5 (LBO) crystal mountedin OPG/OPA, which is pumped by the 355 nm beam. The visible beam, tunable from 420 to640 nm, was generated in a LBO crystal mounted in OPG/OPA pumped by the 355 nmbeam. The visible and IR beams were overlapped at sample surface with the incidenceangles of 70° and 50°, respectively. The spectral resolution of the tunable visible beam wasabout 8 cm-1, and its frequency was calibrated with the Hg lines. The spectral resolution ofthe IR beam was 6 cm-1, and the IR frequency was calibrated with the absorption lines ofpolystyrene standard. In order to minimize the irradiation damage, both tunable infraredand visible beams were defocused. The focus size of the infrared and visible beams were >1mm and >3 mm, respectively. Further, in order to avoid photo-irradiated damage, thefluence of the visible beam was kept below 100 p per pulse. The absence of the damageeffect was confirmed by repeated SFG measurements. In order to eliminate the scatteredvisible light and the photoluminescent light from the samples, the sum-frequency outputsignal in the reflected direction was filtered with short-wave-pass filters (Asahi Spectra Co.Ltd.), prism monochromator (PF-200, Bunkoukeiki Co., Ltd.), and grating monochromator Fig. 3.The schematic arrangement of the SFG spectrometer for the DR-SFG.OD; Opticaldelay, SWP; short wave pass filters, PMC; prism monochromator, GMC; gratingmonochromator, PMT; photomultiplier tube. (Oriel MS257). Then the SFG signal was detected by a photomultiplier tube (HamamatsuR649). The signal was averaged over 300 pulses by a gated integrator for every data pointtaken at a 3 cm-1 interval and was stored in a personal computer. In the frequency regionbetween 2000 and 1300 cm-1, significant portion of the infrared beam is absorbed by watervapor in the optical path. The effect was minimized by purging the optical path of the IRbeam and the sample stage by dry nitrogen gas. Each SFG spectrum was normalized to thevisible and IR power to compensate the laser intensity fluctuations. 3.2 Sample preparations for the SFG measurements 3.2.1 Preparation of the PFO samples The samples of the PFO endcapped with dimethylphenyl (MW=48.8K) were obtained fromAmerican Dye Source and used as received. Thin film of the PEDOT:PSS solution (CREVIOSAl4083) was spin-coated at 3000 rpm on the top of the fused quartz or CaF2 substrates andthen baked at 150 °℃ for 60 min in an oven with N2 flow. PFO layer was then spin-coated at3000 rpm from 1% w/v toluene solution on top of the PEDOT:PSS layer. Then the filmswere evacuated to eliminate residual solvent. For the measurements of the buried Al/LiF/PFO interface, the LiF and the Al were directlydeposited on the spin-coated PFO/PEDOT:PSS onto CaF2 substrates in a vacuum chamber.The thicknesses of the LiF and Al are about 1 and 40 nm, respectively. 3.2.2 Preparation of the Alq3 samples For the preparation of the Alq3/Al samples, the Al substrates were prepared by vacuumevaporation of Al on Si substrates by using a tungsten filament. Here, the notation of A/Bindicates a system prepared by depositing A on B. Deposition of Alq3 was performed usinga quartz crucible coiled with a tungsten wire heater. Alqs were deposited on them underdark condition in a vacuum chamber. In order to avoid the influence of the air, 50 nm thickCaF2 was deposited after the deposition of the 2 nm thick Alq3. For the observation of theAl/ Alqs interfaces by SFG, the Alqs films were directly deposited on CaF2 substrates, andthick Al layers were then deposited under dark condition. For Al/LiF/Alq3, thin LiF film of1 nm thick was deposited on the Alq3 from a tungsten basket. Then 50 nm thick Al layer wasdeposited on the LiF layer. After the deposition, the SFG measurements were subsequentlyperformed in ambient conditions. 4. DR-SFG study of organic/metal Interfaces 4.1 DR-SFG study of poly(9,9-dioctylfluorene) surfaces and Al/LiF interfaces Polymer LEDs are one of the most promising applications given the current high interest indeveloping ultra thin computer monitors and television sets, i.e., flat-panel displays. Theresearch on polymers in LEDs has undergone a rapid expansion beginning in 1990, whenresults on a light-emitting diode with poly(p-phenylenevinylene) (PPV), as the emittinglayer was published.(Burroughes et al., 1990) Recently, one particular classes of conjugatedpolymers, the poly(9,9-dioctylfluorene)(PFO, chemical structure is shown in Fig.1) andfluorene-arylene copolymers have been studied intensively because of its applications in theLEDs due to their highly efficient blue photoluminescence. (Mallavia et al., 2005) Althoughthe bulk electronic and optical properties of PFO have been studied extensively by UV-visible absorption, Raman, and photoluminescence spectroscopy,(Ariu et al., 2000; Montilla & Mallavia, 2007) the optical and electronic properties of PFO at the buried electrode interface remain unexplored. Because the electronic properties of electrode/organicinterface affect the performance of the organic LEDs, understanding of the interactionbetween the electrode and organic molecules and the electronic structures at the buriedinterfaces are quite important. In an organic device, the charge carriers have to be injectedthrough polymer/electrode interfaces. Therefore, the band gaps of conjugated polymers atthe buried interface are important energy parameters to discuss the charge injection andoverall efficiency of the organic devices. In this study, we present the surface and the buriedinterfacial vibrational and electronic structure of the PFO using SFG. (Miyamae et al., 2010)Figure 4 shows the SFG vibrational spectra from the PFO/PEDOT:PSS/quartz surface withvarious visible wavelengths in a SSP configuration (S-, S-, and P-polarized for SFG, visible, andIR, respectively).SFG susceptibility of the quartz is expected to be approximately constant inthe visible region because it is transparent to visible light. A strong vibrational band wasobserved at 1610 cm-1 in all spectra, and the band intensity increased when the visible probewavelength was changed from 550 to 435 nm. The vibrational band at 1610 cm-1 is assigned tothe C=C symmetric stretching of the fluorene rings located at the backbone of PFO. Theelectronic resonance enhancement of the SFG spectra is observed when the visible wavelengthis near 435 nm, which produces a SFG wavelength near 407 nm with an IR beam of 1610 cm-1.It should be noted that the PFO surface does not change during the SFG measurements. It hasbeen reported that the oxidative defect are formed during the operation or UV lightirradiation. (List & Guentner, 2002; Gong et al., 2003) The UV-visible and IR absorptionsignature allow an identification of the defects as ketone groups attached to the 9-position ofthe fluorene unit; thus, the fluorene unit becomes a 9-fluorenone due to oxidative degradation.The SFG spectra clearly shows that the absence of the oxidative peak derived from the fluorenone, indicating that the PFO surface is not oxidized during the SFG measurements. Fig. 4. SFG vibrational spectra of PFO surface with various incident visible wavelengths.Spectra are offset for clarity Next, we show in Figure 5 the SFG spectra from the buried Al/LiF/PFO interface with variousvisible wavelengths in SSP polarization combination. In this project, the LiF and the Al layerswere directly deposited on the spin-coated PFO/PEDOT:PSS onto CaF2 substrate. Since the deposited Al layer can act as superior gas barrier, the extent of the oxidation of the Alinterfaces is expected to be much reduced. The vibrational band at 1610 cm-1 is still observed inall SFG spectra. As discussed later, the 1610 cm-1 peak is not derived from the buriedPFO/PEDOT:PSS interface due to the less orientational order at the polymer/polymerinterface. The peak position of the band does not change between the PFO surface and the PFOinterface, indicating that the PFO is not degradated by the Al deposition. In the case of the DR-SFG spectra of the Al/LiF/PFO interface, it should be noted that the SFG peak shows differentshape from that of the air/PFO interface. This difference is caused by the different interferencephenomena with the SFG non-resonant contribution arising from the Al substrate. Fig.5. The SFG spectra of buried Al/LiF/PFO interface with various incident visiblewavelengths. The experimental data and the fitted curves using eq. 4 are represented bydots and solid lines, respectively. Experimental SFG setup for probing the buried interface isshown in the inset. Spectra are offset for clarity. Because of the electronic transitin of the PFO, the refractive index of PFO in the investigatedregion is wavelength-dependent. (Campoy-Quiles et al., 2005) Therefore, the Fresnel factorsneed to be considered to obtain the actual dispersion relation of the second-order nonlinearsusceptibility. In the electric-dipole approximation, the effective second-order nonlinearsusceptibility tensor for the SSP polarization can be written as where LYY(@) and Lzz(ω) are the Fresnel coefficients at frequency ω; ir is the reflection angleof the IR frequency; and Xyyz is the nonvanishing yyz component of the second-ordernonlinear susceptibility in the laboratory coordinate. In the SSP polarization, the Fresnelfactor can be written as The refractive indices for PFO and metallic aluminum reported by Campoy-Quiles et al.(Campoy-Quiles et al., 2005) and the literature (Parik, 1985) were used for the evaluation ofthe Fresnel factors. In general, there are two types of processes in IR-visible SFG, as mentioned in the theoreticalsection. The first type starts with an electronic transition followed by a vibrational transition(VIS-IR SFG), and the second type begins with a vibrational transition followed by anelectronic transition (IR-VIS SFG). (Hayashi et al., 2002) Because the electronic relaxationtimes are generally much shorter than the vibrational relaxation times, the contribution ofthe VIS-IR SFG is generally negligible. If the VIS-IR SFG occurs, increase of the non-resonantbackground is expected due to the ultrafast dephasing dynamics of the Si state. (Wu et al.,2009) Therefore, only the IR-VIS SFG will be considered in the following analysis. Wavelength/nm Fig.6.(a) Optical absorption spectrum of the PFO spin cast film. (b) The SFG electronicexcitation profile of air/PFO interface and the Fresnel factor Fyyz (continuous blue curve) atair/PFO interface, and (c) the SFG electronic excitation profile of Al/LiF/PFO interface andthe Fyyz at CaF2/Al interface (red curve). Solid black lines are guide to the eyes. (d) Proposedmodel for the planar configuration at the interface. The curves b and c in Figure 6 show the changes in the A of the 1610 cm- peak deduced fromthe fitting of the DR-SFG spectra in Figs. 4 and 5 as a function of the photon energies of theSFG. Figure 6a shows the optical absorption spectrum of the PFO spin cast film. The broadoptical absorption band originates from inhomogeneously broadened →元* transitions of theglassy PFO. (Cadby et al., 2000) As shown in Fig. 6, the SFG electronic excitation spectrumobtained from the air/PFO interface is slightly red-shifted with respected to an opticalabsorption maximum of PFO film. The SFG excitation spectrum at the Al/LiF/PFO interface isalso plotted in Fig. 6c, and it is further red-shifted with respected to that of the PFO surface. Itshould be noted that these red-shifts are not caused by the visible variations of the Fresnelfactors. As shown in Fig. 6, the wavelength variations of the Fvy both air/PFO and CaF2/Alinterfaces do not explain the SFG electronic excitation profiles of the air/PFO and the buriedinterface. Thus we conclude that the changes of the Fresnel factors do not much affect on thespectral shape of the SFG excitation profile of the 1610 cm-1 peak. We attribute that the origin of the red-shifts of the SFG electronic excitation spectra from theair/PFO and Al/LiF/PFO interfaces are due to the stress-induced surface confinementeffects of the polymer backbone, as in the case of the MEH-PPV interfaces. (Li et al., 2008) Ingeneral, the optical band gap of a conjugated polymer is closely related to the conjugationlength. Conjugated polymer chains consist of a series of connected segments, each of which has a different extent of n-electron delocalization. Although the extent of the conjugation islimited by the twists in the polymer backbone, the longer the segment is, the smaller theoptical band gap of the conjugated polymers due to the increasing average effectiveconjugation length. The restriction of the torsion angle between adjacent segments at theair/polymer and the Al/LiF/polymer interfaces produce a longer conjugation length.Similar red-shift of the electronic excitation profile at the interface has been also reported bythe SFG measurements for the MEH-PPV interfaces. (Li et al., 2008) To gain further structural information at the PFO surface, we performed the SFGmeasurements in the CH stretching region. The SSP SFG spectrum of the PFO surface takenat the visible wavelength of 532 nm exhibits peaks derived from the aliphatic hydrocarbonpeaks that originate from the side chain of PFO, as shown in Fig. 7a. The tiny SFG signalsderived from the CH stretching mode of PFO ring are observed around 3050cm-1 at thevisible excitation wavelength of 532 nm. We also tried to measure the SPS and PPPpolarization combinations, however, the intensities of the peak around 3050 cm1 in SPS andPPP were much weaker than those of SSP spectra. One may think that the PFO surface mustbe covered with the side chain of the PFO because the peaks derived from the aliphatichydrocarbon peaks are clearly detected. However, this 3050 cm-1 peak is clearly observedwhen the visible excitation wavelength is changed to shorter wavelength, as shown in Fig. 7.This result indicates that the planes of PFO rings are nearly parallel to the surface plane atthe air/PFO interface, and the PFO surface is not fully covered with the aliphatic side chains. Ifthe molecules take a planar orientation at the surface, it is hard to detect in SFG without theelectronic resonance. It is well known that planar ordering of the polymer chains parallel to theinterfaces due to the confinement effects occurs and this creates highly anisotropic opticalproperties to the film surface. (Kawana et al., 2002; Knaapila et al.,2003) The planar ordering ofthe polymer chains at the surface is in good agreement with the X-ray diffraction studies andthe optical investigation by emission spectroscopy.(Cheum et al., 2009) Fig. 7. SFG spectra of (a) PFO on quartz substrate taken by the 532nm () and 450nm (o), (b)PFO/PEDOT:PSS on quartz, and (c) PEDOT:PSS on quartz. It is well known that the bulk solid PFO film exhibits complex phase behavior. DisorderedPFO forms the glassy phase where the polymer backbones do not form a particularconformation with long-range order. In contrast, PFO in the so-called p-phase is extendedconformation of PFO chains and possesses lower energy, due to the backbone planarization.(Grell et al., 1999) Single molecule spectroscopy demonstrates that the β-phase features ofPFO are the results of stress-induced backbone planarization of polymer chain. (Becker & Lupton, 2009) The optical absorption spectra of p-phase PFO exhibits the characteristicshoulder absorption around 430 nm in comparison with the glassy PFO. The SFG electronicprofiles of the PFO interfaces have maximum around 410-420nm, and this peak position isclose to the shoulder absorption of the p-phase PFO, rather than that of the glassy PFO.Because of the restriction of the torsion angle between adjacent segments, the conformationof the polymer backbone is limited at the polymer interfaces. As a result, the effectiveconjugation length at the interface is increased. Thus we conclude that the optical band gapsat the Al/LiF/PFO interfaces become smaller than that of the bulk glassy PFO, due to thestress-induced chain planarization at the air/PFO and the Al/LiF/PFO interfaces. Theappearance of β-phase in the PFO films can be affected by many experimental treatments,such as, thermal annealing, organic solvent vapor exposure, mechanical stress, chemicalmodification of PFO chains, and so on. (Zhu et al., 2008) In addition to these treatments, ourfindings indicate that the interface confinement effect is also affected to induce the planarorientation of the polymer chains. Proposed planar orientation of the PFO chains at theinterfaces is shown in Fig. 6(d). Figure 7 also indicates thatthe SFG signalsare not)tcderivedffrom the buriedPFO/PEDOT:PSS interface. To endure the observed SFG is truly generated at the air/PFOinterface without a contribution from the buried PFO/PEDOT:PSS interface, we comparethe SFG spectra for the PFO coated on PEDOT:PSS and the PEDOT:PSS films in the CHstretch region. The SFG spectrum of the PEDOT:PSS exhibits three vibrational resonancesfrom CH stretches at 2855, 2927, and 3074 cm-1. (Silva & Miranda, 2009) With an additionalPFO layer, the SFG spectrum changes both in intensity and shapes. The SFG spectra of thePFO on PEDOT:PSS layer is very close to that of the PFO. Consequently, the topmostmolecular orientation of the PEDOT:PSS does not affect the surface molecular orientation ofthe PFO. From this observation, we conclude that only the topmost layer has a netorientational order and contributes to the SFG spectra while the interface between PFO andPEDOT:PSS does not have contributions to the SFG spectra due to less orientational orderthat is inactive for SFG. 4.2 DR-SFG study of tris-(8-hydroxy-quinoline) aluminium (Alqs)/Al interfaces 4.2.1 DR-SFG study of Alq3 films: Peak assignments and the thickness dependences In this section, DR-SFG was applied to detect the interfacial vibrational and electronic statesof tris(8-hydroxyquinoline) aluminum (Algs)/Al interfaces. (Mivamae et al. 2011) In OLEDs,Alq is most widely used as electron transport/light emitting material. It is well known thatAlqs has two possible geometrical isomers of meridional (Ci symmetry) and facial (C3symmetry) forms, as shown in Fig. 1. In the meridional isomer, the three quinolate ligandsaround the central Al atom are not equivalent, while they are equivalent in the facial isomer.It has been reported that a- and amorphous Alq3 consist of the meridional isomer, while y-and 8-Alq3 consist of facial isomer. (Nishiyama et al., 2009) Elucidating the electronicstructures of the Alqs/metal interface is required for its applicability to OLED. Suchnecessity should increase, due to the recent report of a significant enhancement of thecurrent injection and OLED output induced by the insertion of an insulating layer such asLiF,(Hung et al., 1997) MgO, or MgF2 (Shaheen et al., 1998) between the Al cathode and theAlq3. Various mechanisms for this enhancement in the device efficiency have beenproposed, and investigated using various techniques such as XPS, UPS, (Mason et al., 2001)and high resolution electron energy loss spectroscopy (HREELS). (He et al., 2000) Onehypothesis is that thin LiF layer protects the Alqs from the deleterious reaction with Al. Another hypothesis is that Li atoms produced by the dissociation of LiF by Al depositionlead to formation of the Alq3 radical anion, is also considered. (Mason et al., 2001; Kido &Matsumoto1998) Figure 8 (a) shows the SFG spectra of 10 and 20 nm thick Alqs films on CaF2 substrateexcited by the visible light of 450 nm with the PPP polarization combination. In Fig. 8(b), wecompare the transmission IR spectrum of 69nm thick Alqs film deposited on CaF2 substrateand the simulated IR spectrum for the Alqs. The observed IR spectra of pristine Alqs agreedwell with the IR spectrum of the meridional isomers in literature. (Kushto et al., 2000;Sakurai et al., 2004) The observed SFG spectra reasonably correspond to the IR spectrum interms of the energies of the spectral features. Two peaks around 1600 cm-1 are derived fromthe C=C stretching modes of the quinolate ligands. The observed total SFG intensity of20nm thick Alqs film shown in Fig. 8 was significantly larger than that of 10nm thick film,and the relative intensity of each peak also showed variation. We measure the SSP and PPPSFG spectra from 2 nm thick Alq3 film deposited on CaF2, however, the SFG signals derivedfrom the Alg3 were not observed. Fig.8. (a) The SFG spectra of 10 and 20 nm thick Alqson CaF2 substrate excited by thevisible light of 450 nm. (b) IR spectrum of 69 nm thick Alqs deposited on CaF2 substrate. In general, the growth of the SFG signal intensities with increasing the film thickness can beinterpreted by the several reasons. First, the bulk SFG signal effect may come from thedipole-forbidden transitions. It is known that the dipole-forbidden transition observed inthe SHG of the solid C60 films. (Koopmans et al., 1993; Kuhnke et al., 1998) Second-ordernonlinearities of C60 are forbidden by symmetry under the electric-dipole approximation,but nonlocal bulk electric-quadrupole and magnetic-dipole processes appear due to itsspherical character. However, such bulk contribution is not observed in the thicknessdependence of the SHG on the photo-irradiated Alqs films. (Yoshizaki et al., 2005) Thus thebulk dipole-forbidden effects are excluded. Second, due to the existence of the two (air/Alq3and Alqs/CaF2) interfaces, the interference of the SFG signal between the two interfaces willinduces the enhancements of the SFG signal intensities. The interference effects of the SFGsignal due to the multiple layers are well analyzed by Hirose et al. (Hirose et al., 1998; Ishidaet al., 1998) However, the SHG on the photo-irradiated Alqs films does not show suchinterference pattern. (Yoshizaki et al., 2005) Moreover, the decrease of in the intensity of theSHG signal was observed when the Alqs film was heated at a temperature lower than 100℃. (Kajimoto et al., 2006) Although the part of the SFG signal might be influenced by theinterference between the two interfaces, these SHG results suggest that the interference effect is not the main origin of the increase of the signal intensities. We attributed that thegrowth of the SFG signal is due to the non-centrosymmetric orientation of the bulk film, asin the case of the ordered formic acid layers on the Pt. (Hirose et al., 1998) It has beenreported that a large potential is built in as-deposited Alq3 thick film in dark and it decaysrapidly by exposure to the ambient light observed by the Kelvin probe method. (Yoshizakiet al., 2005; Ito et al., 2002) According to the Kelvin probe experiments, (Ito et al., 2002) thesurface potential increased rapidly, in the initial stage of Alqs deposition up to 1 nm on Alsubstrate, corresponding to the formation of the interfacial dipole layer. (Seki et al., 1997)After the initial shift, the surface potential increased linearly over a wide range of thicknessfrom 5 to 550 nm. And this behaviour is independent on the kind of the substrate. (Hayashiet al., 2004) For Alq3, meridional isomer possesses permanent dipole moment. Thus thepermanent dipole moment of Alq3 makes a significant contribution to the surface potentialwhen these dipoles align unidirectionally in the film. On the other hand, the large surfacepotential is rapidly reduced by exposure to ambient light. (Yoshizaki et al., 2005; Ito et al.,2002) At first, this was considered with the photo-induced randomization of molecularorientation, (Sugi et al., 2004) however, the first-order electroabsorption measurements forthe Alq3 confirms that the non-centrosymmetric molecular orientation remains even afterthe light irradiation, indicating that the reduction of the large surface potential is not causedby the orientation randomization. (Isoshima et al., 2009) It is also suggested that theorientation polarization of Alqs film is maintained in OLED structure even under lightillumination after the device fabrication. (Noguchi et al.,2008) To gain further information about the thickness dependent SFG signal intensities, in Fig. 9we show the SFG spectra of the Alq3 films deposited on Au substrate excited by the visiblelight of 450 nm with the PPP polarization combination. In this experiments, we used the Auprecoated Si substrates instead of the CaF2 in order to investigate how thickness the non-centrosymmetric orientation in the bulk films appears from. As shown in Fig. 9, thesignificant increase of the SFG signal intensities are observed from the range of the thicknessfrom 5 to 20 nm. This observation clearly indicates that the thickness of more than 5 nmthick Alqs film has uniaxial dipole orientation, because the SFG process is allowed in non-centrosymmetric media. In these spectra, it should be noted that the SFG peak shapes alsoshows the thickness dependence. This behavior must be mainly comes from the decrease inthe intensity of the non-resonant contributions from the Au. It is known that the intensity ofthe non-resonant term of the SFG is changed by the coverage of the surface. (Himmelhaus etal., 2000) In contrast, the SFG spectra of the 1, 2 and 5 nm thick Alq3 films deposited on Audoes not show the significant thickness dependence, and these spectra show almost thesame shapes and the same intensities. Since the Alqs thickness of 1 nm is comparable to theaverage thickness of the Alqsmonolayers, (Yokoyama et al., 2003) these results indicates thatthe observed SFG peaks mainly come from the Alqs/Au interface, and the molecularorientation of the inside of the Alqs films from the range of the thickness from 1 to 5 nmdoes not show the preferred orientation in the bulk. This finding is consistent with thepreviously reported thickness and the substrate dependence of the surface potentialmeasurements for the Alq3 evaporated films. (Hayashi et al., 2004) This result is alsosuggestive that the SFG signals from air/Alqs interface is negligibly small than those fromthe Alq3/ Au interface. SFG signal contribution from the air/ Alq3 interface will be furtherdiscussed in the next section. Consequently, we conclude that the inside of the thin films ofAlq3 does not form the effective non-centrosymmetric molecular orientation except theAlq3/ Au interface in the case of the film thickness under 5 nm. Fig. 9. Thickness dependence of the SFG spectra of Alqs/Au. As mentioned above, non-centrosymmetric orientation in the bulk films are remained evenafter the light irradiation, (Isoshima et al., 2009; Noguchi et al., 2008) while the surfacepotential observed in the Kelvin probe is rapidly reduced by the light-illumination. (Ito etal., 2002) The remaining of the molecular orientation on the bulk is consistent with ourresults of the thickness dependence of the SFG signal intensity. If the reduction of thesurface potential is caused by the randomization of molecular orientation by the light-illumination, our probing lights should induce the randomization leading to much reducedSFG intensity and lack of thickness dependence in contrast to the observation, because thewavelength of the incident visible lights are near the absorption edge of Alqs. Because therelation between the permanent dipole of the meridional Alq3 and the vibrational transitiondipole is not known, the mechanism for the appearance of the large surface potential in Alqsthick film is not elucidated by our SFG measurements. However, we conclude that the Alq3molecules spontaneously orient and form non-centrosymmetric orientation in the bulk evenafter the light irradiation in the case of the film thicknesses more than 5 nm. 4.2.2 DR-SFG study of Alq3 thin films deposited on Al In Fig. 10 we show the SFG vibrational spectra of the 2 nm thick Alqs deposited on Al withvarious visible wavelength in a PPP polarization (P-, P-, and P-polarized for SFG, visible,and IR, respectively) combination measured in the ambient condition. To minimize theinfluence of the air, the Alq3 was covered with the 50 nm thick CaF2. The SFG spectra of the1 nm thick Alq3/Al show almost the same to that of the 2 nm thick one. Since the filmthickness of 1 nm is comparable to the average thickness of the Alq3 monolayers, theobserved SFG spectra of 2 nm thick Alq3/ Al are mainly originated from the Alq3/ Alinterface. The 1 nm thick data is unstable and much worse reproducibility. On the otherhand, the SFG spectra of the 5 nm thick Alqs/Al systems show relatively stronger signalsthan those of the 1 and 2 nm thick Alq3/Al. Such thickness dependent signal enhancementsmust be due to the effect of the uniaxial orientation of the molecular dipole, as mentioned inthe preceding section. In order to minimize the effect of the uniaxial orientation, we used the2 nm thick Alq3 films for the SFG measurements. In the SFG spectra of the CaF2/Algs/ Alshows the bands at 1344, 1386,1426,1465,1504, 1583, and 1612 cm-1. The bands at 1583 and1612 cm-1 are derived from the C=C stretching modes of the quinolate ligands. (Kushto et al.,2000; Sakurai et al., 2004) As shown in Fig. 10, remarkable changes in intensity of thesepeaks can be clearly observed by changing the visible wavelength. Figure 10 (b) shows thechanges in the two representative peak strengths (Ai) of the peaks deduced from the fitting Fig. 10.(a) The SFG spectra of the Alqs on Al with various visible wavelengths. Spectra areoffset for clarity. (b) Changes in the peak strengths of the 1583 and 1504 cm-1 as a function ofthe photon energies of the SFG. Optical absorption spectrum of the Alqs film is also shownby gray line. (c) Evolution of the Fresnel factors of Fzzz (black line) and Fxxz (red line) for theair/ Al, Fzzz for the air/Alqs (green line), and Fzzz for the CaF2/ Alqs(blue line) interfaces. TheFarZ/Aly and pCafz/Alq3 are multiplied by 10. of the DR-SFG spectra in Fig. 10 (a) using eq. (4) as a function of the photon energies of theSFG. In order to observe the enhancement ratios of the peak strength with the output SFGfrequencies, the peak strengths are normalized with the strength of the SFG spectrum takenat the visible wavelength of 532 nm. For comparison, we show the optical absorptionspectrum of the 20 nm thick Alqs film on CaF2 in Fig. 10 (b). The excitation spectra exhibit aresonance almost coincident with the absorption spectrum for the Alq3 thin film. Especially,significant increase in intensity is observed for the band at 1583 cm-1. In contrast, theenhancements ratio of the SFG peak strength of the band at 1504 cm-1 is relatively weakerthan that of the bands at 1583 cm-1. These vibrational mode around 1583 cm-1 is assigned tothe C=C stretching of the quinolate group while the 1504cm-1 peak is mixed modes thatcontain the contributions from the C-C and C-H in-plane bending motions. (Kushto et al.,2000) They are expected to have different degrees of coupling with the electronic transition.For Alq3, the electronic transition at 390 nm is dominated by the -* excitation of thequinolate ligands. (Halls & Schlegel 2001) Thus it is reasonable that the C=C stretching ofthe quinolate ligands are effectively enhanced due to the resonance with the n-n* transitions.The SFG electronic excitation spectra in Fig. 10 (b) are slightly shifted to lower frequency ascompared to the optical absorption spectrum of the Alq. The shift of the electronictransition peak may be suggestive that the electronic excitation gap at the interface becomessmaller than that of the bulk. Since the SFG excitation spectra are not measured in the wholeregion across the optical transition peak, and therefore, further experiments with the shorterwavelength excitation are needed to reveal the definitive information of the excitationprofiles at the interface. For the analysis of the doubly-resonant SFG, it should be important to note that the changesof the Fresnel factors have to be considered since it might change with the variation of thevisible.e wavelength. The effectivethe second-order nonlinear susceptibilitytensorcomponents of an azimuthally isotropic sample contributes to the PPP SFG signals can bewritten as A,ppp=-Lxx(@sp)Lxx(@vis)Lzz(@m)cos Pse cos Bvis sin BIRxxz-Lxx(@sr)Lzz(@vis)Lxx(@m)cos Bsr sin Bvis cos BIRXxzx(7)+Lzz(@sp)Lxx(@vis)Lxx(@r)sin Bsp cos pvis cos BIRUzxx+Lzz(@sF)Lzz(@vis)Lzz(@m)sin Bse sin Bvis sin BIXzzz where Lxx(ω) and Lzz(ω) are the Fresnel coefficients at frequency ω; psr, pvis, and B are thereflection angles of the sum frequency, visible, and IR pulses, respectively; and Xiiks are thenonvanishing elements of the second-order nonlinear susceptibility. (Zhuang et al., 1999)We found that Xxzx and Xzxx are much smaller than Xxxz and Xzxx. Thus the Fresnel factorsFzzz=Lzz(@sF)Lzz(@vis)Lzz(@m)sin Bsr sin Bvis sin BIR andFxcxz =Lxx(@sF)Lxx(@vis)Lzz(@m)cos Pse cos pvis sinBIRwere calculated using the complexrefractive indices of metallic aluminum. (Parik, 1985) As shown in Fig. 10 (b), the Fzzz atair/ Al interface monotonically decreases with the increase of the photon energy of the SFG,and it does not explain the evolution of the SFG intensities of the Alq3/Al. Thus weconclude that the changes of the Fresnel factors do not much affect on the spectral shape ofthe SFG excitation profile of the Alq3/ Al.The analysis of the Fresnel factor is also important for the investigation of such a thin layered sample. We calculated the Fresnel factors Fzzz at air/Alq3 and CaF2/Alqs interfaces,assuming that the air/Alqs interface is azimuthally isotropic. The wavelength dependenceof the refractive indices for Alq3 were used for the evaluation of the Fresnel factors atair/Alq and CaF2/ Alqs interfaces. (Djurisic et al., 2002) As shown in Fig. 10 the Fzzz atair/Alq3 and CaF2/Alqs interfaces are much smaller than the Fzzz at air/ Al interface. Fromthis observation, we conclude that the experimentally observed SFG should be mainly fromthe Alq3/Al interface. In the previous UPS study of the Alq3 deposited on Al systems, an extra occupied stateabove the HOMO level was detected, suggesting a strong chemical interaction between Alqsand Al. (Yokoyama et al., 2003) It was suggested that the interaction between Al and Alq3 issomewhat different from the charge transfer as reported for alkaline metal doped Alq.(Curioni & Andreoni, 1999) On the other hand, a theoretical calculation of Alq3 layer on Al(111) suggested that the interfacial interaction is weak, (Yanagisawa & Morikawa 2006)These previous findings are controversial and not easy to discuss consistently, but onepossible reason of this discrepancy must be due to the least reactivity of the clean Al(111)surface used in the DFT. (Yanagisawa & Morikawa 2008) If the strong chemical interactionoccurs at the interface, the vibrational SFG spectra and the corresponding electronicexcitation profiles should provide different behavior to those of the bulk. On the contrary,the SFG excitation profile of the 1583 cm-1 band is almost identical to the visible opticalabsorption spectrum of the pristine Alq, and we cannot find such spectral changes.Although the electronic excitation profile does not show significant changes, however, theposition of the C=C stretching peak shows slightly red-shifted. As discussed below, red-shiftof the C=C peak is indicative of the charge transfer from the Al substrate to Alq3. 4.2.3 DR-SFG study of Al layer deposited onto Alq3 The traditional surface analysis techniques such as UPS have been applied to examine theinterfaces formed by depositing organic material on metals, which are not much troubled bythe factor of chemical reaction. (Ishii et al., 1999) Actually, in many cases the UPS spectra of organic-on-metal systems show only rigid shifts on the energy scale, suggesting the absenceof strong chemical interaction. In contrast, actual OLEDs are fabricated by organic layerssandwiched by a cathode and anode. The buried interface between metal anode and theorganic layer is formed by the deposition of the metal on organic materials. When the metalis deposited on an organic layer by evaporation, the high reactivity of the vaporized hotmetal atom often leads to a chemical reaction at the interface, and diffuse into the organiclayer. Due to the energy transfer from the hot metal atom, deposition of the metal on organicmaterials may also induce the decomposition of the molecules, polymerization of themolecules, reorientation of the molecules, desorption of the organic materials from thesubstrate, and so on. Thus the "metal-o2n1-1oer gtaonic" systems are generally much more complexthan the organic-on-metal systems. Due to the high reactivity of the Al atom, reactionsbetween the Alq and Al are expected by the deposition of the Al layer. For thecharacterization of the buried metal-on-organic interface, next, we measure the SFG spectrafor the Al deposited on Alqs film. The deposited thick Al layer can act as superior gasbarrier, and the extent of the oxidation of the Al interface is much reduced. In Fig. 11, we show the SFG spectra of Al film directly deposited on 5nm thick Alqs film onCaF2 substrate with various visible wavelengths in a PPP polarization. In the case of theAl/Alqs/CaF2 system, the thickness of Alq3 is set to 5 nm. When we use the Alqs layer of 2nm thick sandwiched by CaF2 and Al, the SFG gives quite weak signal. Low stickingprobability of the Algs on CaFz is not plausible judging from the molecular weight of Alg3.Although the exact reason is not clear at this present, we tentatively thought that thedetectable interface could not be formed by the deposition of the 2 nm thick Alq3. Asmentioned above, the metal atoms often diffuse into the organic layer, and this process mayprevent to form the clear interface for the 2 nm thick Alq3 sandwiched between CaF2 and Al.It should be noted that the SFG signal comes mainly from the Al/Alqs interface, not fromthe Alqs/CaF2 interface, because no SFG signals are detected from the thin Alqs layerdeposited on CaF2. This is further supported by the Fresnel factor difference between Al andCaF2 interfaces. We show in Fig. 10 (b), the Fzzz at CaF2/ Alqs interface are negligibly smaller Fig. 11. (a) The SFG spectra of Al/Alqs/CaF2substrate. (b) Changes in the peak strengths ofthe 1586 and 1500 cm-1 of the SFG spectra as a function of the photon energies of the SFG. than Fzzz at air/Al interface. One may think that the SFG spectra in Fig. 11 are comes fromthe Alqs bulk, since the thick Alqs film shows uniaxial orientation. Although the evaluationof the bulk contribution needs transmission experiments, (Wei et al., 2000) if the SFG signalsin Fig. 11 are mainly originated from the bulk Alq, the spectral shapes and their behaviorshould be similar to those of the Alqs on Al systems. Therefore, we thought that the maincontribution of the SFG signals is the Al/ Alq3 interface. The spectral features are different from the SFG spectra of Alqs/Al and the pristine IRspectrum of the Alq3. The relative intensities of bands derived from the C=C stretchingaround 1600 cm-1 becomes weak as compared to the case of the Alq/ Al. Figure 11 (b) showsthe changes in the two representative peak strengths (A;) of the vibrational peaks deducedfrom the fitting of the DR-SFG spectra in Fig. 11 (a) as a function of the photon energies ofthe SFG. As shown in Fig. 11 (b), the SFG electronic profiles derived from the C=C bandsdoes not agree with the linear optical absorption spectrum of the Alq, indicating that theelectronic-resonant effects associated with the 一-元* transitions in the quinolate rings arealmost vanished. According to the theoretical calculations for the Al-Alqs complex, theenergy diagrams near the gaps are significantly changed by the chemical bonding formationbetween Al and Alq.(Curioni & Andreoni, 1999) In contrast to the case of the alkaline-metal-Alqs complex, HOMO of pristine Alqs is destabilized by the interaction with the Al 3sorbital. The interaction with the Al is such that one of the Alq3 HOMOs is repelled to higherenergy, and a state with predominant Al character appears in the same energy range. Al-Alq3 interaction also induces the modification of LUMO. Previous NEXAFS study ofAl/Alq3 interface suggests that the Al-Alqs interaction is not simple electron transfer fromAl to Alqs. (Yokoyama et al., 2005) Although the theoretical simulations for the 1:1 Al-Alqscomplex cannot predict the observed NEXAFS results, modification of HOMO (LUMO)level occurs at the Al/Alqs interface. Thus we conclude that disappearance of the doubly-resonant effect associated with the n-元* transitions must be caused by the perturbation of theHOMO and LUMO of Alq3 by the interaction of the Al. 4.2.4 Effects of the LiF insertion between Al and Ala3 In this section, we discuss the effects of the insertion of a LiF layer between Al and Alqsinterface. The SFG spectra of the Al/LiF/ Alqs system with various visible wavelengths in aPPP polarization are shown in Fig. 12(a). The spectral features are quite different from thoseof Alq3/Al and Al/ Alqs. The new broad bands, which show the weak excitation wavelengthdependence, appear around 1335 and 1450 cm-1. The C=C stretching modes of the quinolateligands are observed at 1572 and 1607 cm-1. The frequency shift to lower wavenumber of theC=C stretching mode is also reported in the IR and DFT study of the potassium-doped Alq3.(Sakurai et al., 2004) The DFT calculations and the IR spectrum for the potassium-dopedAlq3 suggested that the C=C stretching frequency of Alq3 anion is lower than that of pristineAlq3 molecule. Consequently, the red-shift of the C=C stretching bands in the SFG spectra isindicative of the formation of the Alq3 anionic states upon reaction with Li at the interface.(Mason et al., 2001) This observation is in good agreement with the previous UPS and XPSmeasurements for the Al/LiF/Alqs interfaces (Mason et al., 2001; Ding et al., 2009) and, toour knowledge, this is the first observation of the anionic state formation at the buriedinterface in ambient condition. Figure 12 (b) shows the SFG excitation profiles obtained fromthe DR-SFG spectra in Fig. 12 (a) as a function of the photon energies of the SFG. The SFG excitation profiles derived from the 1572 cm-1 band gives maximum around 420 nm,however, it does not show large shift to the lower photon energy. If the Alqs at the LiFinterface forms the Alq3 anion, the absorption peaks should appear below 600 nm.(Ganzorig & Fujihira 2002) The charges transferred from the Li might smear the SFGexcitation profiles of the C=C stretching. Unfortunately, our SFG system cannot generate thesufficient power of the light below 640 nm at present. Further experiments with the longerwavelength excitation will reveal the electronic character at the charged interface. Fig. 12. (a) The SFG spectra of Al/LiF/Alqs. (b) The changes in the peak strengths of thethree representative vibrational peaks as a function of the photon energies of the SFG. Next, we mention the origin of the broad peaks at 1335 and 1450 cm-1. Similar broad features are observed by IR and Raman studies of potassium-doped Alqs and the Al/LiF/Alqssystem. (Sakurai et al., 2004) It was suggested that these bands are derived from thequinolate ligands reacted with potassium or lithium. On the other hand, recent Ramanstudies performed in UHV environment show the similar broad features around 1355, 1405,and 1560 cm-1 for Alq3/Al system, and 1315, 1435, and 1515 cm-1 for Alq3/Ca system,respectively. (Davis & Pemberton, 2008, 2009) They assigned these modes are derived fromthe G-bands and the D-bands of the graphitic carbon generated by the deposition of Ca orAl onto Alq3 thick film. One may think that the graphite related bands are IR inactivemodes, however, these modes become IR active in the nitrogenated amorphous graphite.(Kaufman et al., 1989) NEXAFS studies also suggest the existence of the chemical interactiondifferent from electron transfer at the Al/LiF/Alq3 system, which differs from Al/ Alg3 andLi/Alqs interfaces. (Yokoyama et al., 2005) Although further studies are necessary todetermine the origin of these broad features, the wavelength independent SFG excitationprofiles of these features may be suggestive that these bands are originated from thegraphite-like bands, not from the Alq3. On the other hands, the red-shift of the other SFGpeaks, which shows the remarkable wavelength dependent SFG excitation profiles, may beindicative by the formation of the Alq anionic states at the interface, as mentioned above.Because the interface formed by the metal deposition onto the organic materials is muchmore complicated than the organic-on-metal system, we conclude that the Al/LiF/Alqsburied interface might be co-existence of the negatively charged Alq3 by the charge transferfrom the Li and the Li-reacted graphitic carbon-like Alqs. Finally, we discuss the interfacial vibrational and electronic structural difference betweenAl/Alq and Al/LiF/Alqs interfaces by comparing with the SFG spectra. Figure 13 showsthe SFG spectra of the Alq3/Al, Al/Alq3, and Al/LiF/Alq3 systems excited by the visiblelight of 450 nm with the PPP polarization combination. From these data, we can confirmthree differences by the different interface. First, the red-shift of the C=C stretching modesare observed in the Al/LiF/Alq3 interfaces, while such shift is not observed in the case ofthe Al/Alq3 system. These spectral behaviors clearly indicate that the chemical interactionbetween Li and Alq3 occurred at the Al/LiF/ Alq3 interface. Red-shift of the SFG vibrationalmodes is suggestive to the formation of the Alqs anionic states at the interface. Second, theelectronic-resonance for the C=C stretching modes are vanished for the Al/Alq system,while it remains in the case of the Al/LiF/Alq3 system. This observation indicates that theenergy diagrams near the band gaps are modified by the chemical reaction between Al andAlq3, rather than the simple charge transfer from Al to Alqs. Finally, the broad featureswhich might be due to the graphite-like carbon are observed in the case of the Al/LiF/Alqssystem. Insertion of the LiF layer between Al and Alqs induces reaction at the interface, andit emerges the negatively charged Alqs and the Li-reacted graphitic carbon-like Alq. Fig. 13. The SFG spectra of the (a) CaF2/Alq3/Al, (b) Al/Alq3, and (c) Al/LiF/Alq3 systemsexcited by the visible light of 450 nm with the PPP polarization combination. 5.Conclusion The interfacial vibrational and electronic states of organic/metal interfaces were studiedusing doubly-resonant SFG spectroscopy. In the SFG studies of the air/PFO and theAl/LiF/PFO interfaces, the planes of PFO rings are nearly parallel to the surface plane at theair/PFO interface. This planar orientation induced by the interface confinement effects leadsto the smaller band gaps at the air/PFO and the Al/LiF/PFO interfaces than those of thebulk PFO. In the DR-SFG spectra of the Alqs/Al, remarkable changes in intensities of theSFG peaks derived from the C=C stretching of the quinolate ligands can be clearly observedby changing the visible wavelength due to the double resonance effect. In contrast, The SFGexcitation profiles of the C=C stretching of the Al/Alqs interfaces do not show thewavelength dependences, indicating that the perturbation of the HOMO and LUMO ofpristine Alqs by the interaction of the Al. The SFG spectra of the Al/LiF/Alq3 system indicates that the existence of the Alq3 anionic states at the buried interface in atmosphericcondition. Additional broad bands around 1335 and 1450 cm-1 might be due to the existenceof the Li-reacted graphitic carbon-like Alq3. Co-existence of the negatively charged Alq3 andthe Li-reacted graphitic carbon-like Alq3 at the buried interface is proposed. Although the experimental results obtained here were performed in ambient condition, thepresent study lead to a better understanding of the molecular and the electronic structure ofthe organic/metal interfaces. In much the same way as multi-dimensional spectroscopy issuitable for studies of intra- and inter-molecular interactions in the bulk, the DR-SFGprovides a similar opportunity for studies of molecules at interfaces. This doubly-resonantSFG technique, which was proved feasible for OLEDs study in this chapter, offers a novelspectroscopy for the characterization of the vibrational and electronic structures at theburied organic interfaces. 6. Acknowledgments The work in this paper was performed in collaboration with Professors H. Ishii, Y. Ouchi,and K. Seki, and Drs W. Mizutani, K. Tsukagoshi, Y. Noguchi, E. Ito, and Y. Sakurai; all aregratefully acknowledged. We gratefully acknowledge financial support from the MitsuiChemicals Inc. This work was supported in part by Grants-in-Aid for Scientific Researchfrom the Japan Society for the Promotion of Science (JSPS) of Japan. 7. References ( Ariu,M.; Lidzey, D. G.; Bradley, D. D. C., Influence of film morphology on th e vi b rationalspectra of d ioctyl substituted p olyfluorene ( P FO), Synth. Met., Vol. 111 (2000), pp.607-610, ) Becker, K.; Lupton, J. M., Dual species emission from single polyfluorene molecules: signatures ofstress-induced planarization of single polymer chains, J. Am. Chem. Soc., Vol. 127, No.20 (2005), pp. 7306-7307. Burroughes,J. H.; Bradley, D. D. C.; Brown, A. R.;Marks, R. N.; Mackay, K.; Friend, R. H.;Burn, P. L.; Holmes, A. B., Light-emitting diodes based on conjugated polymers,Nature, Vol. 347, No. 6293 (1990),pp. 539-540. Cadby, A. J.;Lane, P. A.; Mellor, H.; Martin, S. J.;Grell, M.; Giebeler, C.; Bradley, D. D. C.;Wohlgenannt, M.; An, C.; Vardeny, Z. V., Film morphology and photophysics ofpolyfluorene, Phys. Rev. B, Vol.62, No. 23 (2000),62, pp. 15604-15609. Campoy-Quiles, M.; Heliotis, G.; Xia, R.; Ariu, M.; Pintani, M.; Etchegoin, P.; D. D. C.Bradley, D. D. C., Ellipsometric characterization of the optical constants ofpolyfluorene gain media, Adv. Func. Mater.,Vo.15, No.6(2005), pp.925-933. Cheum, H.; Galbrecht, F.; Nehls, B.; Scherf, U.; Winokur, M. J., Interface specific variationsin the steady-state optical properties of polyfluorene thin films, J. Mater. Sci.: Mater.Electronics, Vol.20, Supplement 1 (2009), S498-S504. Curioni, A.; Andreoni, W., Metal-Alqs complexes: The nature of the chemical bonding, J.Am. Chem. Soc., Vol. 121, No. 36(1999), pp. 8216-8220. Davis, R.J; Pemberton, J. E., Investigation of the interfaces of tris-(8-hydroxyquinoline)aluminum with Ag and Al using surface Raman spectroscopy, J. Phys. Chem. C,Vo.112, No. 11 (2008), pp. 4364-4371. Davis, R. J; Pemberton, J. E., Surface Raman spectroscopy of chemistry at the tris(8-hydroxyquinoline) aluminum/Ca interface, J. Phys. Chem. A. Vol. 113, No. 16(2009), pp.4397-4402. Ding, H.; Park, K.; Gao, Y.; Kim, D. Y.; So, F., Electronic structure and interactions of LiFdoped tris-(8-hydroxyquinoline) aluminum (Alq), Chem. Phys. Lett., Vol. 473, Nos.1-3(2009), pp. 92-95. Djurisic, A. B.; Kwong, C. Y.;Guo, W. L.; Lau, T. W.; Li, E. H.; Liu, Z. T.; Kwok, H. S.;Lam,L. S. M.; Chan, W. K., Spectroscopic ellipsometry of the optical functions of tris-(8-hydroxyquinoline) aluminum (Alqs),Thin Solid Films, Vol. 416, Nos. 1-2 (2002), pp.233-241 Ganzorig, C.; Fujihira, M., A possible mechanism for enhanced electrofluorescence emissionthrough triplet-triplet annihilation in organic electroluminescent devices, Appl.Phys. Lett., Vol. 81, No 17 (2002), pp.3137-3179. Gong, X.; Iyer, P. K.; Moses, D.; Bazon, G. C.; Heeger, A. J;Xiao, S. S., Stabilized blue emissionfrom polyfluorene-based light-emitting diodes: Elimination of fluorenone defects, Adv.Func. Mater., Vol. 13,No.4(2003),pp.325. Grell, M.; Bradley, D. D. C.; Ungar, G.; Hill, J; Whitehead, K. S., Interplay of physicalstructure and photophysics for a liquid crystalline polyfluorene, Macromolecules,Vol. 32, No. 18 (1999), pp. 5810-5817. Halls, M. D.; Schlegel, H. B., Molecular orbital study of the first excited state of the OLEDmaterial tris-(8-hydroxyquinoline)aluminum(III), Chem. Mater., Vol. 13, No. 8(2001), pp. 2632-2640. Hayashi, M.; Lin, S. H.; Raschke, M. B.; Shen, Y. R., A Molecular theory for doubly resonantIR-UV-vis sum-frequency generation, J. Phys. Chem. A, Vol. 106, No. 10 (2002), pp.2271-2282. Hayashi, N.; Imai, K; Suzuki, T.; Kanai, K.; Ouchi, Y.; Seki, K., Substrate dependence of giantsurface potential of Alq3 and the examination of surface potential of relatedmaterials, Proceedings of International Symposium on Super-Functionality OrganicDevices, IPAP Conf. Series 6, pp.69-72, ISBN4-900526-20-7 Chiba, October, 2004. He, P.; Au, F. C. K.; Wang, Y.M.; Cheng, L. F.; Lee, C. S.; Lee, S. T., Direct evidence forinteraction of magnesium with tris(8-hydroxy-quinoline) aluminum, Appl. Phys.Lett., Vol. 76, No. 11 (2000), pp.1422-1424. naus,M.; Eisert, F.; Buck, M.; Grunze,M., Self-assembly of n-alkanethiolmonolayers; A study by IR-visible sum frequency spectroscopy (SFG), J. Phys.Chem.B, Vol.104, No.3 (2000), pp.576-584. Hirose, C.; Ishida, H.; Iwatsu, K.; Watanabe, N.; Kubota, J.; Wada, A.;Domen,K., In situ SFGspectroscopy of film growth. I. General formulation and the analysis of the signalobserved during the deposition of formic acid on Pt(110)-(1×2) surface, J. Chem.Phys., Vol. 108, No. 14 (1998), pp.5948-5956. HungL. S.; Tang, C. W.; Mason, M. G., Enhanced electron injection in organicelectroluminescence devices using an Al/LiF electrode, Appl. Phys. Lett., Vol. 70,No. 2 (1997),pp.152-154. Ishida, H.; Iwatsu, K.; Kubota, J.; Wada, A.; Domen, K.; Hirose, C., In situ SFG spectroscopyof film growth. II. Deposition of formic acid on Ni(110) surface, J. Chem. Phys., Vol.108,No.14 (1998), pp. 5957-5964. Ishii, H.; Sugiyama, K.; Ito, E.; Seki, K., Energy level alignment and interfacial electronicstructures at organic/metal and organic/organic interfaces, Adv. Mater., Vol. 11,No. 8 (1999),pp.605-625. Isoshima, T.; Ito, H.; Ito, E.; Okabayashi, Y.; Hara, M., Long-term relaxation of molecularorientation in vacuum-deposited Alqs thin films, Mol. Cryst. Liq. Cryst., Vol. 505,No.1(2009), pp.59-63. Ito, E.; Washizu, Y.; Hayashi, N.;Ishii, H.; Matsuie, N.; Tsuboi, K.; Harima, Y.; Yamashita,K.; Seki, K., Spontaneous buildup of giant surface potential by vacuum depositionof Alqs and its removal by visible light irradiation, J. Appl. Phys., Vol. 92, No. 12(2002),pp.7306-7310. Iwahashi, T.; Miyamae, T.; Kanai, K.; Seki, K.; Kim, D.; Ouchi, Y., Anion configuration atthe air/liquid interface of ionic liquid [bmim]OTf studied by sum-frequencygeneration spectroscopy, J. Phys. Chem. B, Vol. 112, No.38 (2008), pp. 11936-11941. Kajimoto, N.; Manaka, T.; Iwamoto, M., Decay process of a large surface potential of Alqsfilms by heating, J. Appl. Phys., Vol. 100, No. 5 (2006), pp. 053707. Kaufman, J. H.; Metin, S.; Saperstein, D. D., Symmetry breaking in nitrogen-dopedamorphous carbon: Infrared observation of the Raman-active G and D bands, Phys.Rev. B, Vol.39, No. 18 (1989), pp. 13053-13060. Kawana, S.; Durrel, M.; Lu, J.; Macdonald, J. E.; Grell, M.; Bradley, D. D. C.; Jukes, P. C.;Jones, R. A. L.; Bennett, S. L., X-ray diffraction study of the structure of thinpolyfluorene films, Polymer, Vol. 43,No. 6 (2002), pp. 1907-1913. Kido, J.; Matsumoto, T., Bright organic electroluminescent devices having a metal-dopedelectron-injecting layer,Appl. Phys. Lett., Vol. 73, No. 20 (1998),pp. 2866-2868. Knaapila, M.; Lyons, B. P.; Kisko, K.; Foreman, J. P.; Vainio, U.; Mihaylova, M.;Seeck, O. H.;Palsson, L. O.; Serimaa, R.; Torkkeli, M.; Monkma, A. P., X-ray diffraction studies ofmultiple orientation in poly(9,9-bis(2-ethylhexyl)fluorene-2,7-diyl) thin films, J. Phys.Chem. B, Vol. 107, No.45 (2003), pp. 12425-12430. Koopmans, B.; Janner,A.-M.; Jonkman, H. T.; Sawatzky, G. A.;van der Woude, F., Strongbulk magnetic dipole induced second-harmonic generation from C6o, Phys. Rev.Lett., Vol. 71, No. 21 (1993), pp. 3569-3572. Kuhnke, K.; Epple, M.; Kern, K., Second-harmonic spectroscopy of fullerenes, Chem. Phys.Lett., Vol.294, Nos. 1-3 (1998), pp. 241-247. Kushto, G. P.; Iizumi, Y.; Kido, J.; Kafafi, Z. H., A matrix-isolation spectroscopic andtheoretical investigation of tris(8-hydroxyquinolinato)aluminum(III) and tris(4-methyl-8-hydroxyquinolinato)aluminum(III), J. Phys. Chem. A, Vol. 104, No. 16,(2000), pp. 3670-3680. Li, Q.; Hua, R.; Chou, K. C., Electronic and conformational properties of the conjugatedpolymer MEH-PPV at:6a buried film/solid interface investigated by itwo-dimensional IR-visible sum frequency generation, J. Phys. Chem. B, Vol. 112, No. 8(2008), pp. 2315-2318. List, E. J. W.; Guentner, R., The effect of keto defect sites on the emission properties ofpolyfluorene-type materials, Adv. Mater.,Vol. 14, No.5,(2002),pp. 374-378. Mallavia, R.;Montilla, F.; Pastor, I.; Velasquez, P.; Arredondo, B.; Alvarez, A. L.;Mateo, C.R.Characterization and side chaina manipulation iinn vyiolet-blue poly-[(9,9-dialkylfluoren-2,7-diyl)-alt-co-(benzen-1,4-diyl)] backbones,Macromolecules, Vol.38,No. 8 (2005), pp. 3185-3192. Mason,M. G.; Tang, C. W.; Hung, L. -S.;Raychaudhuri, P.; Madathi, J.; Giesen,D. J.; Yan, L.;Le, Q. T.; Gao, Y.; Lee, S. -T.; Liao, L. S.; Cheng, L. F.; Salaneck, W. R.; dos Santos,D. A.; Bredas, J. L., Interfacial chemistry of Alq3 and LiF with reactive metals, JAppl. Phys., Vol. 89, No. 5 (2001), pp. 2756-2765. Miyamae,, T.; Nozoye, H., Correlation of molecular conformation with adhesion atAlOxpoly(ethylene terephthalate) interface studied by sum-frequency generationspectroscopy, Appl. Phys. Lett., Vol.85, No. 19 (2004), pp.4373-4375 (2004). Miyamae,·TT..; Akiyama, H.; Yoshida, M.;;Tamaoki, N., Characterization of poly(N-isopropylacrylamide)-grafted interfaces with sum-frequency generation spectroscopy,Macromolecules,Vol. 40,No. 13 (2007), pp. 4601-4606. Miyamae, T.; Morita, A.; Ouchi, Y., First acid dissociation at an aqueous H2SO4 interfacewith sum frequency generation spectroscopy, Phys. Chem. Chem. Phys., Vol. 10, No.15 (2008), pp.2010-2013. Miyamae, T.; Miyata, Y.; Kataura, H.,Two-color sum-frequency generation study of single-walled carbon nanotubes on silver, J. Phys. Chem. C, Vol. 113, No. 34,(2009), pp.15314-15319. Miyamae, T.; Tsukagoshi, K.; Mizutani, W., Two-color sum frequency generation study ofpoly(9,9-dioctylfluorene)/electrode interfaces, Phys. Chem. Chem. Phys., Vol. 12,No.44 (2010), pp. 14666-14669. Miyamae, T.;Ito, E.;Noguchi, Y.; Ishii, H., Characterization of the interactions between Alqs thinfilms and Al probed by two-color sum-frequency generation spectroscopy, J. Phys.Chem. C, Vol. 15, No. 19 (2011), pp. 9551-9560. Montilla, F.;Mallavia, R., On the origin of green emission bands in fluorene-based conjugatedpolymers, Ado. Func. Mater., Vol. 17,No. 1(2007),pp. 71-78. Nishiyama, Y.; Fukushima, T.; Takami, K.; Kusaka, Y.; Yamazaki, T.; Kaji, H., Characterizationoflocal1 structuresinn 2amorphousSand crystalline tris(8-hydroxyquinoline)aluminum(III) (Alqs) by solid-state 27A1 MQMAS NMR spectroscopy, Chem. Phys.Lett., Vol. 471, Nos. 1-3 (2009),pp.80-84. Noguchi, Y.; Sato, N.; Tanaka, Y.;Nakayama, Y.; Ishii, H., Threshold voltage shift andformation of charge traps induced by light irradiation during the fabrication oforganic light-emitting diodes, Appl. Phys. Lett., Vol. 92, No. 20 (2008), pp. 203306. Parik, E. D., Ed. Handbook of Optical Constants of Solids, 1985, Academic Press, ISBN 0-12-544420-6, London. Raschke, M. B.; Hayashi, M.; Lin, S. H.; Shen, Y. R., Doubly-resonant sum-frequencygeneration spectroscopy for surface studies, Chem. Phys. Lett., Vol. 359, Nos. 5-6(2002) pp.367-372. Sakurai, Y.; Hosoi, Y.; Ishii, H.; Ouchi, Y.; Salvan, G.; Kobitski, A.; Kampen, T. U.; Zahn, D.R. T.; Seki, K., Study of the interaction of tris-(8-hydroxyquinoline) aluminum(Alqs) with potassium using vibrational spectroscopy: Examination of possibleisomerization upon K doping, J. Appl. Phys., Vol. 96, No. 10 (2004), pp. 5534-5542. Salaneck, W. R.; Seki, K.; Kahn, A.; Pireaux, J. J., (Eds.) 2002, Conjugated Polymer andMolecular Interfaces -Science and Technology for PhotonicandOptoelectronicsApplications, Marcel Dekker, ISBN 0-8247-0588-2, New York. Seki, K.; Ito, E.; Ishii, H., Energy level alignment at organic/metal interfaces studied by UVphotoemission, Synth. Met., Vol. 91, Nos. 1-3 (1997), pp. 137-142. Shaheen, S. E.; Jabbour, G. E.; Morrell, M. M.; Kawabe, Y.; Kippelen, B.; Peyghambarian, N.;Nabor, M. -F.; Schlaf, R.; Mash, E. A.; Armstrong, N. R., Bright blue organic light-emitting diode with improved color purity using a LiF/Al cathode, J. Appl. Phys.,Vol.84, No. 4(1998), pp. 2324-2327. Shen, Y. R., November 2002, The principles of Nonlinear Optics: Wiley, ISBN: 978-0-471-43080-3, New York. Silva, H. S.; Miranda, P. B., Molecular ordering of layer-by-layer polyelectrolyte filmsstudied by sum-frequency vibrational spectroscopy, J. Phys. Chem. B, Vol. 113, No.30 (2009),pp. 10068-10071. Sugi, K.; Ishii, H.; Kimura, Y.; Niwano, M.; Ito, E.;Washizu, Y.; Hayashi, N.; Ouchi, Y.; Seki,K.,Characterization of light-erasable g1i64a.nt4 6s5u(r?face potential built up in evaporatedAlq3 thin films, Thin Solid Films, Vol. 464-465 (2004), pp. 412-415. Tang, C. W.;Slyke,S. A. V,Organic electroluminescent diodes, Appl. Phys. Lett.,Vol. 51, No.12(1987), pp.913-915. Wei, X.; Hong, S. C.; Lvovsky, A. I.; Held, H.; Shen, Y. R., Evaluation of surface vs bulkcontributions in sum-frequency vibrational spectroscopy using reflection andtransmission geometries, J. Phys. Chem. B, Vol. 104,No. 14 (2000), pp.3349-3354. Wu, D.; Deng, G. H.; Guo, Y.; Wang, H. F., Observation of the interference between theintramolecular IR-visible and visible-IR processes in the doubly resonant sumfrequency generation vibrational spectroscopy of rhodamine 6G adsorbed at theair/water interface, J. Phys. Chem. A, Vol. 113, No. 21 (2009), pp. 6058-6063. Yanagisawa,S; Morikawa, Y., Theoretical investigation on the electronic structure of the tris-(8-hydroxyquinolinato) aluminum/aluminum interface,Jpn. J. Appl. Phys., Vol. 45,No. 1B (2006), pp. 413-416. Yanagisawa, S.; ILee, K.; Morikawa, Y., First-principles theoretical study of Alqs/Alinterfaces: Origin of the interfacial dipole, J. Chem. Phys., Vol. 128, No. 24 (2008), pp.244704. Yokoyama, T.; Yoshimura, D.; Ito, E.; Ishii, H.; Ouchi, Y.; Seki, K., Energy level alignment atAlqs/LiF/Al interfaces studied by electron spectroscopies: Island growth of LiFand size-dependence of the electronic structures, Jpn.J. Appl. Phys., Vol. 42,No.6A,(2003), pp.3666-3675. Yokoyama, T.; Ishii, H.; Matsuie, N.; Kanai, K.; Ito, E.; Fujimori, A.; Araki, T.; Ouchi, Y.; Seki,K., Neat Alqs thin film and metal/Alqs interfaces studied tbyNEXAFSspectroscopy, Synth. Met. Vol. 152, No.1-3,(2005), pp. 277-280. Yoshizaki, K.;Manaka, T.; Iwamoto, M., Large surface potential of Alqs film and its decay, J.Appl. Phys., Vol. 97,No.2,(2005), pp. 023703. Zhu, R.; Lin, J. M.; Wang, W. Z.; Zheng, C.; Wei, W.; Huang, W.; Xu, Y. H.; Peng, J. B.; Cao,Y.,Use of the p-phase of poly(9,9-dioctylfluorene) as a probe into the interfacial interplayfor the mixed bilayer films formed by sequential spin-coating, J. Phys. Chem. B, Vol.112,No. 6 (2008), pp.1611-1618. Zhuang, X.; Miranda, P. B.; Kim, D.; Shen, Y. R., Mapping molecular orientation andconformation at interfaces by surface nonlinear optics, Phys. Rev.B, Vol. 59, No. 19(1999), pp. 12632-12640. Vibrational SpectroscopyEdited by Prof. Dominique De Caro ISBN 978-953-51-0107-9Hard cover, 168 pagesPublisher InTechPublished online 24, February, 2012Published in print edition February, 2012 The infrared and Raman spectroscopy have applications in numerous fields, namely chemistry, physics,astronomy, biology,medicine, geology, mineralogy etc. This book provides some examples of the use ofvibrational spectroscopy in supramolecular chemistry, inorganic chemistry, solid state physics, but also in thefields of molecule-based materials ororganic-inorganic interfaces. How to reference In order to correctly reference this scholarly work, feel free to copy and paste the following: Takayuki Miyamae (2012). Probing Metal/Organic Interfaces Using Doubly-Resonant Sum FrequencyGeneration Vibrational Spectroscopy, Vibrational Spectroscopy, Prof. Dominique De Caro (Ed.), ISBN: 978-953-51-0107-9, InTech, Available from: http://www.intechopen.com/books/vibrational-spectroscopy/probing-metal-organic-interfaces-using-doubly-resonant-sum-frequency-generation-spectroscopy INTECH InTech EuropeInTech ChinaUniversity Campus STeP RiUnit 405, Office Block, Hotel Equatorial ShanghaiSlavka Krautzeka 83/ANo.65, Yan An Road (West), Shanghai,200040, China51000 Rijeka, Croatia中国上海市延安西路65号上海国际贵都大饭店办公楼405单元Phone:+385 (51) 770 447Phone: +86-21-62489820Fax: +385 (51) 686 166Fax: +86-21-62489821www.intechopen.com www.intechopen.com
确定


还剩25页未读,是否继续阅读?

产品配置单


北京欧兰科技发展有限公司为您提供《金属/有机物界面中和频光谱检测方案(其它光谱仪)》,该方案主要用于其他中和频光谱检测,参考标准--,《金属/有机物界面中和频光谱检测方案(其它光谱仪)》用到的仪器有Ekspla SFG 表面和频光谱分析系统、Ekspla CARS 相干反斯托克斯拉曼显微光谱仪、Ekspla PL2230型高能量皮秒激光器
推荐专场


激光拉曼光谱(RAMAN)
更多


相关方案
更多
该厂商其他方案
更多