采用LaVison公司的DaVis软件平台,通过阴影发成像和粒子成像测速分析,对脉冲流场在USP溶解仪中引起的水动力复杂性,进行了研究。
方案详情

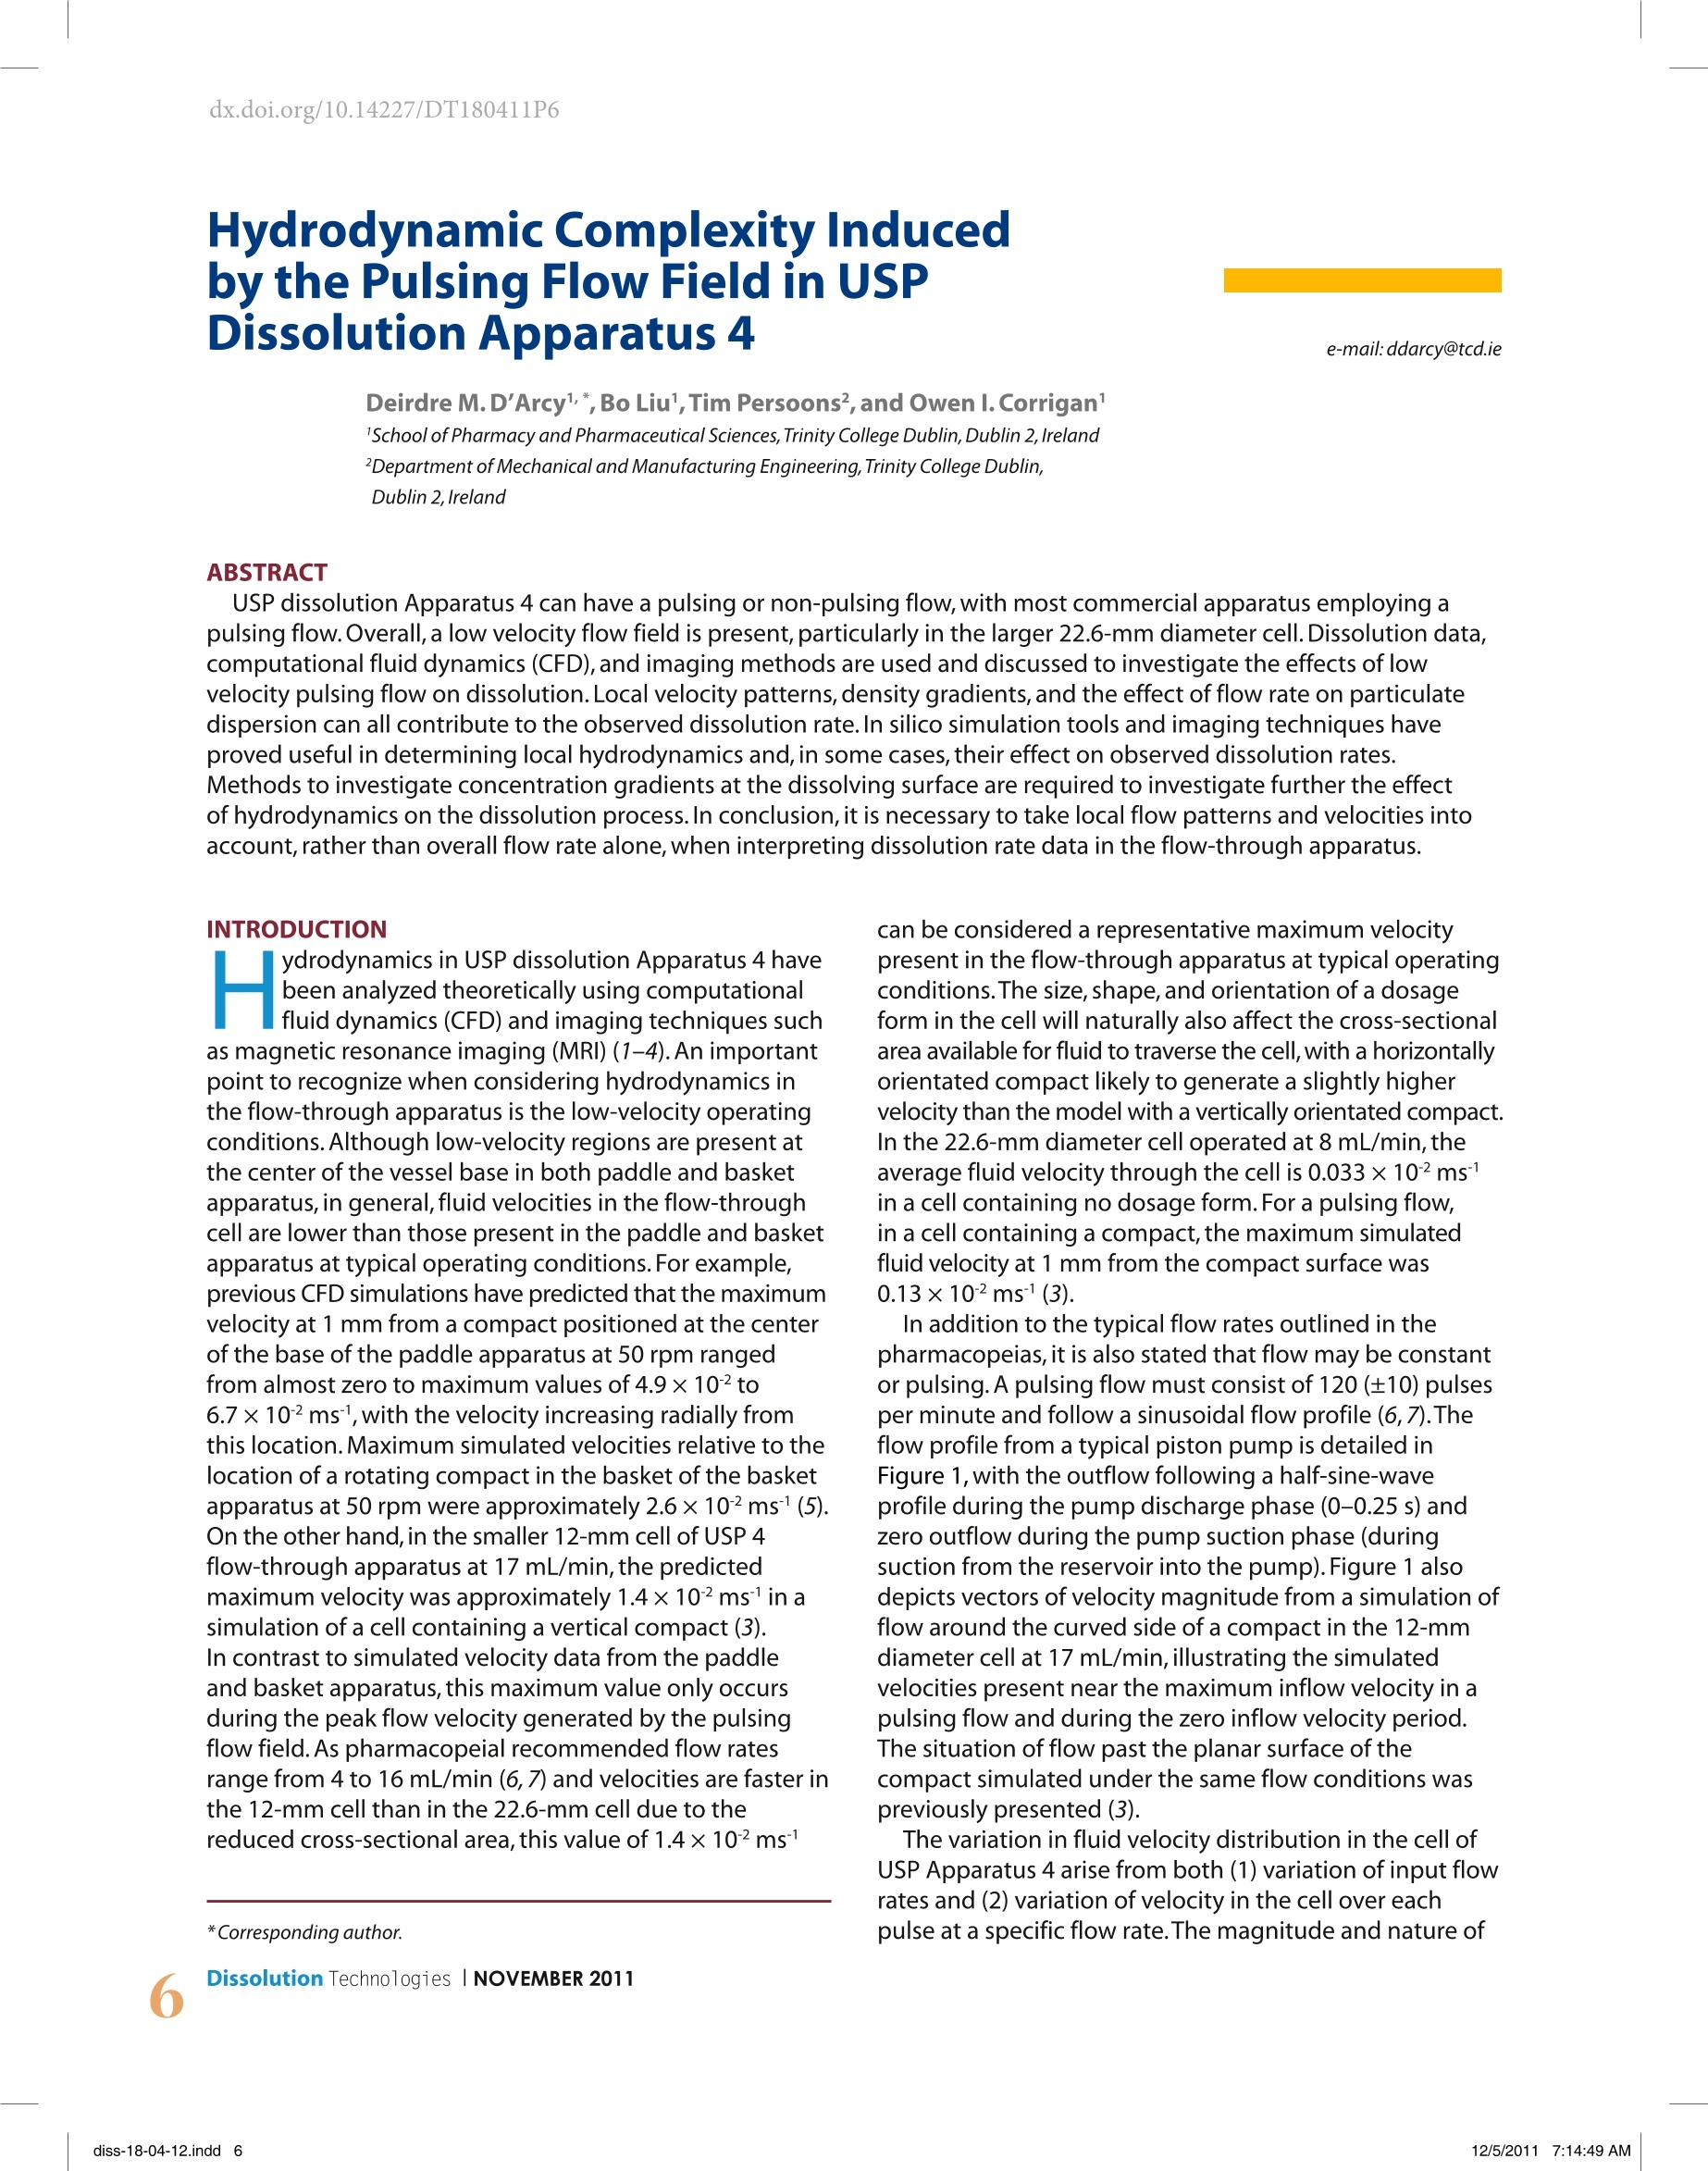
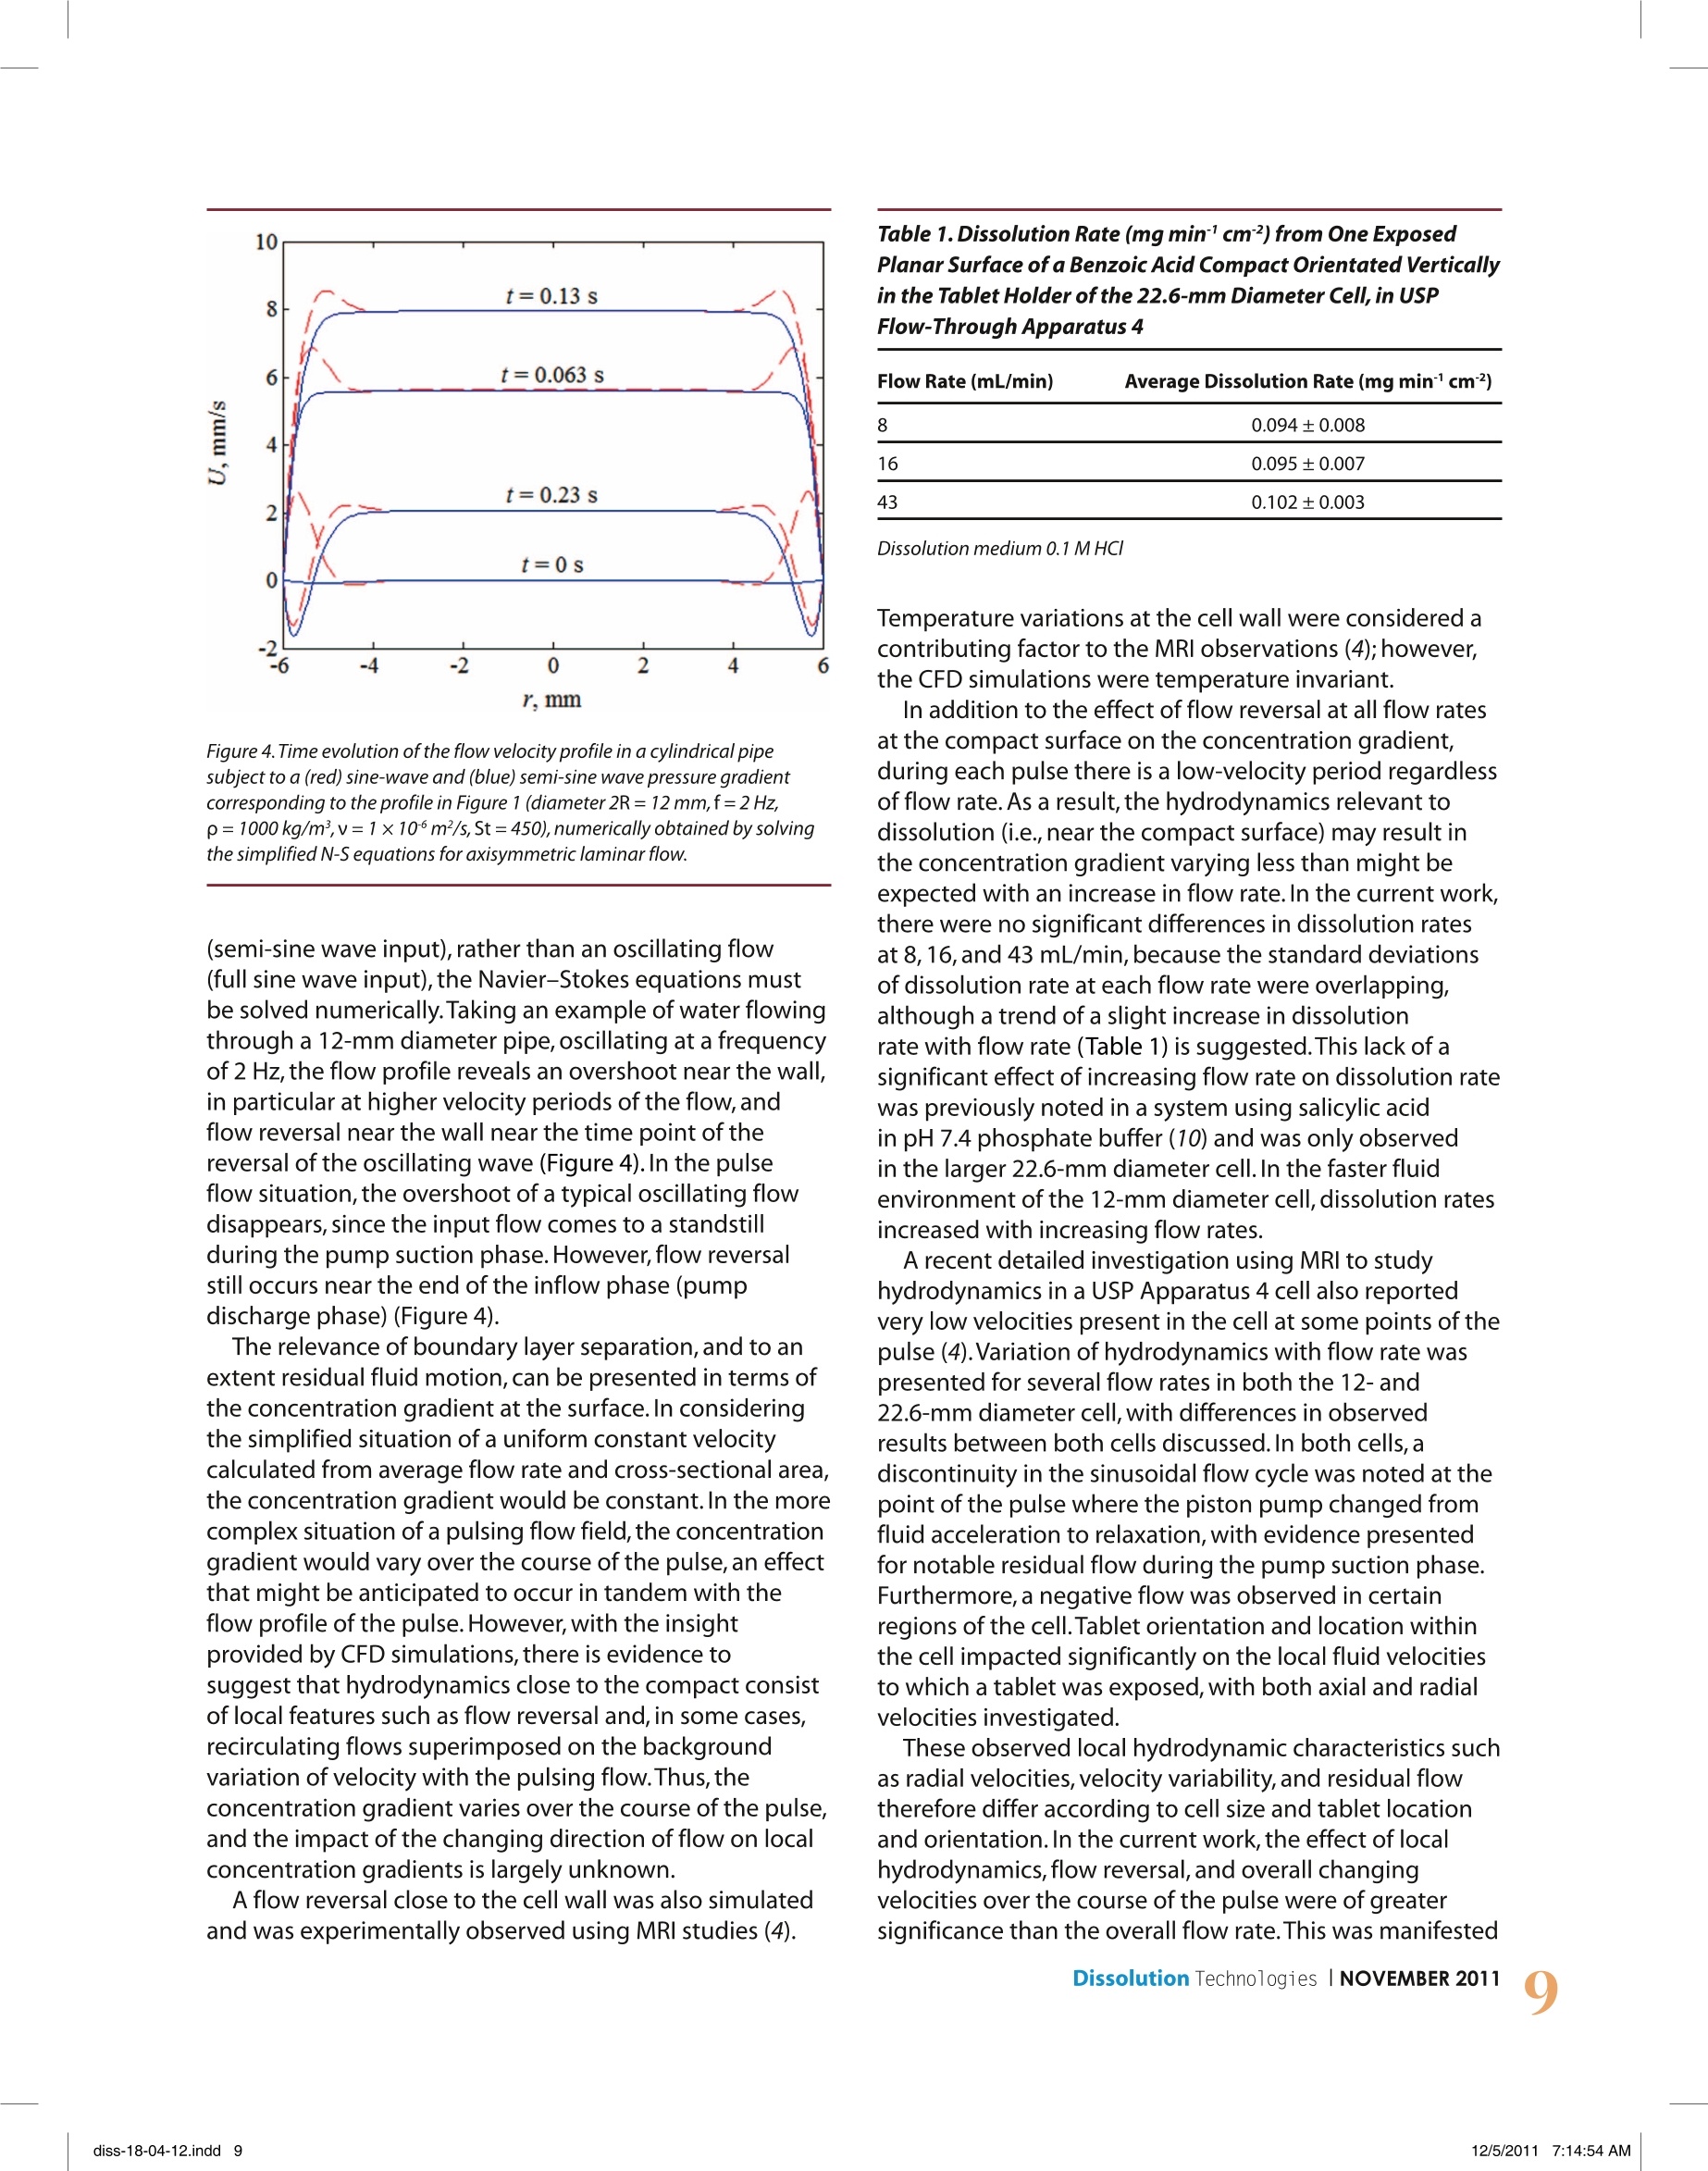
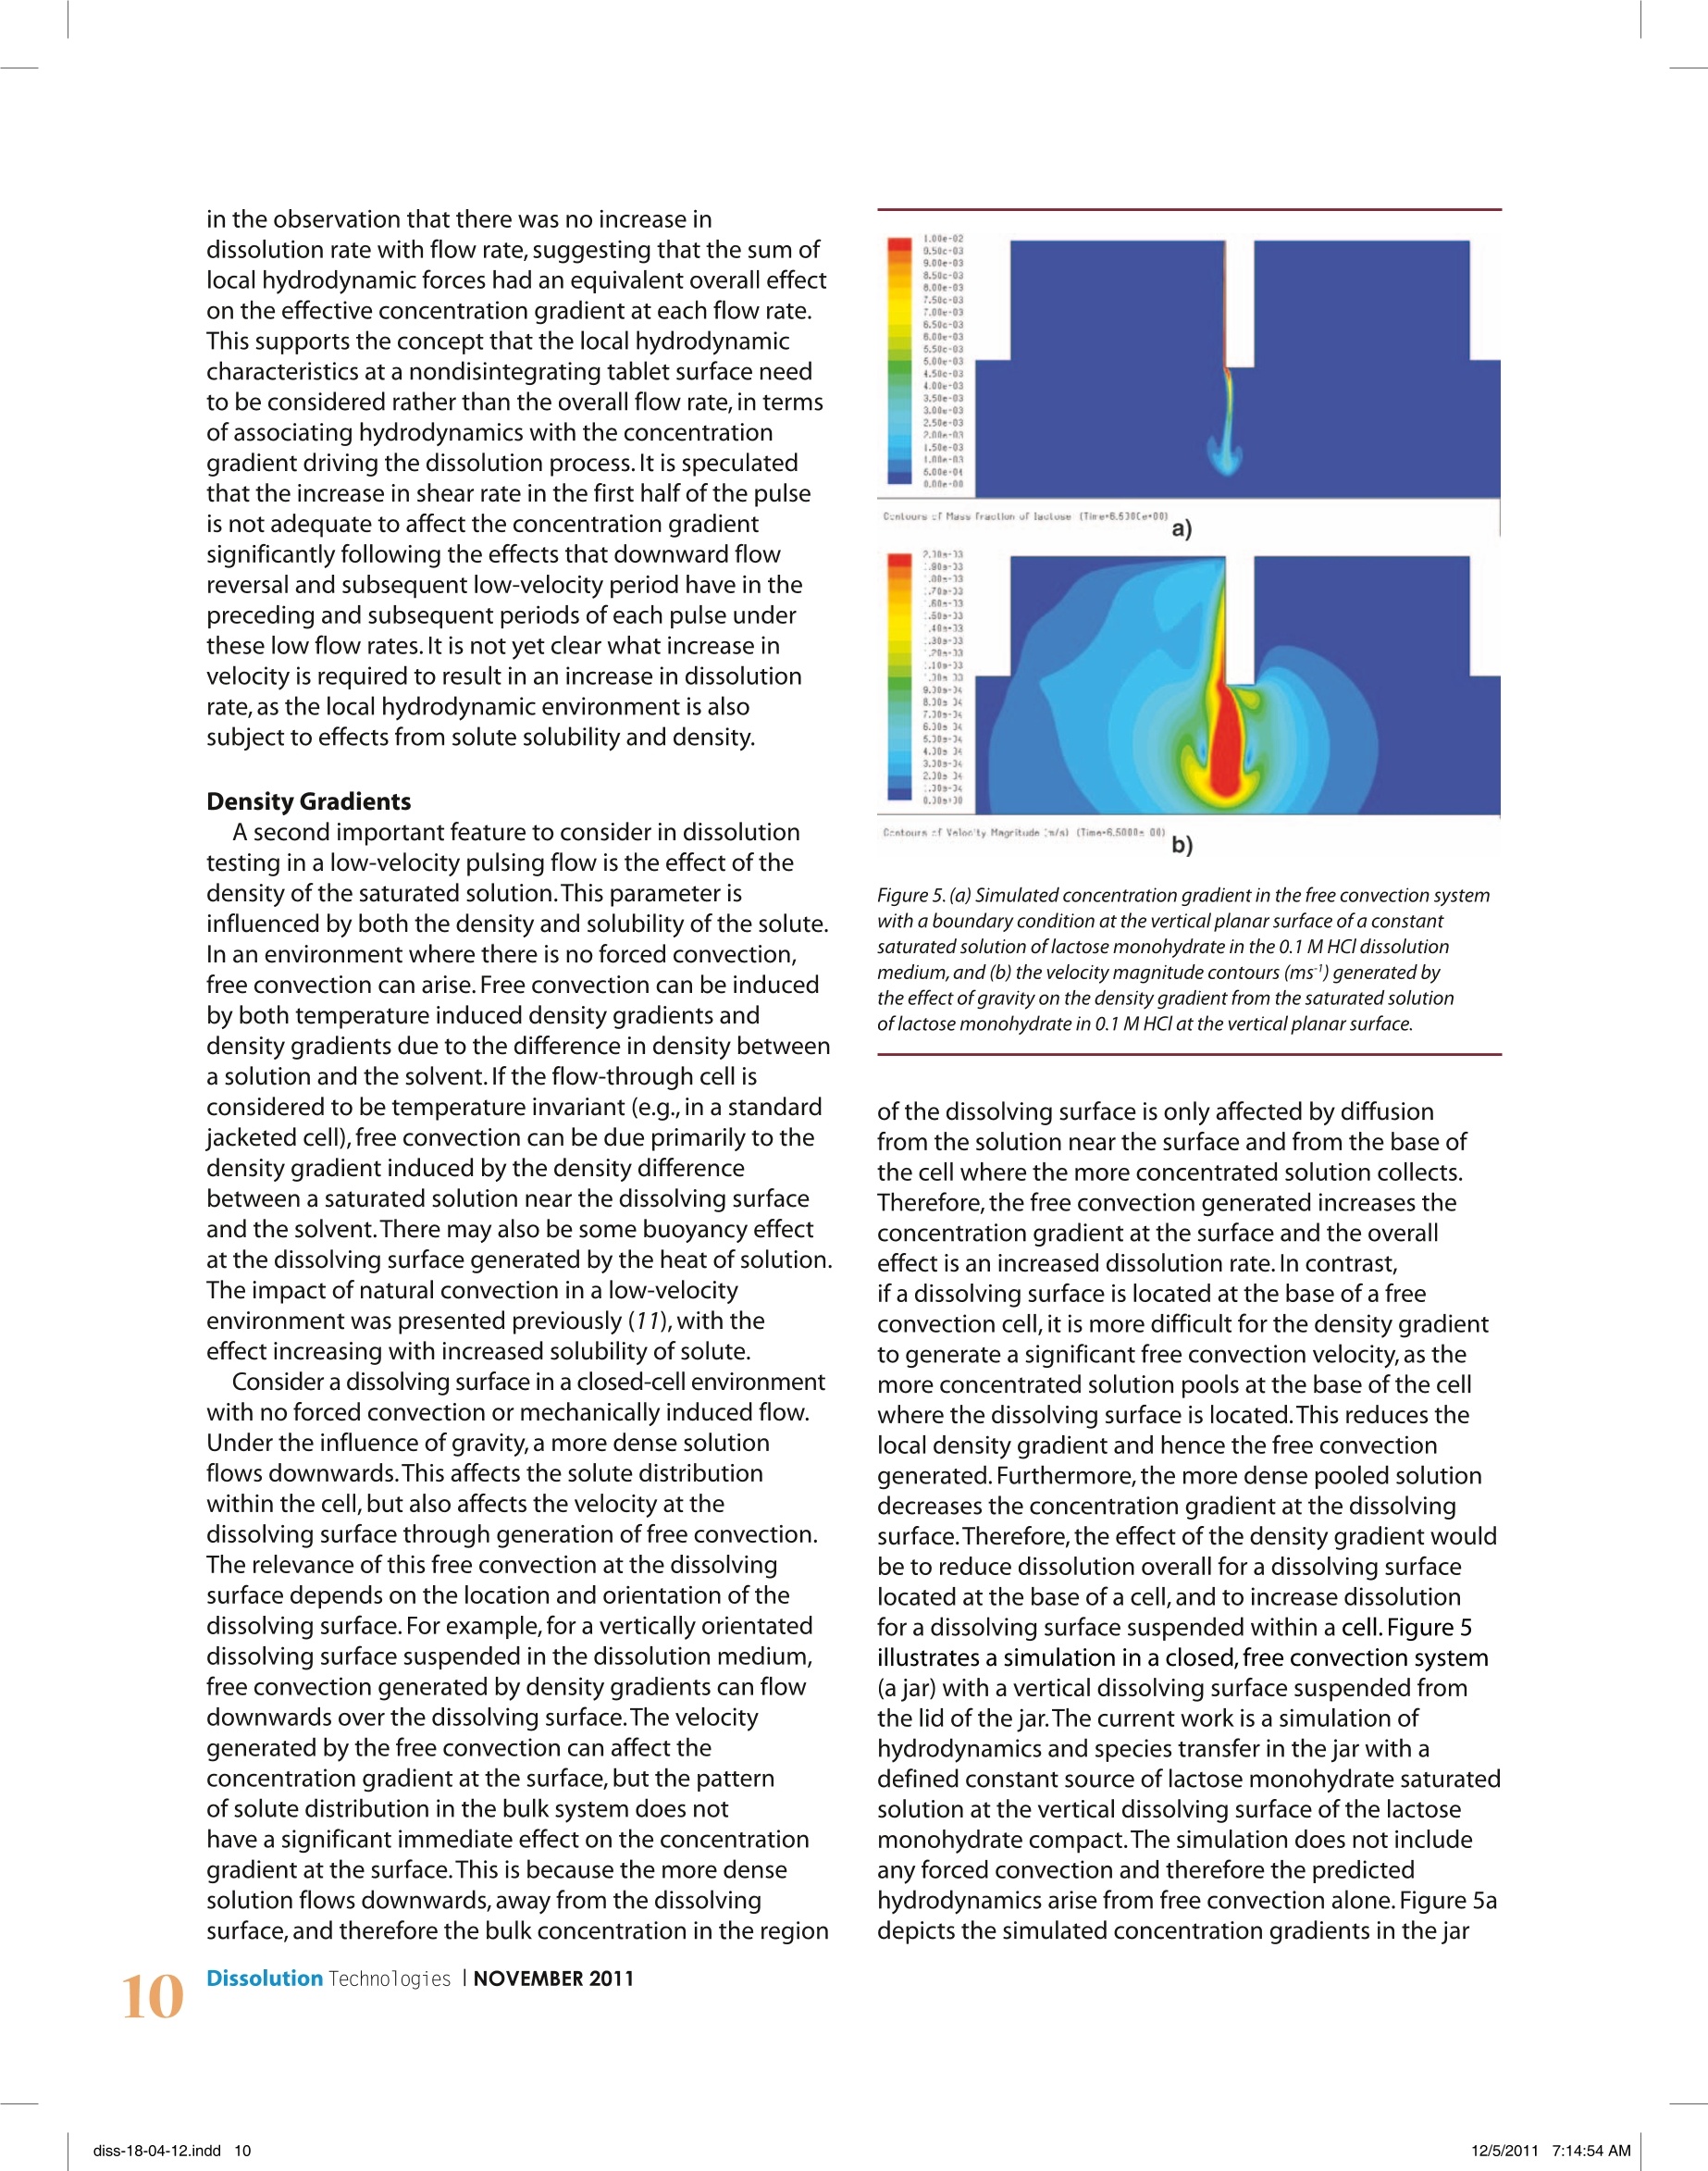
dx.doi.org/10.14227/DT180411P6 e-mail:ddarcy@tcd.ie Deirdre M.D'Arcy", Bo Liu1,Tim Persoons?,and Owen l. Corrigan1'School of Pharmacy and Pharmaceutical Sciences, Trinity College Dublin,Dublin 2, IrelandDepartment of Mechanical and Manufacturing Engineering,Trinity College Dublin,Dublin 2,Ireland ABSTRACT USP dissolution Apparatus 4 can have a pulsing or non-pulsing flow, with most commercial apparatus employing apulsing flow.Overall,a low velocity flow field is present,particularly in the larger 22.6-mm diameter cell.Dissolution data,computational fluid dynamics (CFD), and imaging methods are used and discussed to investigate the effects of lowvelocity pulsing flow on dissolution.Local velocity patterns, density gradients, and the effect of flow rate on particulatedispersion can all contribute to the observed dissolution rate. In silico simulation tools and imaging techniques haveproved useful in determining local hydrodynamics and, in some cases,their effect on observed dissolution rates.Methods to investigate concentration gradients at the dissolving surface are required to investigate further the effectof hydrodynamics on the dissolution process.In conclusion,it is necessary to take local flow patterns and velocities intoaccount, rather than overall flow rate alone, when interpreting dissolution rate data in the flow-through apparatus. INTRODUCTION ydrodynamics in USP dissolution Apparatus 4 haveHbeen analyzed theoretically using computationalfluid dynamics (CFD) and imaging techniques suchas magnetic resonance imaging (MRI) (1-4). An importantpoint to recognize when considering hydrodynamics inthe flow-through apparatus is the low-velocity operatingconditions.Although low-velocity regions are present atthe center of the vessel base in both paddle and basketapparatus, in general,fluid velocities in the flow-throughcell are lower than those present in the paddle and basketapparatus at typical operating conditions.For example,previous CFD simulations have predicted that the maximumvelocity at 1 mm from a compact positioned at the centerof the base of the paddle apparatus at 50 rpm rangedfrom almost zero to maximum values of 4.9 × 10 to6.7×10msl, with the velocity increasing radially fromthis location.Maximum simulated velocities relative to thelocation of a rotating compact in the basket of the basketapparatus at 50 rpm were approximately 2.6×10ms1(5).On the other hand,in the smaller 12-mm cell of USP 4flow-through apparatus at 17 mL/min, the predictedmaximum velocity was approximately 1.4×10msl in asimulation of a cell containing a vertical compact (3).In contrast to simulated velocity data from the paddleand basket apparatus, this maximum value only occursduring the peak flow velocity generated by the pulsingflow field. As pharmacopeial recommended flow ratesrange from 4 to 16 mL/min (6,7) and velocities are faster inthe 12-mm cell than in the 22.6-mm cell due to thereduced cross-sectional area,this value of 1.4×10²msl ( *Corresponding author. ) can be considered a representative maximum velocitypresent in the flow-through apparatus at typical operatingconditions.The size,shape,and orientation of a dosageform in the cell will naturally also affect the cross-sectionalarea available for fluid to traverse the cell,with a horizontallyorientated compact likely to generate a slightly highervelocity than the model with a vertically orientated compact.In the 22.6-mm diameter cell operated at 8 mL/min,theaverage fluid velocity through the cell is 0.033 ×10 msin a cell containing no dosage form.For a pulsing flow,in a cell containing a compact, the maximum simulatedfluid velocity at 1 mm from the compact surface was0.13×102ms(3). In addition to the typical flow rates outlined in thepharmacopeias, it is also stated that flow may be constantor pulsing. A pulsing flow must consist of 120(±10) pulsesper minute and follow a sinusoidal flow profile (6,7).Theflow profile from a typical piston pump is detailed inFigure 1, with the outflow following a half-sine-waveprofile during the pump discharge phase (0-0.25 s) andzero outflow during the pump suction phase (duringsuction from the reservoir into the pump). Figure 1 alsodepicts vectors of velocity magnitude from a simulation offlow around the curved side of a compact in the 12-mmdiametercell at 17 mL/min, illustrating the simulatedvelocities present near the maximum inflow velocity in apulsing flow and during the zero inflow velocity period.The situation of flow past the planar surface of thecompact simulated under the same flow conditions waspreviously presented (3). The variation in fluid velocity distribution in the cell ofUSP Apparatus 4 arise from both (1) variation of input flowrates and (2) variation of velocity in the cell over eachpulse at a specific flow rate.The magnitude and nature of Figure 1.Profile of fluid velocity vs. time used to simulate the cell inflow fromthe piston pump in USP dissolution Apparatus 4. Also shown are vectors ofvelocity magnitude (ms') from a simulation of flow around the curved sideof a compact in the 12-mm diameter cell at 17 mL/min at (a) 0.15 s (nearpeakinflow) and(b) 0.35 s (during zero inflow period). the variation in fluid dynamics further depend on the cellsize used. As dissolution rate is intrinsically linked to localhydrodynamics through the effect of hydrodynamics onthe concentration gradient, an insight into the hydrody-namics in the flow-through cell is crucial for interpretationof dissolution rate data.The current work considers theeffects of features present in a low-velocity pulsing flowfield on dissolution rates in USP dissolution Apparatus 4.As the pulsing flow includes periods of zero inflow, a freeconvection system was also simulated. METHODSHydrodynamic and Mass Transfer Simulations CFD was used to generate 3D simulations of hydrody- namics in the 22.6-mm diameter cell at 8,16,and 43 mL/min, using the method previously described (3). The model contained a cylinder within the cell,representing a dissolving compact, at the location of the tablet holder, with the flat planar surfaces orientated vertically.One pulse through the cell was simulated and consisted of both the pump discharge and pump suction phases.The 2D simulation of velocity and mass transfer in thefree convection system was generated using the species-transfer model. The free convection system consisted of a jar filledwith dissolution medium, with a cylindrical compactsuspended from the lid of the jar in a vertical orientation.As only one planar surface was exposed to thedissolution medium, only one planar surface wasincluded in the species transfer simulation. Speciestransfer does not simulate the dissolution process, but it can be used to simulate a situation where a saturatedsolution of solute is present at the dissolving surface,thereby simulating the effect of the dissolution process onlocal hydrodynamics.The CFD software package FLUENT(ANSYS,Inc., NH,USA) was used to generate the fluiddynamics and species-transfer simulations. Dissolution Studies Dissolution tests were carried out in the flow-throughapparatus 22.6-mm diameter cell at 8, 16,and 43 mL/min,using the method previously described (3). In summary,compacts consisted of 500 mg of benzoic acid and were13 mm in diameter and approximately 3 mm in height.The compacts were coated with paraffin wax, leaving onlyone of the flat, planar surfaces exposed to the dissolutionmedium.The compacts were placed in the tablet holderof the flow-through cell with the exposed planar surfaceorientated vertically.The dissolution medium was 0.1 MHCl,and dissolution tests were carried out at 37℃using a closed system configuration, with a reservoirvolume of 900 mL. Shadowgraph Imaging The shadowgraph imaging method used was previouslydescribed (8). In brief, it involves using a double-framecamera with a high-magnification lens to capture imagesof a particle-containing fluid against a background ofuniform pulsed illumination,thereby being a noninvasivetechnique.The field of view had a resolution of 6 um perpixel,(magnification 3.33:1).The field of view was limitedto a6×6 mm section at the lower right-hand side of theflow-through cell. Particle sizes and velocities weredetermined using LaVision DaVis 7.2.2 software (LaVisionGmbH,Gottingen,Germany).A schematic diagram of thesampling window and experimental setup of the powdercell used in the current work is presented in Figure 2a. RESULTS AND DISCUSSION: Local Hydrodynamics: Flow Reversal,Low-VelocityPeriods, and Local Fluid Dynamics Variations Simulated images of velocity vectors near the curvedsurface of the compact at 16 mL/min are shown inFigure 3. Figure 3a shows velocity vectors at 0.06 s,andFigure 3b at 0.2 s.The inflow velocities to the cell aresimilar at these two time points (flow profile, Figure 1);however, it is clear that flow reversal is commencing nearthe compact surface in Figure 3b (inset). An interestinghydrodynamic feature of pulsing flow in USP dissolutionApparatus 4 is that boundary layer separation followed byflow reversal occurs during the decreasing velocity periodof the pump discharge phase.Due to viscous friction, ahydrodynamic boundary layer develops during theincreasing velocity period, leading to a separationbetween high kinetic energy fluid in the bulk flow and lowenergetic fluid near the wall. Because of this kinetic energydifference, the boundary layer is subjected to an adversepressure gradient when the flow decelerates towards the a) b) Figure 2. (a) Schematic diagram of the shadowgraph imaging set up forthe 12-mm diameter powder cell, showing the sampling window used inthe shadowgraphimaging. (b) A typical image generated using theshadowgraph imaging method, where a particle is visualized with the redarrow showing velocity magnitude and direction. In this case, the particleis moving vertically upwards. end of the pump discharge phase.This pressure gradientin turn causes the flow to detach from the wall,creatinga region of instantaneous flow reversal. This feature waspreviously presented (3) and was observed in a simulation Figure 3. Vectors colored by velocity magnitude (ms) from a 3D simulationof hydrodynamics near the curved surface of the compact in the 22.6-mmdiameter cell at 16 mL/min, at (a) 0.06 s and (b) 0.2 s. of 16 mL/min at 0.1875 s (2),and at 8 mL/min.In thecurrent work, flow reversal occurred at all three flow ratessimulated. At each flow rate,the boundary layer separationhad occurred and flow reversal was commencing by 0.2 s.The discrepancy in the time for boundary layer occurrencecan be attributed to different hydrodynamics, as thecompact shape was different in both simulations(a curved surface in the work by Kakhi,whereas thecurrent work used a flat planar surface).Furthermore,because the work by Kakhi (2) used a time step of0.00025 s, compared with 0.01 s in the current work,thesimulation was more refined over this pump dischargephase but did not include simulation of flow over thefollowing pump suction phase. Evidence for residual fluidmotion during the pump suction phase, particularly athigher flow rates in the smaller 12-mm diameter cell, waspreviously demonstrated using both CFD simulationsand flow visualization studies (3). Flow reversal is a well-known phenomenon in oscillatinglaminar flows (9). For simple geometries such as an infinitecylindrical pipe,the velocity profile subject to an oscillatingpressure gradient can be determined analytically,bydirectly solving the incompressible Navier-Stokesequations.At higher Stokes numbers (St=2nfR2/v> 10,where f is the pulsation frequency, R is the pipe radius,and vis the kinematic viscosity),the velocity profilebecomes flatter rather than parabolic,and displaysfeatures of both an overshoot near the wall and flowreversal at the end of the half period. For a pulsed flow Figure 4.Time evolution of the flow velocity profile in a cylindrical pipesubject to a (red) sine-wave and (blue) semi-sine wave pressure gradientcorresponding to the profile in Figure 1 (diameter 2R=12 mm,f=2Hz,p=1000kg/m,v=1×106m²/s,St=450),numerically obtained by solvingthe simplified N-S equations for axisymmetric laminar flow. (semi-sine wave input), rather than an oscillating flow(full sine wave input),the Navier-Stokes equations mustbe solved numerically.Taking an example of water flowingthrough a 12-mm diameter pipe, oscillating at a frequencyof 2 Hz, the flow profile reveals an overshoot near the wall,in particular at higher velocity periods of the flow,andflow reversal near the wall near the time point of thereversal of the oscillating wave (Figure 4).In the pulseflow situation,the overshoot of a typical oscillating flowdisappears, since the input flow comes to a standstillduring the pump suction phase.However, flow reversalstill occurs near the end of the inflow phase (pumpdischarge phase) (Figure 4). The relevance of boundary layer separation, and to anextent residual fluid motion,can be presented in terms ofthe concentration gradient at the surface.In consideringthe simplified situation of a uniform constant velocitycalculated from average flow rate and cross-sectional area,the concentration gradient would be constant. In the morecomplex situation of a pulsing flow field, the concentrationgradient would vary over the course of the pulse, an effectthat might be anticipated to occur in tandem with theflow profile of the pulse. However, with the insightprovided by CFD simulations, there is evidence tosuggest that hydrodynamics close to the compact consistof local features such as flow reversal and, in some cases,recirculating flows superimposed on the backgroundvariation of velocity with the pulsing flow.Thus,theconcentration gradient varies over the course of the pulse,and the impact of the changing direction of flow on localconcentration gradients is largely unknown. A flow reversal close to the cell wall was also simulatedand was experimentally observed using MRI studies (4). Table 1. Dissolution Rate (mg min'cm²) from One ExposedPlanar Surface of a Benzoic Acid Compact Orientated Verticallyin the Tablet Holder of the 22.6-mm Diameter Cell, in USPFlow-Through Apparatus 4 8 0.094±0.008 16 0.095±0.007 43 0.102±0.003 Dissolution medium 0.1 M HC/ Temperature variations at the cell wall were considered acontributing factor to the MRI observations (4);however,the CFD simulations were temperature invariant. In addition to the effect of flow reversal at all flow ratesat the compact surface on the concentration gradient,during each pulse there is a low-velocity period regardlessof flow rate. As a result, the hydrodynamics relevant todissolution (i.e.,near the compact surface) may result inthe concentration gradient varying less than might beexpected with an increase in flow rate.In the current work,there were no significant differences in dissolution ratesat 8,16, and 43 mL/min,because the standard deviationsof dissolution rate at each flow rate were overlapping,although a trend of a slight increase in dissolutionrate with flow rate (Table 1) is suggested. This lack of asignificant effect of increasing flow rate on dissolution ratewas previously noted in a system using salicylic acidin pH 7.4 phosphate buffer (10) and was only observedin the larger 22.6-mm diameter cell. In the faster fluidenvironment of the 12-mm diameter cell,dissolution ratesincreased with increasing flow rates. A recent detailed investigation using MRI to studyhydrodynamics in a USP Apparatus 4 cell also reportedvery low velocities present in the cell at some points of thepulse (4).Variation of hydrodynamics with flow rate waspresented for several flow rates in both the 12-and22.6-mm diameter cell, with differences in observedresults between both cells discussed. In both cells,adiscontinuity in the sinusoidal flow cycle was noted at thepoint of the pulse where the piston pump changed fromfluid acceleration to relaxation, with evidence presentedfor notable residual flow during the pump suction phase.Furthermore,a negative flow was observed in certainregions of the cell.Tablet orientation and location withinthe cell impacted significantly on the local fluid velocitiesto which a tablet was exposed, with both axial and radialvelocities investigated. These observed local hydrodynamic characteristics suchas radial velocities, velocity variability, and residual flowtherefore differ according to cell size and tablet locationand orientation.In the current work, the effect of localhydrodynamics, flow reversal,and overall changingvelocities over the course of the pulse were of greatersignificance than the overall flow rate.This was manifested in the observation that there was no increase indissolution rate with flow rate,suggesting that the sum oflocal hydrodynamic forces had an equivalent overall effecton the effective concentration gradient at each flow rate.This supports the concept that the local hydrodynamiccharacteristics at a nondisintegrating tablet surface needto be considered rather than the overall flow rate, in termsof associating hydrodynamics with the concentrationgradient driving the dissolution process. It is speculatedthat the increase in shear rate in the first half of the pulseis not adequate to affect the concentration gradientsignificantly following the effects that downward flowreversal and subsequent low-velocity period have in thepreceding and subsequent periods of each pulse underthese low flow rates. It is not yet clear what increase invelocity is required to result in an increase in dissolutionrate, as the local hydrodynamic environment is alsosubject to effects from solute solubility and density. Density Gradients A second important feature to consider in dissolutiontesting in a low-velocity pulsing flow is the effect of thedensity of the saturated solution.This parameter isinfluenced by both the density and solubility of the solute.In an environment where there is no forced convection,free convection can arise. Free convection can be inducedby both temperature induced density gradients anddensity gradients due to the difference in density betweena solution and the solvent. If the flow-through cell isconsidered to be temperature invariant (e.g.,in a standardjacketed cell),free convection can be due primarily to thedensity gradient induced by the density differencebetween a saturated solution near the dissolving surfaceand the solvent.There may also be some buoyancy effectat the dissolving surface generated by the heat of solution.The impact of natural convection in a low-velocityenvironment was presented previously (11),with theeffect increasing with increased solubility of solute.Consider a dissolving surface in a closed-cell environmentwith no forced convection or mechanically induced flow.Under the influence of gravity, a more dense solutionflows downwards.This affects the solute distributionwithin the cell, but also affects the velocity at thedissolving surface through generation of free convection.The relevance of this free convection at the dissolvingsurface depends on the location and orientation of thedissolving surface.For example, for a vertically orientateddissolving surface suspended in the dissolution medium,free convection generated by density gradients can flowdownwards over the dissolving surface.The velocitygenerated by the free convection can affect theconcentration gradient at the surface, but the patternof solute distribution in the bulk system does nothave a significant immediate effect on the concentrationgradient at the surface.This is because the more densesolution flows downwards,away from the dissolving surface,and therefore the bulk concentration in the region Figure 5. (a) Simulated concentration gradient in the free convection systemwith a boundary condition at the vertical planar surface of a constantsaturated solution of lactose monohydrate in the 0.1 M HC/ dissolutionmedium, and (b) the velocity magnitude contours (ms"') generated bythe effect of gravity on the density gradient from the saturated solutionof lactose monohydrate in 0.1 M HC/ at the vertical planar surface. of the dissolving surface is only affected by diffusionfrom the solution near the surface and from the base ofthe cell where the more concentrated solution collects.Therefore, the free convection generated increases theconcentration gradient at the surface and the overalleffect is an increased dissolution rate.In contrast,if a dissolving surface is located at the base of a freeconvection cell, it is more difficult for the density gradientto generate a significant free convection velocity, as themore concentrated solution pools at the base of the cellwhere the dissolving surface is located.This reduces thelocal density gradient and hence the free convectiongenerated. Furthermore, the more dense pooled solutiondecreases the concentration gradient at the dissolvingsurface.Therefore, the effect of the density gradient wouldbe to reduce dissolution overall for a dissolving surfacelocated at the base of a cell,and to increase dissolutionfor a dissolving surface suspended within a cell. Figure 5illustrates a simulation in a closed, free convection system(a jar)with a vertical dissolving surface suspended fromthe lid of the jar.The current work is a simulation ofhydrodynamics and species transfer in the jar with adefined constant source of lactose monohydrate saturatedsolution at the vertical dissolving surface of the lactosemonohydrate compact.The simulation does not includeany forced convection and therefore the predictedhydrodynamics arise from free convection alone. Figure 5adepicts the simulated concentration gradients in the jar of lactose monohydrate from the dissolving vertical planardisc surface in 0.1 M HCl,and Figure 5b depicts thevelocity magnitude contours generated by the effect ofgravity on the density gradient.The downward naturalconvection generated from the more dense saturatedsolution present at the vertical dissolving surface isevident in this 2D simulation. In a low-velocity environment,free convection interactswith forced convection. In the flow-through apparatus,as there is a low-velocity environment overall withperiods of zero-velocity input, there is potential for asignificant effect from natural convection.Furthermore,as the flow direction is upward, this is directly counteringthe downward free convection. The effect of density gradients on dissolution in a low-velocity flow-through environment, including orientationrelative to gravity and flow direction, was previouslysimulated and described (11). Furthermore,an increaseddissolution rate of slightly soluble benzoic acid in 0.1 MHCl in a free convection system compared with thatat 8 mL/min,22.6-mm diameter cell in the flow-throughapparatus was reported (3). Simulated results in thatsituation suggest that intermittent downward flow dueto flow reversal rather than natural convection reducedflow at the surface in the flow-through apparatus.A recentstudy (12) presented a detailed analysis of the interactionbetween forced and natural convection in the flow-throughapparatus,suggesting that solubility of the solute plays amajor role in the generation of natural convection at thedissolving surface. The hydrodynamic environment at a dissolving surfacesuspended in the flow-through cell,therefore, is influencedby the overall pulsing flow, local effects such as flowreversal,and downward free convection,when thesolution density is high enough to generate freeconvection against the forced convection environment.As the fluid velocity at a surface affects the hydrodynamicboundary layer thickness, and the hydrodynamic boundarylayer thickness affects the diffusion boundary layerthickness, it is evident that changing local fluid velocitiesaffects the dissolution rate. As illustrated in the theoryoutlined above, the nature of these changing local fluidvelocities does not have a simple relationship with theoverall pump flow rate. Dissolution of Particulate Systems To this point, we have been considering a staticdissolving surface.In many cases dissolution testing inUSP Apparatus 4 involves particulate systems, from pureAPl to disintegrated dosage forms. A comprehensiveanalysis on the effect of particle size and density ondissolution in the flow-through cell was presented (8).The velocity relevant to particulate dissolution is therelative velocity;in other words, as the fluid moves, aparticle is free to move with the fluid. However,the particlevelocity is rarely identical to the fluid velocity, dependingon particle size, shape and density as,for a spherical particle,the velocity is equal to the sum of a numberof forces including drag force,buoyancy forces, and fluidacceleration(8). For a spherical particle, the relative velocity can beexpressed in terms of the particle Reynolds number, Re,: where p is the fluid density,Urand U, are the fluid andparticle velocities, respectively,d, is the diameter of theparticle, and pr is the fluid viscosity. Dissolution is then related to the Re, as follows: where k is the mass transfer coefficient,D is the diffusioncoefficient of the solute in the solvent, and v is thekinematic viscosity of the fluid.The change in particlemass with time (dissolution rate) is then relatedto the solubility of the dissolving substance,the masstransfer coefficient (k), and the surface area of thedissolving particle. Although this theory is relatively straightforward,most particulate dissolution systems involve a particle sizedistribution.Furthermore,particle motion is bound bythe flow-through cell boundary. In other words, ratherthan having a constant relative velocity, there are periodsof absolute velocity when a particle is held at the upperor lower cell boundary due to buoyancy effects. Therefore, rather than one initial relative velocity appliedto one initial particle size, a range of relative velocities ispresent. Furthermore, as particles dissolve,the particle sizedistribution changes over time, and therefore at the sameflow rate the relative fluid velocities also change over time.In the pulsing flow of the flow-through apparatus,therelative velocity value represents the difference betweenfluid and particle velocity over the course of the pulse.As the fluid velocity increases,the particle velocity alsoincreases,and as the fluid velocity reduces to zero, theparticle is free to move downward under gravity, if it isdenser than the fluid and the buoyancy force overcomesviscous friction. It can be seen,therefore,how particledensity plays a role in the relative fluid velocity generatedby a particulate system. An increase in flow rates leads to an increase in absolutevelocity, which also leads to an increase in particle velocity.Therefore, in theory, relative velocity is not predicted tovary with flow rate for a given particle size. According toeq 2, a constant relative velocity suggests a constantdissolution rate; however, an increase in dissolution ratewith flow rate for particulate systems was noted (8).A constant relative velocity for a given particle size assumesan idealized situation of an independent particle movingeither in one direction with the fluid or in the directionopposite to the fluid flow during zero-or low-velocity periods, when the particle is more dense than the fluid,and the flow direction is opposite gravity.On observingparticulate dissolution in USP Apparatus 4, however, threeadditional phenomena are thought to contribute to thehydrodynamic environment of the dissolving particles.Firstly,particles are moving in a three-dimensional space,and therefore there is some radial movement in additionto upward and downward movement.The extent of thisradial movement may be affected by flow rate.Secondly,unless the system is very dilute, particles are not alwaysindependent spheres and can, for example, form a loosecake at the base (or top) of the cell. In this situation,particle motion is inhibited by adjacent particles, and thelocal concentration gradient is affected by dissolution ofadjacent particles, the result being to decrease thedissolution rate. An increase in flow rate can lead toincreased motion and dispersal of this cake,leadingto a system gradually approaching the scenario ofindependently dissolving particles.An increase in flowrate, therefore, is likely to be associated with an increasein dissolution rate through increased disruption of theparticulate system allowing a particle greater movementand exposure to fresh dissolution medium, rather thanany increase in relative-velocity value for a theoreticalindependent particle. Finally, in terms of particles held atthe upper or lower cell boundary due to buoyancy forces,while the particle remains static, absolute fluid velocity,which changes with flow rate, is relevant. Once the particleis suspended in the fluid, relative velocity is the relevantparameter.Therefore, particle dissolution is also affectedby flow rate when buoyancy forces dictate that a particle isstatic and its dissolution subject to absolute-velocity forces.The above analysis (eq 2) is for the simplified case of spherical particles, whereas particle velocity also dependsto an extent on particle shape.The concept of aparticleshape factor (PSF) wasintroduced to adjust for the surfacearea of a nonspherical particle(13). An approximate PSFcan be calculated by calculating the surface area ofthe particle relative to the surface area of a sphere ofequivalent volume.As yet, however, there is no simpleequation to predict the effect of particle shape on theeffective diffusion boundary layer thickness. Imaging Techniques Overall particle motion effects such as cake formation,floating particles, or particles trapped at the upper filtercan be observed by simple visualization. In terms ofcharacterizing particle size and motion over the courseof a dissolution test, a shadowgraph imaging methodwas recently introduced (8). Figure 2b shows a typicalshadowgraph image, in this case with the particle movingdirectly upward.The red arrow depicts both directionand velocity magnitude, and the particle diametercan also be measured (indicated here by the red circles).Out-of-focus particles are detected by the algorithm andomitted from the statistics. With the shadowgraph imaging technique, particledirection, velocity,and diameter can be measured.From this,the change in particle size distribution over timecan be observed.This observation is made within thesampling region only, and as demonstrated recently (8),the particles observed within the sampling region mayrepresent a"window"of particle size distribution,with particles entering and leaving that window as theydecrease in size. Furthermore,the absolute lower particle diameter limitfor particle detection with the optical arrangement(i.e.,combination of a 105-mm macro lens with a 150-mmlong extension tube) employed in the study by D'Arcyand Persoons (8) was 6 um.Nevertheless, with this systema practical lower limit of approximately 30-um particlediameter is more realistic for dissolution imaging, todetect changes in particle diameter over time.Highermagnification lenses and higher resolution cameras areavailable,however,and this aspect should be exploredalong with method optimization.In summary,theshadowgraph imaging method could be furtheroptimized to detect smaller particles and to look at arange of regions in the cell to detect overall particlevelocities present and the overall change of particle sizedistribution with time.Knowledge of particle size andmotion over the dissolution test can indicate whether theparticles are mostly free to move with the fluid,therebysubject to a relative-velocity value that does not changewith flow rate, or are somehow prohibited from movingfreely (e.g., due to cake formation or particle density,resulting in the particle resting at the cell of the baseduring low-velocity periods of the pulse).In the lattersituations where the particles are not free to moveindependently, the absolute-velocity value is relevant tothe dissolution rate, and therefore dissolution of theexposed surface could be expected to vary with flow rate. Shadowgraph imaging is a promising tool to investigatethe hydrodynamic environment of a particulate dissolutionsystem during dissolution testing in USP dissolutionApparatus 4, giving information on particle size andvelocity.However, in a situation where there is cakeformation, it is not only the particle motion and exposedsurface area that are inhibited through contact withadjacent particles.The local concentration gradient is alsoaffected, as the bulk concentration could not always beexpected to be zero, despite the flow of fresh dissolutionmedium through the cell. During the zero and low-velocityperiod of the pulse, there is no, or limited,inflow of freshdissolution medium.Furthermore, in considering a bed orcake of particles, not all areas of the surface are equallyexposed to the fresh dissolution medium flowing throughthe cake,depending on the path of the medium.Therefore,local concentration gradients affect the dissolution rate.There have been some interesting developments inusing UV imaging technology to analyze concentrationgradients at a dissolving surface in a flow-through cell. Recently, it was reported (14) that quantitative analysis ofconcentration gradients is possible when investigatingnicotine release from a nicotine patch using UV imaging.Although, to our knowledge, these methods have notbeen applied routinely to concentration gradients aroundparticulate systems in USP Apparatus 4, the developmentof such techniques is promising for investigating the effectsof local concentration gradients on dissolution rates.Thisis relevant also to nondisintegrating dissolving surfaces,for example to determine the effects of solution densityon local hydrodynamics and its change with flow rate. CONCLUSION Investigation and simulation of hydrodynamic effects inthe low-velocity,pulsing flow of USP dissolution Apparatus4 can give some insight on how the hydrodynamics withinthe flow-through cell can affect the dissolution process.Relevant hydrodynamic features include the bulk pulsingflow field, which consists of periods of low to zero fluidvelocity and periods of higher velocity depending on theflow rate.The velocity magnitude of this pulsing flow canbe significant for distribution of a particulate systemwithin the cell and consequent exposure of particles tofresh dissolution medium.Local hydrodynamic features,which may require simulation or imaging techniques toanalyze, can result in fluid flow opposite to the bulk flowdirection.This occurs due to effects of boundary layerseparation and reversal at a dissolving surface and gravityinduced natural convection caused by density gradients.Furthermore, significant variation in radial velocities andflow variability depending on tablet location and cell sizewere observed (4).Such local flow features can affect thelocal concentration gradient and thus the dissolution rate,in what may be an unpredictable manner, resulting indissolution rates that do not increase with increasingflow rates under certain conditions.Although simulationtools such as CFD can be of assistance in predicting thehydrodynamic effects on dissolution,newer imagingapplications such as MRI,shadowgraphy, and UV imagingshow promise in their ability to determine the environmentlocal to the dissolving surface. In the complex hydrody-namic environment of the low-velocity pulsing flow withinUSP Apparatus 4,interpretation of dissolution rate datarequires consideration of hydrodynamics local to thedissolving surface in addition to overall flow rate. ACKNOWLEDGMENT This research was funded in part by the Irish ResearchCouncil for Science Engineering and Technology. ( REFERENCES ) 1. Kakhi,M. Classification of the flow regimes in the flow-through cell.Eur.J.Pharm.Sci. 2009,37(5),531-544 2. Kakhi,M.Mathematical modeling of the fluid dynamicsin the flow-through cell.Int.J.Pharm. 2009,376(1-2),22-40. 3. D'Arcy,D.M.;Liu,B.;Bradley,G.;Healy,A.M.; Corrigan,O.I.Hydrodynamic and species transfer simulations in. the USP 4 dissolution apparatus: considerations fordissolution in a low velocity pulsing flow.Pharm.Res.2010,27(2),246-258. 4. Shiko,G.;Gladden,L.F.;Sederman,A.J.;Connolly, P. C.;Butler, J.M. MRI Studies of the Hydrodynamics in a USP4 Dissolution Testing Cell.J.Pharm.Sci.2011,100(3),976-991. 5. D'Arcy,D.M.;Corrigan,O.I.;Healy, A. M.Evaluation ofhydrodynamics in the basket dissolution apparatususing computational fluid dynamics-dissolution rateimplications.Eur.J.Pharm. Sci. 2006,27(2-3),259-267. 6. The United States Pharmacopeia and National FormularyUSP 34-NF 29;The United States PharmacopeialConvention,Inc.:Rockville, MD,2011. 7. European Pharmacopoeia, 7th ed.;EuropeanDirectorate for the Quality of Medicines & Healthcare,Council of Europe: Strasbourg,France,2011. 8. D'Arcy, D.M.; Persoons,T.Mechanistic modelling andmechanistic monitoring: Simulation and shadowgraphimaging of particulate dissolution in the flow-throughapparatus.J.Pharm.Sci. 2011,100(3),1102-1115. 9. White, F. M. Viscous Fluid Flow,2nd ed.;McGraw-Hill:NY,1991. 10. Cammarn,S.R.; Sakr, A. Predicting dissolution viahydrodynamics: salicylic acid tablets in flow throughcell dissolution.Int.J.Pharm.2000, 201 (2),199-209. 11. Stevens,L.E.;Missel,P.J.Impact of density gradientson flow-through dissolution in a cylindrical flow cell.Pharm.Dev.Technol. 2006, 11 (4),529-534. 12. D'Arcy, D. M.;Liu, B.;Corrigan,O.I. Investigating theeffect of solubility and density gradients on localhydrodynamics and drug dissolution in the USP 4dissolution apparatus.Int.J.Pharm. 2011,419(1-2),175-185. 13. Sugano,K.Introduction to computational oral absorp-tion simulation.Expert Opin.Drug Metab. Toxicol. 2009,5,(3),259-293. 14. Ostergaard,J.;Meng-Lund,E.;Larsen,S.W.;Larsen, C.;Petersson,K.;Lenke,J.;Jensen,H.Real-time UV imagingof nicotine release from transdermal patch.Pharm.Res.2010,27,2614-2623. Dissolution Technologies INOVEMBER iss-indd AM USP dissolution Apparatus 4 can have a pulsing or non-pulsing flow, with most commercial apparatus employing a pulsing flow. Overall, a low velocity flow field is present, particularly in the larger 22.6-mm diameter cell. Dissolution data, computational fluid dynamics (CFD), and imaging methods are used and discussed to investigate the effects of low velocity pulsing flow on dissolution. Local velocity patterns, density gradients, and the effect of flow rate on particulate dispersion can all contribute to the observed dissolution rate. In silico simulation tools and imaging techniques have proved useful in determining local hydrodynamics and, in some cases, their effect on observed dissolution rates. Methods to investigate concentration gradients at the dissolving surface are required to investigate further the effectof hydrodynamics on the dissolution process. In conclusion, it is necessary to take local flow patterns and velocities intoaccount, rather than overall flow rate alone, when interpreting dissolution rate data in the flow-through apparatus.
确定




还剩6页未读,是否继续阅读?
北京欧兰科技发展有限公司为您提供《USP溶解仪中速度场检测方案(CCD相机)》,该方案主要用于其他中其他检测,参考标准--,《USP溶解仪中速度场检测方案(CCD相机)》用到的仪器有Imager sCMOS PIV相机、德国LaVision PIV/PLIF粒子成像测速场仪、LaVision ParticleMaster-Shadow 粒径测量系统、LaVision DaVis 智能成像软件平台
推荐专场
CCD相机/影像CCD
更多
相关方案
更多
该厂商其他方案
更多


