


Two novel techniques based on Laser-Induced Fluorescence (LIF) were applied to measure gas-phase temperature distributions in boundary layers close to wall surfaces. Single line toluene-LIF thermometry was used to image temperature in a nitrogen gas flow above a heated wall. The nitrogen gas flow was doped with evaporated toluene. When excited at 266 nm, the toluene LIF-signal shows an exponential dependence on temperature. This behavior was used to calculate absolute temperatures from LIF images after calibration at known conditions. The second technique, multi-line NO-LIF thermometry was applied to image temperature in the quenching boundary layer close to a metal wall located on a flat flame burner. A small amount of nitric oxide was mixed into the air/methane mixture. NO molecules were excited in the A-X (0,0)-band at 225 nm. NO-LIF excitation spectra were acquired by tuning the excimer laser wavelength and recording the NO LIF-signal with an ICCD camera. Absolute temperatures were calculated for every pixel by fitting simulated
excitation spectra to the experimental data. Temperature distributions close to the wall surface were measured at two different flow-rate conditions. A high nominal spatial resolution of
0.016 mm/pixel in direction perpendicular to the wall was reached. Wall surface temperatures were recorded simultaneously by embedded thermocouples and compared with gas-phase temperature near the wall surface.
方案详情

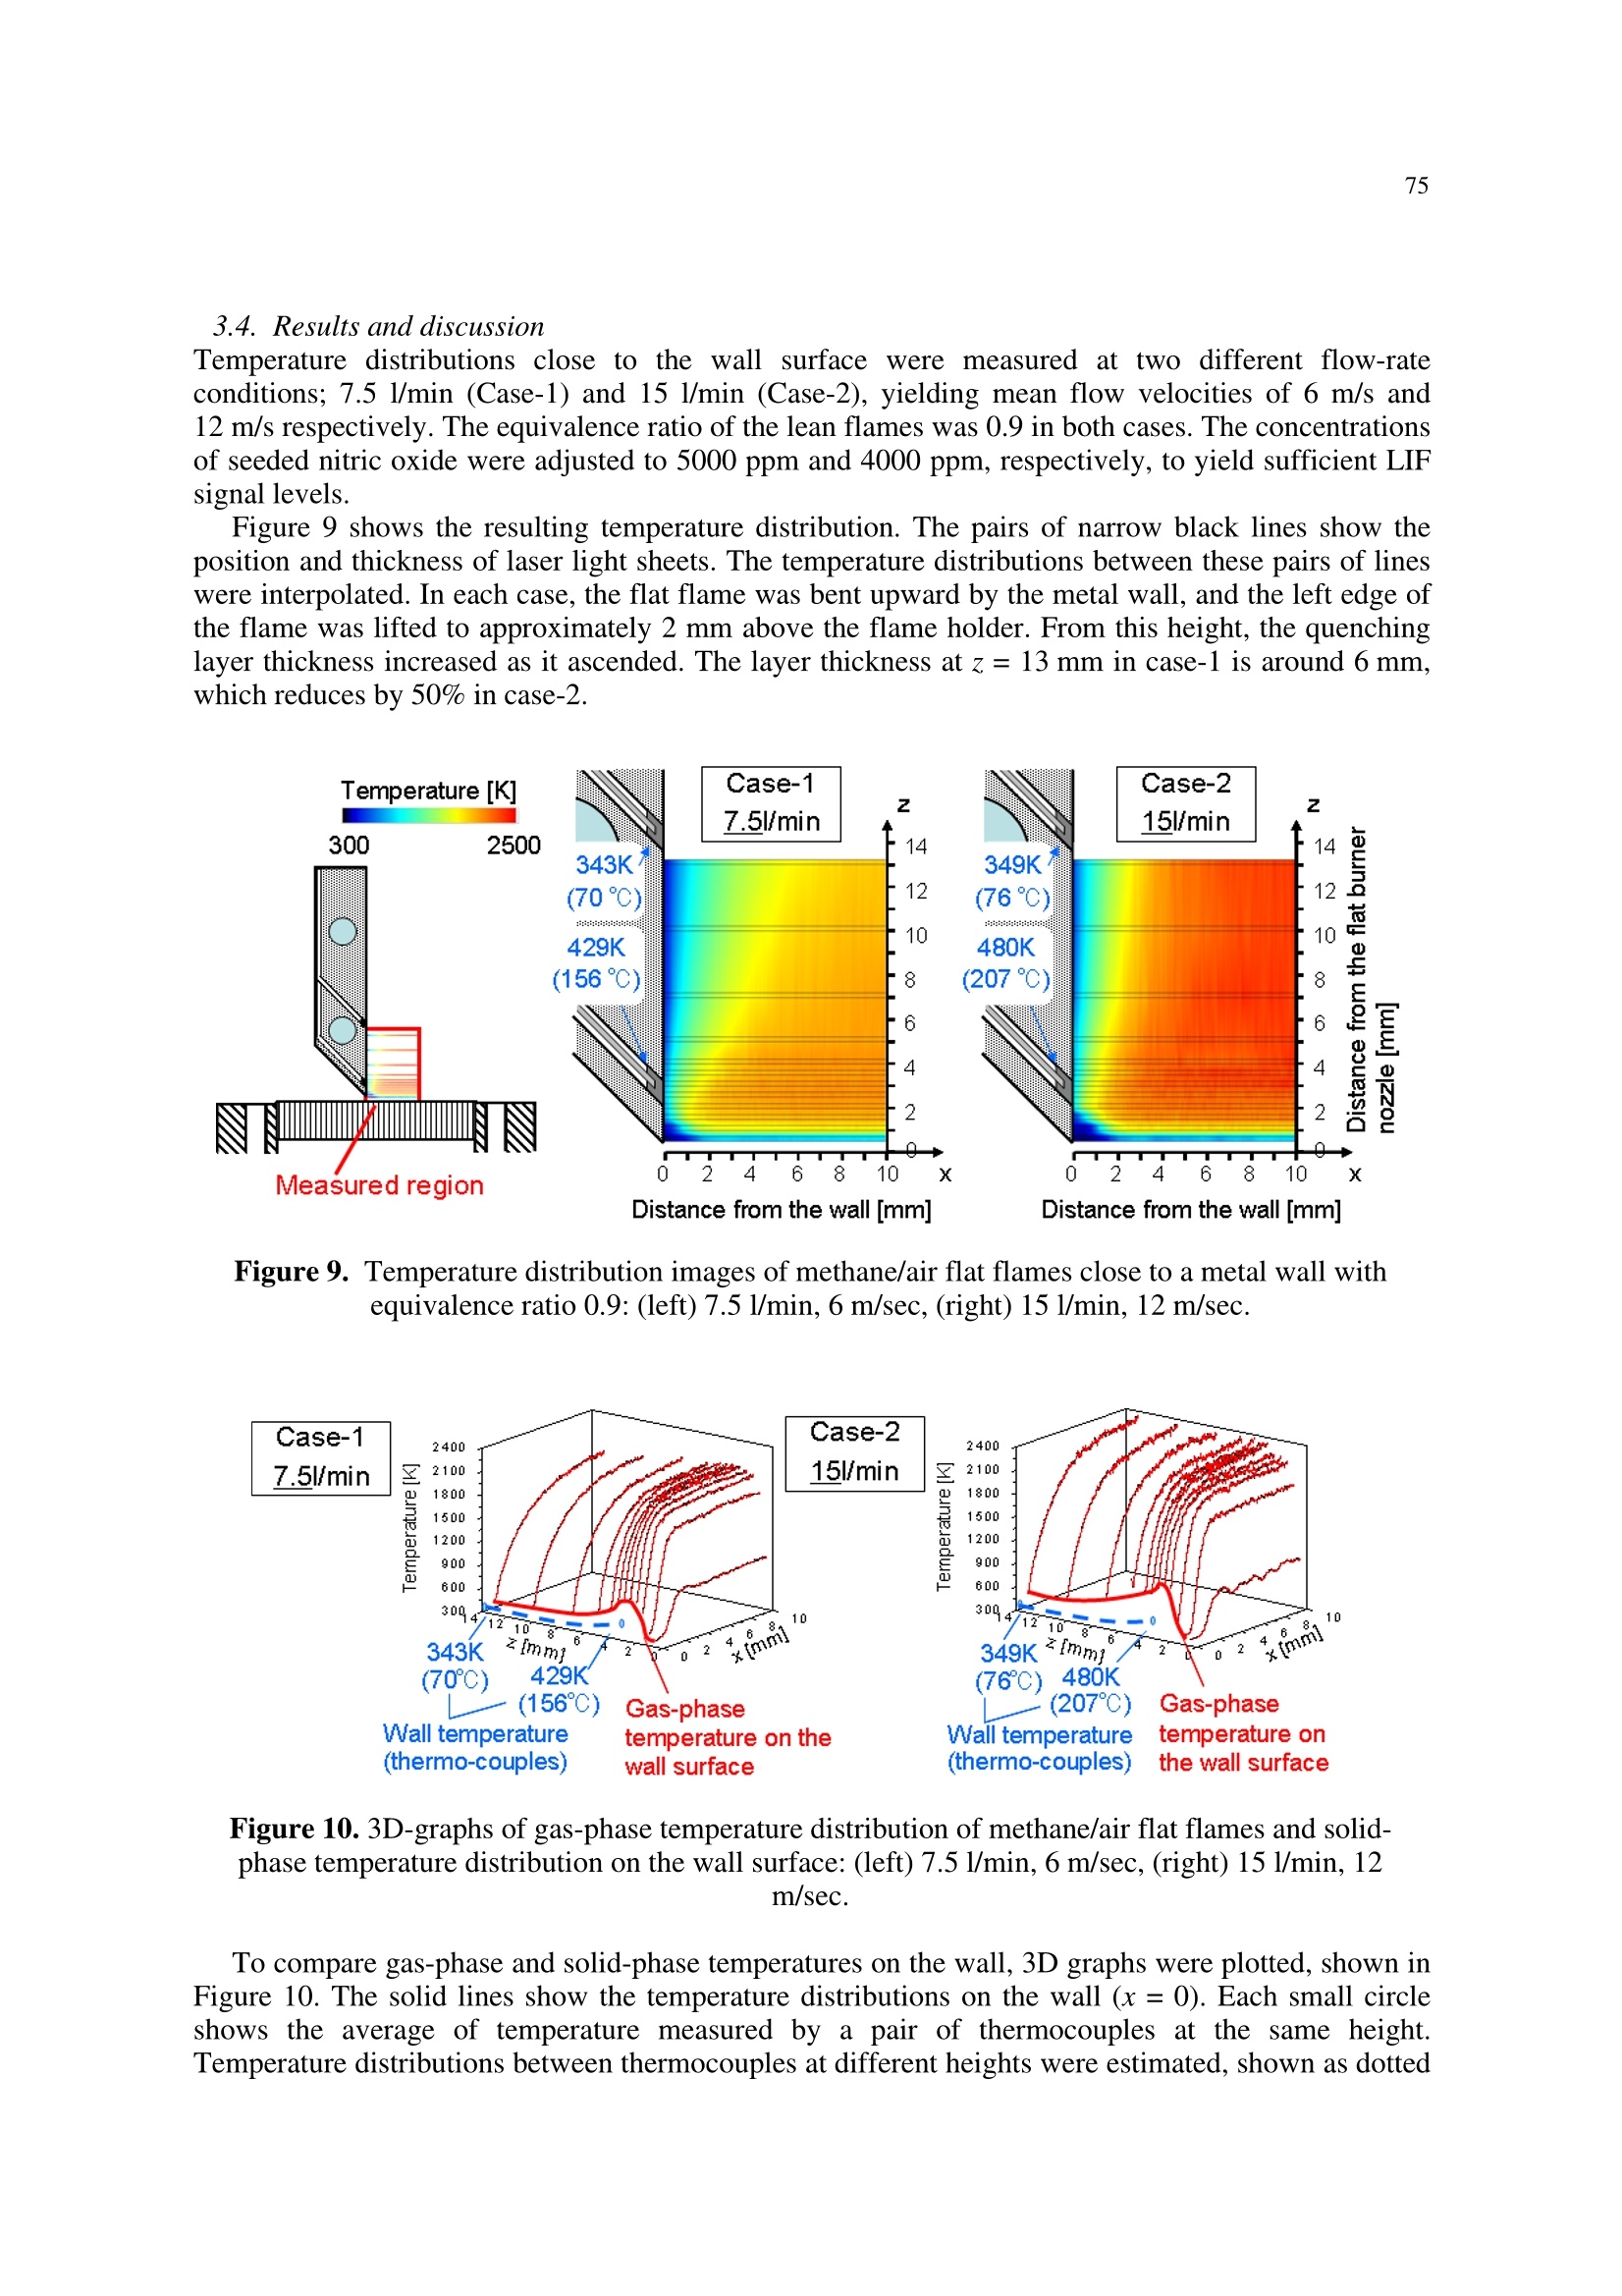
Institute of Physics Publishingdoi:10.1088/1742-6596/45/1/010Journal of Physics: Conference Series 45 (2006) 69-76Second International Conference on Optical and Laser Diagnostics (ICOLAD 2005) 70 ◎ 2006 IOP Publishing Ltd69 Laser-based temperature imaging close to surfaces withtoluene and NO-LIF T Fuyuto, H Kronemayer, B Lewerich, W Koban, K Akihama and C Schulz PCI,Physikalisch-Chemisches Institut, Universitat Heidelberg, INF 253, 69120Heidelberg, Germany Engine Combustion Lab., Mechanical Engineering Dept., Toyota Centra R&D Labs.,Nagakute, Aichi 480-1192, Japan ’IVG, Institut fiir Verbrennung und Gasdynamik, Universitat Duisburg-Essen,Lotharstrasse 1, 47057 Duisburg, Germany E-mail: christof.schulz@uni-duisburg.de Abstract. Two novel techniques based on Laser-Induced Fluorescence (LIF) were applied tomeasure gas-phase temperature distributions in boundary layers close to wall surfaces. Single-line toluene-LIF thermometry was used to image temperature in a nitrogen gas flow above aheated wall. The nitrogen gas flow was doped with evaporated toluene. When excited at266 nm, the toluene LIF-signal shows an exponential dependence on temperature. Thisbehavior was used to calculate absolute temperatures from LIF images after calibration atknown conditions. The second technique, multi-line NO-LIF thermometry was applied toimage temperature in the quenching boundary layer close to a metal wall located on a flatflame burner. A small amount of nitric oxide was mixed into the air/methane mixture. NOmolecules were excited in the A-X (0,0)-band at 225 nm. NO-LIF excitation spectra wereacquired by tuning the excimer laser wavelength and recording the NO LIF-signal with anICCD camera. Absolute temperatures were calculated for every pixel by fitting simulatedexcitation spectra to the experimental data. Temperature distributions close to the wall surfacewere measured at two different flow-rate conditions. A high nominal spatial resolution of0.016 mm/pixel in direction perpendicular to the wall was reached. Wall surface temperatureswere recorded simultaneously by embedded thermocouples and compared with gas-phasetemperature near the wall surface. 1. Introduction A detailed understanding of transport phenomena in boundary layers is essential for the quantitativedescription of reactive flows, as appear in internal combustion engines, power plants, etc. Within therecent years, laser diagnostics have been frequently applied to combustion analysis, e.g.in internalcombustion engines [1,2]. However, most of these techniques have been used to measure ‘bulkflow/combustion’. Diagnostics for wall/flow interactions in boundary layers have not yet beendeveloped sufficiently. Temperature measurement in boundary layers seemed to be more important than velocity andspecies concentration, for the following reasons. First, the temperature distribution close to surfaces ina cylinder of reciprocating engines affects directly flame propagation, knocking, and quenching. Thesephenomena dominate engine performance and exhaust emissions. Second, temperature information isvery useful for LIF measurement of species, such as OH and fuel compounds. The temperaturedependence of their LIF signals hampers the application of LIF techniques to conditions with spatialtemperature gradients. If the temperature distribution is known, however, the LIF signal can becorrected for its temperature dependence. Gas phase temperatures can be measured based on Rayleigh scattering off gas molecules [3]. In thevicinity of surfaces scattering generates a prohibitive background. This technique is therefore notapplicable unless filtered Rayleigh techniques [4] are used. Another option is to take advantage of thetemperature dependence of the LIF signal from molecular tracers. Such methods have the advantagethat the signal from the excited molecules is shifted with regard to the excitation wavelength. Thisallows the discrimination against scattered light with appropriate filters. Popular tracers are 3-pentanone and acetone [5,6]. Recently, toluene was discovered as promising tracer for thermometry. All these substances show broad temperature dependant LIF spectra [7].In single-line techniques (one laser wavelength and one detection band) the change of the totalfluorescence intensity is measured and temperature is calculated after calibration. They can only beapplied if the tracer concentration is invariant in the observed field. Two-line techniques (i.e. eithertwo excitation wavelengths or two detection bands) and multi-line techniques gather information abouteither the emission or the excitation spectrum of the tracer. From its temperature dependant shapetemperaturesescanbe calculated. These methodslsaallow measurementsisalso in1systems withinhomogeneous distribution of the tracer. In this work, two novel techniques based on LIF were chosen and applied to measure gas-phasetemperature distributions in boundary layers. First, single-line toluene-LIF thermometry was appliedto visualize a temperature gradient in a nitrogen gas flow above a heated wall. Second, multi-line NO-LIF thermometry was applied to image temperature in the quenching boundary layer close to a metalwall located on a flat flame burner. 2. Temperature imaging with toluene-LIF thermometry 2.1. Single-line toluene thermometry Fluorescence quantum yield and temperature sensitivity are important criteria for the choice of a tracerfor thermometry. Here toluene has a clear advantage compared to the widely used tracers 3-pentanoneor acetone (a factor ~500 higher quantum yield).Together with the measurements published by Luonget al. [8], this work is the first application of toluene as a tracer for thermometry. The technique is based on measurements of the temperature dependant absorption cross section oand fluorescence quantum yield . of toluene in nitrogen bath gas [7]. They were Ycohndeucted with266 nm excitation wavelength in a temperature regime from 300 K to 930 K. When calculating theLIF-signal per volume S at constant pressure and constant tracer mole fraction Xacer the change ofnumber density with temperature has to be accounted for as well: The resulting plot shows a logarithmic dependence of total LIF signal on temperature and is displayedin figure 1. An exponential fit to this plot gives the following equation: with S (T,) being the fluorescence signal at the known temperature Trer This equation allows the calculation of the temperature in a nitrogen/toluene gas flow based on thechange of the LIF signal in respect to a reference signal. This is subject to the condition that theconcentration of toluene is kept constant and that the distribution of laser energy does not change andis far from saturation limits. The absorption of laser light along its path through a gas depends on the absorption cross-section and the number density of the absorbing molecules. For toluene the productof both is normalized and plotted against temperature in figure 2. Between 300 K and 500 K morelight will be absorbed with increasing temperature. Therefore the distribution of laser energy along thelight sheet is temperature dependant. To reduce this error source it is important to keep the tolueneconcentration low. Figure 1. Temperature-dependence oftoluene LIF. Figure 2. Product of absorption cross section andnumber density as a function of temperature.Normalized to the value at 300 K. 2.2. Experimental A sketch of the experimental setup is shown in figure 3. A 6 l/min nitrogen gas flow was seeded with18 g/h toluene using an evaporator and mixer and then further diluted in a stream of 24 l/min nitrogen.Gas and liquid flows were controlled by Bronkhorst flow controllers. The gas mixture was introducedinto an optical accessible flow channel (5x60 mm’cross section, 258 mm length) to form a laminarflow of 1.7 m/s average velocity with a toluene concentration of 2300 ppm. The bottom wall of theflow channel was made of aluminum (3 mm thickness) with a wall heater unit (Watlow NM180X50,180 mm length) attached to it. A thermocouple was embedded into the aluminum wall 204 mm behindthe inlet to monitor the wall temperature at this location. A quadrupled Nd:YAG laser (Thomson CSF, 5000 Series) provided laser light at 266 nm. Thebeam was expanded in vertical direction by a pair of cylindrical lenses (f =-40 mm,f=80 mm). Asection was cut out by an aperture and formed to a light sheet using another cylindrical lens (f=1000mm). Via a periscope stage the light sheet was aligned under a small angle of incidence onto theheated bottom wall. In order to avoid saturation effects the laser energy was reduced by changing theQ-switch timing. The laser beam had an energy of ~0.5 mJ per pulse at the entrance window of theflow channel. Images were acquired using a LaVision NanoStar ICCD camera with a Nikon UV lens (f=105 mm,f =4.5) and averaged over 50 laser shots. One pixel geometrically represents ~50 um in the observedarea. A Schott WG 280 filter reduced elastically scattered laser light. The remaining background from elastically scattered laser light (less than 1% signal strengthcompared to the toluene LIF) was recorded in pure nitrogen. With toluene seeded into the flow, LIFimages were acquired at room temperature and at two different wall temperatures. These weremeasured by the thermocouple to be 409 K and 447 K. The background images were subtracted from all LIF images. Then, temperature distributions overthe heated wall were calculated pixel-by-pixel according to equation (1) with the image taken at roomtemperature serving as reference (Tre=296K). Figure 3. Experimental setup 2.3. Results and discussion The temperature distribution in a laminar channel flow with an average velocity of 1.7 m/s over aheated surface was imaged at two different wall temperatures. The results are shown in figure 4. Theheated surface was considered to be at the position of highest temperature and the images were cut offalong this line. At three positions, at the left and right edge of the observed area and at the location ofthe thermocouple, temperature profiles were extracted from the images. They show a temperatureboundary layer with an almost linear temperature gradient towards the wall. In the middle of theimaged area gas-phase temperatures at the wall are about 15 K below the value measured inside thewall by the thermocouple. The peak temperature decreases by ~16 K in flow direction which is due to an inhomogeneous heatflux from the heater unit. The absorption through the imaged area was calculated to increase by 2% ifthe wall is heated, resulting in an error of max. 2 K. Thus a change in the laser energy distribution dueto this effect should play a minor role. Further experiments will include monitoring the temperature inthe heated wall at several locations. The standard deviation of temperatures was calculated from the root mean square of the LIFimages to be ~10 K (2.5%) for all pixels. This originates from oscillations of the laser energy and cansignificantly be reduced by recording the laser energy shot-per-shot. Figure 4. Measured temperature images in the flow channel. 450Position 1 425 400- 375- 350- 325- 3001 3. Temperature imaging with multi-line NO-LIF thermometry 3.1. Multi-line NO-LIF thermometry Multi-line NO-LIF temperature imaging was recently introduced by Bessler and Schulz [9]. Accuracyand versatility were significantly improved compared to conventional two-line techniques. The multi-line technique was applied to temperature measurements in sooting flames [9], high-pressure flames[10] as well as in spray flames [11]. 2D-LIF excitation scans were performed over a spectral range in the NO A-X(0,0) band whileacquiring two-dimensional intensity maps with an ICCD camera. For each individual pixel, LIFintensities were extracted versus excitation wavelengths, yielding experimental excitation spectra. Aspectral simulation code [12] was then used to fit simulated spectra to the experimental spectra foreach pixel using a non-linear least-square fitting method. The fitting technique yields absolutetemperature without the necessity of calibration. Figure 6. Experimental setup: overall figure (left) and the inside of the burner housing (right). 3.2. Experimental A schematic of the optical setup is shown in figure 6. The beam from a tunable, narrow-band(Av=0.6 cm) KrF excimer laser (Lambda Physik, EMG 150 TMSC) was used to pump a H-Raman-cell. Behind the cell a Pellin-Broca prism and a slit aperture separated the first anti-Stokes frequencyfrom the fundamental and the other Raman-shifted frequencies. A cylindrical lens formed the laserbeam into a horizontal light sheet. Laser pulse energies were approximately 1 mJ, which were detectedby a photodiode on a single-shot basis to correct the LIF signal for laser energy fluctuations. Inside the burner housing, premixed methane/air flat flames, shown in figure 7, were stabilized on aflat-flame burner [13,14]. The flame folder is a honeycomb disk with 805 holes, each 1 mm indiameter. It was made of brass, which has high thermal conductivity, to uniform the temperaturedistribution. The surface was coated with nickel plating to prevent corrosion due to the seeded nitricoxide. The burner had a co-flow nozzle to stabilize the flat flame. The flow rate of the co-flow wasadjusted to the velocity of the unburned mixture flow. 0.5 mm above the flame folder, an edged metal wall was located. It was made of stainless steel,with a cooling-water channel inside. The cooling-water temperature was kept to 60℃. The objectsurface of the wall was polished. Four thermocouples are embedded close to the surface. The horizontal laser sheet passed over the flame-holder. The cross section of the light sheet was~20 x 0.2 mm² at the burner center. It had a small depression angle to the metal wall surface, 0 in figure 6, to prevent blind spot close to the surface. For the same reason, a 45° mirror was shiftedslightly towards the CCD camera to have a small depression angle to the wall surface. Therefore, thefield of view included not only fluorescence images on the horizontal cross-section, but also reflectionimages on the wall surface. Excitation scans were performed by recording 2D-images at a given laser wavelength and thentuning the laser to the next wavelength. The scans covered the 44407-44418 cm range with 0.2cmspectral resolution. At each wavelength, LIF signals of 50 images were averaged to improvesignal/noise ratio. A band pass filter separated the signal light from elastically scattered light and otherinterference. LIF signals were focused (Halle, f=200 mm achromatic UV lens) onto a LaVisionFlowmaster ICCD camera with 100 ns exposure time. The camera chip was binned ×8 on the y-axis toenhance the signal level, yielding raw images of 160×1024 pixels,. A high nominal spatial resolutionof 0.016mm/pixel in direction perpendicular to the wall (x-axis) was achieved. Figure 7. Structure of the flat flameburner and the metal wall. Figure 8. An example of measured temperature images andprocedure of data evaluation. 3.3. Data evaluation Figure 8 shows the procedure of data evaluation. The multi-line spectra fitting was performed by theLIFSim program package [12]. Simultaneous fit of background signal and LIF strength makes thistechnique robust against both broadband interference and laser and signal attenuation. It yieldsabsolute, quantitative temperature measurements without the necessity of external calibration.However, while accurate temperatures were evaluated at most pixels on the 2D images, the spectrafitting did not converge at some pixels, as indicated by the black areas in the images. Therefore, theseerror pixels were corrected by interpolation. Then, the center parts of the 2D(xy)-images, locatedbetween the pair of thermo-couples at the same height, were extracted and averaged on the y-axis.These one-dimensional temperature distributions on the x-axis at different heights were combined togenerate a 2D-image in the xz-plane. The detection of the wall position is important to achieve high spatial accuracy. The authorsconsidered the position of the lowest temperature as the wall position, because the temperature mustbe the lowest on the wall. The dispersion of the lowest temperature position was ±3 pixels (~±0.05mm). Finally, the 2D-(xz)-images were trimmed at wall position. 3.4. Results and discussion Temperature distributions close to the wall surface were measured at two different flow-rateconditions; 7.5 l/min (Case-1) and 15 l/min (Case-2), yielding mean flow velocities of 6 m/s and12 m/s respectively. The equivalence ratio of the lean flames was 0.9 in both cases. The concentrationsof seeded nitric oxide were adjusted to 5000 ppm and 4000 ppm, respectively, to yield sufficient LIFsignallevels. Figure 9 shows the resulting temperature distribution. The pairs of narrow black lines show theposition and thickness of laser light sheets. The temperature distributions between these pairs of lineswere interpolated. In each case, the flat flame was bent upward by the metal wall, and the left edge ofthe flame was lifted to approximately 2 mm above the flame holder. From this height, the quenchinglayer thickness increased as it ascended. The layer thickness at z= 13 mm in case-1 is around 6 mm,which reduces by 50% in case-2. Figure 9. Temperature distribution images of methane/air flat flames close to a metal wall withequivalence ratio 0.9: (left) 7.5 l/min, 6 m/sec, (right) 15 l/min, 12 m/sec. Figure 10. 3D-graphs of gas-phase temperature distribution of methane/air flat flames and solid-phase temperature distribution on the wall surface: (left) 7.5 1/min, 6 m/sec, (right) 15 l/min, 12m/sec. To compare gas-phase and solid-phase temperatures on the wall, 3D graphs were plotted, shown inFigure 10. The solid lines show the temperature distributions on the wall (x=0). Each small circleshows the average of temperature measured by a pair of thermocouples at the same height.Temperature distributions between thermocouples at different heights were estimated, shown as dotted lines. Wall temperatures measured by the upper thermocouples were close to the coolant watertemperature (333 K) in both cases, because of the short distance between the thermocouples and thewater channel. The distance between the dotted line and the solid line shows a temperature drop fromgas-phase to solid-phase on the wall surface. This temperature drop increases in case-2 with higherflow rate Note that the thermocouple measurements do not show the true wall-temperature, because thecontact points of the thermocouples were located inside the wall, ~0.2 mm away from the wall surface,resulting in a temperature drop within the solid-phase. 4. Summary and future plan Two novel techniques based on LIF were applied to measure gas-phase temperature distributions inboundary layers close to wall surfaces.; - Single-line toluene-LIF thermometry was used to image temperature in a nitrogen gas flow abovea heated wall. Multi-line NO-LIF thermometry was applied to image gas-phase temperature in the quenchingboundary layer close to a metal wall located on a flat flame burner. Results of multi-line NO-LIF thermometry will be used to correct LIF signals of species, such as OH,O,, etc, for their temperature dependence. These measurements will be conducted in the samequenching boundary layers. The authors are planning to apply these techniques to in-cylindertemperature measurement in internal combustion engines. Acknowledgements The authors thank Prof. Kazunori Wakai (Gifu Univ.) for his advice on the design of the flat-flameburner. References N.M. Laurendeau: Prog. Energy Combust. Sci. 14, 147 (1988) E.W. Rothe, P. Anresen: Appl. Optics 36, 3971 (1997) R.W. Dibble, R.E. Hollenbach: Proc. Combust. Inst. 18, 1489(1981) R.B. Miles, W.R. Lempert, J.N. Forkey: AIAA paper 91-0357 (1991) F. GroBmann, P.B. Monkhouse, M.Ridder, V. Sick, J. Wolfrum: Appl. Phys. B 62, 249(1996) M.C. Thurber, F. Grisch, R.K. Hanson: Opt. Lett. 22,251(1997) W. Koban, J.D. Koch, R.K. Hanson, C. Schulz Phys. Chem. Chem. Phys. 6, 2940 (2004) M. Luong, W. Koban, C. Schulz: Novel strategies for imaging temperature distribution usingToluene LIF (ICOLAD,London, 2005) [9] W.G. Bessler, C. Schulz Appl. Phys. B 78, 519 (2004) [10] W.G. Bessler, C. Schulz,T. Lee, D.I. Shin, M. Hofmann, J.B. Jeffries, J. Wolfrum,R.K.Hanson: Appl. Phys. B 75, 97 (2002) 111 H. Kronemayer, I. Diiwel, C. Schulz: Temperature imaging in spray flames (EuropeanCombustion Meeting (ECM), Louvain-la-Neuve,2005) [12] W.G. Bessler, C. Schulz, V. Sick, J.W. Daily: A versatile modeling tool for nitric oxide LIFspectra (http://www.pci.uni-heidelberg.delpci/lifsim) (3rd Joint meeting of the US sections ofThe Combustion Institute, Chicago, 2003, PI1) 141 M. Saffman: Combustion and flame 55, 141 (1984)
确定


还剩6页未读,是否继续阅读?

产品配置单


北京欧兰科技发展有限公司为您提供《燃烧,火焰,空气流体中浓度场,温度场检测方案(流量计)》,该方案主要用于其他中浓度场,温度场检测,参考标准--,《燃烧,火焰,空气流体中浓度场,温度场检测方案(流量计)》用到的仪器有PLIF平面激光诱导荧光火焰燃烧检测系统、Imager sCMOS PIV相机、德国LaVision PIV/PLIF粒子成像测速场仪
推荐专场


相关方案
更多
该厂商其他方案
更多