


方案详情
文
This work presents a study of carboxylate adsorption at the fluorite/water interface by vibrational sum frequency
spectroscopy(SFG). A homologous series of monocarboxylic ions including formate, acetate, propionate, hexanoate,
and dodecanoate was studied in frequency regions corresponding to the îCH and îCO/äCH response. Previously
reported vibrational and Raman modes were investigated for their sum frequency activity. For a more reliable
band assignment, sum frequency measurements on systematically deuterated compounds were completed
and compared with calculated band positions and intensities. Different polarization configurations were utilized,
together with symmetry properties of bands derived from a normal-mode analysis, to classify the observed
fundamentals and overtones. Differences in chain length led to striking changes in the spectral signatures of
the compounds studied and were related to the molecular structure of the adsorbates and interfacial water
molecules.
方案详情

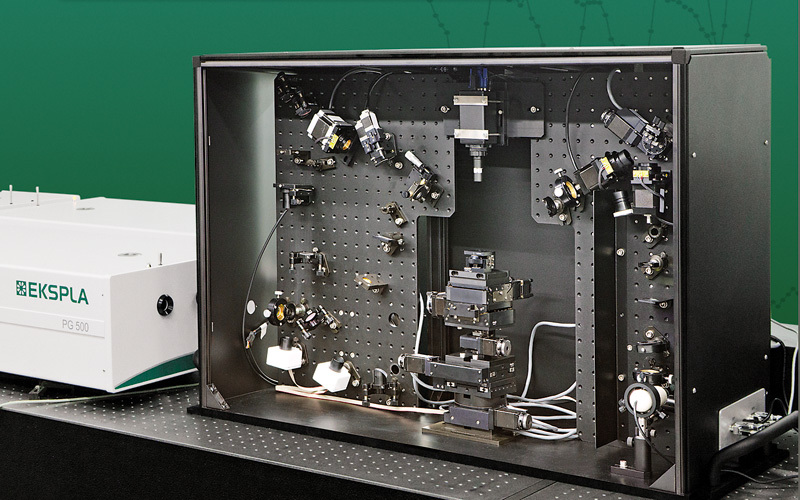
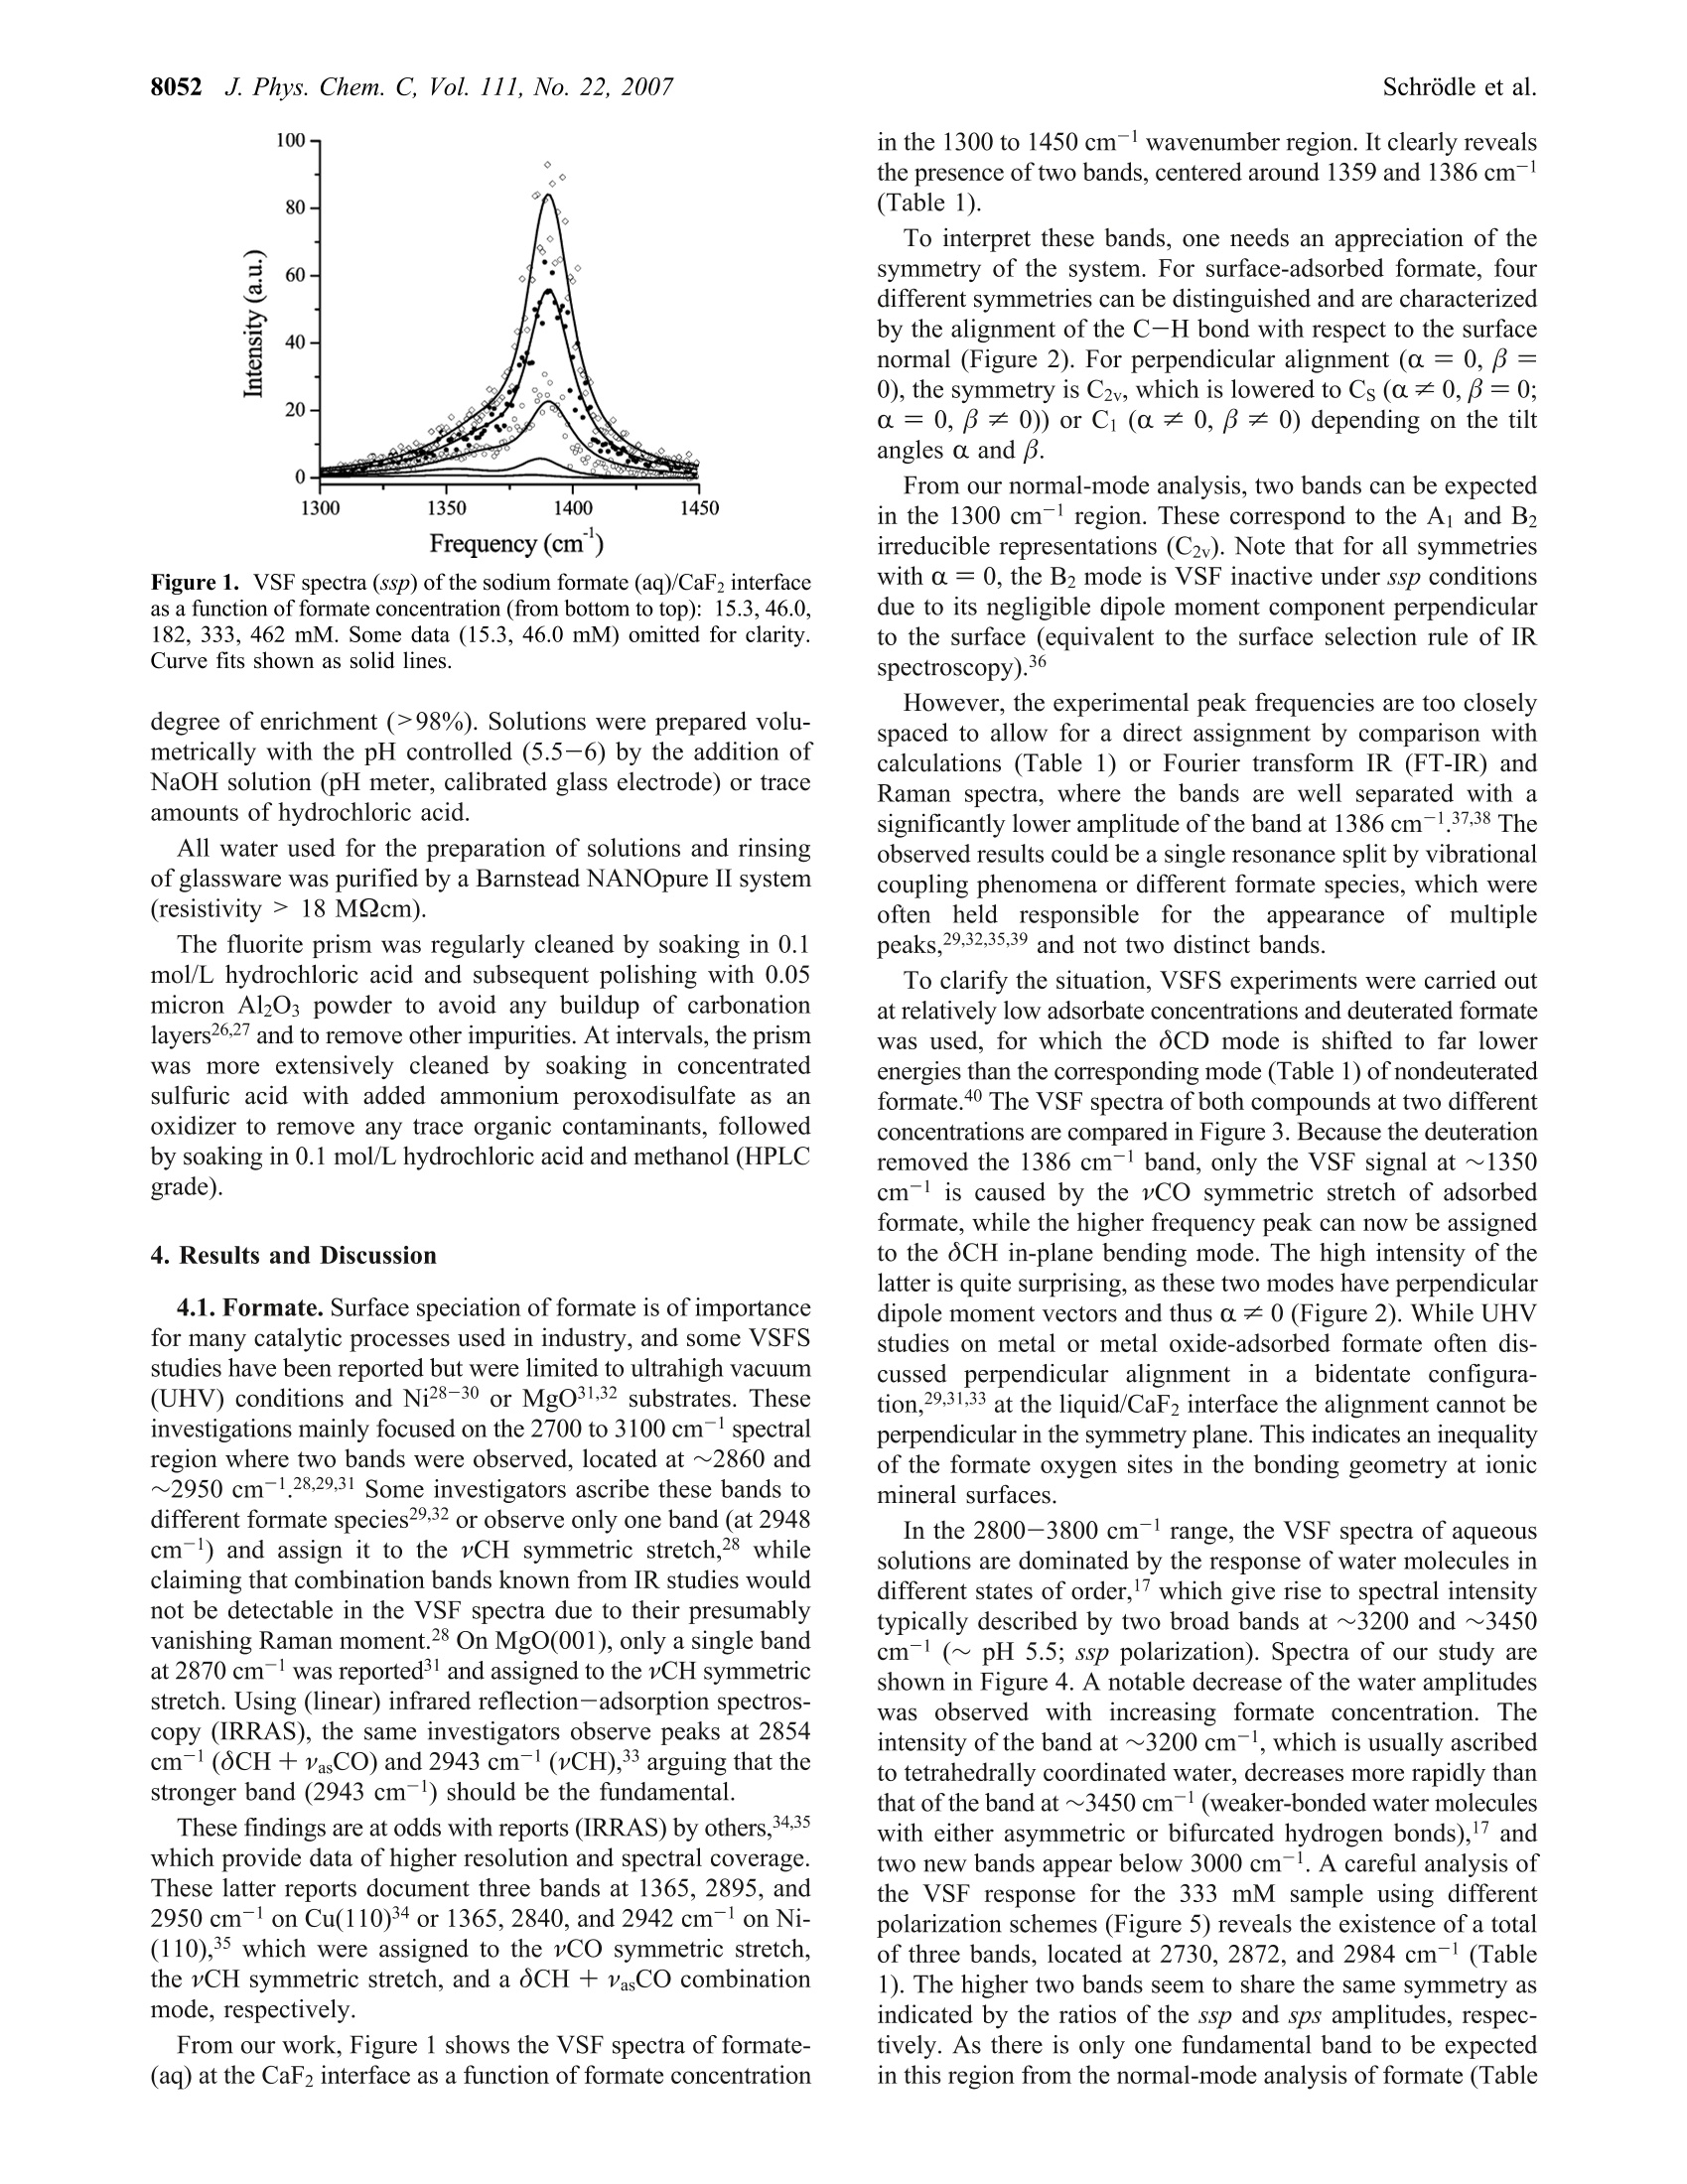
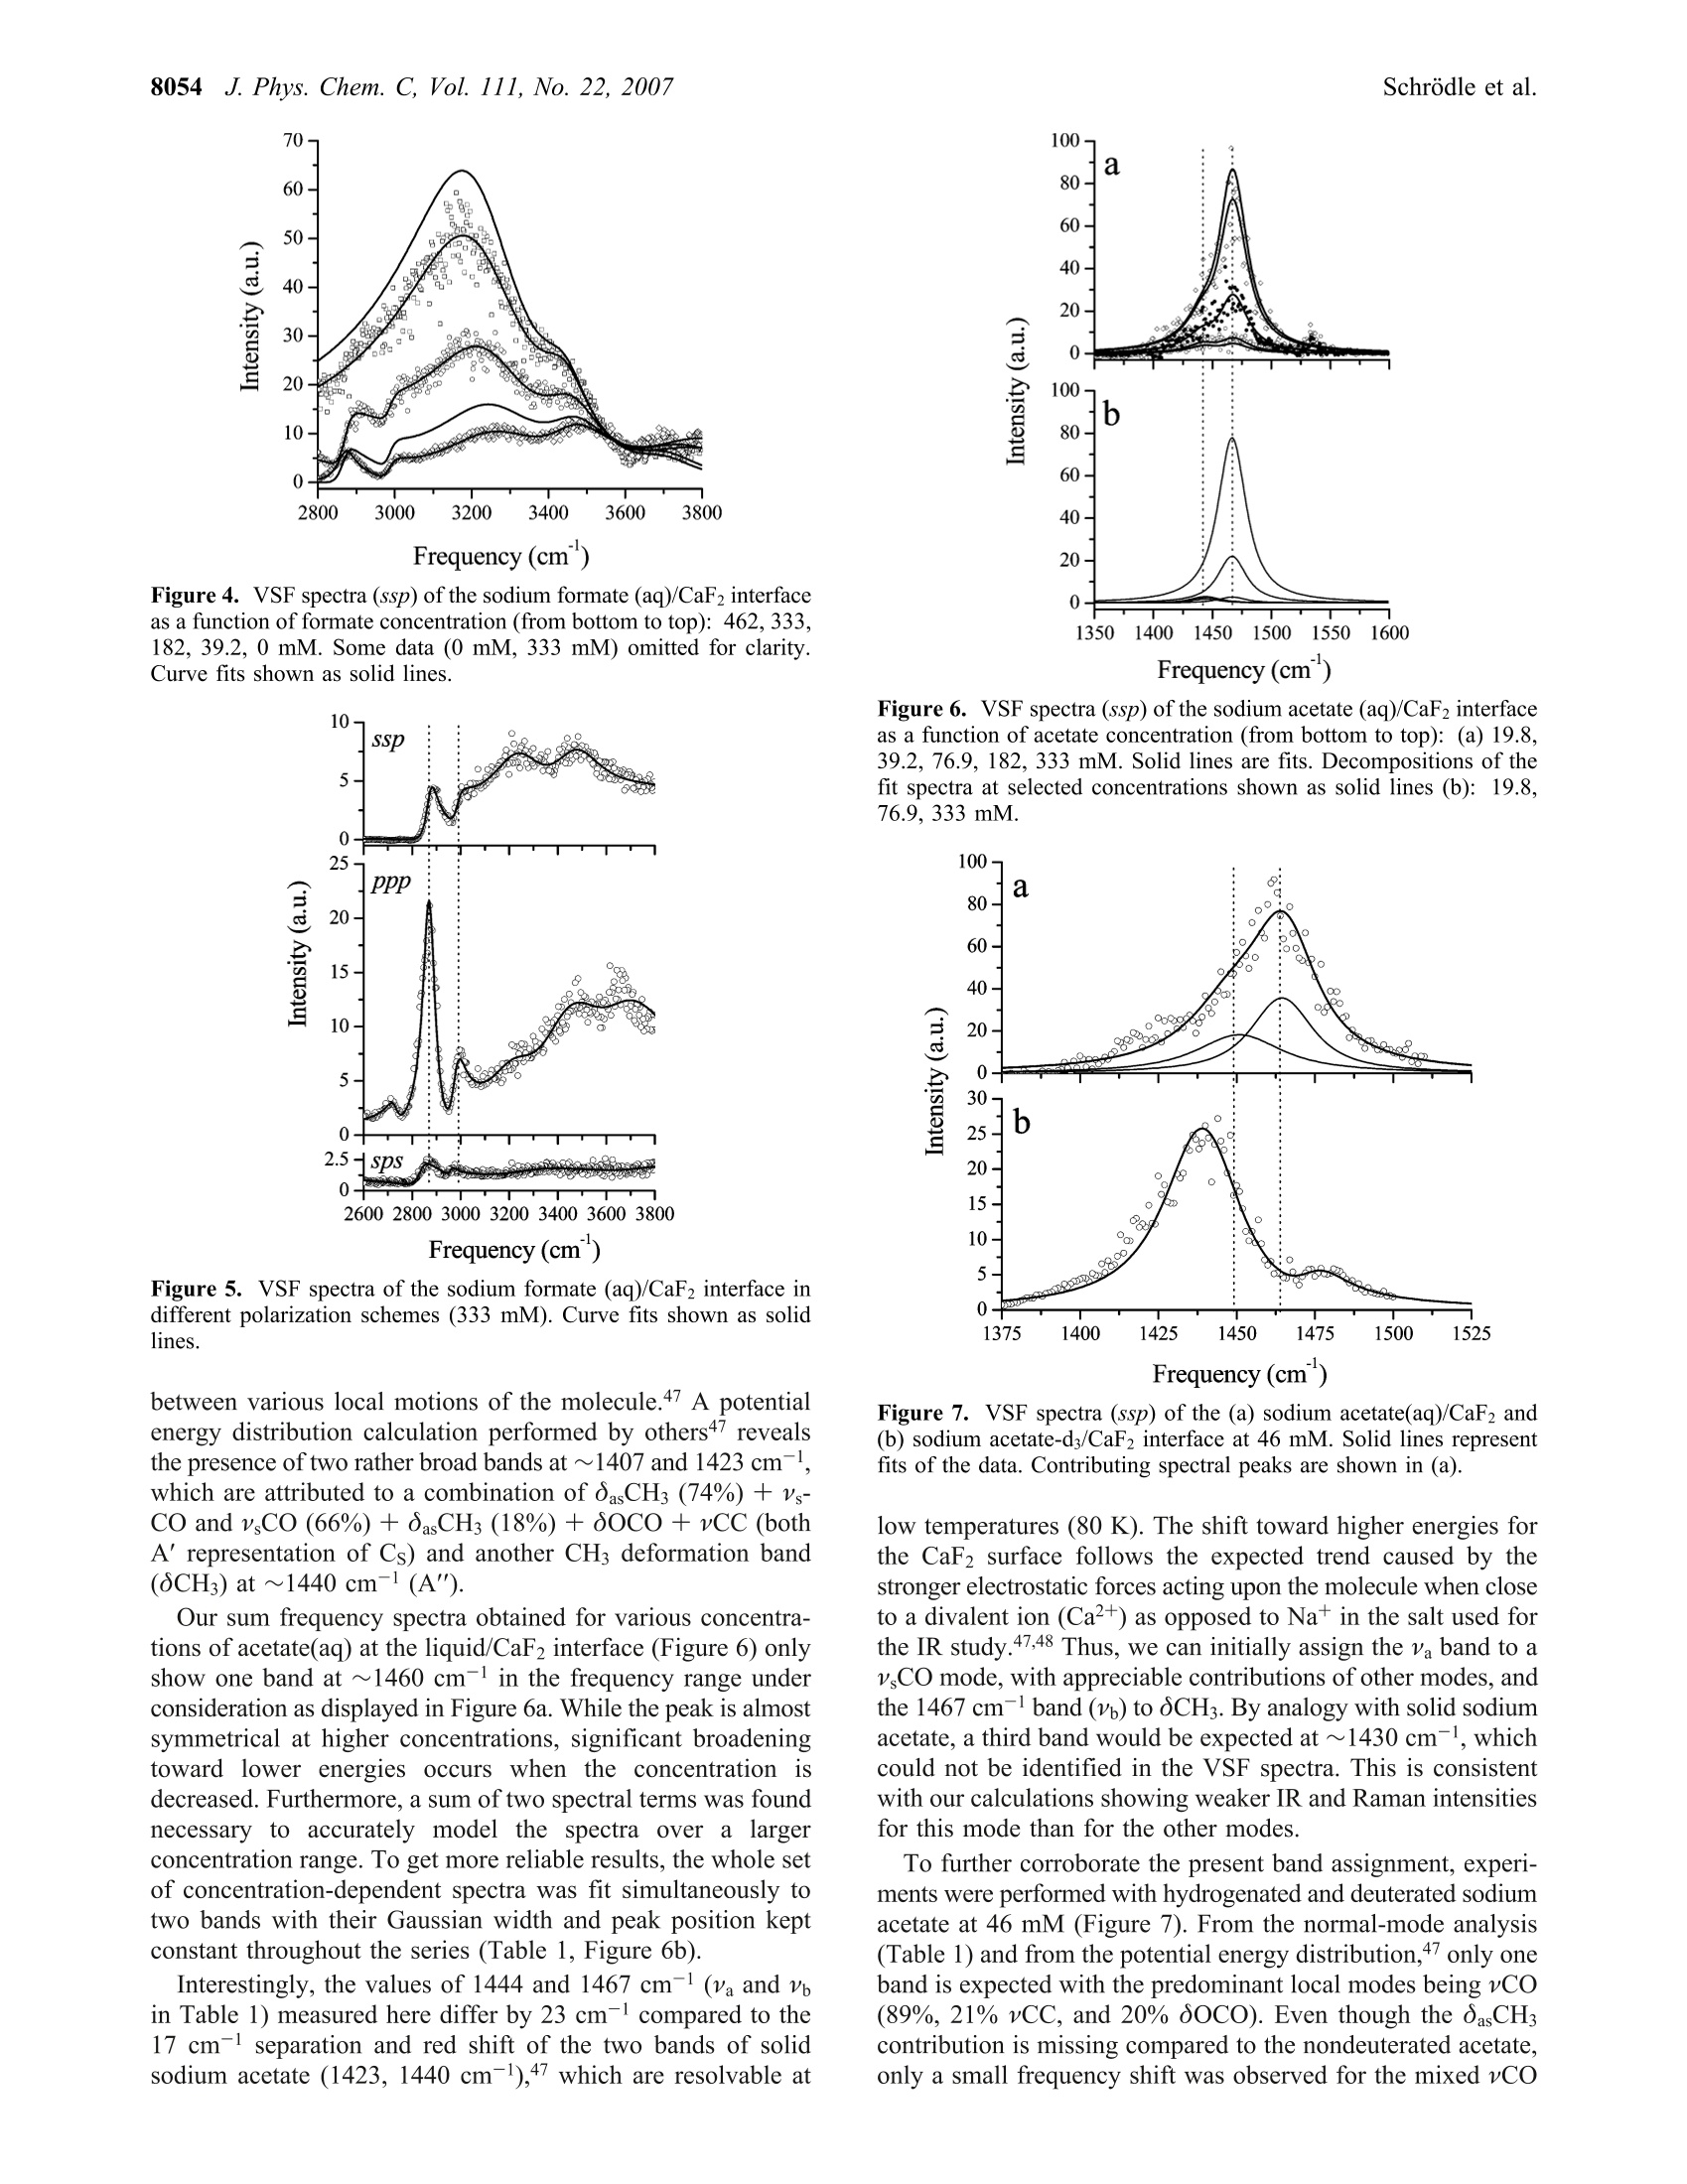
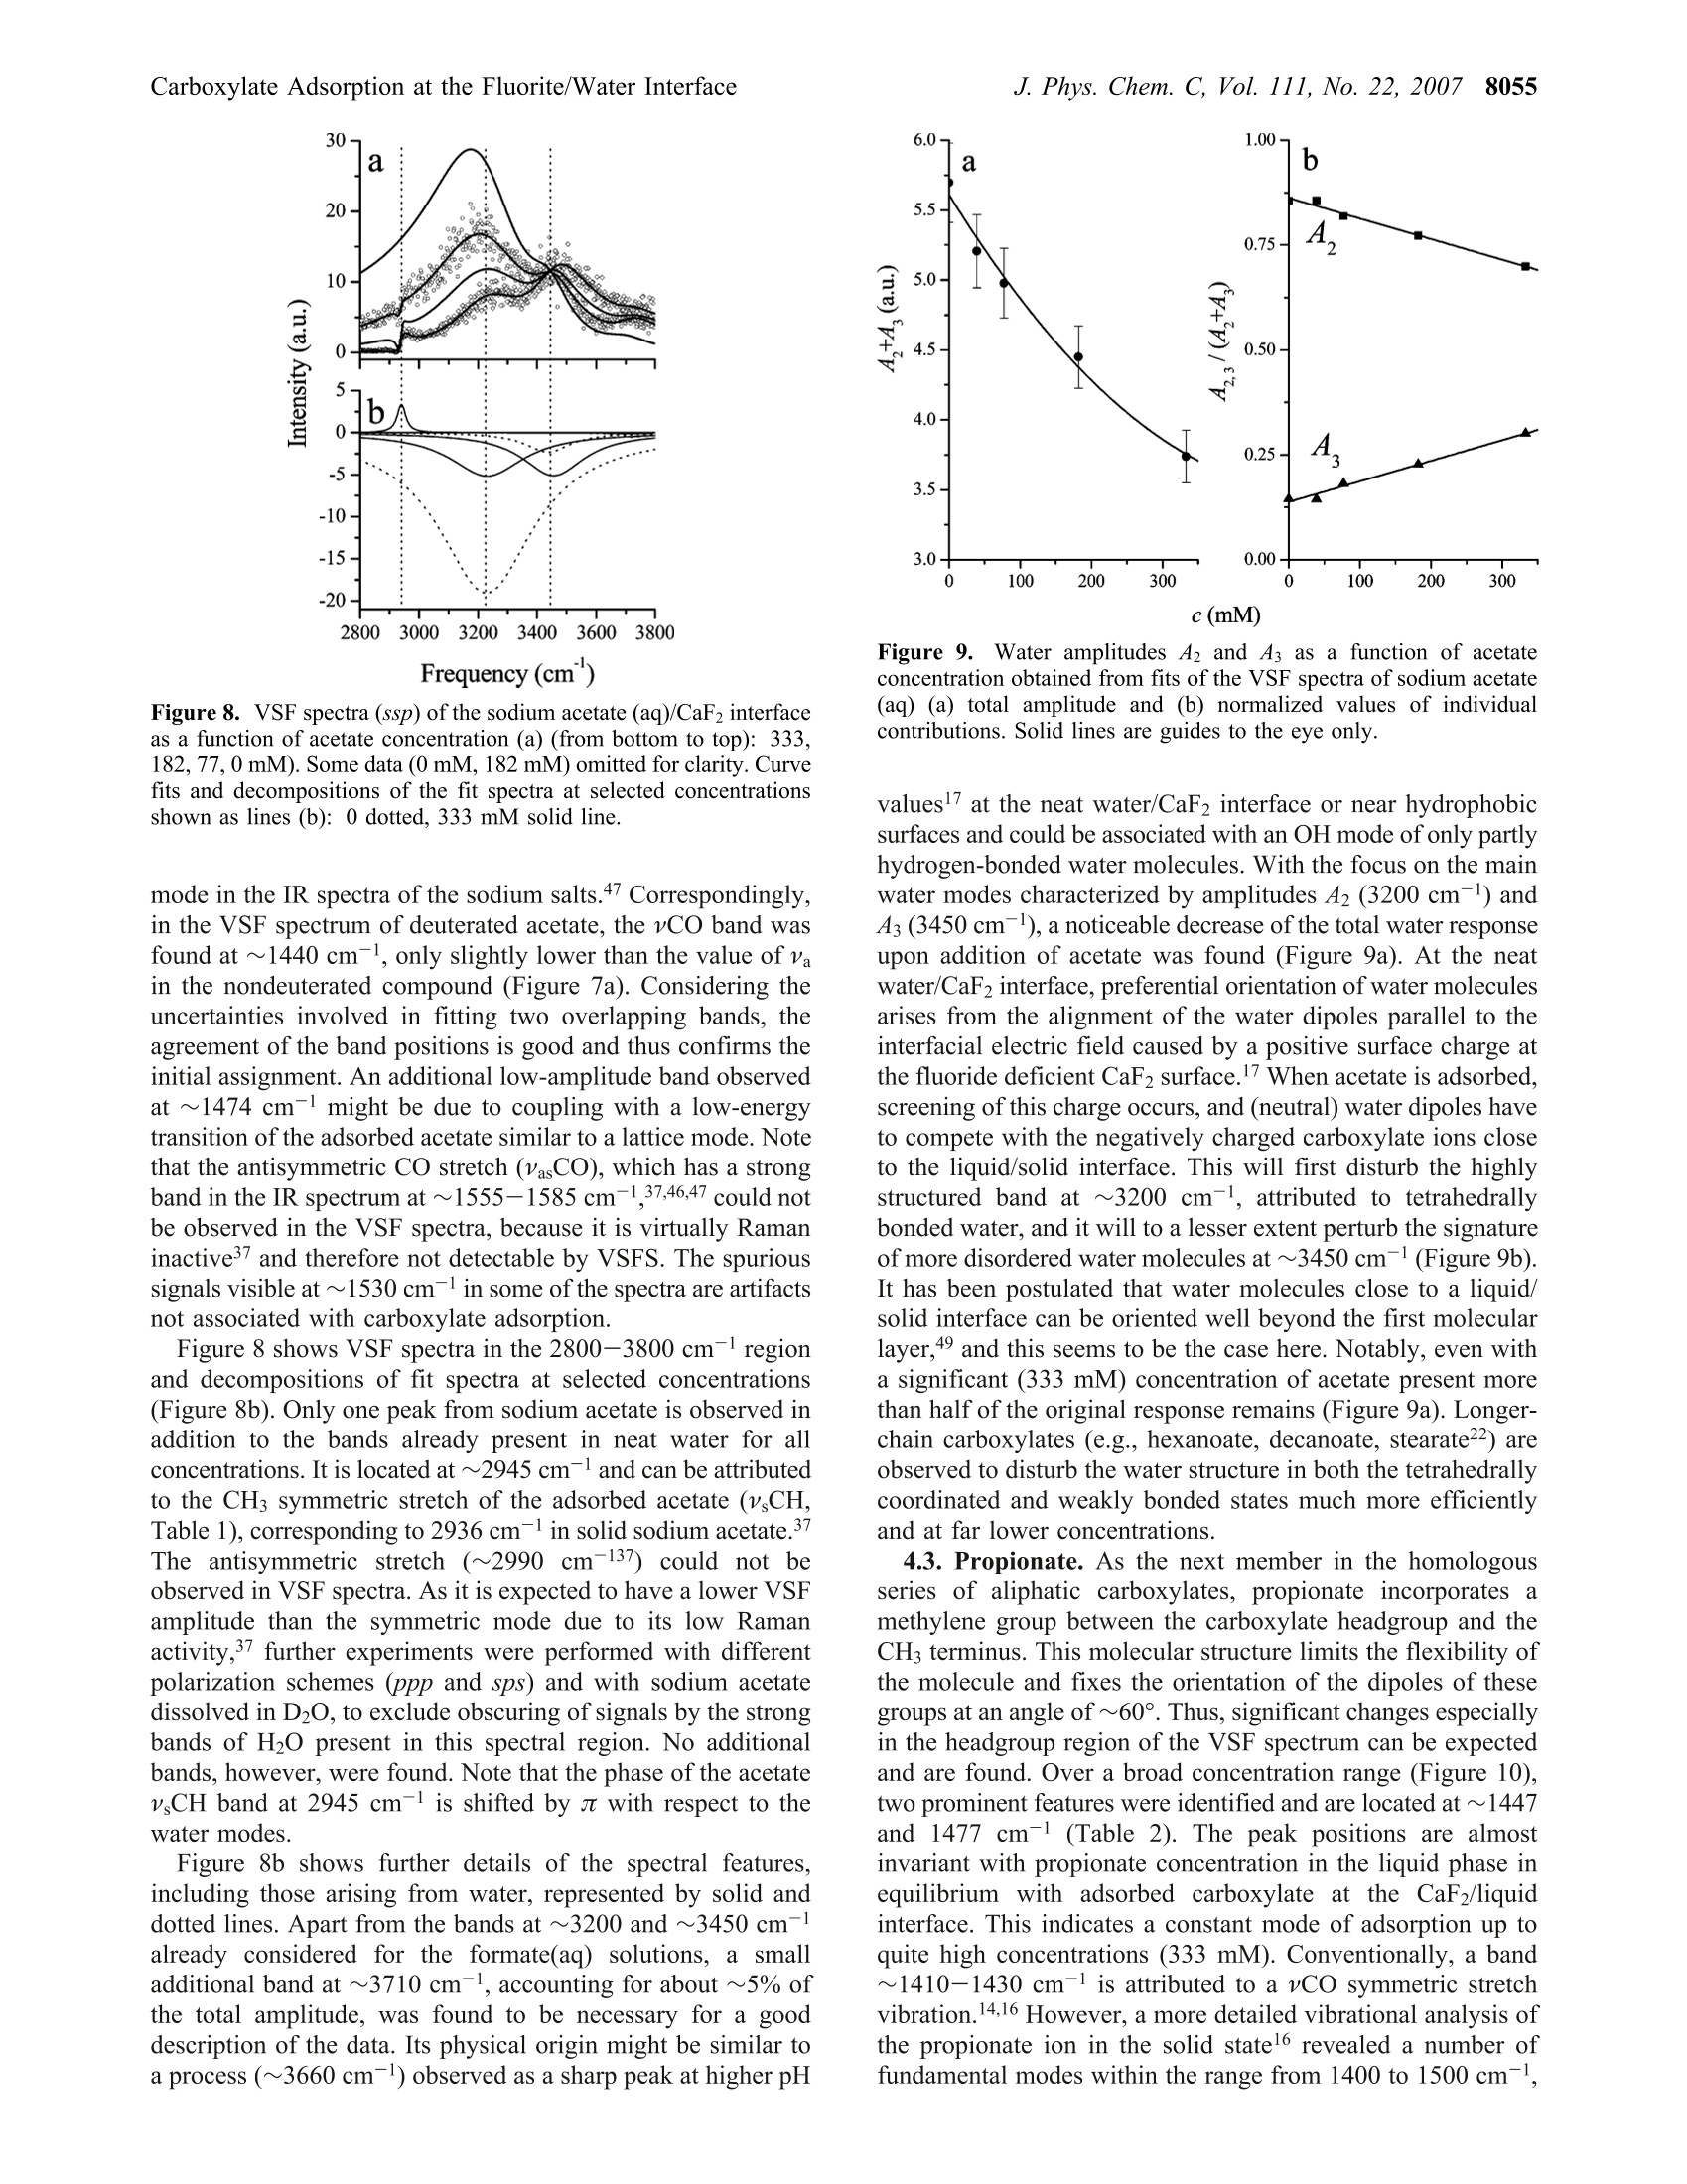
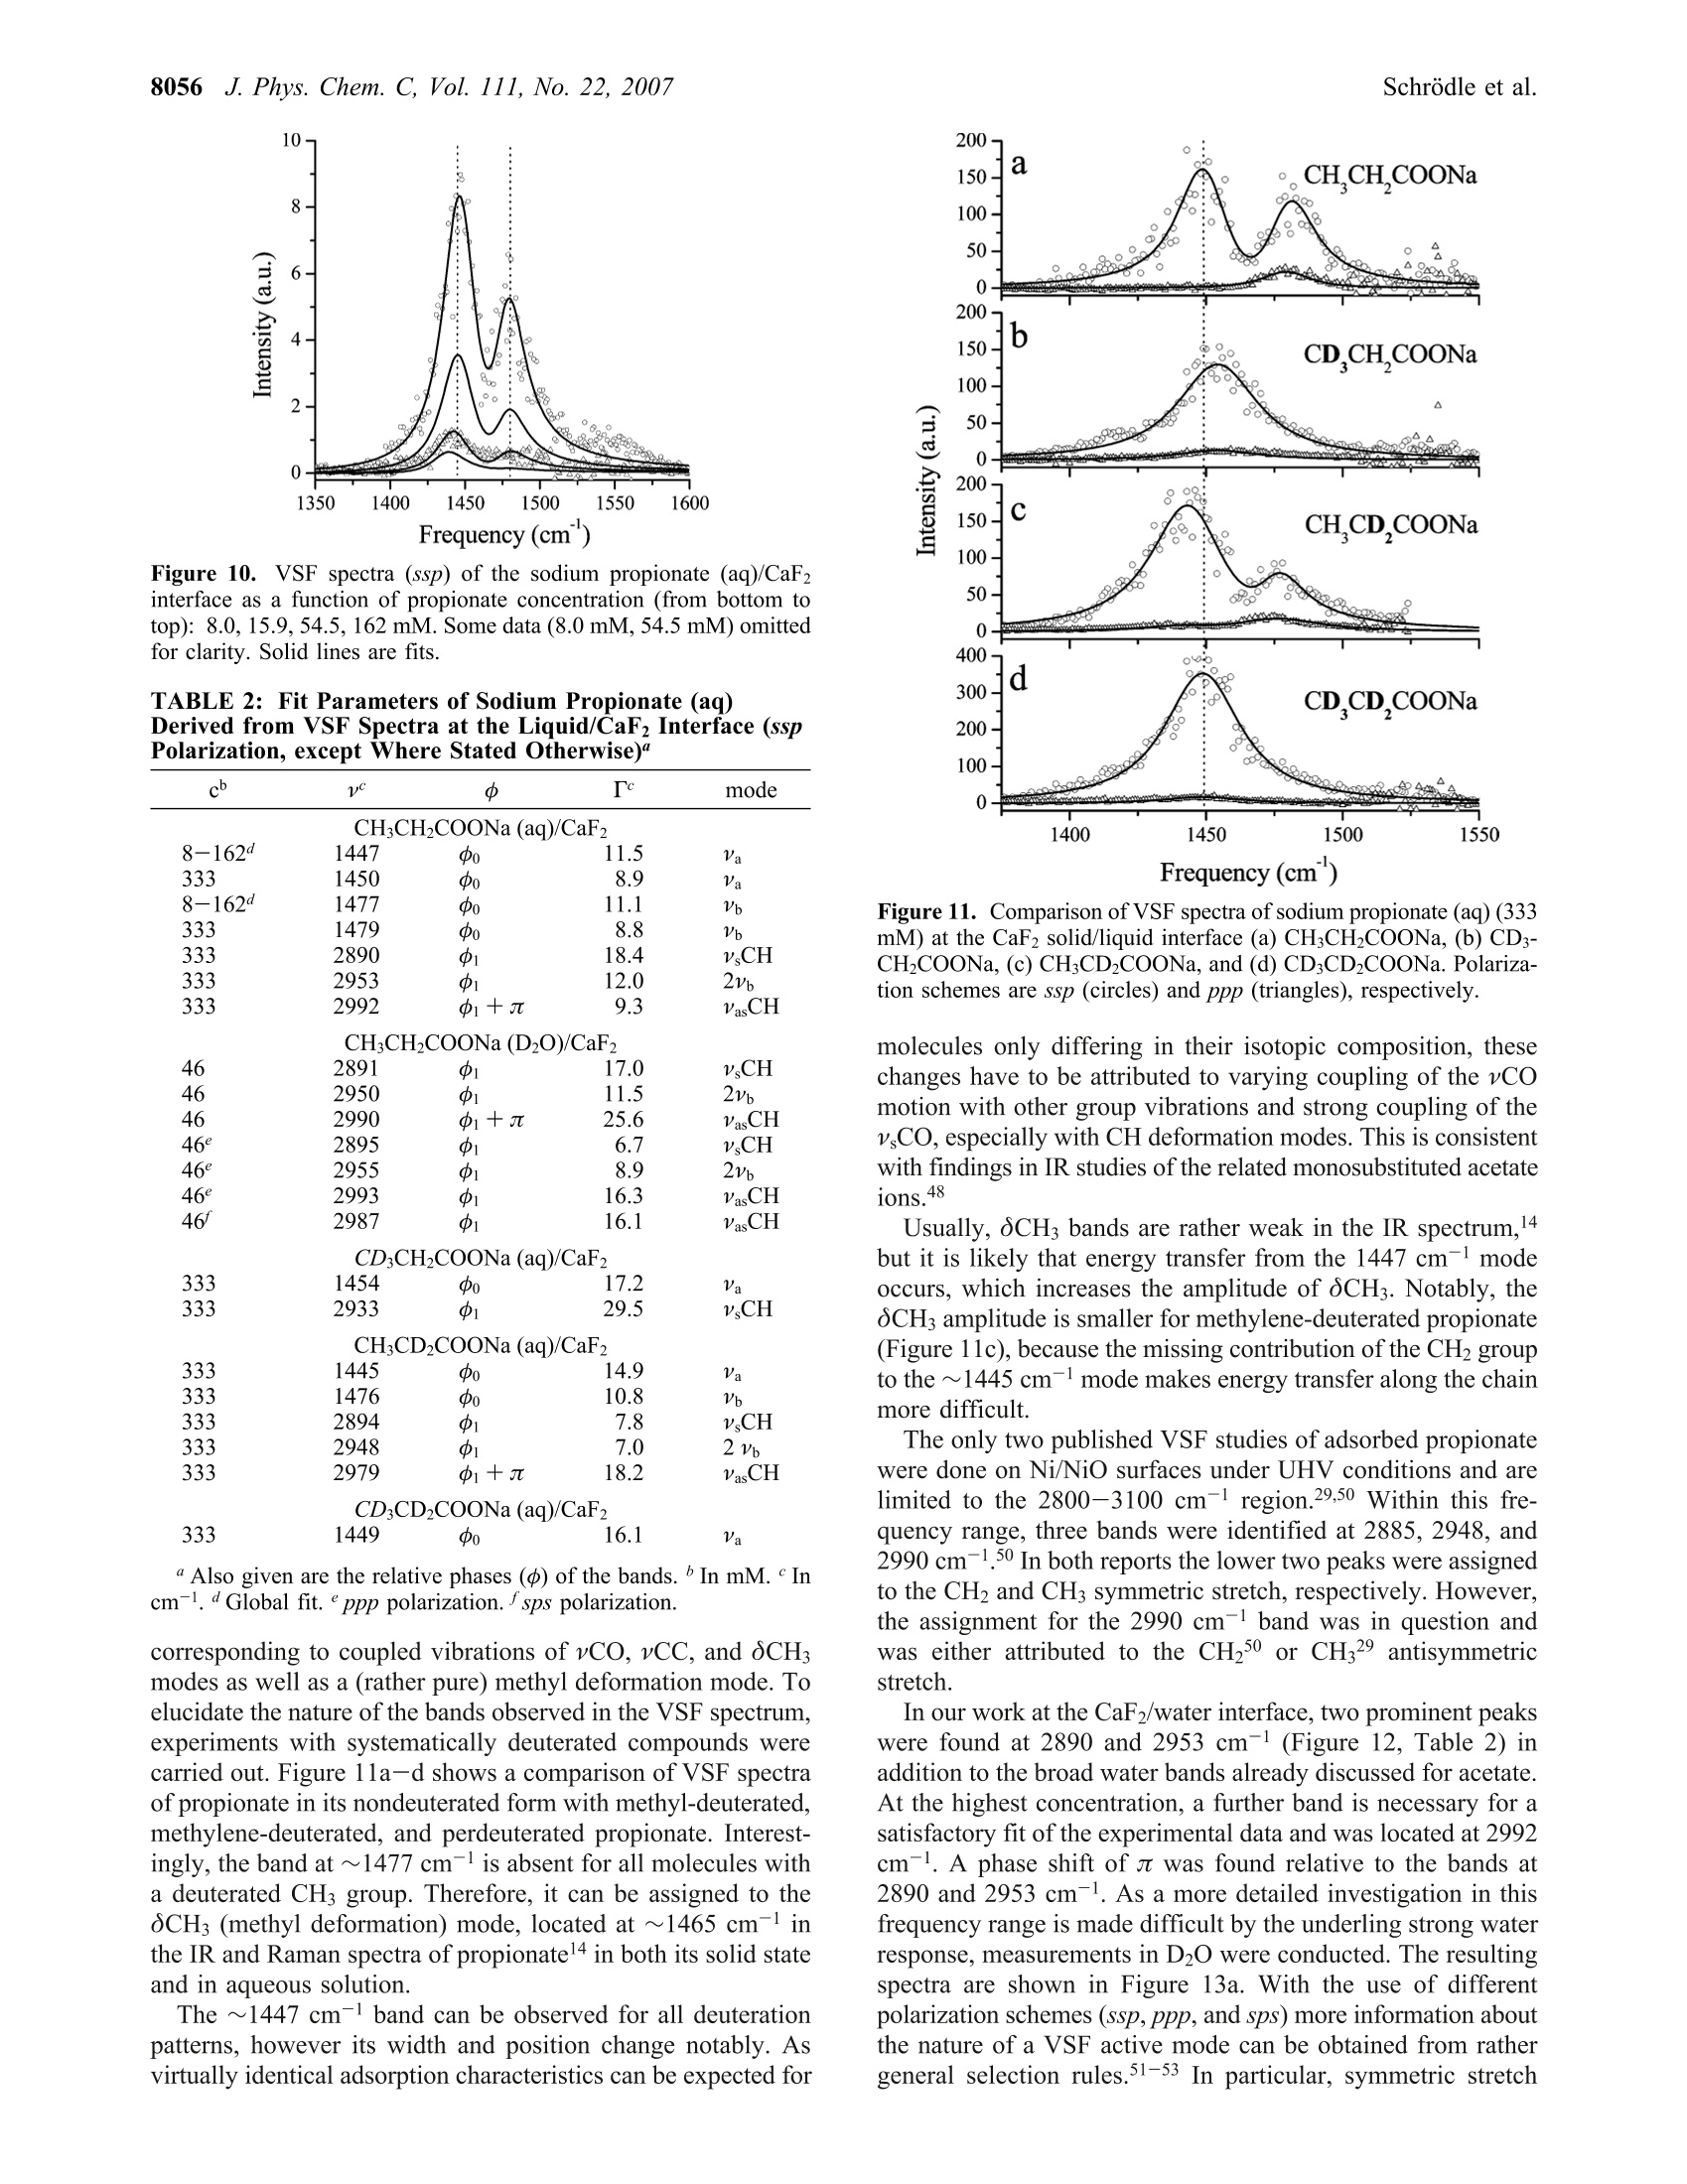
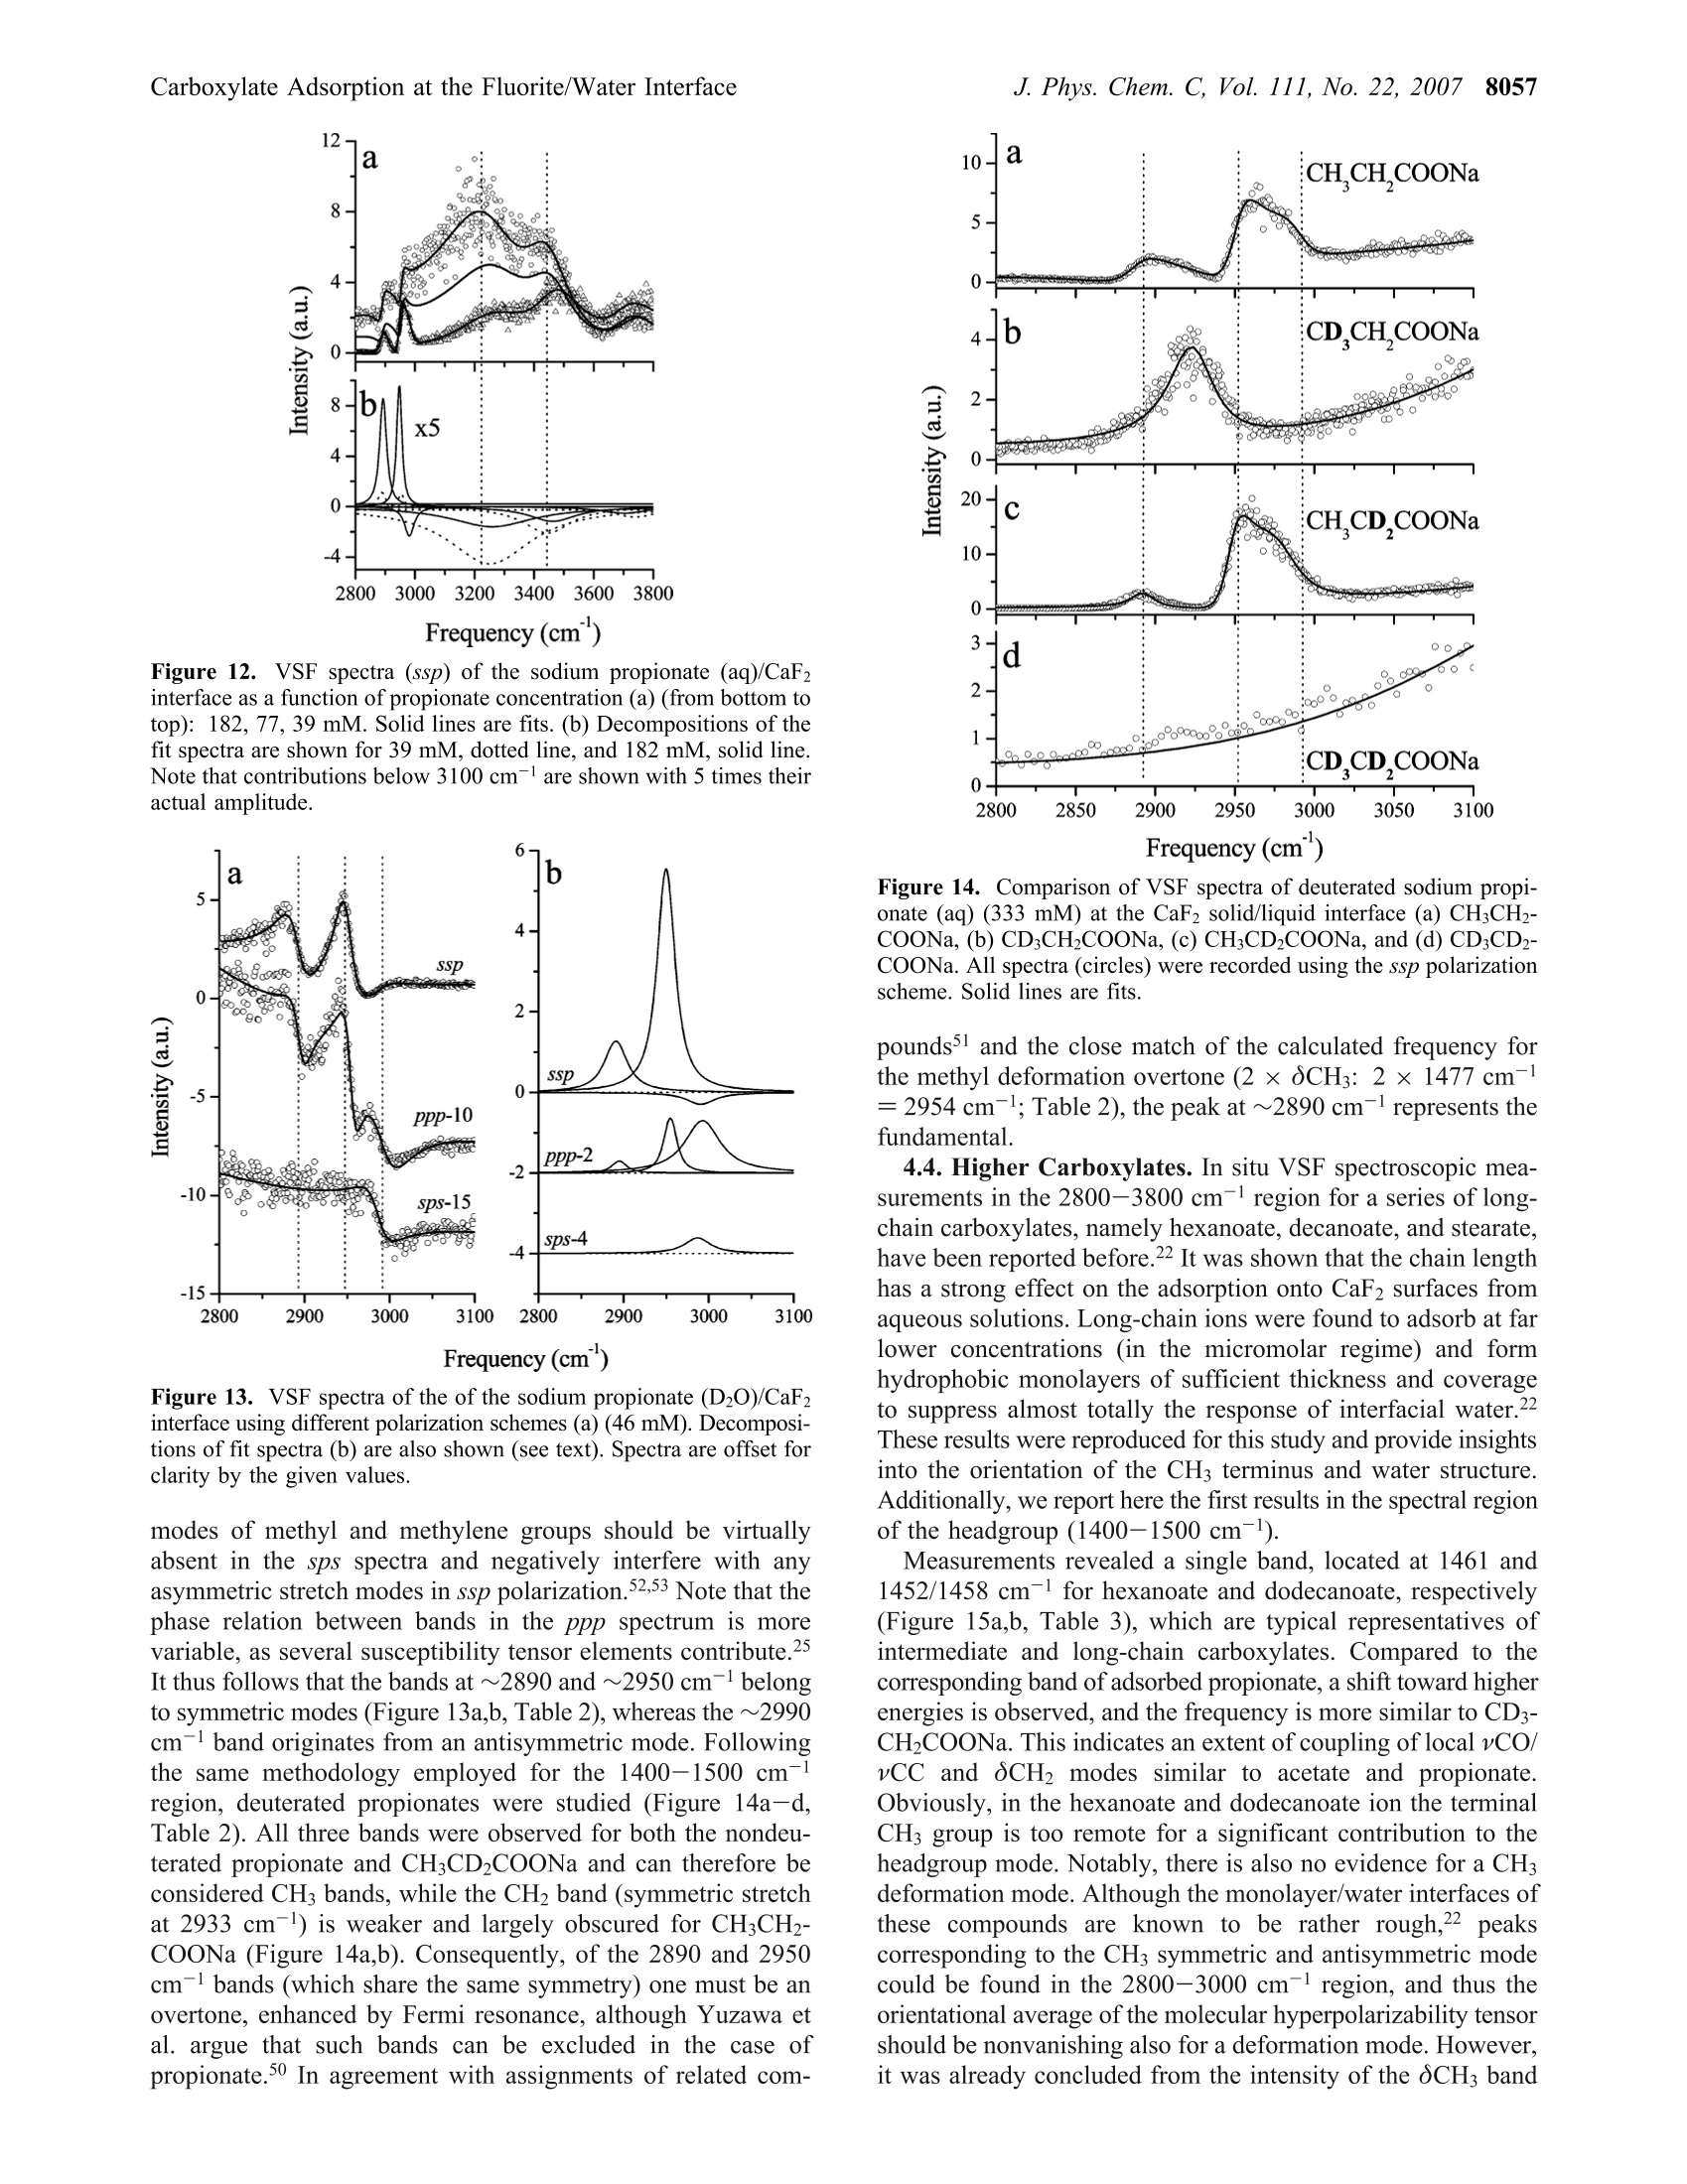
8050J. Phys. Chem. C 2007,111,8050-8059 J. Phys. Chem. C, Vol. 111, No. 22, 20078051Carboxylate Adsorption at the Fluorite/Water Interface 10.1021/jp071248e CCC: $37.00 C 2007 American Chemical SocietyPublished on Web 05/16/2007 In situ Investigation of Carboxylate Adsorption at the Fluorite/Water Interface by SumFrequency Spectroscopy Simon Schrodle, Fred G. Moore, and Geraldine L.Richmond* Department of Chemistry, University of Oregon, Eugene, Oregon 97403-1253 Received: February 13, 2007; In Final Form: April 5, 2007 This work presents a study of carboxylate adsorption at the fluorite/water interface by vibrational sum frequencyspectroscopy. A homologous series of monocarboxylic ions including formate, acetate, propionate, hexanoate,and dodecanoate was studied in frequency regions corresponding to the vCH and vCO/OCH response. Previouslyreported vibrational and Raman modes were investigated for their sum frequency activity. For a more reliableband assignment, sum frequency measurements on systematically deuterated compounds were completedand compared with calculated band positions and intensities. Different polarization configurations were utilized,together with symmetry properties of bands derived from a normal-mode analysis, to classify the observedfundamentals and overtones. Differences in chain length led to striking changes in the spectral signatures ofthe compounds studied and were related to the molecular structure of the adsorbates and interfacial watermolecules. 1. Introduction Adsorption processes at liquid/solid interfaces play animportant role in geochemical processes and a variety oftechnological applications. l-3 Here, the interaction of mineralsurfaces with low molecular weight carboxylates, which areubiquitous in soils4.5 and large-scale industrial production, isof particular interest. Carboxylate ions can govern dissolutionprocesses, regulate the biological availability of nutrients, andare a determining factor for the environmental transport cycleof various metals, including the bioretention of chromium andother toxic pollutants. In industry, the adsorption of carboxylateions onto particles is a common mechanism for growth inhibitionand impurity inclusion during product crystallization (e.g., inthe Bayer process, a key step in the production of aluminum).Carboxylates have also found a variety of applications fromsurface modifying agents to the size-controlled synthesis ofnanoparticles’ and can act as an intermediate layer for theinteraction of surfaces with other organic materials, which iscrucial for promising innovations like dye-sensitized solar cells. Naturally, carboxylate interactions with solid substrates havebeen studied by a variety of techniques with IR and Ramanspectroscopy being most common for in situ investigations.While such studies are certainly useful and can reveal a fairamount ofdetail, they are not surface specific on a molecularscale. Even specialized methods (Fourier transform infrared-internal reflection spectroscopy, diffuse reflectance Fouriertransform spectroscopy) are usually limited to substrates withrather high surface areas such as finely divided powders,suspensions, or colloids10-12 and often require a difficult spectralseparation of the adsorbate contributions from bulk backgroundsignals. More recently, vibrational sum frequency spectroscopy(VSFS) has been employed to develop a molecular picture ofadsorption processes at the solid/liquid interface. On the basisof an inherently surface specific nonlinear optical process, the ( * Author to whom c o rrespondence sh o uld be addressed. E- m ail: richmond@uoregon.edu. F ax:5 4 1-346-5859. ) coherent nature of the sum frequency generation can reveal moredetailed information compared to linear techniques, especiallywhen coupled with polarization-resolved measurements. Untilnow, most studies were limited to the frequency regions of vCHand vOH bands, as suitable laser sources were more readilyavailable in the corresponding wavelength region (2800-4000cm-). For carboxylates, the relevant bands (vC-O,vC=0)are located at larger wavelengths, typically on the order of1300-1700 cm-l, and technological advances only recentlyopened up this spectral region for VSFS studies.3 In IR and Raman investigations of carboxylates, both insolutions and adsorbed on substrates, the signature of thecarboxylate group is often obscured by other bands, namely,C-H bending modes.14 Furthermore, efforts at performingsimplified group moment analysis of the experimentally resolvedbands, along with the presence of overtones and the often low-resolution spectra have caused considerable disagreement andambiguity in mode assignments.15,16 With the additional infor-mation revealed by VSFS, combined with an ab inito calculationapproach and the investigation of systematically deuteratedcompounds, we can resolve many of these problems. The solid/liquid interface selected for this study, the fluorite-(CaF2)/water interface, serves as a model system for a varietyof ionic crystalline solids. Fluorite is characterized by a positivesurface charge in many natural environments, especially atslightly acidic pH.17The sum frequency response of the neatfluorite/water interface has already been investigated, and theseresults, together with the favorable optical properties of CaF2(transparent from ~120 to 7800 nm), facilitate the experimentand the interpretation of VSFS data in related systems. The investigation of the principal spectral features of car-boxylate head groups and the clarification of peak assignmentsare prerequisite for any orientational analysis and also arerelevant for adsorption studies with other molecules of interest(e.g., amino acids and similar biological molecules). Addition-ally, the frequency coverage of this study, which includes thewater region of the VSF spectrum, provides a more detailedpicture of the adsorption processes and the water structure near the adsorbates, which is of fundamental importance for furtherVSFS studies in this field. 2. Background 2.1. VSFS. VSFS is a technique particularly suited for thestudy of interfaces. It exploits the symmetry breaking at theboundary of two isotropic media, which gives rise to a nonlinearsusceptibility x(2). As these effects have been extensively treatedin the literature,18,19 only an overview of the essential conceptsis given here. For the experiment, two short laser pulses, one with fixedfrequency ωvis in the visible and the other tunable in the IRrange (wIR), are spatially and temporally overlapped at theinterface. The local fields E(ωIR) and E(@vis) are then coupledby x(2) (eq 1) and induce a nonlinear polarization at the sumfrequency ωSF= WIR + Wvis Generally, the wavelength of the visible beam is chosen tobe off resonance, thus x(2) only depends on the IR frequency,and measured sum frequency spectra are of the form Here Ivis and Ii denote the intensities of the incident beams,and the L terms are the Fresnel factors. Note that for a smallfrequency band, the Fresnel factors can be considered constant. Phenomenologically,x(2) is treated as a coherent superpositionof a nonresonant part xn and resonant components of thesusceptibility, x (eq3). While x is assumed to be real for the CaF2/water interfacelike for most common dielectric surfaces,20 x is complex andrelated to the orientationally averaged hyperpolarizabilities<(2)> of the interfacial molecules. From<(2)>, the averageorientation of adsorbates can be derived, when the molecularhyperpolarizabilities are known in the molecular frame.2 Given that the interface layer is isotropic (i.e., it has Cooysymmetry), only 7 of the 27 tensor elements of z(2) are nonzeroand of these only 4 are unique. With the lab coordinates chosenso that z lies along the interface normal and the xz-plane is theplane of incidence, they are=x2=x=and x. In addition, for wvis far from resonance,x=x,=x=. These four elements can be probed using combina-tions of incident and outgoing linearly polarized light, namely:ssp, sps (or pss), and ppp, where the letters represent lightpolarized parallel to the plane of incidence (p) or perpendicularto the plane of incidence (s). All polarization notations are givenin the order sum frequency, visible, IR. 2.2. Fitting Procedures. VSF spectra, normalized by theintensities of the incident beams and the nonresonant responseof a highly polished gold surface (to account for variations inpulse duration and beam overlap), were deconvoluted by amethod developed earlier in our laboratory.2? The line shape ofthe ith resonance was modeled by an expression x= that accounts for homogeneous line broadening IL (Lorentzianwidth, fixed at 5 cm-) and inhomogeneous broadening, Ii(Gaussian width). The Gaussian width combines the effect ofthe multitude of environments experienced by the adsorbate andthe IR beam bandwidth, while the Lorentzian profile describesthe inherent line width of the transition. For overlapping bands, the phase relationship of the responses,Yi has to be considered. For all bands observed here, phases ofeither 0 or j were used, as variable phases -Yv jt didnot significantly improve the quality of the fits. The effective sum frequency transition strength of a band A;depends on the product of the number of adsorbed molecules,the orientational average of the electric transition dipole moment,and the Raman polarizability of the underlaying mode. Modesare therefore only sum frequency active if they are both Ramanand IR active. Additionally, the adsorbed molecules must showa net orientation with respect to the interface. 2.3. Electronic Structure Calculations. All electronicstructure modeling and normal-mode analysis have been per-formed using the Gaussian03 program3 with the 6-311+g(d,p)basis set used throughout. For every carboxylate ion studied, ageometry optimization was performed followed by a normal-mode analysis and frequency calculation using the RHF andRB3LYP methods. Systematic errors in calculated frequencieswere accounted for by scale factors. Values of 0.893 and 0.961were chosen for the RHF and RB3LYP calculations,24 respec-tively. 3. Experimental Methods 3.1. Vibrational Sum Frequency Spectrometer. The ex-perimental instrumentation is based on a commercially availableVSF spectrometer (Ekspla, Vilnius, Lithuania). The visible (532nm) and IR (1000-4300 cm-l, bandwidth <6 cm-l) beams(30 ps pulse duration, 10 Hz repetition rate) reach the solid/liquid interface in a copropagating configuration. A CaF2 prism(68°) was used and the beam geometry adjusted to near-criticalincidence (17°IR, 20.5°vis). It has been noted before that thistotal internal reflection geometry greatly enhances the sumfrequency (SF) signal.25 For detection, residual vis and IR energywas blocked by a high-efficiency notch filter, and the SF signalwas detected by a photomultiplier tube (PMT) attached to amonochromator. Prior to each measurement, the prism surface was equilibratedwith the sample until a stable sum-frequency response wasreached, except for experiments at partial coverage. Spectra were usually recorded at 1 cm- resolution in the1400/2800-3000 cm- region and at 4 cm- for higherwavenumbers. The actual intensities of the IR and vis beams(typically 300 and 100 uJ, respectively) were recorded duringacquisition, and raw data were normalized for the fluctuationsin beam power as well as the dark current of the PMT. Theresulting spectra were calibrated against the nonresonant SFresponse of a thin gold layer measured under similar conditionsto correct for frequency dependent variations of the SF genera-tion efficiency. The alignment of the spectrometer was fre-quently checked against neat water. Around 1410 and 1525 cm-, a small resonant backgroundwas observed, which did not seem to arise from the solid/liquidinterface but rather from the prism sides exposed to air.Carboxylate spectra were thus corrected for any water back-ground signal. 3.2. Materials. All salts used were at least of analytical purityand obtained from commercial sources. The deuterated materialswere purchased from CDN Isotopes (Quebec, Canada) orCambridge Isotope Laboratories (Andover, MA) and had a high 8052 J. Phys. Chem. C, Vol. 111, No. 22, 2007 Figure 1. VSF spectra (ssp) of the sodium formate (aq)/CaF2 interfaceas a function of formate concentration (from bottom to top): 15.3,46.0,182, 333, 462 mM. Some data (15.3, 46.0 mM) omitted for clarity.Curve fits shown as solid lines. degree of enrichment (>98%). Solutions were prepared volu-metrically with the pH controlled (5.5-6) by the addition ofNaOH solution (pH meter, calibrated glass electrode) or traceamounts of hydrochloric acid. All water used for the preparation of solutions and rinsingof glassware was purified by a Barnstead NANOpure II system(resistivity > 18 M9cm). The fluorite prism was regularly cleaned by soaking in 0.1mol/L hydrochloric acid and subsequent polishing with 0.05micron Al2O3 powder to avoid any buildup of carbonationlayers26,27 and to remove other impurities. At intervals, the prismwas more extensively cleaned by soaking in concentratedsulfuric acid with added ammonium peroxodisulfate as anoxidizer to remove any trace organic contaminants, followedby soaking in 0.1 mol/L hydrochloric acid and methanol (HPLCgrade). 4. Results and Discussion 4.1. Formate. Surface speciation of formate is of importancefor many catalytic processes used in industry, and some VSFSstudies have been reported but were limited to ultrahigh vacuum(UHV) conditions and Ni28-30 or MgO31,32 substrates. Theseinvestigations mainly focused on the 2700 to 3100 cmspectralregion where two bands were observed, located at ~2860 and~2950 cm-1.28,29,31 Some investigators ascribe these bands todifferent formate species29,32 or observe only one band (at 2948cm-l) and assign it to the vCH symmetric stretch,28 whileclaiming that combination bands known from IR studies wouldnot be detectable in the VSF spectra due to their presumablyvanishing Raman moment.28 On MgO(001), only a single bandat 2870 cm- was reported3l and assigned to the vCH symmetricstretch. Using (linear) infrared reflection-adsorption spectros-copy (IRRAS), the same investigators observe peaks at 2854cm-(CH+VasCO) and 2943 cm- (vCH),33 arguing that thestronger band (2943 cm-) should be the fundamental. These findings are at odds with reports (IRRAS) by others,34.35which provide data of higher resolution and spectral coverage.These latter reports document three bands at 1365, 2895, and2950 cm-l on Cu(110)34 or 1365, 2840, and 2942 cm-on Ni-(110),35 which were assigned to the vCO symmetric stretch,the vCH symmetric stretch, and a oCH + VasCO combinationmode,respectively. From our work, Figure 1 shows the VSF spectra of formate-(aq) at the CaF2 interface as a function of formate concentration in the 1300 to 1450 cm-l wavenumber region. It clearly revealsthe presence of two bands, centered around 1359 and 1386 cm(Table 1). To interpret these bands, one needs an appreciation of thesymmetry of the system. For surface-adsorbed formate, fourdifferent symmetries can be distinguished and are characterizedby the alignment of the C-H bond with respect to the surfacenormal (Figure 2). For perpendicular alignment (a =0, =0), the symmetry is C2v, which is lowered to Cs (a=0, β=0;a=0,β=0)) or Ci (a0, =0) depending on the tiltangles a and β. From our normal-mode analysis, two bands can be expectedin the 1300 cm- region. These correspond to the A and B2irreducible representations (C2v). Note that for all symmetrieswith a=0, the B2 mode is VSF inactive under ssp conditionsdue to its negligible dipole moment component perpendicularto the surface (equivalent to the surface selection rule of IRspectroscopy).36 However, the experimental peak frequencies are too closelyspaced to allow for a direct assignment by comparison withcalculations (Table 1) or Fourier transform IR (FT-IR) andRaman spectra, where the bands are well separated with asignificantly lower amplitude of the band at 1386 cm-137,38 Theobserved results could be a single resonance split by vibrationalcoupling phenomena or different formate species, which wereoften held responsible for thaeppearance of multiplepeaks,29,32,35,39 and not two distinct bands. To clarify the situation, VSFS experiments were carried outat relatively low adsorbate concentrations and deuterated formatewas used, for which the OCD mode is shifted to far lowerenergies than the corresponding mode (Table 1) of nondeuteratedformate.40 The VSF spectra of both compounds at two differentconcentrations are compared in Figure 3. Because the deuterationremoved the 1386 cm-band, only the VSF signal at ~1350cm- is caused by the vCO symmetric stretch of adsorbedformate, while the higher frequency peak can now be assignedto the OCH in-plane bending mode. The high intensity of thelatter is quite surprising, as these two modes have perpendiculardipole moment vectors and thus a0 (Figure 2). While UHVstudies on metal or metal oxide-adsorbed formate often dis-cussed perpendicular alignment in a bidentate configura-tion,29,31,33 at the liquid/CaF2 interface the alignment cannot beperpendicular in the symmetry plane. This indicates an inequalityof the formate oxygen sites in the bonding geometry at ionicmineral surfaces. In the 2800-3800 cm- range, the VSF spectra of aqueoussolutions are dominated by the response of water molecules indifferent states of order,which give rise to spectral intensitytypically described by two broad bands at ~3200 and ~3450cm(~ pH 5.5; ssp polarization). Spectra of our study areshown in Figure 4. A notable decrease of the water amplitudeswas observed with increasing formate concentration. Theintensity of the band at~3200 cm, which is usually ascribedto tetrahedrally coordinated water, decreases more rapidly thanthat of the band at ~3450 cm-(weaker-bonded water moleculeswith either asymmetric or bifurcated hydrogen bonds), andtwo new bands appear below 3000 cm. A careful analysis ofthe VSF response for the 333 mM sample using differentpolarization schemes (Figure 5) reveals the existence of a totalof three bands, located at 2730, 2872, and 2984 cm-(Table1). The higher two bands seem to share the same symmetry asindicated by the ratios of the ssp and sps amplitudes, respec-tively. As there is only one fundamental band to be expectedin this region from the normal-mode analysis of formate (Table TABLE 1: Fit Parameters of Sodium Formate and Sodium Acetate (aq) Derived from VSF Spectra at the Liquid/CaF2Interface (ssp Polarization)" experimental calculated c v Ic mode v cd IR RAJ v268 IR2° RA2 HCOONa (aq)/CaF2 15.3 1358 do 19.1 vCo 1323 204 14 1285 149 32 46.0 1359 do 19.8 v,Co 15.4 1385 Co 8.6 0CH 1353 45.7 5.7 1321 11.6 5.6 46.0 1387 Co 7.4 CH 333 2730 di 27.2 2 v,CO 333 2872 0i 32.7 vCH 2498 534 280 2468 611 400 333 2984 中i 31.5 OCH + vasCO DCOONa (aq)/CaF2 SCD 995 6.8 3.2 969 1.8 2.9 15.3 1352 do 12.9 v CO 1308 152 11 1273 111 22 46.0 1351 do 7.9 vsCO 19.8-333 1444 do CH;COONa (aq)/CaF2 19.2 Va 1358 385 24.4 1293 337 86.5 46 1451 do 20.3 Va 19.8-333" 1467 o 12.4 vb(oCH3) 1412 22.1 7.1 1407 22.3 8.4 46 1464 Co 10.2 Vb (OCH3) 182 2939 di 12.2 v CH 2801 43.6 145 2880 48.6 138 333 2950 中i 12.2 vsCH 46 2949 中i CHCOONa (D2O)/CaF2 12.9 v,CH 46 1440 中o 12.9 vsCO CDCOONa (aq)/CaF2 1347 421 21.9 1291 330 76.9 46 1474 0o 8.1 v,CO + 34 aAlso listed are calculated frequencies, together with estimated IR and Raman activities (IR and RA, respectively),along with relative phases(d) of the bands.In mM. In cm-. RHF method. e In km mole-./In A4 u-.g RB3LYP method. h Global fit. Figure 2. Tilting of the formate ion relative to the surface normal. 1; vCH at 284041 or 2870 cm-1 37 in solid sodium formate),two of the peaks can be assigned to combination tones, 2 v,CO(2.1359)=2718 cm-1≈ 2730 cm-l) and oCH + VasCO.Another possible overtone oCH + v CO (2745 cm-l) cannotgain intensity from Fermi resonance with the vCH symmetricstretch, because it does not share the same symmetry(Ai) incontrast to OCH + VasCO (B2·B2=Ai), which has a sharedsymmetry with vCH and thus fulfills the requirements for bandenhancement by Fermi resonance. Note that the antisymmetricvasCO stretch itself is not Raman active3 and could not bedetected in the VSF spectrum. Its position, known from IRspectra of formate either adsorbed onto TiO2,38 in solution,38or in the solid state, falls within the range of 1540-1620 cm-l,corresponding to ~2925-3005 cm- for the OCH + VasCOcombination band. Keeping in mind that the separation of thecomponent modes is usually increased by a Fermi resonance,the band found at 2984 cm-l in the VSF spectra can be clearlyattributed to the overtone, while the fundamental (vCH) forformate at the liquid/CaF2 interface is found at 2872 cm-1. Adetailed analysis of formate orientation using the intensity ofthe identified modes under different polarization schemes isbeyond the scope of this paper and will be reported elsewhere. Figure 3. VSF spectra of the sodium formate (aq)/CaF2 interface.Effect of H/D substitution on the vCO and oCH regions (triangles,15.3 mM; circles, 46.0 mM). Curve fits shown as solid lines. 4.2. Acetate. To our knowledge, no VSFS study of acetateat solid/liquid interfaces has been reported. As with formate,the few studies of any sort44 are limited to vacuum conditionsand the 2800-3000 cm-region where a single band at ~2950cm- was identified. The IR spectra of the acetate ion havebeen subject to a number of investigations.15,37,45,46 Only withthe help of13C/H isotope substitution were disagreements inband assignments rectified (bulk measurements).47 These dis-agreements arose because investigators often did not recognizethe strong mixing of ocH (methyl deformation) and v COmodes,48 which are both located in the 1330-1500 cm-spectralregion. Consequently, there is no one normal mode confined tothe carboxylate group;rather there is a strong interaction 8054 J. Phys. Chem. C, Vol. 111, No. 22, 2007 Frequency (cm) Figure 4. VSF spectra (ssp) of the sodium formate (aq)/CaF2 interfaceas a function of formate concentration (from bottom to top): 462,333,182, 39.2,0 mM. Some data (0 mM, 333 mM) omitted for clarity.Curve fits shown as solid lines. Figure 5. VSF spectra of the sodium formate (aq)/CaF2 interface indifferent polarization schemes (333 mM). Curve fits shown as solidlines. between various local motions of the molecule.47 A potentialenergy distribution calculation performed by others47 revealsthe presence of two rather broad bands at ~1407 and 1423 cm,which are attributed to a combination of OasCHs (74%) + Vs-CO and v CO (66%)+OasCH (18%) + 0OCO+ vCC (bothA’representation of Cs) and another CH3 deformation band(8CH3) at ~1440 cm-(A"). Our sum frequency spectra obtained for various concentra-tions of acetate(aq) at the liquid/CaF2 interface (Figure6) onlyshow one band at ~1460 cm- in the frequency range underconsideration as displayed in Figure 6a. While the peak is almostsymmetrical at higher concentrations, significant broadeningtoward lower energies occurs when the concentration isdecreased. Furthermore, a sum of two spectral terms was foundnecessary to accurately model the spectra over a largerconcentration range. To get more reliable results, the whole setof concentration-dependent spectra was fit simultaneously totwo bands with their Gaussian width and peak position keptconstant throughout the series (Table 1, Figure 6b). Interestingly, the values of 1444 and 1467 cm-(Va and Vin Table 1) measured here differ by 23 cm-l compared to the17 cm- separation and red shift of the two bands of solidsodium acetate (1423, 1440 cm-),47 which are resolvable at Figure 6. VSF spectra (ssp) of the sodium acetate (aq)/CaF2 interfaceas a function of acetate concentration (from bottom to top): (a) 19.8,39.2, 76.9,182,333 mM. Solid lines are fits. Decompositions of thefit spectra at selected concentrations shown as solid lines (b): 19.8,76.9, 333 mM. Figure 7. VSF spectra (ssp) of the (a) sodium acetate(aq)/CaF2 and(b) sodium acetate-d3/CaF2 interface at 46 mM. Solid lines representfits of the data. Contributing spectral peaks are shown in (a). low temperatures (80 K). The shift toward higher energies forthe CaF2 surface follows the expected trend caused by thestronger electrostatic forces acting upon the molecule when closeto a divalent ion (Ca²+) as opposed to Nat in the salt used forthe IR study.47,48 Thus, we can initially assign the va band to avsCO mode, with appreciable contributions of other modes, andthe 1467 cm-band (Vb) to OCH. By analogy with solid sodiumacetate, a third band would be expected at~1430 cm-, whichcould not be identified in the VSF spectra. This is consistentwith our calculations showing weaker IR and Raman intensitiesfor this mode than for the other modes. To further corroborate the present band assignment, experi-ments were performed with hydrogenated and deuterated sodiumacetate at 46 mM (Figure 7). From the normal-mode analysis(Table 1) and from the potential energy distribution,47 only oneband is expected with the predominant local modes being vCO(89%, 21% vCC, and 20% 0OCO). Even though the oasCHcontribution is missing compared to the nondeuterated acetate,only a small frequency shift was observed for the mixed vCO Figure 8. VSF spectra (ssp) of the sodium acetate (aq)/CaF2 interfaceas a function of acetate concentration (a) (from bottom to top): 333,182, 77,0 mM). Some data (0 mM, 182 mM) omitted for clarity. Curvefits and decompositions of the fit spectra at selected concentrationsshown as lines (b):0 dotted, 333 mM solid line. mode in the IR spectra of the sodium salts.47 Correspondingly,in the VSF spectrum of deuterated acetate, the vCO band wasfound at ~1440 cm-l, only slightly lower than the value of Vain the nondeuterated compound (Figure 7a). Considering theuncertainties involved in fitting two overlapping bands, theagreement of the band positions is good and thus confirms theinitial assignment. An additional low-amplitude band observedat ~1474 cm-l might be due to coupling with a low-energytransition of the adsorbed acetate similar to a lattice mode. Notethat the antisymmetric CO stretch (VasCO), which has a strongband in the IR spectrum at~1555-1585 cm-1,37,46,47 could notbe observed in the VSF spectra, because it is virtually Ramaninactive and therefore not detectable by VSFS. The spurioussignals visible at~1530 cm- in some of the spectra are artifactsnot associated with carboxylate adsorption. Figure 8 shows VSF spectra in the 2800-3800 cm-regionand decompositions of fit spectra at selected concentrations(Figure 8b). Only one peak from sodium acetate is observed inaddition to the bands already present in neat water for allconcentrations. It is located at ~2945 cm-1 and can be attributedto the CH symmetric stretch of the adsorbed acetate (V CH,Table 1), corresponding to 2936 cm- in solid sodium acetate.The antisymmetric stretch (~2990 cm-137) could not beobserved in VSF spectra. As it is expected to have a lower VSFamplitude than the symmetric mode due to its low Ramanactivity,37 further experiments were performed with differentpolarization schemes (ppp and sps) and with sodium acetatedissolved in D20, to exclude obscuring of signals by the strongbands of H20 present in this spectral region. No additionalbands, however, were found. Note that the phase of the acetatevsCH band at 2945 cm-is shifted by with respect to thewater modes. Figure 8b shows further details of the spectral features,including those arising from water, represented by solid anddotted lines. Apart from the bands at ~3200 and ~3450 cm-already considered for the formate(aq) solutions, a smalladditional band at ~3710 cm-, accounting for about ~5% ofthe total amplitude, was found to be necessary for a gooddescription of the data. Its physical origin might be similar toa process (~3660 cm-l) observed as a sharp peak at higher pH Figure 9.Water amplitudes A2 and As as a function of acetateconcentration obtained from fits of the VSF spectra of sodium acetate(aq) (a) total amplitude and (b) normalized values of individualcontributions. Solid lines are guides to the eye only. values at the neat water/CaF2 interface or near hydrophobicsurfaces and could be associated with an OH mode of only partlyhydrogen-bonded water molecules. With the focus on the mainwater modes characterized by amplitudes A2 (3200 cm-) andA3 (3450 cm), a noticeable decrease of the total water responseupon addition of acetate was found (Figure 9a). At the neatwater/CaF2 interface, preferential orientation of water moleculesarises from the alignment of the water dipoles parallel to theinterfacial electric field caused by a positive surface charge atthe fluoride deficient CaF2 surface. 17 When acetate is adsorbed,screening of this charge occurs, and (neutral) water dipoles haveto compete with the negatively charged carboxylate ions closeto the liquid/solid interface. This will first disturb the highlystructured band at ~3200 cm-l, attributed to tetrahedrallybonded water, and it will to a lesser extent perturb the signatureof more disordered water molecules at ~3450 cm(Figure 9b).It has been postulated that water molecules close to a liquid/solid interface can be oriented well beyond the first molecularlayer,4 and this seems to be the case here. Notably, even witha significant (333 mM) concentration of acetate present morethan half of the original response remains (Figure 9a). Longer-chain carboxylates (e.g., hexanoate, decanoate, stearate22) areobserved to disturb the water structure in both the tetrahedrallycoordinated and weakly bonded states much more efficientlyand at far lower concentrations. 4.3. Propionate. As the next member in the homologousseries of aliphatic carboxylates, propionate incorporates amethylene group between the carboxylate headgroup and theCH terminus. This molecular structure limits the flexibility ofthe molecule and fixes the orientation of the dipoles of thesegroups at an angle of ~60°. Thus, significant changes especiallyin the headgroup region of the VSF spectrum can be expectedand are found. Over a broad concentration range (Figure 10),two prominent features were identified and are located at ~1447and 1477 cm- (Table 2). The peak positions are almostinvariant with propionate concentration in the liquid phase inequilibrium with adsorbed carboxylate at the CaF2/liquidinterface. This indicates a constant mode of adsorption up toquite high concentrations (333 mM). Conventionally, a band~1410-1430 cm- is attributed to a vCO symmetric stretchvibration.14,16 However, a more detailed vibrational analysis ofthe propionate ion in the solid statel6 revealed a number offundamental modes within the range from 1400 to 1500 cm-, 8056 J. Phys. Chem. C, Vol. 111, No. 22, 2007 Figure 10.VSF spectra (ssp) of the sodium propionate (aq)/CaF2interface as a function of propionate concentration (from bottom totop): 8.0,15.9, 54.5, 162 mM. Some data (8.0 mM, 54.5 mM) omittedfor clarity. Solid lines are fits. TABLE 2: Fit Parameters of Sodium Propionate (aq)Derived from VSF Spectra at the Liquid/CaF2 Interface (sspPolarization, except Where Stated Otherwise)" CH;CH2COONa (aq)/CaF2 8-162 1447 11.5 333 1450 8.9 8-162d 1477 11.1 333 1479 8.8 333 2890 18.4 vCH 333 2953 12.0 2V6 333 2992 少1+兀 9.3 VasCH CH;CH2COONa (D2O)/CaF2 2891 17.0 VsCH 2950 11.5 2V6 2990 i+t 25.6 VasCH 2895 6.7 V CH 2955 8.9 2v 2993 16.3 VasCH 2987 16.1 VasCH CD:CH2COONa (aq)/CaF2 333 1454 17.2 Va 333 2933 29.5 vsCH CH;CD2COONa (aq)/CaF2 333 1445 14.9 333 1476 10.8 333 2894 v,CH 333 2948 2Vb 333 2979 中i+j 18.2 VasCH " Also given are the relative phases (中) of the bands. In mM.Incm. dGlobal fit. eppp polarization.sps polarization. corresponding to coupled vibrations of vCO, vCC, and OCH;modes as well as a (rather pure) methyl deformation mode. Toelucidate the nature of the bands observed in the VSF spectrum,experiments with systematically deuterated compounds werecarried out. Figure 11a-d shows a comparison of VSF spectraof propionate in its nondeuterated form with methyl-deuterated,methylene-deuterated, and perdeuterated propionate. Interest-ingly, the band at ~1477 cm-is absent for all molecules witha deuterated CHs group. Therefore, it can be assigned to theoCH (methyl deformation) mode, located at ~1465 cm-l inthe IR and Raman spectra of propionatel4 in both its solid stateand in aqueous solution. The ~1447 cm-band can be observed for all deuterationpatterns, however its width and position change notably. Asvirtually identical adsorption characteristics can be expected for Frequency (cm) Figure 11. Comparison of VSF spectra of sodium propionate (aq) (333mM) at the CaF2 solid/liquid interface (a) CH;CH2COONa, (b) CD3-CH2COONa,(c) CH;CD2COONa, and (d) CDCD2COONa.Polariza-tion schemes are ssp (circles) and ppp (triangles), respectively. molecules only differing in their isotopic composition, thesechanges have to be attributed to varying coupling of the vCOmotion with other group vibrations and strong coupling of thevsCO, especially with CH deformation modes. This is consistentwith findings in IR studies of the related monosubstituted acetateions.48 Usually, OCH bands are rather weak in the IR spectrum,4but it is likely that energy transfer from the 1447 cm- modeoccurs, which increases the amplitude of OCH. Notably, theOCH3 amplitude is smaller for methylene-deuterated propionate(Figure 11c), because the missing contribution of the CH2 groupto the ~1445 cm-l mode makes energy transfer along the chainmore difficult. The only two published VSF studies of adsorbed propionatewere done on Ni/NiO surfaces under UHV conditions and arelimited to the 2800-3100 cm-l region.29,50 Within this fre-quency range, three bands were identified at 2885, 2948, and2990 cm-1.50 In both reports the lower two peaks were assignedto the CH2 and CH3 symmetric stretch, respectively. However,the assignment for the 2990 cm- band was in question andwas either attributed to the CH250 or CH329antisymmetricstretch. In our work at the CaF2/water interface, two prominent peakswere found at 2890 and 2953 cm- (Figure 12, Table 2) inaddition to the broad water bands already discussed for acetate.At the highest concentration, a further band is necessary for asatisfactory fit of the experimental data and was located at 2992cm. A phase shift of a was found relative to the bands at2890 and 2953 cm-1. As a more detailed investigation in thisfrequency range is made difficult by the underling strong waterresponse, measurements in D2O were conducted. The resultingspectra are shown in Figure 13a. With the use of differentpolarization schemes (ssp,ppp, and sps) more information aboutthe nature of a VSF active mode can be obtained from rathergeneral selection rules.51-53 In particular, symmetric stretch Carboxylate Adsorption at the Fluorite/Water Interface Frequency (cm) Figure 12. VSF spectra (ssp) of the sodium propionate (aq)/CaF2interface as a function of propionate concentration (a) (from bottom totop): 182, 77, 39 mM. Solid lines are fits. (b) Decompositions of thefit spectra are shown for 39 mM, dotted line, and 182 mM, solid line.Note that contributions below 3100 cm-are shown with 5 times theiractual amplitude. Figure 13. VSF spectra of the of the sodium propionate (D2O)/CaF2interface using different polarization schemes (a)(46 mM). Decomposi-tions of fit spectra (b) are also shown (see text). Spectra are offset forclarity by the given values. modes of methyl and methylene groups should be virtuallyabsent in the sps spectra and negatively interfere with anyasymmetric stretch modes in ssp polarization.52,53 Note that thephase relation between bands in the ppp spectrum is morevariable, as several susceptibility tensor elements contribute.It thus follows that the bands at ~2890 and ~2950 cm-lbelongto symmetric modes (Figure 13a,b, Table 2), whereas the ~2990cmband originates from an antisymmetric mode. Followingthe same methodology employed for the 1400-1500 cmregion, deuterated propionates were studied (Figure 14a-d,Table 2). All three bands were observed for both the nondeu-terated propionate and CHCD2COONa and can therefore beconsidered CH3 bands, while the CH2band (symmetric stretchat 2933 cm-l) is weaker and largely obscured for CH;CH2-COONa (Figure 14a,b). Consequently, of the 2890 and 2950cm- bands (which share the same symmetry) one must be anovertone, enhanced by Fermi resonance, although Yuzawa etal. argue that such bands can be excluded in the case ofpropionate.50 In agreement with assignments of related com- Figure 14. Comparison of VSF spectra of deuterated sodium propi-onate (aq) (333 mM) at the CaF2 solid/liquid interface (a) CH;CH2-COONa, (b) CD3CH2COONa, (c) CH;CD2COONa,and (d) CDCD2-COONa.All spectra (circles) were recorded using the ssp polarizationscheme. Solid lines are fits. pounds and the close match of the calculated frequency forthe methyl deformation overtone (2×OCH: 2× 1477 cm-=2954 cm-l; Table2), the peak at ~2890 cm- represents thefundamental. 4.4. Higher Carboxylates. In situ VSF spectroscopic mea-surements in the 2800-3800 cm-region for a series of long-chain carboxylates, namely hexanoate, decanoate, and stearate,have been reported before.22 It was shown that the chain lengthhas a strong effect on the adsorption onto CaF2 surfaces fromaqueous solutions. Long-chain ions were found to adsorb at farlower concentrations (in the micromolar regime) and formhydrophobic monolayers of sufficient thickness and coverageto suppress almost totally the response of interfacial water."2These results were reproduced for this study and provide insightsinto the orientation of the CH terminus and water structure.Additionally, we report here the first results in the spectral regionof the headgroup (1400-1500 cm-). Measurements revealed a single band, located at 1461 and1452/1458 cm-l for hexanoate and dodecanoate, respectively(Figure 15a,b, Table 3), which are typical representatives ofintermediate and long-chain carboxylates. Compared to thecorresponding band of adsorbed propionate, a shift toward higherenergies is observed, and the frequency is more similar to CD3-CH2COONa. This indicates an extent of coupling of local vCO/vCC and oCH2 modes similar to acetate and propionate.Obviously, in the hexanoate and dodecanoate ion the terminalCHs group is too remote for a significant contribution to theheadgroup mode. Notably, there is also no evidence for a CHsdeformation mode. Although the monolayer/water interfaces ofthese compounds are known to be rather rough, peakscorresponding to the CH symmetric and antisymmetric modecould be found in the 2800-3000 cm- region, and thus theorientational average of the molecular hyperpolarizability tensorshould be nonvanishing also for a deformation mode. However,it was already concluded from the intensity of the OCH band 8058 J. Phys. Chem. C, Vol. 111, No. 22, 2007 Figure 15..VSF spectra of the sodium hexanoate (aq) and sodiumdodecanoate (aq)/CaF2 interface (a) 46 mM C5HnCOONa, (b) 5(incomplete coverage), 13 uM CnH23COONa. Solid lines are fits. TABLE 3: Fit Parameters of Sodium Hexanoate (aq) andSodium Dodecanoate (aq) Derived from VSF Spectra at theLiquid/CaF2 Interface (ssp Polarization) Pa mode C5HCOONa (aq)/CaF2 46mM 1461 17.4 va CH23COONa (aq)/CaF2 5uM 1452 17.9 13uM 1458 19.0 “ In cm-. Incomplete coverage. in methylene-deuterated propionate ion that this band may begreatly enhanced by resonance with the headgroup mode in thecase of nondeuterated propionate. Such an energy transfer isnot possible between the carboxylate group and the distantterminal CH in any long-chain homologue. Another interesting feature is the coverage-dependent fre-quency shift of the headgroup band for dodecanoate (6 cm-l,Table3). This presumably arises from intermolecular interac-tions with increasing coverage,4 which is expected to bestronger for the better aligned adsorbate layers of long-chaincarboxylates. Note that even for dodecanoate, the surfaceadsorption remains a fully reversible process (i.e., all adsorbate-related bands vanished when water was substituted for thesample solution in contact with the fluorite prism). Additionally,the concentrations were far below the critical micellar concen-tration for dodecanoate.54 Therefore, the observed shifts cannotbe caused by surface-precipitated surfactant aggregates, but arisefrom a monomolecular layer. 5. Conclusions This investigation presents the first VSF spectra of thecarboxylate headgroup of various aliphatic carboxylates at theliquid/solid interface. The carboxylate bands are located in closeproximity to CH deformation bands and could be identified byisotopic substitution. From experiment and calculation, it is nowapparent that the simplifying concept of group modes is notgenerally applicable here because of significant contributionsof various group motions to the fundamentals. For some bands,which are prominent in the IR spectrum but SF inactive,combination bands were used to gain further insights. Theimportance of intensity enhancement,often by Fermi resonance,was also demonstrated. Furthermore, a number of conflicting assignments reportedfor adsorbed carboxylates (mainly under UHV conditions) inthe CH2/CH stretch region (2700-3100 cm-) were resolvedusing deuterated compounds and selection rules for polarization-dependent VSF spectra. Naturally, accurate assignments areessential for any further analysis of VSF spectra in terms oforientational distributions of organic adsorbates at interfaces. Adsorption onto fluorite results in significant spectral shifts,caused by the high electrical field at the interface. These effectswere particularly strong for headgroup bands. However, theinternal modes of vibration of the carboxylate molecules retaintheir essential character. The reversibility of the adsorptionindicates that all studied compounds are linked to the substrateby ionic interactions (i.e., no permanent chemical bonds areformed between the adsorbate and the fluorite crystal). Fromthis perspective, strong effects of pH and ionic strength on theadsorption equilibria can be inferred. A more detailed assessmentof this is forthcoming in another paper. An intensity analysis of the two main bands arising from theorientation of water dipoles at the interface revealed that theeffect of the positively charged solid surface extends well intothe liquid phase, even at relatively high carboxylate concentra-tions. With a decreasing number of oriented water molecules,the more well-ordered interfacial states are diminished first.Long-chain surfactant-like carboxylates have a higher affinityto the interface and form layers that more effectively shield thefluorite surface. Intermolecular interactions of adsorbed carboxylate head-groups are rather small, as evidenced by the almost negligibleshift of the corresponding bands. Only for dodecanoate aresomewhat larger effects observed. Using surface selection rules, we were able to ascertainnotable differences of VSF studies at the solid/liquid interfacecompared to measurements performed under UHV conditions.In particular, we observed an inequality in oxygen sites forformate molecules that are tipped. Acknowledgment. We gratefully acknowledge the financialsupport of the Department of Energy, Basic Energy Sciences,DEFG02-96ER45557. S.S. appreciates a scholarship of theGerman Research Foundation (DFG, Bonn), SCHR 1153/1-1.The authors thank D. Beaman and C. McFearin for theirinvaluable help with the experimental setup. References and Notes (1) Davis, J. A.; Hayes, K. F. Geochemical Processes at MineralSurfaces; American Chemical Society: Washington, DC,1986. (2) Vaughan, D. J.; Pattrick, R. A. D. Mineral Surfaces; Chapman &Hall: London, 1995. (3) Brady, P. V. Physics and Chemistry ofMineral Surfaces; CRCPress: Boca Raton, FL, 1996. (4) Graustein, W. C. K.; Cromack, J.; Sollins, P. Science 1977,198,1252. (5) Strobel, B. W. Geoderma 2001, 99, 169.(6) Nikolic, I.; Bleěic, D.; Blagojevic, N.; Radmilovic, V.; Kovaevic,K.J. Cryst. Growth 2003, 252, 360.(7) Jiang, B.; Yin, H.; Jiang, T.; Yan, J.; Fan, Z.; Li, c.; Wu, J.; Wada, Y. Mater. Chem. Phys. 2005,92,595. (8) Ojamae, L.;Aulin, C.; Pedersen, H.; Kall, P.-O. J. Colloid InterfaceSci.2006, 296, 71. (9) Hagfeldt, A.; Gratzel, M. Acc. Chem. Res.2000, 33, 269. (10) Dobson, K. D.; McQuillan, A. J. Spectrochim. Acta, Part A 1999,55.1395. (11) McQuillan, A. J. Adu. Mater.2001, 13, 1034. (12) Yoon, T. H.; Johnson, S. B.; Musgrave, C. B.; Brown, G. E. J.Geochim. Cosmochim. Acta 2004, 68, 4505. (13) Johnson, C. M.; Tyrode, E.; Baldelli, S.; Rutland, M. W.;Leygraf,C. J.Phys. Chem.B 2005, 109, 321. (14) Spinner,E.; Yang, P.; Wong, P. T. T.; Mantsch, H. Aust. J. Chem.1986,39,475. (15) Kakihana, M.; Kotaka, M.; Okamoto, M. J. Phys. Chem. 1982,86,4385. (16) Kakihana, M.; Akiyama, M. J. Phys. Chem. 1987, 91, 4701. (17) Becraft, K. A.; Richmond,G. L. Langmuir 2001, 17, 7721. ( ( 1 8) S hen, Y. R. T he Principles ofNonlinear Optics; Wiley: New York, 1984. ) (19) Richmond, G. L. Chem. Rev. 2002,102,2693. (20) Superfine, R.; Guyot-Sionnest, P.; Hunt, J.; Kao, C. T.; Shen, Y.R. Surf. Sci. 1988, 200, L445. (21) Hore, D.; Beaman, D.; Parks,D.; Richmond, G. J. Phys. Chem. B2005,109,16846. (22) Becraft, K. A.; Richmond, G. L. J. Phys. Chem. B 2005,109,5108.(23) Frisch, M. J.; Trucks, G. W.; Schlegel, H. B.; Scuseria, G. E.; Robb,M. A.; Cheeseman,J. R.; Montgomery, J. A., Jr.; Vreven, T.; Kudin, K.N.; Burant, J. C.; Millam, J. M.; Iyengar, S. S.; Tomasi, J; Barone, V.;Mennucci, B.; Cossi, M.; Scalmani, G.; Rega, N.; Petersson, G. A.;Nakatsuji, H.; Hada, M.; Ehara, M.; Toyota, K.; Fukuda, R.; Hasegawa,J.;Ishida, M.; Nakajima, T.; Honda, Y.; Kitao, O.; Nakai, H.; Klene, M.; Li,X.; Knox,J. E.; Hratchian, H. P.; Cross, J. B.; Adamo, C.; Jaramillo, J.;Gomperts, R.; Stratmann, R. E.; Yazyev, O.; Austin, A. J.; Cammi, R.;Pomelli, C.; Ochterski, J.W.; Ayala, P. Y.; Morokuma, K.; Voth, G. A.;Salvador,P.; Dannenberg, J. J.; Zakrzewski, V. G.; Dapprich, S.; Daniels,A. D.; Strain, M. C.; Farkas, O.; Malick, D. K.; Rabuck, A. D.;Raghavachari, K.; Foresman, J. B.; Ortiz, J. V.; Cui, Q.; Baboul, A. G.;Clifford, S.; Cioslowski, J.; Stefanov, B. B.; Liu, G.; Liashenko, A.; Piskorz,P.; Komaromi, I.; Martin,R. L.; Fox, D. J.; Keith, T.; Al-Laham, M. A.;Peng, C. Y.; Nanayakkara, A.; Challacombe, M.; Gill, P. M. W.; Johnson,B.; Chen, W.; Wong, M. W.; Gonzalez, C.; Pople, J. A. Gaussian 03,revision B.04; Gaussian, Inc.: Pittsburgh, PA, 2003. ( (24) F oresman, J. B .; F risch, E. Exploring Chemistry with Elect r onicStructure Methods, 2 n d Ed.; Gaussian, In c .: Pi t tsburgh, PA, 19 9 6. ) ( (25) L o bau, J.; Wolfrum, K. J. Opt . Soc. Am . B 1997,14,2505. ) ( (26) M iller, J . D.; Hiskey, J. B. J. Colloid Interface Sci. 1972,41,5 6 7. (27) M iller, J. D .; F a, K .; C alara, J. V.; P aruchuri, V. K . C o lloids Surf, A 2004, 238,91. ) (28) Ishida, H.; Iwatsu, K.; Kubota, J.; Wada, A.; Domen, K.; Hirose,C. Surf. Sci. 1996,366,L724. (29) Yuzawa, T.; Shioda,T.; Kubota, J.; Onda, K.; Wada, A.; Domen,K.; Hirose, C. Surf. Sci. 1998, 416,L1090. (30) Kusafuka, K.; Noguchi, H.; Onda, K.; Kubota, J.; Domen, K.;Hirose, C.; Wada, A. Surf. Sci. 2002, 313, 502-503. (31) Yamamoto, H.; Akamatsu, N.; Wada, A.; Domen, K.; Hirose, C.J. Electron Spectrosc. Relat. Phenom. 1993, 64/65,507. ( (32) Domen,K.; Yamamoto, H.; Watanabe, N.; W a da, A.; Hirose, C. Appl. Phys. A 1995, 60,131. ) ( (33) Yamakata, A .; Kubota, J.;Kondo, J . N.;Domen, K.; Hirose, C. J. Phys. Chem. 1 996, 1 00, 1 8177. ) ( (34) H ayden, B. E.; Prince, K.;Woodruff, D. P .; Bradshaw, A. M . Surf.Sci.1983, 1 33, 5 89. ) ( (35) H aq, S.; L o v e, J. G.; S a nders, H. E . ; King, D. A. Surf. Sci. 19 9 5, 325,230. ) ( (36) Ito, M.; Suetak a , W. J . Phys. Chem . 1975 , 79, 1 190. ) ( (37) I to, K.; Bernstein, H. J . Can. J. Chem. 1 956, 34,17 0 . ) ( (38) R otzinger, F . P.; Kesselman-Truttmann, J.M.; Hug,S. J .; Shklover,V.; Gratzel, M. J. Phys. Chem. B 2 004, 108, 5 004. ) ( (39) S exton, B. A . S urf. Sci. 1979, 8 8,319. ) ( (40) F onteyne, R . N aturwissenschaften 1 9 43, 37/38, 441. ) ( (41) Newman, R . J. C hem. Phys. 1952, 20, 1663. ) ( (42) J akob, P. Phys. Rev. Lett . 1997 , 79,2919. ) ( (43) S chrodle, S.; Moore, F. G . ; Richmond, G. L . Un i versity of Oregon, E ugene, O R. Un p ublished work. ) ( (44) W ang, C.-Y.; Groenzin, H. ; Shultz, M. J. J . Am. C h em. So c . 20 0 5, 127,9736. ) ( (45) J ones, L .; M cLaren, E . J. Chem. Ph y s. 19 5 4, 22, 179 6 . ) ( (46) Nakamura, K . K agaku Zasshi 1958, 7 9,1411. ) ( (47) K akihana, M .; K otaka, M.;Okamoto, M. J. Phys. Chem.19 8 3,87, ) 2526. ( (48) K ang, I . P . S .; Spinner, E . Aust. J. Chem. 1 9 86, 39, 4 6 5. ) ( (49) Gragson, D. E .; Richmond, G. L. J. P hys. Chem. B 1 9 98, 1 0 2,3847 . ) ( (50) Y uzawa, T . ; K ubota, J.; Onda, K.; Wada,A.; D omen, K .; H i rose, C. J. M ol. Struct. 1997 , 307,413-414. ) ( (51) W olfrum, K . ; Laubereau, A. Chem. P h ys. L e tt. 1 994, 2 28, 8 3. ) (52) Lu, R.; Gan, W.; Wu, B. H.; Chen, H.; Wang, H. F. J. Phys. Chem.B 2004,108,7297. (53) Lu, R.; Gan, W.; Wu, B. H.; Zhang, Z.; Guo, Y.; Wang, H. F. J.Phys. Chem. B 2005, 109, 14118. (54) Yan, Y.; Xiong, W.; Huang, J.; Li, Z.; Li, X.; Li, N.; Fu, H. J.Phys. Chem. B 2005, 109,357. (55) Schrodle, S.; Moore, F. G.; Richmond, G. L. J. Phys. Chem. C.,submitted for publication, 2007.
确定


还剩8页未读,是否继续阅读?

产品配置单

北京欧兰科技发展有限公司为您提供《羧酸盐,萤石和水界面中和频光谱(SFG),吸附过程检测方案(其它光谱仪)》,该方案主要用于其他中和频光谱(SFG),吸附过程检测,参考标准--,《羧酸盐,萤石和水界面中和频光谱(SFG),吸附过程检测方案(其它光谱仪)》用到的仪器有Ekspla SFG 表面和频光谱分析系统、Ekspla PL2230型高能量皮秒激光器、Ekspla CARS 相干反斯托克斯拉曼显微光谱仪
推荐专场


相关方案
更多
该厂商其他方案
更多