


方案详情
文
A new compact micro-lens optical system has been developed to produce a 7 x 7 multiline optical grid for Hydroxyl Tagging Velocimetry (HTV). These lines provide additional spatial information and aid the software tracking of the flowfield by increasing its resolution. Single-photon photodissociation of groundstate H2O by a ~193-nm ArF excimer laser “writes” a 7
x 7 beam molecular grid with very long gridlines of superequilibrium OH and H photoproducts in either room air flowfields or in H2-Air flames due to the presence of H2O vapor. The displaced OH tag lines’
positions are revealed through fluorescence by A2Σ+ (v′= 0) ← X2Πi (v″ = 0) OH excitation using a ~308 nm pulsed frequency-doubled dye laser. A time-of-flight software (DaVis 6.0 Stereo PIV/PTV, LaVision,
GmbH) determines the instantaneous velocity field. HTV tag lifetime comparisons between experimental results and theoretical predictions are discussed.
方案详情

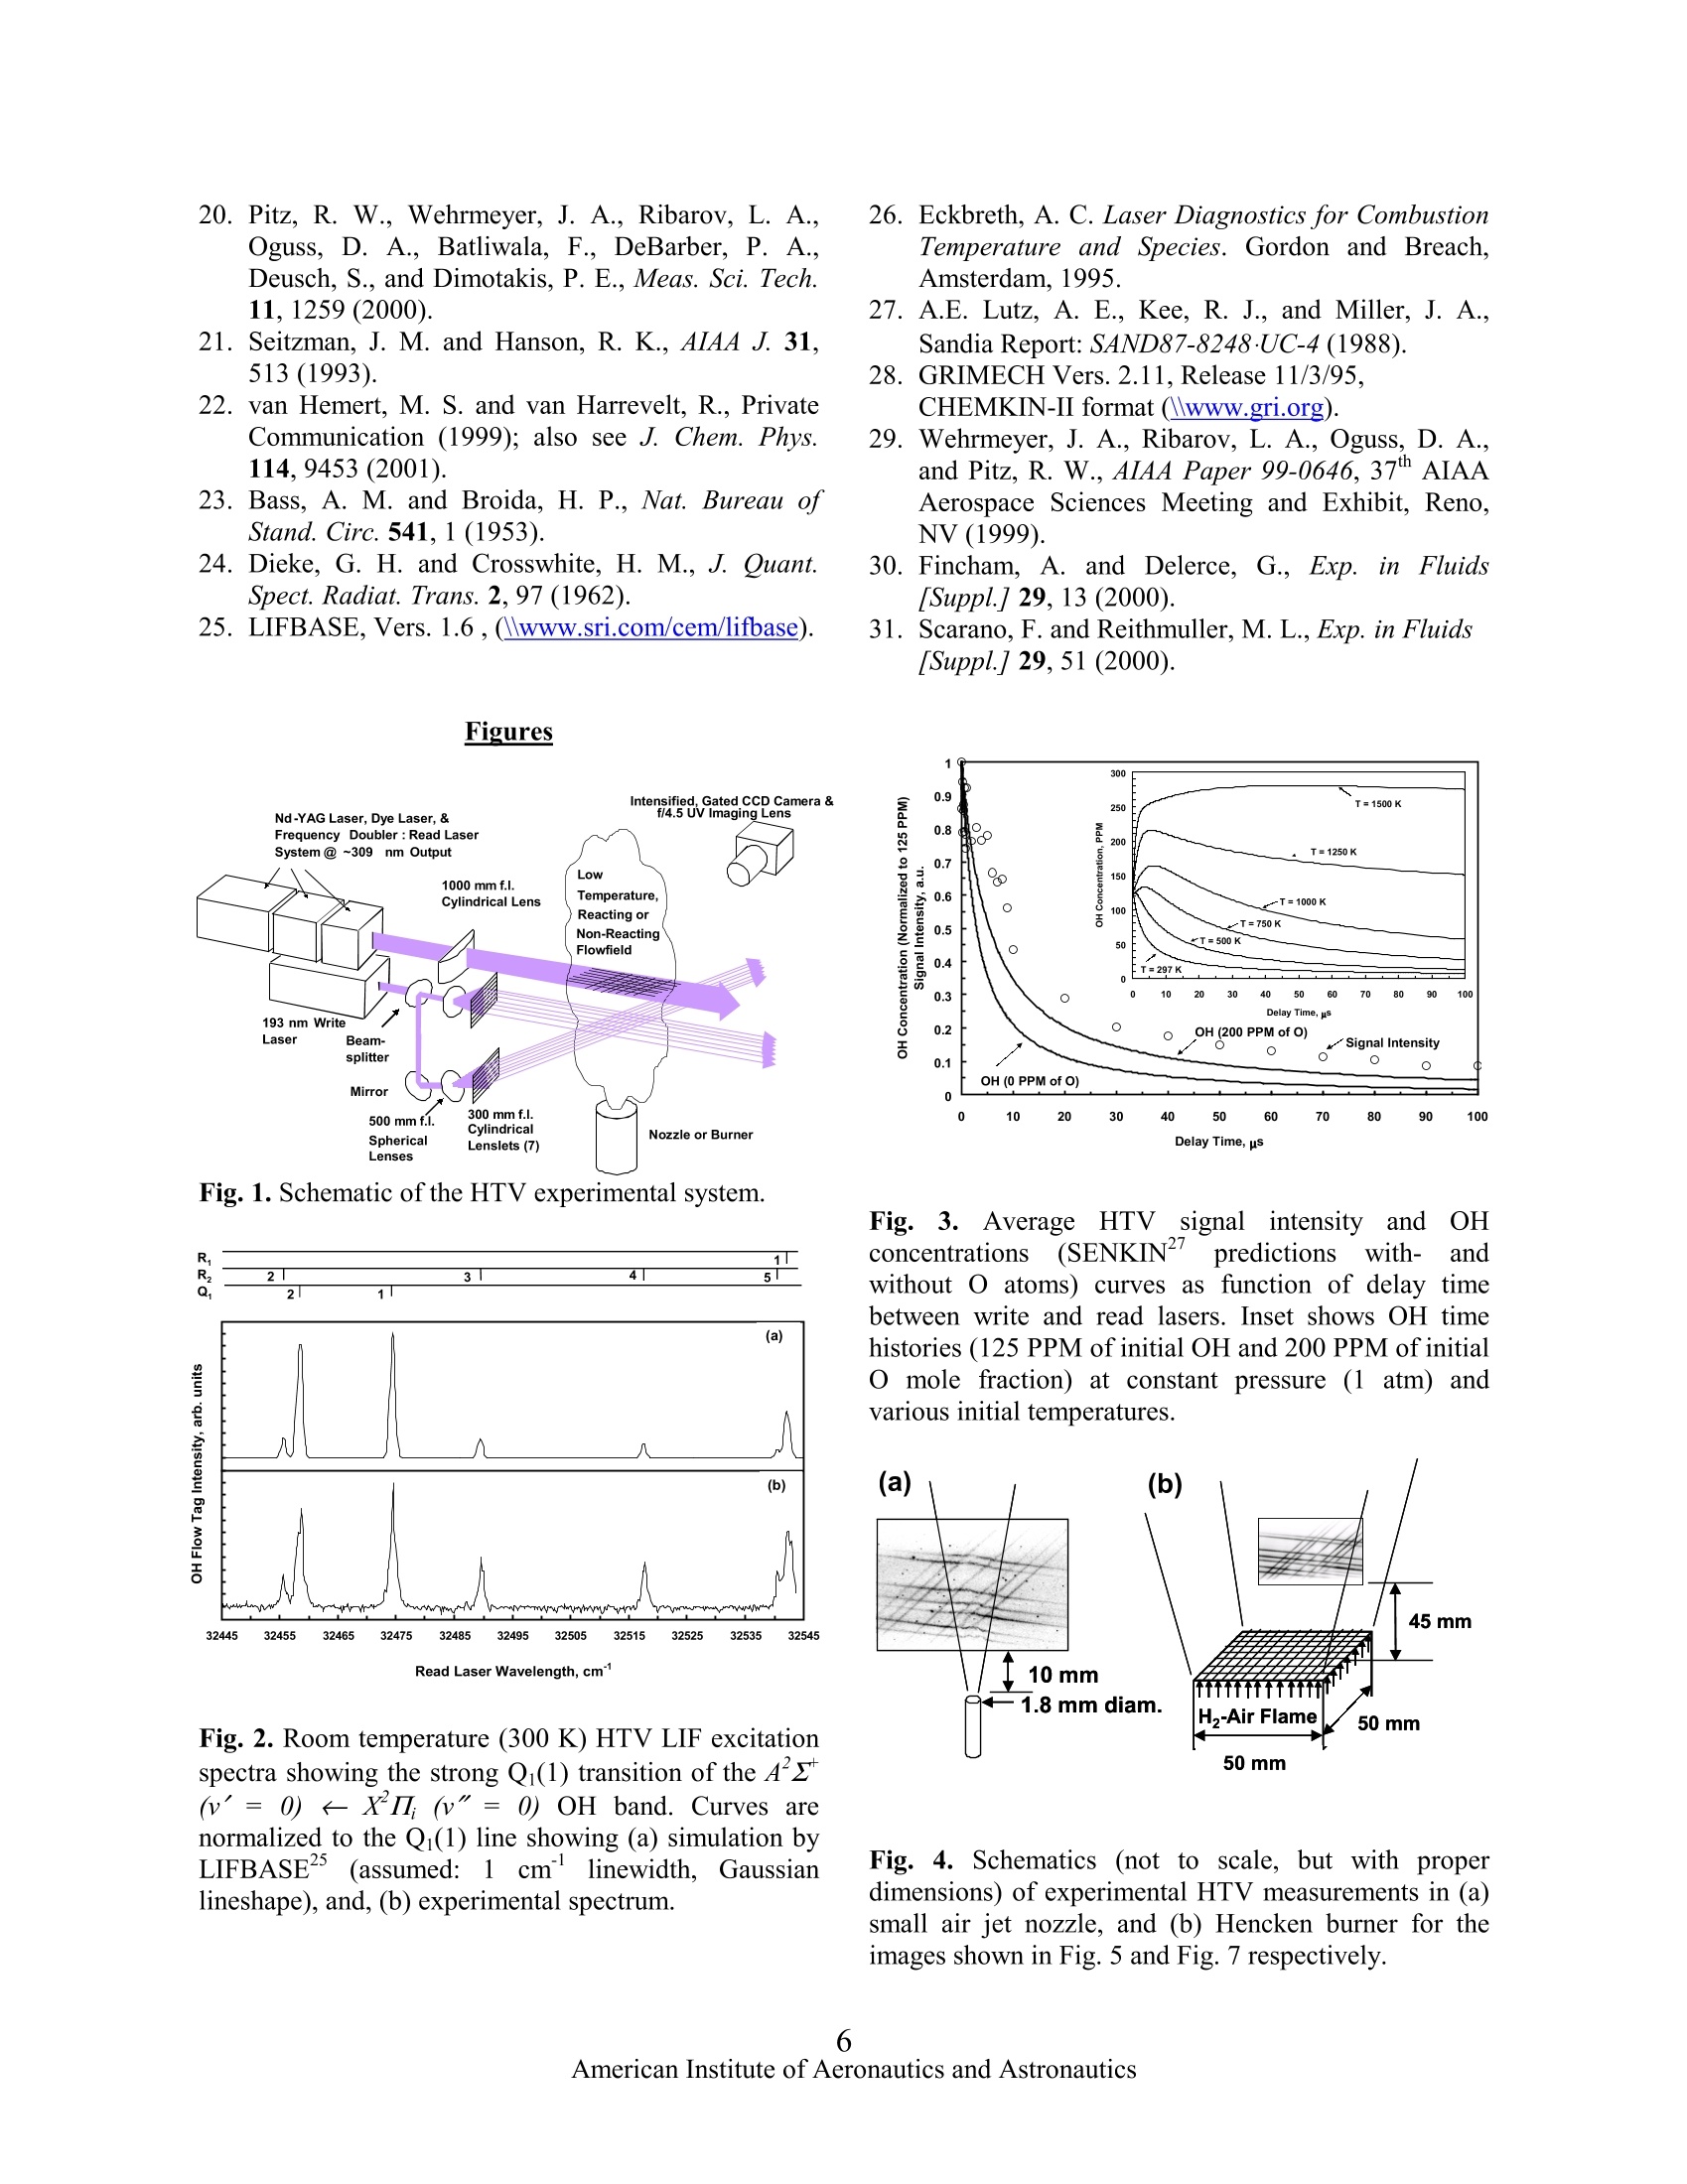
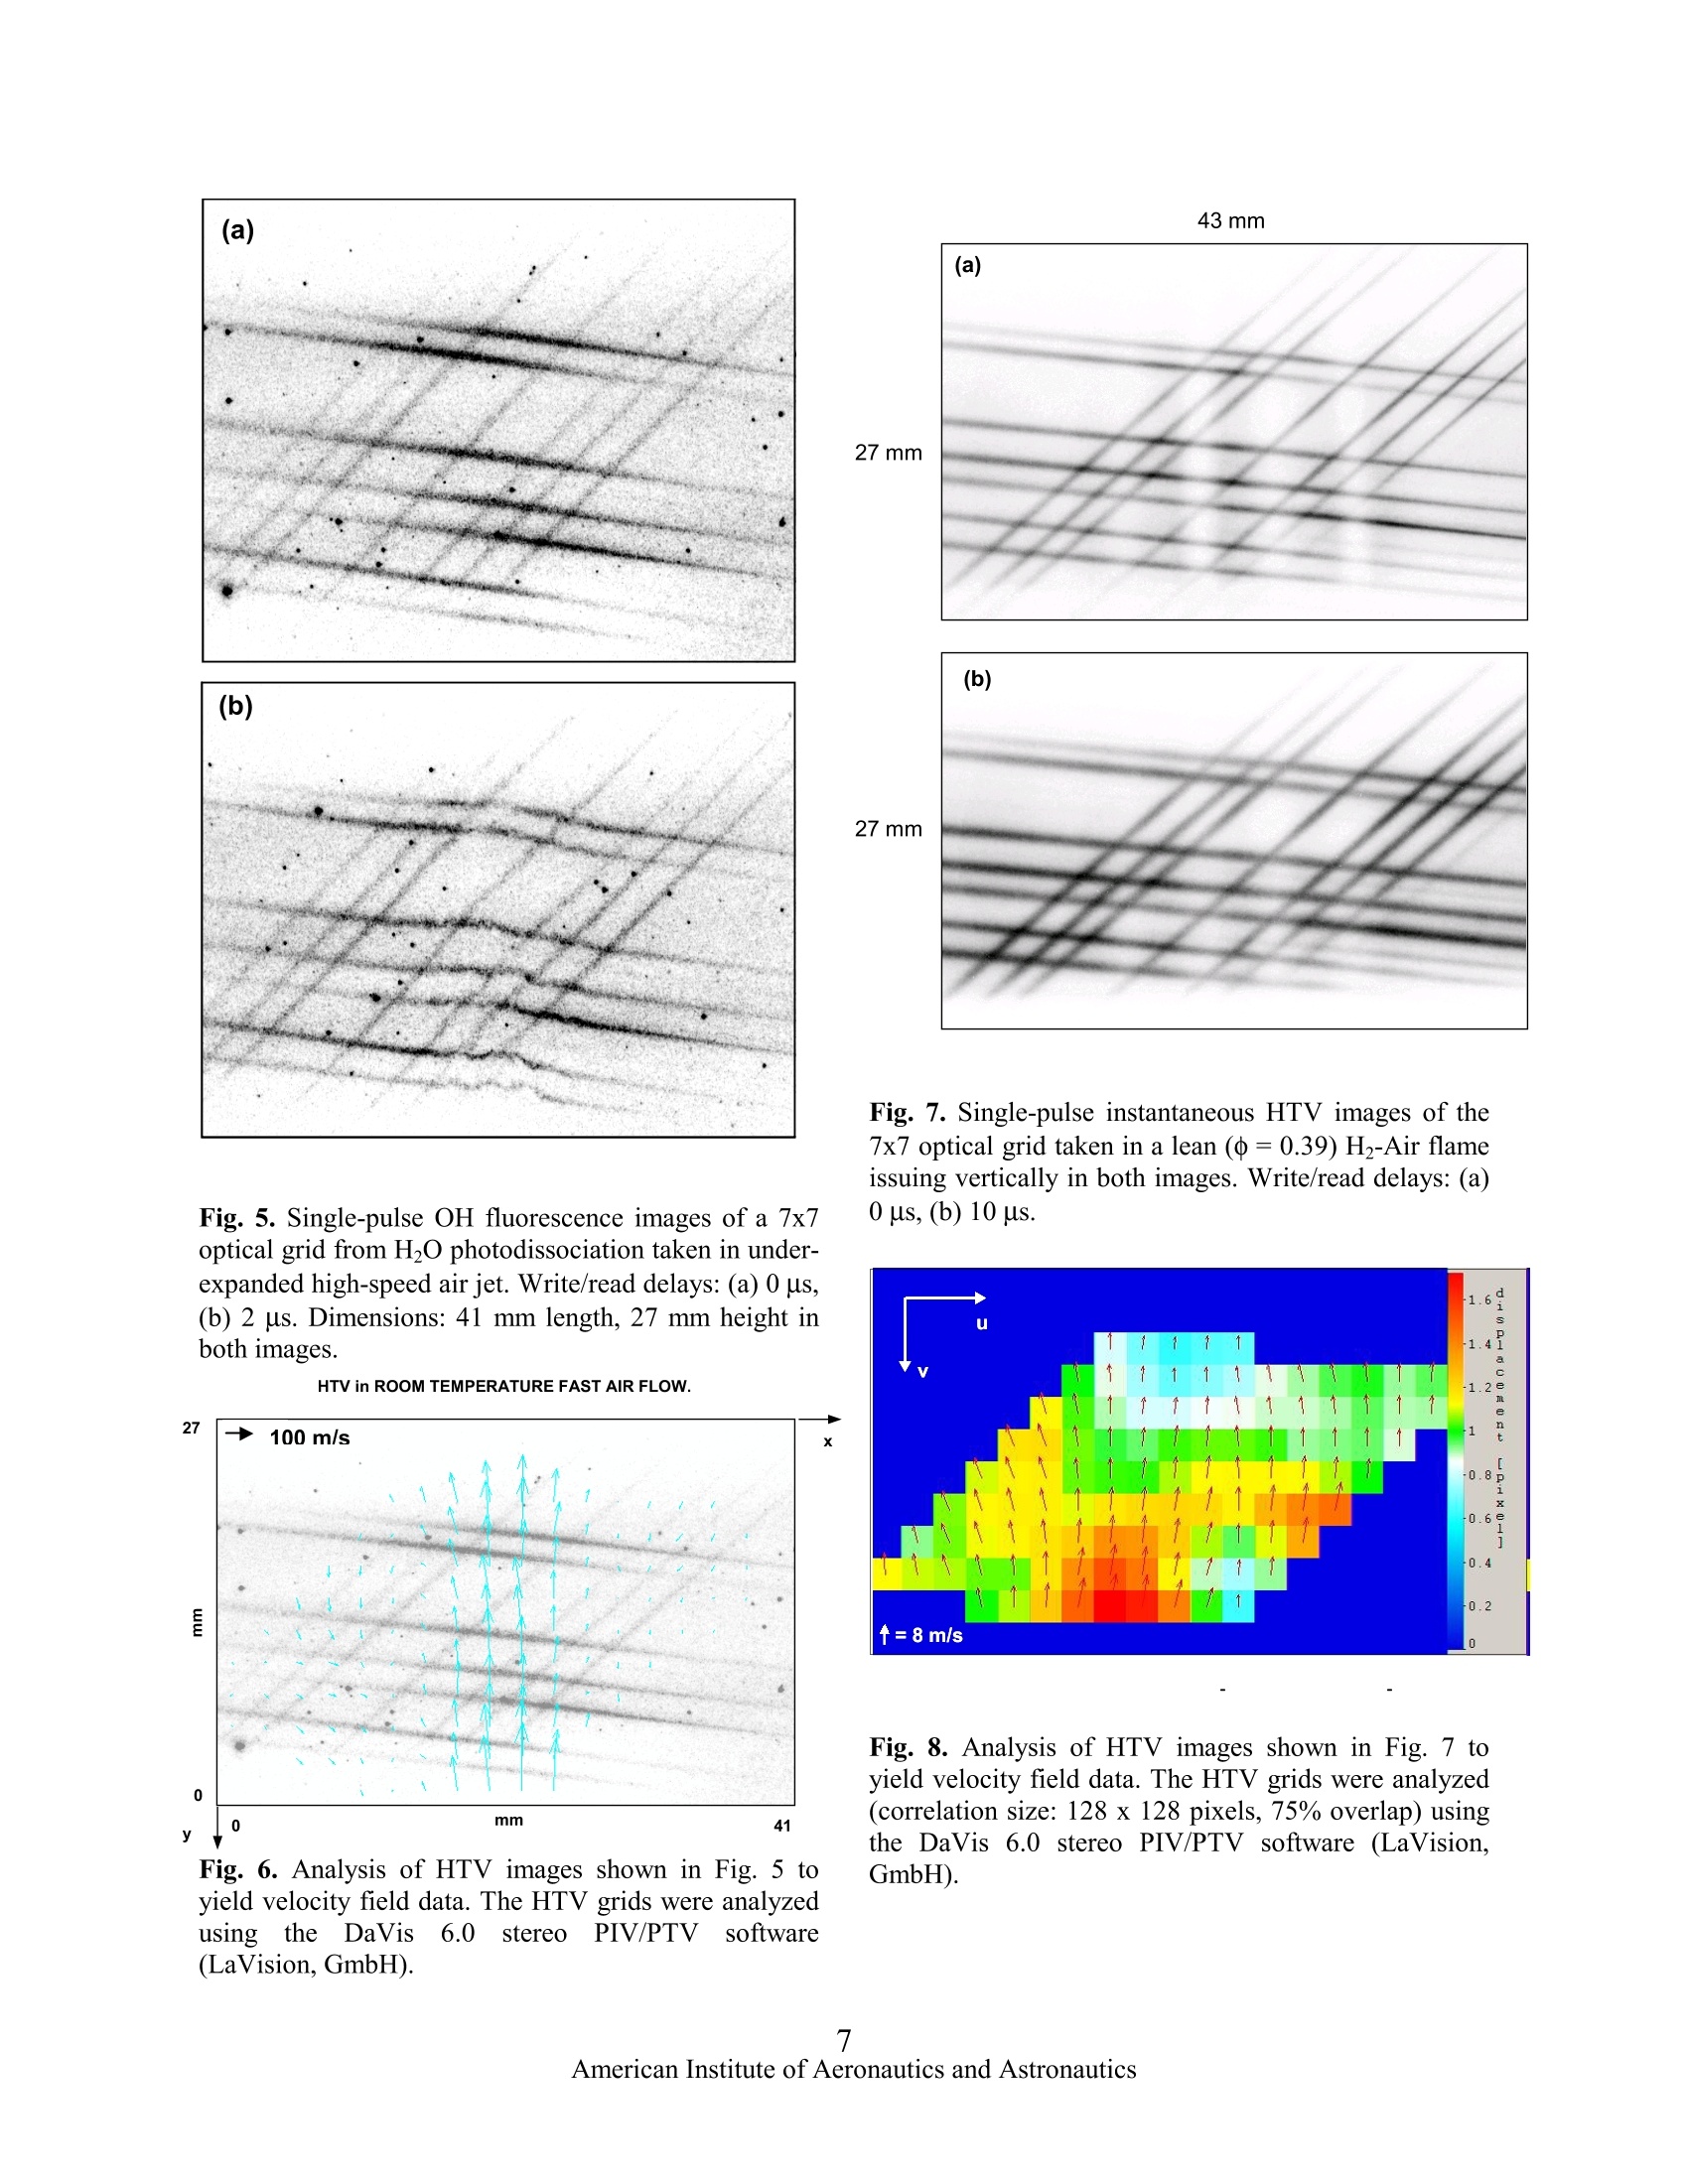
AIAA 2002-3862 43 mm MULTILINE HYDROXYL TAGGING VELOCIMETRY IN REACTING AND NONREACTINGEXPERIMENTAL FLOWS Lubomir A. Ribarov, Joseph A. Wehrmeyer , and Robert W. Pitz* Department of Mechanical Engineering Vanderbilt University, Nashville, TN 37235-1592,USA (Fax: +1.615.343.6687,E-Mail: robert.w.pitz@vanderbilt.edu) A new compact micro-lens optical system has beendeveloped to produce a 7 x 7 multiline optical grid forHydroxyl TaggingVelocimetry (HTV). These linesprovide additional spatial information and aid thesoftware tracking of the flowfield by increasing itsresolution. Single-photon photodissociation of ground-state H20 by a~193-nm ArF excimer laser “writes”a 7x 7 beam molecular grid with very long gridlines ofsuperequilibrium OH and H photoproducts in eitherroom air flowfields or in H-Air flames due to thepresence of H20 vapor. The displaced OH tag lines’positions are revealed through fluorescence by A’z(v'=0)←XI}(v"=0) OH excitation using a ~308 nmpulsed frequency-doubled dye laser. A time-of-flightsoftware (DaVis6.0 Stereo PIV/PTV, LaVision,GmbH) determines the instantaneous velocity field.HTV tag lifetime comparisons between experimentalresults and theoretical predictions are discussed. Introduction Accurate and reliable velocimetry measurementsareessentialinour understanding of the fluid-mechanical, thermodynamical, and thermo-chemicalproperties of a given experimental flowfield. There is aneed for nonintrusive velocimetry methods, which donot perturb the interrogated flowfield and provide ahigh degree of accuracy. In recent years several suchopticaldiagnosticmethodsshavebeen cdeveloped.Having found a wide application in aerodynamics,combustion, and fluid dynamics, these methods areintrinsically nonintrusive and thus do not suffer theproblems usually associated with insertion devices (e.g.static and total pressure probes, pitot tubes, hot-wire/hot-film anemometers. etc.) used in moretraditional measurements. Laser-based nonintrusive velocity measurements inexperimental gas flowfields are performed routinelywith molecular velocimetry methods.. UnliketheDoppler-shifted molecular velocimetry methods,8 that ( S tudent Member AIAA ) ( + S enior Member AIAA ) ( A s sociate Fellow AIAA, Corresponding Author ) ( This material is declared a work of the U.S. ) ( Government and is not subject to copyright protection in the United States. ) tend to be inaccurate at low speeds due to the extremelysmall shift, molecular tagging methods can be appliedto a wide range of experimental flowfield velocities. In molecular flow tagging, the specific molecularmarker is written into the interrogated gas and velocityis dCetermined by computing the displaced marker’sposition over a known time period. Several moleculartagging methods rely on seeding of the gas flow prior toits interrogation by the laser light sources. A detaileddescription of these methods is found elsewhere. Suchmolecular methods with chemical additives are oftenundesirable from an environmental and/or safety aspect,and in large-scale applications they can be prohibitivelycostly. Excessive buildup of seed particles on testsectionaccesswindows presents another seriouschallenge as clearly illustrated in a recent work. Inaddition, the tracer particles with their large inertiarelative to the gas flow molecules (esp. in supersonicflow fields),are often susceptiblee to flow fieldirregularities (e.g. shocks, temperature and velocitygradients, etc.) and may not follow accurately theinterrogated flow streamlines. Generally, an upperlimit on particle size is bound by particle inertia, whilethe lower limit is dictated by Brownian motion andmolecular slip in addition to the decreasing light-scattering cross sections due to the decreased individualparticle size."Lorentz-Mie scattering from the seedparticles also interferes with simultaneous diagnosticsat- or near- the excitation wavelength.Other forces thatcan similarly cause the motion of the particles todeviate from the interrogated fluid motion (although toalesser degree) include gravitational, centrifugal,acoustic, diffusiophoretic, photophoretic, phosphoretic,anddthermophoretic.l3,14 Thisleadsto undesirableinaccuracies in the velocity measurements. Finally,thermophoretic forces in temperature gradients (e.g. incombustion environmentsts) can bias thevelocitymeasurement1.5 Time-of-flight (TOF) unseeded molecular flowtagging velocimetry methods have been successfullydevelopedSsuch as two-photon water vapordissociation, Raman excitation + laser-inducedelectronic fluorescence (RELIEF) of 02,’ and ozonetagging velocimetry (OTV).18 Nonlinear methods。16,17generally produce shorter lines due to the signal'sinverse dependence on the square of beam diameter.Elevated temperatures can be detrimentalto some unseeded tagging methods,( 17,18and have led to thedevelopment of other nonintrusive molecular methods(HTV) amenable to either low-’or high-temperaturereacting flows.19.20 In tthislSwork, a ffrequency-doubled dye laserpumped by an Nd-YAG laser (also frequency-doubled)is used as a “read” source to demonstrate HTV’sapplicability to low- and high-temperature flowfields.By operating the frequency-doubled dye at ~308 nm,the vibrational transitions of the Az(v'=0)X’Il,(v"=(0)OH band are accessed..These (00)transitions result in fluorescence that is about twoorders of magnitude (where the ratio of the Einstein“B”coefficients for (0←0) and (3←0) respectively isBoo/B30 = 167)21 stronger than that for the (3(0)transitions previously used for some of some earlierHTV work.19,20 These strongly fluorescing OH (0(0)transitions compensate for the relatively weak 193 nmphotodissociation cross-section of ground vibrationalstate HO,19,20.22 allowing HTV to be applied to lowtemperature (300 K) flowfields. HTV is also applied inlean H-air flames where pumping of the stronglyfluorescing OH (0(0) transition is used. A wide rangeof velocityflowfields (slow-to near-sonic) issuccessfully interrogated and the results aredemonstrated. Experimental System A schematic of the experimental system is shownin Fig. 1. The low temperature HTV demonstrationconsists of two laser light sources. A tunable LambdaPhysik COMPex-150T 193-nm ArF excimer laser is thewrite laser. The output of the narrowband ArF excimerlaser (~150 mJ/pulse, 0.003 nm linewidth, 0.2 mraddivergence at FWHM) is divided into two sets of sevenbeams formed by two stacks of seven 0.3-m focallength (f.l.) cylindrical micro lenses (20 mm x 3 mm x3 mm) each. Both sets of laser light beams cross in theflowfield producing a 49-point optical grid. The ArFbeams are focused to 0.3 mm beam waists by a secondset of 0.3-m f.l. cylindrical lenses (25 mm x 40 mm).The tunable ArF excimer laser is operated in itsbroadband mode (~1 nm linewidth) since the H2Oabsorption band is a broad continuum lacking anydistinct absorption lines.The total distance traveled byeach of the ArF grid lines is over 1 m in (unpurged)room air and leads to ~16% loss (estimated) in energyfrom laser exit to the measurement zone. The output of a Continuum Powerlite Nd-YAGlaser (532-nm) is frequency-doubled and is used topump a Continuum ND6000 dye laser whose output isfrequency doubled to ~308 nm to provide the (20mJ/pulse, tunable, 0.05 cm bandwidth) read laser.Approximately 5-6 mJ/pulse islost due to beamtransmission losses to the measurement volume. The 308-nm light output of the dye laser is focused by a 1 mf. l. cylindrical lens to a sheet of 20 mm by 0.5 mmcross section. Images from the measurement volumewere collected through a multi-element UV imaginglens (Nikon, UV-Nikkor F/4.5, f= 105 mm) coupled toa gated Princeton Instruments ICCD camera (576 x 384array, 22 um pixels). The gating time was typically 50ns.A33-mm thickbutyl1acetate filter (passingwavelengths longer than 255 nm) was placed in front ofthe UV lens to reject the strong O2 fluorescence linescaused by the 193-nm ArF excimer, thus preventing theappearance of O2 fluoresce on the CCD image fromphotocathode image persistence.18 The output of theread dye laser is tuned to excite the strong Az(v'=0)(XI}(v"=0)OH transition. OH Tag Spectral Identification and Formation Figure 2bshows/Sthefluorescence excitationspectrum for the flow tag measured in quiescent roomair conditions (297 K, 40% Relative Humidity, RH) fora ~1 nm range of the tunable dye laser. The dye laserdoes have a wider tuning range; however, to keep thedye laser output relatively strong (and close to its peakvalue), its range was kept at around 1 nm, between~307.3 nm (32545 cm') and ~308.2 nm (32445 cm).The dye laser’s output for this range was in therelatively linear section of the laser dye-tuning curve;hence, the laser’s output power was normalized in alinear fashion. The spectral signature of OH-LIF isclearly identified in this excitation and transitions areassigned by comparing tthe experimental results toearlier spectral data23.24:4as well as to a simulatedspectrum (Fig. 2a) for the same initial conditions." Asseen from the spectra, at 32474.433 cm° (307.935 nm)the Qi(1) is the strongest line to pump in the portion ofthe Az(v'=0)←XI; (v"=0) OH band that isaccessible by the dye laser. The dissociated H2Ofraction is calculated in the limit of weak absorption(on;L<1) when Beer-Lambert law2 is equated to theenergy loss of the laser due to absorption for all levels: where in the i vibrational level, n; is the numberdensity of water,ndi isthe number density ofdissociated water, o; is the absorption cross section, E isthe laser pulse energy, h is Planck’s constant, v is thefrequency of light, L is the length of the HO regionthrough which the laser beam travels and A is the areaof the laser beam. At room temperature (300 K), all theH20 molecules are in the ground vibrational state withthree fundamental frequencies (Vi,v2, V) for threemodes:symmetricstretch(vi = 33651.7cm),symmetric bend (vz= 1595.0 cm ), and asymmetricstretch (Vs=3755.8 cm ). For 193 nm, the ground state (0, 0,0) absorption cross section is small,??8x10²cm’and leads to about 1% dissociation of HO vapor inroomair for)rtypicallexperimental conditions (8mJ/pulse, 20 ns, 0.5 mm diameter laser beam, ~0.205GW/cm irradiance). This relatively low (orders ofmagnitude) pulse energy (as compared to typicalnonlinear methods with ~50 GW/cmirradiance ) canbe very beneficial especially in measurements thatmight be conducted nearwindowsor inngasescontaining particles that might otherwise tend to breakdown (i.e. ionize) under the high laser irradinace levelsthat are required for excitation by nonlinear methods.For typical room air conditions of 24.4℃ (297.4 K) and40% RH, 1% dissociation of H O leads to a numberdensity of ~3x10⁵ OH molecules/cm(125 PPM). TheOH1 tag ilsSformedimmediatelybyy1193 nmphotodissociation from the ArF excimer laser pulse.The flow tag’s formation is limited only by the lasers’pulse width, which is ~20 ns. This short formation timemakes HTV amenable, but not limited, to high-speedflows, where the time delay between write and readlasers may be<1 us. The strength of the OH tag “read”signal dependson the initial mole fraction of H20 vapor present in theambient air (related to RH and temperature), the delaytime between the write and read laser pulses and themolecularr ddiffusion.thattakesplace at roomtemperature for the OH molecule. A series of singleshot images of the experimental flowfield (air jet) weretaken to address the effect of delay time on the OH tagsignal strength.l. The signal of a typical laser linesegment in the HTV grid was integrated and averagedat various times to determine the decay of the integratedsignal. This value is independent of the diffusion rate.A value for background (fairly constant from shot-to-shot) was subtracted from a corresponding total signalvalue to yield experimental points on the curve asshown in Fig. 3. OH Tag Lifetime Predictions To predict the lifetime of the low temperature OHtag, the CHEMKIN II thermodynamic database and theSENKIN chemical kinetics solver are used with an airchemistry mechanism consisting of a set of 109reversible reactions (27 species) as previously shown.A constant pressure, adiabatic system was simulatedthat initially contains equilibrium humid air mixture towhichis1S; addedaa certainnamount of OH and Hphotoproducts. As calculated above, ~1% of ambientH2O vapor ((40%1rIelative humidity, 2977K) isphotodissociated into ~125 PPM of OH and H atoms bythe ArF write laser. Fig. 3 shows a comparison betweenthe SENKIN predictions for OH concentration (eitherwith 0- or 200 PPM of initial O atoms concentration)and experimentally determined OH tag signal intensitythat is both normalized and plotted as a function of delay time between the write and read lasers. The ratesof two significant OH recombination pathways: were modified from their previous values, to bettermodel both low- and high-temperature air situations.With no O atoms, OH is rapidly depleted primarily viathe chain sequence: where a fast formation of HO2 (R3) leads to OHdepletion (R4). However, a small amount of O atoms(200 PPM) will be present based on the expected~0.05% O2 dissociation by the broadband ArF laser.With the O atoms present, there is a much bettercomparison between the simulation and experiment.The initial O atom concentrations were varied over awide range (100-4100 PPM) of input conditions to theSENKIN solver without any appreciable changes in theOH depletion rates. The initial presence of O atomsdepletes HO2 and additionally regenerates OH through: Slight underprediction of the experimental resultsby the mechanism could be attributed to uncertainties inboth the initial conditions as well as rate constantparameters, notably for R4, which has the greatestuncertainty. Detailed description of the air chemistrymechanism and its reactions (with the appropriatereactions references) is given elsewhere.9 To determine the effect of temperature on the OHtag lifetime, the OH time histories were simulated forseveral different initial temperatures (see Fig. 3 inset),ranging from 297 K to 1500 K, where constant initialmole fractions ofOH are assumed (125 PPM) and with200 PPM of O. While low temperatures (<500 K) haveminimal effect on initial rise in OH concentration, it isobservedthat at higherr temperatures(>600)K)additional amounts of OH are produced at very shortdelay times (<10us).TThese results agreewithpreviously demonstrated SENKIN simulations of high-temperature combustion environments. Alltemperature cases tend to fall back to the equilibriumOH concentrations (not shown) as delay time increasessignificantly especially for the higher temperaturecases. The inset in Fig. 3 shows results only for the first1000us of OH time histories since typical HTVwrite/read delay times are in that range (0-100 us). To determine the lifetime of the OH tag in thehydrogen-air combustion hot products, the SENKINchemical kinetic solverwwas used to calculate thechemical composition as aa function of time underconstant enthalpy and pressure conditions.Theseconditions would be typical of those encountered in theatmosphere or in test facilities. Here we use theCHEMKINlibrary and aashortenedhhydrogen-airmechanism from GRIMECH 2.11 that consisted of 69reactions.27,28 Since the calculations are in a carbon freeenvironment, the carbon bearing reactions were notconsidered. Thecomplete reactionmechanismis29published elsewhere. The results of the SENKIN calculations for HOphotodissociation in lean and rich streams of H-aircombustion products at atmospheric pressure (1 atm)were used to study the OH lifetimes in these flames.Here we have assumed the initial amount of 1% HzOphotodissociation. For a typical laser beam (15 mJ, 0.5mm dia.) this is a conservative estimate. For timeslonger than 10 ms, the initial OH recombines to itsequilibrium concentration. For both the lean flames (=0.43, and 0.69), the OH tag is produced very quickly(20 ns) and lasts for ~1 ms. In these lean flames theconcentration of the OH is enhanced over the amountinitially produced by the photodissociation of H2O. Theincrease of OH (in the short time scale of 1 ps) isattributed mostly to the reactions: while the depletion pathways for OH are through thereactions: In very fuel rich conditions, the excess H2 fuel quicklyconsumes OH through (R10) forming water and atomichydrogen: A detailed description of the chemical kinetics and ofthe analyses is published elsewhere.19,28 HTV Imaging in an Air Jet Figure 4a shows the experimental schematic andFig. 5 shows HTV flow tagging results in an air jetcreated by a small nozzle (1.8 mm dia.) emanatingvertically into a quiescent surrounding environment(Fig. 1). Figure 5a shows a typical instantaneous image of the HTV grid for a write-read delay of 0 us, thusproviding initial locations for the grid lines’ crosspoints in the flow. Figure 5b shows another image ofthe same HTV grid displaced after a 2 us delay. This isfor a location immediately downstream from thenozzle’s exit (10 mm) near the jet’s centerline. Basedon the initial and final locations of these grid lines andthe write-read time delays, one can establish velocityvector profiles. The images were taken in an under-expanded jet with velocities as high as 230 m/s (in thecenter, closest to the jet’s exit). Slight variations in taglines’ intensity are attributed to unequal splitting oflaser beam, non-uniform intensity profile of the dye andexcimer lasers, system alignment, and possible beamtransmission problems. The darker “dots”were imagesof elastically scattered particles in the flow mostly dueto Lorentz-Mie scattering close to the pump wavelength(~308 nm) of the read dye laser. Since the fluorescenceemission is mostly from v' =0 due to the (0<0)pumping of OH at ~308 nm, the fluorescence light isvery close to the laser wavelength. This elastic particlescattering can be minimized (or even avoided) by using,say, Az(v'=1)←XII; (v"=0) OH excitation at~285 nm to read the HTV grid, and imaging only(1→1) emission at 308 nm. The HTV grids shown in Fig. 5 were analyzedusing commercial optical tracking software (DaVis 6.0Stereo PIV/PTV, by LaVision, GmbH). The velocityfield results are shown in Fig. 6. This method relies ona short-pixel defined structure that uses iterative multi-grid passestogether with deformed interrogationwindows adjusting to the local velocity gradient. Thisenhances the robustness and precision of the methodespecially in high gradient flowfields. Another featureis the use of FFT-correlations with short evaluationtimes. Domain transformation is replaced by first-orderapproximation of the local displacement distribution.This results in matching between regions where thecontinuum deformation is accounted for, in terms oftranslation, rotation, shearing, anddilatation.1. Inaddition, the displacements are locally independent,which means that a single “bad"velocity vector can beeliminated at a later time. Since this method correlatesflow structures rather than intensity gradients, one canreally compute the true (projected) 2-D flow fielddisplacement. The method can also track the gridlinesbetween the grid’s crossing points to provide additionalvelocityy vectors. Detailedddescriptionsof similaralgorithms have been published elsewhere.30.31 rNotethat the optical tracking method can give spurious dataas shown in Fig. 6. The software is tracking the dustparticles in the air as shown in the images in Fig. 5.This is due to the elastic particle scattering problem asalready discussed. HTV Imaging in H2-Air Flames Figure 4b shows tthe experimental schematic ofHTVmeasurements in anH-airr fflameewhoseinstantaneous images are shown in Fig. 7. A Henckenmulti-element fuel flame diffusion burner (50 mm x 50mm) was used where premixed H2 and air were flowedin the vertical direction. A short delay time (10 us)between the 193-nm write ArF excimer and the 308-nmread dye laser was used in a lean flame (=0.39).Figure 7a shows the undisplaced 7 x 7 grid and itsdisplacement is shown in Fig. 7b. The images weretaken at ~45 mm above the burner’s surface, along itscenterline. The burner’s reacting flowfield is wideenough to show the complete 7 x 7 HTV grid linesresulting in 49 separate unambiguous cross points. Theclean (filtered) flow from the Hencken burner has noparticles that could cause Lorentz-Mie scattering asseen in the low temperature HTV images in Fig. 5. Theimages from Fig. 7 were analyzed using again theDaVis 6.0 software and the resulting displacementvectors are shown in Fig. 8. If one considers the delaytime (10 us) between the two images, then a typicalvelocity vector can be computed (as shown in lower leftcorner in Fig. 8). A correlation size of 128 x 128 pixelswas used with a 75% overlap. Curvature effect can beseen on both sides of the axial line of the burner andcould be attributed to possible temporal flow changes.The background color shows the displacement in thehorizontal x-axis. Displacements in the negative x-dir.are shown in blue, and displacements in the positive x-dir. are shown in red. Conclusions A tunable 193-nm ArF excimer laser and an Nd-YAG pumped tunable 308-nm frequency-doubled dyelaser are used for HTV flow tagging in room air- andhigh-temperature reacting flowfields. New compactgrid forming optics are developed that form a 7 x 7optical grid. The ArF excimer produces a grid of OHmolecules that is displaced by the interrogated flowfieldand imaged by the dye laser. The OH grid is created viaa single-photoyaTLn process that yields very long lines (>50mm),compared to thosegenerated by non-linearprocesses. The dye laser accesses the strong Qi(1) lineat 32474.433 cm (307.935 nm) in the Az(v'=0)+XI (v"=0) OH band that compensates for therelativelyweak 193-nm rphotodissociationcross-sections of ground vibrational state H20. A multilinegrid is used to demonstrate the feasibility of multipointnonintrusive instantaneous velocity measurements atvarious temperatures and velocities. The HTV methodcould be viewed as the nonintrusive instantaneousmolecular diagnostic method of choice in either low- orhigh-temperature flowfields at atmospheric or higherpressures with variable flow speeds. Acknowledgements The authors gratefully acknowledge the support ofNASA-Glenn (grant NAG3-1984, Dr. R. Seasholtz,technicalmonitor),BMDO-ARO (DURIPawardDAAG55-98-1-0197, Dr. D. Mann, technical monitor),and AFOSR (DURIP award F49620-99-1-0120, Dr. J.Tishkoff, technical monitor). The authors thank ArnoldEngineering Development Center (AEDC), Tennessee,for use of their ArF excimer laser and for their supportunder Sverdrup/AEDC Group Contract # T01-55. Thetechnical assistance of Dr. B. Wieneke (LaVision,GmbH) with image processing is gratefullyacknowledged. ( References ) ( 1. Doebelin. E. O. Measurement S ystems:Applications S and Design. McGraw-Hill , New York, 1996. ) ( 2 Measures, R. M., J. Appl. Phys. 39,5232 (1968). 3 ) ( Zimmermann, M . an d Mi l es, R. B. , Appl. Ph y s.Lett. 37, 885 (1980). ) ( 4. McDaniel,J. C., Hiller, B., and Hanson, R. K., O pt.Lett.8,51 (1983). ) ( 5. Marinelli, W., Kessler, W. J., Allen, M . G., Davis,S, J., and Arepalli, S . , AIA A Paper 91-0358, 29" AIAA A e rospace Sc i ences Me e ting and Exhibit, Reno,NV (1991). ) ( 6. Paul, P. H., Lee, M. P., and Hanson, R. K., Opt. Lett. 14, 417 (1989). ) ( 7. Seasholtz , R . G ., Z upanc, F . J . , a nd S c hneider, S. J.,J. Prop. Power 8, 935 (1992). ) ( 8. Forkey, J . N., F inkelstein, N. D ., Lempert, W. R . , and Miles, R. B., AIAA J. 34,442 (1996). ) ( 9. Ribarov, L. A ., W ehrmeyer, J. A., Pitz, R. W., andYetter, R. A.,Appl. Phys. B. 72, 17 5 ( 2 002). ) ( 10. Santoro, R. J., Pal, S., Woodward, R . D., and Schaaf, L. , AIAA Paper 2001-0748, 39h AIAA Aerospace S ciences M eeting and E x hibit, R eno,NV (2001). ) ( 1 1 . Maurice, M. S., AIAA J., 30,376 (1992). ) ( 12. Mazumder, M. K. and Ki r sch, K. J., Appl. Opt. 1 4, 894 (1975). ) ( 13. I Durst, F . , Melling, A., and Whitelaw, J J . . H. Principles of L a ser-Doppler Anemometry. Academic Press, London, U . K ., 1976. ) ( 14. G C omez, A. and Rosner, D. E., Comb. Sci. T echn.89,335(1993). ) ( 15. Talbot, L., Cheng, R . K . , Shefer, R . W . , and Willis,D. R., J . F l . Mech. 101 , 737 (1980). ) ( 16. B oedecker, L . R., O pt. L ett. 14:473 (1989). ) ( 17. Miles, R. B. and Lempert, W . R., Annu. R ev. F luidMech.29,285 (1997). ) ( 18. Ribarov, L. A., Wehrmeyer, J. A ., B atliwala, F .,and P itz, R. W., AIAA J . 37,708 (1999). ) ( 19. W V ehrmeyer, J . A., R ibarov, L. A., O guss, D. A., and Pitz, R. W., Appl. Opt. 38, 6912 (1999). ) 20. Pitz, R. W., Wehrmeyer,J. A., Ribarov, L. A.,Oguss, D. A., Batliwala, F., DeBarber, P. A.,Deusch, S., and Dimotakis, P. E., Meas. Sci. Tech.11,1259 (2000). 21. Seitzman, J. M. and Hanson, R. K., AIAA J. 31,513 (1993). 22. van Hemert, M. S. and van Harrevelt, R., PrivateCommunication (1999); also see J. Chem. Phys.114, 9453 (2001). 23. Bass, A. M. and Broida, H. P., Nat. Bureau ofStand. Circ. 541,1(1953). 24. Dieke, G. H. and Crosswhite, H. M., J. Quant.Spect. Radiat. Trans. 2,97 (1962). 25. LIFBASE, Vers. 1.6, (www.sri.com/cem/lifbase). Figures Fig. 1. Schematic of the HTV experimental system. Read Laser Wavelength, cm"' Fig. 2. Room temperature (300 K) HTV LIF excitationspectra showing the strong Qi(1) transition of the A(v'=0)←XII (v"=0) OH band. Curves arenormalized to the Qi(1) line showing(a) simulation byLIFBASE25(assumed::1cmlinewidth, Gaussianlineshape), and, (b) experimental spectrum. 26. Eckbreth, A. C. Laser Diagnostics for CombustionTemperature and Species. Gordon and Breach,Amsterdam, 1995. 27. A.E. Lutz, A. E., Kee, R. J., and Miller, J. A.,Sandia Report: SAND87-8248-UC-4 (1988). 28. GRIMECH Vers. 2.11, Release 11/3/95, 29. Wehrmeyer, J. A., Ribarov, L. A., Oguss, D. A.,and Pitz, R. W., AIAA Paper 99-0646, 37* AIAAAerospace Sciences Meeting and Exhibit, Reno,NV(1999). 30. Fincham, A. and Delerce, G., Exp. in Fluids[Suppl.]29,13(2000). 31. Scarano, F. and Reithmuller, M. L., Exp. in Fluids[Suppl.] 29,51 (2000). Fig. 3.. AverageHTV1intensityand(OHsignaconcentrations (SENKIN27predictionsISwith--aandwithout O atoms) curves as function of delay timebetween write and read lasers. Inset shows OH timehistories (125 PPM of initial OH and 200 PPM of initialO mole fraction) at constant pressure (1 atm) andvarious initial temperatures. Fig. 4. Schematics (not to scale, but with properdimensions) of experimental HTV measurements in (a)small air jet nozzle, and (b) Hencken burner for theimages shown in Fig. 5 and Fig. 7 respectively. Fig. 5. Single-pulse OH fluorescence images ofa 7x7optical grid from H20 photodissociation taken in under-expanded high-speed air jet. Write/read delays: (a) 0 us,(b) 2 us. Dimensions: 41 mm length, 27 mm height inboth images. HTV in ROOM TEMPERATURE FAST AIR FLOW. Fig. 6. Analysis of HTV images shown in Fig.5 toyield velocity field data. The HTV grids were analyzedusing the IDaVis 6.0 stereo PIV/PTVsoftware(LaVision, GmbH). Fig. 7. Single-pulse instantaneous HTV images of the7x7 optical grid taken in a lean (q=0.39)H2-Air flameissuing vertically in both images. Write/read delays: (a)0 us, (b) 10 us. Fig. 8. Analysis of HTV images shown in Fig. 7 toyield velocity field data. The HTV grids were analyzed(correlation size: 128 x 128 pixels, 75% overlap) usingthe DaVis 6.0 stereo PIV/PTV software (LaVision,GmbH). merican Institute of Aeronautics and Astronautics
确定
还剩5页未读,是否继续阅读?

产品配置单


北京欧兰科技发展有限公司为您提供《羟基中多线羟基标志测速技术用于反应和非反应实验流体检测方案(粒子图像测速)》,该方案主要用于其他中多线羟基标志测速技术用于反应和非反应实验流体检测,参考标准--,《羟基中多线羟基标志测速技术用于反应和非反应实验流体检测方案(粒子图像测速)》用到的仪器有德国LaVision PIV/PLIF粒子成像测速场仪、Imager sCMOS PIV相机、PLIF平面激光诱导荧光火焰燃烧检测系统
推荐专场


CCD相机/影像CCD
更多


相关方案
更多
该厂商其他方案
更多