


方案详情
文
Vapor adsorption is an important process influencing the
migration and the fates of many organic pollutants in the
environment. In this study, adsorption of ethylene glycol (EG)
vapor onto single crystal R-Al2O3 (0001) and fused SiO2
(amorphous) surfaces was studied with sum frequency
generation spectroscopy, a well-suited surface specific
technique for probing interfacial phenomena at the molecular
scale. Air-aqueous EG solutions were also investigated
to compare to the adsorption at the air-solid interface in
the presence of water vapor. The gauche conformer of
EG molecules dominates the air-aqueous EG solution
interface, and EG molecules act as hydrogen acceptors
at the air-liquid interface. Water and surface hydrophilic/
hydrophobic properties play important roles for the
adsorption of EG onto silica and alumina surfaces. The
adsorbed EG molecules interact in different ways at the two
different oxide surfaces. EG molecules weakly physisorb
onto the R-Al2O3 (0001) surface by forming relatively weak
hydrogen bonds with surface water molecules. On the
silica surface, the suppression of the silanol OH stretching
peak indicates that EG molecules form hydrogen bonds
with silanol OH groups.
Introduction
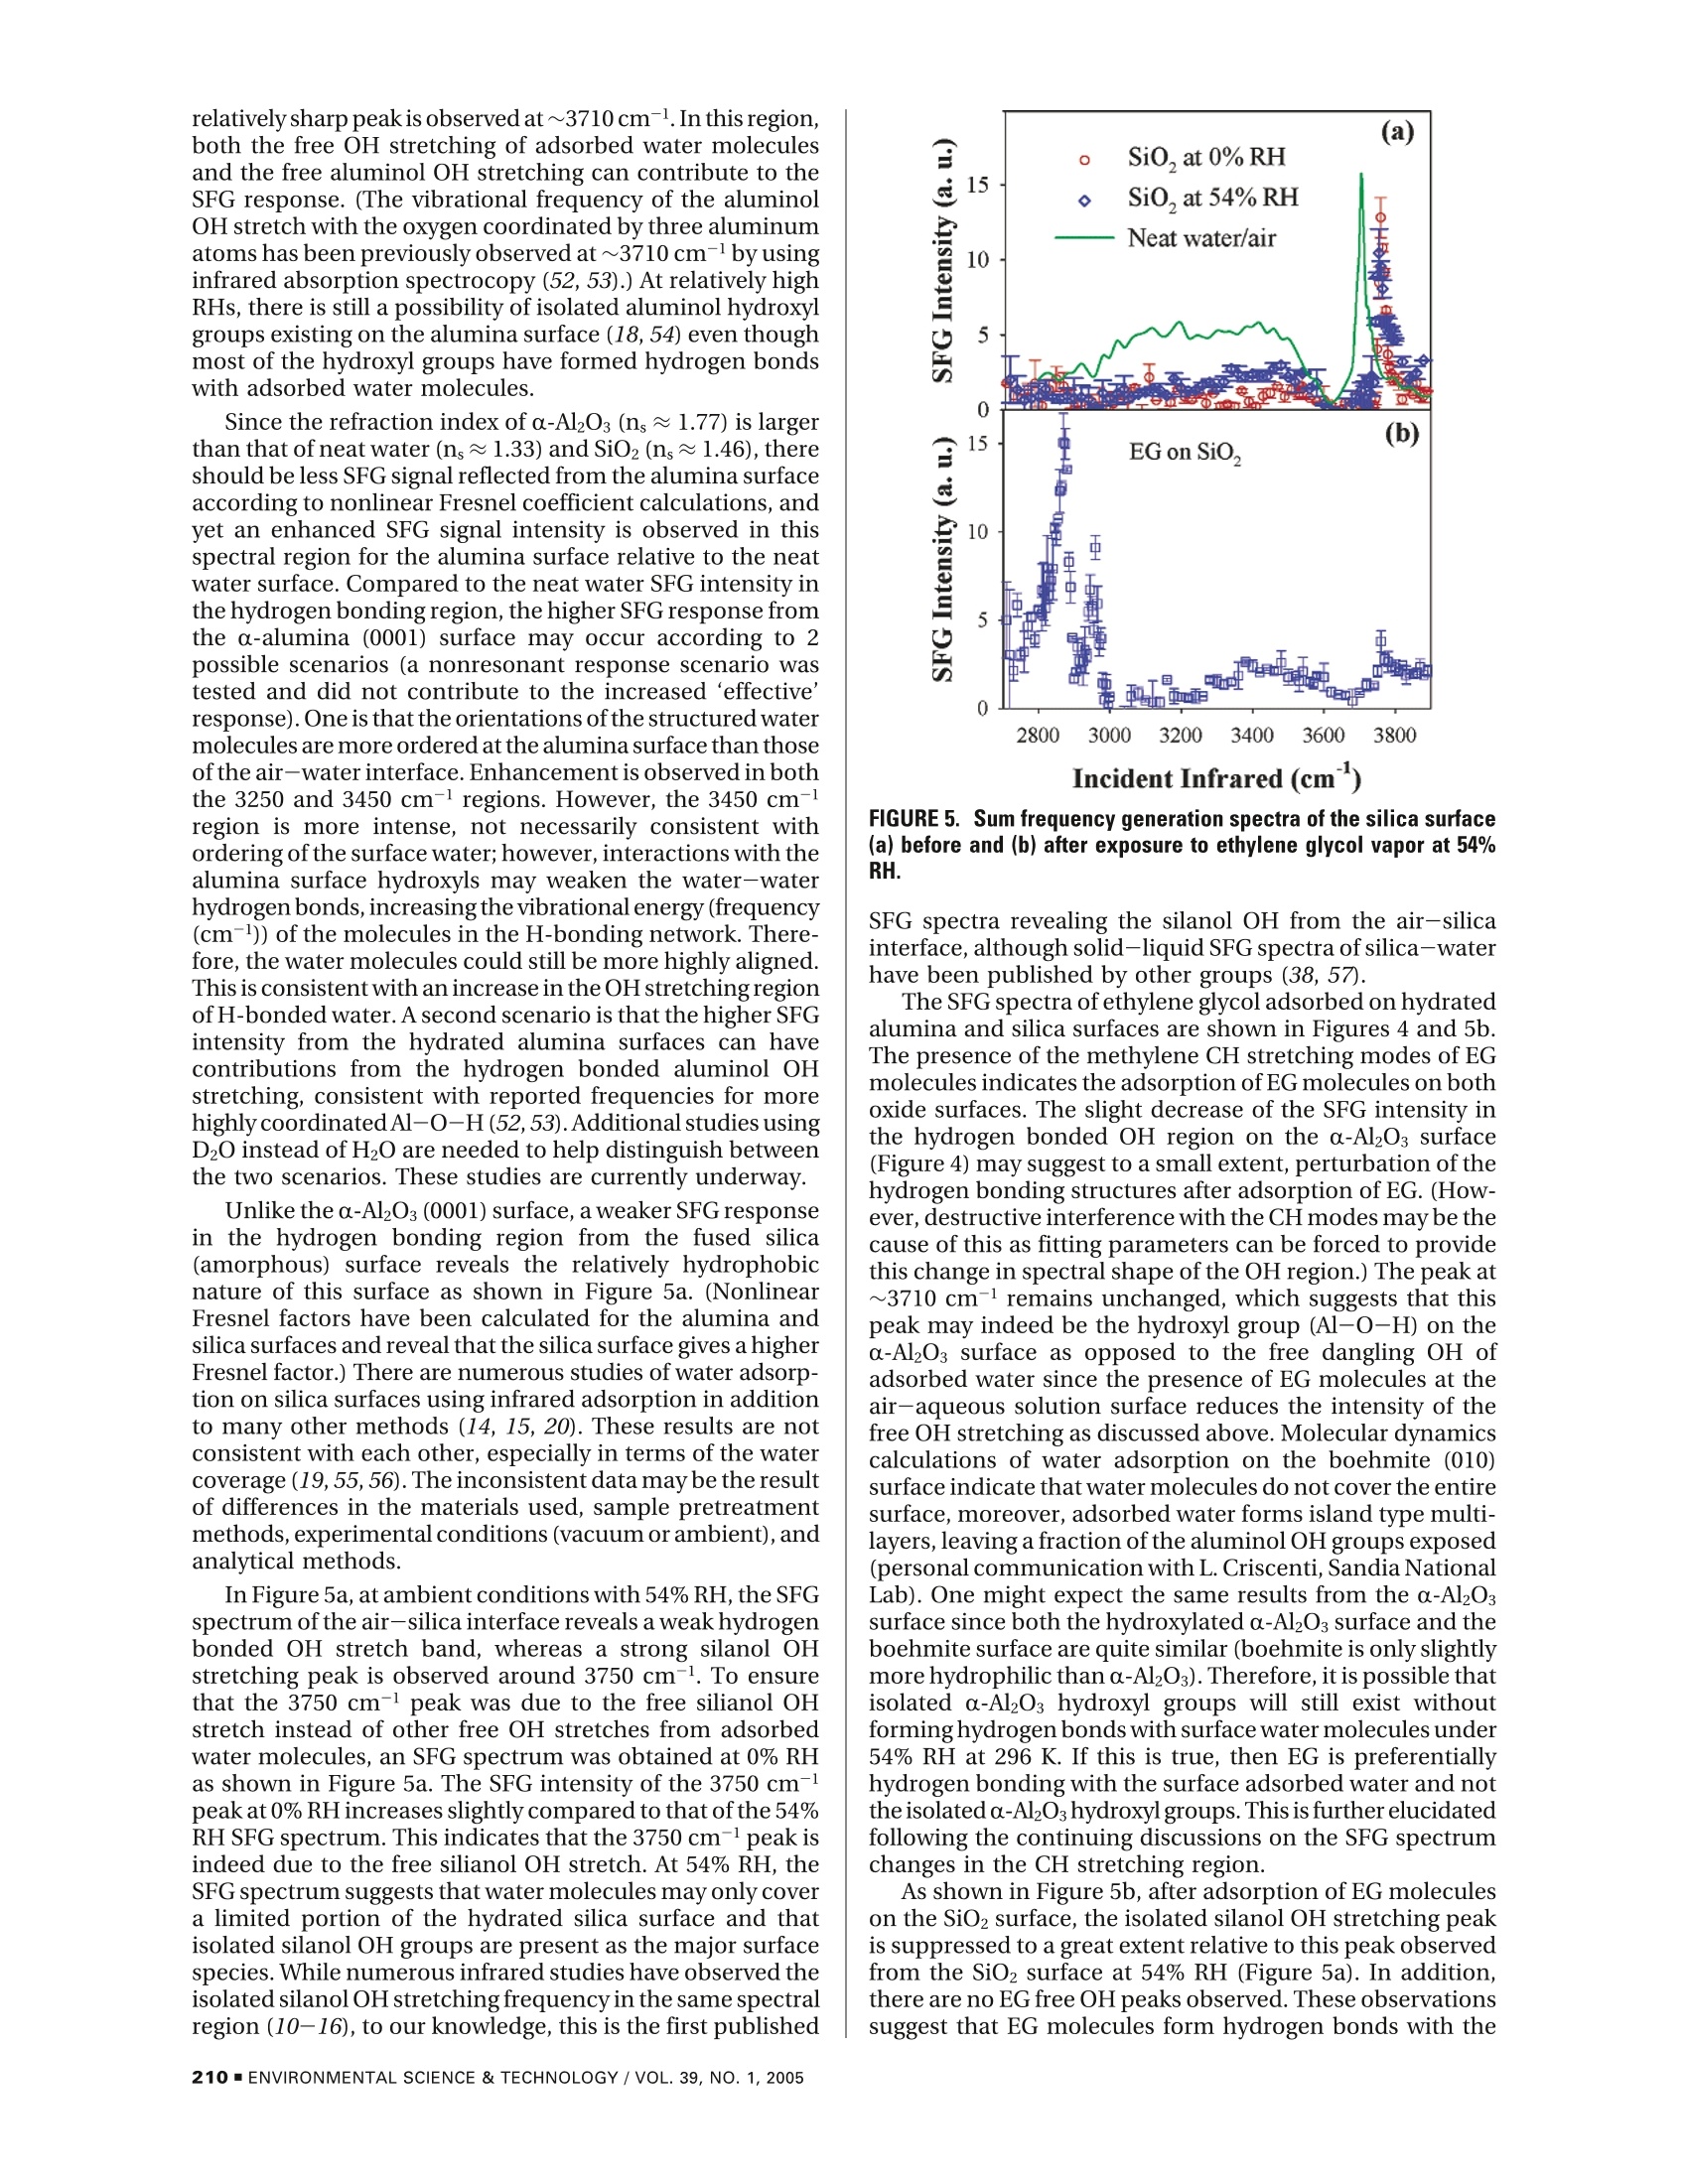
方案详情

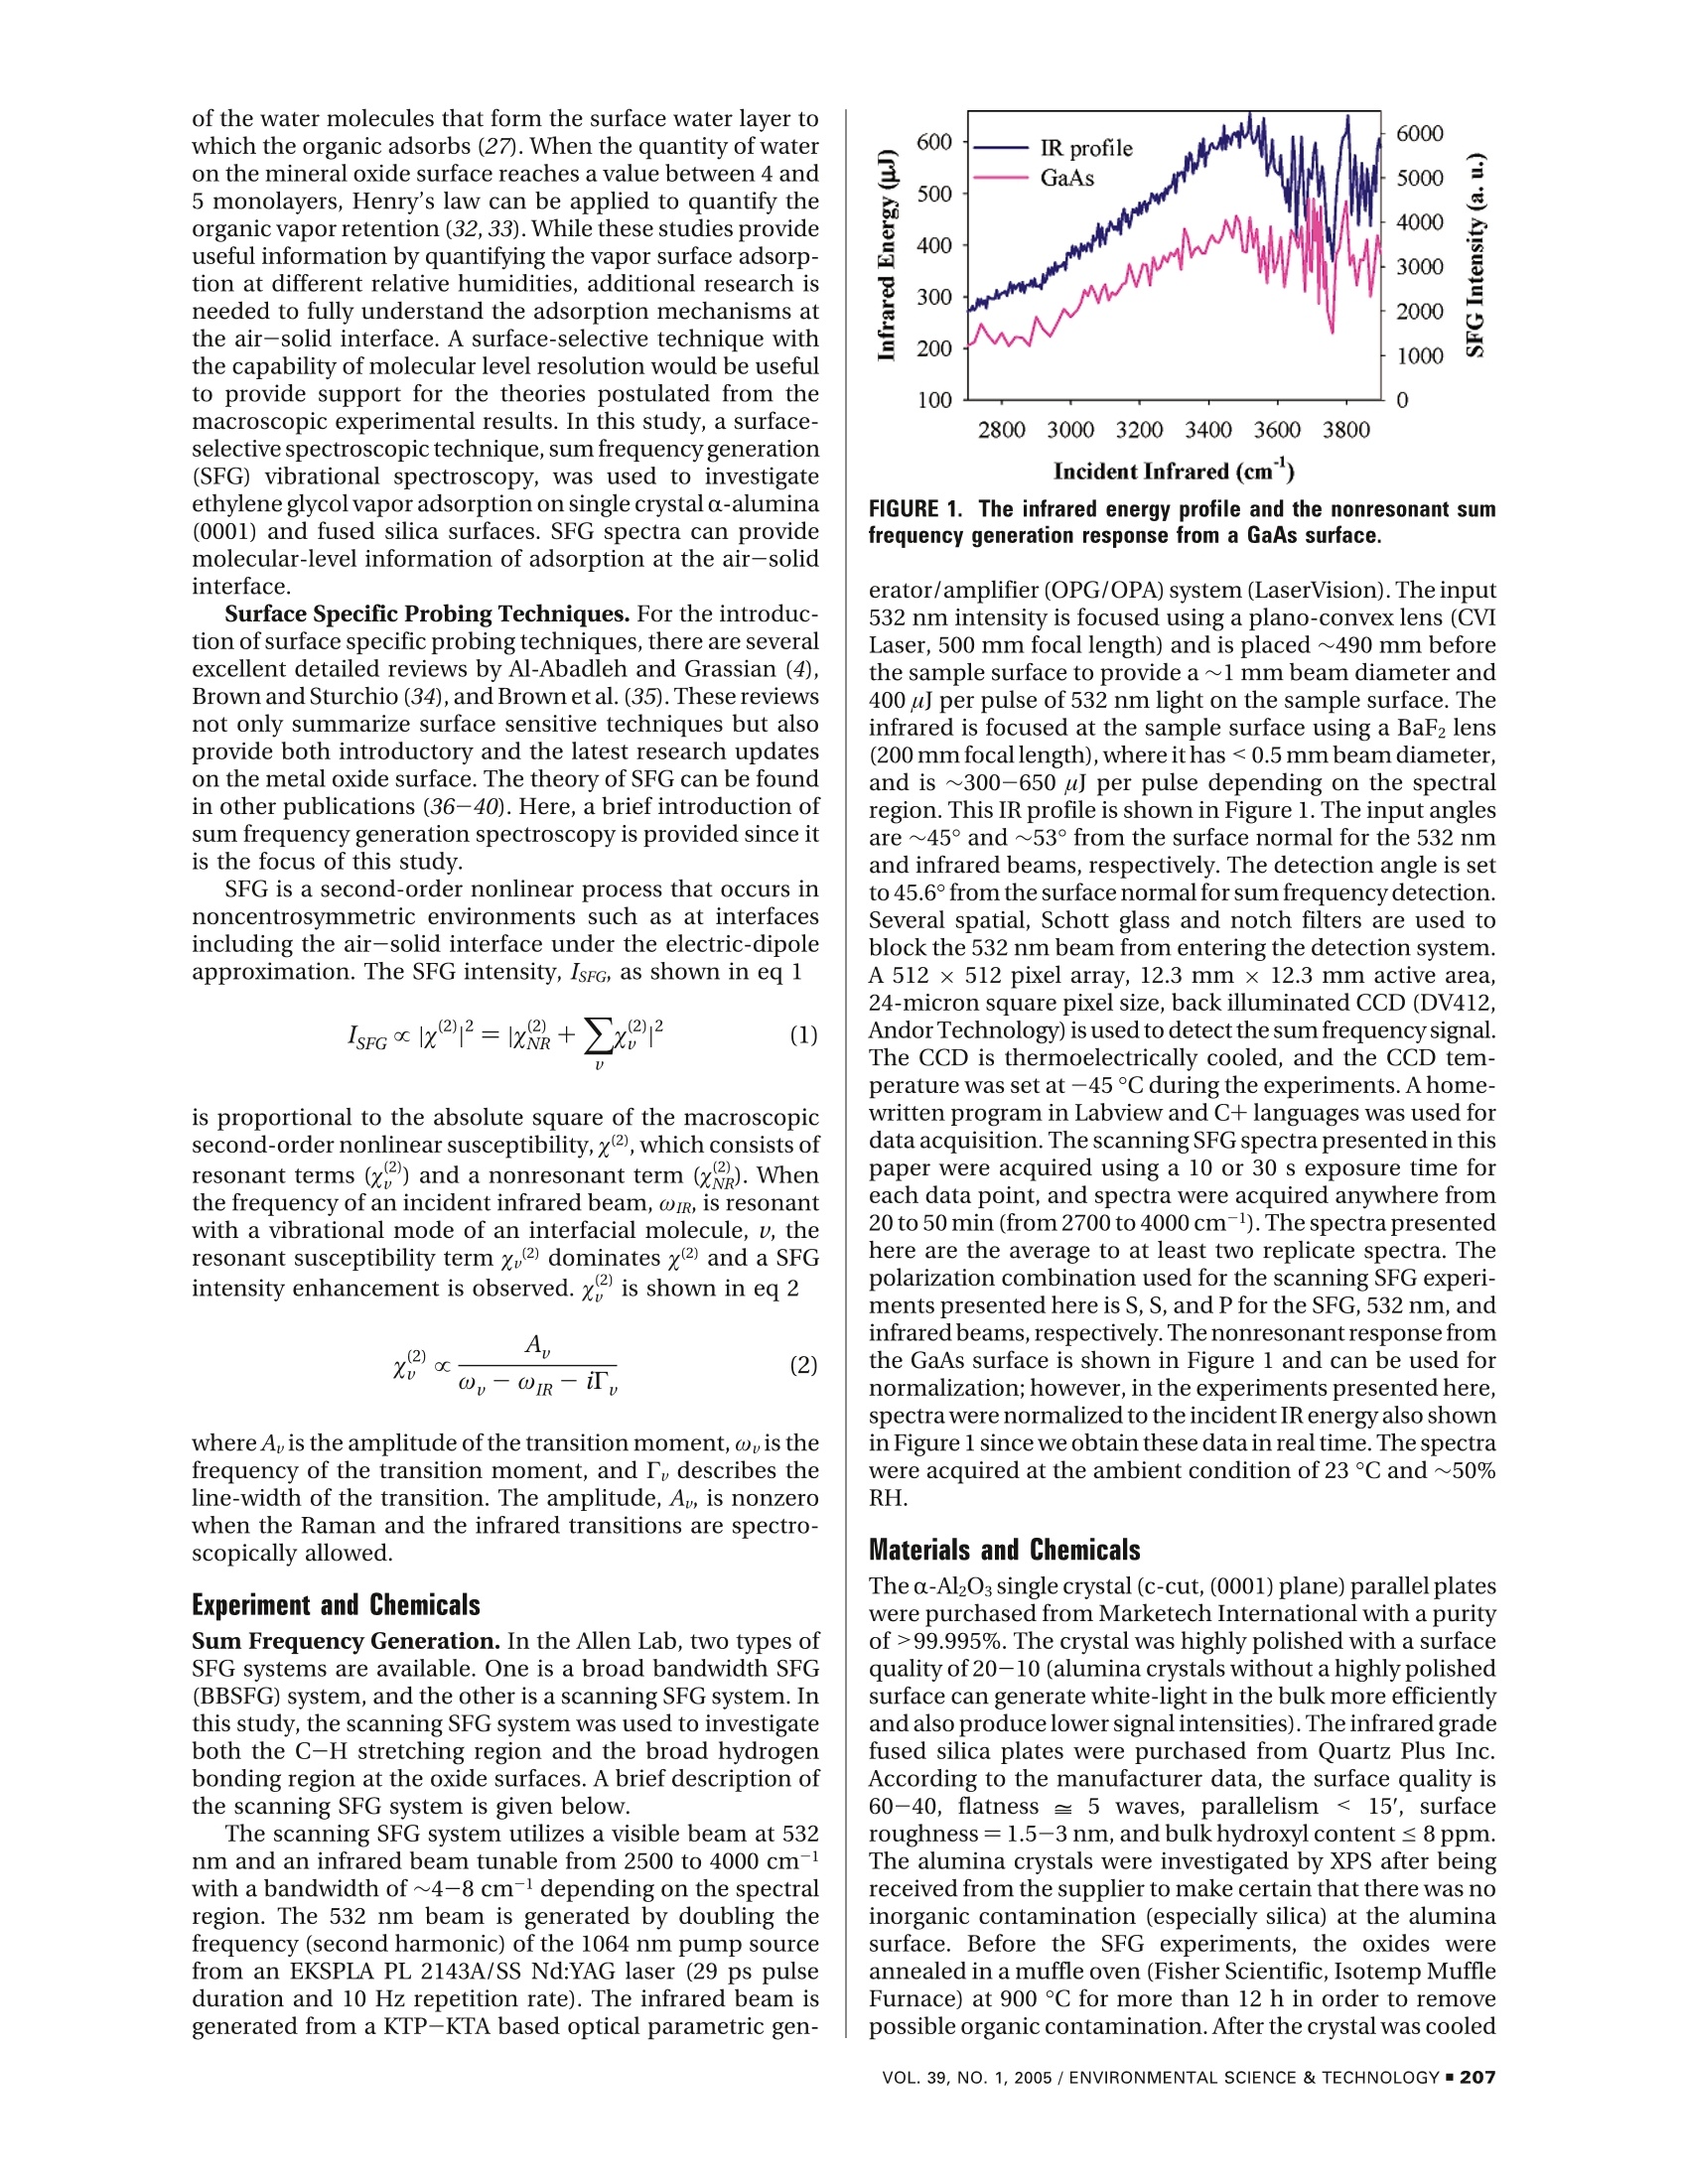
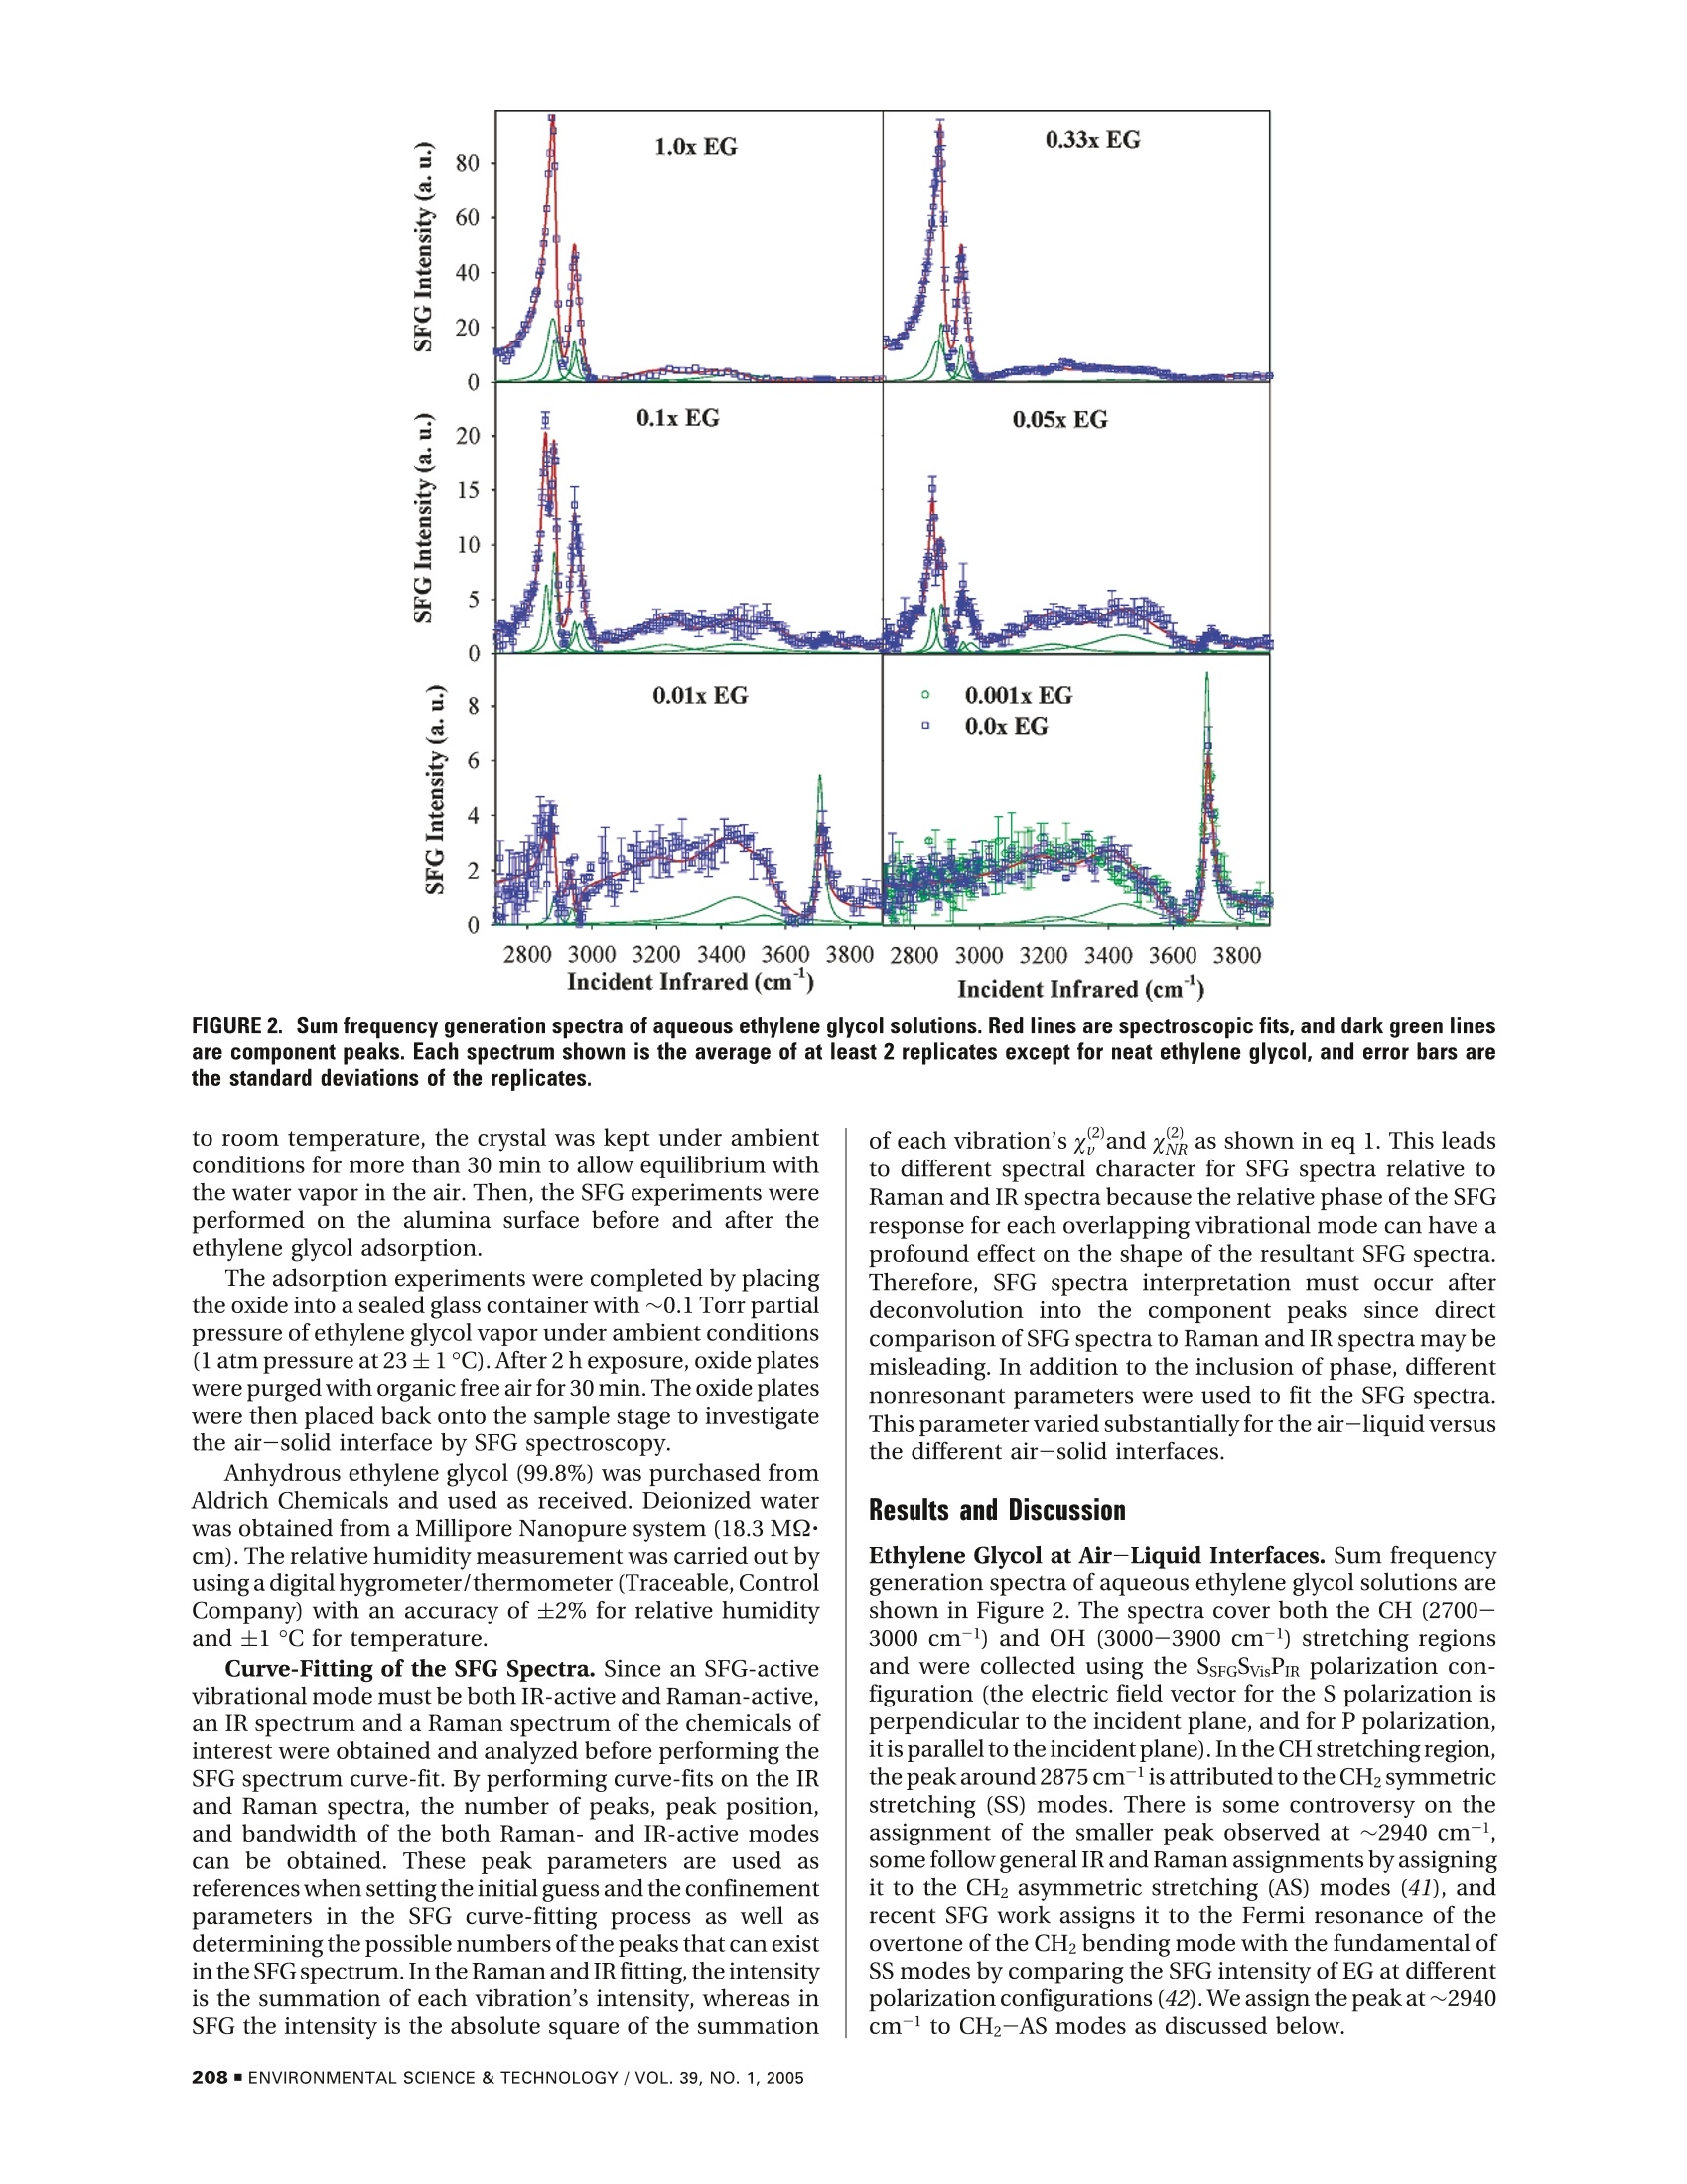
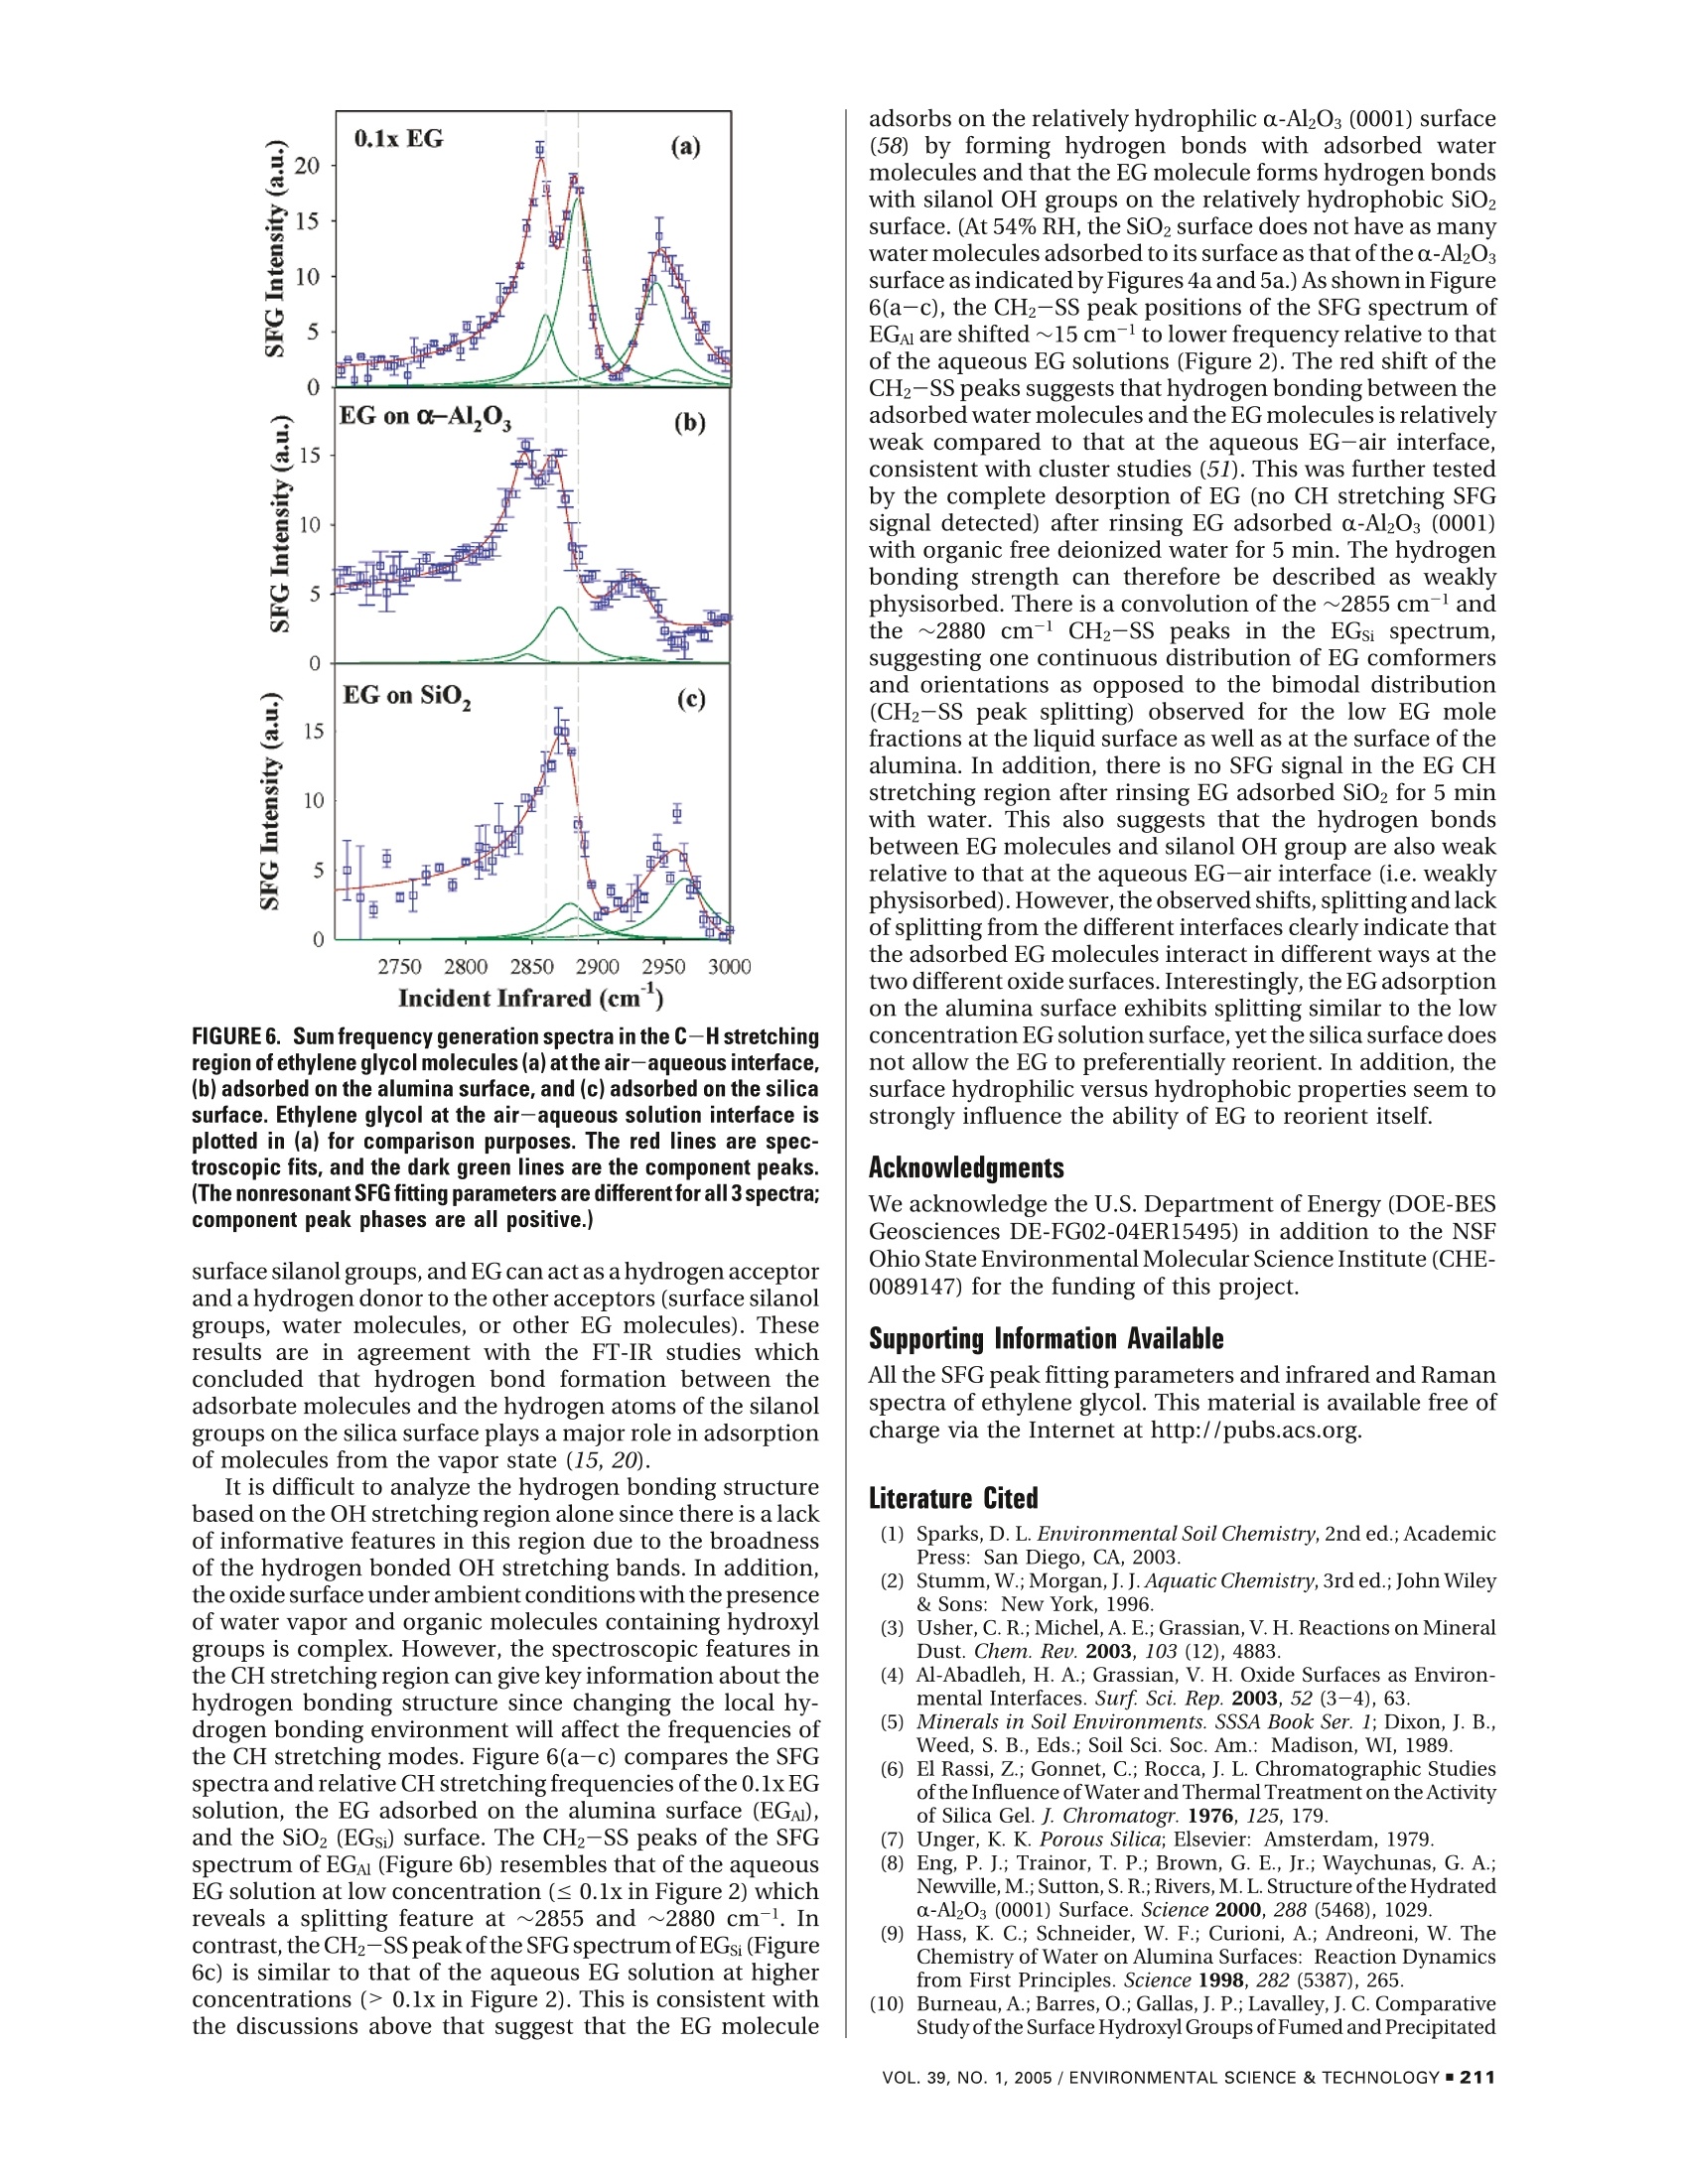
Environ. Sci. Technol.2005, 39,206-212 Adsorption of Ethylene Glycol Vaporon C-Al203 (0001) and AmorphousSiO2 Surfaces: Observation ofMolecular Orientation and SurfaceHydroxyl Groups as Sorption Sites DINGFANGLIU,GANGMA,MAN XU,AND HEATHERC.ALLEN*Department of Chemistry, The Ohio State University,100 W. 18th Avenue, Columbus, Ohio 43210 Vapor adsorption is an important process influencing themigration and the fates of many organic pollutants in theenvironment. In this study, adsorption of ethylene glycol (EG)vapor onto single crystal α-Al203 (0001) and fused SiO2(amorphous) surfaces was studied with sum frequencygeneration spectroscopy, a well-suited surface specifictechnique for probing interfacial phenomena at the molecularscale. Air-aqueous EG solutions were also investigatedto compare to the adsorption at the air-solid interface inthe presence of water vapor. The gauche conformer ofEG molecules dominates the air-aqueous EG solutioninterface, and EG molecules act as hydrogen acceptorsat the air-liquid interface. Water and surface hydrophilic/hydrophobic properties play important roles for theadsorption of EG onto silica and alumina surfaces. Theadsorbed EG molecules interact in different ways at the twodifferent oxide surfaces. EG molecules weakly physisorbonto the a-Al203 (0001) surface by forming relatively weakhydrogen bonds with surface water molecules. On thesilica surface, the suppression of the silanol OH stretchingpeak indicates that EG molecules form hydrogen bondswith silanol OH groups. Introduction Vapor adsorption onto oxide surfaces occurs in unsaturatedsoils and on mineral aerosols in the atmosphere. Vaporadsorption influences the contaminant migration and fatein the environment and can modify surface properties of themineral particles, such as reactivity, hydrophobicity/hydro-philicity,and surface charge (1,2). In the troposphere, mineralaerosols can act as reactive surfaces with trace organic orinorganic atmospheric gases. The heterogeneous reactionsbetween mineral aerosol and organic gases are critical forgoverning the trace atmospheric gas budget (such as O3) (3,4). Among the metal oxides studied, silica and alumina arethe most extensively studied because of their ubiquitouspresence in soil and mineral aerosols (3-5). It is well-known that the reactivity of silica and aluminasurfaces is strongly influenced by the degree of surfacehydroxylation. For example, small quantities of H20 inchromatographic columns are known to have a large effecton the specificity of silica powders and surfaces to polarchemicals (6, 7). Both silica and alumina surfaces are quickly ( * Corresponding authore-mail: allen@chemistry.ohio-state.edu. ) hydroxylated after contact with water vapor, and hydrationalso modifies oxide surface structures. The hydrated oxidesurface structure is not the perfect termination of the oxidebulk structure. The clean a-alumina (0001) surface is Al-terminated and is significantly relaxed relative to the bulkstructure under ultrahigh vacuum (UHV) conditions,whereasthe fully hydrated surface is oxygen terminated, and thesurface structure is an intermediate between a-Al2O3 andy-Al(OH) (8). Ab initio molecular dynamic calculations revealthat during the hydration, the coordinated unsaturatedsurface Al ions provide strong Lewis acid sites for H2Oadsorption, and dissociation of adsorbed H2O generates twotypes of surface hydroxyl groups: OadsH andO,H (Oads, wateroxygen; Os, surface oxygen) (9). Numerous studies have beencompleted on the thermal stability of various types ofhydroxylgroups on silica surfaces (10-16). Theoretical studies havefound that the formation of a Si-OH group on quartz surfacesdue to dissociative adsorption ofwater is preferred and causesa significant lowering of the surface energy (17). Underambient conditions, many researchers have demonstratedthat silica and alumina surfaces are covered with severalmonolayers of water molecules by forming hydrogen bondseither between surface hydroxyl and water molecules orbetween individual water molecules (4, 14, 15, 18, 19).Foradsorption of nonionic organic vapor on hydroxylatedmetal oxide surfaces, there are two main types ofinteractionforces: van der Waals (dispersion force) interaction beinguniversal for many compounds and the interaction withformation of hydrogen bonds between the surface hydroxylgroup and adsorbed molecules (15,20).Many IR studies havebeen dedicated to the investigation of hydrogen bonds ofsilanol groups upon adsorption. In addition, IR spectroscopyunder various temperature conditions has been utilized toinvestigate the adsorption properties of organic compoundson oxide surfaces for various applications (11, 14, 15, 20-26), where experiments were typically carried out in con-trolled environmental conditions such as vacuum, absenceof water vapor after hydroxylation or hydration, etc. Basedon hundreds of studies of organic adsorption on the silicasurface, it has been concluded that hydrogen bond formationbetween electronegative atoms or s electrons of adsorbatemolecules and the hydrogen atoms of the silanol groups playsa major role in adsorption of molecules from the vapor state(15, 20). The sorption of organic vapor to mineral oxide surfacesunder ambient environmental conditions has been shownto follow these mechanisms (27, 28): (1) Organic vaporadsorbed to the mineral oxide surface. The organic vaporcan be physically adsorbed and/or reacted with the surfacealuminol or silanol group.(2) Organic vapor adsorbed within/on the surface water film that is adsorbed on the mineralsurface.(3) Organic vapors are solvated into the adsorbedwater layers (a quasi-liquid water layer). Using gas chro-matographic methods, Goss et al.(27-31)measured surface-air adsorption constants of a diverse set of 50 organic vaporson silica and alumina surfaces at different relative humidities(RH) and found that, comparing with the adsorptionconstants at different relative humidities,adsorbed water onthe oxide surface plays a crucial role on the organic adsorptionbehavior. Mechanism 1 only occurs on surfaces that werenot completely covered with water (28). With complete waterlayer coverage, mechanism 2 dominates for all the organicsstudied except for polar molecules such as methanol or smallorganic acids (28, 29). At very high water relative humidities(90-100%), an increase of adsorption was observed, and itwas speculated that this is due to a change in the orientation SFG is a second-order nonlinear process that occurs innoncentrosymmetric environments such as at interfacesincluding the air-solid interface under the electric-dipoleapproximation. The SFG intensity, IsFG, as shown in eq 1 of the water molecules that form the surface water layer towhich the organic adsorbs (27). When the quantity of wateron the mineral oxide surface reaches a value between 4 and5 monolayers, Henry's law can be applied to quantify theorganic vapor retention (32, 33). While these studies provideuseful information by quantifying the vapor surface adsorp-tion at different relative humidities, additional research isneeded to fully understand the adsorption mechanisms atthe air-solid interface. A surface-selective technique withthe capability of molecular level resolution would be usefulto provide support for the theories postulated from themacroscopic experimental results. In this study, a surface-selective spectroscopic technique, sum frequency generation(SFG) vibrational spectroscopy, was used to investigateethylene glycol vapor adsorption on single crystal a-alumina(0001) and fused silica surfaces. SFG spectra can providemolecular-level information of adsorption at the air-solidinterface. erator/amplifier (OPG/OPA) system (LaserVision). The inputSurface Specific Probing Techniques. For the introduc- 532 nm intensity is focused using a plano-convex lens (CVItion of surface specific probing techniques,there are several Laser, 500 mm focallength) and is placed ~490 mm beforeexcellent detailed reviews by Al-Abadleh and Grassian (4), the sample surface to provide a~1 mm beam diameter andBrown and Sturchio (34),and Brown et al. (35). These reviews 400 uJ per pulse of 532 nm light on the sample surface. Thenot only summarize surface sensitive techniques but also infrared is focused at the sample surface using a BaF2 lensprovide both introductory and the latest research updates (200 mm focal length), where it has <0.5 mm beam diameter,on the metal oxide surface. The theory of SFG can be found and is ~300-650 pJ per pulse depending on the spectralin other publications (36-40). Here, a brief introduction of region. This IR profile is shown in Figure 1. The input anglessum frequency generation spectroscopy is provided since it are ~45°and~53° from the surface normal for the 532 nmis the focus of this study.and infrared beams, respectively. The detection angle is setto 45.6°from the surface normal for sum frequency detection.Several spatial, Schott glass and notch filters are used toblock the 532 nm beam from entering the detection system.A 512×512 pixel array, 12.3 mm x12.3 mm active area,24-micron square pixel size, back illuminated CCD (DV412,AndorTechnology) is used to detect the sum frequency signal.The CCD is thermoelectrically cooled, and the CCD tem-perature was set at -45°C during the experiments. Ahome-is proportional to the absolute square of the macroscopic written program in Labview and C+languages was used forsecond-order nonlinear susceptibility,x2), which consists of data acquisition. The scanning SFGspectra presented in thisresonant terms () and a nonresonant term (x). Whenpaper were acquired using a 10 or 30 s exposure time forthe frequency of an incident infrared beam, ωR, is resonanteach data point, and spectra were acquired anywhere fromwith a vibrational mode of an interfacial molecule, u, the20 to 50 min (from 2700 to 4000 cm-l).The spectra presentedresonant susceptibility term xp dominates x(2 and a SFGhere are the average to at least two replicate spectra. Theintensity enhancement is observed.x polarization combination used for the scanning SFG experi-is shown in eq2ments presented here is S, S, and P for the SFG, 532 nm, andinfrared beams, respectively. The nonresonant response fromthe GaAs surface is shown in Figure l and can be used fornormalization;however, in the experiments presented here,spectra were normalized to the incident IR energy also shownin Figure l since we obtain these data in real time. The spectrawere acquired at the ambient condition of 23°C and~50%RH.Sum Frequency Generation. In the Allen Lab, two types ofSFG systems are available. One is a broad bandwidth SFG(BBSFG) system, and the other is a scanning SFG system. Inthis study, the scanning SFG system was used to investigateboth the C-H stretching region and the broad hydrogenbonding region at the oxide surfaces. A brief description ofthe scanning SFG system is given below.The scanning SFG system utilizes a visible beam at 532nm and an infrared beam tunable from 2500 to 4000 cm-with a bandwidth of~4-8 cm-depending on the spectralregion. The 532 nm beam is generated by doubling thefrequency (second harmonic) of the 1064 nm pump sourcefrom an EKSPLA PL 2143A/SS Nd:YAG laser (29 ps pulseduration and 10 Hz repetition rate). The infrared beam isgenerated from a KTP-KTA based optical parametric gen- where A, is the amplitude of the transition moment, ω,is thefrequency of the transition moment, and T, describes theline-width of the transition. The amplitude, Ap, is nonzerowhen the Raman and the infrared transitions are spectro-scopically allowed. Experiment and Chemicals FIGURE 1. The infrared energy profile and the nonresonant sumfrequency generation response from a GaAs surface. Materials and Chemicals The a-Al2Os single crystal (c-cut, (0001) plane) parallel plateswere purchased from Marketech International with a purityof>99.995%. The crystal was highly polished with a surfacequality of 20-10 (alumina crystals without a highly polishedsurface can generate white-light in the bulk more efficientlyand also produce lower signal intensities).The infrared gradefused silica plates were purchased from Quartz Plus Inc.According to the manufacturer data, the surface quality is60-40, flatness = 5 waves, parallelism < 15', surfaceroughness=1.5-3 nm, and bulk hydroxyl content ≤8 ppm.The alumina crystals were investigated by XPS after beingreceived from the supplier to make certain that there was noinorganic contamination (especially silica) at the aluminasurface. Before the SFG experiments, the oxides wereannealed in a muffle oven (Fisher Scientific, Isotemp MuffleFurnace) at 900 °C for more than 12 h in order to removepossible organic contamination. After the crystal was cooled Incident Infrared (cm) Incident Infrared (cm) FIGURE 2. Sum frequency generation spectra of aqueous ethylene glycol solutions. Red lines are spectroscopic fits,and dark green linesare component peaks. Each spectrum shown is the average of at least 2 replicates except for neat ethylene glycol, and error bars arethe standard deviations of the replicates. to room temperature, the crystal was kept under ambientconditions for more than 30 min to allow equilibrium withthe water vapor in the air. Then, the SFG experiments wereperformed on the alumina surface before and after theethylene glycol adsorption. The adsorption experiments were completed by placingthe oxide into a sealed glass container with ~0.1 Torr partialpressure of ethylene glycol vapor under ambient conditions(1 atm pressure at 23±1°C). After 2 h exposure, oxide plateswere purged with organic free air for 30 min. The oxide plateswere then placed back onto the sample stage to investigatethe air-solid interface by SFG spectroscopy. Curve-Fitting of the SFG Spectra. Since an SFG-activevibrational mode must be both IR-active and Raman-active,an IR spectrum and a Raman spectrum of the chemicals ofinterest were obtained and analyzed before performing theSFG spectrum curve-fit. By performing curve-fits on the IRand Raman spectra, the number of peaks, peak position,and bandwidth of the both Raman- and IR-active modescan be obtained. These peak parameters are used asreferences when setting the initial guess and the confinementparameters in the SFG curve-fitting process as well asdetermining the possible numbers of the peaks that can existin the SFG spectrum. In the Raman and IR fitting,the intensityis the summation of each vibration’s intensity, whereas inSFG the intensity is the absolute square of the summation Anhydrous ethylene glycol (99.8%) was purchased fromAldrich Chemicals and used as received. Deionized waterwas obtained from a Millipore Nanopure system (18.3 MQ·cm). The relative humidity measurement was carried out byusing a digital hygrometer/thermometer (Traceable, ControlCompany) with an accuracy of ±2% for relative humidityand±1C for temperature. of each vibration’s x, and xe as shown in eq 1. This leadsto different spectral character for SFG spectra relative toRaman and IR spectra because the relative phase of the SFGresponse for each overlapping vibrational mode can have aprofound effect on the shape of the resultant SFG spectra.Therefore, SFG spectra interpretation must occur afterdeconvolution into the component peaks since directcomparison of SFG spectra to Raman and IR spectra may bemisleading. In addition to the inclusion of phase, differentnonresonant parameters were used to fit the SFG spectra.This parameter varied substantially for the air-liquid versusthe different air-solid interfaces. Results and Discussion Ethylene Glycol at Air-Liquid Interfaces. Sum frequencygeneration spectra of aqueous ethylene glycol solutions areshown in Figure 2. The spectra cover both the CH (2700-3000 cm-l) and OH (3000-3900 cm-l) stretching regionsand were collected using the SsrcSvisPI polarization con-figuration (the electric field vector for the S polarization isperpendicular to the incident plane, and for P polarization,itis parallel to the incident plane). In the CH stretching region,the peak around 2875 cm-is attributed to the CH2 symmetricstretching (SS) modes. There is some controversy on theassignment of the smaller peak observed at ~2940 cm-l,some follow general IR and Raman assignments by assigningit to the CH2 asymmetric stretching (AS) modes (41), andrecent SFG work assigns it to the Fermi resonance of theovertone of the CH2 bending mode with the fundamental ofSS modes by comparing the SFG intensity of EG at differentpolarization configurations (42). We assign the peak at~2940cm-to CH2-AS modes as discussed below. FIGURE 3. Peak area ratios of CHz-SS and free OH stretching ofsurface water change with the concentration of ethylene glycol inaqueous solutions.The peak areas of the CH2-SS are the total areafor two fitted component bands. One fitted free OH peak centeredat~3700 cm-accounts for the area of the water free OH peak. Theratios are relative to neat ethylene glycol for the CHz-SS and toneat water for the free OH.The SFG intensity in the CH stretching region of aqueousethylene glycol solutions increases with the concentrationof the ethylene glycol in the solution, as one would expect.However, the CH2-SS peak is split into two prominent peaksat concentrations ≤0.1 mole fraction EG, suggesting thatthere are atleasttwo components to the CH2-SS. Thesplittingis not observed in Raman and IR spectra of the bulk solutionconfirming that the distribution of bulk and surface EG-water complexes are different. The splitting observed in ourSFG surface spectra suggests that there is a critical H2Oconcentration needed to organize the EG molecules intofewer, but more highly probable, EG conformers at thesolution surface. One can view this as a surface solvationeffect since the addition of solvent water molecules givesrise to the stabilization of fewer EG conformers at the solutionsurface. Hydrogen bonding between water and EG moleculesplays a key role in the stabilization of fewer conformers atthe surface, whereas in the bulk,solvation is 3-dimensionaland therefore different. (Gas-phase cluster data on EG-watercomplexes is helpful to explain the EG-water interactions(41).) The splitting of the CH-SS peak also indicates thatthe peak at~2940 cm-can be attributed to CH2-AS modes,otherwise a similar splitting feature would have been observedif this peak is due to Fermi resonance modes.Various ab initio calculations in gas and condensed phasesreveal that the gauche conformer dominates the EG popula-tions (41, 43-45). Since the trans conformer is internallycentrosymmetric, one would expect minimal if any SFGintensity according to the spectroscopic rules for SFG (46).However, a strong methylene SFG response is observed as Ethylene Glycol at Air-Solid Interfaces. The SFG spectrashown in Figure 2 indicating that at the air-liquid interface ofa-Al2O3 (0001) at 54% relative humidity before (clean) andEG gauche conformers are also dominant, consistent with after exposure to EG vapor are shown in Figure 4. A neatthese previous calculations. water spectrum acquired using the same parameters (IR andThe hydrogen bonded OH stretches are clearly observed 532 nm energy, exposure time etc.) is also plotted forin the 3000-3600 cm- region; however, free OH stretches comparison. The spectrum of clean a-alumina (0001) showsof EG (3600-3800 cm-region (47,48)) are not observed for intensity in the hydrogen bonded OH stretching regionthe neat EG-air spectrum. This indicates that, unlike water (3000-3600 cm-), consistent with infrared studies of watermolecules with about 20% of OH dangling freely at the air- adsorption at the α-Al203 (0001) surface (9, 18). Recently,liquid interface (49), the diols of the EG molecules are Al-Abadleh and Grassian studied surfaces of both singlehydrogen bonded at the interface. This leaves hydrophobiccrystal and particles of a-alumina under 1 to 95% RHalkyl groups pointing from the liquid surface into the airconditions using FT-IR spectroscopy (18). They found thatphase and indicates that EG at its air-liquid interface behaveswater adsorbs on the surface in an ordered fashion with theorientationally similar to methanol and ethanol (50,51).formation of a stable hydroxide layer below ~10% RH, andThe free OH stretching (3700 cm-l) of water moleculeswater molecules form a structured overlayer between 10 andnearly disappears at concentrations ≥ 0.1x EG, and only70% RH. A quasi-liquid layer was also indicated to form onshows a weak response in the 0.05x EG solution as shownthe surface above 70% RH. According to Al-Abadleh andin Figure 2. This indicates that the EG molecules at the air-Grassian, there are~3 monolayers ofwater molecules formedliquid interface are hydrogen acceptors (in addition to beingon the a-alumina (0001) surface at 54% RH. At 296 K andhydrogen donors) in the EG-water binary system. That is,54% RH, our SFG spectra suggest that the a-alumina (0001)the oxygens of the EG diols are hydrogen bonding to thesurface is hydrated with the possibility of several monolayershydrogens of the dangling (free) OH of surface water. Figureof water molecules, generally consistent with previous IR3 summarizes the peak intensities for both the CH2-SS forstudies (9,18). Yet, in the free OH region of Figure 4, a FIGURE 4. Sum frequency generation spectra of (a) the α-Al203(0001)surface before and (b) after exposure to ethylene glycol vaporat 54% RH. The neat water sum frequency spectrum acquired usingthe same setup is plotted for comparison. EG and the free OH for water (relative ratios to neat EG forCH2-SS and to neat water for free OH). The free OH intensitydecreases substantially from 0.001x to 0.05x EG solution (1EG:19H2O:~4 dangling OH). There are two factors that needto be considered when the SFG intensity is used for thequantitative spectral analysis. The first factor is the increasedsurface number density of EG molecules relative to the bulkconcentration (41) since EG slightly partitions to the surfaceof its aqueous solution (decreasing surface tension withincreasing EG concentrations). The second factor is the natureofSFG(SFGintensity depends on both the interfacial numberdensity and the orientation of these molecules). However,the steep drop of the free OH intensity at such a low EGconcentration strongly suggests that EG has a propensity forforming hydrogen bonds with the dangling OH (H-donor) ofwater at the interface. These findings are consistent withprevious studies on aqueous methanol solutions, also analcohol, which indicated that methanol is a more efficienthydrogen-bonding acceptor when it resides in the interfacialregion (51). relatively sharp peak is observed at~3710cm-. Inthis region,both the free OH stretching of adsorbed water moleculesand the free aluminol OH stretching can contribute to theSFG response. (The vibrational frequency of the aluminolOH stretch with the oxygen coordinated by three aluminumatoms has been previously observed at ~3710 cm-byusinginfrared absorption spectrocopy (52, 53).) At relatively highRHs, there is still a possibility of isolated aluminol hydroxylgroups existing on the alumina surface (18, 54) even thoughmost of the hydroxyl groups have formed hydrogen bondswith adsorbed water molecules.Since the refraction index of a-Al2Os(ns ≈1.77) is largerthan that of neat water (ns ~1.33) and SiO2 (ns~1.46), thereshould be less SFG signal reflected from the alumina surfaceaccording to nonlinear Fresnel coefficient calculations, andyet an enhanced SFG signal intensity is observed in thisspectral region for the alumina surface relative to the neatwater surface. Compared to the neat water SFG intensity inthe hydrogen bonding region, the higher SFG response fromthe a-alumina (0001) surface may occur according to 2possible scenarios (a nonresonant response scenario wastested and did not contribute to the increased ‘effective'response). One is that the orientations of the structured watermoleculesare more ordered at the alumina surface than thoseof the air-water interface.Enhancement is observed in boththe 3250 and 3450 cm-regions. However, the 3450 cm-lregion is more intense, not necessarily consistent withordering of the surface water; however, interactions with thealumina surface hydroxyls may weaken the water-waterhydrogen bonds,increasing the vibrational energy (frequency(cm-)) of the molecules in the H-bonding network. There-fore, the water molecules could still be more highly aligned.This is consistent with an increase in the OH stretchingregionof H-bonded water. A second scenario is that the higher SFGintensity from the hydrated alumina surfaces can havecontributions from the hydrogen bonded aluminol OHstretching, consistent with reported frequencies for morehighly coordinatedAl-O-H(52,53).Additional studies usingD2O instead of H20 are needed to help distinguish betweenthe two scenarios. These studies are currently underway.Unlike the o-Al2O3 (0001) surface, a weaker SFG responsein the hydrogen bonding region from the fused silica(amorphous) surface reveals the relatively hydrophobicnature of this surface as shown in Figure 5a. (NonlinearFresnel factors have been calculated for the alumina andsilica surfaces and reveal that the silica surface gives a higherFresnel factor.) There are numerous studies of water adsorp-tion on silica surfaces using infrared adsorption in additionto many other methods (14, 15,20). These results are notconsistent with each other, especially in terms of the watercoverage (19,55,56). The inconsistent data may be the resultof differences in the materials used, sample pretreatmentmethods, experimental conditions (vacuum orambient),andanalytical methods.In Figure 5a, at ambient conditions with 54% RH, the SFGspectrum of the air-silica interface reveals a weak hydrogenbonded OH stretch band, whereas a strong silanol OHstretching peak is observed around 3750 cm-. To ensurethat the 3750 cm-peak was due to the free silianol OHstretch instead of other free OH stretches from adsorbedwater molecules, an SFG spectrum was obtained at 0% RHas shown in Figure 5a. The SFG intensity of the 3750 cm-peak at 0%RHincreases slightly compared to that of the 54%RH SFG spectrum. This indicates that the 3750 cm-peak isindeed due to the free silianol OH stretch. At 54% RH, theSFG spectrum suggests that water molecules may only covera limited portion of the hydrated silica surface and thatisolated silanol OH groups are present as the major surfacespecies. While numerous infrared studies have observed theisolated silanol OH stretching frequency in the same spectralregion (10-16), to our knowledge, this is the first published Incident Infrared (cm ) FIGURE 5. Sum frequency generation spectra of the silica surface(a) before and (b) after exposure to ethylene glycol vapor at 54%RH. SFG spectra revealing the silanol OH from the air-silicainterface, although solid-liquid SFG spectra of silica-waterhave been published by other groups (38, 57). The SFG spectra of ethylene glycol adsorbed on hydratedalumina and silica surfaces are shown in Figures 4 and 5b.The presence of the methylene CH stretching modes of EGmolecules indicates theadsorption of EG molecules on bothoxide surfaces. The slight decrease of the SFG intensity inthe hydrogen bonded OH region on the a-Al2O3 surface(Figure 4) may suggest to a small extent, perturbation of thehydrogen bonding structures after adsorption of EG. (How-ever, destructive interference with the CH modes may be thecause of this as fitting parameters can be forced to providethis change in spectral shape of the OH region.) The peak at~3710 cm-remains unchanged, which suggests that thispeak may indeed be the hydroxyl group (Al-O-H) on thea-Al2Os surface as opposed to the free dangling OH ofadsorbed water since the presence of EG molecules at theair-aqueous solution surface reduces the intensity of thefree OH stretching as discussed above. Molecular dynamicscalculations of water adsorption on the boehmite (010)surface indicate that water molecules do not cover the entiresurface, moreover, adsorbed water forms island type multi-layers, leaving a fraction of the aluminol OH groups exposed(personal communication with L. Criscenti, Sandia NationalLab). One might expect the same results from the a-Al2Ossurface since both the hydroxylated o-Al2Os surface and theboehmite surface are quite similar (boehmite is only slightlymore hydrophilic than a-Al2O3). Therefore, it is possible thatisolated a-Al2O3 hydroxyl groups will still exist withoutforminghydrogen bonds with surface water molecules under54% RH at 296 K. If this is true, then EG is preferentiallyhydrogen bonding with the surface adsorbed water and notthe isolated a-Al2O3hydroxyl groups. This is further elucidatedfollowing the continuing discussions on the SFG spectrumchanges in the CH stretching region. As shown in Figure 5b, after adsorption of EG moleculeson the SiO2 surface, the isolated silanol OH stretching peakis suppressed to a great extent relative to this peak observedfrom the SiO2 surface at 54% RH (Figure 5a). In addition,there areno EG free OH peaks observed. These observationssuggest that EG molecules form hydrogen bonds with the Incident Infrared (cm) surface silanol groups, and EG can act as a hydrogen acceptorand a hydrogen donor to the other acceptors (surface silanolgroups, water molecules, or other EG molecules). Theseresults are in agreement with the FT-IR studies whichconcluded that hydrogen bond formation between theadsorbate molecules and the hydrogen atoms of the silanolgroups on the silica surface plays a major role in adsorptionof molecules from the vapor state (15, 20). It is difficult to analyze the hydrogen bonding structurebased on the OH stretching region alone since there is a lackof informative features in this region due to the broadnessof the hydrogen bonded OH stretching bands. In addition,the oxide surface under ambient conditions with the presenceof water vapor and organic molecules containing hydroxylgroups is complex. However, the spectroscopic features inthe CH stretching region can give key information about thehydrogen bonding structure since changing the local hy-drogen bonding environment will affect the frequencies ofthe CH stretching modes. Figure 6(a-c) compares the SFGspectra and relative CH stretching frequencies ofthe 0.1xEGsolution, the EG adsorbed on the alumina surface (EGAl),and the SiO2 (EGsi) surface. The CH2-SS peaks of the SFGspectrum of EGAl (Figure 6b) resembles that of the aqueousEG solution atlow concentration (≤ 0.1x in Figure 2) whichreveals a splitting feature at ~2855 and ~2880 cm-. Incontrast, the CH-SS peak ofthe SFG spectrum ofEGsi (Figure6c) is similar to that of the aqueous EG solution at higherconcentrations (> 0.1x in Figure 2). This is consistent withthe discussions above that suggest that the EG molecule FIGURE6. Sum frequency generation spectra in the C-H str9etchingregion of ethylene glycol molecules (a) at the air-aqueous interface,(b)adsorbed on the alumina surface, and (c) adsorbed on the silicasurface. Ethylene glycol at the air-aqueous solution interface isplotted in (a) for comparison purposes. The red lines are spec-troscopic fits, and the dark green lines are the component peaks.(The nonresonant SFG fitting parameters are different for all 3 spectra;component peak phases are all positive.) adsorbs on the relatively hydrophilic α-Al2O3 (0001) surface(58) by forming hydrogen bonds with adsorbed watermolecules and that the EG molecule forms hydrogen bondswith silanol OH groups on the relatively hydrophobic SiO2surface. (At54%RH, the SiO2 surface does not have as manywater molecules adsorbed to its surface as that of the a-Al2O3surface as indicated by Figures 4a and 5a.) As shown in Figure6(a-c), the CH2-SS peak positions of the SFG spectrum ofEGAl are shifted~15 cm- to lower frequency relative to thatof the aqueous EG solutions (Figure 2). The red shift of theCH-SS peaks suggests that hydrogen bonding between theadsorbed water molecules and the EG molecules is relativelyweak compared to that at the aqueous EG-air interface,consistent with cluster studies (51). This was further testedby the complete desorption of EG (no CH stretching SFGsignal detected) after rinsing EG adsorbed a-Al2O3 (0001)with organic free deionized water for 5 min. The hydrogenbonding strength can therefore be described as weaklyphysisorbed. There is a convolution of the ~2855 cm- andthe ~2880 cm-1 CH2-SS peaks in the EGsi spectrum,suggesting one continuous distribution of EG comformersand orientations as opposed to the bimodal distribution(CH2-SS peak splitting) observed for the low EG molefractions at the liquid surface as well as at the surface of thealumina. In addition, there is no SFG signal in the EG CHstretching region after rinsing EG adsorbed SiO for 5 minwith water. This also suggests that the hydrogen bondsbetween EG molecules and silanol OH group are also weakrelative to that at the aqueous EG-air interface (i.e. weaklyphysisorbed). However, the observed shifts, splitting and lackofsplitting from the different interfaces clearly indicate thatthe adsorbed EG molecules interact in different ways at thetwo different oxide surfaces. Interestingly, the EG adsorptionon the alumina surface exhibits splitting similar to the lowconcentration EG solution surface, yet the silica surface doesnot allow the EG to preferentially reorient. In addition, thesurface hydrophilic versus hydrophobic properties seem tostrongly influence the ability of EG to reorient itself. Acknowledgments We acknowledge the U.S. Department of Energy (DOE-BESGeosciences DE-FG02-04ER15495) in addition to the NSFOhio State Environmental Molecular Science Institute (CHE-0089147) for the funding of this project. Supporting Information Available All the SFG peak fitting parameters and infrared and Ramanspectra of ethylene glycol. This material is available free ofcharge via the Internet at http://pubs.acs.org. Literature Cited (1) Sparks,D. L. Environmental Soil Chemistry,2nd ed.;AcademicPress: San Diego, CA, 2003. (2) Stumm, W.;Morgan, J. J. Aquatic Chemistry, 3rded.;John Wiley& Sons: New York, 1996. (3)Usher, C. R.; Michel, A. E.; Grassian,V. H. Reactions on MineralDust. Chem. Rev.2003,103(12), 4883. ( ( 4 ) Al-Abadleh,H. A.; Grassian, V . H. O xide Surfaces as Env i ron-mental I n terfaces. Surf. Sci. R ep. 2 003, 52 ( 3 -4), 6 3 . ) ( (5 ) M inerals in Soil Environments. SSSA Book Ser. 1; Dixon, J. B.,Weed, S. B., Eds.; Soil Sci . Soc . Am.: Madison, WI, 1 9 89. ) ( (6) El Rassi, Z. ; Gonnet, C.; Rocca, J . L. Chromatographic S tudies o f the Influence of Water and Thermal Treatment on the Activity of Silica Gel.J . Chromatogr. 1976,125, 1 79. ) ( U nger, K. K. Porous Silica; Elsevier : Amsterdam, 1979. ) ( E ng, P. J . ; T rainor,T. P . ; B rown, G. E. , J r .; W aychunas, G. A.; Newville,M.; Sutton,S. R.;R i vers, M. L. Structure of the Hydrateda-Al2O3 (0001) Surface. Science 2000, 288 ( 5468),1029. ) ( (9) Hass, K. C.; Schneider, W. F.; Curioni, A.; Andreoni , W. The Chemistry of Water on Alumina Surfaces: Reaction Dynamicsfrom First P rinciples. Science 1998, 282 ( 5387), 265. ) ( (10 ) ) Burneau, A.; B a rres, O.; Gallas, J. P.; L avalley, J. C. Comparative Study ofthe Surface Hydroxyl Groups of Fumed and Precipitated ) Silicas. 2. Characterization by Infrared Spectroscopy of theInteractions with Water. Langmuir 1990, 6 (8), 1364. (11) BIurneau,A.; Barres, O.; Vidal,A.; Balard, H.; Ligner, G.; Papirer,E. Comparative Study of the Surface Hydroxyl Groups ofFumedand Precipitated Silicas. 3. Drift Characterization of GraftedN-Hexadecyl Chains. Langmuir 1990,6 (8), 1389. (12) McFarlan,A.J.;Morrow,B. A. Infrared Evidence for Two IsolatedSilanol Species on Activated Silicas.J. Phys. Chem. 1991, 95,5388. (13)NMorrow, B. A.; McFarlan, A. J. Surface Vibrational Modes ofSilanol Groups on Silica. J. Phys. Chem. 1992, 96,1395. (14) Morrow,B. A.;Gay, I. D. Infrared and NMR Characterization ofthe Silica Surface. In Adsorption on Silica Surface; Papirer, E.,Ed.; Marcel Dekker: New York, 2000. (15) IIler, R. K. The Chemistry of Silica: Solubility, Polymerization,Colloid and Surface Properties, and Biochemistry; Wiley-Inter-science Publication, John Wiley & Sons: New York, 1979. (16)SSneh, O.; George, S. M. Thermal Stability of Hydroxyl Groupson a Well-Defined Silica Surface.J.Phys. Chem. 1995,99,4639. (17) de Leeuw, N. H.; Higgins, F. M.; Parker, S. C. Modeling theSurface Structure and Stability of a-Quartz. J. Phys. Chem. B1999,103,1270. (18) Al-Abadleh, H. A.; Grassian, V. H. FT-IR Study of WaterAdsorption on Aluminum Oxide Surfaces. Langmuir 2003, 19(2),341. (19) SSneh, O.; Cameron, M. A.; George, S. M. Adsorption andDesorption Kinetics of H2O on a Fully Hydroxylated SiO2 Surface.Surf. Sci. 1996, 364 (1), 61. (20) Davydov, V. Y. Adsorption on Silica Surfaces. In Adsorption onSilica Surfaces; Papirer,E., Ed.;Marcel Dekker: New York, 2000;p63. (21) Natal-Santiago, M. A.; Hill, J. M.; Dumesic, J. A. Studies of theAdsorption of Acetaldehyde,Methyl Acetate,EthylAcetate,andMethyl Trifluoacetate on Silica. J. Mol. Catal. A: Chem. 1999,140,199. (22) MNorrow, B. A.; McFarlan, A. J. Chemical Reactions at SilicaSurfaces.J. Non-Cryst. Solids 1990, 120 (1-3), 61. (23)Z2aki,M.I.;Hasan, M. A.;Al-Sagheer,F. A.; Pasupulety, L. In SituFTIR Spectra of Pyridine Adsorbed on SiO2-Al2O3, TiO2, ZrO,andCeO2: General Considerations for the Identification of AcidSites on Surfaces of Finely Divided Metal Oxides. Colloid Surf.2001,190,261. (24) Dines, T. J; MacGregor, L. D.; Rochester, C. H. Adsorption of2-Chloropyridine on Oxide-an Infrared Spectroscopic Study.Spectrochim. Acta, Part A 2003, 59,3205. (25) Hair,M. L.;Hertl, W. Adsorption on Hydroxylated Silica Surface.J. Phys. Chem. 1969,73,4269. (26)I]naki, Y.; Yoshida, H.; Yoshida, T.; Hattori, T. Active Sites onMesoporous and Amorphous Silica Materials and Their Pho-tocatalytic Activity: An Investigation by FTIR, ESR,VUV-UVand Photoluminescence Spectroscopies.J. Phys. Chem.B 2002,106, 9098. (27) Goss, K.-U.; Schwarzenbach, R. P. Adsorption of a Diverse Setof Organic Vapors on Quartz, CaCO3, and a-Al2O3 at DifferentRelative Humidities. J. Colloid Interface Sci. 2002, 252 (1), 31. (28)3)Goss, K.-U.; Eisenreich,S. J. Adsorption of VOCs from the GasPhase to Different Minerals and a Mineral Mixture. Environ.Sci. Technol. 1996, 30 (7), 2135. (29)G(oss, K. U. Effects of Temperature and Relative Humidity onthe Sorption of Organic Vapors on Quartz Sand. Environ. Sci.Technol. 1992,26 (11), 2287. (30) Goss, K.-U.; Schwarzenbach, R. P. Quantification of the EffectofHumidity on the Gas/MineralOxide and Gas/Salt Adsorptionof Organic Compounds. Environ. Sci. Technol. 1999, 33 (22),4073. (31)(Goss, L. M.; Sharpe, S. W.; Blake, T. A.; Vaida, V.; Brault, J. W.Direct Absorption Spectroscopy of Water Clusters. J. Phys. Chem.A 1999, 103,8620. (32)O(ng, S.K.; Lion, L. W.Mechanisms for Trichloroethylene VaporSorption onto Soil Minerals. J. Enuiron. Qual. 1991,20(1), 180. (33)PIetersen,L. W.; Moldrup, P.; El-Farhan, Y. H.; Jacobsen, O. H.;Yamaguchi,T.; Rolston, D. E. The Effect of Moisture and SoilTexture on the Adsorption of Organic Vapors. J. Environ. Qual.1995, 24(4), 752. (34)IBrown,G. E., Jr.; Sturchio, N. C. An Overview of SynchrontronRadiation Application to Low-Temperature Geochemistry andEnvironmental Science. Rev. Min. Geochem. 2002, 49, 1. (35)Brown, G. E., Jr.; Henrich, V. E.; Casey, W. H.; Clark, D. L.;Eggleston, C.;Felmy, A.; Goodman, D. W.; Graetzel, M.; Maciel,G.;McCarthy, M. I.; Nealson, K. H.; Sverjensky, D. A.; Toney, M.F.; Zachara, J. M. Metal Oxide Surfaces and Their Interactions with Aqueous Solutions and Microbial Organisms. Chem. Rev.1999,99 (9),77. (36)Shen, Y. R. The Principles of Nonlinear Optics, lst ed.; JohnWiley & Sons: New York, 1984. (37) Bloembergen,N.; Pershan, P. S. Light Waves at the Boundaryof Nonlinear Media. Phys. Rev. 1962, 128 (2), 606. (38)Miranda, P. B.; Shen, Y. R. Liquid Interfaces: A Study by Sum-Frequency Vibrational Spectroscopy.J. Phys. Chem. B 1999,103,3292. (39) Hirose, C.; Akamatsu, N.; Domen, K. Formulas for the Analysisof the Surface SFG Spectrum and Transformation Coefficientsof Cartesian SFG Tensor Components. Appl. Spectrosc. 1992,46(6), 1051. (40)Moad, A. J.; Simpson, G.J. A Unified Treatment of SelectionRules and Symmetry Relations for Sum-Frequency and SecondHarmonic Spectroscopies. J. Phys. Chem. B 2004, 108, 3548. (41) Hommel, E.; Merle, J; Ma, G.; Hadad, C.; Allen, H. C.Spectroscopic and Computational Studies ofAqueous EthyleneGlycol Solution Surfaces. 2004, submitted 6-04. (42) Lu, R.; Gan, W.; Wu, B.-H.; Chen, H.; Wang, H.-F. VibrationalPolarization Spectroscopy of CH Stretching Modes of theMethylene Group at the Vapor/Liquid Interfaces with SumFrequency Generation. J. Phys. Chem. B 2004, 108,7297. (43) Chaudhari, A.; Lee, S.-L. A Computational Study of Microsol-vation Effect on Ethylene Glycol by Density Functional Method.J. Chem. Phys. 2004, 120 (16),7464. (44)Nagy, P. I.; Dunn, W. J., III.; Alagona, G.; Ghio, C. TheoreticalCalculations on 1,2-Ethanediol. 2. Equilibrium of the GaucheConformers with and without an Intramolecular Hydrogen Bondin Aqueous Solution. J.Am. Chem. Soc. 1992, 114 (12), 4752. (45) Cramer, C. J.;Truhlar,D. G. Quantum Chemical ConformationalAnalysis of 1,2-Ethanediol: Correlation and Solvation Effectson the Tendency to Form Internal Hydrogen Bonds in the GasPhase in Aqueous Solution. J. Am. Chem. Soc.1994,116,3892. (46) Hommel, E. L.;Allen,H. C. The Air-Liquid Interface of Benzene,Toluene, M-Xylene, and Mesitylene: ASum Frequency,Raman,and Infrared Spectroscopic Study. Analyst 2003, 128, 750. (47) Szymanski, H. A. Interpreted Infrared Spectra; Plenum PressData Division: New York, 1966; Vol.2. (48) Krueger, P. J.; Mettee, H. D. Spectroscopic Studies of Alcohols,Part VII. Intramolecular Hydrogen Bonds in Ethylene Glycoland 2-Methoxyethanol. J. Mol. Spectrosc. 1965,18, 131. (49) Du, Q.; Superfine, R.; Freysz, E.; Shen, Y. R. VibrationalSpectroscopy of Water at the Vapor/Water Interface. Phys. Rev.Lett. 1993,70(15), 2313. (50) Stanners, C. D.; Du, Q.; Chin, R. P.; Cremer, P.; Somorjai, G. A.;Shen, Y. R. Polar Ordering at the Liquid-Vapor Interface ofN-Alcohols (C1-C8). Chem. Phys. Lett. 1995,232 (4), 407. (51) Ma, G.; Allen, H. C. Surface Studies of Aqueous MethanolSolutions by Vibrational Broad Bandwidth Sum FrequencyGeneration Spectroscopy. J. Phys. Chem. B 2003,107,6343. (52) Knozinger, H.; Ratnasamy,O. Catalytic Aluminas: SurfaceModels and Characterization of Surfaces Sites. Catal. Reu.-Sci.Eng.1978, 17,31. (53) Mawhinney, D. B.; Rossin,J. A.; Gerhart, K.; Yates,J.T.,Jr. InfraredSpectroscopic Study of Surface Diffusion to Surface HydroxylGroups on Al2O: 2-Chloroethylethyl Sulfide Adsorption SiteSelection. Langmuir 2000, 16,2237. (54) Hass, K. C.;Schneider, F. W.;Curioni, A.; Andreoni, W. First-Principles Molecular Dynamics Simulations of H2O on a-Al2O3(0001). J. Phys. Chem. B 2000, 104, 5527. (55) de la Caillerie,J.-B. d. E.; Aimeur, M. R.; Kortobi, Y. E.; Legrand,A. P. Water Adsorption on Pyrogenic Silica Followed by HMASNMR. J. Colloid Interface Sci. 1997, 194, 434. (56) Zhuravlev, L. T. The Surface Chemistry of Amorphous Silica.Zhuravlev Model. Colloid Surf. 2000, 173, 1. (57) Kim,J.; Kim, G.; Cremer, P. S. Investigations of PolyelectrolyteAdsorption at the Solid/Liquid Interface by Sum FrequencySpectroscopy: Evidence for Long-Range Macromolecular Align-ment at Highly Charged Quartz/Water Interfaces.J. Am. Chem.Soc. 2002,124,8751. (58))Chattoraj,D. K.; Birdi, K. S. Adsorption and Gibbs'Surface Excess;Plenum Press: New York, 1984. Received for review June 21, 2004. Revised manuscript re-ceived September 17, 2004. Accepted September 27, 2004.ESO49066A es CCC: $ O American Chemical SocietyPublished on Web ENVIRONMENTAL SCIENCE & TECHNOLOGY/VOL. NO. , VOL. NO. , /ENVIRONMENTAL SCIENCE & TECHNOLOGY■
确定

还剩5页未读,是否继续阅读?

产品配置单

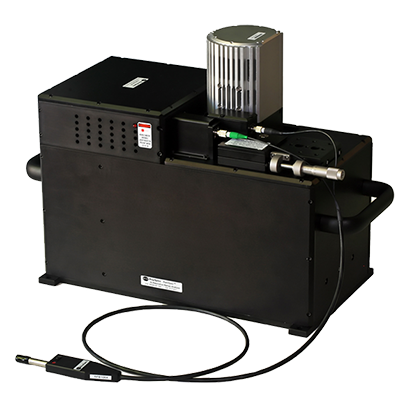
北京欧兰科技发展有限公司为您提供《表面, 界面,羟基中分子取向,吸附检测方案(其它光谱仪)》,该方案主要用于其他中分子取向,吸附检测,参考标准--,《表面, 界面,羟基中分子取向,吸附检测方案(其它光谱仪)》用到的仪器有Ekspla SFG 表面和频光谱分析系统、Ekspla PL2230型高能量皮秒激光器
推荐专场


相关方案
更多
该厂商其他方案
更多