


方案详情
文
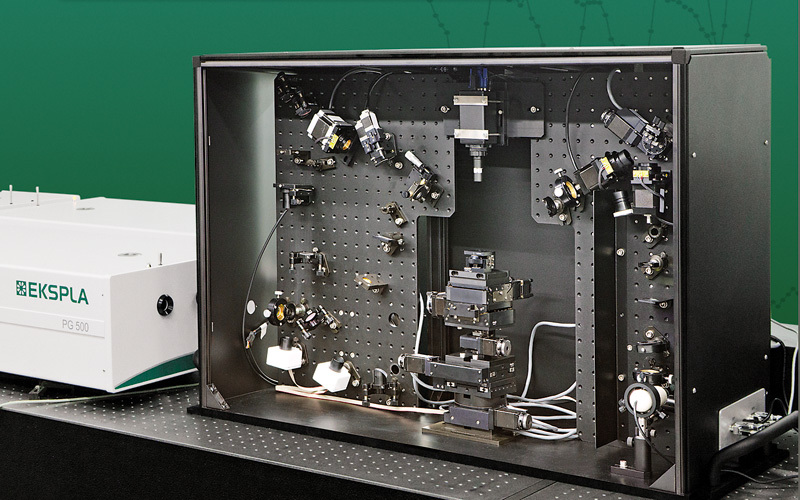
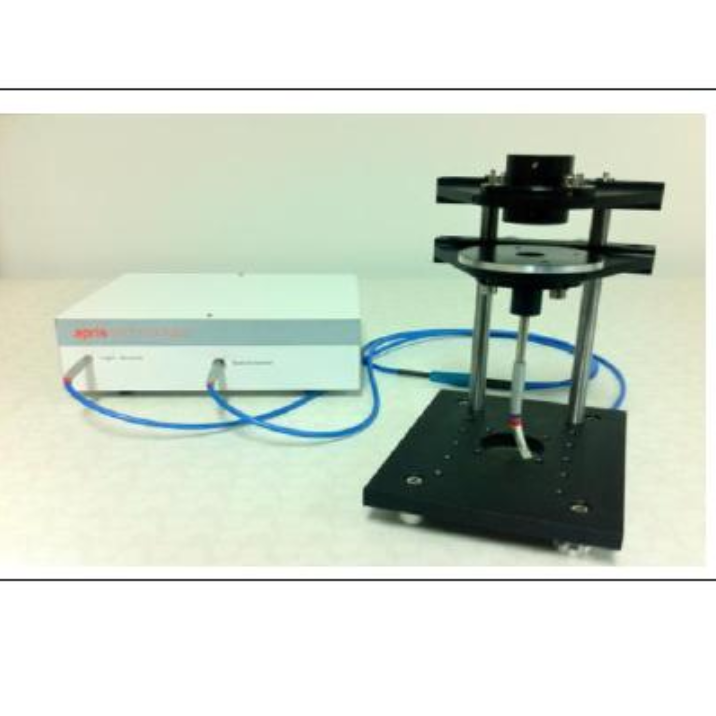
采用立陶宛Ekspla公司的SFG系统。对在疏水表面的G B1蛋白分子的取向,进行了测量。同时和SFG理论预测结果,以及蒙特卡洛法进行模拟的结果进行了对比分析。
方案详情

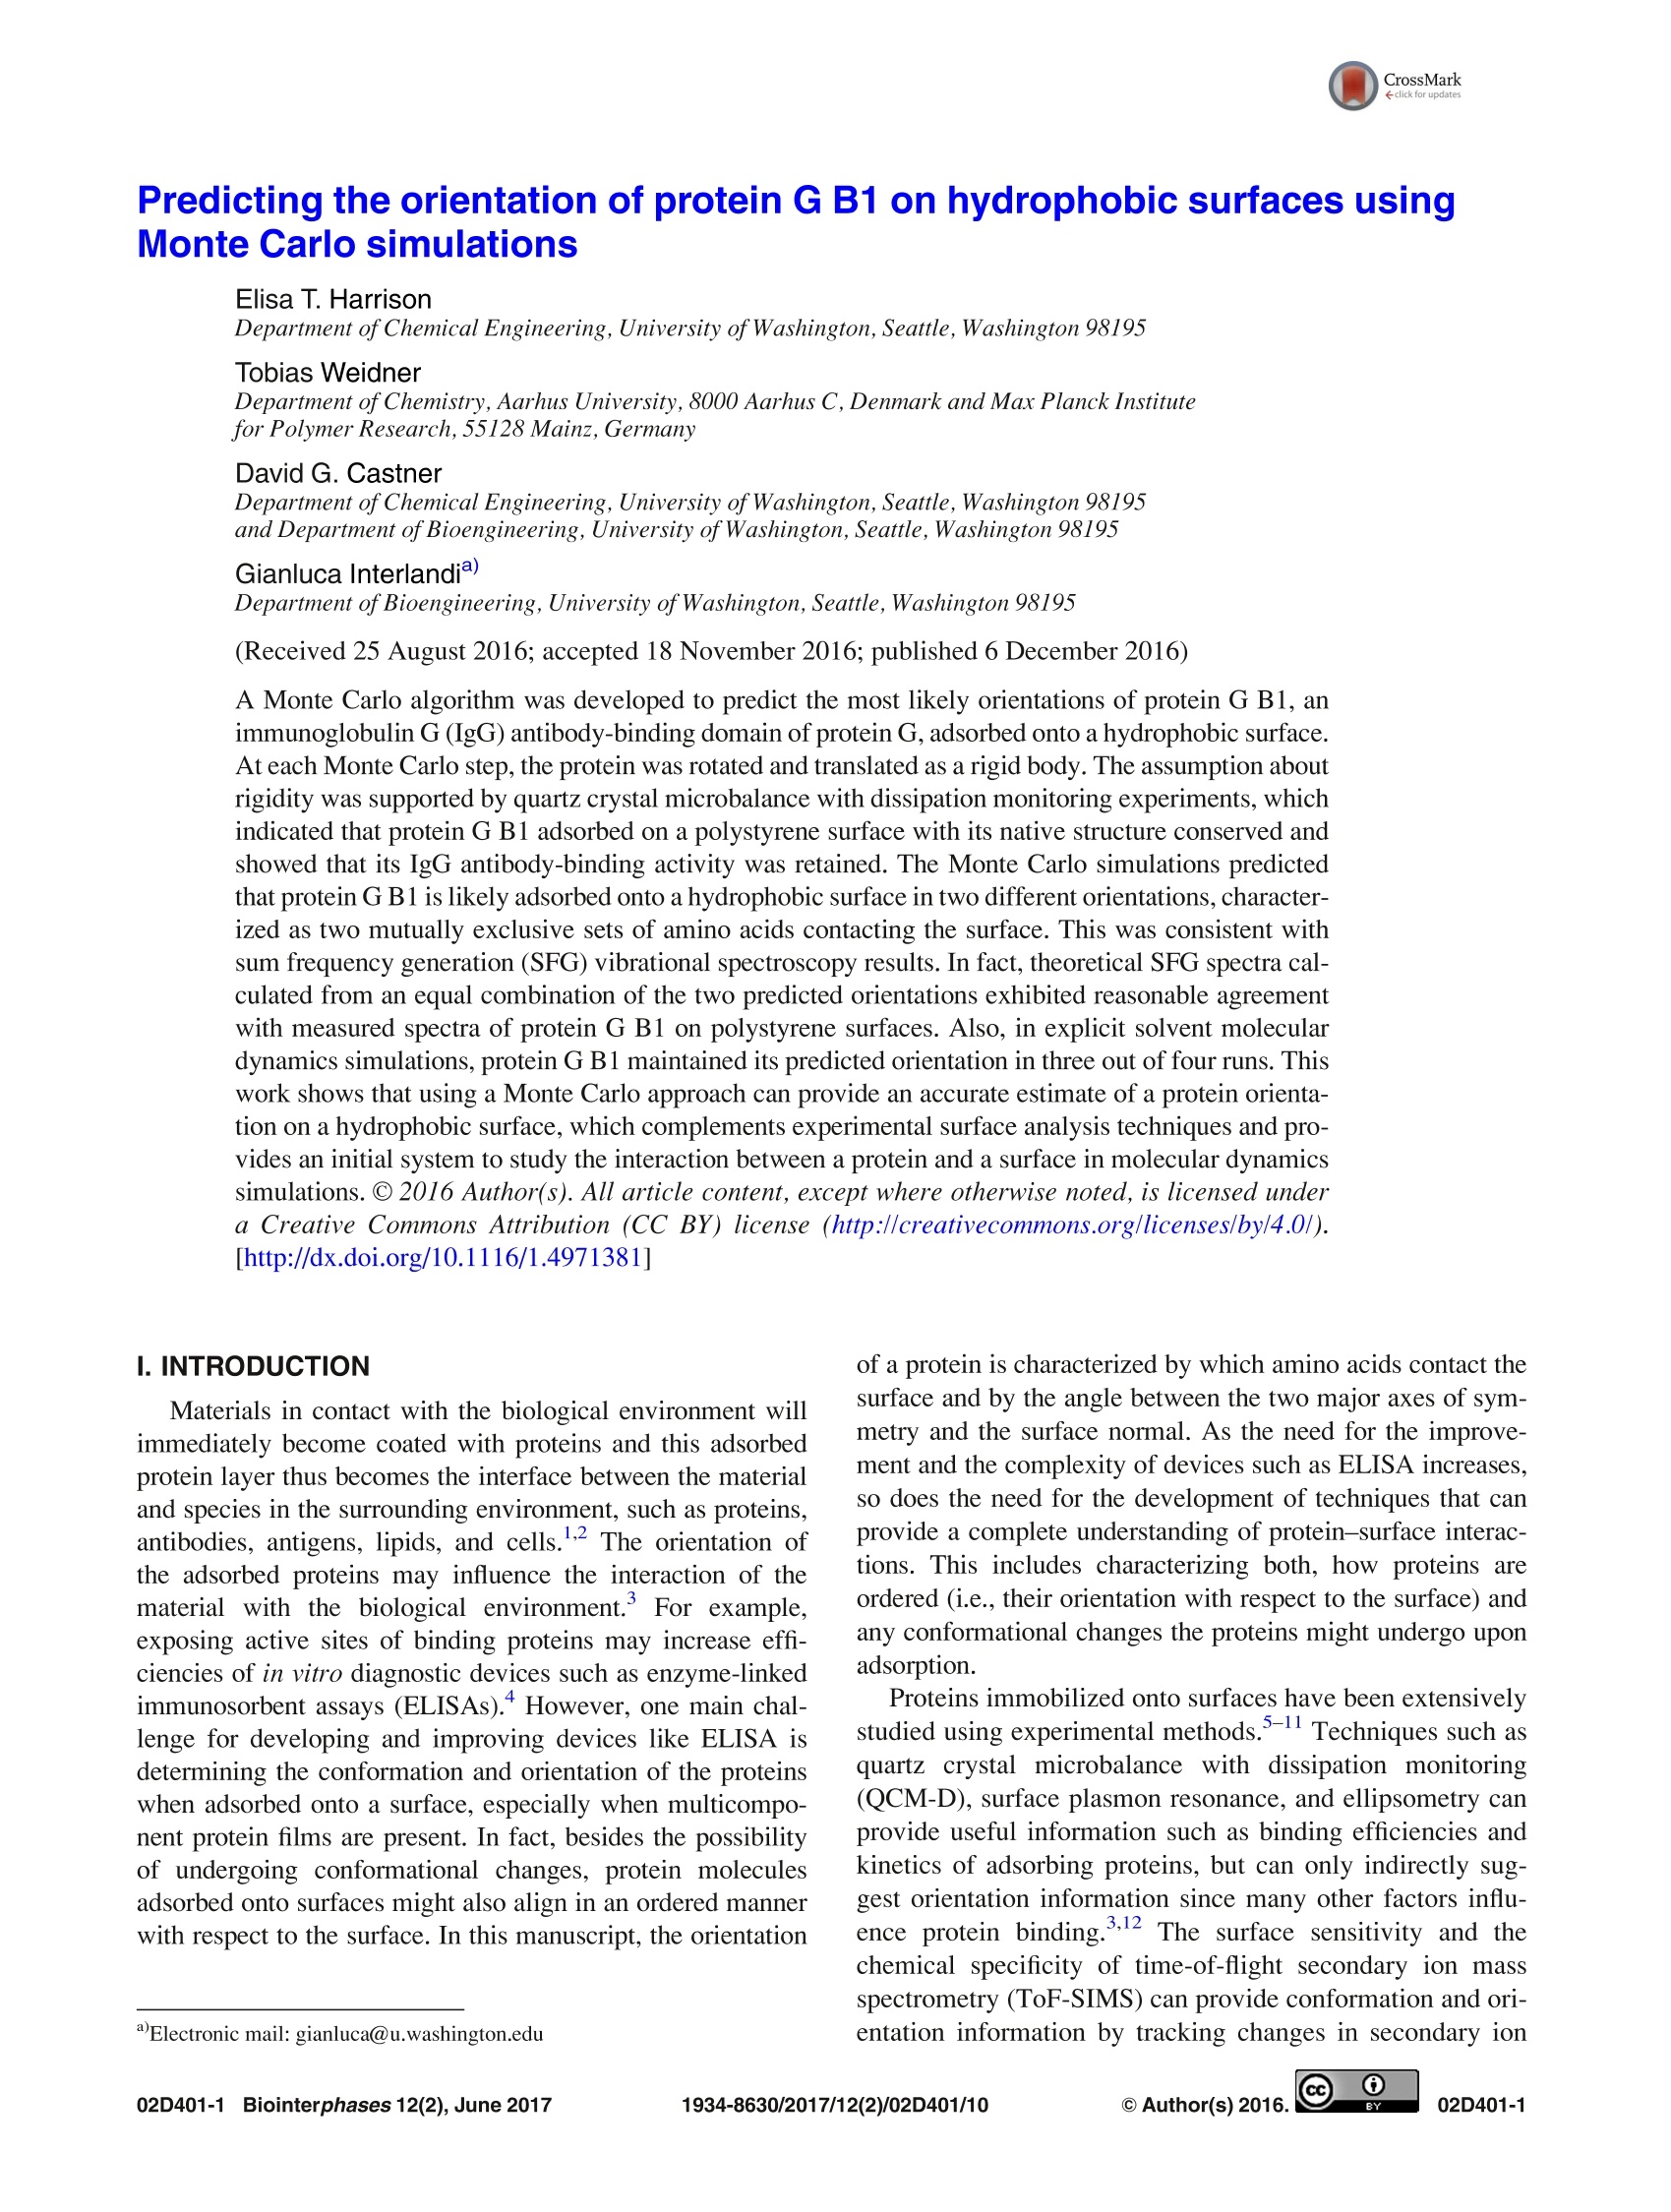
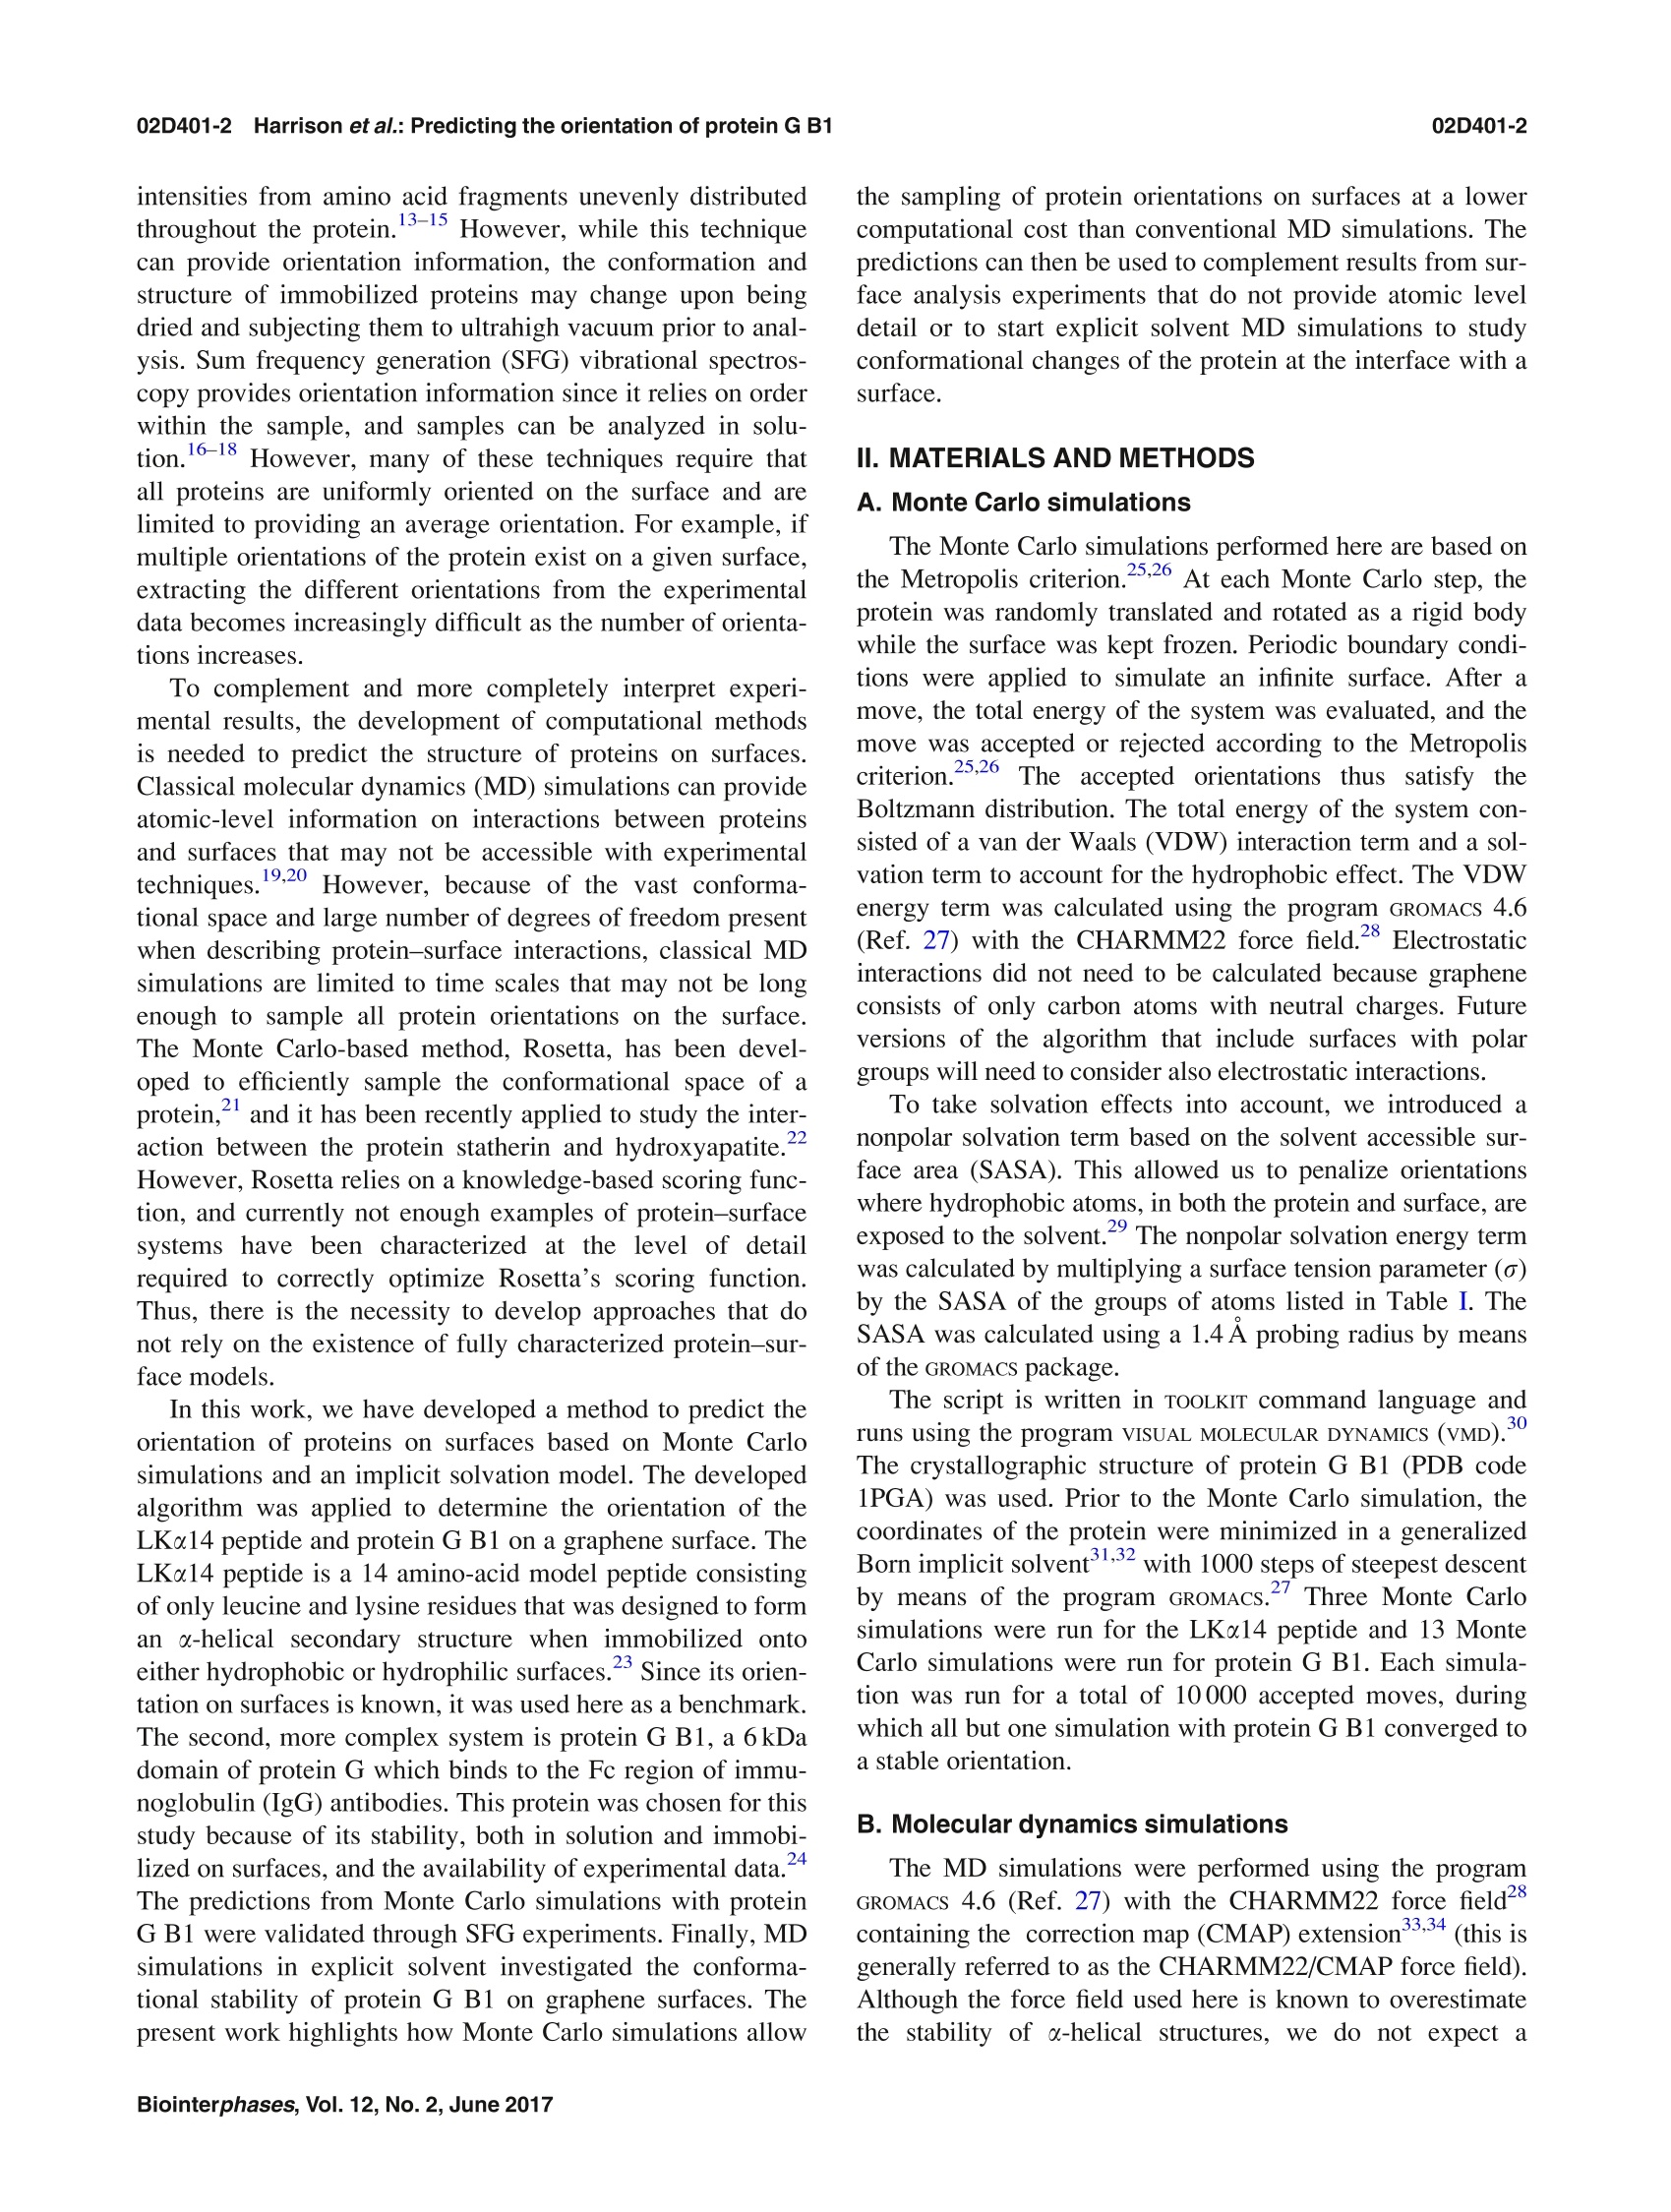
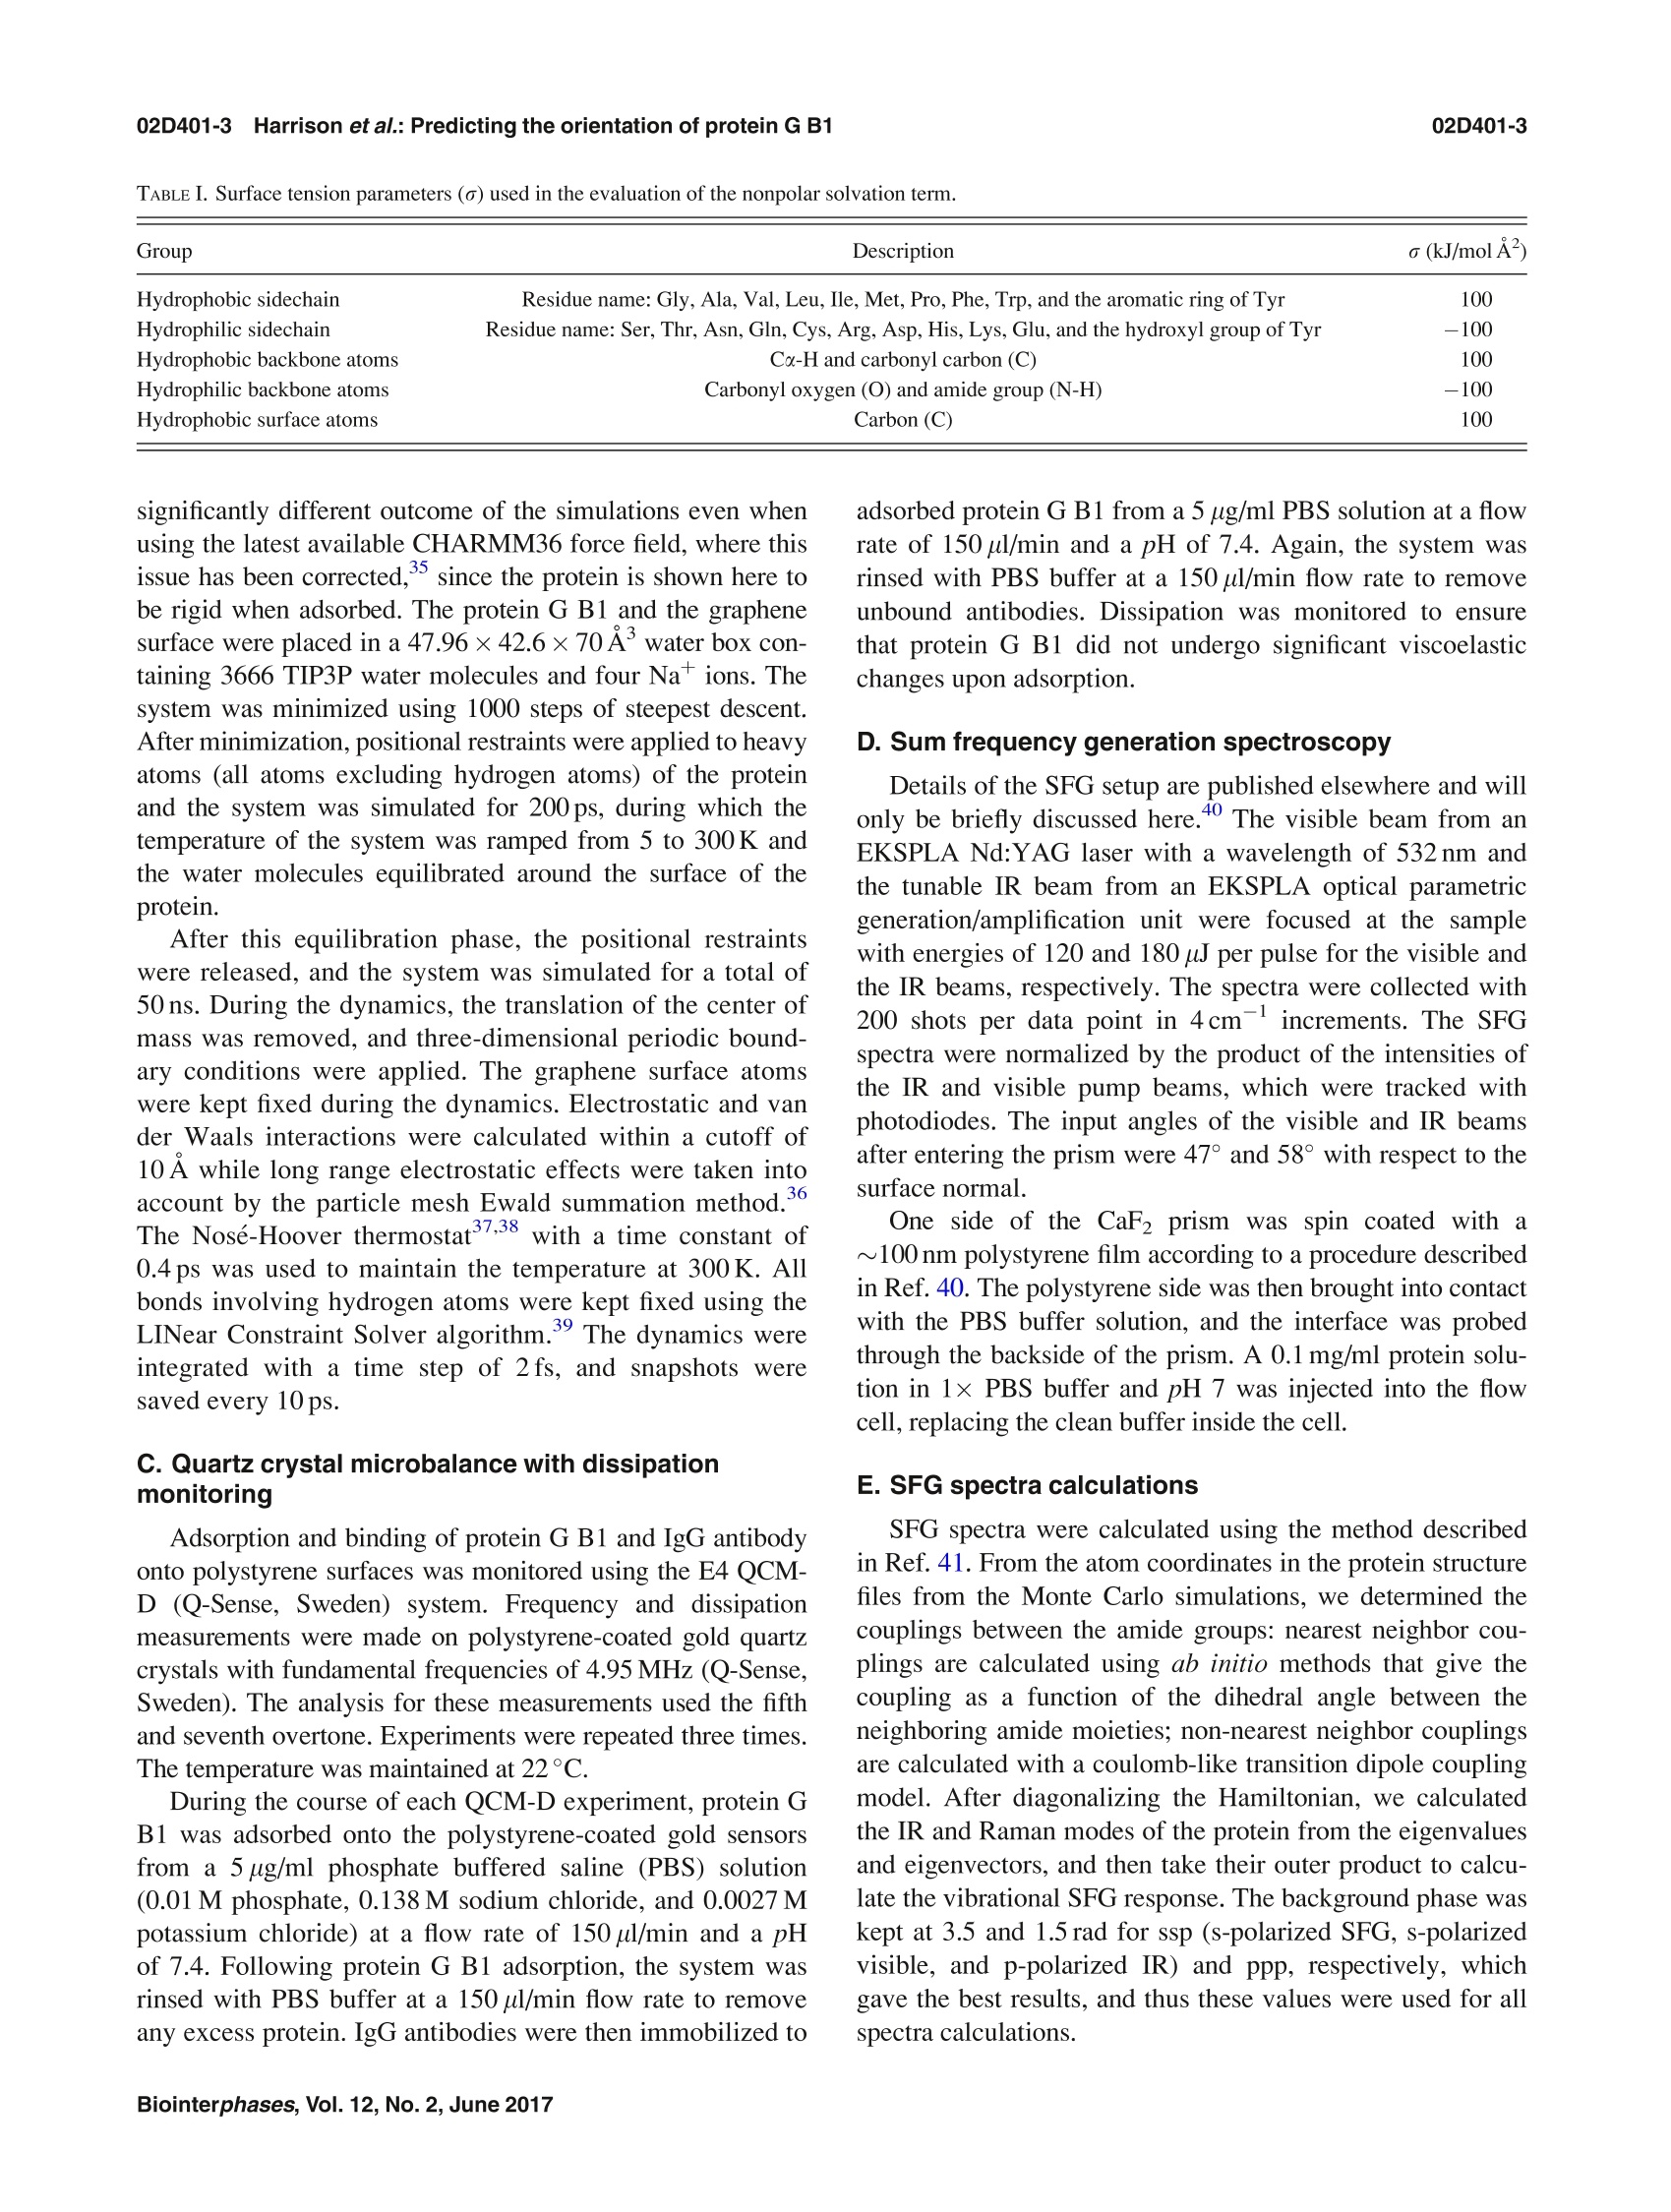
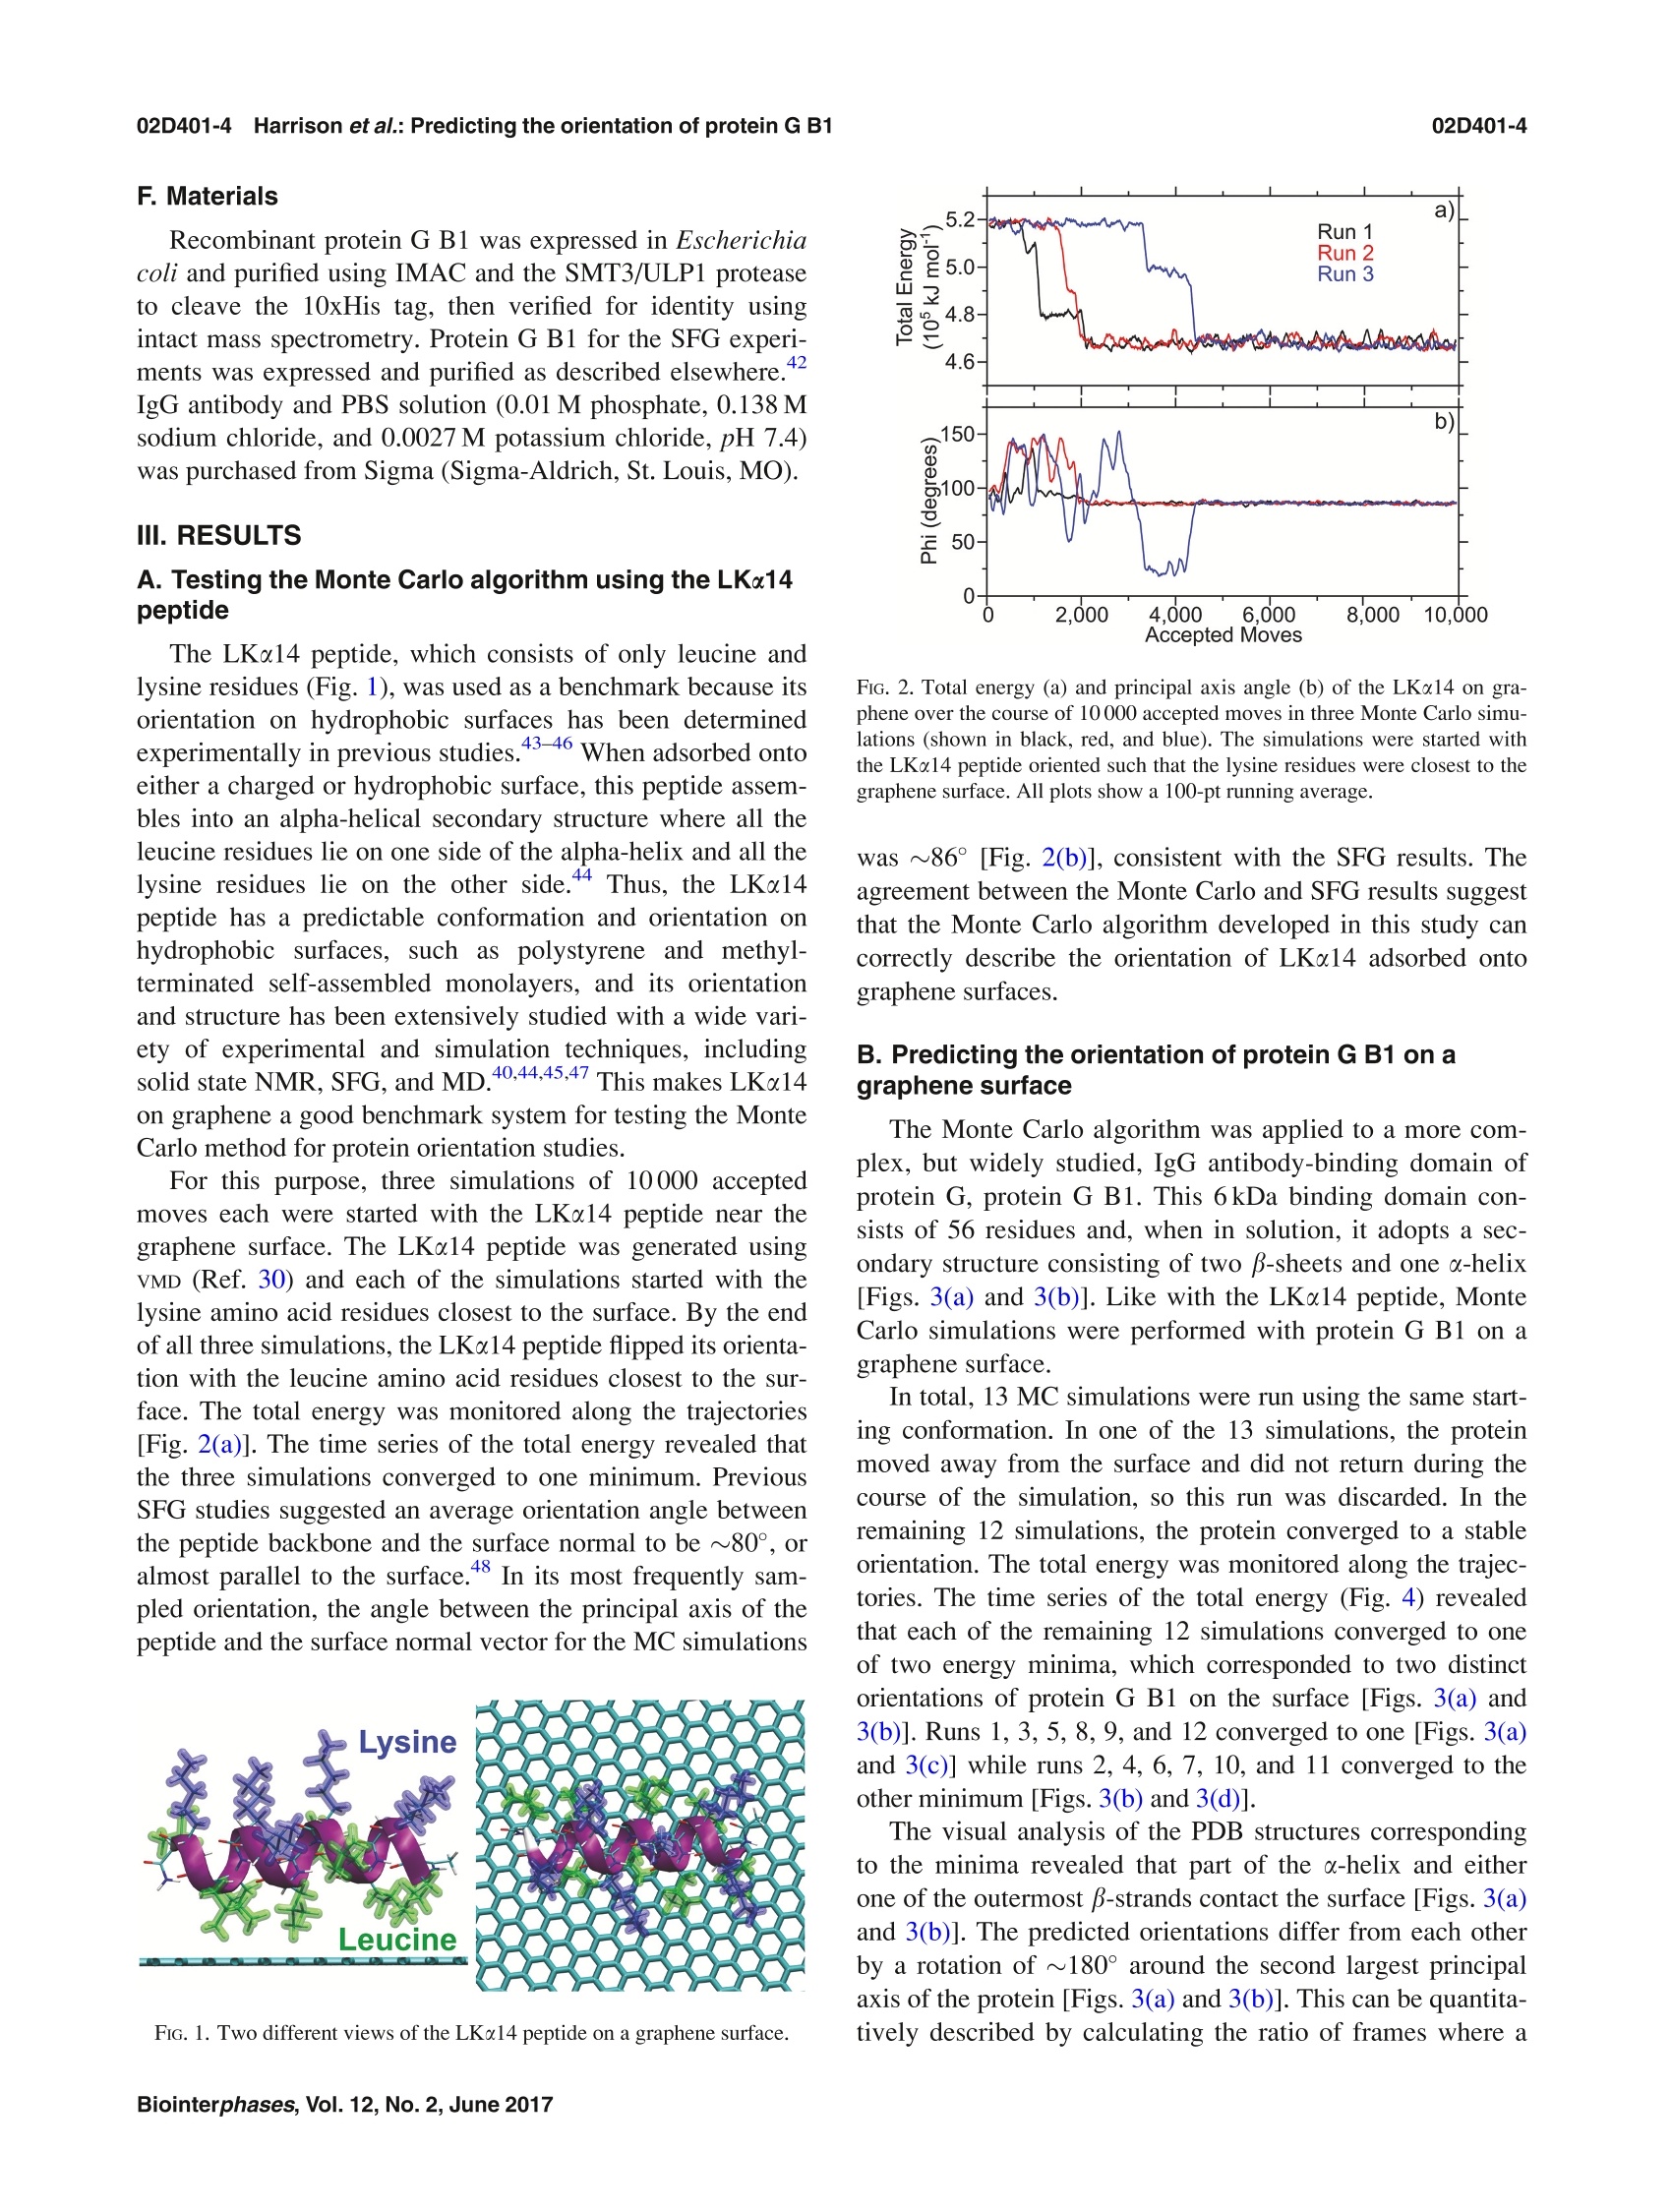
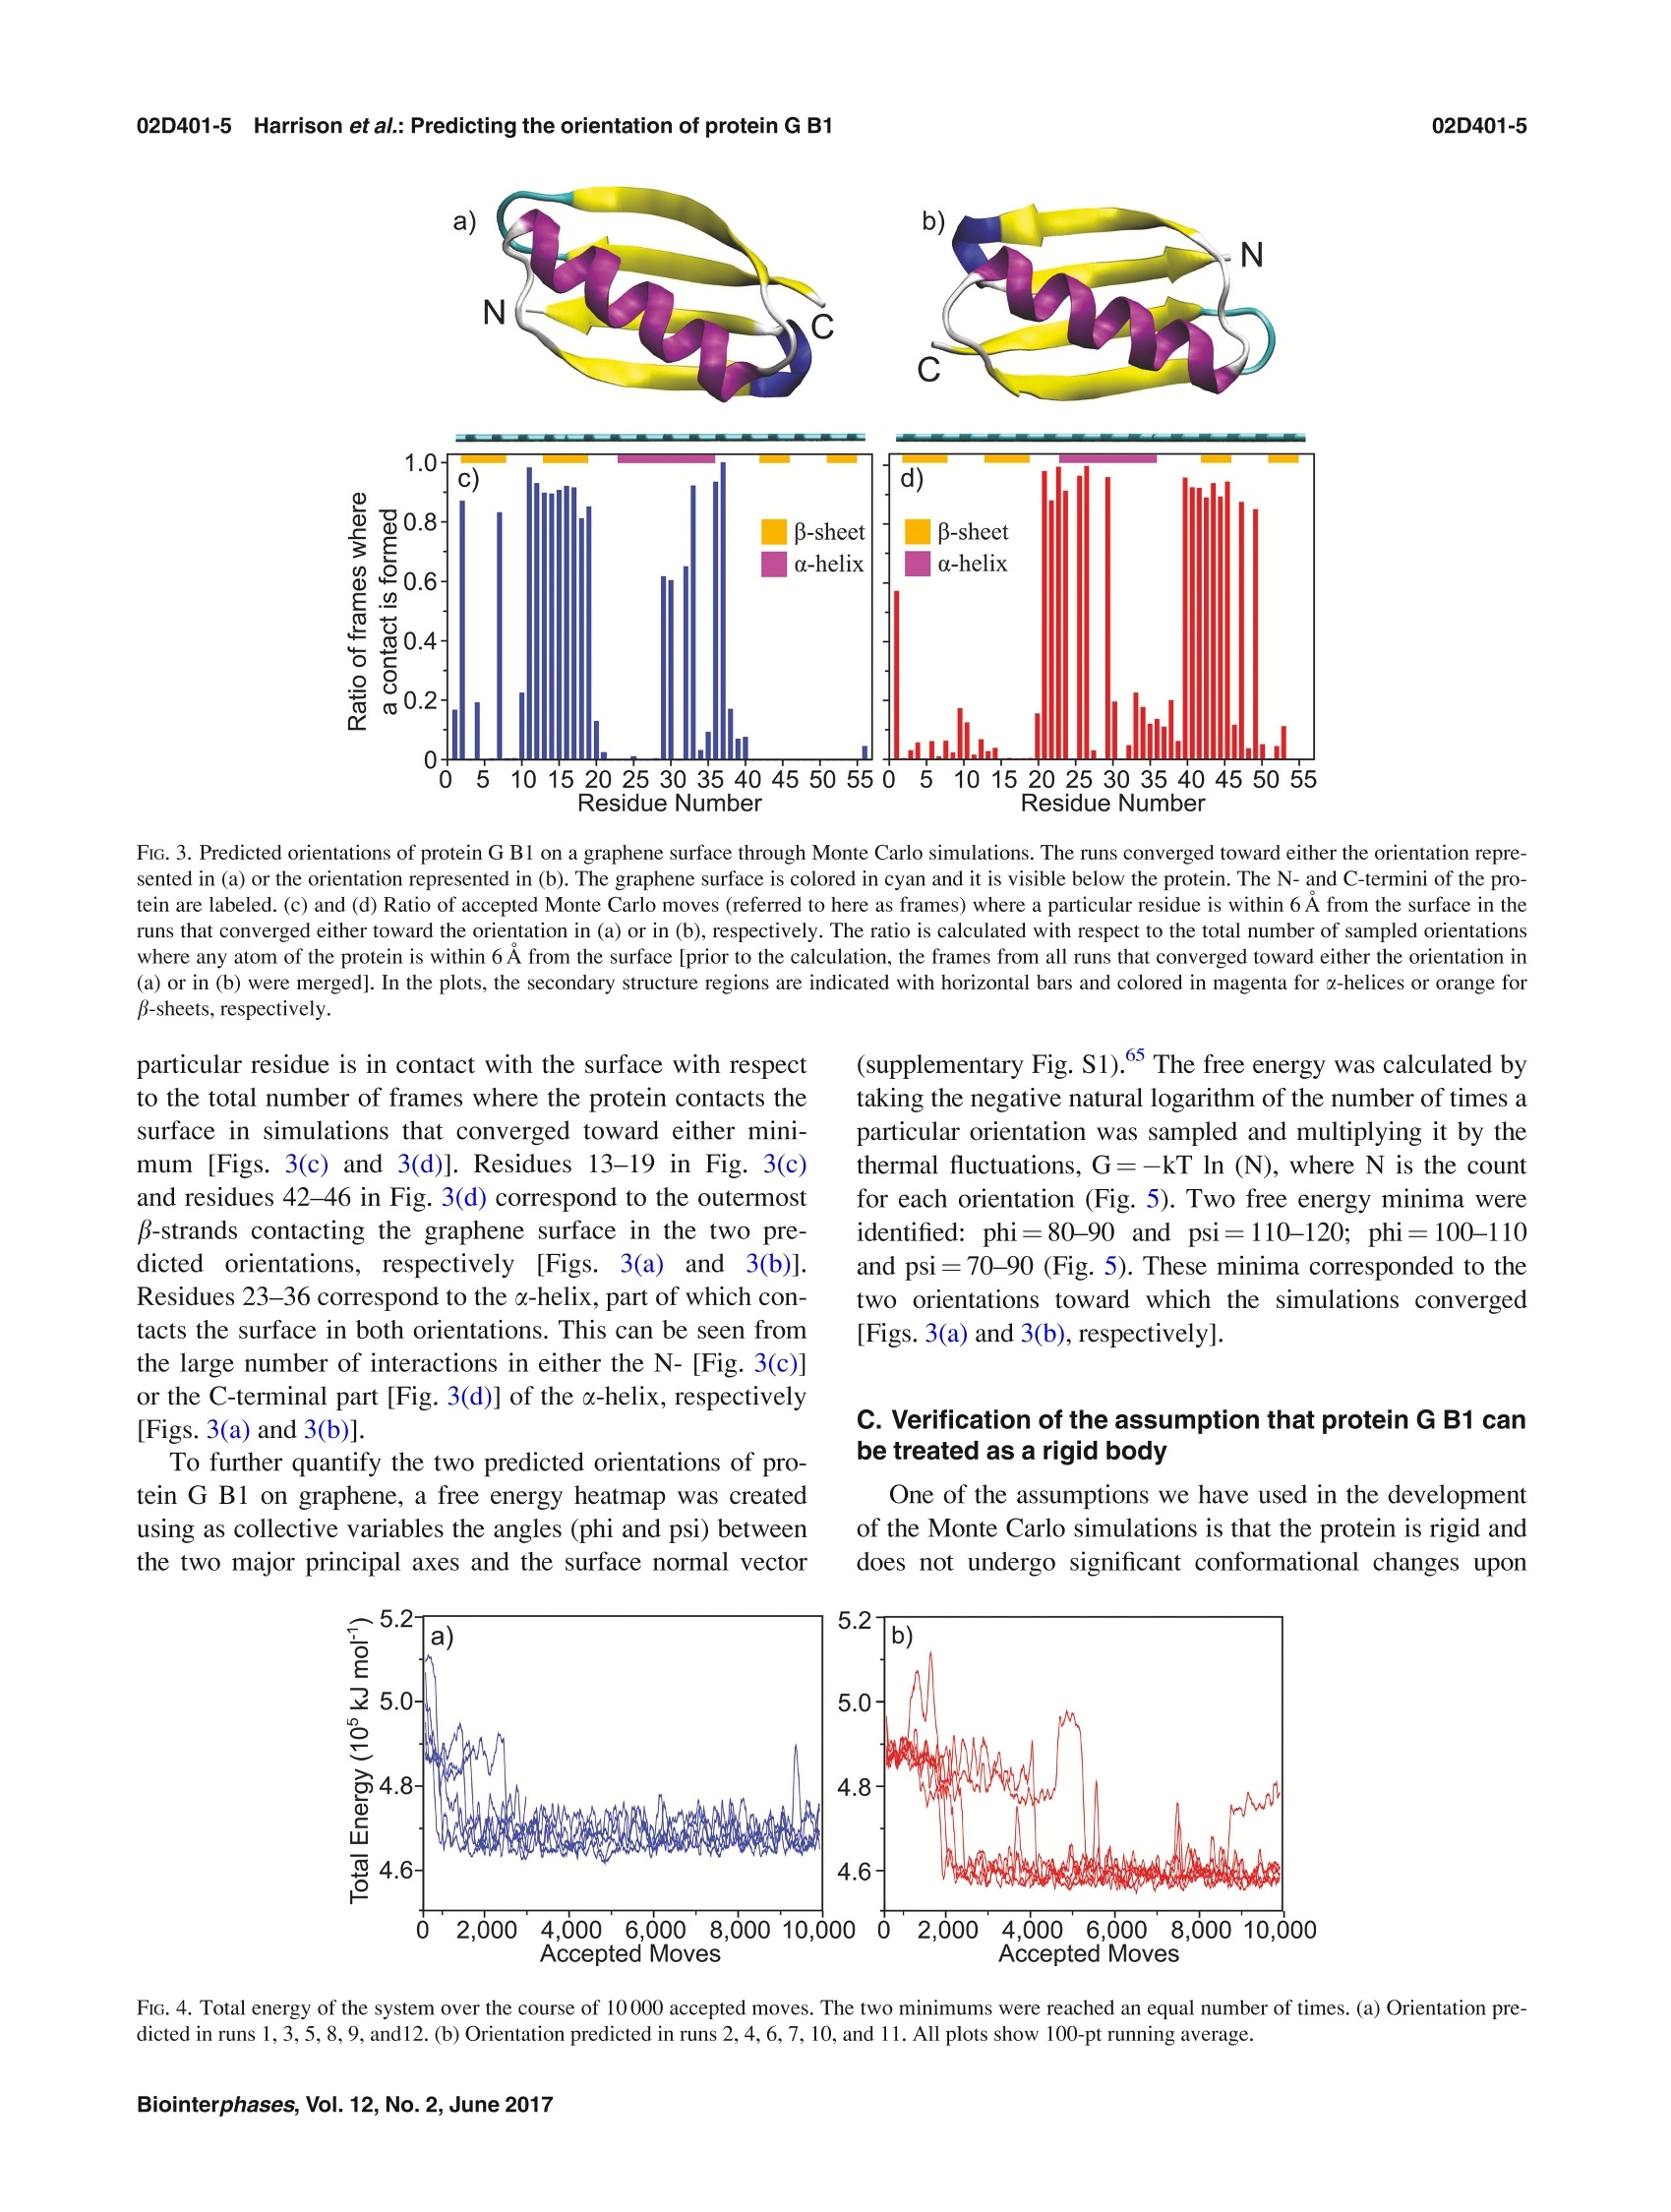
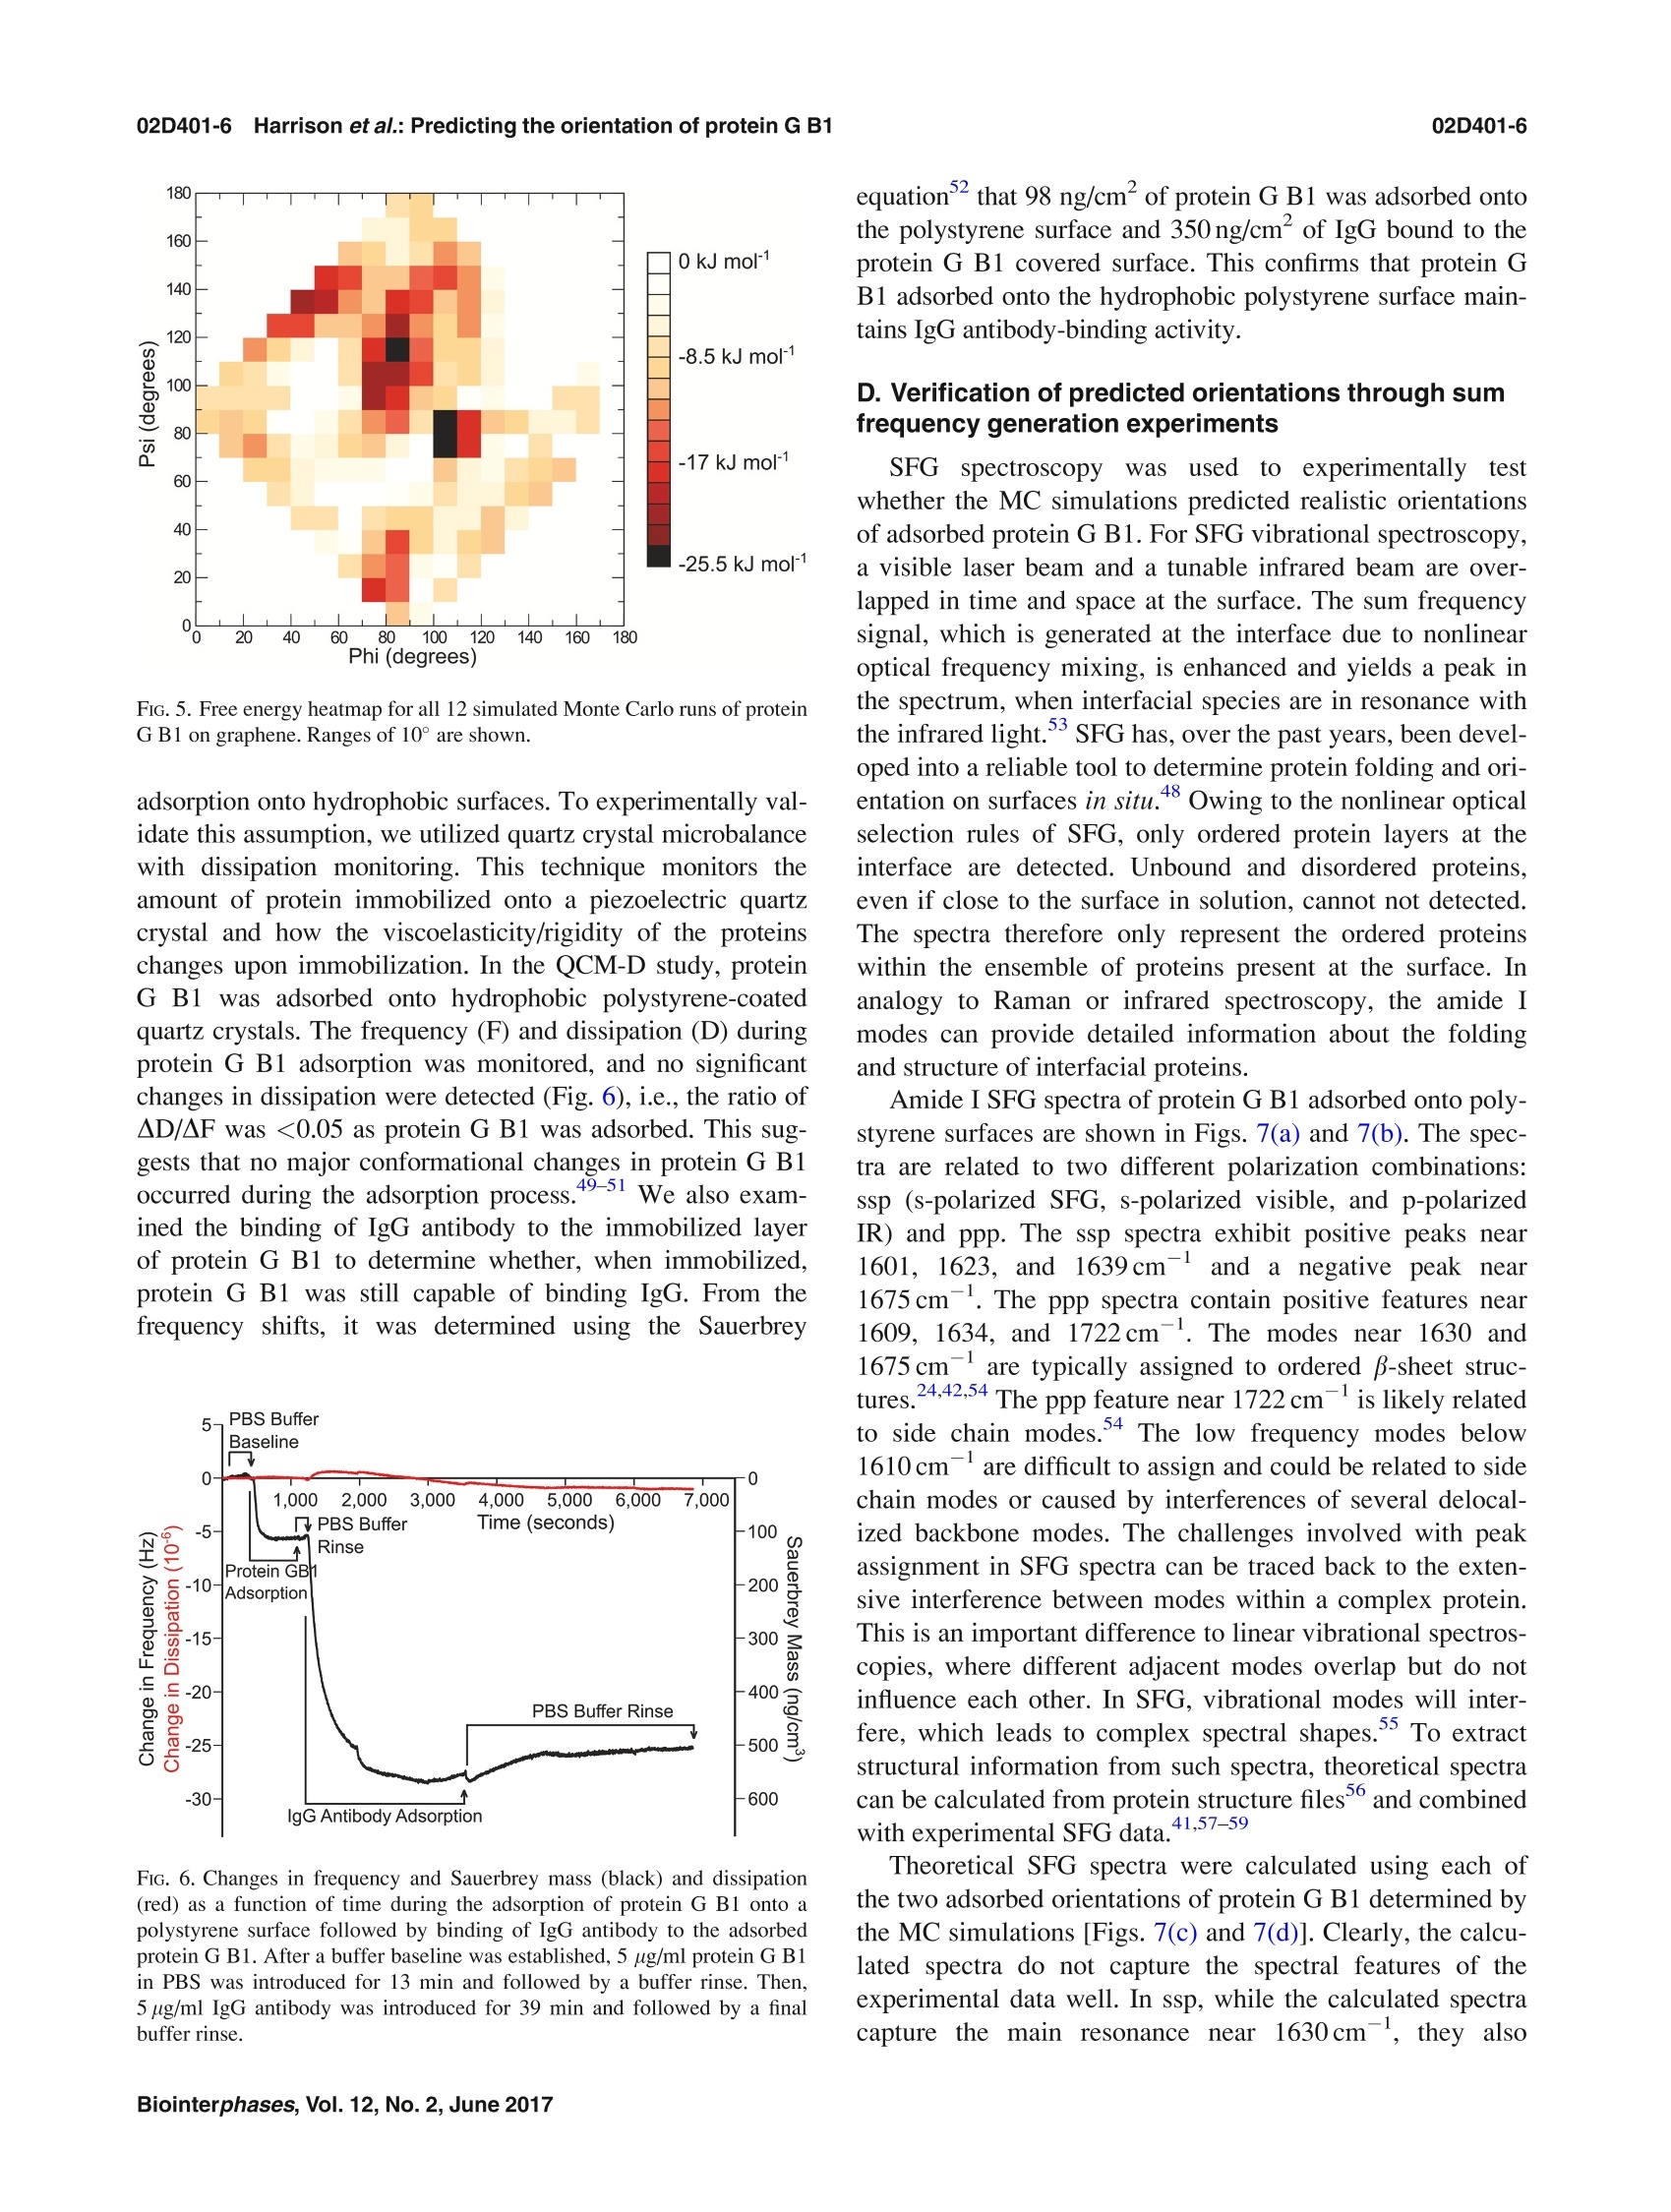
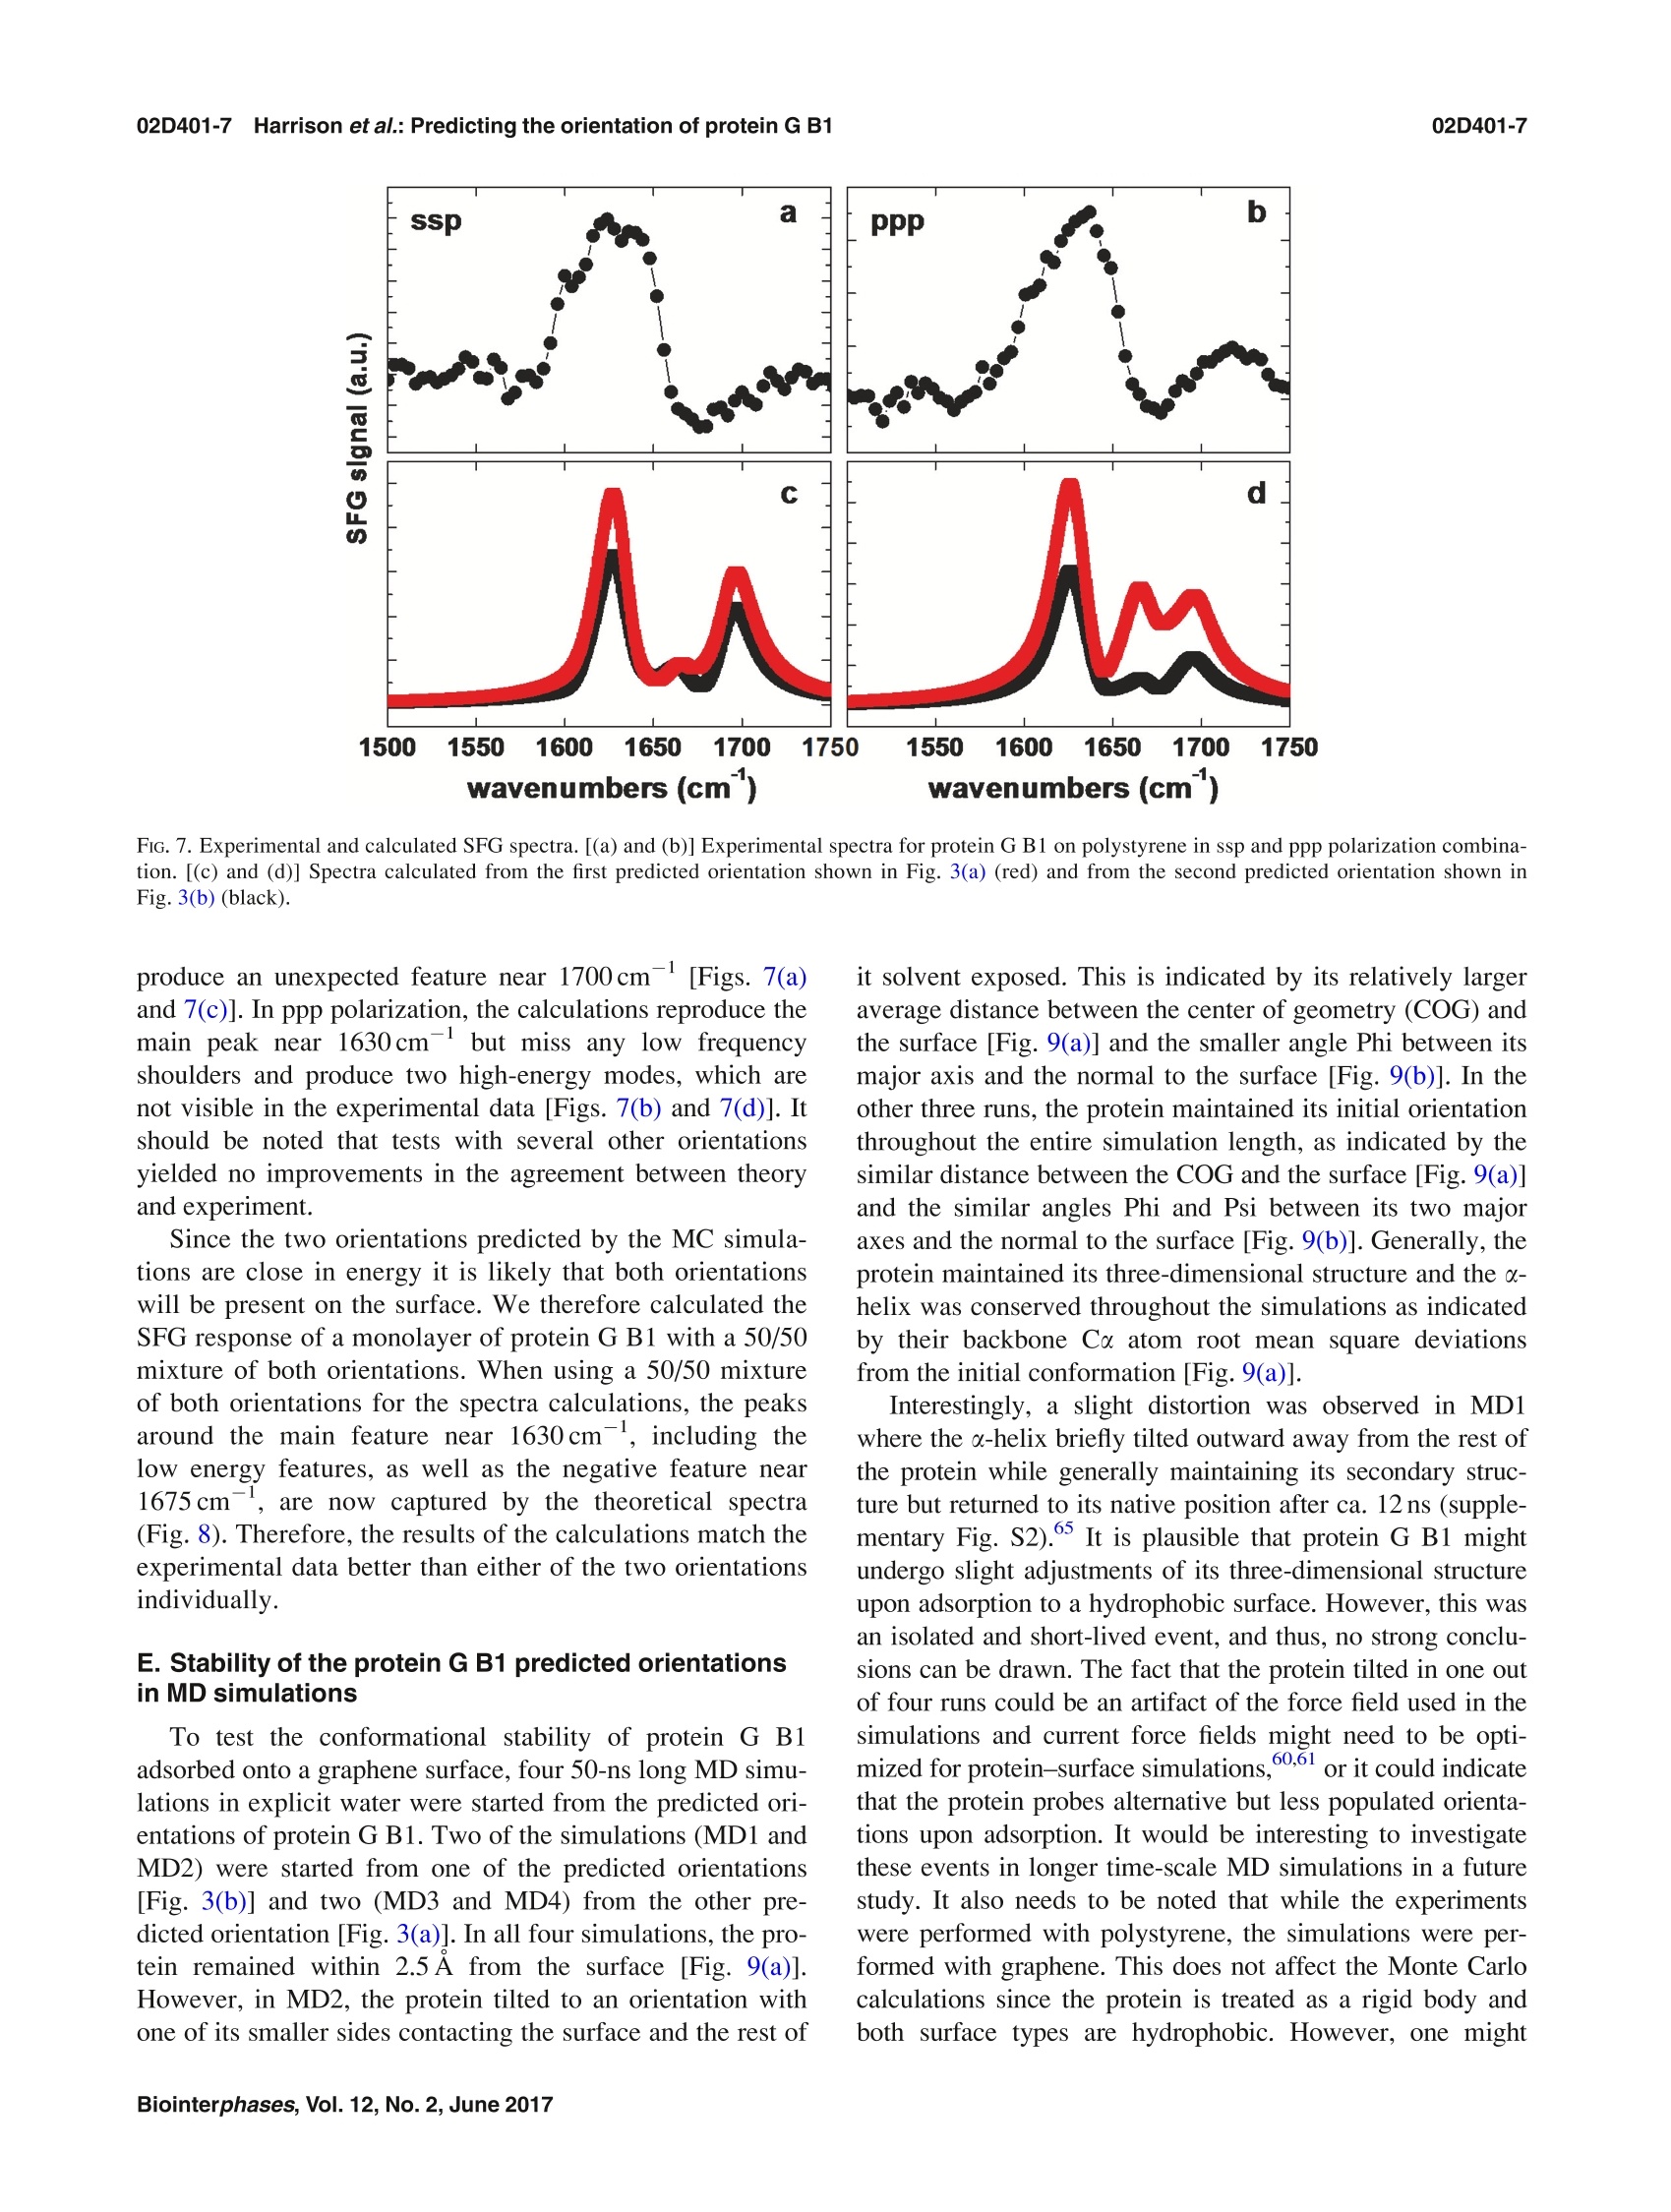
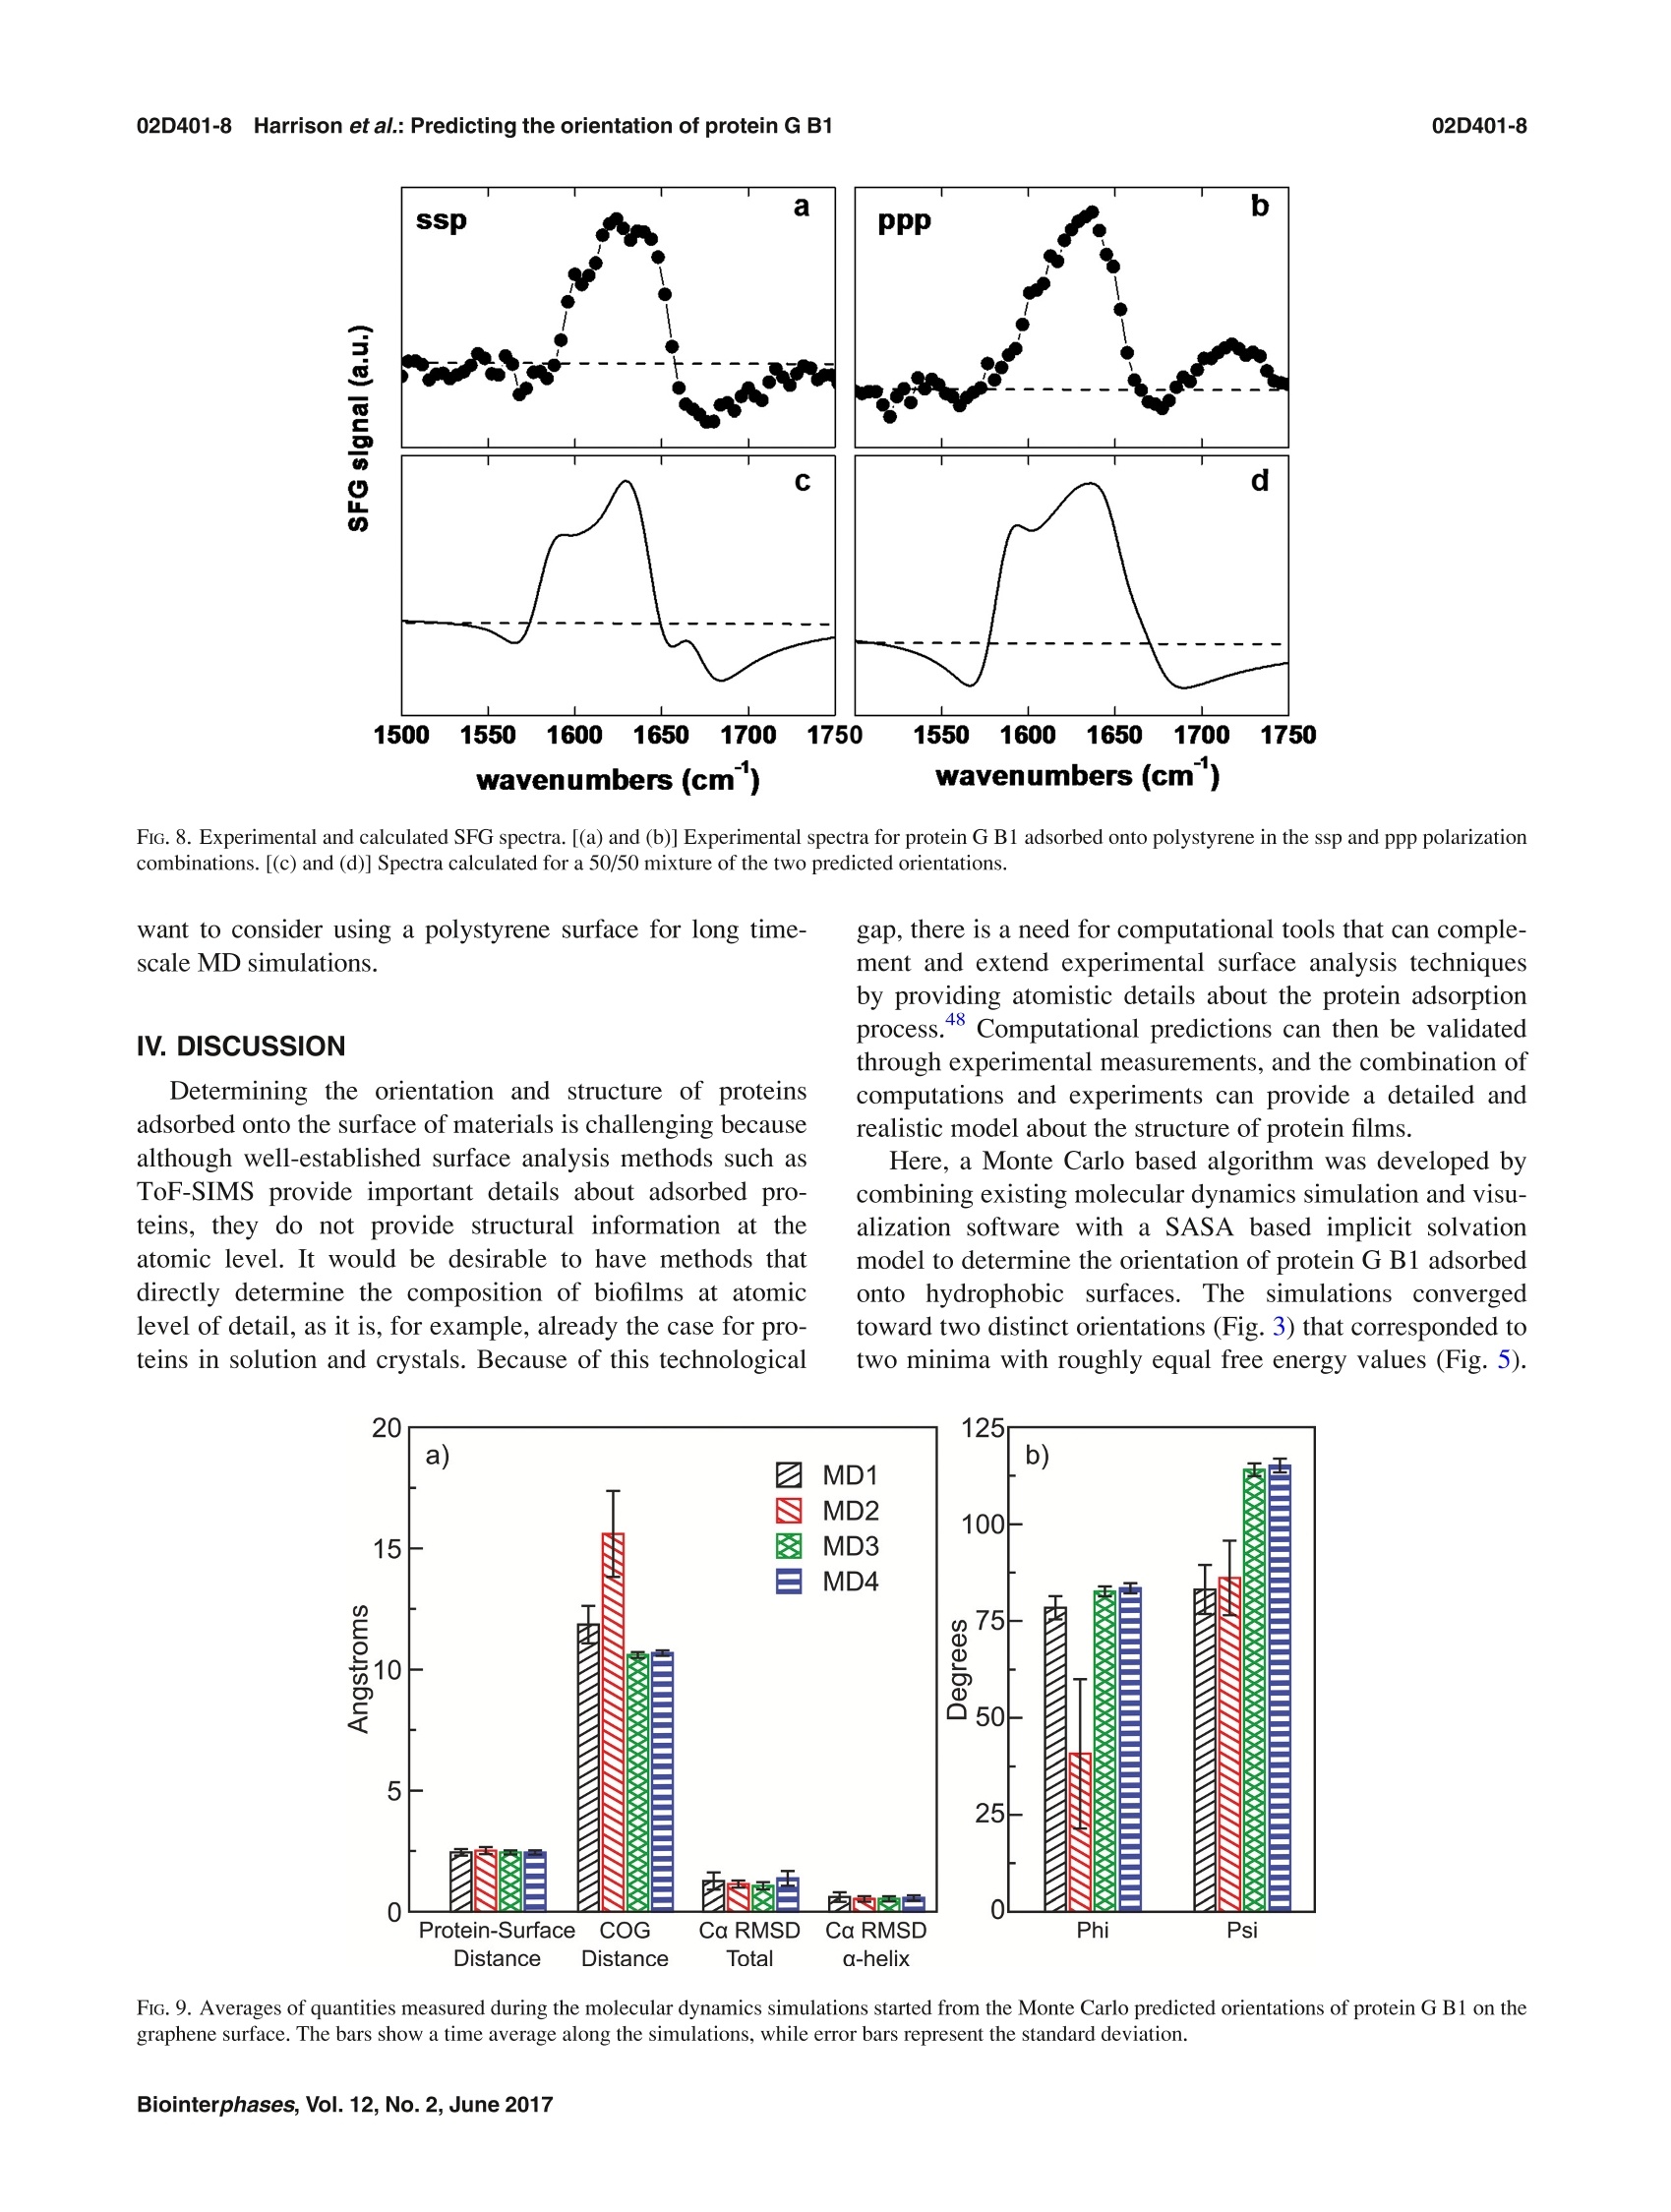
02D401-2.2Harrison et al.: Predicting the orientation of protein G B102D401-2 Predicting the orientation of protein G B1 on hydrophobic surfaces using Monte Carlosimulations Elisa T. Harrison, Tobias Weidner, David G. Castner, and Gianluca Interlandi Citation: Biointerphases 12, 02D401 (2017); doi: 10.1116/1.4971381 View online: https://doi.org/10.1116/1.4971381 View Table of Contents: https://avs.scitation.org/toc/bip/12/2 Published by the American Vacuum Society ARTICLES YOU MAY BE INTERESTED IN Orientation and characterization of immobilized antibodies for improved immunoassays (Review) Biointerphases 12,02D301 (2017); https://doi.org/10.1116/1.4978435 Biomedical surface analysis: Evolution and future directions (Review) Biointerphases 12,02C301 (2017); https://doi.org/10.1116/1.4982169 Identifying the selectivity of antimicrobial peptides to cell membranes by sum frequency generation spectroscopy Biointerphases 12,02D406 (2017); https://doi.org/10.1116/1.4982710 Application of advanced sampling and analysis methods to predict the structure of adsorbed protein on amaterial surface Biointerphases 12,02D409 (2017); https://doi.org/10.1116/1.4983274 Role of neutral transport in aspect ratio dependent plasma etching of three-dimensional featuresJournal of Vacuum Science & Technology A: Vacuum, Surfaces, and Films 35, 05C301 (2017); https://doi.org/10.1116/1.4973953 Preface: In Focus Issue on Protein Structures at Biointerfaces Biointerphases 12, 02D101 (2017); https://doi.org/10.1116/1.4987130 Plot, compare, and validateyour data with just a click .Spectra:'surface science Predicting the orientation of protein G B1 on hydrophobic surfaces usingMonte Carlo simulations Elisa T. Harrison Department of Chemical Engineering, University of Washington, Seattle, Washington 98195 Tobias Weidner Department of Chemistry, Aarhus University, 8000 Aarhus C,Denmark and Max Planck Institutefor Polymer Research, 55128 Mainz, Germany David G. Castner Department of Chemical Engineering, University of Washington, Seattle, Washington 98195andDepartment ofBioengineering, University of Washington, Seattle, Washington 98195 Gianluca Interlandia) Department of Bioengineering, University of Washington, Seattle, Washington 98195 (Received 25 August 2016; accepted 18 November 2016; published 6 December 2016) A Monte Carlo algorithm was developed to predict the most likely orientations of protein G B1, animmunoglobulin G (IgG) antibody-binding domain of protein G, adsorbed onto a hydrophobic surface.At each Monte Carlo step, the protein was rotated and translated as a rigid body. The assumption aboutrigidity was supported by quartz crystal microbalance with dissipation monitoring experiments, whichindicated that protein G B1 adsorbed on a polystyrene surface with its native structure conserved andshowed that its IgG antibody-binding activity was retained. The Monte Carlo simulations predictedthat protein G B1 is likely adsorbed onto a hydrophobic surface in two different orientations, character-ized as two mutually exclusive sets of amino acids contacting the surface. This was consistent withsum frequency generation (SFG) vibrational spectroscopy results. In fact, theoretical SFG spectra cal-culated from an equal combination of the two predicted orientations exhibited reasonable agreementwith measured spectra of protein G B1 on polystyrene surfaces. Also, in explicit solvent moleculardynamics simulations, protein G B1 maintained its predicted orientation in three out of four runs. Thiswork shows that using a Monte Carlo approach can provide an accurate estimate of a protein orienta-tion on a hydrophobic surface, which complements experimental surface analysis techniques and pro-vides an initial system to study the interaction between a protein and a surface in molecular dynamicssimulations. O 2016 Author(s). All article content, except where otherwise noted, is licensed undera Creative Commons Attribution (CC BY) license (http://creativecommons.org/licenses/by/4.0/). [http://dx.doi.org/10.1116/1.4971381] I.INTRODUCTION Materials in contact with the biological environment willimmediately become coated with proteins and this adsorbedprotein layer thus becomes the interface between the materialand species in the surrounding environment, such as proteins,antibodies, antigens, lipids, and cells.2 The orientation ofthe adsorbed proteins may influence the interaction of thematerial with the biological environment.’ For example,exposing active sites of binding proteins may increase effi-ciencies of in vitro diagnostic devices such as enzyme-linkedimmunosorbent assays (ELISAs). However, one main chal-lenge for developing and improving devices like ELISA isdetermining the conformation and orientation of the proteinswhen adsorbed onto a surface, especially when multicompo-nent protein films are present. In fact, besides the possibilityof undergoing conformational changes, protein moleculesadsorbed onto surfaces might also align in an ordered mannerwith respect to the surface. In this manuscript, the orientation of a protein is characterized by which amino acids contact thesurface and by the angle between the two major axes of sym-metry and the surface normal. As the need for the improve-ment and the complexity of devices such as ELISA increases,so does the need for the development of techniques that canprovide a complete understanding of protein-surface interac-tions. This includes characterizing both, how proteins areordered (i.e., their orientation with respect to the surface) andany conformational changes the proteins might undergo uponadsorption. Proteins immobilized onto surfaces have been extensivelystudied using experimental methods. Techniques such asquartz crystal microbalance with dissipation monitoring(QCM-D), surface plasmon resonance, and ellipsometry canprovide useful information such as binding efficiencies andkinetics of adsorbing proteins, but can only indirectly sug-gest orientation information since many other factors influ-ence protein binding.3.12 The surface sensitivity and thechemical specificity of time-of-flight secondary ion massspectrometry (ToF-SIMS) can provide conformation and ori-entation information by tracking changes in secondary ion intensities from amino acid fragments unevenly distributedthroughout the protein.13-15 However, while this techniquecan provide orientation information, the conformation andstructure of immobilized proteins may change upon beingdried and subjecting them to ultrahigh vacuum prior to anal-ysis. Sum frequency generation (SFG) vibrational spectros-copy provides orientation information since it relies on orderwithin the sample, and samples can be analyzed in solu-tion.16-18However, many of these techniques require thaall proteins are uniformly oriented on the surface and arelimited to providing an average orientation. For example, ifmultiple orientations of the protein exist on a given surface,extracting the different orientations from the experimentaldata becomes increasingly difficult as the number of orienta-tions increases. To complement and more completely interpret experi-mental results, the development of computational methodsis needed to predict the structure of proteins on surfaces.Classical molecular dynamics (MD) simulations can provideatomic-level information on interactions between proteinsand surfaces that may not be accessible with experimentaltechniques.19.20However, because of the vast conforma-tional space and large number of degrees of freedom presentwhen describing protein-surface interactions, classical MDsimulations are limited to time scales that may not be longenough to sample all protein orientations on the surface.The Monte Carlo-based method, Rosetta, has been devel-oped to efficiently sample the conformational space of aprotein,and it has been recently applied to study the inter-action between the protein statherin and hydroxyapatite.2However, Rosetta relies on a knowledge-based scoring func-tion, and currently not enough examples of protein-surfacesystems have been characterized at the level of detailrequired to correctly optimize Rosetta’s scoring function.Thus, there is the necessity to develop approaches that donot rely on the existence of fully characterized protein-sur-face models. In this work, we have developed a method to predict theorientation of proteins on surfaces based on Monte Carlosimulations and an implicit solvation model. The developedalgorithm was applied to determine the orientation of theLKα14 peptide and protein G B1 on a graphene surface. TheLKα14 peptide is a 14 amino-acid model peptide consistingof only leucine and lysine residues that was designed to forman o-helical secondary structure when immobilized ontoeither hydrophobic or hydrophilic surfaces.23 Since its orien-tation on surfaces is known, it was used here as a benchmark.The second, more complex system is protein G B1, a 6kDadomain of protein G which binds to the Fc region of immu-noglobulin (IgG) antibodies. This protein was chosen for thisstudy because of its stability, both in solution and immobi-lized on surfaces, and the availability of experimental data.The predictions from Monte Carlo simulations with proteinG B1 were validated through SFG experiments. Finally, MDsimulations in explicit solvent investigated the conforma-tional stability of protein G B1 on graphene surfaces. Thepresent work highlights how Monte Carlo simulations allow the sampling of protein orientations on surfaces at a lowercomputational cost than conventional MD simulations. Thepredictions can then be used to complement results from sur-face analysis experiments that do not provide atomic leveldetail or to start explicit solvent MD simulations to studyconformational changes of the protein at the interface with asurface. II.MATERIALS AND METHODS A. Monte Carlo simulations The Monte Carlo simulations performed here are based onthe Metropolis criterion.25.26 At each Monte Carlo step, theprotein was randomly translated and rotated as a rigid bodywhile the surface was kept frozen. Periodic boundary condi-tions were applied to simulate an infinite surface. After amove, the total energy of the system was evaluated, and themove was accepted or rejected according to the Metropoliscriterion.25,26t The accepted orientations thus satisfy theBoltzmann distribution. The total energy of the system con-sisted of a van der Waals (VDW) interaction term and a sol-vation term to account for the hydrophobic effect. The VDWenergy term was calculated using the program GROMACs 4.6(Ref. 27) with the CHARMM22 force field. Electrostaticinteractions did not need to be calculated because grapheneconsists of only carbon atoms with neutral charges. Futureversions of the algorithm that include surfaces with polargroups will need to consider also electrostatic interactions. To take solvation effects into account, we introduced anonpolar solvation term based on the solvent accessible sur-face area (SASA). This allowed us to penalize orientationswhere hydrophobic atoms, in both the protein and surface, areexposed to the solvent. The nonpolar solvation energy termwas calculated by multiplying a surface tension parameter (o)by the SASA of the groups of atoms listed in Table I. TheSASA was calculated using a 1.4 A probing radius by meansof the GROMAcs package. The script is written in TOOLKIT command language andruns using the program VISUAL MOLECULAR DYNAMICS (VMD).The crystallographic structure of protein G B1 (PDB code1PGA) was used. Prior to the Monte Carlo simulation, thecoordinates of the protein were minimized in a generalizedBorn implicit solvent31,32 with 1000 steps of steepest descentby means of the program GROMACs.2 Three Monte Carlosimulations were run for the LKo14 peptide and 13 MonteCarlo simulations were run for protein G B1. Each simula-tion was run for a total of 10 000 accepted moves, duringwhich all but one simulation with protein G B1 converged toa stable orientation. B.Molecular dynamics simulations The MD simulations were performed using the programGROMACS 4.6 (Ref. 27) with the CHARMM22 force fieldcontaining the correction map (CMAP) extension3334 (this isgenerally referred to as the CHARMM22/CMAP force field).Although the force field used here is known to overestimatethe stability of a-helical structures, we do not expect a Group Description c(kJ/molA3) Hydrophobic sidechain Residue name: Gly, Ala, Val, Leu, Ile, Met, Pro, Phe, Trp, and the aromatic ring of Tyr 100 Hydrophilic sidechain Residue name: Ser, Thr, Asn, Gln, Cys, Arg, Asp, His, Lys, Glu, and the hydroxyl group of Tyr -100 Hydrophobic backbone atoms Ca-H and carbonyl carbon (C) 100 Hydrophilic backbone atoms Carbonyl oxygen (O) and amide group (N-H) -100 Hydrophobic surface atoms Carbon(C) 100 significantly different outcome of the simulations even whenusing the latest available CHARMM36 force field, where thisissue has been corrected, since the protein is shown here tobe rigid when adsorbed. The protein G B1 and the graphenesurface were placed in a 47.96×42.6×70A water box con-taining 3666 TIP3P water molecules and four Na ions. Thesystem was minimized using 1000 steps of steepest descent.After minimization, positional restraints were applied to heavyatoms (all atoms excluding hydrogen atoms) of the proteinand the system was simulated for 200 ps, during which thetemperature of the system was ramped from 5 to 300 K andthe water molecules equilibrated around the surface of theprotein. After this equilibration phase, the positional restraintswere released, and the system was simulated for a total of50 ns. During the dynamics, the translation of the center ofmass was removed, and three-dimensional periodic bound-ary conditions were applied. The graphene surface atomswere kept fixed during the dynamics. Electrostatic and vander Waals interactions were calculated within a cutoff of10 A while long range electrostatic effects were taken intoaccount by the particle mesh Ewald summation method.36The Nose-Hoover thermostat37,38’with a time constant of0.4 ps was used to maintain the temperature at 300 K. Allbonds involving hydrogen atoms were kept fixed using theLINear Constraint Solver algorithm.The dynamics wereintegrated with a time step of 2fs, and snapshots weresaved every 10 ps. C. Quartz crystal microbalance with dissipationmonitoring Adsorption and binding of protein G B1 and IgG antibodyonto polystyrene surfaces was monitored using the E4 QCM-D (Q-Sense, Sweden) system. Frequency and dissipationmeasurements were made on polystyrene-coated gold quartzcrystals with fundamental frequencies of 4.95 MHz (Q-Sense,Sweden). The analysis for these measurements used the fifthand seventh overtone. Experiments were repeated three times.The temperature was maintained at 22 °C. During the course of each QCM-D experiment, protein GB1 was adsorbed onto the polystyrene-coated gold sensorsfrom a 5ug/ml phosphate buffered saline (PBS) solution(0.01 M phosphate, 0.138 M sodium chloride, and 0.0027 Mpotassium chloride) at a flow rate of 150 ul/min and a pHof 7.4. Following protein G B1 adsorption, the system wasrinsed with PBS buffer at a 150 ul/min flow rate to removeany excess protein. IgG antibodies were then immobilized to adsorbed protein G B1 from a 5 ug/ml PBS solution at a flowrate of 150 ul/min and a pH of 7.4. Again, the system wasrinsed with PBS buffer at a 150 ul/min flow rate to removeunbound antibodies. Dissipation was monitored to ensurethat protein G B1 did not undergo significant viscoelasticchanges upon adsorption. D. Sum frequency generation spectroscopy Details of the SFG setup are published elsewhere and willonly be briefly discussed here. The visible beam from anEKSPLA Nd:YAG laser with a wavelength of 532 nm andthe tunable IR beam from an EKSPLA optical parametricgeneration/amplification unit were focused at the samplewith energies of 120 and 180 uJ per pulse for the visible andthe IR beams, respectively. The spectra were collected with200 shots per data point in 4cm increments. The SFGspectra were normalized by the product of the intensities ofthe IR and visible pump beams, which were tracked withphotodiodes. The input angles of the visible and IR beamsafter entering the prism were 47° and 58°with respect to thesurface normal. One side of the CaF2 prism was spin coated with a~100 nm polystyrene film according to a procedure describedin Ref. 40. The polystyrene side was then brought into contactwith the PBS buffer solution, and the interface was probedthrough the backside of the prism. A 0.1 mg/ml protein solu-tion in 1× PBS buffer and pH 7 was injected into the flowcell, replacing the clean buffer inside the cell. E. SFG spectra calculations SFG spectra were calculated using the method describedin Ref. 41. From the atom coordinates in the protein structurefiles from the Monte Carlo simulations, we determined thecouplings between the amide groups: nearest neighbor cou-plings are calculated using ab initio methods that give thecoupling as a function of the dihedral angle between theneighboring amide moieties; non-nearest neighbor couplingsare calculated with a coulomb-like transition dipole couplingmodel. After diagonalizing the Hamiltonian, we calculatedthe IR and Raman modes of the protein from the eigenvaluesand eigenvectors, and then take their outer product to calcu-late the vibrational SFG response. The background phase waskept at 3.5 and 1.5 rad for ssp (s-polarized SFG, s-polarizedvisible, and p-polarized IR) and ppp, respectively, whichgave the best results, and thus these values were used for allspectra calculations. F. Materials Recombinant protein G B1 was expressed in Escherichiacoli and purified using IMAC and the SMT3/ULP1 proteaseto cleave the 10xHis tag, then verified for identity usingintact mass spectrometry. Protein G B1 for the SFG experi-m42ents was expressed and purified as described elsewhere.IgG antibody and PBS solution (0.01 M phosphate, 0.138 Msodium chloride, and 0.0027 M potassium chloride,pH 7.4)was purchased from Sigma (Sigma-Aldrich, St. Louis, MO). III. RESULTS A. Testing the Monte Carlo algorithm using the LKo14peptide The LKo14 peptide, which consists of only leucine andlysine residues (Fig.1), was used as a benchmark because itsorientation on hydrophobic surfaces has been determinedexperimentally in previous studies.43-46 When adsorbed ontoeither a charged or hydrophobic surface,this peptide assem-bles into an alpha-helical secondary structure where all theleucine residues lie on one side of the alpha-helix and all thelysine residues lie on the other side.44 Thus, the LKo14peptide has a predictable conformation and orientation onhydrophobic surfaces, such as polystyrene and methyl-terminated self-assembled monolayers, and its orientationand structure has been extensively studied with a wide vari-ety of experimental and simulation techniques, includingsolid state NMR, SFG, and MD.40,44,45,47 This makes LKo14on graphene a good benchmark system for testing the MonteCarlo method for protein orientation studies. For this purpose, three simulations of 10000 acceptedmoves each were started with the LKo14 peptide near thegraphene surface. The LKo14 peptide was generated usingVMD (Ref. 30) and each of the simulations started with thelysine amino acid residues closest to the surface. By the endof all three simulations, the LKo14 peptide flipped its orienta-tion with the leucine amino acid residues closest to the sur-face. The total energy was monitored along the trajectories[Fig. 2(a)].The time series of the total energy revealed thatthe three simulations converged to one minimum. PreviousSFG studies suggested an average orientation angle betweenthe peptide backbone and the surface normal to be ~80°, oralmost parallel to the surface.48 In its most frequently sam-pled orientation,the angle between the principal axis of thepeptide and the surface normal vector for the MC simulations FiG.1. Two different views of the LKo14 peptide on a graphene surface. FiG. 2. Total energy (a) and principal axis angle (b) of the LKo14 on gra-phene over the course of 10 000 accepted moves in three Monte Carlo simu-lations (shown in black, red, and blue). The simulations were started withthe LKα14 peptide oriented such that the lysine residues were closest to thegraphene surface. All plots show a 100-pt running average. was ~86°[Fig. 2(b)], consistent with the SFG results. Theagreement between the Monte Carlo and SFG results suggestthat the Monte Carlo algorithm developed in this study cancorrectly describe the orientation of LKα14 adsorbed ontographene surfaces. B. Predicting the orientation of protein G B1 on agraphene surface The Monte Carlo algorithm was applied to a more com-plex, but widely studied, IgG antibody-binding domain ofprotein G, protein G B1. This 6kDa binding domain con-sists of 56 residues and, when in solution, it adopts a sec-ondary structure consisting of two B-sheets and one a-helix[Figs. 3(a) and 3(b)]. Like with the LKα14 peptide, MonteCarlo simulations were performed with protein G B1 on agraphene surface. In total, 13 MC simulations were run using the same start-ing conformation. In one of the 13 simulations, the proteinmoved away from the surface and did not return during thecourse of the simulation, so this run was discarded. In theremaining 12 simulations, the protein converged to a stableorientation. The total energy was monitored along the trajec-tories. The time series of the total energy (Fig. 4) revealedthat each of the remaining 12 simulations converged to oneof two energy minima, which corresponded to two distinctorientations of protein G B1 on the surface [Figs. 3(a) and3(b)]. Runs 1, 3, 5,8, 9, and 12 converged to one [Figs. 3(a)and 3(c)] while runs 2, 4, 6, 7, 10, and 11 converged to theother minimum [Figs. 3(b) and 3(d)]. The visual analysis of the PDB structures correspondingto the minima revealed that part of the a-helix and eitherone of the outermost B-strands contact the surface [Figs. 3(a)and 3(b)].The predicted orientations differ from each otherby a rotation of ~180°around the second largest principalaxis of the protein [Figs. 3(a) and 3(b)]. This can be quantita-tively described by calculating the ratio of frames where a FiG. 3. Predicted orientations of protein G B1 on a graphene surface through Monte Carlo simulations. The runs converged toward either the orientation repre-sented in (a) or the orientation represented in (b). The graphene surface is colored in cyan and it is visible below the protein. The N- and C-termini of the pro-tein are labeled. (c) and (d) Ratio of accepted Monte Carlo moves (referred to here as frames) where a particular residue is within 6 A from the surface in theruns that converged either toward the orientation in (a) or in (b), respectively. The ratio is calculated with respect to the total number of sampled orientationswhere any atom of the protein is within 6 A from the surface [prior to the calculation, the frames from all runs that converged toward either the orientation in(a) or in (b) were merged]. In the plots, the secondary structure regions are indicated with horizontal bars and colored in magenta for a-helices or orange forβ-sheets,respectively. particular residue is in contact with the surface with respectto the total number of frames where the protein contacts thesurface in simulations that converged toward either mini-mum [Figs. 3(c) and 3(d)]. Residues 13-19 in Fig.3(c)and residues 42-46 in Fig.3(d) correspond to the outermostB-strands contacting the graphene surface in the two pre-dicted orientations, respectively [Figs. 3(a)and3(b)].Residues 23-36 correspond to the o-helix, part of which con-tacts the surface in both orientations. This can be seen fromthe large number of interactions in either the N-[Fig. 3(c)]or the C-terminal part [Fig. 3(d)] of the o-helix,respectively[Figs. 3(a) and 3(b)1. (supplementary Fig. S1). The free energy was calculated bytaking the negative natural logarithm of the number of times aparticular orientation was sampled and multiplying it by thethermal fluctuations, G=-kT ln (N), where N is the countfor each orientation (Fig. 5). Two free energy minima wereidentified: phi=80-90 and psi=110-120; phi=100-110and psi=70-90 (Fig.5). These minima corresponded to thetwo orientations toward which the simulations converged[Figs. 3(a) and 3(b), respectively]. C. Verification of the assumption that protein G B1 canbe treated as a rigid body To further quantify the two predicted orientations of pro-tein G B1 on graphene, a free energy heatmap was createdusing as collective variables the angles (phi and psi) betweenthe two major principal axes and the surface normal vector One of the assumptions we have used in the developmentof the Monte Carlo simulations is that the protein is rigid anddoes not undergo significant conformational changes upon FiG. 4. Total energy of the system over the course of 10 000 accepted moves. The two minimums were reached an equal number of times. (a) Orientation pre-dicted in runs 1, 3, 5, 8,9, and12. (b) Orientation predicted in runs 2, 4, 6, 7, 10, and 11. All plots show 100-pt running average. FIG. 5. Free energy heatmap for all 12 simulated Monte Carlo runs of proteinG B1 on graphene. Ranges of 10°are shown. adsorption onto hydrophobic surfaces. To experimentally val-idate this assumption, we utilized quartz crystal microbalancewith dissipation monitoring. This technique monitors theamount of protein immobilized onto a piezoelectric quartzcrystal and how the viscoelasticity/rigidity of the proteinschanges upon immobilization. In the QCM-D study, proteinG B1 was adsorbed onto hydrophobic polystyrene-coatedquartz crystals. The frequency (F) and dissipation (D) duringprotein G B1 adsorption was monitored, and no significantchanges in dissipation were detected (Fig. 6),i.e., the ratio ofAD/AF was <0.05 as protein G B1 was adsorbed. This sug-gests that no major conformational changes in protein G Bloccurred during the adsorption process.49 51 We also exam-ined the binding of IgG antibody to the immobilized layerof protein G B1 to determine whether, when immobilized,protein G B1 was still capable of binding IgG. From thefrequency shifts, it was determined using the Sauerbrey FiG. 6. Changes in frequency and Sauerbrey mass (black) and dissipation(red) as a function of time during the adsorption of protein G B1 onto apolystyrene surface followed by binding of IgG antibody to the adsorbedprotein G B1. After a buffer baseline was established, 5 ug/ml protein G B1in PBS was introduced for 13 min and followed by a buffer rinse. Then,5 ug/ml IgG antibody was introduced for 39 min and followed by a finalbuffer rinse. equationthat 98 ng/cm’of protein G B1 was adsorbed ontothe polystyrene surface and 350ng/cm’ of IgG bound to theprotein G B1 covered surface. This confirms that protein GB1 adsorbed onto the hydrophobic polystyrene surface main-tains IgG antibody-binding activity. D. Verification of predicted orientations through sumfrequency generation experiments SFG spectroscopy was used to experimentally testwhether the MC simulations predicted realistic orientationsof adsorbed protein G B1. For SFG vibrational spectroscopy,a visible laser beam and a tunable infrared beam are over-lapped in time and space at the surface. The sum frequencysignal, which is generated at the interface due to nonlinearoptical frequency mixing, is enhanced and yields a peak inthe spectrum, when interfacial species are in resonance withthe infrared light.SFG has, over the past years, been devel-oped into a reliable tool to determine protein folding and ori-entation on surfaces in situ.48 Owing to the nonlinear opticalselection rules of SFG, only ordered protein layers at theinterface are detected. Unbound and disordered proteins,even if close to the surface in solution. cannot not detected.The spectra therefore only represent the ordered proteinswithin the ensemble of proteins present at the surface. Inanalogy to Raman or infrared spectroscopy, the amide Imodes can provide detailed information about the foldingand structure of interfacial proteins. Amide I SFG spectra of protein G B1 adsorbed onto poly-styrene surfaces are shown in Figs. 7(a) and 7(b). The spec-tra are related to two different polarization combinations:ssp (s-polarized SFG, s-polarized visible, and p-polarizedIR) and ppp. The ssp spectra exhibit positive peaks near1601, 1623, and1 1639cm- and a negative peak near1675cm. The ppp spectra contain positive features near1609, 1634, and 1722cm-. The modes near 1630 and1675cmare typically assigned to ordered B-sheet struc-tures.24,42.54The ppp feature near 1722 cm- is likely relatedto side chain modes.4 The low frequency modes below1610cm-are difficult to assign and could be related to sidechain modes or caused by interferences of several delocal-ized backbone modes. The challenges involved with peakassignment in SFG spectra can be traced back to the exten-sive interference between modes within a complex protein.This is an important difference to linear vibrational spectros-copies, where different adjacent modes overlap but do notinfluence each other. In SFG, vibrational modes will inter-fere, which leads to complex spectral shapes. To extractstructural information from such spectra, theoretical spectracan be calculated from protein structure files and combinedwitthh experimental SFG data.41,57-59 Theoretical SFG spectra were calculated using each ofthe two adsorbed orientations of protein G B1 determined bythe MC simulations [Figs. 7(c) and 7(d)]. Clearly, the calcu-lated spectra do not capture the spectral features of theexperimental data well. In ssp, while the calculated spectracapture the main resonance near 1630cm, they also FiG. 7. Experimental and calculated SFG spectra. [(a) and (b)] Experimental spectra for protein G B1 on polystyrene in ssp and ppp polarization combina-tion. [(c) and (d)] Spectra calculated from the first predicted orientation shown in Fig. 3(a) (red) and from the second predicted orientation shown inFig. 3(b) (black). produce an unexpected feature near 1700cm[Figs. 7(a)and 7(c)]. In ppp polarization, the calculations reproduce themain peak near 1630cm but miss any low frequencyshoulders and produce two high-energy modes, which arenot visible in the experimental data [Figs. 7(b) and 7(d)]. Itshould be noted that tests with several other orientationsyielded no improvements in the agreement between theoryand experiment. Since the two orientations predicted by the MC simula-tions are close in energy it is likely that both orientationswill be present on the surface. We therefore calculated theSFG response of a monolayer of protein G B1 with a 50/50mixture of both orientations. When using a 50/50 mixtureof both orientations for the spectra calculations, the peaksaround the main feature near 1630cm, including thelow energy features, as well as the negative feature near1675cm, are now captured by the theoretical spectra(Fig.8). Therefore, the results of the calculations match theexperimental data better than either of the two orientationsindividually. E. Stability of the protein G B1 predicted orientationsin MD simulations To test the conformational stability of protein G B1adsorbed onto a graphene surface, four 50-ns long MD simu-lations in explicit water were started from the predicted ori-entations of protein G B1. Two of the simulations (MD1 andMD2) were started from one of the predicted orientations[Fig.3(b)] and two (MD3 and MD4) from the other pre-dicted orientation [Fig. 3(a)]. In all four simulations, the pro-tein remained within 2.5 A from the surface [Fig. 9(a)].However, in MD2, the protein tilted to an orientation withone of its smaller sides contacting the surface and the rest of it solvent exposed. This is indicated by its relatively largeraverage distance between the center of geometry (COG) andthe surface [Fig. 9(a)] and the smaller angle Phi between itsmajor axis and the normal to the surface [Fig. 9(b)]. In theother three runs, the protein maintained its initial orientationthroughout the entire simulation length,as indicated by thesimilar distance between the COG and the surface [Fig. 9(a)]and the similar angles Phi and Psi between its two majoraxes and the normal to the surface [Fig. 9(b)]. Generally, theprotein maintained its three-dimensional structure and the d-helix was conserved throughout the simulations as indicatedby their backbone Co atom root mean square deviationsfrom the initial conformation [Fig.9(a)]. Interestingly, a slight distortion was observed in MD1where the a-helix briefly tilted outward away from the rest ofthe protein while generally maintaining its secondary struc-ture but returned to its native position after ca. 12 ns (supple-mentary Fig. S2). It is plausible that protein G B1 mightundergo slight adjustments of its three-dimensional structureupon adsorption to a hydrophobic surface. However, this wasan isolated and short-lived event, and thus, no strong conclu-sions can be drawn. The fact that the protein tilted in one outof four runs could be an artifact of the force field used in thesimulations and current force fields might need to be opti-mized for protein-surface simulations,60,61or it could indicatethat the protein probes alternative but less populated orienta-tions upon adsorption. It would be interesting to investigatethese events in longer time-scale MD simulations in a futurestudy. It also needs to be noted that while the experimentswere performed with polystyrene, the simulations were per-formed with graphene. This does not affect the Monte Carlocalculations since the protein is treated as a rigid body andboth surface types are hydrophobic. However, one might FIG. 8. Experimental and calculated SFG spectra. [(a) and (b)] Experimental spectra for protein G B1 adsorbed onto polystyrene in the ssp and ppp polarizationcombinations. [(c) and (d)] Spectra calculated for a 50/50 mixture of the two predicted orientations. want to consider using a polystyrene surface for long time-scale MD simulations. IV. DISCUSSION Determining the orientation and structure of proteinsadsorbed onto the surface of materials is challenging becausealthough well-established surface analysis methods such asToF-SIMS provide important details about adsorbed pro-teins, they do not provide structural information at theatomic level. It would be desirable to have methods thatdirectly determine the composition of biofilms at atomiclevel of detail, as it is, for example, already the case for pro-teins in solution and crystals. Because of this technological gap, there is a need for computational tools that can comple-ment and extend experimental surface analysis techniquesby providing atomistic details about the protein adsorptionprocess.48 Computational predictions can then be validatedthrough experimental measurements, and the combination ofcomputations and experiments can provide a detailed andrealistic model about the structure of protein films. Here, a Monte Carlo based algorithm was developed bycombining existing molecular dynamics simulation and visu-alization software with a SASA based implicit solvationmodel to determine the orientation of protein G B1 adsorbedonto hydrophobic surfaces. The simulations convergedtoward two distinct orientations (Fig. 3) that corresponded totwo minima with roughly equal free energy values (Fig.5). FiG. 9. Averages of quantities measured during the molecular dynamics simulations started from the Monte Carlo predicted orientations of protein G B1 on thegraphene surface. The bars show a time average along the simulations, while error bars represent the standard deviation. Strikingly, SFG experiments confirmed that protein G B1indeed has a roughly 50% probability of being found ineither one of the two predicted orientations on a polystyrenesurface (Fig. 8). This highlights the importance of comple-menting current surface analysis techniques with atomisticcomputational predictions, since, as shown in this case,it would have been hard to uniquely determine from SFGdata alone the number of orientations that were present.Finally, MD simulations in explicit water illustrated how theMC-based method developed here can be used to efficientlygenerate a starting system for studying conformational fluc-tuations of adsorbed proteins. The atomistic understanding of the protein adsorptionprocess can provide insight how different surface materialscan differentially influence the function of proteins. Forexample, recently it has been shown that the coagulationprotein von Willebrand factor (VWF) is activated whenadsorbed on a polystyrene surface but inactive on a glass sur-face.62 A combination of Monte Carlo and MD simulationsas presented here could help discriminate whether this is dueto different orientations or to conformational changes ofVWF on a hydrophobic versus a hydrophilic surface. Itneeds to be noted that the method presented here does nottake into account that protein molecules can also interactwith each other besides with the surface and that this couldinfluence their orientation or conformation. However, sincethe polypeptides used here are soluble, it is likely that duringthe adsorption process the protein-surface interaction will bemore dominant than any interprotein interactions. Consistentwith this, in a recently published simulation, the LK peptidewas observed to assume a similar surface orientationwhether it was isolated or whether another LK peptide waspresent.3 Nonetheless, more complex algorithms could bedeveloped to take interprotein interactions into account forcases where these effects are suspected to play a major rolein the system under study. In the future, it will be necessary to also predict proteinorientations on hydrophilic surfaces. Unlike in the case ofnonpolar surfaces such as graphene, electrostatic interactionsneed to be accounted for when studying adsorption ontohydrophilic surfaces. Since the energy evaluation in theMonte Carlo algorithm is based on an implicit solvationmodel, screening effects of the water will also have to be con-sidered, either by using a constant or a distance-dependentdielectric coefficient. This is challenging because distance-dependent dielectric constants are known to overestimateelectrostatic interactions between charged side chains in pro-tein folding studies with implicit solvent models.29,64 Anotherchallenge is that more advanced implicit solvation modelsbased on Generalized Born132 are not adequate to study theinteraction between molecules and surfaces. Finally, in casesof surfaces that are known to order water, it might be neces-sary to include water molecules explicitly. Overall, the devel-I-opment of better implicit solvation models along with theimplementation of Monte Carlo algorithms to predict the ori-entation of proteins on surfaces presents an interesting andexciting challenge. V. CONCLUSIONS The following conclusions can be drawn from this work: (1) The Monte Carlo simulations predicted two distinct ori-entations of protein G B1 on hydrophobic graphenesurfaces. (2) The QCM-D results indicated that upon adsorption ontopolystyrene surfaces protein G B1 did not undergo majorconformational changes and maintained its IgG antibodybinding activity. This justifies the assumption that theprotein can be treated as a rigid body in Monte Carlosimulations. (3) Calculated SFG spectra based on a 50/50 mixture of thetwo Monte Carlo predicted orientations agreed withexperimental data of protein G B1 adsorbed onto poly-styrene confirming that an ensemble containing at leastthe two predicted orientationswas present on thesurface. (4) In MD simulations started from the predicted MonteCarlo orientations, the protein was generally stable,remained in contact with the surface, and in three out offour runs it maintained the predicted orientation. The Monte Carlo simulations developed here can provideatomic-level detail of protein-surface interactions that arenot typically available from experimental surface analysistechniques. The predicted orientations can be used to com-plement results from surface analysis experiments and asstarting structure for more accurate explicit solvent molecu-lar dynamics simulations to study conformational changes ofthe protein at the protein-surface interface. ACKNOWLEDGMENTS The authors would like to thank Jim Pfaendtner and WendyThomas for interesting and helpful discussions. The authorsalso thank Amedeo Caflisch at the University of Zurich,Switzerland for helpful discussions about implicit solvationmodels. TobiasWeidner acknowledgesfunding bytheDeutsche Forschungsgemeinschaft (WE4478/4-1) andEuropean Union Marie Curie Program for support of this work(CIG Grant No. 322124) and thanks Steven Roeters and SanderWoutersen for providing code for the spectra calculations.Recombinant protein G B1 used in this work was obtained fromthe Institute for Protein Design, University of Washington,Seattle, WA. This study was financially supported by NIHGrant No. R03EB014516 (GI), a NIH career developmentAward No. K25HL1181377to GI, andNIH Grantt No.P41EB002027 (NESAC/BIO). ( A. A. T h yparambil, Y. W ei, Y. Wu, and R . A . La t our, A cta Biomater. 1 0, 2404(2014). ) ( L . Li, S . C hen, and S . J i ang, J . B iomat er . S ci . , Poly m. E d . 1 8, 14 15(2007). ) ( "W. N o rde,“T h e beh a vior of proteins at int e rfaces, wi t h sp e cial attention to t he r ole o f t h e structure stability of t he protein molecule,” i nBiologicall y M odified Polymeric Biomaterial Surfaces (Springer, N etherlands, 1992), pp. 8 5- 9 1. ) ( 1 0W. N o rde an d J. Lyklema, Col l oid s Surf. 38, 1 (198 9 ). ) ( N. X i a, Y. Hu, D. W. Grainger, a nd D . G. Castner, L angmuir 18, 3255 (2002). ) ( R. J. Green, R. A . F r azier, K. M. S h akesheff, M. C. D a v ies, C. J. Roberts, and S .J. T endler, B i o materials 21,1823 (2000). ) ( R. Michel and D. G . C astner, Surf . Int e rf a ce Anal. 38, 138 6 (2006). ) ( S. M u ramoto, D. J. Graham, M. S. Wagner, T. G. Lee, D. W. Moon, and D . G . Castner,J . P hy s . C hem., C 11 5, 2 4 247 (2 0 11). ) ( J. B. Lhoest, M. S. Wagner, C. D. Tidwell, and D. G. Castner, J. B i o med. M ater. Res. 57,432 (2001). ) ( F. Vidal and A. Tadjeddine, Rep. Prog . Phys . 68, 1 095 (2005). ) ( E. C . Yan, Z. Wang, and L. Fu, J . Phys. Chem., B 11 9,2769(2015). ) ( ’s. R oy, P. A. Covert, W. R . F itzGerald, and D. K. Hore, Chem. R ev. 1 14,8388 (2014). ) ( F. B . Sheinerman and C. L. B rooks, Pro t e i ns: S t r uc t ., F u n c t., B ioinf. 2 9, 193(1997). ) ( 2D . Roccatano, A. Amadei, A. D. Nola, and H. J. B e r e ndsen, Prot ein Sci. 8, 2130 (1999). ) ( C. A. Rohl, C. E. Strauss, K. M. Misura, and D. Baker, Me t hods E n z y mol. 383,66(2004). ) ( "K. M a krodimitris, D. L. Ma s ica, E. T. Kim, and J. J. G r a y, J. A m . C h e m . Soc. 129, 13713 ( 2007). ) ( 23W. DeGrado and J. L e ar, J . A m. C h em. S o c . 10 7 , 76 8 4 (1985). ) ( 24J. E. Baio, T. Weidner, L. Baugh, L. J. G a mble, P. S. St a yton,and D. G. Castner, La ng muir 28 , 2107(2012). ) ( N. Metropolis, A. W. Ro s enbluth, M. N. Rosenbluth, A. H. Teller, and E. T eller, J . C h em. P hys . 2 1,1087 (1953). ) ( 2N. Metropolis and S.U l am, J. A m. St at. A ssoc. 4 4, 335 (1949). ) ( 2 H. J. B erendsen, D . v an der Spoel, a nd R . van Drunen, C omput. Phys. Commun.9 1 ,43 (1995). ) ( 2 8A. D. M acKerell, Jr . e t al., J . Phys. Chem., B 1 0 2, 3 5 86 (1 9 9 8). ) ( 29P. Ferrara, J. Apostolakis, and A . C a flisch, P roteins: S truct. , F unct. , Bioinf. 46, 24 (2002). ) ( 30W. H umphrey, A . Dalke, and K. Sc h ulten, J. M o l. G raphi c s 14 , 33 ( 1 996). ) ( W. C. Still, A . T empczyk, R . C . H a wley, a n d T. H e ndrickson, J . A m.Chem. S oc. 1 12, 6127 (1990). ) ( A . Onufriev, D . A. Case, and D. Bashford, J . Comp u t. Chem. 2 3, 1 297 (2002). ) 33A. D. MacKerell, M. Feig, and C. L. Brooks, J. Am. Chem. Soc. 126,698(2004). 4A. D. MacKerell, M. Feig, and C. L. Brooks, J. Comput. Chem. 25,1400(2004). ( R . B. Best, X. Zhu, J. S h im, P. E. Lop e s, J. Mittal, M. Feig, and A. D. M acKerell, Jr., J . Ch em. T heory Co m put. 8, 3 257( 2 012). ) ( 36T. Darden, D. Y ork, and L. Pedersen, J . Chem . P hys. 98,10089 (1993). 3 7 S. N ose, J . C h em. P h ys . 8 1 , 511 (1 9 84). ) ( 3 8W. G. H oo ver, Ph ys. R e v. A 3 1, 1695 (1985). ) ( B. Hess, H. Bekker, H. J. B e rendsen, and J. G. Fraaije, J. C omput. C hem. 18, 1463 ( 1 997). ) ( 4 T. Weidner, N . F. B r een, K. Li, G . P . D r obny, and D. G. Castner, Pr o c. N atl . Acad. Sci . 107, 13288(2010). ) ( 4S. J . Roeters, C. N. van Dijk, A. Torres-Knoop, E. H. Backus, R. K. Campen, M. B o nn, and S. Woutersen, J. P h ys. C h em., A 1 17 , 6311 (2013). ) ( 42L. Baugh, T. Weidner, J. B a io, P . -C. T . Nguyen, L. J. Gamble, P. S . S tayton, and D. G. Castner, L a n gmuir 26 , 16434 (2010). ) ( 4 3J. Baio , T. Weidner, N. Samuel, K. Mc C rea, L. B au g h, P. S . S t ayton, and D . G. Castner, J . Vac . Sci . Techno l. , B 28 , C5D1 ( 2010). ) ( 4 G. Collier, N . A . Vellore, J. A. Yancey, S. J . Stuart, and R. A. L a tour, B io in terphases 7 , 24 (2012). ) ( 4C. Dalgicdir and M. Sayar, J. Ph ys . Chem., B 119,15164 (2015). ) ( 46T. Weidner, N . T. Samuel, K. McCrea, L. J . Gamble, R. S . War d , and D. G . Ca s tner, B iointe r phases 5 , 9 (2010). 47 ) ( 4 M. Deighan and J. Pfaendtner, L a ngmu ir 29 , 7999 (2013). ) ( 48 T . Weidner a nd D. G. Castner, P hys . C hem. C h em. Ph y s. 1 5 , 12 5 16(2013).9 ) ( 49A. Janshoff and C. Steinem, Sens. U pda t e 9 , 313(2001). 5 0F. Hook et al., C o l loids S u rf., B 24 , 15 5 (2002). ) ( A . A. Fe i ler, A. Sahlholm, T. Sandberg, and K. D. C al d well, J. C o lloid I nterface Sc i. 315,475 (2007). ) G. Sauerbrey,Z. Phys. 155,206(1959). ( R. W. Boyd, Nonlinear Optics, 1 e d. (Academic, London, 1992). ) ( “ K. T . Nguyen, J. T. K i ng, and Z . Chen, J. P hys. C hem., B 11 4 , 8 2 91 (2010). 5 5A. G . Lambert, P. B. Davies, and D. J. N eivandt, A pp l. S pe c tros c . R ev. 40, 1 03 (2005). ) ( C. Liang, M. Louh i vuori, S. J . Ma r rink, T. L. C. Jansen, and J. Kn o ester, J . P hys . C hem. L e tt. 4 , 4 48 ( 2 013). ) R. Hennig et al., Nat. Commun.6, 7018(2015). 5&D. Schach et al., J. Chem. Phys. 141, 22D517 (2014). L. Bellucci, A. Ardevol, M. Parrinello, H. Lutz, H. Lu, T. Weidner, and T. Corni, Nanoscale 8, 8737 (2016). R. A. Latour, Colloids Surf., B 124,25(2014). P. K. Biswas, N. A. Vellore, J. A. Yancey,T. G. Kucukkal, G. Collier, B. R. Brooks, S. J. Stuart, and R. A. Latour, J. Comput.Chem. 33,1458(2012). 2E. H. Tronic,O. Yakovenko, T. Weidner, J. E. Baio, R. Penkala, D. G. Castner, and W. E. Thomas, Biointerphases 11, 029803(2016). ( 3H. Lutz, V . Jaeger, R. Berger, M. Bonn, J . Pfaendtner, and T. W eidner, Adv . M ater. I n t erf a ces 2 , 1 ( 2015). ) ( 4T. Lazaridis and M . Ka r plus, Pr o t eins: Struct., F u n ct., B ioinf . 3 5, 133 (1999). ) ( See su p plementary mat e rial at htt p:// d x.doi.o r g/10.1 11 6/1.4 9 71381 fo r a r epresentation o f t he orientation angles a nd time s e ries along one o f theMD simulations. ) SEE HOW IT WORKS )Electronic mail: gianluca@u.washington.eduBiointerphases , June Author(s) / A Monte Carlo algorithm was developed to predict the most likely orientations of protein G B1, an immunoglobulin G (IgG) antibody-binding domain of protein G, adsorbed onto a hydrophobic surface. At each Monte Carlo step, the protein was rotated and translated as a rigid body. The assumption about rigidity was supported by quartz crystal microbalance with dissipation monitoring experiments, which indicated that protein G B1 adsorbed on a polystyrene surface with its native structure conserved and showed that its IgG antibody-binding activity was retained. The Monte Carlo simulations predicted that protein G B1 is likely adsorbed onto a hydrophobic surface in two different orientations, characterizedas two mutually exclusive sets of amino acids contacting the surface. This was consistent with sum frequency generation (SFG) vibrational spectroscopy results. In fact, theoretical SFG spectra calculated from an equal combination of the two predicted orientations exhibited reasonable agreement with measured spectra of protein G B1 on polystyrene surfaces. Also, in explicit solvent molecular dynamics simulations, protein G B1 maintained its predicted orientation in three out of four runs. This work shows that using a Monte Carlo approach can provide an accurate estimate of a protein orientation on a hydrophobic surface, which complements experimental surface analysis techniques and provides an initial system to study the interaction between a protein and a surface in molecular dynamics simulations.
确定
还剩9页未读,是否继续阅读?

产品配置单


北京欧兰科技发展有限公司为您提供《疏水表面G B1 蛋白中分子取向检测方案(其它光谱仪)》,该方案主要用于其他中分子取向检测,参考标准--,《疏水表面G B1 蛋白中分子取向检测方案(其它光谱仪)》用到的仪器有Ekspla SFG 表面和频光谱分析系统、PG400 系列皮秒光学参量发生/放大器系统
推荐专场


相关方案
更多
该厂商其他方案
更多