


方案详情
文
Fishes have an enormous diversity of body shapes and
fin morphologies. From a hydrodynamic standpoint, the
functional significance of this diversity is poorly
understood, largely because the three-dimensional flow
around swimming fish is almost completely unknown.
Fully three-dimensional volumetric flow measurements
are not currently feasible, but measurements in multiple
transverse planes along the body can illuminate many of
the important flow features. In this study, I analyze flow in
the transverse plane at a range of positions around bluegill
sunfish Lepomis macrochirus, from the trailing edges of
the dorsal and anal fins to the near wake. Simultaneous
particle image velocimetry (PIV) and kinematic measurements
were performed during swimming at 1.2·body·lengths·s–1
to describe the streamwise vortex structure, to quantify
the contributions of each fin to the vortex wake, and to
assess the importance of three-dimensional flow effects in
swimming.
方案详情

1516The Journal of Experimental Biology 209, 1516-1534Published by The Company of Biologists 2006 Sunfish median fin function 1517 doi:10.1242/jeb.02154 Median fin function in bluegill sunfish Lepomis macrochirus: streamwise vortexstructure during steady swimming Eric D. Tytell Department ofOrganismic and Evolutionary Biology, Harvard University, Cambridge, MA 02138, USA Present address: Department of Biology, University of Maryland, College Park, MD 20742, USA (e-mail: tytell@post.harvard.edu) Accepted 7 February 2006 Fishes have an enormous diversity of body shapes andfin morphologies. From a hydrodynamic standpoint, thefunctional significance of this diversityis poorlyunderstood, largely because the three-dimensional flowaround swimming fish is almost completely unknown.Fully three-dimensional volumetric flow measurementsare not currently feasible, but measurements in multipletransverse planes along the body can illuminate many ofthe important flow features. In this study, I analyze flow inthe transverse plane at a range of positions around bluegillsunfish Lepomis macrochirus, from the trailing edges ofthe dorsal and anal fins to the near wake. Simultaneousparticle image velocimetry and kinematic measurementswere performed during swimming at 1.2 body lengths sto describe the streamwise vortex structure, to quantifythe contributions of each fin to the vortex wake, and toassess the importance of three-dimensional flow effects inswimming. Sunfish produce streamwise vortices from at least eightdistinct places, including both the dorsal and ventralmargins of the soft dorsal and anal fins, and the tips andcentral notched region of the caudal fin. I propose a three-dimensional structure of the vortex wake in which thesevortices from the caudal notch are elongated by the dorso-ventral cupping motion of the tail, producing a structurelike a hairpin vortex in the caudal fin vortex ring. Vorticesfrom the dorsal and anal fin persist into the wake, Introduction Fish are not two-dimensional. However, swimming fishmove primarily in the horizontal plane, undulating from sideto side as they propel themselves forward. The apparent two-dimensional (2D) character of the motion has led bothhydrodynamic and kinematic studies of fish swimming to focuson a 2D slice through the horizontal midline (e.g. Breder,1926;Carling et al., 1998; Lighthill, 1960; Lindsey, 1978; Miiller etal., 1997;Tytell and Lauder, 2004; Weihs, 1972; Wu, 1971).This approach has allowed researchers to make headway inunderstanding fish swimming despite the complexity of the probably linking up with the caudal fin vortices. Thesedorsal and anal fin vortices do not differ significantly incirculation from the two caudal fin tip vortices. Becausethe circulations are equal and the length of the trailingedge of the caudal fin is approximately equal to thecombined trailing edge length of the dorsal and anal fins, Iargue that the two anterior median fins produce a totalforce that is comparable to that of the caudal fin. Toprovidee additionaldetail on how differentlhpositionscontribute to total force along the posterior body, thechange in vortex circulation as flow passes down the bodyis also analyzed. The posterior half of the caudal fin andthe dorsal and anal fins add vortex circulation to the flow,but circulation appears to decrease around the peduncleand anterior caudal fin. Kinematic measurements indicatethat the tail is angled correctly to enhance thrust throughthis interaction. Finally, the degree to which the caudal finacts like a idealized two-dimensional plate is examined:approximately 25% of the flow near the tail is acceleratedup and down, rather than laterally, producing wastedmomentum, a loss not present in ideal two-dimensionaltheories. Key words: fluid dynamics, streamwise vortex, particle imagevelocimetry, median fin, dorsal fin, anal fin, vortex wake, body shape,bluegill sunfish, Lepomis macrochirus. fluid dynamics, which has only recently become amenable todetailed experimental measurements (with the development ofmethods for observing planar flow fields; Willert and Gharib,1991) and computational simulation. Even though this approach has been quite successful, it isbecoming more apparent that neither the swimming motion northe flow around the body are 2D. For example, even fish withsymmetrical (homocercal) tails, such as bluegill sunfishLepomis macrochirus and chub mackerel Scomber japonicus,do not move them symmetrically (Gibb et al., 1999;Lauder,2000); instead, both fishes angle the dorsal edge of the fin into the tail motion, leading the ventral lobe through the tail beatcycle. Sunfish and other fishes also cup the dorsal and ventraledges of the caudal fin into the flow (Bainbridge, 1963; Lauder,2000;Webb,1975), a clearly three-dimensional (3D) motion.Many fishes also angle their bodies to maintain lift forhorizontal swimming (Ferry and Lauder,1996; He and Wardle,1986; Liao and Lauder, 2000), showing the importance of fluiddynamic effects perpendicular to the horizontal midline. Second, several recent hydrodynamic studies have eitherdirectly observed 3D effects or inferred their importance.Sharks’ asymmetrical tails produce a large vortex ring witha smaller ring inside it produced by the upper lobe (Wilgaand Lauder, 2004). A more subtle effect from 3D body shapewas described in eels (Tytell and Lauder,2004). Beginningwith the observation (Muller et al., 2001; Tytell and Lauder,2004) that eels produce a different wake from previouslystudied fishes, like sunfish or mackerel Scomber japonicus,they argued that differences in 2D swimming kinematicswere not sufficient to explain the hydrodynamic differences.Instead, they proposed that the more important factor was thedifferent body shapes among the fishes (Lauder and Tytell,2006). Third, a 3D computational simulation of swimming fishesfound that the flow around a giant danio Danio aequipinnatus,which has a generalized teleost morphology, could not beapproximated by classical 2D models (Zhu et al., 2002). Theysimulated motion strictly in the horizontal plane, using anapproximation of the giant danio’s morphology, but found thatthis produced a combination of flow down the body andtransversely around the body. This combination of flowdirections invalidates the assumption of 2D flow in two classictheoretical models (Lighthill, 1971; Wu, 1971). Three-dimensional body shape may also have subtle effectson swimming efficiency. Three-dimensional airplane wings,for example, lose efficiency because of effects at their tips. Asthe wings grow shorter relative to their chord (i.e. their aspectratio grows smaller), these losses become greater (Barnard andPhilpott, 1995). For example, Dong et al. simulated flappingwings with varying aspect ratios (Dong et al., 2005). In theirsimulations, a 2D flapping wing, which does not have tiplosses, has a peak propulsive efficiency of greater than 25%,while a 3D wing with a low aspect ratio (2.55; close to that ofa bluegill tail,which is around 2.25) has a maximum efficiencyof about 20%. At the peak efficiencies, the 2D wing alsoproduces about twice the thrust of the 3D wing (Dong et al.,2005). The performance of the simulated wings is lessimpressive (Dong et al., 2005) than some other reports forflapping propulsors (e.g. Barrett et al., 1999 report propulsiveefficiencies above 90%), but their study provides the onlysystematic examination of tip losses in flapping propulsion.Regardless of the exact magnitude, fish tails certainly suffer tiplosses like the simulated wings due to their 3D shape. Fishessuch as tunas, with high-aspect ratio lunate tails, may mitigatethese effects, bbuutt even for them, the‘cost of three-dimensionality’will never be zero and may be substantial(Dong et al.,2005). Finally, and more broadly, it is in the third dimension thatthe diversity of fish body shapes, fin shapes and locations,and swimming modes become important for function. Thefocus on the horizontal midline, while useful for derivinggeneral principles, cannot explain much of the evolution andadaptation of this diversity. The dorsal and anal fins, forexample, move in a complex, active way, different from thebody (Standen and Lauder, 2005), and generate their ownwakes (Lauder et al., 2002), changing the flow that the:11..caudal fin encounters and possibly enhancing its thrust(Akhtar and Mittal, 2005; Wolfgang et al., 1999; Zhu et al.,2002). To begin to approach the question of the adaptivesignificance of fish morphology, one must examine 3D fluidflow. Instantaneous 3D)fluid flownmeasurements aroundswimming fish are not yet feasible, however (but for apromising technique, see Pereira and Gharib, 2002). Instead,2D measurements of flow in the transverse plane at multiplepositions down the body can illuminate many of the salientfeatures of the 3D flow field. In particular, vortices alignedapproximately along the swimming or ‘streamwise’direction(termed ‘tip vortices’ in the aerodynamics literature) are shednearly constantly by the dorsal and ventral margins of themedian fins, but have never been described for a swimmingfish. The strength of these vortices relates directly to the overallforce and its distribution among fins, and also to efficiency,because much of the energy used to produce them is not usefulfor thrust. Therefore, I examine the transverse flow around swimmingbluegill sunfish using particle image velocimetry (PIV) in thetransverse plane. Flow in multiple planes along the body isdescribed, resulting in the first description of the streamwisevortex pattern around a swimming fish. Putting together thepattern described here with previous data from the horizontaland vertical planes, I propose a new form of the 3D vortexstructure around a swimming sunfish. The average relativeforces produced by each fin are approximated from thecirculation of their vortices, indicating that the dorsal and analfins together produce a force that is comparable to thatproduced by the caudal fin. Materials and methodsFish Bluegill sunfish Lepomis macrochirus Rafinesque werecollected using nets in ponds near Concord, MA, USA. L.macrochirus WaSchosentbecauseboth 3D)swimmingkinematics and flow patterns have been studied in this species(Drucker and Lauder, 1999; Drucker and Lauder, 2000;Drucker and Lauder.2001: Lauder, 2000; Standen and Lauder,2005). Animals were maintained at room temperature (~20°℃)in1separate401freshwateraquariawith a 12 h:12 hphotoperiod, and were fed earthworms three times weekly.Four fish of similar size (total body length L=18.3±0.2 cm,mean ± s.e.m.; range 17.7-18.7 cm) were selected for wakevisualization experiments. Swimming protocol and flow visualization Sunfish swam individually in the center of the working area(28 cm×28 cm×80 cm) of a variable-speed freshwater flowtank. Steady Sswimming was elicited at 1.20 L s-(approximately 22 cm s-l), slightlyfaster thanthee gaittransition speed in which sunfish begin using their caudal finstogether with the pectoral fins (Drucker and Lauder, 2000).Animals were gently maneuvered into the center of theworking section using a wooden dowel, which was removedbefore filming a swimming sequence. Swimming sequenceswere collected so that the light sheet illuminated sixapproximate positions along the body: the trailing edge of thesoft dorsal and anal fins, the caudal peduncle, the base, middleand trailing edge of the caudal fin, and the wake just posteriorto the caudal fin. Wake sequences were carefully chosen so thatthe tail did not intersect the light sheet, but was still partiallyvisible through it to allow the fish's location to be determined.Far wake measurements were not made, due to the difficultyof determining the fish’s position precisely without being ableto view it in the PIV images. Fluid flow in the transverse plane was filmed using two highspeed digital cameras, a configuration that enabled use of thestereo PIV algorithm (Gaydon et al., 1997; Prasad, 2000;Willert, 1997) to correct the strong parallax effect from flow passing through the plane. The cameras viewed the swimmingfish from behind through a 12.7 cm×15.2 cm front-surfacemirror placed at 45° in the flow (Fig. 1A). One camera, aPhotron APX (Photron USA, Inc., San Diego,CA, USA) with1024×1024 pixel resolution, was placed so that it viewed thetransverse plane orthogonally through a 135 mm lens at adistance of approximately 1.5 m. The other, a PhotronFastCam with 1280×1024 pixel resolution, was placed 12° offaxis, and used a 50 mm lens at a distance of about 0.72 m(Fig. 1A). The off-axis camera used a Scheimpfliig lens mount(LaVision, Inc., Ypsilanti,MI, USA) to focus on the entireplane, even though it was at an angle to the camera sensor (seeNauen and Lauder, 2002b; Prasad, 2000 for a more detaileddescription of the optical configuration). The two camerasimaged an overlapping region approximately 12 cm×12 cm inarea. An additional Photron FastCam was used to film thesilhouette of the fish from below (Fig. 1B) for simultaneouskinematic analysis. The distance between the mirror and the light sheet wasmore than twice the mirror’s presented width, making effectsfrom the mirror’s bow wake negligible in the light sheet plane.Additionally, the presented area of the mirror was 137 cm ,providing a constriction ratio of 1.2, which should not affectthe mean flow velocities substantially. This type of mirror Fig. 1. Filming arrangement. (A) Flow tank filming configuration seen from above. Two cameras film the fish from behind through a front-surface mirror at 45° in the flow downstream of the fish. The mirror, fish, and camera positions are approximately to scale relative to the flowtank width. A laser light sheet is projected in from the side. One camera views the sheet orthogonally; the other is at a 12°angle. The off-axiscamera uses a Scheimpfliig lens mount to tilt the axis of the lens and focus on the entire light sheet, despite the camera’s angle. The x axis islateral, from the fish’s left to right, and the z axis is streamwise in the flow direction. (B) Side view of the filming configuration, showing theventral view camera used for kinematic measurements. PIV cameras are omitted. The y axis is dorso-ventral and the z axis is streamwise. (C)Sample image from the orthogonal PIV view. (D) Sample image from the ventral view. (E) Terminology for regions in which streamwisevortices are shed. Sources of vortices along the body are indicated by thick colored lines. configuration has been used previously and has been shown notto affect swimming kinematics (Ferry and Lauder, 1996). A 10 Wargon-ion laser was used to project a 3 mm thicklight sheet through the side of the tank, illuminating near-neutrally buoyant 12 um diameter silver-coated glass beads(density 1.3 g cm-; Potter Industries, Valley Forge,PA, USA).Particle motion was analyzed using a stereo digital particleimage velocimetry (PIV) algorithm (Gaydon et al., 1997;Prasad, 2000; Willert, 1997). Camera calibration, the stereoPIV algorithm, and initial vector post-processing wereperformed using DaVis 7.0.9 (LaVision, Ypsilanti,MI, USA).Cameras were calibrated for each experimental procedureusing a grid of crosses with 8 mm×8 mm spacing placed atthree different streamwise positions separated by 3 mm each.Cross displacements were fitted using a pinhole camera model(Hartley and Zissermann, 2000). Fitted parameters includedthe calibration grid position and angle relative to the camerasensor, camera focal length, first and second order radialdistortion, principal point and pixel squareness. A self-calibration procedure (Wieneke, 2005) was performed onparticle images from steady flow to adjust the fitted light sheetposition and angle. The PIV algorithm used three passes,starting with a grid size of 32×32 pixels (approximately4 mm×4 mm) overlapping by 25% and stepping down to12×12 pixels (1.5mm×1.5 mm) overlapping by 50%. Asecond order correlation for error correction (Hart, 2000) wasused in the first two passes. The flow field was initiallyassumed to have the nominal through-plane flow velocity.After processing, vectors were eliminated if the signal-to-noiseratio was less than 2, and by an iterative procedure that usedthe median and RMS velocities in a 3×3 vector neighborhood(similar to Nogueira et al., 1997). Finally, a 3×3 spatialsmoothing filter was applied, followed by a 25 Hz low-passfinite impulse response temporal filter. The final vector fieldshad approximately 155×160 vectors. To assess maximal in-plane error, simulations of particlemotion analyzed using the 2D PIV algorithm were comparedto measured flow characteristics from steady flow analyzedusing the stereo PIV algorithm with post-processing and allfilters. Uniform and vortexx motions weresimulated.Simulations probably produce overestimates of the error,because the stereo PIV algorithm, as implemented in DaVis7.0, uses the additional information from the second camera toreduce the overall error. Maximum error in uniform flow wasless than 3 mm s-. Vorticity errors tended to be large (~30%)for vorticity greater than 50 s-(which was near the maximumobserved), probably due both to high shear and inaccuracy ofnumerical derivatives. In contrast, circulation was accuratelyestimated to within less than 10% for all but the weakestvortices. Peak locking, the tendency of PIV to produce integerpixel displacements, caused overestimates of 30% or more forvortices with circulations of less than 300 mm²s-1. Stereoanalysis of steady flow showed that maximum turbulenceintensity (the standard deviation of flow velocity; Tennekesand Lumley, 1972) was less than 7 mm s-, in-plane Reynoldsstress (Tennekes and Lumley, 1972) was less than 4 mNm, and the standard deviation of background vorticity was lessthan 5 s. The stereo algorithm was used to correct parallax, which itdoes implicitly when estimating 3D vectors. Geometricalconstraints of the setup did not allow a large enough anglebetween the two cameras to reconstruct the through-planevelocity component w with sufficient precision to detect theeffect of the swimming fish over the mean flow velocity. Erroron the through-plane velocity component is proportional to1/tan(0), where 0 is the angle between the two cameras (12° inthis case) (Prasad, 2000); after smoothing the flow velocities,variation in w was typically on the order of 25-50%. Theadditive effect of the swimming fish, in contrast, is expectedto have a maximum downstream magnitude of less than 20%of the mean flow velocity (Drucker and Lauder, 2001), lowerthan the measurement error. Nonetheless, the dual-camerasetup was necessary to remove parallax effects, which weresubstantial (typically around 2 cm sat the edges of the field)in a single-camera configuration. Kinematic analysis Silhouettes of the fish were filmed from a ventral viewthrough a front-surface mirror at a 45°angle using a PhotronFastCamn high-speed digital video camera with1280×1024 pixel resolution, synchronized with the two usedfor flow visualization (Fig. 1B). Midline kinematics weredigitized from the silhouettes using custom Matlab 6.5.1(MathWorks, Natick, MA, USA) routines. The algorithmswere modified only slightly from those previously described(Tytell and Lauder, 2004), where they are explained in moredetail. Briefly, the head and tail positions were digitizedmanually to provide starting coordinates for a procedure thatused one-dimensional cross-correlation to find dark regionswith the known width of the fish body. Midlines were thensmoothed simultaneously along the body and through timeusing a 2D smoothing spline (Matlab spaps routine) to producea mean squared error of approximately 0.25 pixel(a 2Danalog of the method recommended by Walker, 1998). Oncethe midline was determined, the position of the maximumlateral excursion at each point on the body was tracked todetermine the body amplitude, frequency, wave speed andwave length. Changes in the algorithms from the procedureused by Tytell and Lauder (Tytell and Lauder, 2004) wereprimarily to avoid errors in the region illuminated by the laser.The digitized midlines were then used to determine thedistance of the head from the light sheet, running along thecurve of the body, to estimate precisely the laser positionrelative to the fish. The dorso-ventral position of the fish in the light sheet wasdetermined from the PIV images. The dorsal and ventral edgesof the body were manually digitized. Successive planes werealigned by matching the digitized dorso-ventral positions tothe lateral profile of the body, based on a lateral image of oneofftheexperimentalindividuals during swimming.Additionally, the outline of the body and fins in the transverseimages was manually digitized, primarily for visualization purposes, but also for a simple kinematic analysis of fincurvature and for identification of near-body flow. Five pointswere identified along the body or caudal fin (upper and lowermargins, center, and two additional points to approximate thecurvature of the upper and lower lobes). If the dorsal or analfins were visible, five points were also digitized along each.Spline-based interpolation was used to produce a smoothoutline. Vortex analysis The circulation and geometry of vortex loops has been usedpreviously to estimate forces on swimming animals (e.g. Druckerand Lauder, 1999;Muller et al., 1997;Nauen and Lauder, 2002a;Tytell,2004). In this approximation, average force is proportionalto the area circumscribed by a vortex loop and the circulation Iof the vortex, where circulation is defined as: integrating around a loop enclosing the vortex, where u is thefluid velocity vector, t is a unit vector tangent to the contour,and s is arc length along the contour. Strictly, force isproportional to circulation only in steady flow, not the complexunsteady motion of swimming fish (Dabiri, 2005), but previousstudies (e.g. Drucker and Lauder, 1999; Spedding et al.,2003;Warrick et al., 2005) have found agreement between thisapproximation and other force measurements. The goal of the vortex analysis in this study was to assessthe relative contributions of different fins to time-averagedoverall force and to examine at what points along the bodyforces are produced. For these purposes, the circulationproduced at different locations along the body is a sufficientlyaccurate approximation of force production. No effort wasmade to examine everypossible source of vorticity,whichwould be necessary for an accurate estimate of total force(Spedding et al., 2003), nor were assessments made of anyunsteady effects (Dabiri, 2005). Because of the uncertaintiesintroduced by this method of analysis, I did not make directestimates of force; instead, I examined only circulation and useit to make order of magnitude arguments about force. An additional source of complexity in the analysis is theidentification of vortices. In fact, the precise definition of avortex is currently debated in the fluid dynamics community(see, e.g., Haller, 2005). The intuitive definition of a vortex asa region with rotating flow, for example, is dependent on thechoice of reference frame. The vorticity is also not useful inunambiguously identifying vortices, because it is present inshear layers, regions that are clearly not ‘vortices’, in theintuitive sense. A better metric (Adrian et al., 2000;Vollmers,2001), though not the only one, for defining a vortex is theswirling strength, or discriminant for complex eigenvalues: where u and v are the horizontal (lateral) and vertical (dorso-ventral) components of fluid velocity, and x and y are thecorresponding positions (Fig. 1). The swirling strength is largeand negative in regions that are rotating more than shearing or diverging (Vollmers, 2001). Note that swirling strength doesnot depend on the direction of the rotation. It does not captureevery instance that could be called a vortex, nor is it consistentin every reference frame (Haller, 2005), but it does helpautomate the search for rotating regions of fluid. Because this study involved a large number of PIV dataframes (approximately 4800), a simple automatic procedurewas developed for detecting and tracking vortices. The goal ofthis procedure was not strict hydrodynamic consistency, butrather a rapid identification of the vortices that would havebeen found by a manual method (as used in all previous studiesof swimming hydrodynamics, including Miller et al., 2001;Nauen and Lauder, 2002a; Tytell, 2004). A custom Matlabprogram found connected regions with large negative valuesof the swirling strength below a threshold入. Connected regionsbelow the threshold were identified using a standard imagesegmentation routine (Matlab’s bwlabeln function) in threedimensions(two spatial dimensionsSand time) with 18neighbor connectivity (for moreeinformation on imagesegmentation, see Gonzalez et al., 2003). Circulation wasestimated for each region by generating an ellipse in eachframe that enclosed the thresholded area, interpolating the fluidvelocity on to the ellipse using a cubic spline, and numericallyevaluating Eqn 1 using a trapezoidal approximation (Matlab’strapz function; Press et al.,1992). Two additional criteria wereimposed to eliminate noise or small turbulent eddies: (1),connected regions were required to persist over a minimumtime T, and (2), were required to reach a minimum circulationI min in at least one frame. The parameters 入, T and Imin were tuned manually for eachswimming bout until the main vortices (those shed by the outeredges of the dorsal and anal fins and by the upper and loweredges of the caudal fin) were consistently detected. Values of入 were 200 or 300 s-; T was 12% of a tail beat cycle; and I minwas 200 or 300 mm’s-, the minimum circulation that couldbe measured accurately. Detected vortices were manuallydeleted when they overlapped the images of the fish’s body orthe shadow region. All vortices produced by this analysis will be termeddetected’. Of these vortices, some were clearly formed atspecific points along the fish’s body, and will thus be termedidentified'; others could not be definitively assigned to aspecific source, and will be called ‘unidentified’. Both thecirculation magnitude and positions of the identified vorticeswere fairly insensitive to the choice of 入, T and I min. The terminology used for vortex shedding regions along thebody is shown in Fig. 1E, based on that in Jenkins andBurkhead (Jenkins and Burkhead, 1994). Streamwise vorticesare shed from the soft dorsal fin along its dorsal margin (termed‘outer edge') and along the free ventral margin (‘inner edge’).Equivalently, from the anal fin, vortices are shed from theventral margin (outer edge’) and the free dorsal margin (‘inneredge’). Note that the inner edges of both fins are distinct fromthe bases of the fins, where the fin rays insert on to the body.The dorsal and anal fin together will be referred to as theanterior median fins, to distinguish them from the caudal fin. Streamwise vortices from the caudal fin are shed at its dorsaland ventral margins, termed upper'and ‘lower’, respectively.The terms ‘dorsal’and ‘ventral'are avoided for the caudal fin,to avoid confusion with the dorsal fin itself. Vortices are alsoshed along the inclined edges of the notch in the fin, which willbe termed the ‘upper’and lower’edges of the ‘caudal notch'.Because bluegill sunfish have an emarginate tail, not a forkedtail, this region is not called the fork (Jenkins and Burkhead,1994). Added circulation As flow moves down the body, total vortex circulationshould increase, both by addition of new vortices and bychanges in individual vortex strength. The circulation added ata given point on the body is proportional to the lateral orvertical force applied to the fluid there. To estimate additionalcirculation, however, one must remove the contribution ofcirculation that convects into the plane from upstream. Thisremoval requires taking the derivative of circulation withrespect to position, following a fluid element as it moves withthe flow. Because of the noise in the data, a continuousempirical model was regressed on the circulation magnitude ofeach vortex. These models were then summed, smoothed toremove discrete jumps when a new vortex was identified, anddifferentiated. To define the regression model, first note that circulation isperiodic over a tail beat. Because the vortex moves with thelocal flow speed (which is quite close to the global mean flowspeed; Lauder and Tytell, 2006), the peak circulation in thisperiodic function progresses down the body over time (i.e. theperiodic function has a phase shift linearly proportional to thelocation along the body). For simplicity, a coordinate systemthat moves with the global mean flow was chosen. The validityof this assumption is tested in the Results section below. In thiscoordinate system, circulation could be approximated by amodel that is linear in its parameters, simplifying the fittingprocedure. The coordinate system is defined as follows. Relative to theflow, position along the body increases at a rate Ut, where Uis the flow speed and t is time. If the tail tip has a phase whena fluid element passes the tip, then a phase a can be defined asthe tail’s phase when the element started at position s: where L is the length of the fish and T is the tail beat period.To examine the vortex strength, circulation was fit using asinusoidal oscillation with an amplitude that changes linearlyalong the body, where a and bi are the fitted coefficients and C is an offset,which is included for completeness, but which should be equalto zero. Higher order polynomial terms and Fourier modeswere also tested, using a general model, where n is the amplitude polynomial order and m is the numberof Fourier modes included. The appropriate number ofpolynomial terms and Fourier modes was determined byexamining the change in rof the models as terms were added. This model is linear in its parameters and was therefore fittedusing the multivariate regression function (regress) in theMatlab Statistics Toolbox 4.1. Each vortex's circulation wasmodeled only over the range of positions in which it wasobserved, without extrapolating further. Several other equations were tested, but Eqn 5 proved tohave the best combination of simplicity, explanatory power,and ease of fitting. A somewhat better model, mathematically,would be one with a constant phase shift in the sine terms,which would allow the cosine terms to be dropped. Simplifyingthis equation results in the same one as Eqn 5, but with anonlinear restriction on aij and bi (aj/b is constant for allvalues of i), which requires a nonlinear fitting algorithm.Unfortunately, the nonlinear fit did not converge well. Without the above constraint, the general model in Eqn5can produce nonlinear changes in circulation amplitude andphase along the body, due to the different weights on the sineand cosine terms. Specifically, the overall amplitude of eachFourier mode is: and the phase is: The absolute values of the circulations from the separatemodels for each identified vortex were summed to produce amodel of the total circulation magnitude. To avoid discretejumps at positions where a vortex was first detected, the sumwas smoothed slightly using a Gaussian filter. The smoothingmakes physical sense, because streamwise vortices probablygrow in strength gradually along the edges of the fins, muchas tip vortices grow along the length of a highly swept airplanewing (Barnard and Philpott, 1995). The smoothed totalcirculation was then differentiated along s to estimate thecirculation added to the fluid at each point along the body. Comparison to 2D ideal flow To examine the influence of effects from 3D flow relative tothe ideal 2D case, the amount of flow accelerated in a singlecoherent direction (mostly laterally) was compared to theamount pushed up and down towards the dorsal and ventraledges. A simple geometric representation E of how effectivelythe fish avoids producing flows that cancel comes from the length of the mean velocity vector, close to the body, relativeto the mean of all velocity vector lengths: where u and v are the horizontal and vertical components offluid velocity close to the tail and () denotes a mean. E is thefraction of flow close to the body that is going in the samedirection. For example, an ideal 2D plate moving laterallywould push all of the fluid laterally (vertical flow does notexist, so v is defined to be 0, and(u+v)=(u)) and wouldtherefore have an E of 1. In contrast, a 3D plate pushes someflow laterally and some up and down (any individual v is non-zero, but (v) is small because up and down motion averagesto zero) and thus has E<1. The momentum from the verticalflows cancels out, and thus they are wasted for the purposes ofproducing thrust or lateral forces. This is not to infer that allvertical flows cancel out for a swimming fish, but themomentum that does cancel is not useful for steady swimming.The mean was taken over a line parallel to the body at adistance of twice the average spacing of PIV vectors from thesurface. The metric E is related to the added streamwise circulation.as estimated above, because the vertical flows will form tipvortices when they reach the dorsal and ventral edges. Inprinciple, a more physical representation of the losses the fishincurs due to its 3D shape would therefore be based on theadded circulation. However, E was used because of itssimplicity, both for calculating and for understanding it. Statistics Midline kinematics were compared among individuals usingsingle-factor analysis of variance (ANOVA) on each parameterindividually, with individual as a random effect (Milliken andJohnson, 1992). Additionally, tail beat amplitudes at the centerof the tail and the upper and lower margins were comparedusing a two-factor mixed model ANOVA, with a fixed effectof position and a random effect of individual. The same testwas performed for the outer and inner edges of the anteriormedian fins. The peak circulations of all vortices were compared using atwo-factor mixed-model ANOVA, excluding those vorticeswhose sources could not be identified. The fixed effect in themodel was the vortex source, while the random effect was theindividual fish. In all mixed-model ANOVAs,care was takento use the correct denominator in testing for each effect, takinginto account the unbalanced data set (for a discussion ofunbalanced mixed-model ANOVAs, see Milliken and Johnson,1992). Post hoc pairwise comparisons were performed usingTukey’s honestly significant difference (Milliken and Johnson,l992). Means are reported with standard errors and numbers ofmeasurements. Wwhere appropriate.AllAANOVAs wereperformed using JMP 5.1 (SAS Institute, Cary, NC, USA),while regressions were performed in Matlab. Results Steady swimming sequences were gathered along the bodyat positions from 0.68L to 1.06L. Fish often pitched headdownwards or rolled towards the laser light, an unnaturalposture probably due to the highly asymmetric visual stimulusfrom the laser light. Care was taken to analyze sequences inwhich pitch and roll were minimal, but some amount of eachwas unavoidable. At least four steady tail beats at each position were recorded,resulting in 102 total tail beats. One individual did not swimsteadily at the most anterior position. Fig. 2 shows the numberof tail beats for each individual at each position. Fish typicallydrifted forward and backward during a sequence by less than3 mm and never drifted more than 1 cm. Stride length was0.0061±0.0004L. Kinematics Swimming speeds determined from PIV analysis rangedfrom 1.09 to 1.20 Ls(mean 1.16±0.03 Ls). At this speed,fish used both their pectoral fins and caudal fins for propulsion.Caudal fin beat frequency was 2.41±0.02 Hz with a totalamplitude (distance betweenmaximumhlateralttail1tipexcursion on each side) of 0.114±0.002L. Body wave speedwas 1.90±0.02 Ls, with a body wave length of 73.2±0.7% ofthe body. Strouhal number was 0.290±0.004. Individualsvaried significantly in all kinematic variables (one-wayrandom-effects ANOVA; P<0.001 in all cases except for wavespeed, in which P=0.042). The kinematic variables abovecould be estimated twice per tail beat (when the tail reachedmaximum excursion on either side) and so the number of datapoints for these estimates was 204 The fins appeared in the laser light sheet as bright lines(Fig. 1C), allowing an estimation of the dorso-ventral curvatureof the trailing edges of the caudal, dorsal, and anal fins. Fig.3shows representative tracings of the three fins from one half tail Fig. 2. Number of tail beats collected at different positions along thefish body (L) for four individuals. Individuals are shown as differentcolors. An image of a fish is shown in the background, scaledappropriately. beat. Beat frequency was 4.9±0.3 Hz, and did not differ amongfins (F6,291=0.32; P=0.926). The dorsal and anal fins tended toreach maximum lateral excursion 42% of a period earlier thanthe caudal fin. The caudal fin curved both upper and lower edgesinto the flow, with the tips showing a distinct cupping motion, A Fig. 3. Tips of thecaudal, dorsal and anal fins cup actively into theflow. Motion of fins through half a tail beat from left to right in twotransverse planes is presented. Each panel shows 7 tracings of theposterior margins of the fins, spaced equally in time, as seen frombehind the fish. Color and thickness of the bar indicate lateral velocityof a particular segment of the fin. The beat frequency for each fin isthe same, 4.9±0.3 Hz. (A) Caudal fin kinematics. Note how the upperand lower lobes bend into the flow at stroke reversal. Inset showsposition of the two planes.(B) Dorsal and anal fin kinematics. Notethe cupping motion of the outer edges of each fin. Scale bars are thesame for A and B. separate from the motion of the center (Fig.3C). Over the sametime period, the upper and lower tips of the caudal fin traverseda distance of 0.118±0.004L and 0.108±0.003L, respectively (22and 20 mm for L=183 mm, the mean total length) while thecenter moved 0.070±0.002L (12.9mm). The ANOVA showed2 significant differenceeamongtheethreepositions(F2,6.13=12.39; P=0.007) in 49 tail beats near the tail tip, andpost hoc tests using Tukey’s honestly significant difference ata significance level of 0.05 showed that upper and lower tipamplitudes were not significantly different, but they were bothdifferent from the center. Individuals showed no evidence ofsignificant variation (F3,6.00=3.26; P=0.101). Additionally, theupper and lower tips did not appear to differ in phase from eachother, but they both usually led the center by about 9%of thetail beat cycle (as Fig.3 shows). Comparing excursions fordorsal and anal fin inner and outer edges showed a significantdifference among positions (F3,6.22=7.32; P=0.019) for 18 tailbeats near the fins. Post hoc tests at a level of 0.05 indicatedthat dorsal and anal fins’outer edges moved the same distance,0.057±0.003L (10.5 mm), but the anal fin’s inner edge movedsignificantly less than the outer edge, 0.041±0.002L (7.6 mm).The dorsal fin inner edge, in contrast, covered the same distanceas the outer edge. Individuals showed significant variation(F3,6.01=20.46; P=0.002). Streamwise vortex structure A primary result of this study is the identification ofstreamwise vortices formed at different points along the fish’sbody. Vortices shed at eight locations along the fish’s bodywere identified (Fig. 4): the dorsal and ventral tips of the caudalfin, the angled ventral edge of the dorsal lobe of the caudal fin(the upper caudal fin notch), the dorsal edge of the ventral lobeof the caudal fin (the lower caudal fin notch), and the dorsaland ventral edges of both the soft dorsal fin and the anal fin.Additionally, vortices were tentatively identified as being shedoff the dorsal and ventral edges of the caudal peduncle,although they were difficult to identify definitively because thecaudal fin often blocked the view of the peduncle. Vorticesfrom the pectoral fin were also observed as they convectedthrough the light sheet, but are not included in the presentanalysis. Outer vortices from the anal and dorsal fin could beidentified in posterior planes by their phasing and position.Other vortices, including those from the peduncle and the inneredges of the anterior median fins, could not be identifieddefinitively as they convected toward the caudal fin. Vorticesunidentified in posterior planes (such as the unlabeled vorticesin Fig. 4A) may thus have been formed by the peduncle or theinner edges of the dorsal and anal fins, or by other sources suchas the pectoral and pelvic fins. The record of these vortex patterns over time could be usedto construct an approximation of the 3D streamwise wakestructure using the mean flow passing through the transverseplanes. From the flow’s viewpoint, the light sheet can beimagined as moving forward through still water, following thefish as it swims, and thus sampling a range of positions, ratherthan a range of times. Fig. 5 shows such an approximation on the basis of a light sheet at the tip of the caudal fin. Mostunidentified vortices were observed near the horizontal midlineand, while they typically had lower circulations than identifiedvortices, together they make up a substantial component of the total circulation. Some asymmetry is also present; for example,only clockwise vortices from the dorsal fin were detected, anasymmetry like that which Standen and Lauder (Standen andLauder, 2005) also found in dorsal fin kinematics. Vorticity(s-) Fig. 4. Examples of each of the ten different vortices identified. All images have the original PIV image in the background, yellow vectorsrepresent the flow field, and vorticity is shown as colored contours. In all panels, scale bars are 5 mm and scale vectors are 5 cm s. The headsof vectors shorter than 3 cm s are retained to indicate direction. (A) Flow field at the posterior margin of the caudal fin, with the laserilluminating the upper and lower lobes of the fin. The tail is moving from left to right and has just formed the two tip vortices, labeled ‘caudalfin (upper)'and ‘caudal fin (lower)’. Weak remnants of the outer dorsal and anal fin vortices are still present, labeled ‘dorsal fin’and ‘anal fin’.The notch between the two lobes of the caudal fin also sheds vortices, labeled ‘caudal notch (upper)'and ‘caudal notch (lower)’. Every othervector is shown. (B) Flow field at the trailing edge of the dorsal and anal fins, with the laser illuminating the two fins and part of the caudalpeduncle. The caudal fin blocks the view of some of the flow field. The fins are finishing motion from left to right, and the peduncle has justbegun to move from right to left. Outer vortices from the dorsal and anal fins are fully developed (labeled ‘dorsal fin’and ‘anal fin’). The finshave also formed vortices on their inner edges, labeled ‘dorsal fin (inner edge)'and ‘anal fin (inner edge)’. Two vortices may have been shedfrom the peduncle (both labeled ‘peduncle?’), but it is difficult to be certain because of the shadow cast by the peduncle.(C-E) Insets showingdetails of the vector fields boxed in A and B. All vectors are shown in these panels. This view differs from a true 3D flow field in two primaryways. First, it includes only streamwise vortices, which is notpossible in a real fluid. By the Helmholtz vortex theorem, thesevortices must be connected in some way to form completeloops (Faber, 1995). Second, it assumes that vortices do notinteract with one another and do not evolve over time.Although such evolution and interaction is known to occur(e.g. Tytell, 2004), the view presented in Fig.5 is still usefulfor understanding the 3D positions of streamwise vortices. To verify that vortices identified in posterior planes as dorsalor anal fin vortices were genuinely formed by the dorsal or analfins, the timing of peak circulation was investigated (Fig.6).Position alone was not enough to identify the dorsal fin vortexunambiguously. Fish often swam with their dorsal fins slightlylowered and with their heads pitched somewhat downwards;as a result, outer dorsal fin vortices often appeared on the samedorso-ventral level as the caudal fin tip vortex, or sometimeseven lower (Fig.6A). For the same reason, the outer anal finvortex was typically much lower than the corresponding caudalfin vortex and could be identified unambiguously by itsposition (Fig. 4A). For verification of the dorsal fin vortex,notethat fluid should flow from the trailing edge of the dorsal finat approximately 70% of body length to the tip of the caudalfin over a time (0.3L)/U. Flow acceleration in this region of thebody is probably negligible and will never be larger than the20% of U observed in the wake by Drucker and Lauder(Drucker and Lauder,2001). Fig.6B shows the timing of the dorsal fin vortex circulation as measured at 0.7L and at 1.0L,showing that they are separated by the correct amount of time. Spatial changes in circulation A goal of this study was to examine how overall circulationchanges along the body, because circulation is approximatelyproportional to force. To determine how much circulationchanges in a given plane, though, the circulation that convectsin from planes further upstream must be removed. Thisrequires taking the derivative with respect to body position.However, the raw data were too noisy to differentiate directly;therefore, a smooth regression model of the vortex circulationwas developed. Separate regressions were performed on circulation fromeach the vortices, including evolution over time as well asspace. This regression indicated that some circulation mayindeed decrease at the base of the caudal fin. A coordinatesystem that follows the mean flow was chosen. The assumptionthat vortices progress down the body at mean flow speed wastested in two ways. First, the position and time of peak vorticityof each vortex was plotted and compared visually to the flowspeed and body wave speed. Vortex speed was much closer toflow speed than body wave speed (for an example, seeFig.7A). Second, the regression models used (Eqn 4 and 5)allow some variation in vortex speed around the flow speed(i.e. phase can change nonlinearly along the body; seeMaterials and methods for an explanation). Fig. 5. Pseudo-three-dimensional view of thewake, showing the x and y positions ofvortices detected at the tip of the caudal fin,with time as the third axis. This view isrepresentative of the streamwise vortices inthe wake if the vortices did not evolve overtime or interact with each other. The sheetswept out by the caudal fin is shown in gray.Identified vortices are colored by circulation,while vortices that were detected but whosesource could not be determined are shownwith shades of gray representing circulation.Vortices shed by the caudal fin, including thetwo1tip vortices and the caudal notchvortices, have a black mesh, while the outerdorsal and anal fin vortices have a whitemesh. In the regressions, vortex circulation was polynomial overposition and periodic over time. With linear changes inamplitude and one Fourier mode (Eqn 4), the meanr’ valuewas 0.61 (range 0.4-0.72). Quadratic amplitude terms (Eqn 5with n=2 and m=1) were mostly significant, but only increasedmean rto 0.64 and began to introduce undesirable effects atthe ends of the ranges as the quadratic terms increased rapidly.Additionally, the second order Fourier modes (Eqn 5 with n=1and m=2) were mostly not significant (22 out of 32 terms weresignificant), small in amplitude (below 400 mm’s-l), and Fig. 6. Identification of outer dorsal fin vortex in the wake. (A) Twovortices above the upper margin of the caudal fin in a planeapproximately 5 mm downstream of the tail, shown by a thick blackline. The caudal fin vortex appeared first and is clearly a tip vortexfrom the caudal fin. The lower vortex, labeled‘dorsal fin vortex',appears later.(B) Plot of the circulations of three vortices against tailbeat phase. Red line, outer dorsal fin vortex as it is formed on thedorsal fin at z~0.7L; broken blue line, lower vortex in (A) at z~L;thin black line, caudal fin tip vortex (upper vortex in A), at z~L. Blackbars indicate the length of time it would take flow to pass from theposterior margin of the dorsal fin to the tip of the tail, positivelyidentifying the blue trace as the outer dorsal fin vortex.Dotted verticalline indicates the time of A. increased the mean r’ only slightly (to 0.63). Higher orderoscillations may be present in reality, but could not be detectedthrough the noise. Thus, a linear amplitude change with asingle Fourier mode (Eqn 4) was deemed sufficient. Interaction with the body appears to change the observedcirculation of individual vortices as they move with the flow(Fig. 7B). The measurements in this study cannot distinguish 500 1000 15002000 Circulation mag. (mm’s-l)0 100 0.75 0.8 0.85 0.95 1.05 Position(L) Fig. 7. Mean vortex circulation changes along the body. All plots havethe same x axis: body position in L. (A) Example of raw data usedfor the vortex circulation. Peak positive and negative circulation forthe dorsal fin vortex are shown. Color indicates circulation magnitude(mag.); squares and diamonds are from positive and negativecirculation vortices, respectively. Broken and dotted lines indicateflow speed and wave speed, respectively, and are spaced 50% of thetail beat cycle apart. (B,C) Results of the regression of circulation onphase and body position, detailed in Eqn 4, showing the amplitude ofthe oscillation in circulation (B) and the phase of the positivecirculation peak (C). Line color indicates specific vortices, shownschematically at the bottom of B. Phase trajectories in C that wraparound from 100% back to 0% are indicated with arrowheads and-tails. Although the regression from Eqn4 is linear in the amplitudeof the sine and cosine terms separately, the joint amplitudes andphases can have nonlinearities due to the differing weights of thecoefficients. See text for more details. vortex reorientation (i.e. streamwise vortices becoming morevertical, or vice versa) from true changes in circulation, butboth effects may be results from interactions with the body. Allvortices except for the inner dorsal fin vortex had significantchanges in circulation along the body (P<0.05 in all cases;Fig. 7B). The circulation oscillations were slightly asymmetricfor all the major vortices (outer dorsal and anal fin vortices andboth caudal fin tip vortices), meaning that the C parameters(intercepts) from Eqn 4 were significant. The intercepts wereless than 12% of mean amplitude in all cases, but did show abias towards stronger vortices on the fish’s left, probablyreflecting the fish’s desire to escape the experimenter or thebright laser light, which were both on its left. Fig. 7C shows the phase of the peak positive circulation aseach vortex moves down the body. Most vortices track withthe mean flow speed (shown with broken lines), although thecaudal fin vortices have a velocity slightly (but significantly;P<0.05 in all cases) above mean flow, probably reflecting theacceleration of flow near the caudal fin. The magnitude of circulation from each vortex, estimatedthrough these regressions, was summed and differentiatedalong the body position. This allowed an estimate of the Total circulation 100 3000 A 12 80 60 40 1 20 500 0 0.7 0.75 0.8 0.85 0.9 0.95 Change in circulation along the body Fig. 8. Sum of the regressions for each individual vortex's circulationto determine how total circulation changes as flow moves down thebody. Broken lines on each plot indicate the slope of the flow speed;they are only visual guides and are not fit to the data. (A) Totalcirculation magnitude along the body over the tail beat cycle,composed of the smoothed sum of the fitted circulations for eachidentified vortex. (B) Magnitude of circulation added per unit lengthby each position on the body over half of a tail beat cycle, estimatedby taking the derivative of A with respect to position along the brokenlines of flow speed. The zero contour is outlined in a thin solid blackline, indicating that circulation is removed at certain times and places. streamwise circulation added by each point along the body.Fig.8 shows the estimated total circulation and its derivative.Note that circulation decreases near the caudal peduncle andoccasionally along the caudal fin itself (blue regions inFig.8B). The mean circulation added over the whole tail beatperiod was estimated for 12 segments from 0.7 to 1.0L, eachwith length 0.025L (Fig. 9). Fig. 9 indicates that circulation is added primarily at threepoints: at the trailing edges of the dorsal and anal fins, abouthalfway down the caudal fin, and at the very tip of the caudalfin. These correspond to the dorsal and anal fin vortices, thecreation of the caudal fin tip vortices, and the vortex sheddingfrom the notch in the caudal fin. In contrast, the caudalpeduncle and the base of the caudal fin appear to removecirculation, possibly’ indicating someevortexinteractionbetween the caudal fin and the dorsal and anal fin vortices.Note that Fig. 8B shows a small region of circulation loss atnear 0.95L; however, averaged over a full tail beat, this regionof the body does add net circulation, as Fig. 9 shows. Thepattern and approximate magnitudes shown in Fig.9 wererobust to all changes of polynomial and Fourier order in theregression model described above. Comparison ofcirculation among vortices Finally, the peak circulations of vortices from each fin werecompared using a two-way, mixed-model ANOVAwith Fig. 9. Averaged over a tail beat, circulation increases at the dorsaland anal fins and at the trailing edge of the caudal fin, but decreasesat the caudal peduncle and base of the caudal fin. Bars show meancirculation added over a tail beat at 12 points along the body, each0.025L wide. effects from vortex type (fixed effect) and individual (randomeffect). Table 1 summarizes the results, and the least-squaresmeans of the peak circulation of each vortex are given inFig. 10. Multiple comparisons of the vortex strengths (usingTukey’s honestly significant difference) show that, with 95%confidence,the two caudal fin tip vortices are not significantlydifferent from one another or the outer dorsal fin vortex, whilethe outer anal fin vortex is not significantly different from thelower caudal fin tip vortex. The two vortices from the caudalfin notch are not significantly different, either, but the outerdorsal fin vortex is significantly stronger than the outer anal finvortex. Comparison to 2D ideal flow Fig. 11 shows an example of the effectiveness E of the tailin accelerating flow in a single direction, based on Eqn8.Fig. 11A,B show examples of the flow accelerated up anddown as the tail moves from left to right and from right to left,respectively. Because of the shadow cast in the laser lightsheet, E could only be estimated on one side of the tail at atime (termed ‘single-side effectiveness’). By using the flowestimates from sequential half tail beats, a total effectivenesswasestimated. FFig. 11C showssboththe single-sideeffectiveness and the estimated total effectiveness for fourexample tail beats. The mean peak value of E for the 32 halftail beats near the tail tip (0.975L≤s≤1.025L) was 0.75±0.02. Discussion In this study, I describe the streamwise vortex structurearound the posterior body of a swimming bluegill sunfishLepomis macrochirus. To my knowledge, these are the firstobservations of streamwise vorticity near the tail of anyswimming fish, and only the second time flow in the transverseplane has been observed in a biological fluid dynamic study(the first was Drucker and Lauder, 1999). Additiorbecause flow in this plane was sampled at multiple points alongthe body, this study provides the most complete experimentaldescription to date of three-dimensional flow aroundieaswimming fish. Table 1.ANOVA on maximum vortex circulation Source MS d.f. F P Vortex 2 524 531 7 11.48 <0.0001 Denom: 0.97Fs×Vx+0.03e 219869 21.5 Fish (random) 83646 3 0.5 0.684 Denom: 0.57Fs×Vx+0.43e 167 133 35.39 FishXVortex (random) 223540 21 2.43 0.0004 Error 92038 668 N=700. Bold indicates a significant effect. MS, mean square; d.f., degrees of freedom. Denominators (Denom.) used for F tests shown below relevanteffects, where Fs×Vx is the Fish×Vortex MS error and e is theresidual error; when not listed, the error MS was used. Fig. 10. The dorsal and anal fins produce vortices with streamwisecirculation statistically indistinguishable from those produced by thecaudal fin. Bars show the mean + s.e. of the peak circulation over theentire body, based on the ANOVA described in the text. Vortices withcirculations that do not differ significantly (P<0.05) are connected bybars below the plot. Inset shows the position on the body where eachvortex was generated. Three-dimensional vortex structure Transverse flow patterns are quite complex. Streamwisevortices are shed off the caudal fin, at the dorsal and ventralmargins as well as at the central notched region, and off thedorsal and anal fins, at both the dorsal and ventral margins ofeach. By the Helmholtz vortex theorem (Faber, 1995), all ofthese vortices must connect in some way to form loops. InFig. 12A,B, I propose a 3D wake structure that incorporatesthe present measurements. Although the pattern is complex,low-aspect ratio flapping foils also show similarly intricatestructures (Buchholz and Smits, 2006; Dong et al., 2005; vonEllenrieder et al., 2003). The caudal notch vortices connect toform something like a hairpin vortex within the overall vortexring. The tail’s cupping motion elongates them more thanmight be expected from the shape of its trailing edge, but theydo not appear to connect to form a full ‘ring-within-a-ring'structure, observed by Wilga and Lauder from shark tails(Wilga and Lauder, 2004). In retrospect, the size and shape of these hairpin notchvortices could have been predicted from kinematics alone,going back to Bainbridge’s measurements from dace Leuciscusleuciscus (Bainbridge, 1963), and Lauder’s observations fromsunfish (Lauder, 2000). Both observed approximately the sametail motion seen in this study: a distinct cupping motion, inwhich the center of the fin moves only about 60% as far as thetips and lags behind the tips by about 9% of the tail beat cycle(Fig. 3). Because of these amplitude and timing differences, thevertical vortices from the center of the fin must be in differentplaces than those from the upper and lower edges (as shownin the horizontal projection of Fig. 12). Although the vortex structure proposed appears much morecomplex than previous portrayals (e.g. Lauder, 2000), it isconsistent with them. Any horizontal section would find two Fraction of tail beat cycle Fig. 11. Representative plot of the geometric effectiveness E measured at 0.95L, with example flow fields at approximately 25% and 75%through the tail beat cycle. (A,B). Example flow fields showing the main flow patterns as the tail moves from left to right (A) and from rightto left (B). The tail is shown in blue. Scale bars and scale vectors shown below the panels are valid for both. Light passes through the tail to asmall extent, allowing the estimation of some vectors in the shadowed (right) side, but these vectors, shown in gray, were not used in theeffectiveness calculations. (C) Effectiveness estimated assuming tail beats are symmetrical (red line) by using the previous half tail beat toreconstruct flow in the shadowed side of the tail. The black line shows the single-side effectiveness, using only the flow on the illuminated sideof the tail. Single-side effectiveness is higher in the first half of the tail beat, showing that the tail is less effective at sucking fluid laterally thanit is at pushing it, probably due to its cupped shape. The dotted lines show the times at which A and B were measured. Fig. 12. Proposed 3D vortex structure around a swimming bluegill sunfish. Vortex loops are shed off the caudal, dorsal and anal fins, shown ingreen, red and blue, respectively. Vortex filaments and their directions are shown by solid arrowheads. The direction of vortex rotation, derivedby the right hand rule from the filament direction, is shown with open arrowheads where there is space.(A) 3D view, showing the proposedlinkages between caudal fin tip vortices and dorsal and anal fin vortices. Question marks are shown where the connection between dorsal oranal fin vortices and the caudal fin wake is unclear. The notch vortices in the far wake are shown by dotted lines, indicating that the structureis hydrodynamically unstable and may not persist in the form shown. A projection of the vortex structure in the horizontal plane is shown below,with dotted lines indicating the correspondence between the projection and four centers of rotation. Note that the projection is taken frommultiple horizontal planes. A midline tracing, in the correct phase, is shown below the fish. (B) Side views of the vortex filaments shown in Aas the fish swims from left to right, showing how the dorsal and anal fin vortex filaments could potentially join up to the caudal fin vortices.Notch vortices in the far wake are again shown dotted to indicate their instability. (C) Schematic of the progression of the outer dorsal fin vortexand its interaction with the caudal fin, shown at three points in time from top to bottom. The fish is holding station in flow moving from rightto left. L, low pressure zones that would be formed along the tail due to the proximity of the outer dorsal fin vortex. strong centers of vorticity arrayed in a reverse von Karmanstreet, as observed for carangiform swimmers (Drucker andLauder, 2001; Muller et al., 1997; Nauen and Lauder, 2002a),and vertical sections would find two tip vortices for most ofthe cycle (Nauen and Lauder, 2002a; Nauen and Lauder,2002b). It is also numerically consistent with Drucker andLauder’s results from similar-sized sunfish swimming at aboutthe same speed (Drucker and Lauder, 2001). Estimated fromtheir published figures, sunfish swimming at 1.1 L s-producevertical vortices from the caudal fin with circulations near1000 mm²s-l, comparable to the measured streamwise vortexcirculations. However, Fig. 12 makes several easily tested predictions ofeffects that have not previously been observed. In particular,there should be a shift in the timing and spacing of verticalvortices among horizontal planes at the midline versus upperor lower planes, as indicated by the horizontal projection inFig. 12A. Additionally, observations of flow in a vertical planeshould identify the caudal notch vortices. Do these notch vortices have a functional significance?Wilga and1 Lauder proposed that the ring-within-a-ringstructure from a shark’s tail might enhance maneuverability,by allowing sharks to tune the force production precisely(Wilga and Lauder, 2004). The caudal notch vortices may bethe evidence of similar abilities in the sunfish; namely, eachlobe of the caudal fin is independently controlled and canproduce different forces. In steady swimming, the caudal notchvortices are equal in strength (Fig. 10), but they need not be.An imbalance in the two vortices would allow fine tuning ofpitching and rolling moments produced by the tail duringsteady swimming. Larger imbalances might be used duringmaneuvers. The notch vortices also have a disadvantage: they cause thetail to transmit force less efficiently. A circular vortex ringwould be more efficient at producing thrust than the loopshown in Fig. 12 (Lighthill, 1970). Thus, the vortices may beevidence of a trade-off between maneuvering capabilities andswimming efficiency. The mechanical properties of the tail and its kinematics maydetermine whether caudal notch vortices are produced. Nauenand Lauder, using PIV in a vertical plane, did not observe thesevortices from mackerel (Nauen and Lauder, 2002a), despite thedeep fork in their tails. One explanationisthat theirmeasurements may have lacked the resolution necessary todetect these vortices (they estimated approximately 20 vectorsover the tail height, while about 90 vectors were estimated inthis study). More interestingly, though, if mackerel genuinelydo not produce caudal notch vortices, it may indicate thedifferent specializations of mackerel and bluegill sunfish.Mackerels’ stiffer tails and lack of the cupping motion (Gibbet al., 1999) may allow them to produce a more efficient, morecircular vortex ring wake, better suited to steady long distanceswimming. Additionally, the higher aspect ratio of their tail finmay mitigate some of the 3D losses, estimated with E. Sunfish,in contrast, may sacrifice some propulsive efficiency for a less-rigid tail that enables them to maneuver more precisely. It should also be noted that the notch vortices, whileconvincingly shown in the near wake (Fig. 4A,C), are nothydrodynamically stable. The notched vortex loop depicted inFig. 12 assumes little interaction between them over time,which is probably not a valid assumption. Thus, in the farwake, the 3D structure is less clear (indicated by broken linesin Fig. 12). However, the functional consequences of the wakedepend primarily on the near wake; the temporal evolution ofthe wake has a relatively small effect on the fish’s swimming. Fig. 12 also incorporates a more speculative idea of the 3Dstructure of the dorsal and anal fin vortices, shown in red andblue, respectively. The results of this study (Fig.5), combinedwith Drucker and Lauder’s horizontal measurements near thedorsal fin (Drucker and Lauder, 2001) clearly indicate thatthese vortices first form as part of small linked vortex ringsfrom each fin. However, the inner portion of the ring isprobably destroyed by interactions with the caudal fin (asFig.9 suggests). To maintain a hydrodynamically consistentvortex filament structure, the outer portions must link up withthe caudal fin vortices in some way. It is difficult to find aconsistent structure with links between these and the caudal finvortices (indicated by question marks in Fig. 12A), butFig. 12B shows one hypothesis. A different explanation for the difficulty in constructing avortex filament model is that the model itself may not beconsistent with such complex flows. The interaction of flowfrom the anterior median fins as it passes over the caudal finmay not be reducible to a simple small-core vortex model. Thefins actually shed distributed sheets of vorticity, which may beapproximated in some cases as simple filaments, but theinteraction between the streamwise vortices shed off the tip ofthe caudal fin and the outer edges of the dorsal and anal finsmay be too complex for such a representation. Furthermeasurements near the caudal peduncle and in the wake willclarify the structure. Vortex interactions Many previous studies have proposed that vortices producedon the anterior body might interact with flow around the caudalfin, potentially boosting the fin’s thrust or efficiency (Ahlbornet al., 1991; Gopalkrishnan et al.,1994; Wolfgang et al., 1999;Zhu et al., 2002). Drucker and Lauder found the first empiricalevidence of such interactions (Drucker and Lauder, 2001;Lauder and Drucker, 2004), and Akhtar and Mittal used acomputational simulation to demonstrate that the interactiondoubled the caudal fin’s thrust and increased efficiency by 50%(Akhtar and Mittal, 2005). This study provides evidence for vortex interactions in thestreamwise direction, a previously unrecognized source ofvortical flow that might be exploited by the caudal fin. Figs 8Band9 indicate that the observed streamwise circulationdecreases as flow moves from the anterior median fins over thepeduncle to the caudal fin. The vortices from the inner marginsof the dorsal and anal fins almost certainly interact with the tailin this region (indicated schematically in Fig. 12), and, if thetwo fins are depressed slightly more than Fig. 12 depicts (as is common at higher speeds; Drucker and Lauder, 2001), the fins’outer vortices may also intersect the tail. The estimateddecrease may be due to four different effects: (1) difficulty inobserving vortices near the peduncle; (2) viscous or turbulentdissipation of vorticity; (3) reorientation of streamwise vorticesto a more vertical or lateral orientation; (4) true reduction incirculation of the vortices. First, the region where circulation seems to be removed(from 0.75 to 0.875L in Fig. 9) was also the most difficultregion to resolve vortices, because the caudal fin often blockedmuch of the view. Some of the decrease, then, may beattributable to methodological difficulties in observing flownear the peduncle. Second, this decrease could also be due to viscous orturbulent dissipation of vorticity (Tytell and Ellington, 2003),but the diameter of the vortex coresdid not changesubstantially, as would be expected with viscous diffusion ofvorticity, nor did the vortices appear to be breaking upturbulently. The length scale for viscous diffusion, vvT, wherev is the kinematic viscosity and Tis the tail beat period, is about0.6 mm, which is sufficiently smaller than the average vortexcore radius (around 2.5 mm for the major vortices) for viscousdiffusion of vorticity to be a minor effect (Saffman, 1992). Thus, it seems likely that the decrease in circulation is notdue to evolution of the flow itself, but rather to the third orfourth effect, reorientation or true decreases in circulation.Both of these are the results of interactions with the body.These interactions may simply reduce theamount ofcirculationnmeasured.l, without changing thettrue totalcirculation, or may genuinely reduce overall circulation. First,the body may cause streamwise vortices to become morevertical, reducing the circulation measured in the transverseplane. Also, the body may destroy a vortex as a coherentstructure, without actually changing the total vorticity in theflow, by causing the vortex to break down turbulently. Smallregions of vorticity would not be detected by the vortexidentification algorithm, or might drop below the errorthreshold in PIV. Vortex flow may also be incorporated intothe boundary layer vorticity, removing the vortex as a separateflow structure. but maintainingoverall circulation.Alternatively, however, the high pressure region on the anteriorsurface of the fin may raise the low pressure region in thecenter of the vortex, spreading out the vortex core and trulyreducing its strength. The final effect implies that the fish may be able to exploitthe above interactions for its own benefit. Based on the bodyand vortex kinematics, I hypothesize that fish may be able toincrease the thrust of the caudal fin by reducing the pressureon the anteriorly inclined surface. Pressure in the center of avortex is low (Faber, 1995). As streamwise vortices from thedorsal and anal fins pass near the caudal fin, they will reducethe pressure on the side that is angled forward, while thepressure in the center of the vortex becomes closer to ambient,reducing the vortex circulation. The kinematics are consistentwith this proposal (shown schematically in Fig. 12C), but morestudy, particularly computational simulations (like those of Akhtar and Mittal, 2005), will be necessary to determinewhether any thrust augmentation is present and how importantan effect it is. Even if the effect is present, the fish does not receivesomething for nothing. The dorsal and anal fin vortices mayincrease the caudal fin’s thrust, but the efficiency of the entirefish will still be much lower than one. In fact, a more efficientarrangement would have been not to create the dorsal and analfin vortices in the first place, because the energy used to createthem will never be completely recaptured by the caudal fin.However, because the anterior median fins are clearly usefulfor other purposes, such as maneuvering and roll stability(Drucker and Lauder, 2001; Standen and Lauder, 2005),recapturing some of their vortex energy at the caudal fin couldimprove steady swimming, despite competing functionaldemands. Importance of the dorsal and anal fins Not only do the soft dorsal and anal fin possibly increase theefficiency of the caudal fin, but they produce considerableforces themselves. In fact, the vortex data in this study suggestthat they produce a combined force that is comparable to thatof the caudal fin. In steady vortical flow, like a vortex ring, theforce that produced the flow is proportional to the vortex’scirculation and the area of its loop (Batchelor, 1973). Whilethis assumption does not necessarily hold in complex unsteadyflows like fish swimming (Dabiri, 2005), estimations of thrustand lift forces, for example, on the basis of this method haveat least been consistent with measured drag and weight forces(Drucker and Lauder, 1999). Additionally, studies of birdsusing a steady vortex analysis (Spedding et al., 2003; Warricket al., 2005) found good agreement between the circulationrequired to support a flying bird and the circulation theymeasured in the wake. Therefore, the relative magnitude of forces produced by themedian fins can be compared by examining the relativecirculations of the vortices they produce, as well as the areasof the vortex loops. Fig. 10 shows that the streamwisecirculation produced by each of the three median fins is notsignificantly different.. Their circulations in the verticaldirection are probably also comparable, at least at the momentit is shed, because a vortex filament must form a continuousloop connecting the opposite sense streamwise vortices (Faber,1995). Therefore, the loops probably have roughly the samecirculation in all planes. The horizontal plane flow fieldspresented by Drucker and Lauder (Drucker and Lauder, 2001)are also consistent with this observation. Additionally, theareas of the fins’respective vortex loops are also comparable.Loop area, in turn, is approximately equal to the product of thestreamwise diameter and the dorso-ventral height. Loops fromthe dorsal fin, anal fin and caudal fin have approximately thesame streamwise diameter (Fig.5), because the beat frequencyis the same. With reference to the picture in Fig. 9, thecombined trailing edges of the erected soft dorsal and anal finsare quite comparable to that of the caudal fin. Thus, thecombined areas are also similar, and the vortices’contribution to total force should also be comparable to that of the tail.Probably the forces are within a factor of two of each other,and are almost certainly the same order of magnitude. Aspropulsors, the dorsal and anal fins together are approximatelyequal to a second tail. Drucker and Lauder’s results from the horizontal plane(Drucker and Lauder, 2001) support this argument. They foundthat the soft dorsal fin produced a substantial amount of thrust:about 40%of that produced by the caudal fin. They did nothave measurements from the anal fin, but on the basis of thefact that the kinematics are similar (Standen and Lauder,2005),one would expect that horizontal measurements from the analfin would show similar amounts of thrust. Together, force fromthe two fins would thus be nearly equal to that from the tail. The above arguments highlight the importance of the dorsaland anal fin relative to the caudal fin. They should not beconstrued as a statement that the anterior median fins produceforces that exactly equal those of the caudal fin. First, asdiscussed above, they neglect unsteady effects. Secondly, theargument hinges on a rough evaluation of the length of thetrailing edges of the fins. Fish can control these lengths activelyby erecting or depressing the fins (Helfman et al., 1997).Particularly at high speeds, the dorsal and anal fins will not befully erected and therefore will produce lower forces. Finally,the argument does not relate to the direction of the forces. Thecaudal fin may well produce substantially more thrust than thedorsal and anal fins (Drucker and Lauder, 2005), even if thetotal force magnitudes are comparable. Nonetheless, theobservations in this study indicate that the combined dorsal andanal fin force is comparable to that of the caudal fin, within anorder of magnitude, and possibly much closer for bluegillsunfish swimming at low speeds. Additionally, the division of forces between the dorsal, analand caudal fin in other fish taxa may not be as symmetrical asobserved in bluegill sunfish, a percomorph fish. Forexample, thedorsal fin in trout, a basal euteleost, is placed much moreanteriorly than their anal fins (Helfman et al., 1997) and seemsto produce primarily lateral forces (Drucker and Lauder, 2005).The anal fin, which is comparable to the dorsal fin in size,probably also produces large forces, but the relative magnitudeand timing (important for balancing roll moments; Standen andLauder, 2005) has not been described. In contrast, eels, basalteleosts, have dorsal and anal fins that merge into the caudal fin(Helfman et al., 1997; Lauder and Tytell, 2006), and thus do nothave a separate vertical trailing edge. They will still shedstreamwise vortices, but the structure of these vortices is currentlyunknown. Comparative studies are necessary to determine thehydrodynamic effect of these different fin placements. Nonetheless, in many fish taxa, it is likely that the dorsal andanal fins play an active and substantial role in steady ‘body andcaudal fin’ swimming,which isisusually separated from‘median and paired fin’swimming (Helfman et al., 1997). Thecurrent observations and those of Drucker and Lauder (Druckerand Lauder, 2001; Drucker and Lauder, 2005) and Standen andLauder (Standen and Lauder, 2005), indicate that this divisionis not so clear, and should perhaps be revised. Three-dimensional fish, two-dimensional theoriesA clear conclusion from this study is that the two-dimensional view of fish swimming misses several importanteffects, most notably the contributions of the dorsal and analfin. Most 2D theories (except for, for example, that of Weihs,1972) neglect these two fins entirely, passing over a sizeablefraction of the total force and a potential method to enhancethrust from the caudal fin. Additionally, the 3D motion of thecaudal fin may have important functional consequences formaneuverability. Numerically, Fig.11 indicates that the caudal fin is onlyabout three-quarters as good at accelerating flow in a coherentdirection as a 2D plate. At best, about 25% of the flow nearthe tail tip is present as up and down momentum that cancelsout, resulting in zero net force. In fact, the cupping motion ofthe tail may be an attempt to reduce this effect; on the cuppedside, E is increased to approximately 90%.More anteriorregions of the body, which are more rounded and cannot cupinto the flow, probably have even lower E values. One should be cautious in relating the effectiveness E toFroude propulsive efficiency. While the losses due to opposingmomentum will lower the propulsive efficiency, E cannot beused as a numerical estimate of Froude efficiency. Instead, itis intended to assess the ‘two-dimensionality’of a 3D shapeand flow pattern, to be used as a guide for the application of2D theoretical models. These models will have two opposite types of errors due toeffects observed in this study: neglecting the dorsal and analfins will tend to produce underestimates of 3D forces, whilethe losses due to cancellation of vertical momentum will resultin overestimates. Tytell observed that elongated body theory(Lighthill, 1971) and 2D resistive models (Taylor, 1952) bothunderestimate lateral forces for eels, possibly indicating thatthe first effect may be more important than the second (Tytell,2004). Correcting for this underestimate is not difficult forfishes like sunfish with separate median fins; Weihs provideda method for adding in the contributions from fins other thanthe caudal fin (Weihs, 1972). For eels, in which the dorsal andanal fin merge into the caudal fin, such a correction is moredifficult, because the dorsal andanal fins will producestreamwise vortices but have no vertical trailing edges.Additionally, correcting for the overestimate due to losses fromcancellation of vertical momentum is not straightforward.Given these caveats, Weihs’s extension to elongated bodytheory (Weihs, 1972) may still produce useful comparisons ofswimming modes and fin sizes and placements, but thenumerical force and power estimates should be evaluatedcautiously. In particular, Schultz and Webb argue for the useof 2D theoretical models to examine the power requirementsof steady swimming (Schultz and Webb, 2002). The currentresults, in contrast, indicate that 3D computational models (e.g.Dong et al., 2005; Zhu et al., 2002) may be important toproduce accurateeestimatesa nad that more experimentalmeasurements of 3D flowswill be necessary to avoidoverlooking important effects, such as the contributions of thedorsal and anal fins. List of symbols geometric effectiveness, defined in Eqn 8 fish length number of Fourier modes in the regression model(Eqn5) statistical probability arc length along the body midline, starting at thehead unit vector tangent to contour timetail beat periodflow velocity vectorhorizontal flow velocity componentmean flow (swimming) speedvertical flow velocity componentdownstream flow velocity component dij, bi coefficients used to fit circulation in Eqn 4 and 5Cintercept in the model in Eqn 4 and 5E7StuUXyaImin minimum circulation of an automatically identifiedvortex入0T number of polynomial terms in the regression model(Eqn 5) horizontal position vertical position axial (streamwise) position phase of the body’s motion, adjusted for the flow speed vortex circulation threshold swirling strength for vortex identificationangle between the two cameras kinematic viscosity of water minimum duration of an automatically identifiedvortex phase value for the tail tip motion I am grateful to all members of the Lauder laboratory forhelpful discussions of this project, including Peter Madden,who helped with camera configuration and data analysis, andparticularly George Lauder. Thanks to Emily Standen, PeterMadden and George Lauder for thoughtful comments on themanuscript. Thanks also to Rajat Mittal for discussions offluid dynamics. Two anonymous reviewers helped to improvethe manuscript substantially. The fish were maintained byJeremiah Alexander. FundingWas provided by NSFIBN0316675 to George Lauder. ( References ) ( Adrian, R . J ., Christensen, K. T . a nd L i u, Z.-C. ( 2 000). A nalysis a ndinterpretation of instantaneous turbulent v e locity fields. Exp. Fluids 29,275-290. ) Ahlborn, B., Harper, D. G., Blake, R. W., Ahlborn, D. and Cam, M.(1991). Fish without footprints. J. Theor. Biol. 148, 521-533. Akhtar,I. and Mittal, R.(2005). A biologically inspired computational studyof flow past tandem flapping foils. 35th AIAA Fluid Dynamics Conf. Exhib.Toronto, ON. AIAA 2005-4760. Bainbridge, R. (1963). Caudal fin and body movements in the propulsion ofsome fish. J. Exp. Biol. 40, 23-56. Barnard, R. H. and Philpott, D. R. (1995). Aircraft Flight. London:Longman Group. Barrett, D., Triantafyllou, M. S., Yue, D. K. P., Grosenbaugh, M. A. andWolfgang, M. J. (1999). Drag reduction in fish-like locomotion. J. FluidMech. 392, 183-212. Batchelor, G. K.(1973). An Introduction to Fluid Dynamics. Cambridge:Cambridge University Press. Breder,C.M. (1926). The locomotion of fishes. Zoologica 4, 159-297. Buchholz,J. and Smits, A. J. (2006). On the evolution of the wake structureproduced by a low aspect ratio pitching panel.J. Fluid Mech. 546, 433-443. Carling, J., Williams, T. L. and Bowtell, G. (1998). Self-propelledanguilliform swimming: Simultaneous solution of the two-dimensionalNavier-Stokes equations and Newton’s laws of motion. J. Exp. Bio. 201,3143-3166. Dabiri, J.O. (2005).On the estimation of swimming and flying forces fromwake measurements. J. Exp. Biol. 208, 3519-3532. Dong, H., Mittal, R., Bozkurttas, M. and Najjar, F. (2005). Wake structureand performance of fine aspect ratio flapping foils. 43rd AIAA Aerosp. Sci.Meet. Exhib. Reno, NV.AIAA 2005-0081. Drucker, E. G. and Lauder, G. V. (1999). Locomotor forces on a swimmingfish: three-dimensional vortex wake dynamics quantified using digitalparticle image velocimetry. J. Exp. Biol. 202, 2393-2412. Drucker, E. G. and Lauder, G. V. (2000). A hydrodynamic analysis of fishswimming speed: wake structure and locomotor force in slow and fastlabriform swimmers. J. Exp. Biol. 203, 2379-2393. Drucker, E. G. and Lauder, G.V. (2001). Locomotor function of the dorsalfin in teleost fishes: experimental analysis of wake forces in sunfish. J. Exp.Biol. 204, 2943-2958. Drucker, E. G. and Lauder, G. V. (2005). Locomotor function of the dorsalfin in rainbow trout: kinematic patterns and hydrodynamic forces.J. Exp.Biol. 208, 4479-4494. Faber, T. E. (1995). Fluid Dynamics for Physicists. Cambridge: CambridgeUniversity Press. Ferry, L. A. and Lauder, G. V. (1996). Heterocercal tail function in leopard sharks: a three-dimensional kinematic analysis of two models. J. Exp. Biol. 199,2253-2268. Gaydon, M., Raffel, M., Willert,C. E., Rosengarten, M. and Kompenhans, J.(1997). Hybrid stereoscopic particle image velocimetry. Exp. Fluids 23, 331-334. Gibb, A. C., Dickson, K. A. and Lauder, G. V. (1999). Tail kinematics of the chub mackerel Scomber japonicus: Testing the homocercal tail model of fish propulsion. J. Exp. Biol. 202, 2433-2447. Gonzalez, R. C., Woods, R. E. and Eddins, S. L. (2003). Digital Image Processing using MATLAB. Upper Saddle River, NJ: Pearson Education. Gopalkrishnan, R., Triantafyllou, M. S., Triantafyllou, G. S. and Barrett, D. (1994). Active vorticity control in a shear flow using a flapping foil. J. Fluid Mech. 274, 1-21. Haller, G. (2005).An objective definition of a vortex. J. Fluid Mech. 525, 1-26.Hart,D. P. (2000). PIV error correction. Exp. Fluids 29, 13-22. Hartley, R. and Zissermann, A. (2000). Multiple View Geometry inComputer Vision.Cambridge: Cambridge University Press. He, P. and Wardle,C. S. (1986). Tilting behavior of the Atlantic mackerel,Scomber scombrus, at low swimming speeds. J. Fish Biol. 29, 223-232. Helfman, G. S., Collette, B. B. and Facey, D. E. (1997). The Diversity ofFishes. London: Blackwell Science. Jenkins,R. E. and Burkhead, N. M. (1994). Freshwater Fishes of Virginia.Bethesda,MD: American Fisheries Society. Lauder, G. V. (2000). Function of the caudal fin during locomotion in fishes:kinematics, flow visualization, and evolutionary patterns. Am. Zool. 40, 101-122. Lauder, G. V. and Drucker, E. G. (2004). Morphology and experimentalhydrodynamics of fish fin control surfaces. IEEE J. Oceanic Eng. 29, 556-571. Lauder, G. V. and Tytell, E. D. (2006). Hydrodynamics of undulatorypropulsion. In Fish Biomechanics (ed. R. E. Shadwick and G. V. Lauder),pp. 425-468. San Diego: Academic Press. Lauder, G. V., Nauen, J. C. and Drucker, E. G. (2002). Experimentalhydrodynamics and evolution: Function of median fins in ray-finned fishes.Integr. Comp. Biol. 42, 1009-1017. Liao, J. and Lauder, G. V. (2000). Function of the heterocercal tail in whitesturgeon: flow visualization during steadyswimmingandverticalmaneuvering. J. Exp. Biol. 203, 3585-3594. Lighthill, J. (1960). Note on the swimming of slender fish. J. Fluid Mech. 9,305-317. Lighthill, J. (1970). Aquatic animal propulsion of high hydromechanicalefficiency. J. Fluid Mech. 44, 265-301. Lighthill, J. (1971). Large-amplitude elongated-body theory of fishlocomotion. Proc. R. Soc. Lond. B 179, 125-138. Lindsey, C. C. (1978). Form, function, and locomotory habits in fish. In FishPhysiology. Vol. VII, Locomotion (ed. W. S. Hoar and D. J.Randall), pp.1-100. New York: Academic Press. Milliken, G. A. and Johnson, D. E. (1992). Analysis of Messy Data, Vol. 1,Designed Experiments. London: Chapman & Hall. Miiller, U. K., van den Heuvel, B.-L. E., Stamhuis, E. J. and Videler, J. J.(1997). Fish foot prints: morphology and energetics of the wake behind acontinuously swimming mullet (Chelon labrosus Risso). J. Exp. Biol. 200,2893-2906. Muller, U. K., Smit, J., Stamhuis, E. J. and Videler, J. J.(2001). How thebody contributes to the wake in undulatory fish swimming: flow fields of aswimming eel (Anguilla anguilla). J. Exp. Biol. 204,2751-2762. Nauen, J. C. and Lauder, G. V. (2002a). Hydrodynamics of caudal finlocomotion by chub mackerel, Scomber japonicus (Scombridae). J. Exp.Biol. 205, 1709-1724. Nauen, J. C. and Lauder, G. V. (2002b). Quantification of the wake ofrainbow trout (Oncorhynchus mykiss) using three-dimensional stereoscopicdigital particle image velocimetry. J. Exp. Biol. 205, 3271-3279. Nogueira, J., Lecuona, A. and Rodriguez, P. A. (1997). Data validation,false vectors correction and derived magnitudes calculation on PIV data.Meas. Sci. Technol.8, 1493-1501. Pereira, F. and Gharib, M. (2002). Defocusing digital particle imagevelocimetry and the three-dimensional characterization of two-phase flows.Meas. Sci. Technol. 13, 683-694. Prasad, A. K. (2000). Stereoscopic particle image velocimetry. Exp. Fluids29,107-115. Press, W. H., Teukolsky, S. A., Vetterling, W. T. and Flannery, B. P.(1992). Numerical Recipes in C. Cambridge: Cambridge University Press. Saffman, P. G. (1992). Vortex Dynamics. Cambridge: Cambridge UniversityPress. Schultz,W. W. and Webb, P. W. (2002). Power requirements of swimming:do new methods resolve old questions? Integr. Comp. Biol. 42, 1018-1025. Spedding, G. R., Rosen, M. and Hedenstrom, A. (2003). A family of vortexwakes generated by a thrush nightingale in free flight in a wind tunnel overits entire natural range of flight speeds. J. Exp. Biol. 206, 2313-2344. Standen, E. M. and Lauder, G. V. (2005). Dorsal and anal fin function inbluegill sunfish (Lepomis macrochirus): three-dimensional kinematicsduring propulsion and maneuvering. J. Exp. Biol. 208, 2753-2763. Taylor, G. I. (1952). Analysis of the swimming of long and narrow animals.Proc. R. Soc. Lond. A 214, 158-183. Tennekes, H. and Lumley, J. L. (1972). A First Course in Turbulence.Cambridge, MA: MIT Press. Tytell, E. D. (2004). The hydrodynamics of eel swimming. Ⅱ. Effect ofswimming speed. J. Exp. Biol. 207, 3265-3279. Tytell, E. D. and Ellington, C. P. (2003). How to perform measurements ina hovering animal’s wake: physical modelling of the vortex wake of thehawkmoth Manduca sexta. Philos. Trans. R. Soc. Lond.B 358, 1559-1566. Tytell, E. D. and Lauder, G. V.(2004). The hydrodynamics of eel swimming.I. Wake structure. J. Exp. Biol.207, 1825-1841. Vollmers,H. (2001). Detection of vortices and quantitative evaluation of theirmain parameters from experimental velocity data. Meas. Sci. Technol. 12,1199-1207. von Ellenrieder, K. D., Parker, K. and Soria, J.(2003). Flow structuresbehind a heaving and pitching finite-span wing. J. Fluid Mech. 490, 129-138. Walker, J. A. (1998). Estimating velocities and accelerations of animallocomotion: A simulation experiment comparing numerical differentiationalgorithms. J. Exp. Biol.201,981-995. Warrick, D. R., Tobalske, B. W. and Powers, D. R. (2005). Aerodynamicsof the hovering hummingbird. Nature 435, 1094-1097. Webb, P. W. (1975). Hydrodynamics and energetics of fish propulsion. Bull.Fish. Res. Board Can. 190, 1-159. Weihs,D. (1972). A hydrodynamical analysis of fish turning manoevers. Proc.R. Soc. Lond. B 182, 59-72. Wieneke, B. (2005). Stereo-PIV using self-calibration on particle images. Exp.Fluids 39, 267-280. Wilga, C. D. and Lauder, G. V. (2004). Hydrodynamic function of theshark’s tail. Nature 430, 850. Willert, C. E. (1997). Stereoscopic digital particle image velocimetry forapplication in wind tunnel flows. Meas. Sci. Technol. 8,1465-1479. Willert, C. E. and Gharib, M. (1991). Digital particle image velocimetry.Exp. Fluids 10, 181-193. Wolfgang,M. J., Anderson, J. M., Grosenbaugh, M. A., Yue, D. K. P. andTriantafyllou, M. S. (1999). Near-body flow dynamics in swimming fish.J. Exp.Biol. 202,2303-2327. Wu, T. Y. (1971). Hydromechanics of swimming propulsion. Part 1.Swimming of a two-dimensional flexible plate at variable forward speedsin an inviscid fluid. J.Fluid Mech. 46.337-355. Zhu, Q., Wolfgang, M. J., Yue, D. K. P. and Triantafyllou, M. S. (2002).Three-dimensional flow structuresS2and vorticity control in fish-likeswimming. J. Fluid Mech. 468,1-28. THE JOURNAL OF EXPERIMENTAL BIOLOGY
确定
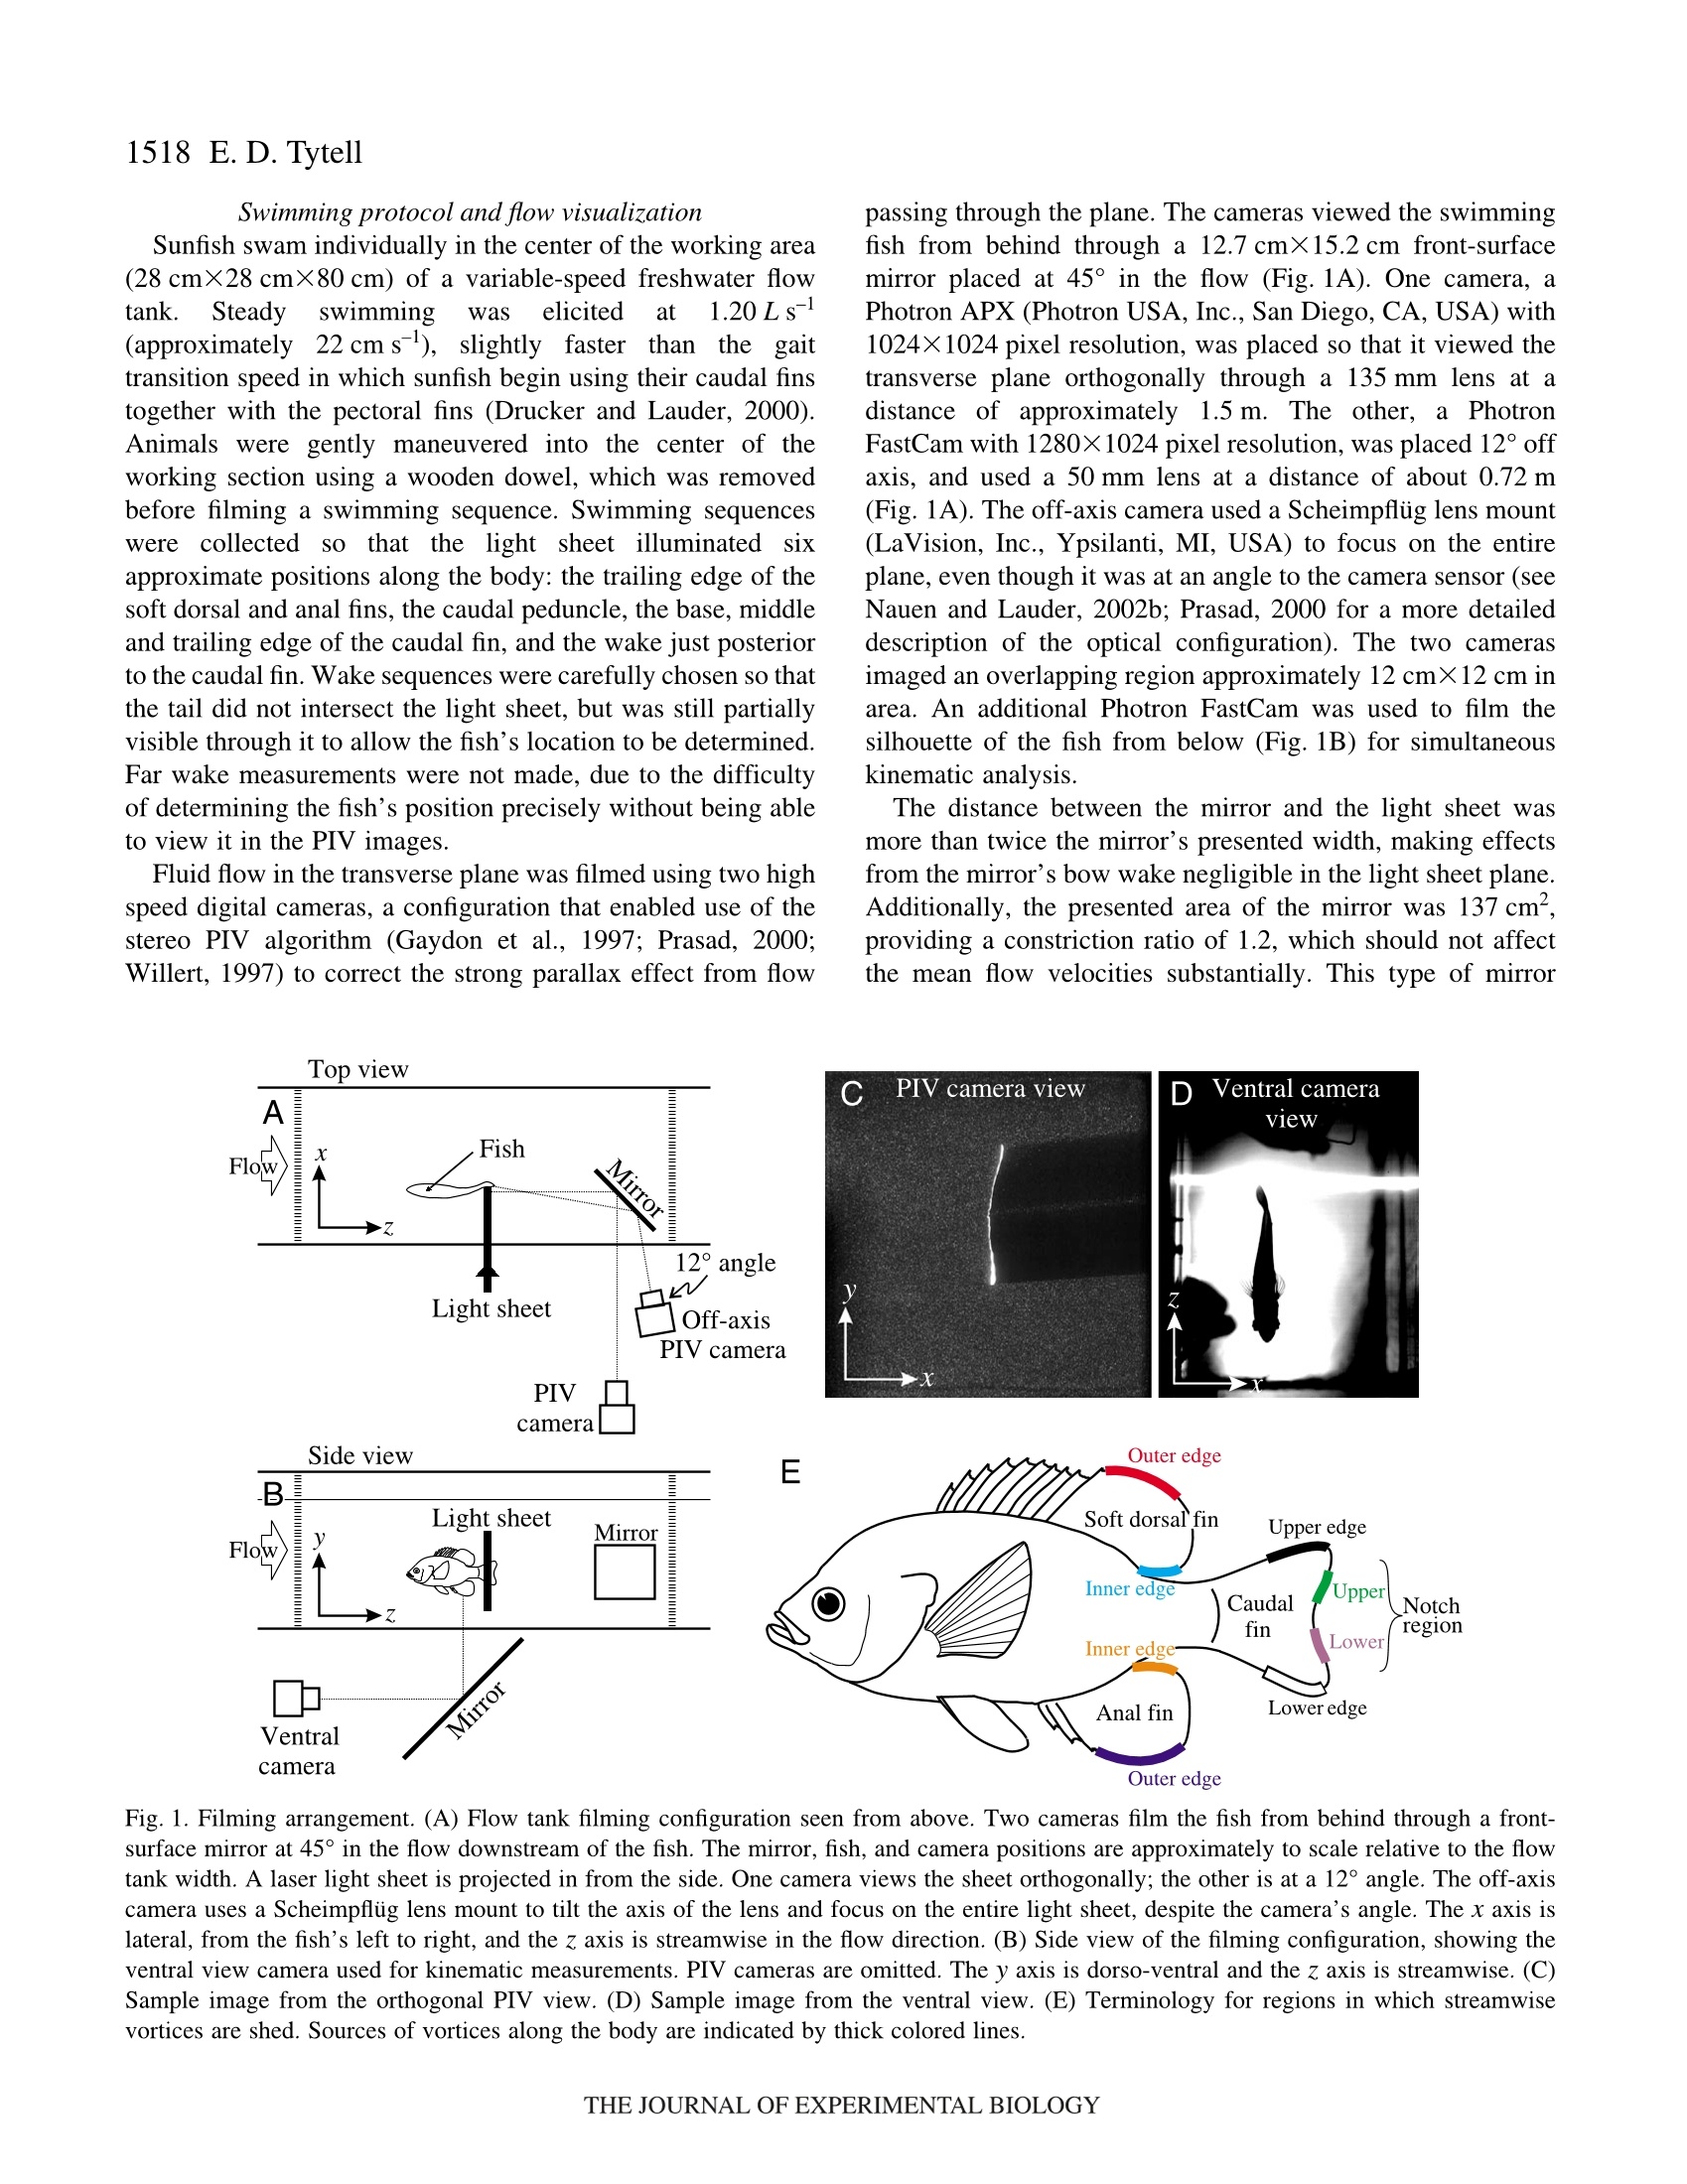
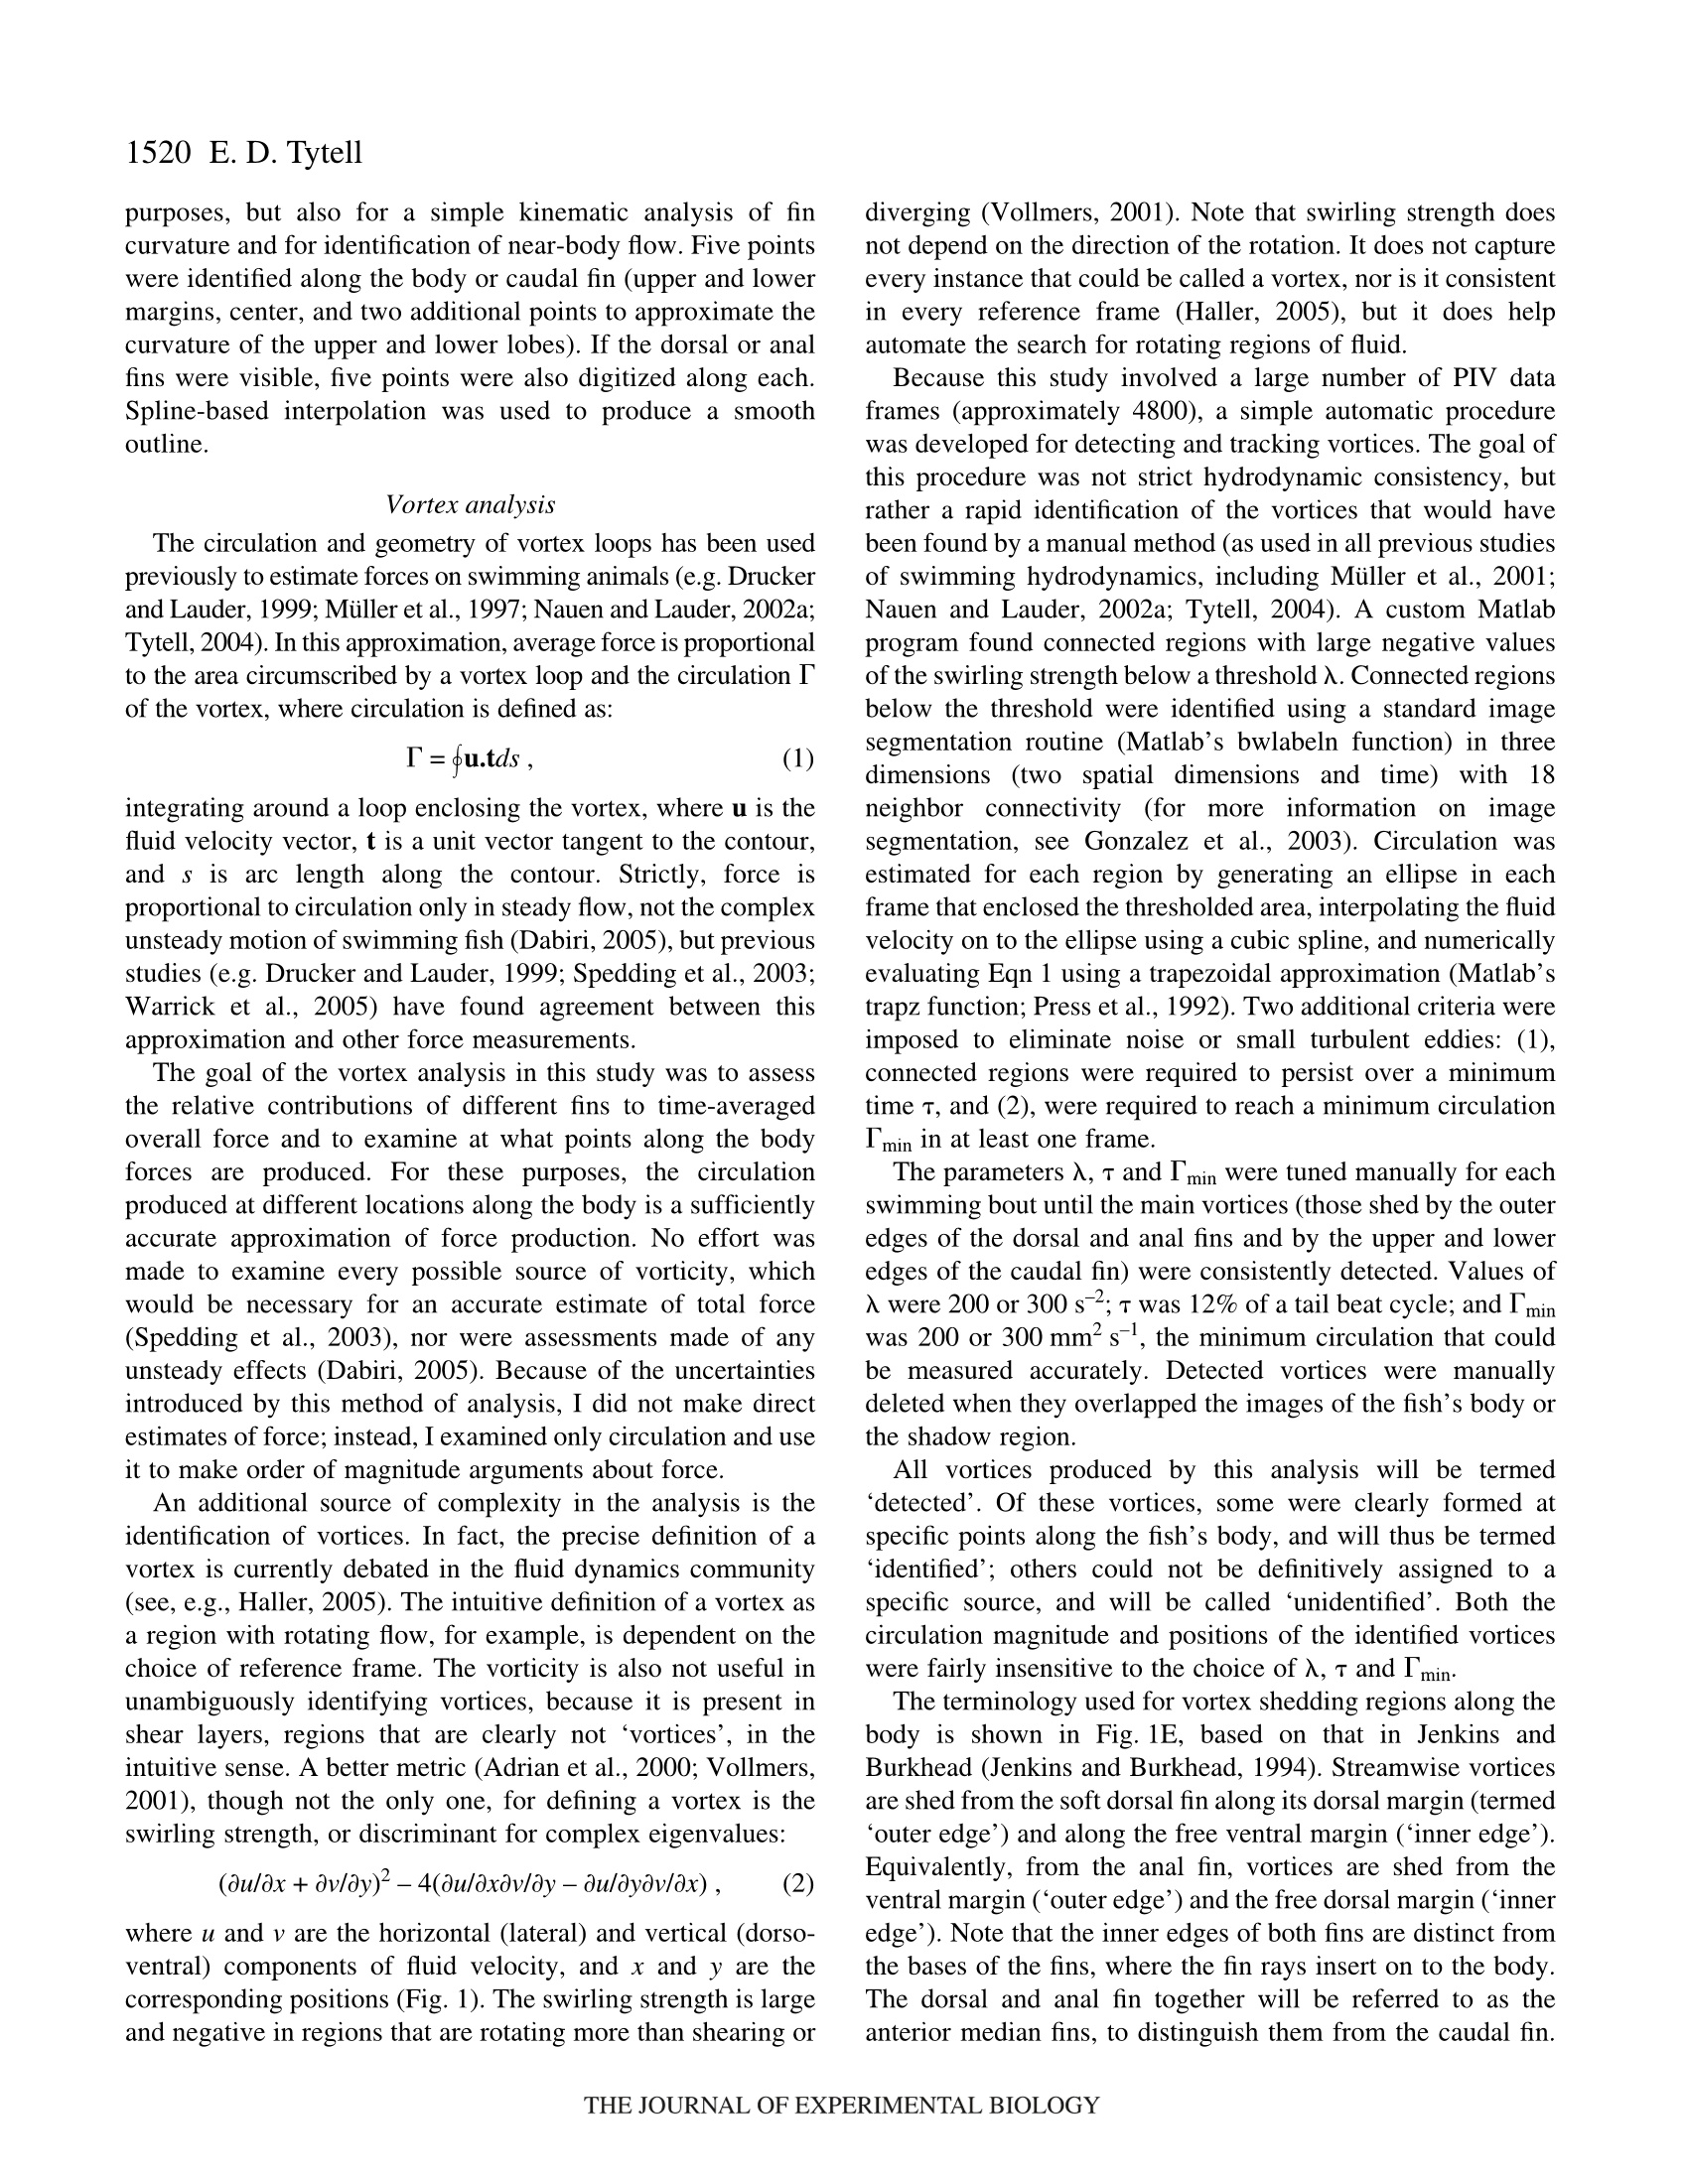
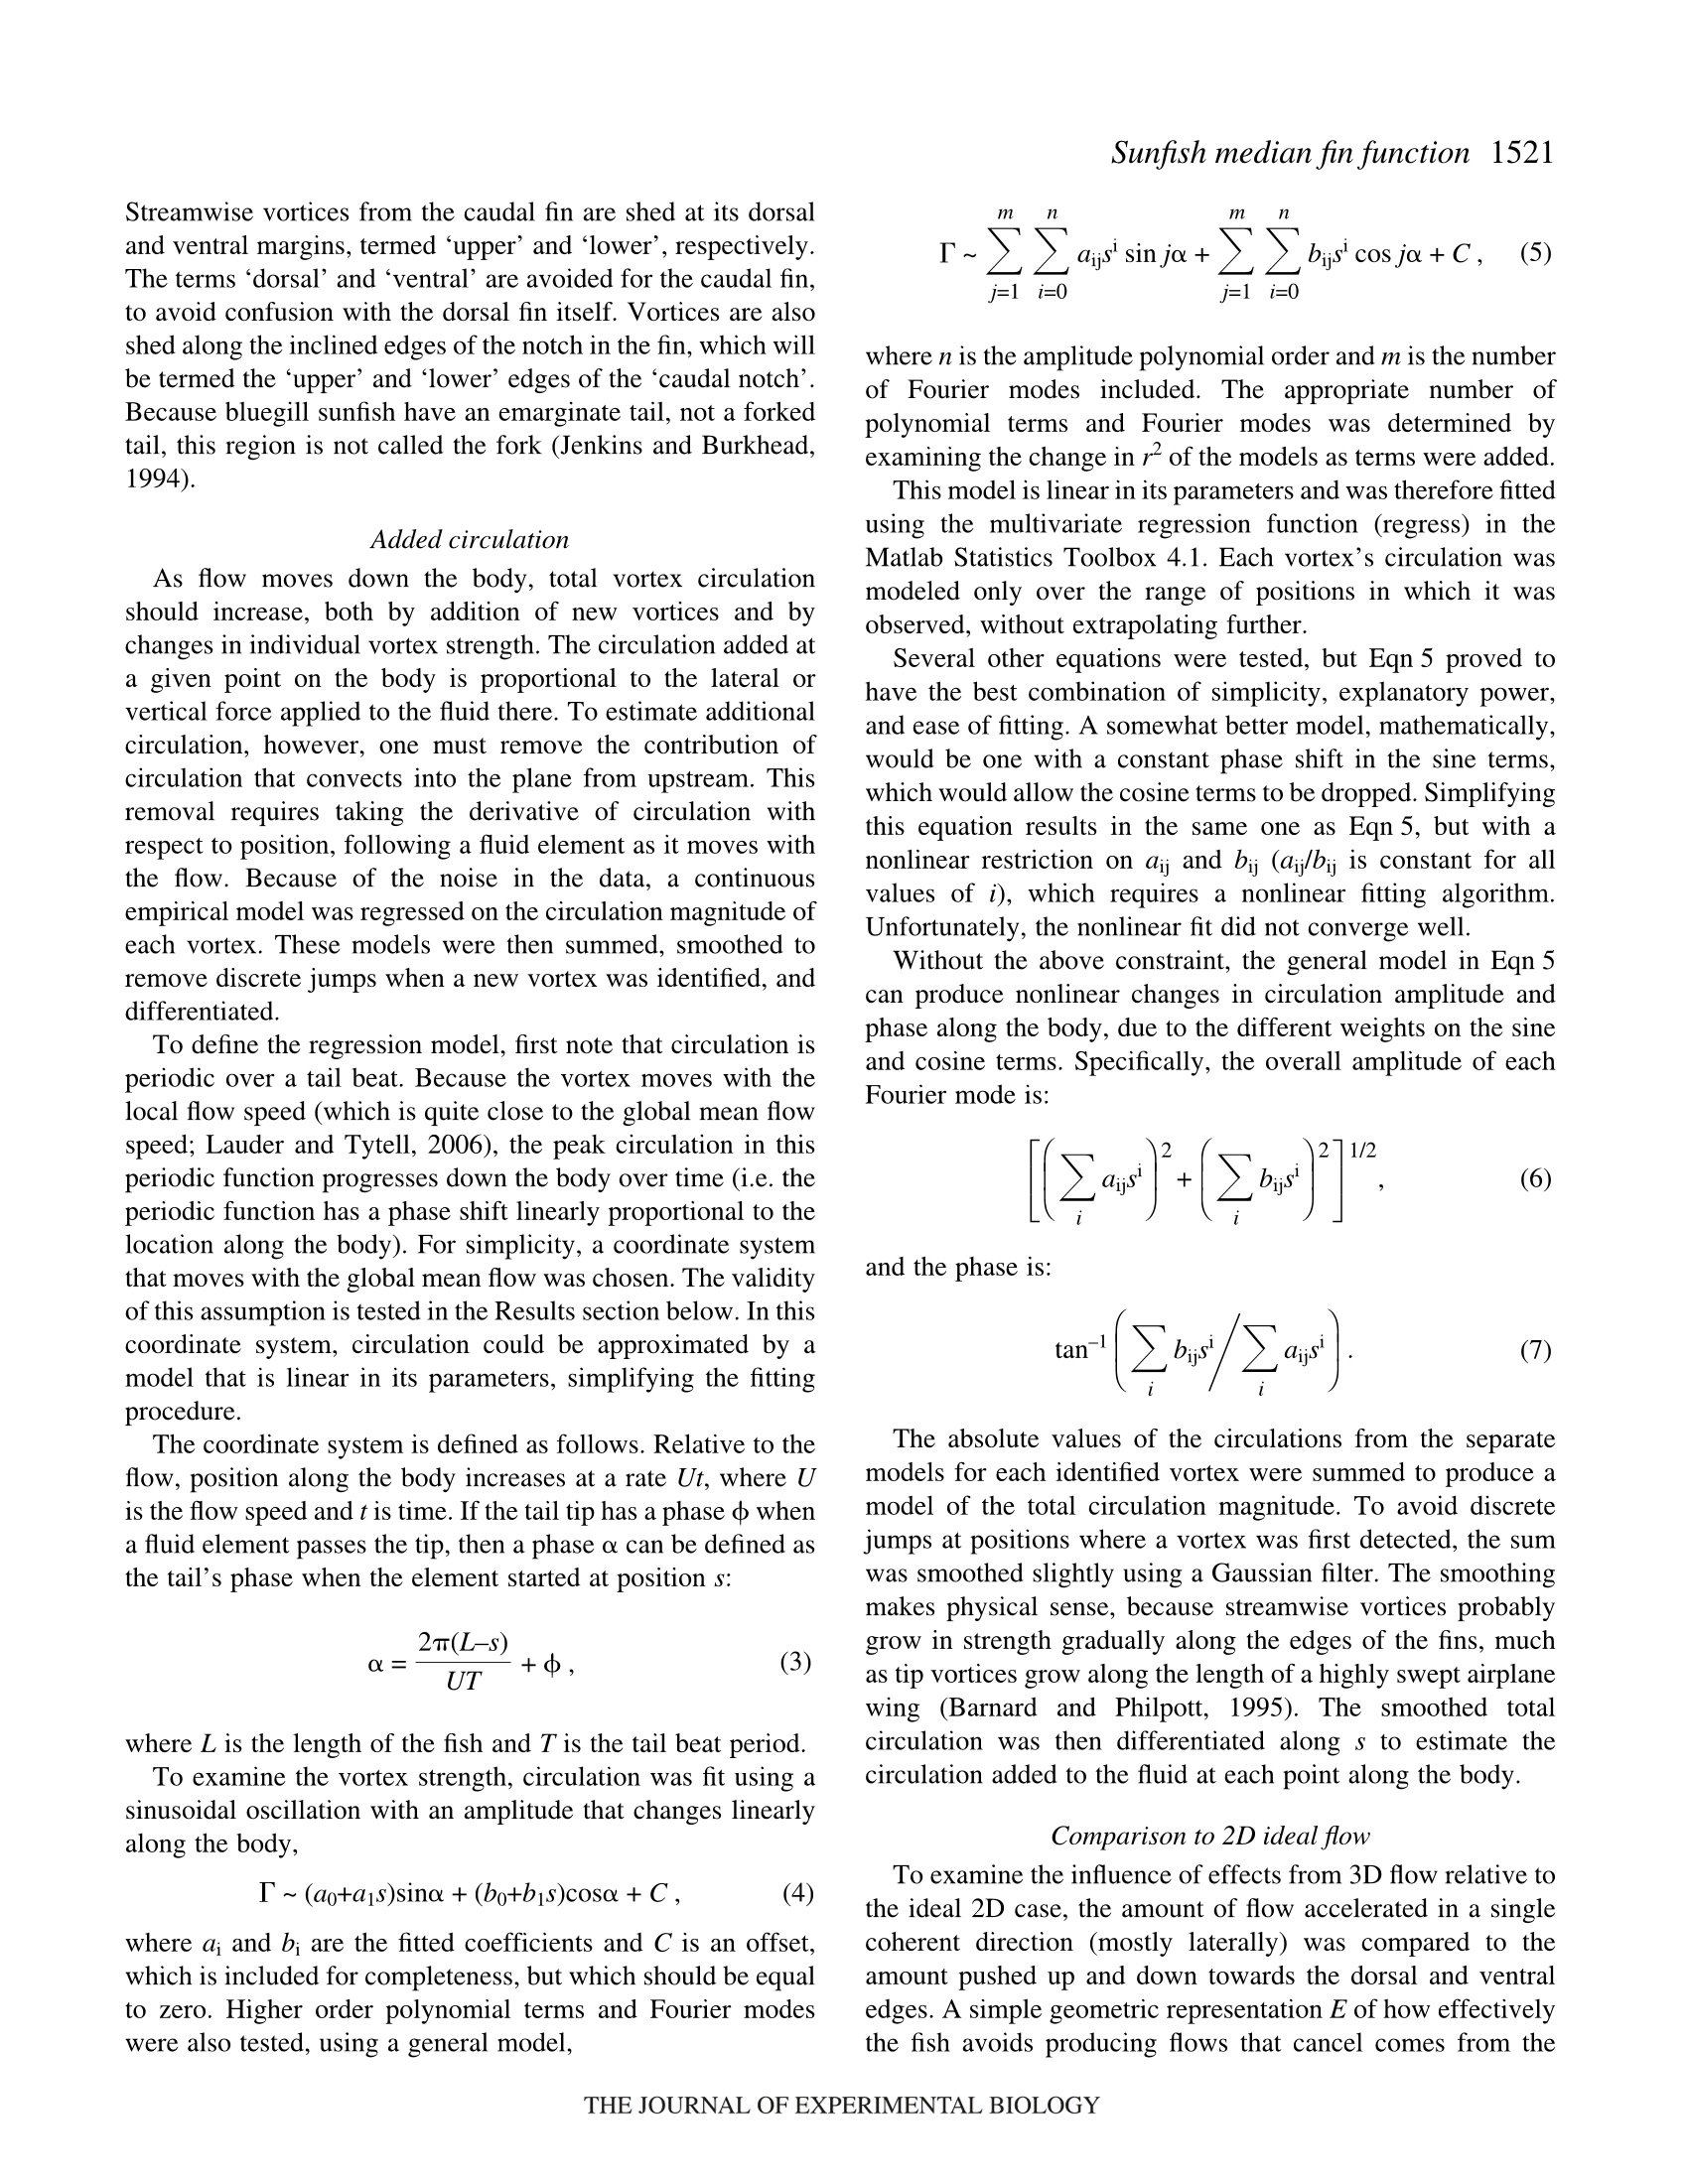
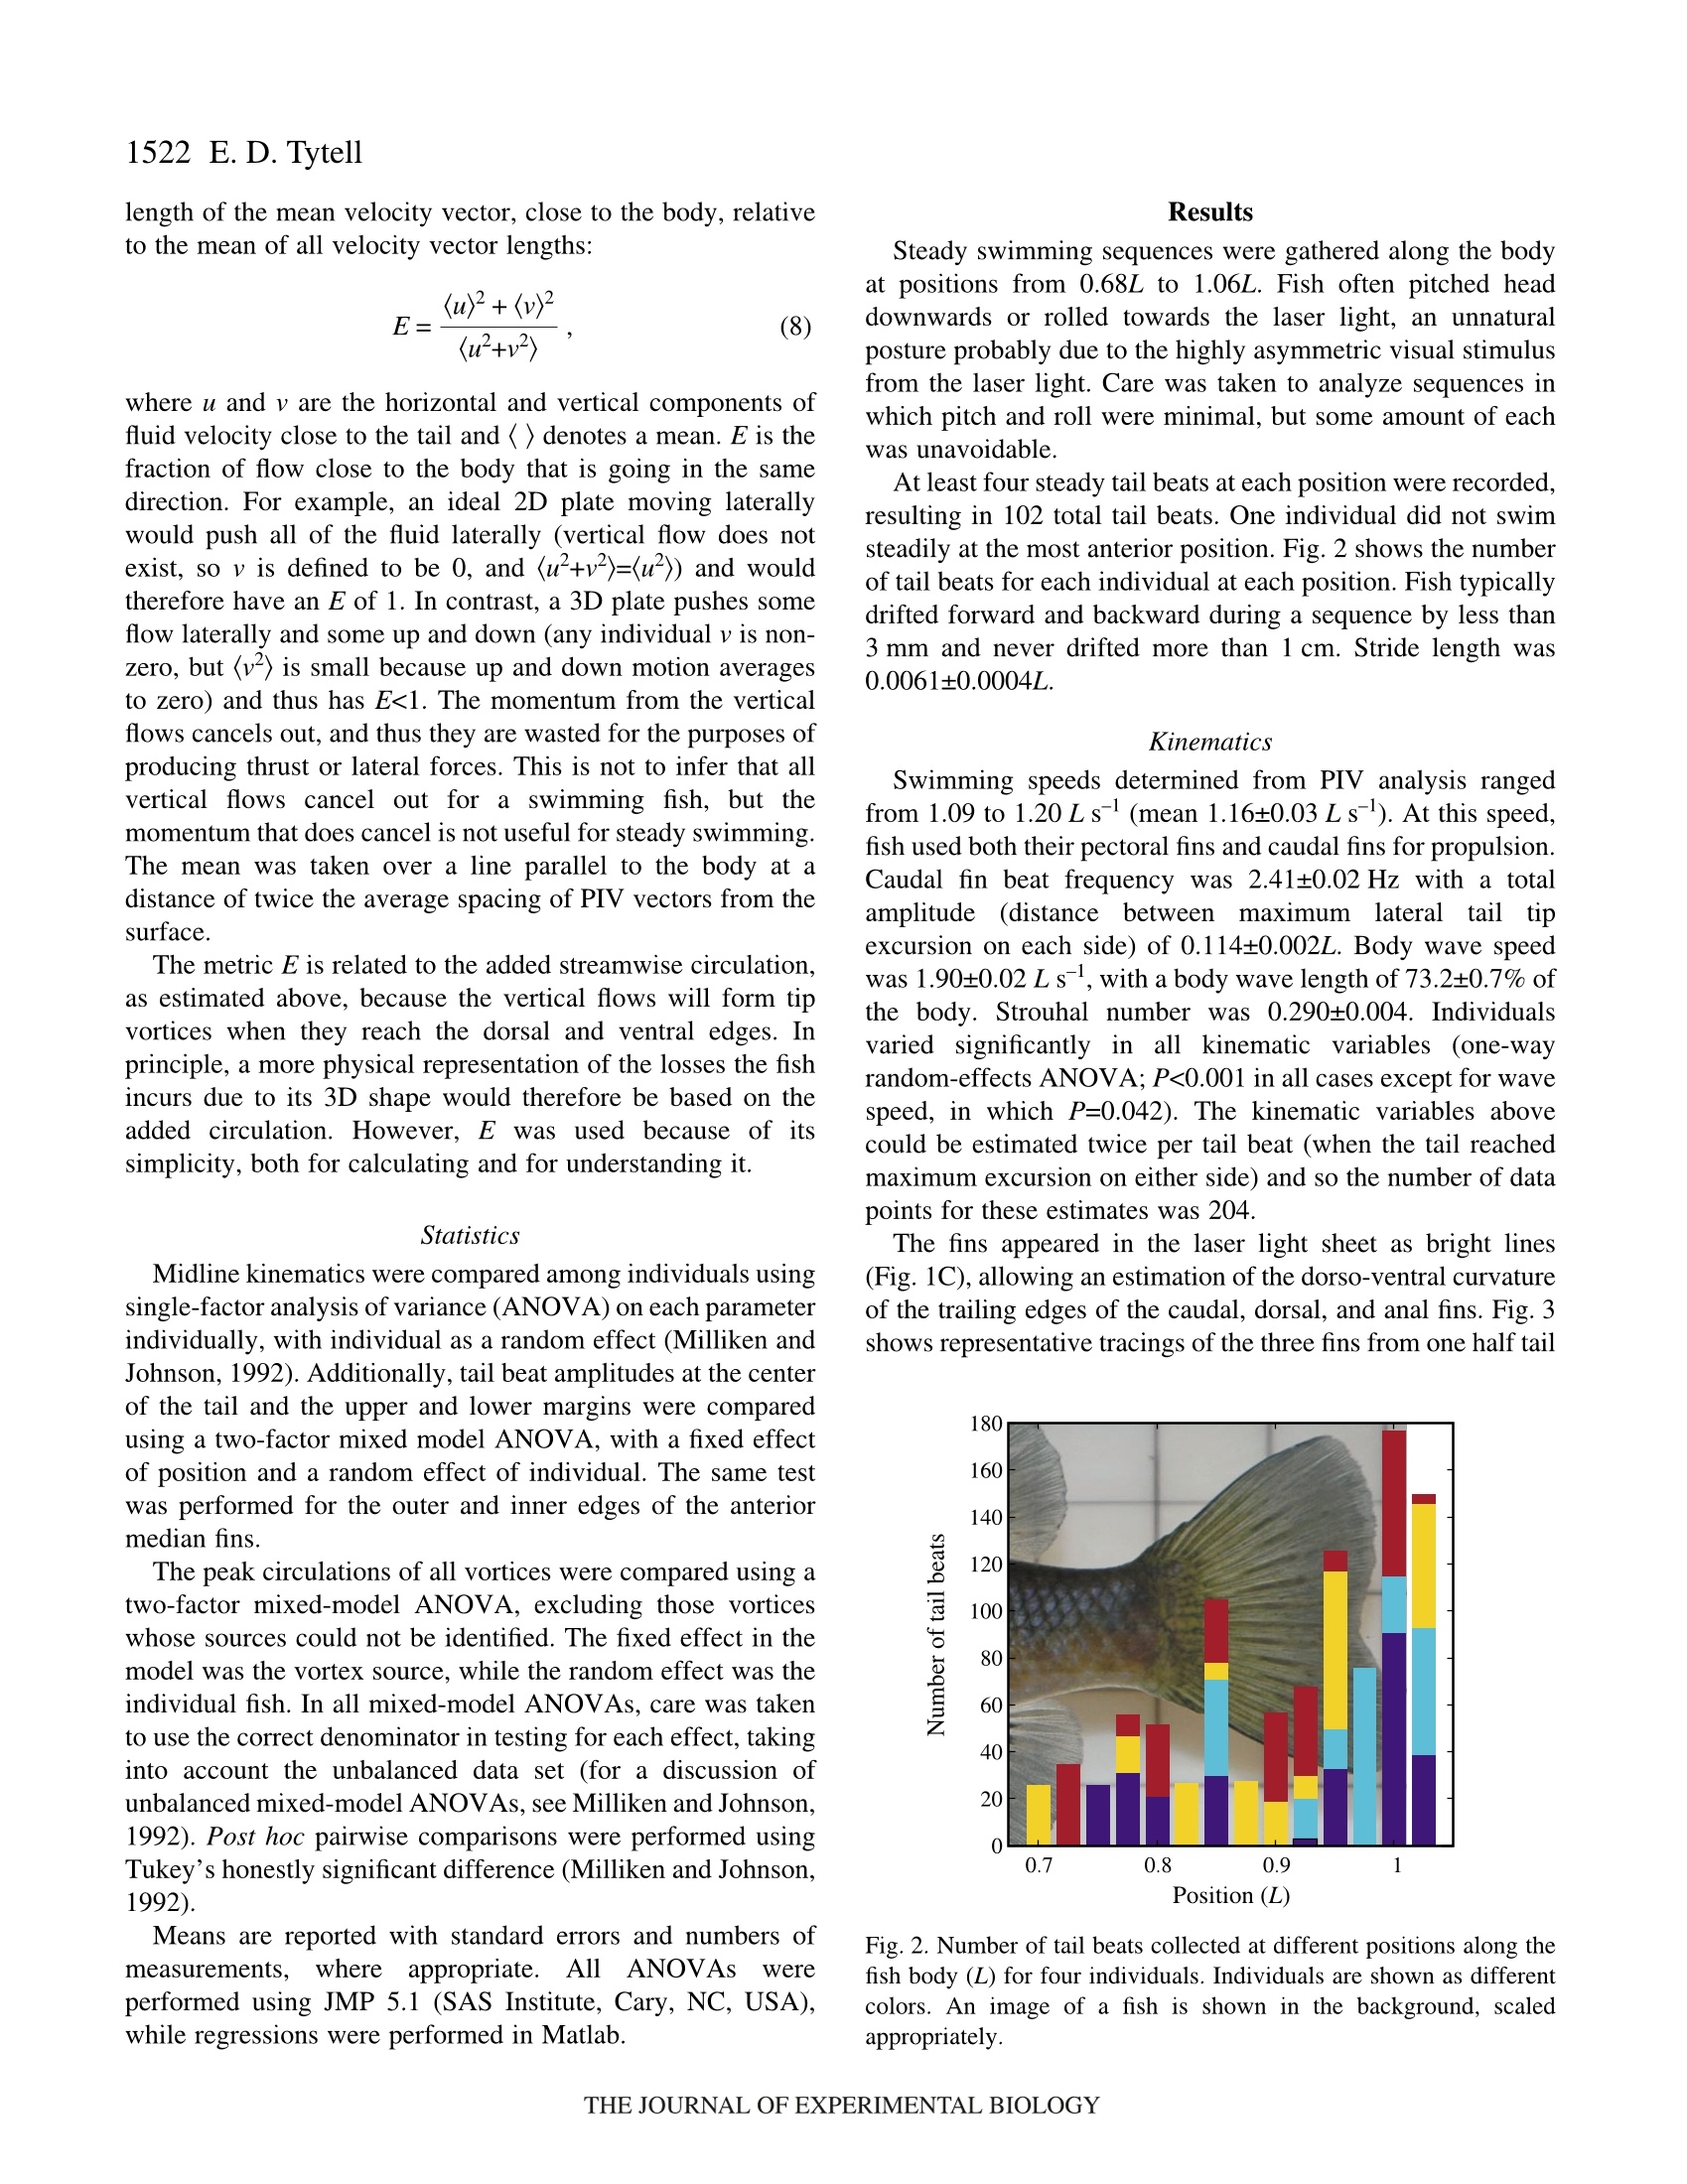
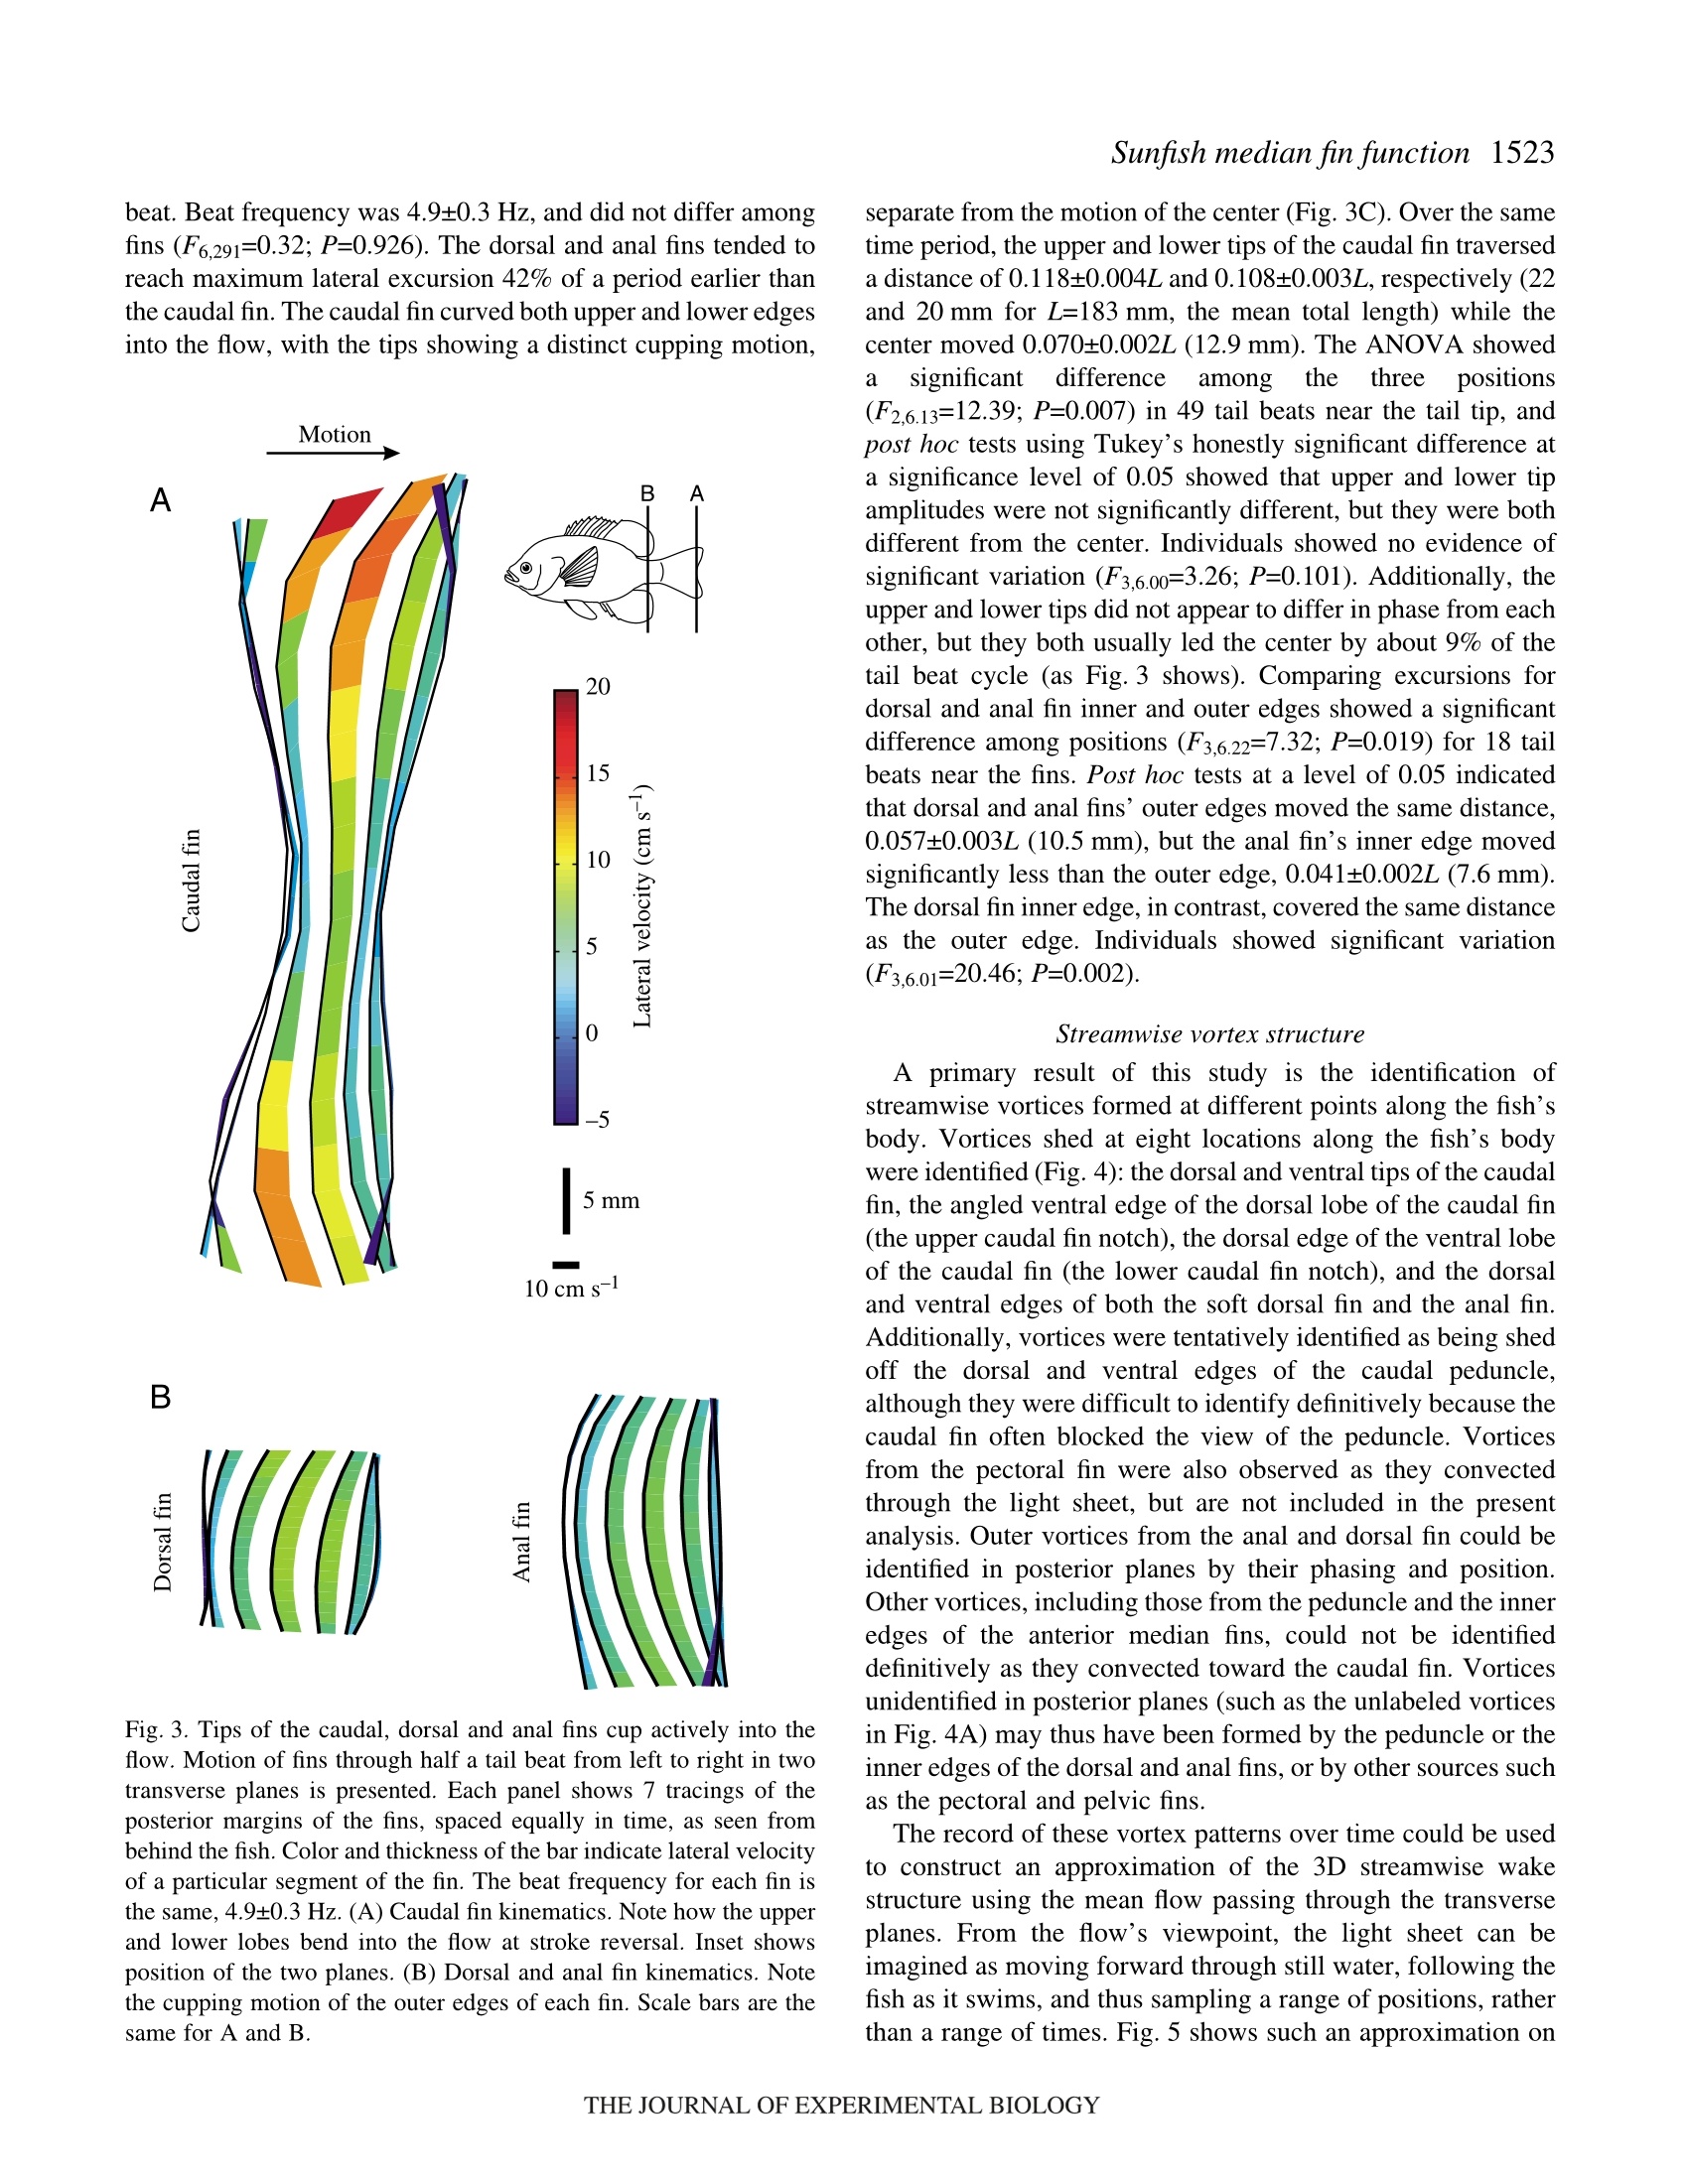
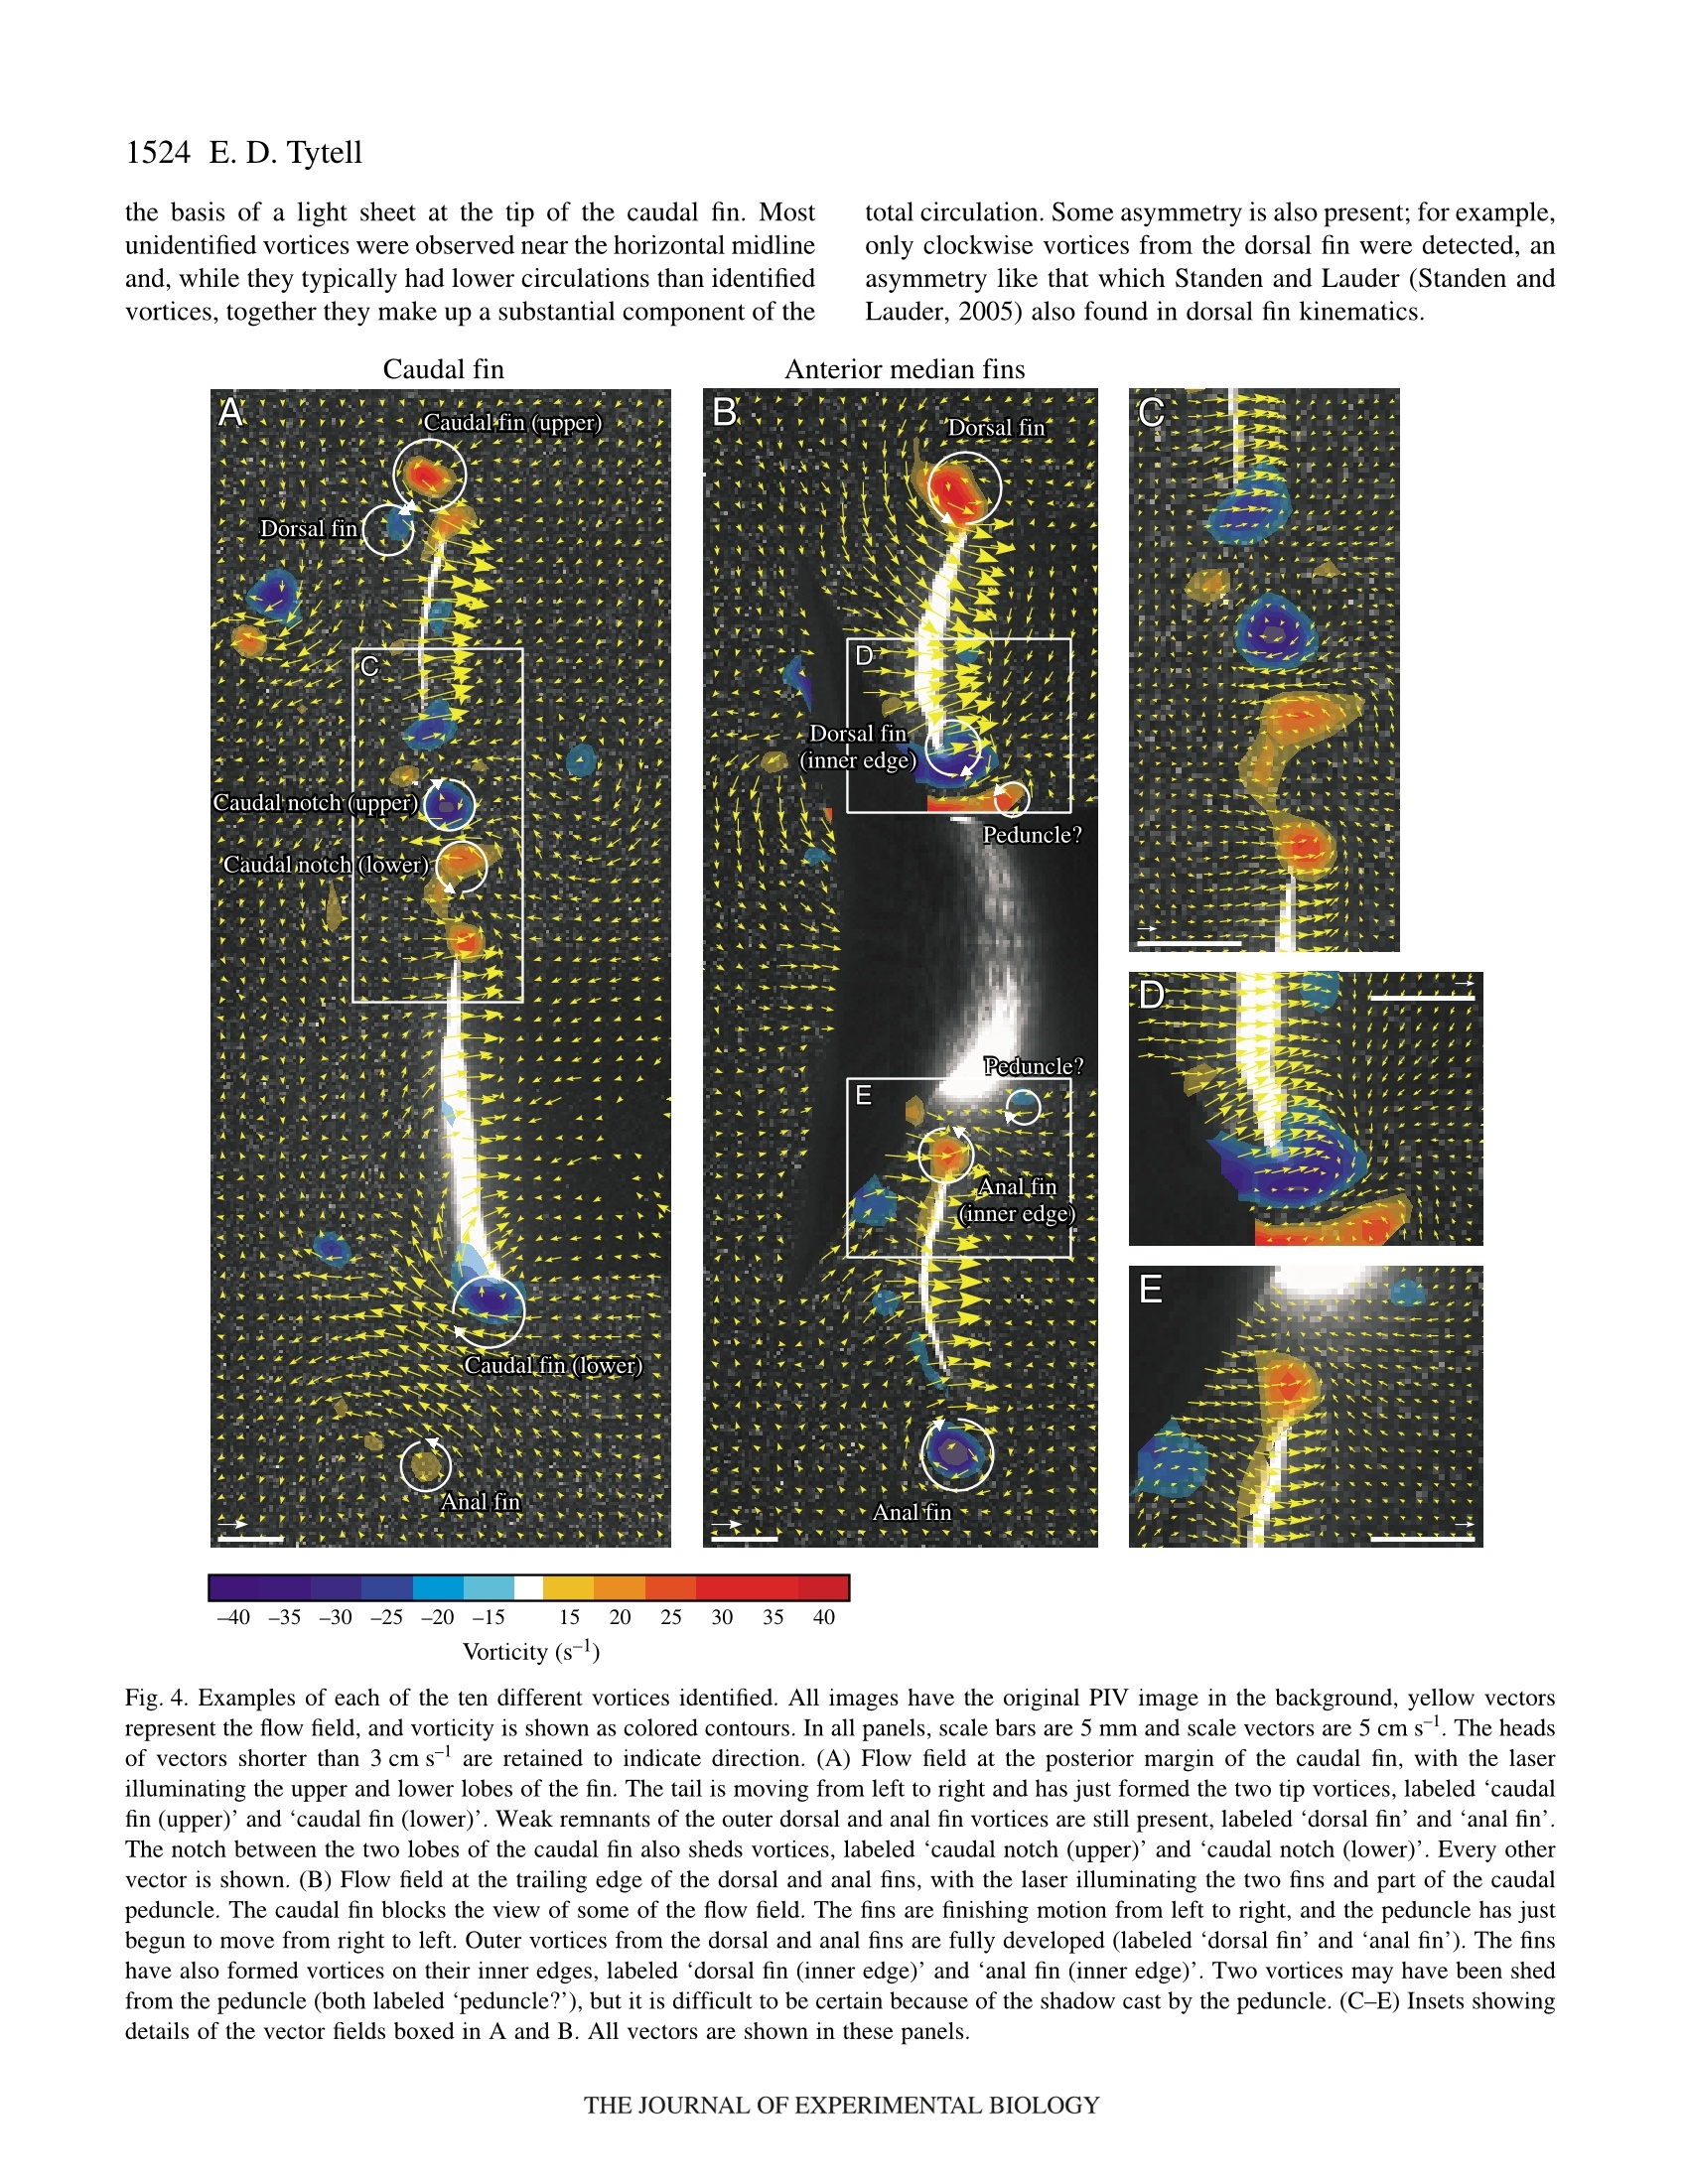
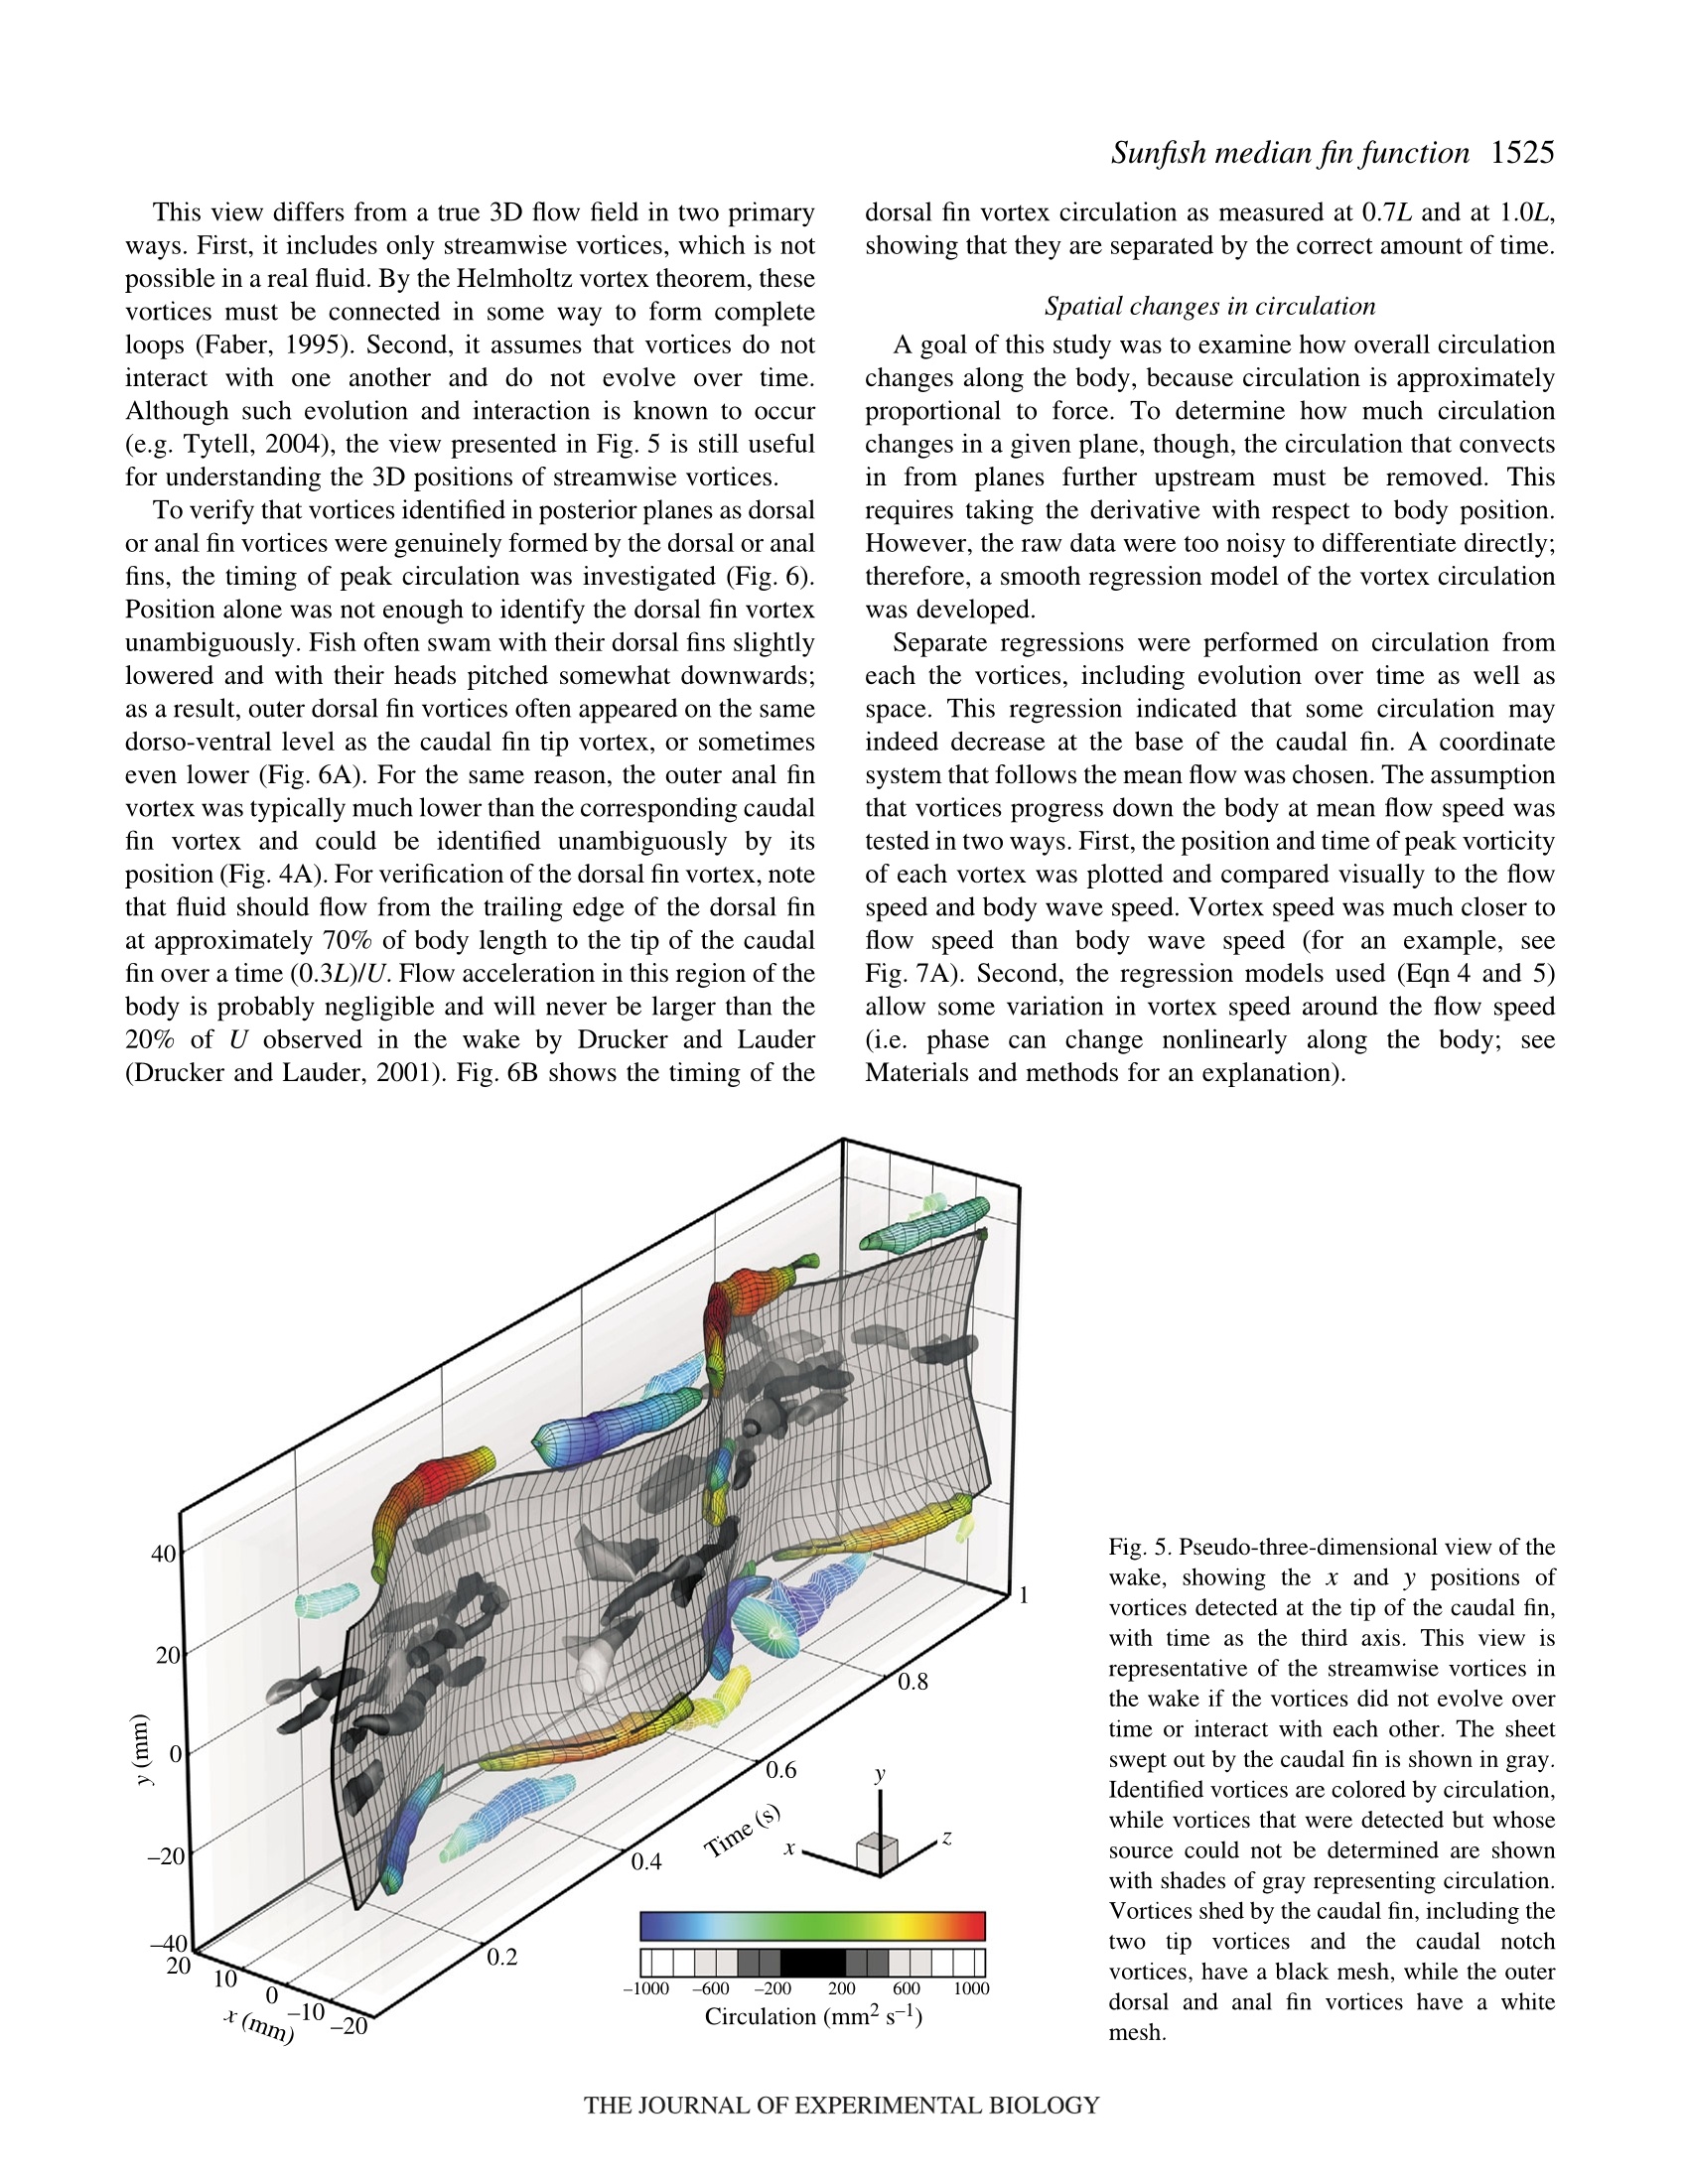
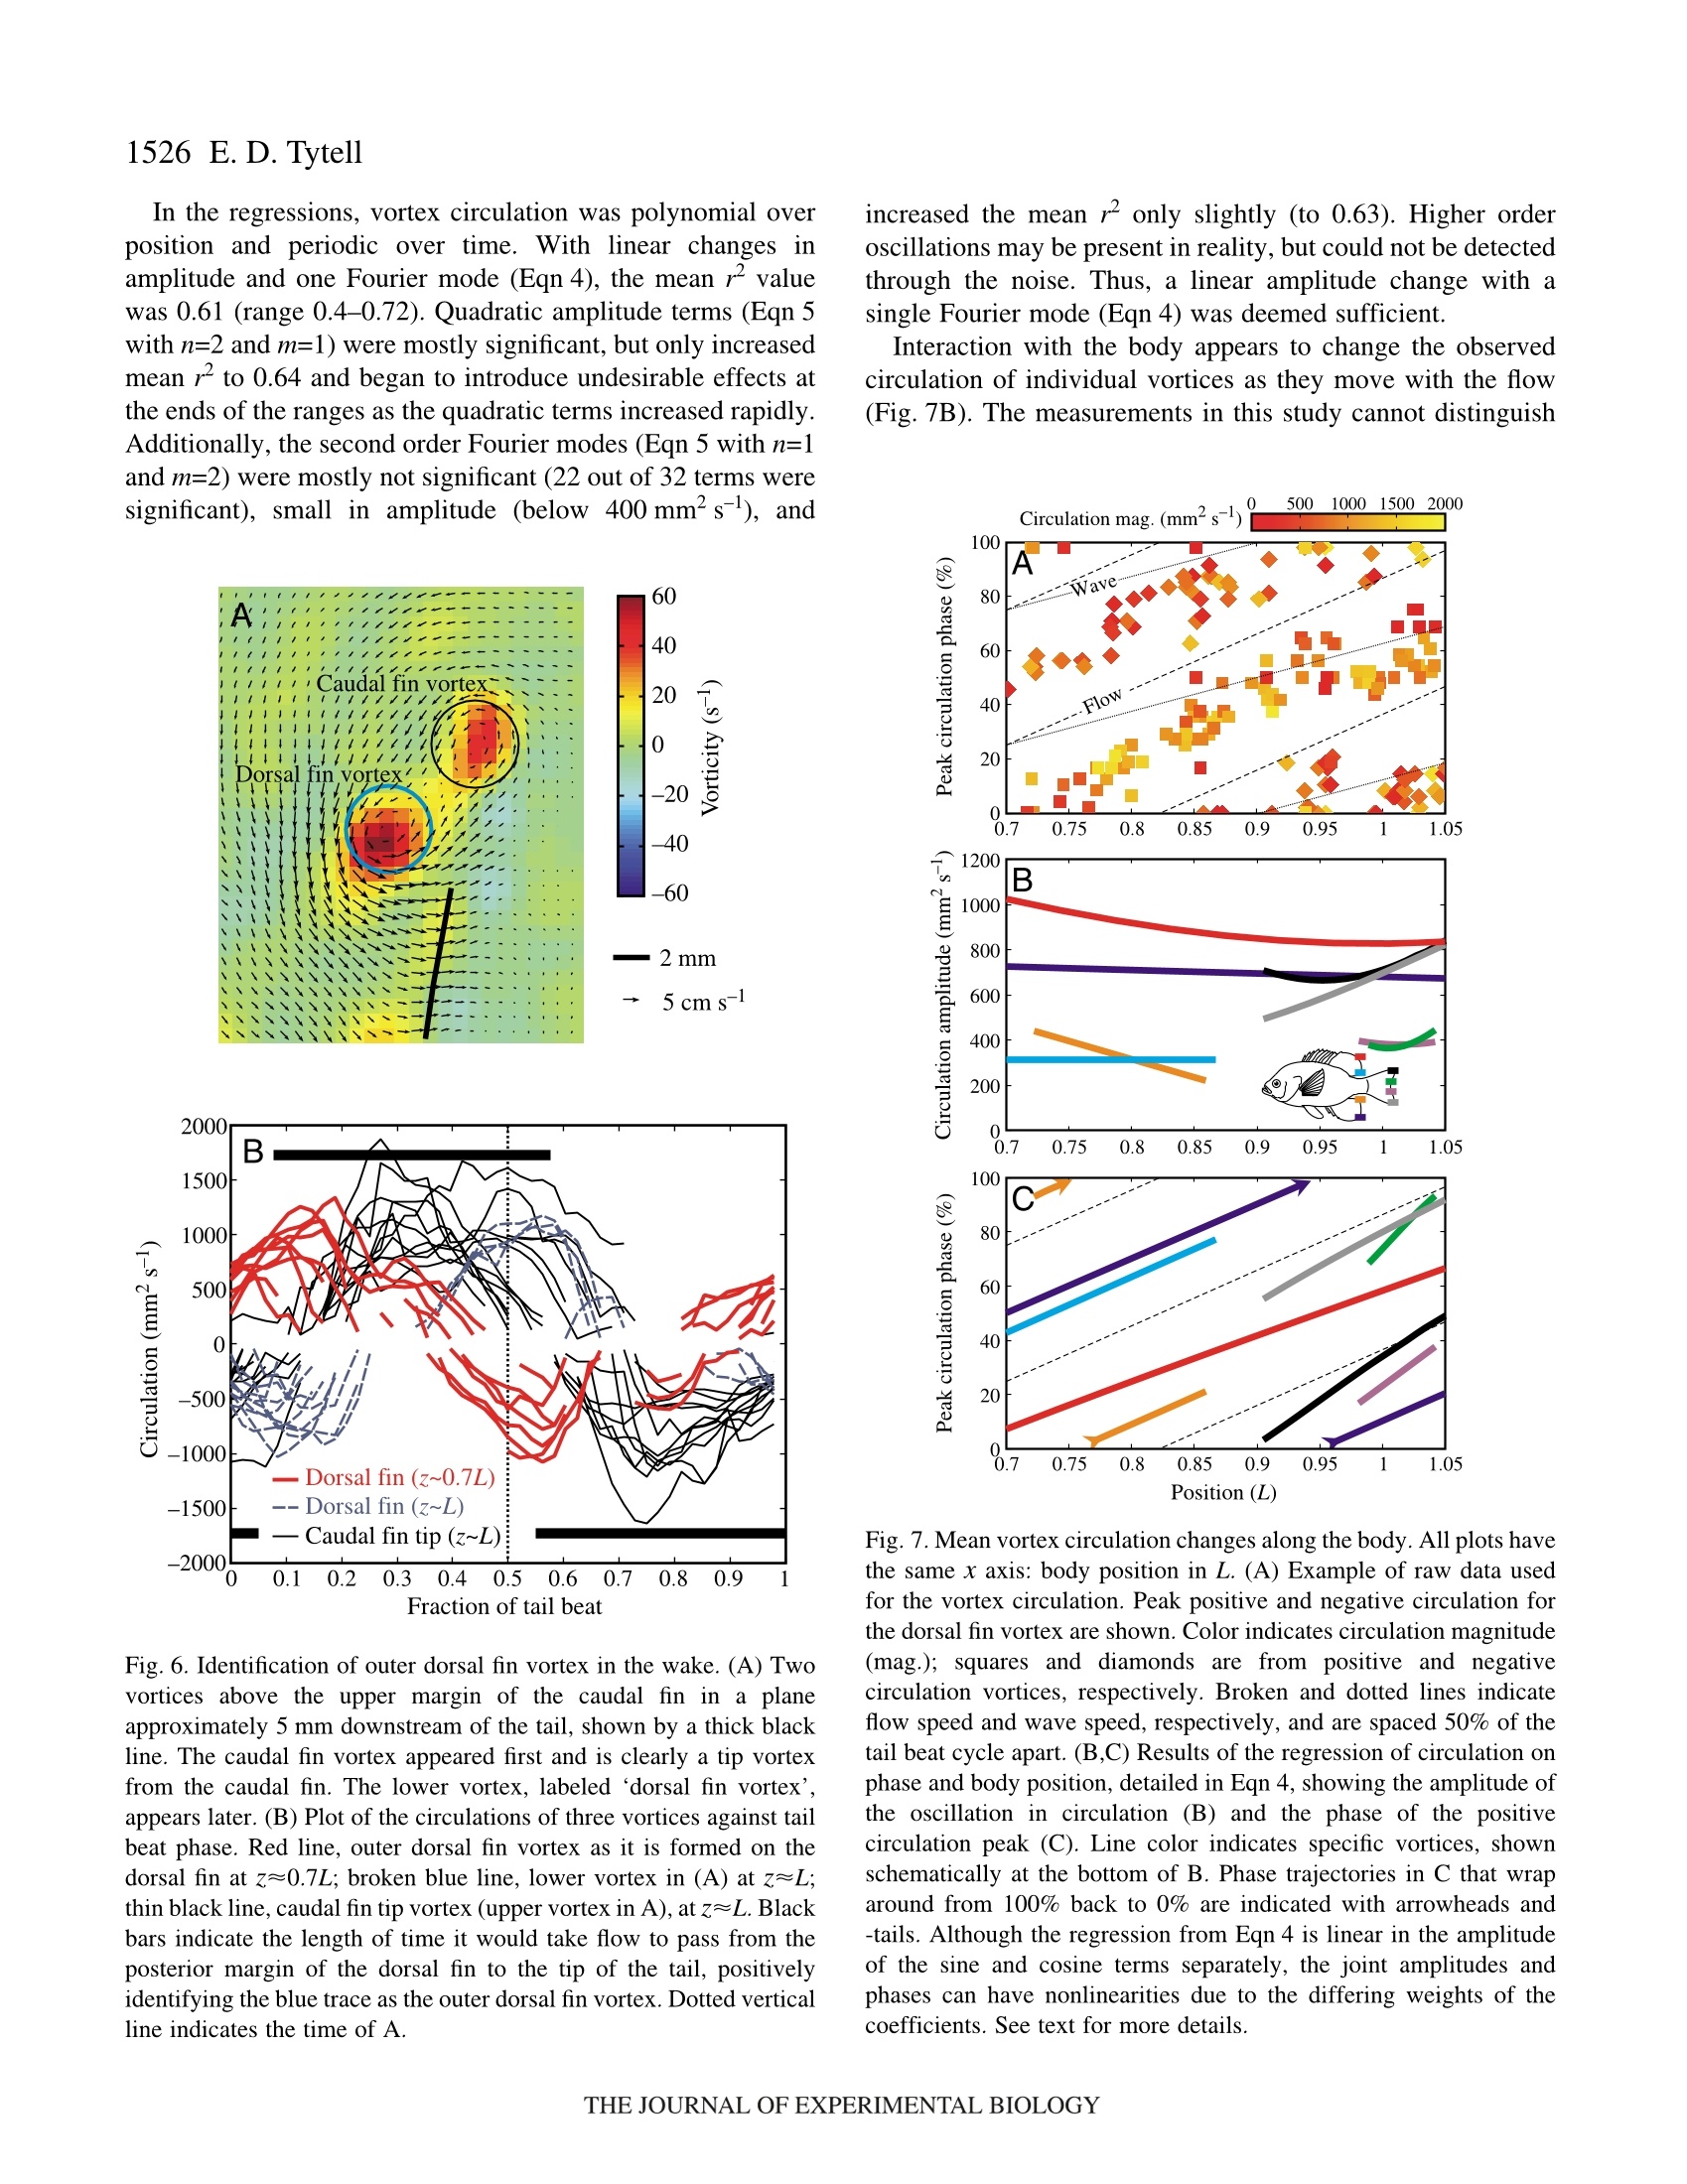
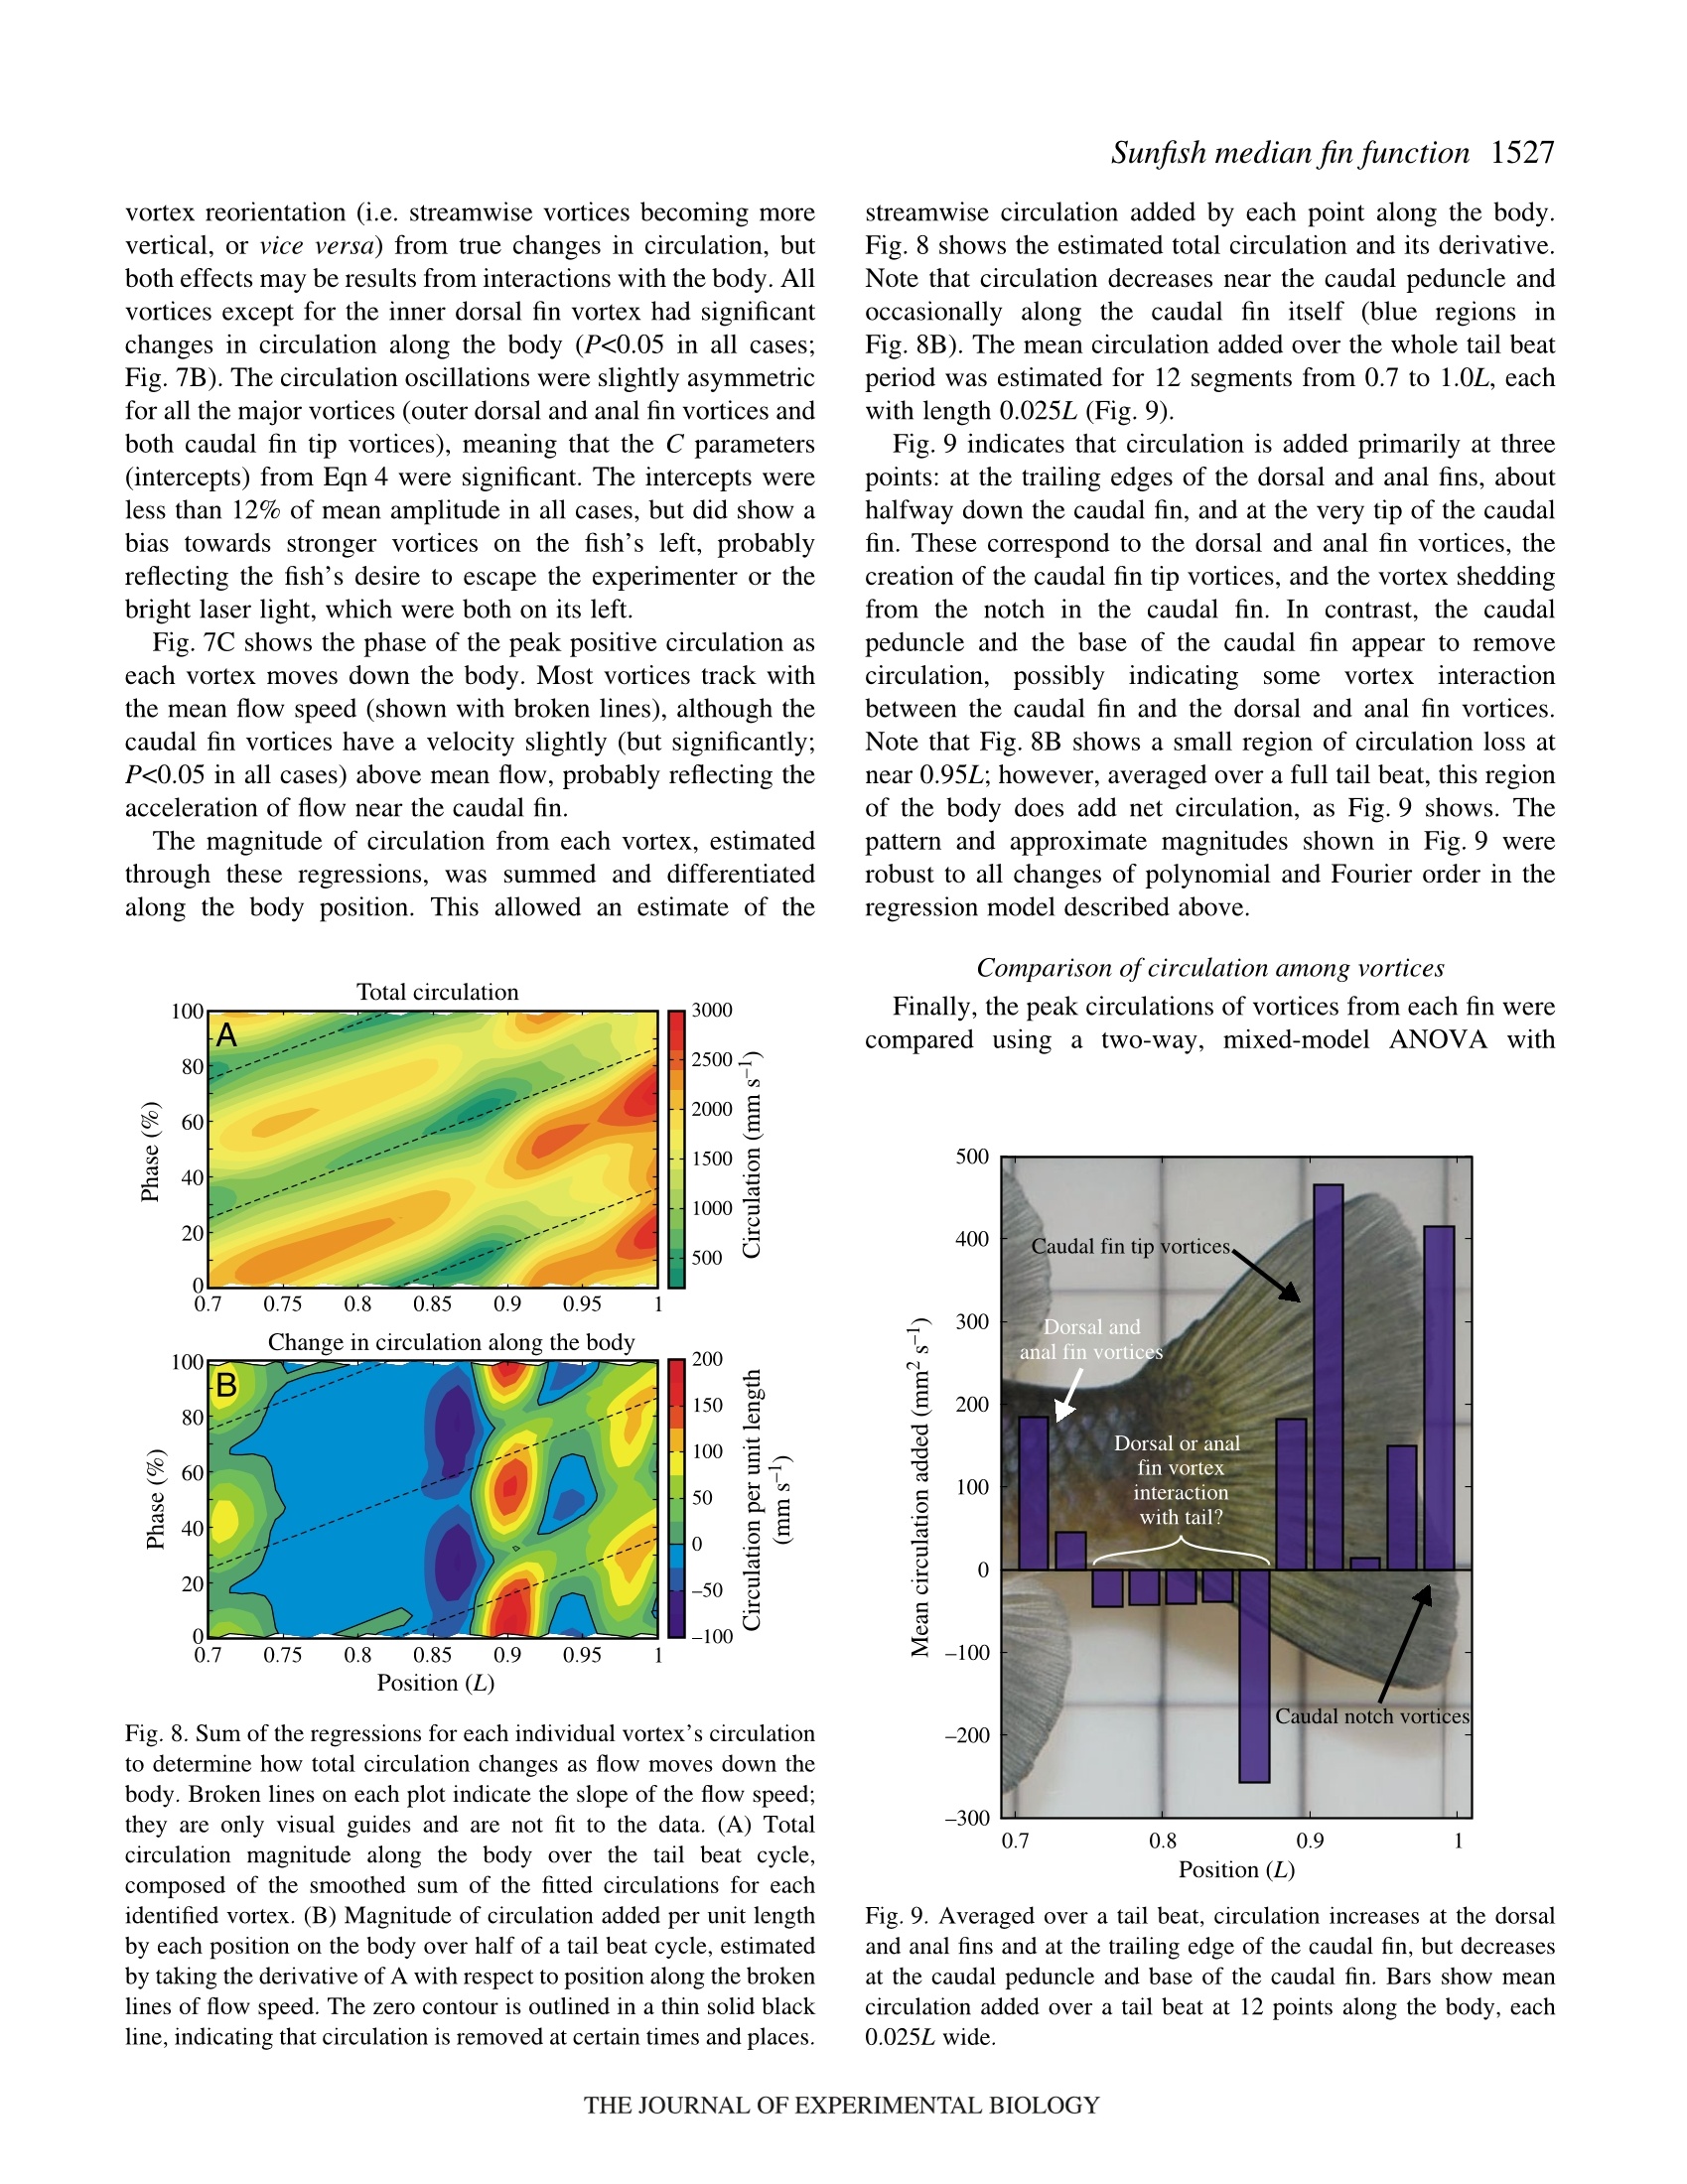
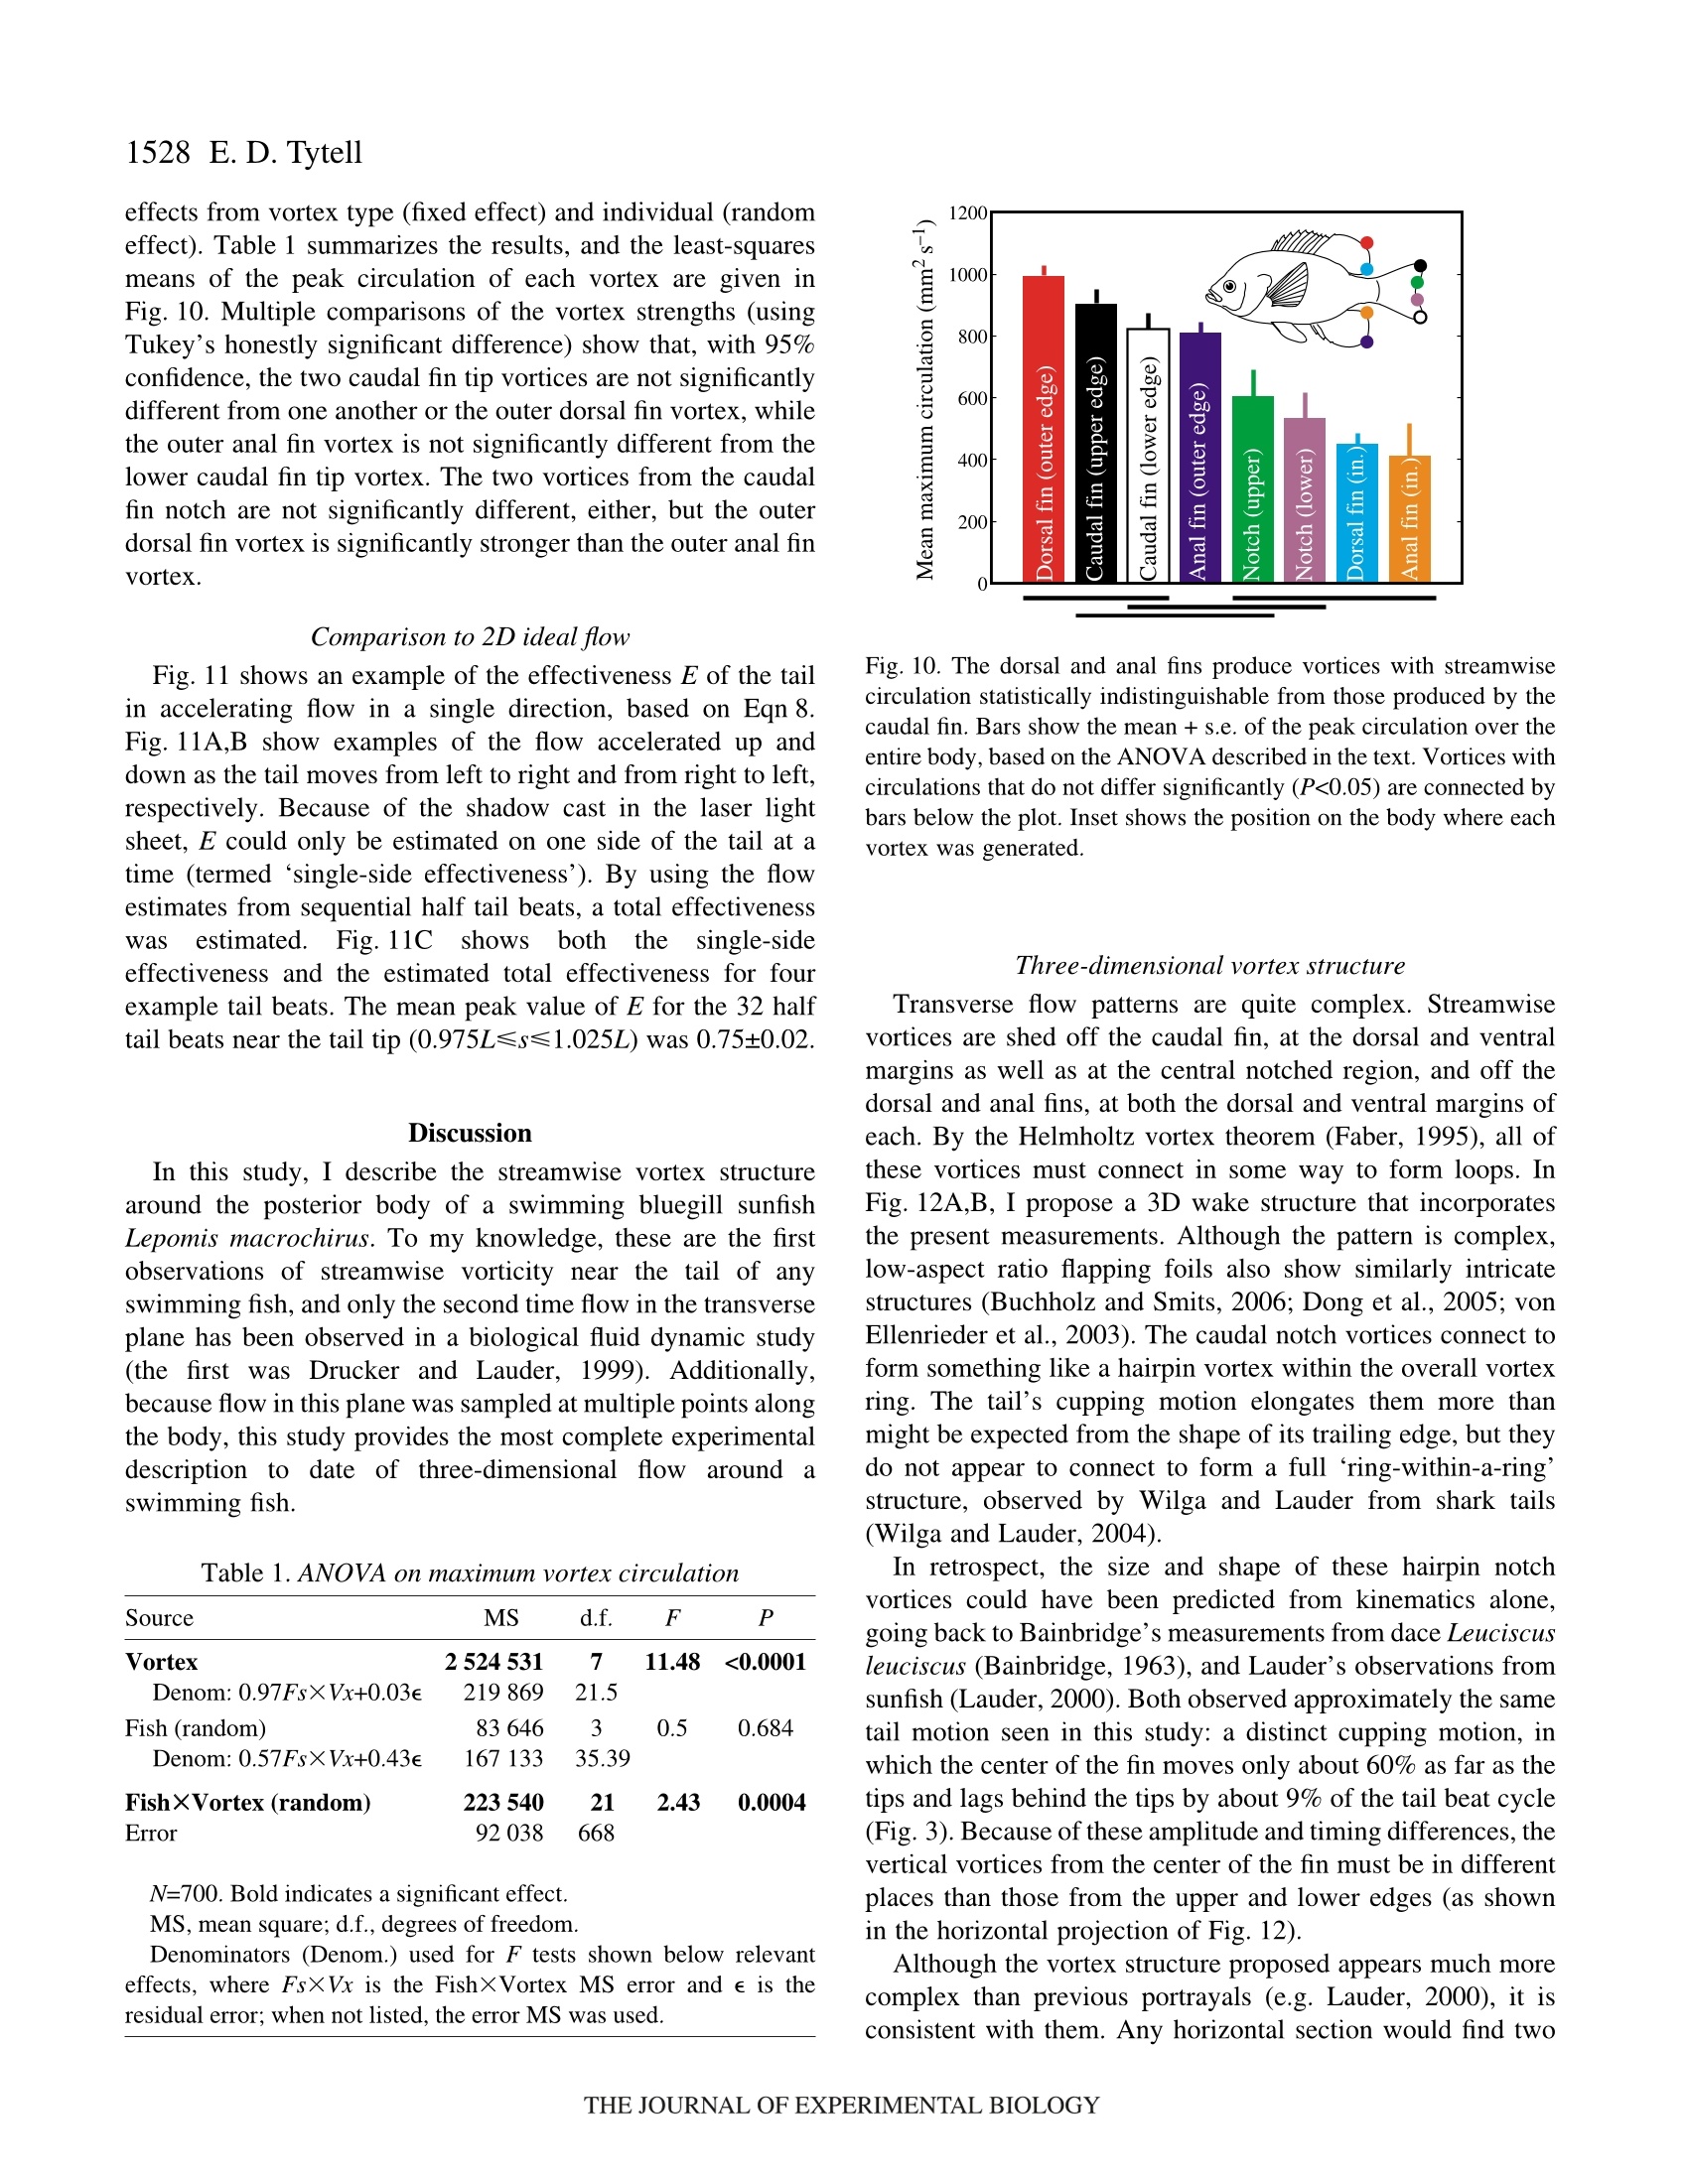
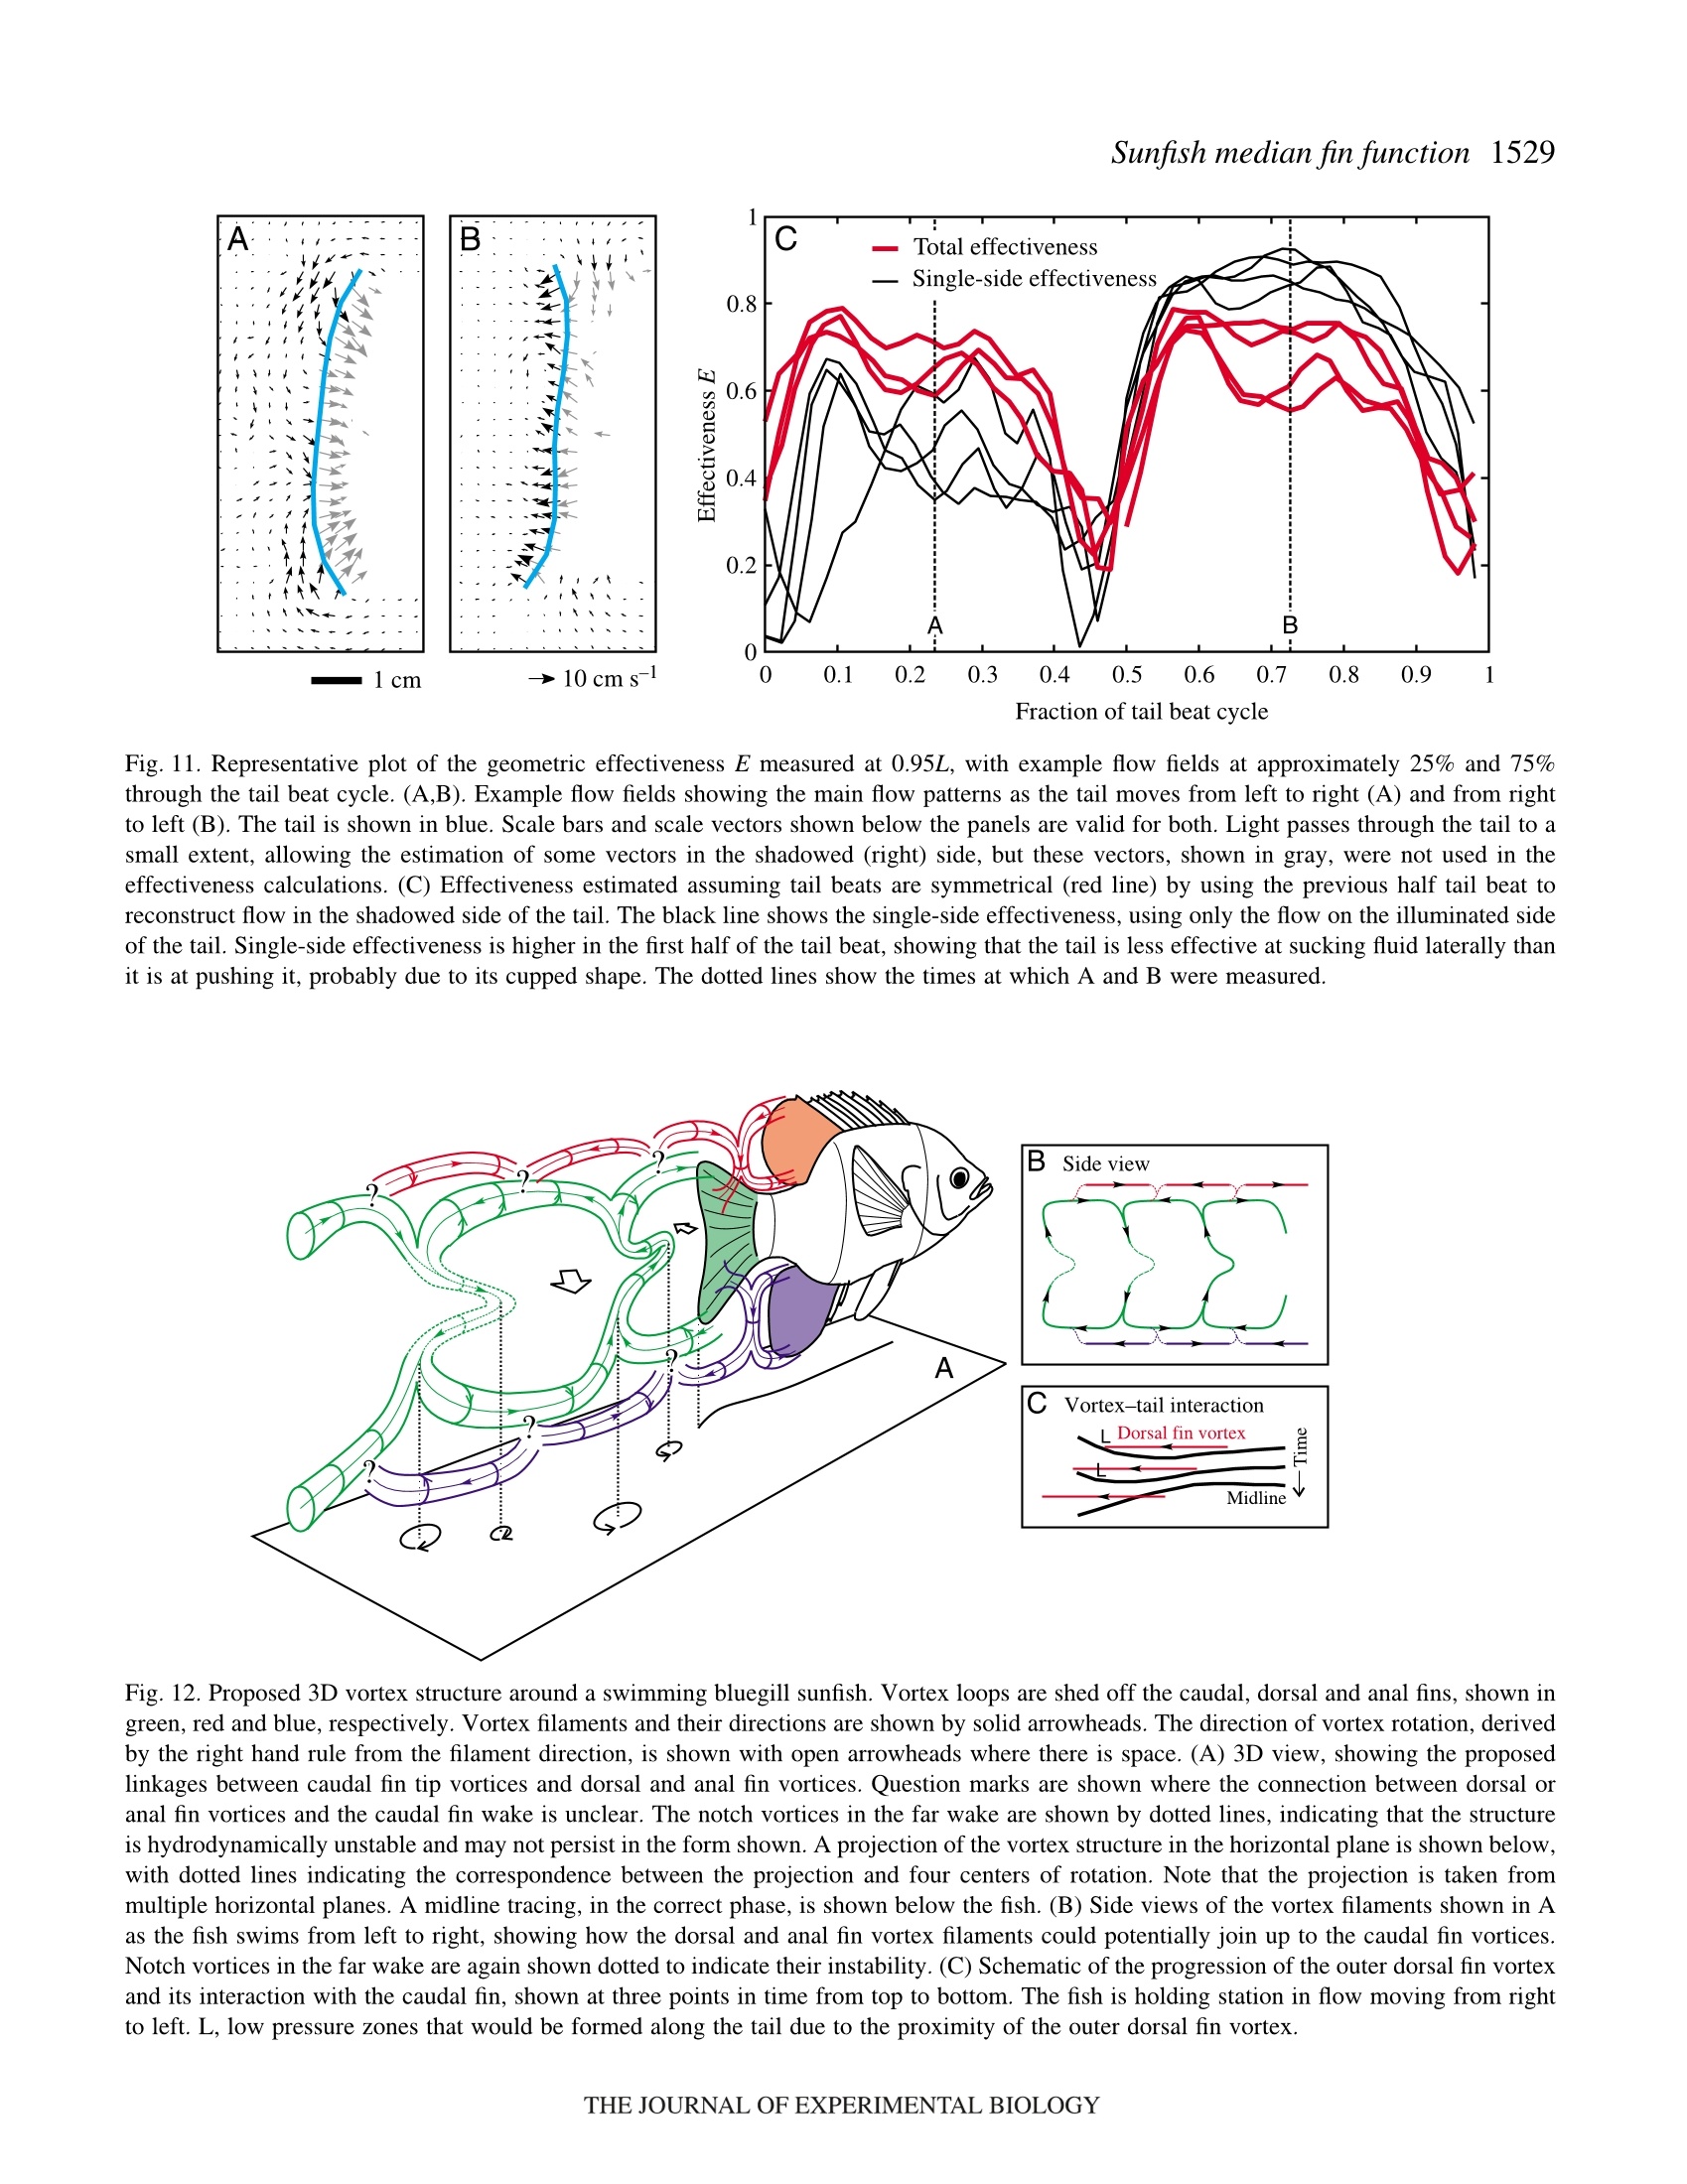
还剩17页未读,是否继续阅读?

产品配置单

北京欧兰科技发展有限公司为您提供《流体,鱼类中速度场,漩涡结构检测方案(粒子图像测速)》,该方案主要用于其他中速度场,漩涡结构检测,参考标准--,《流体,鱼类中速度场,漩涡结构检测方案(粒子图像测速)》用到的仪器有德国LaVision PIV/PLIF粒子成像测速场仪
推荐专场


相关方案
更多
该厂商其他方案
更多