


方案详情
文
采用英国Litron公司LPY 703-200型, 200 Hz PIV激光器作光源。两台Photron 1024 PCI型高速相机作为成像组件,构成一套高速时间分辨粒子成像测速系统。同时用多台高速相机记录两种食虫性蝙蝠飞行的运动学特征。同步同时测量运动学特征和尾流结构。并分析其特点规律。
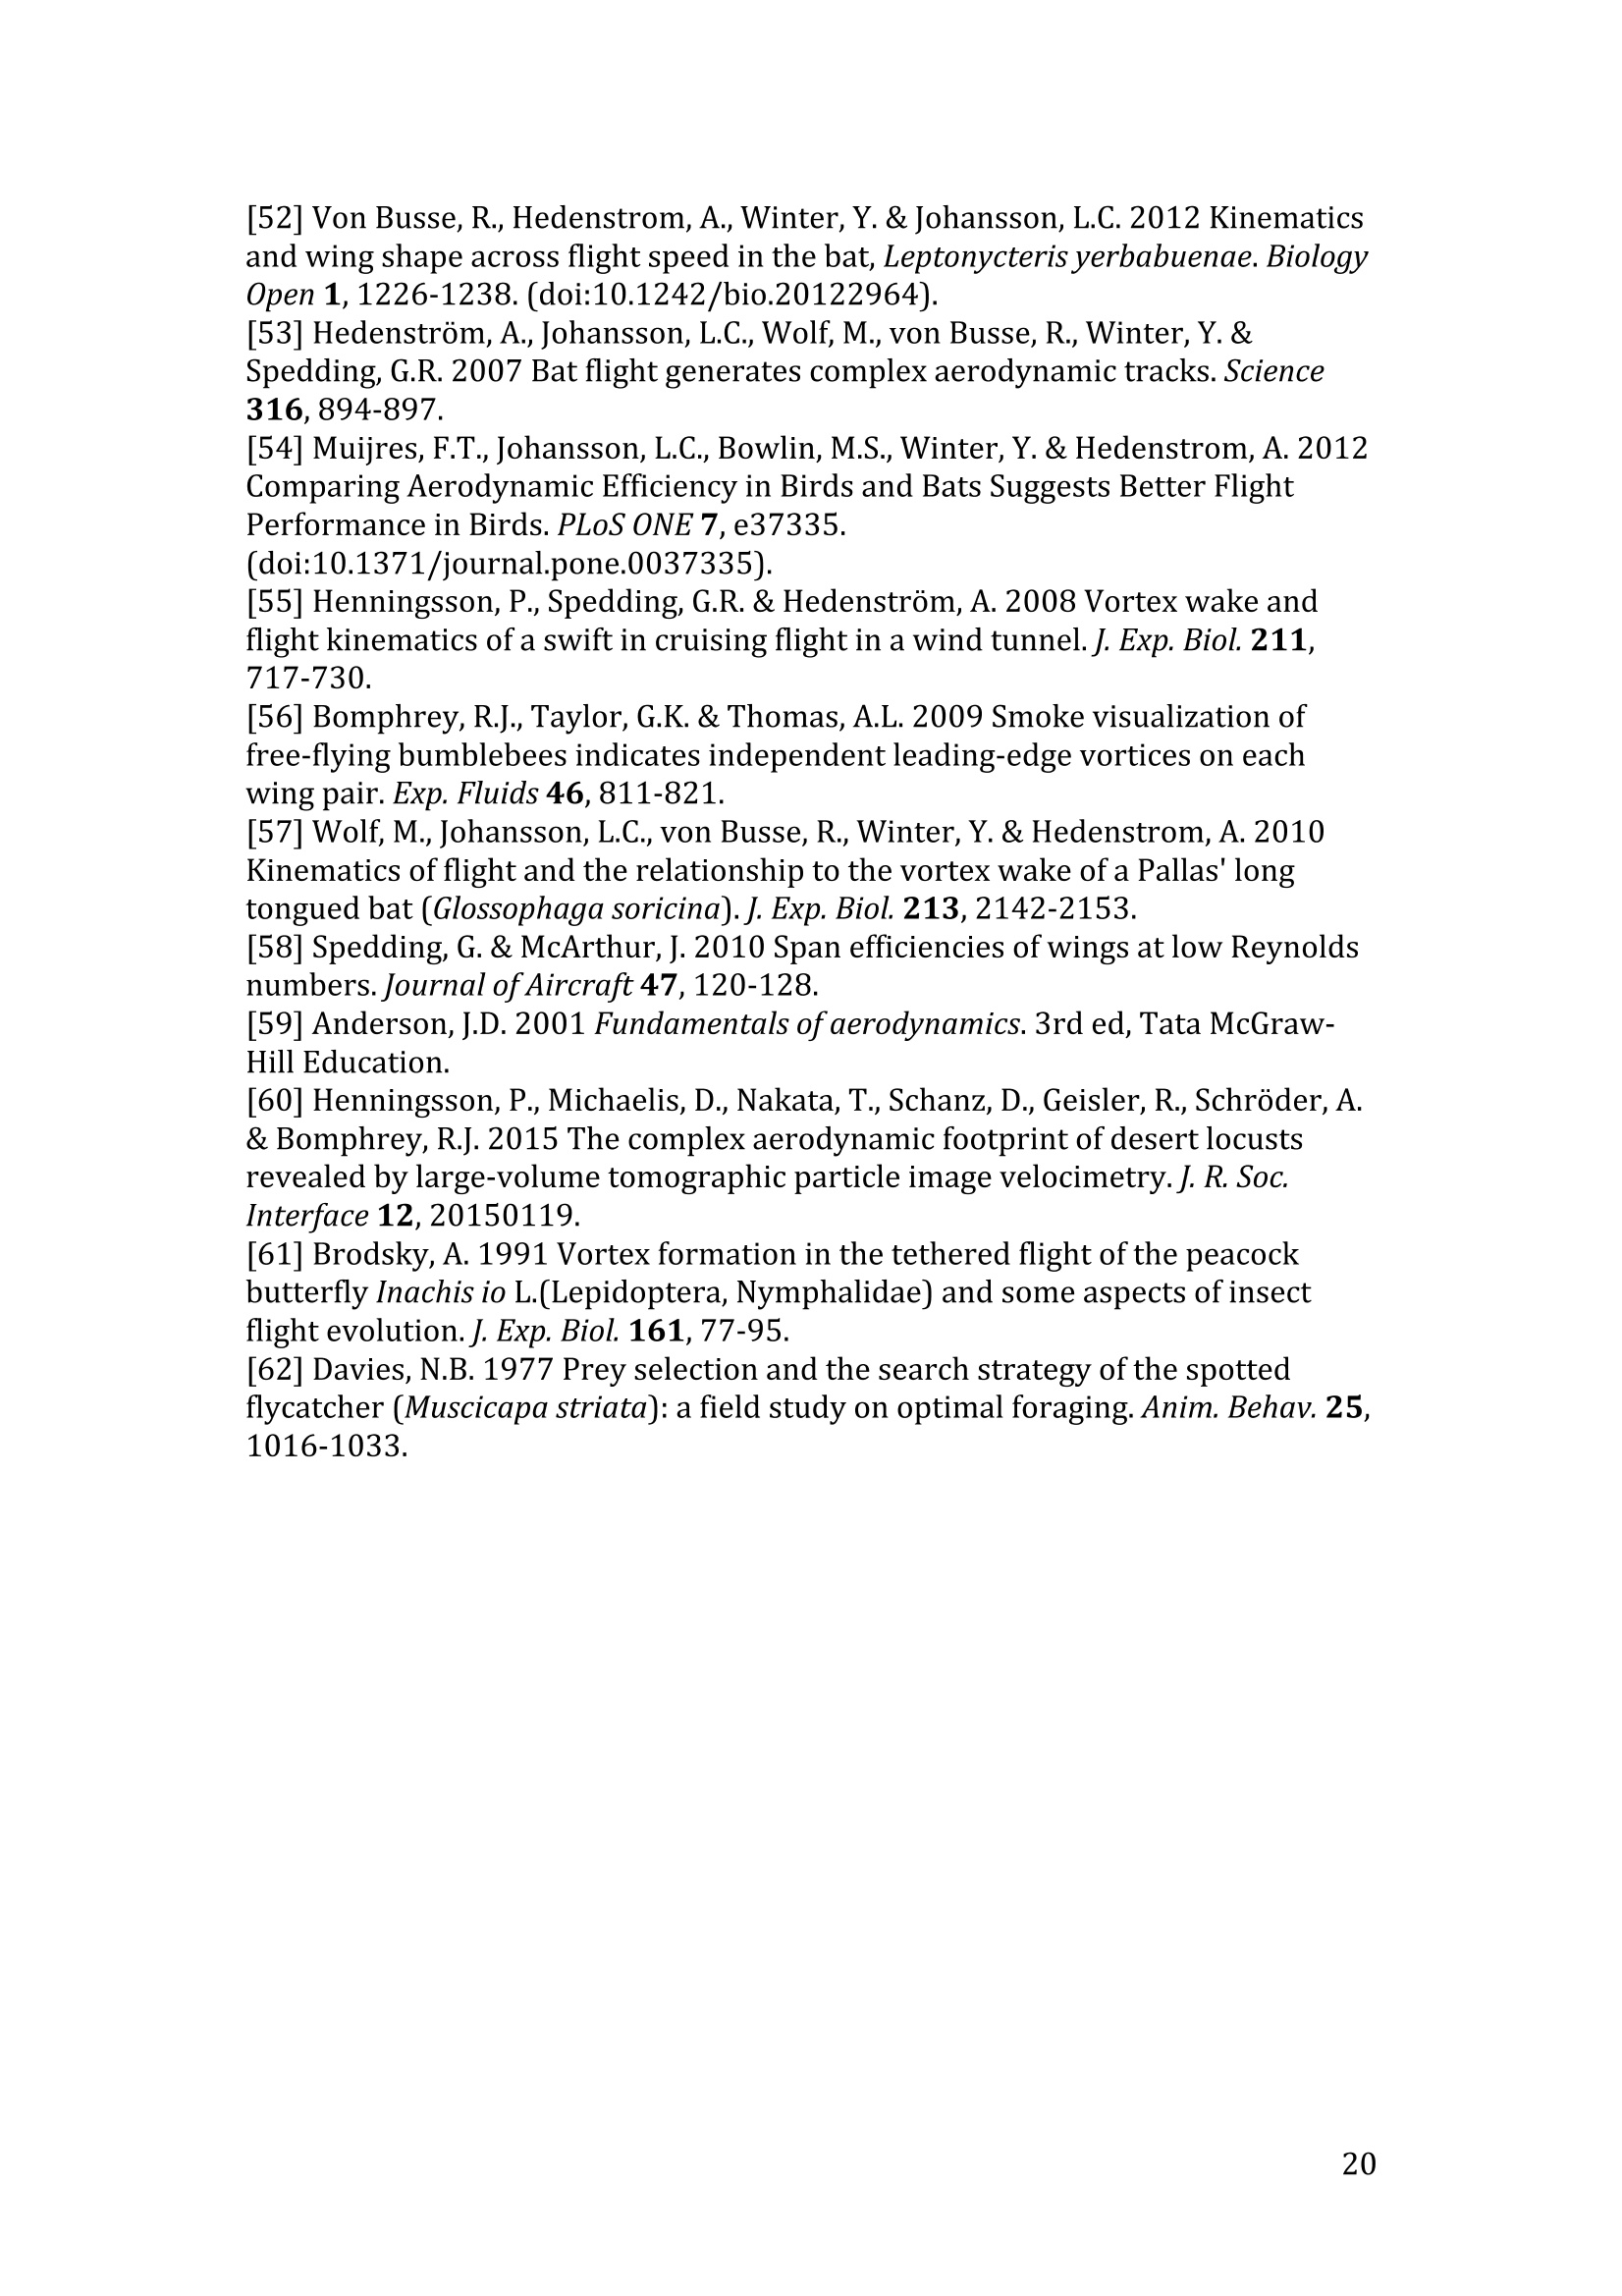
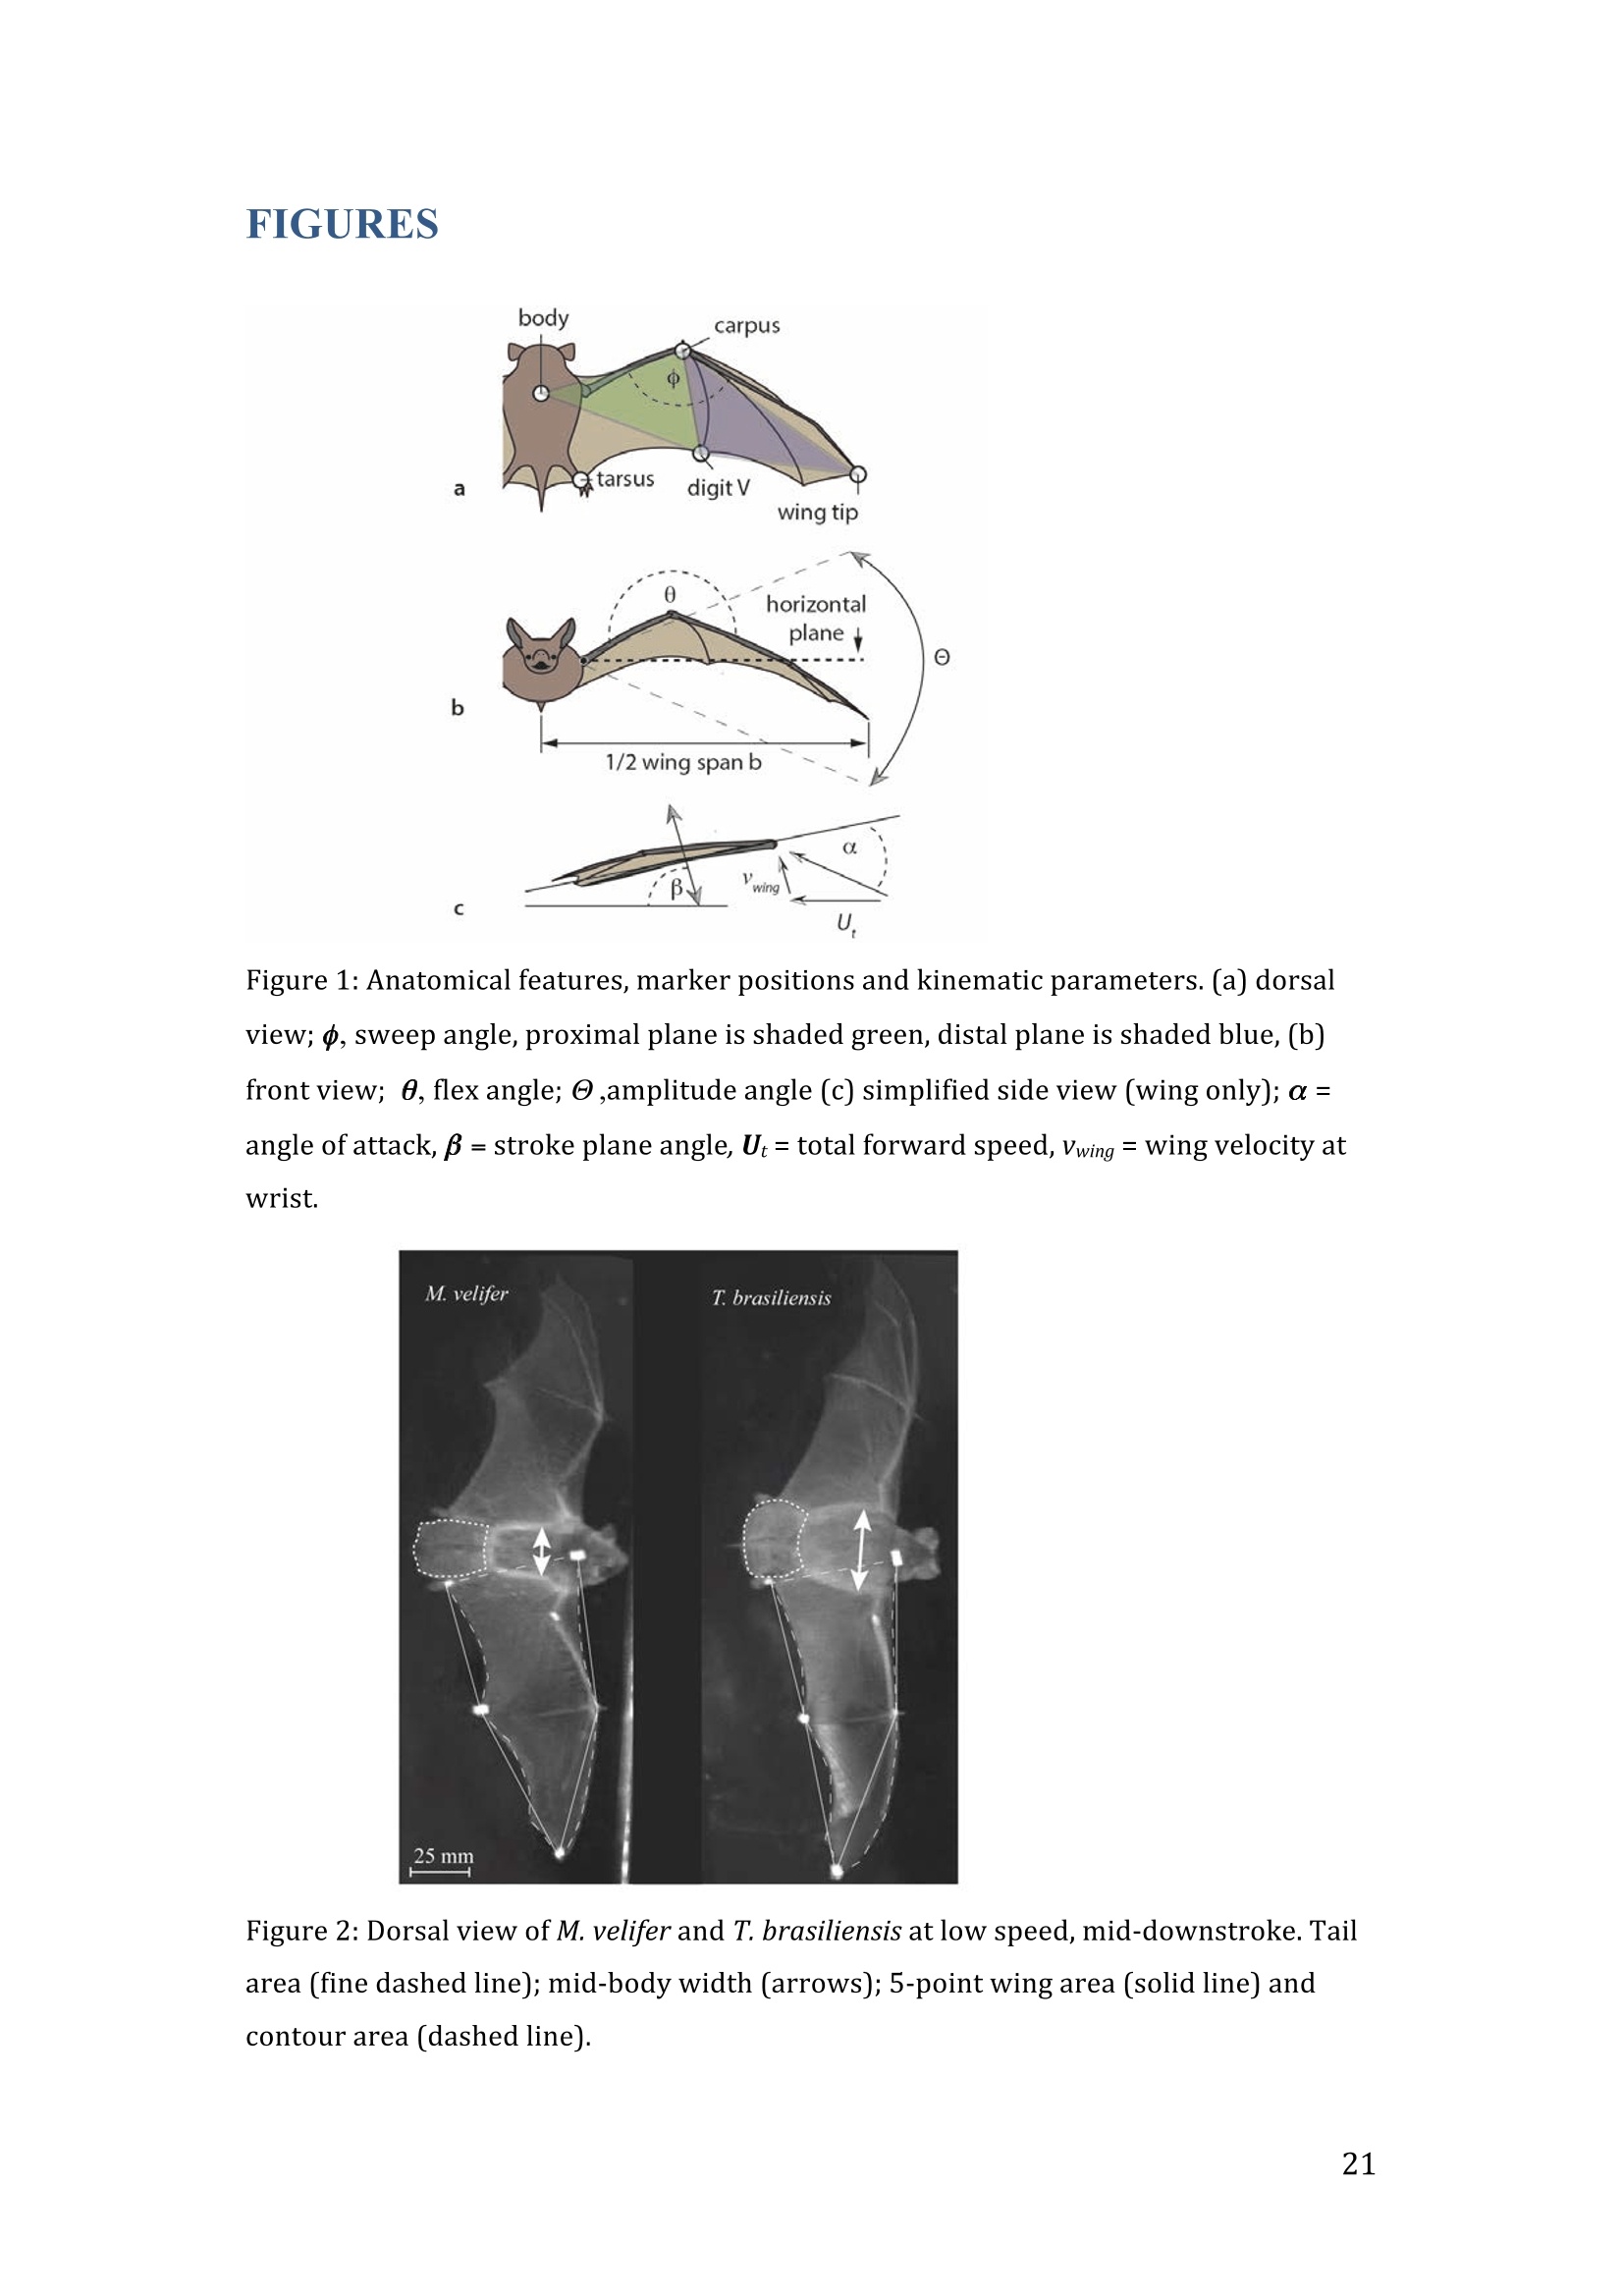
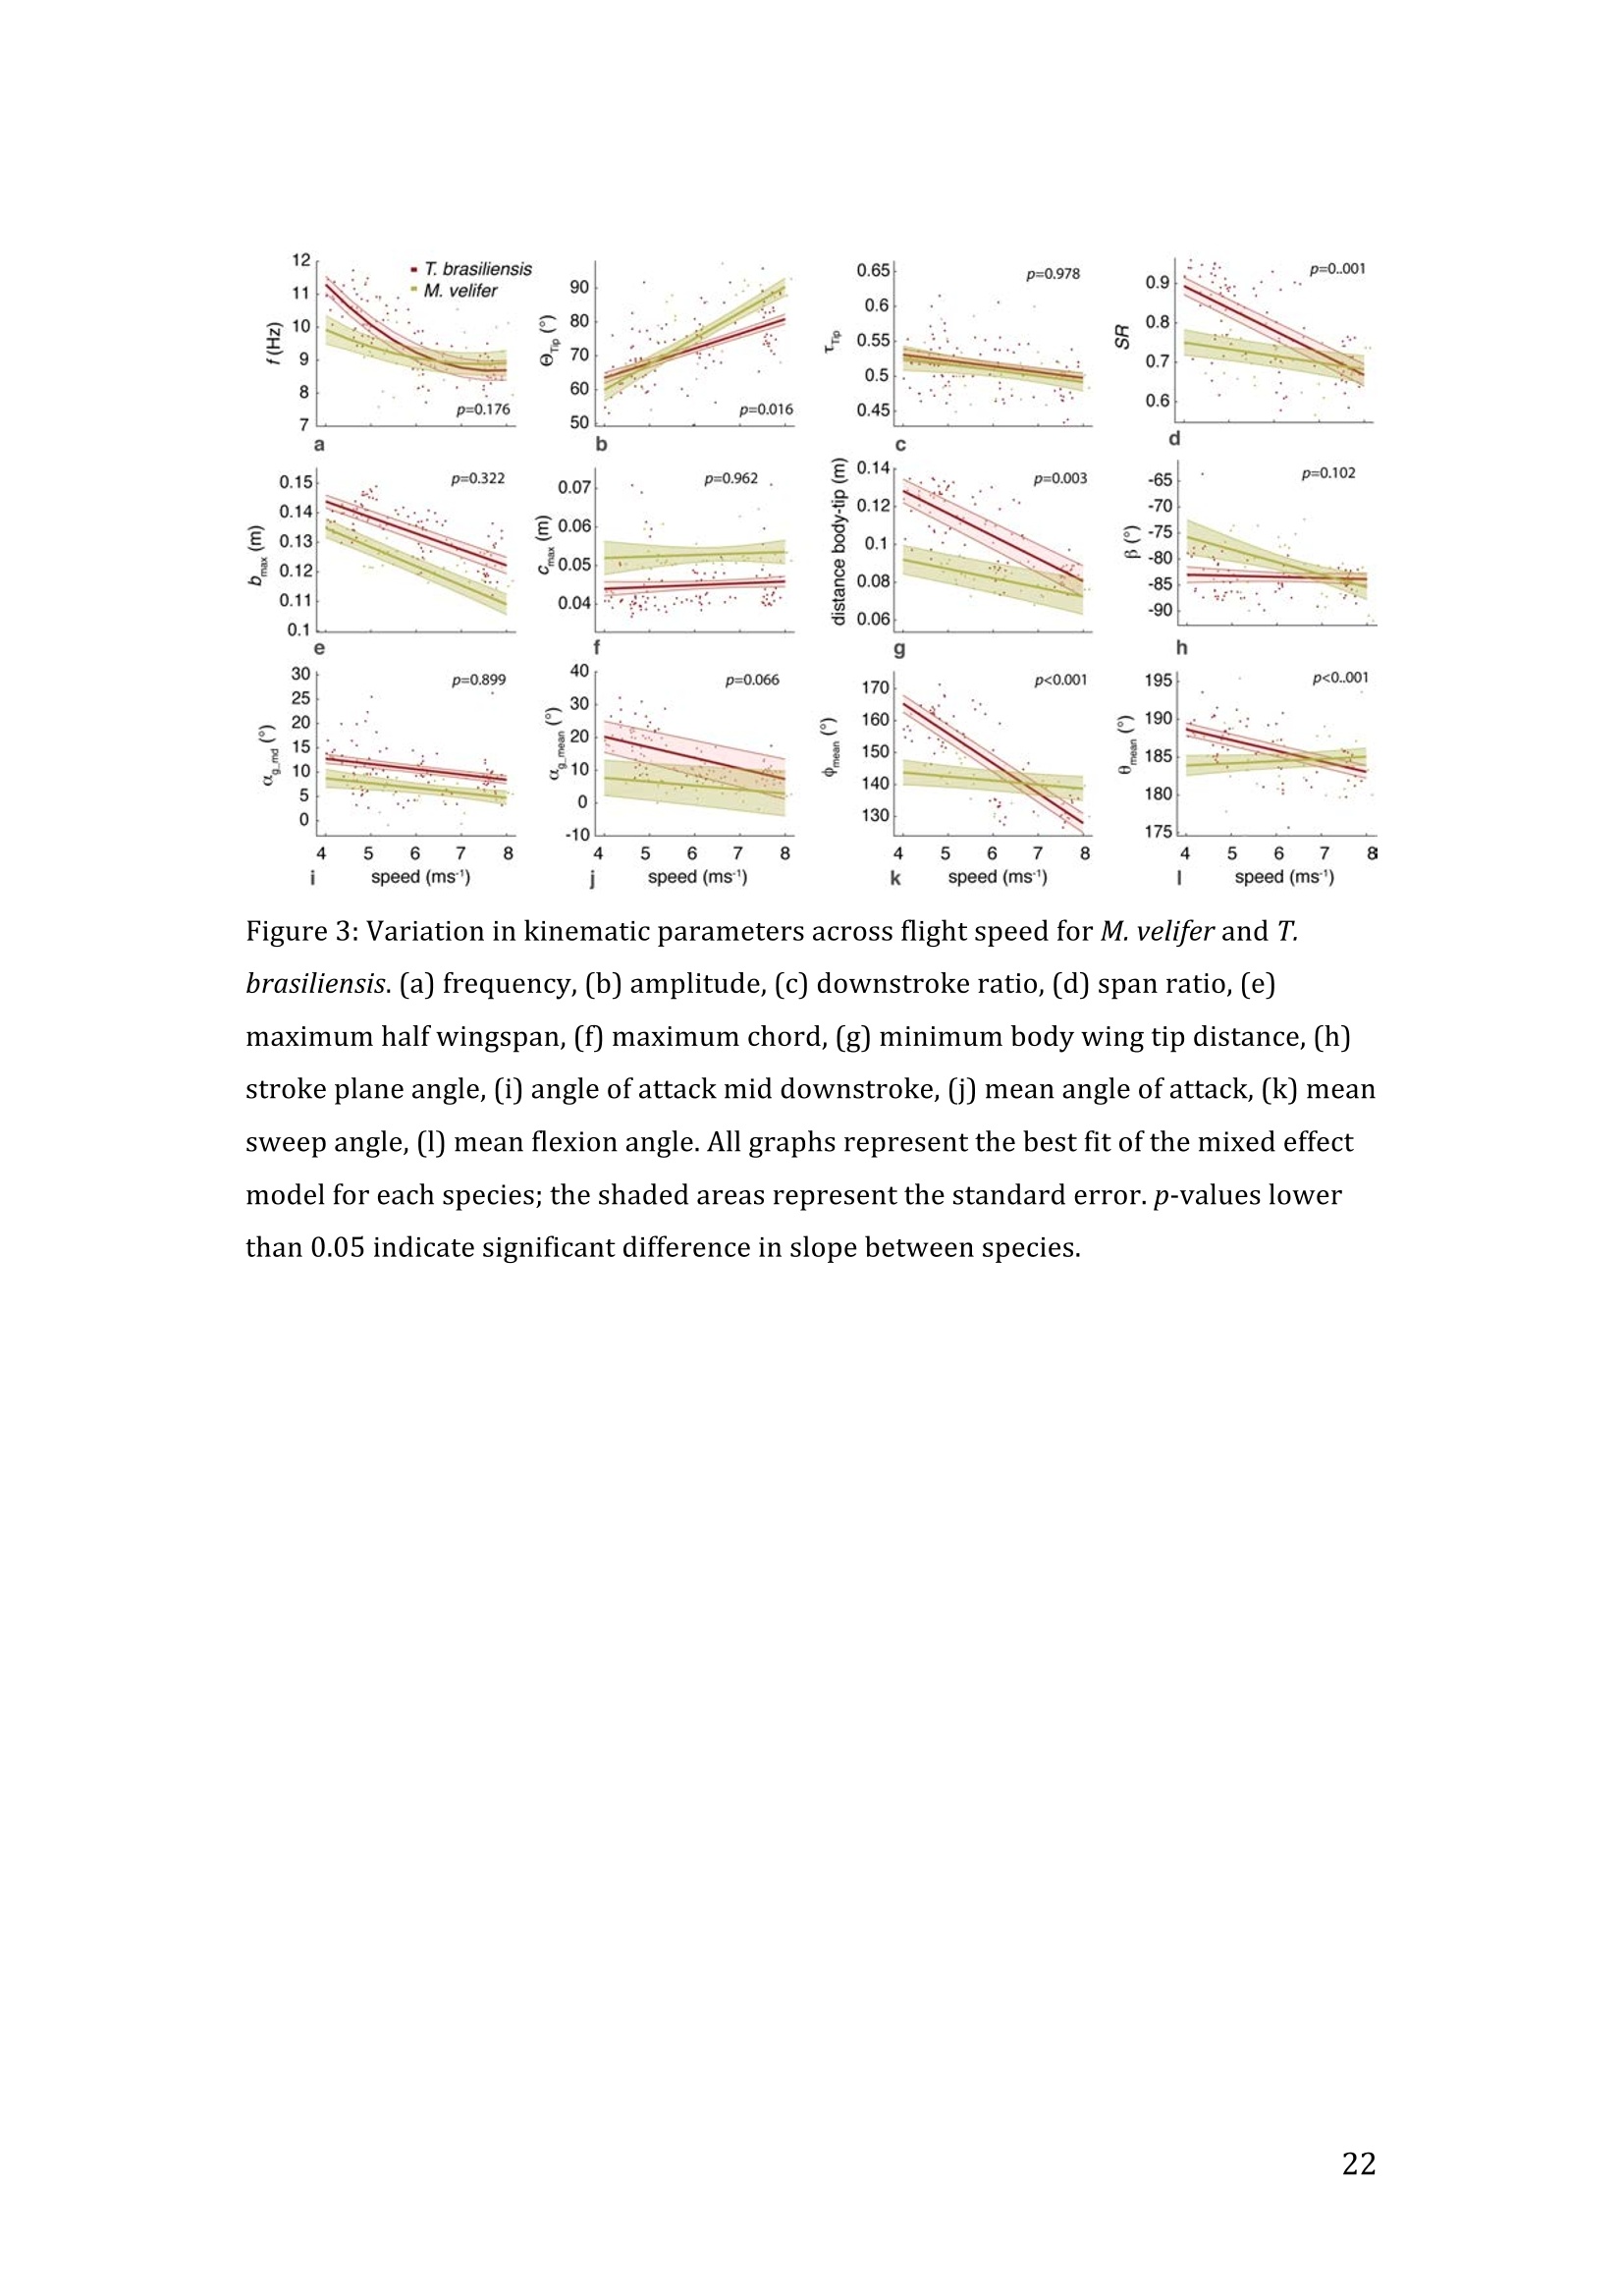
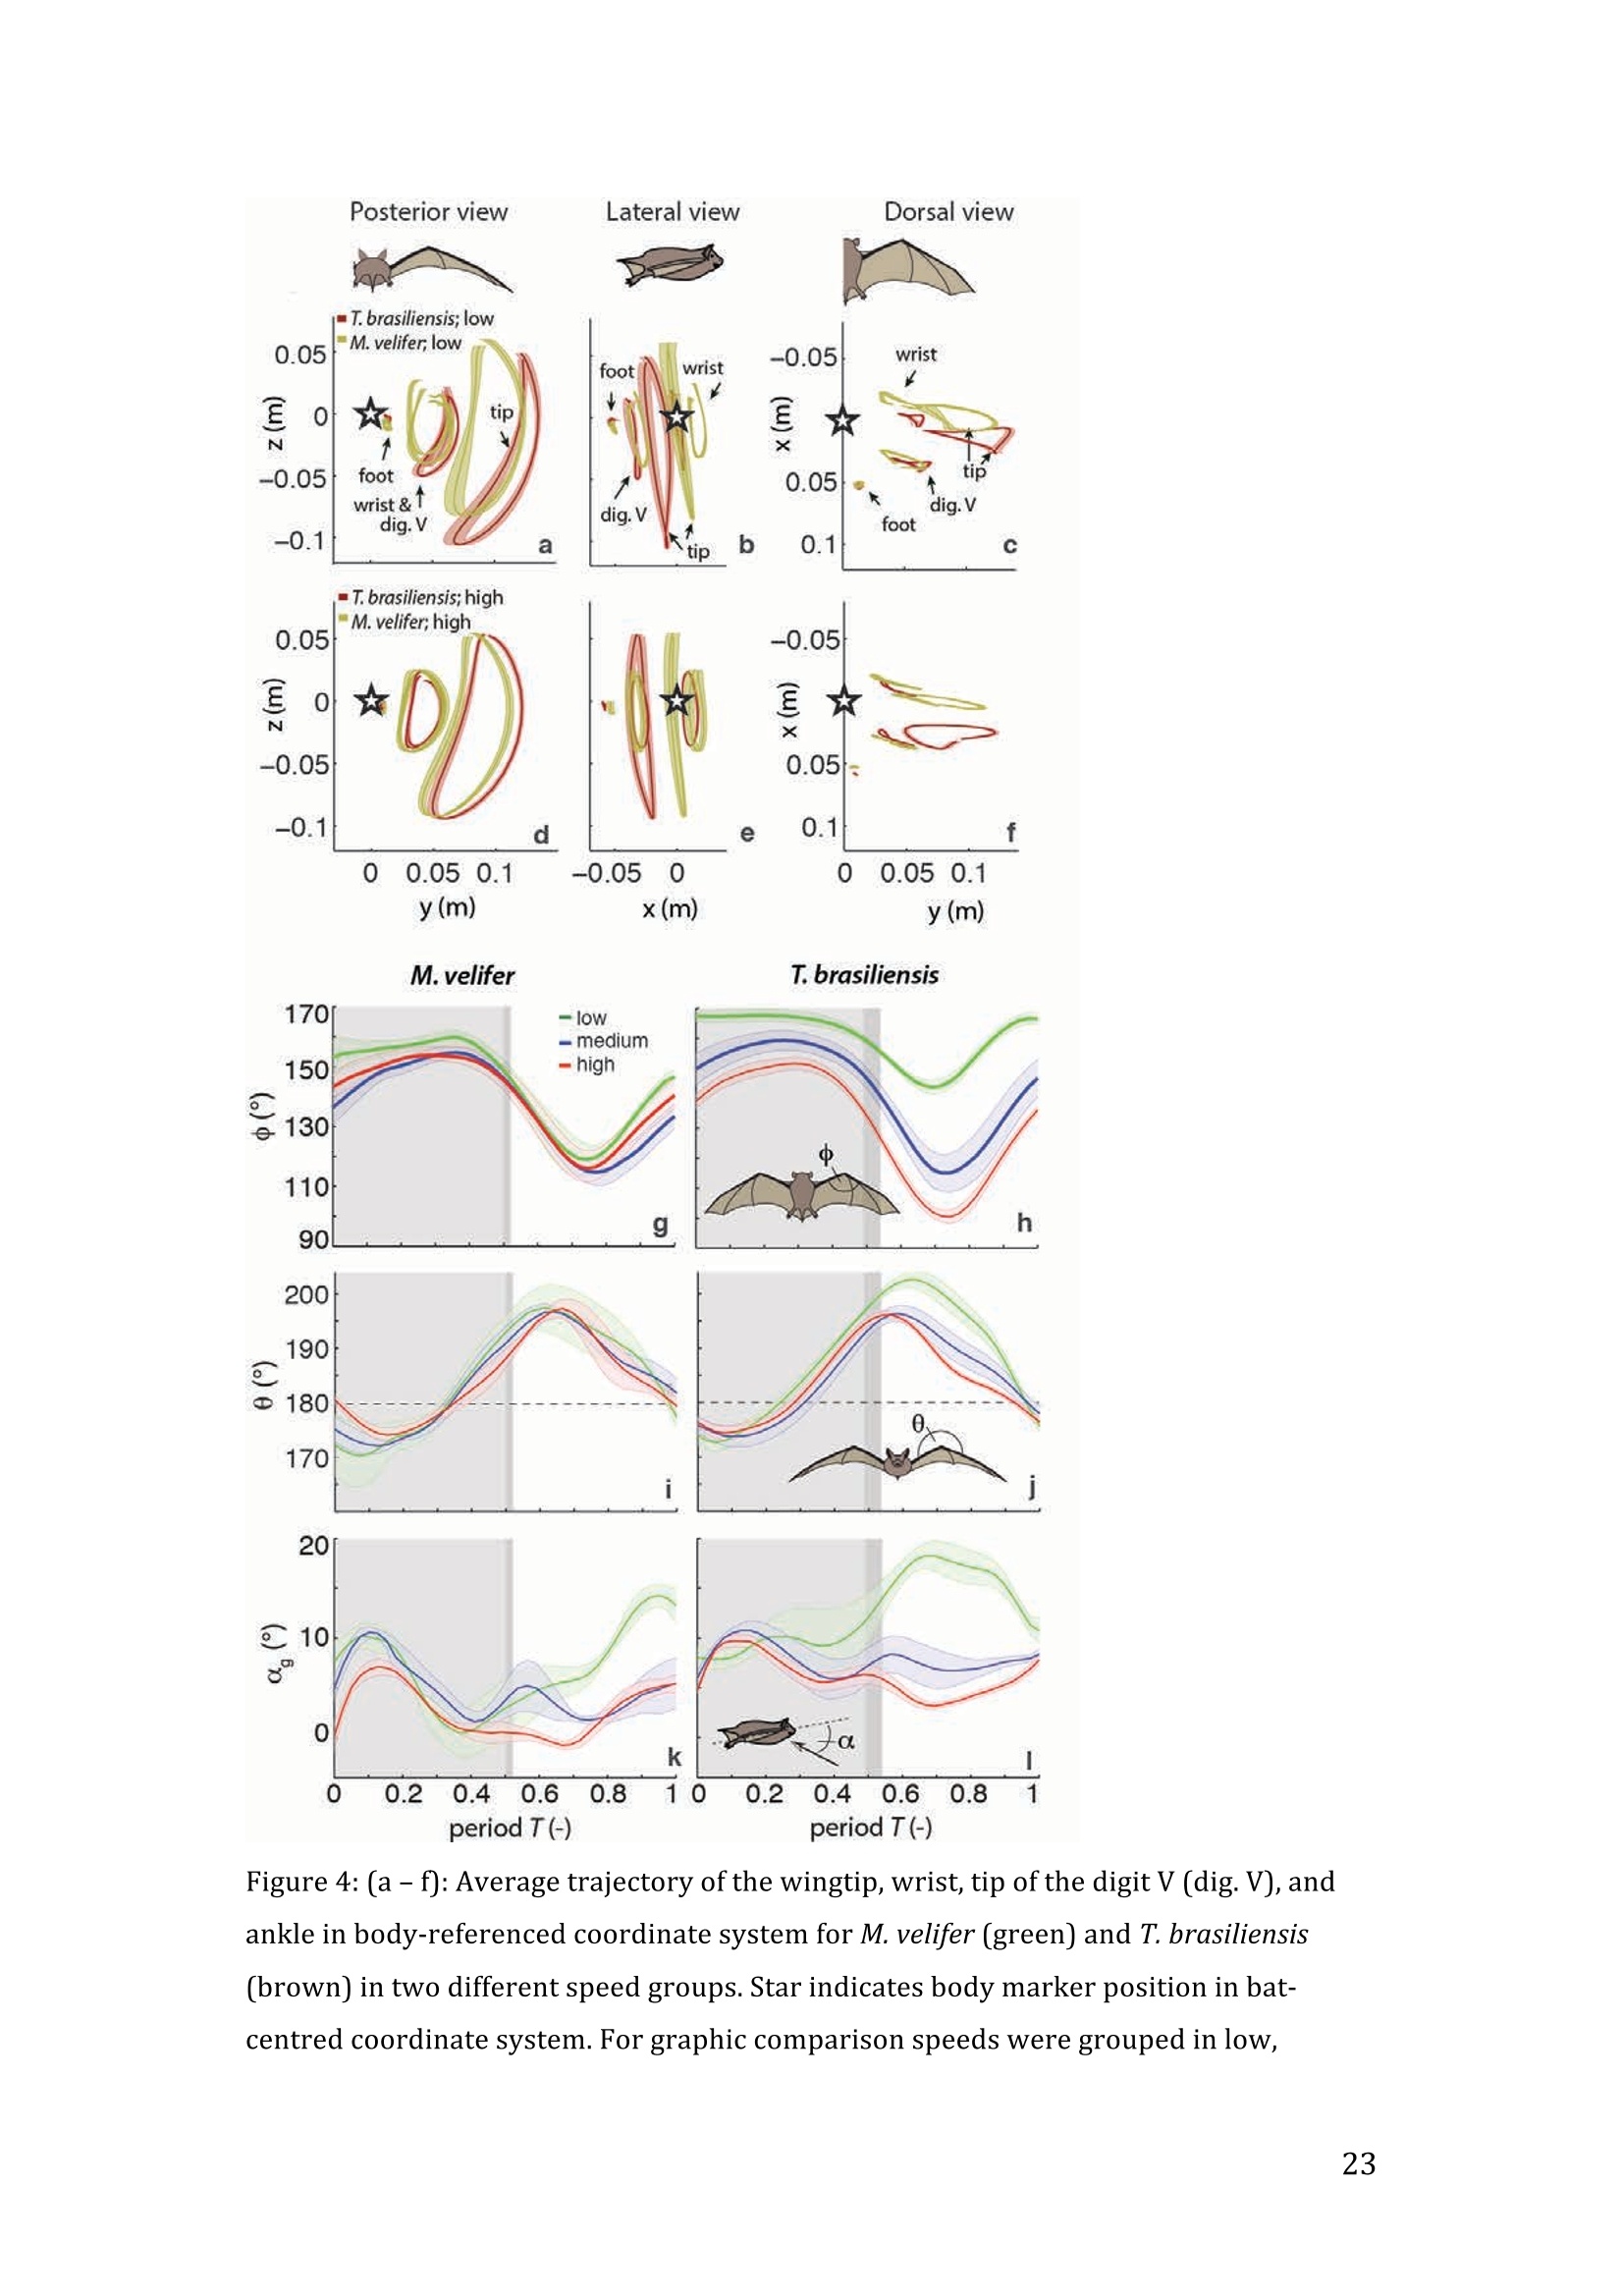
方案详情

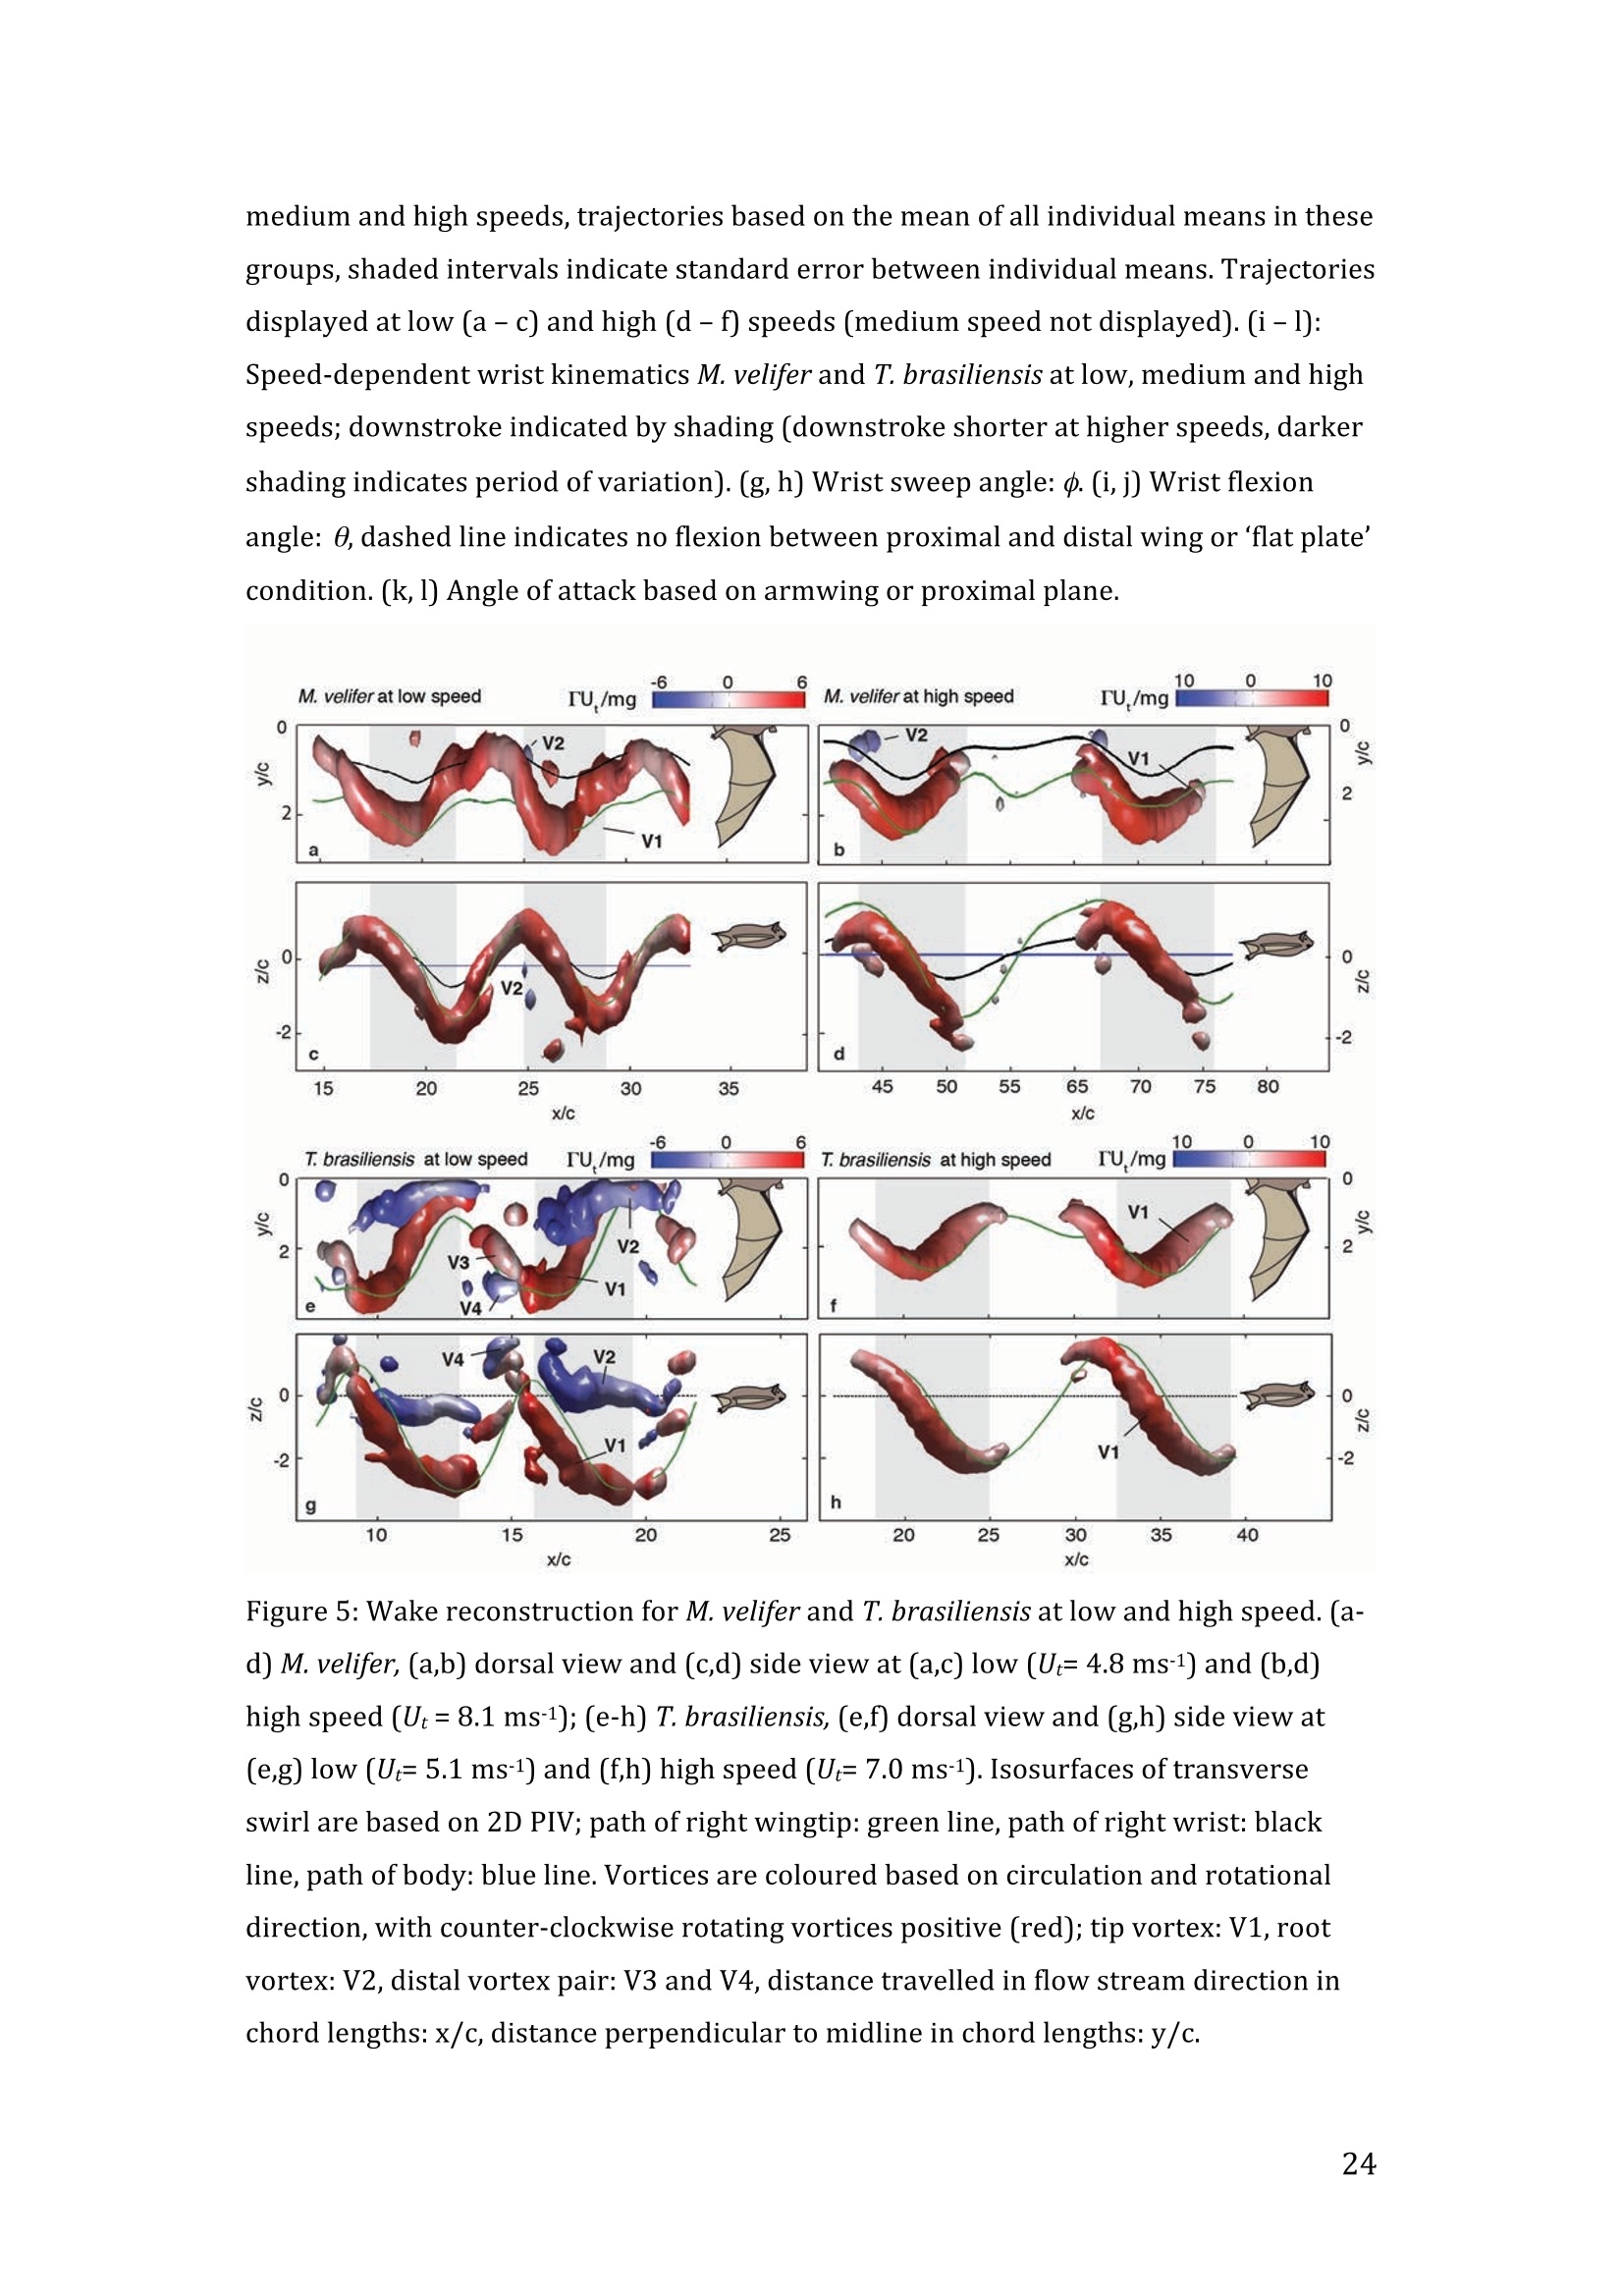
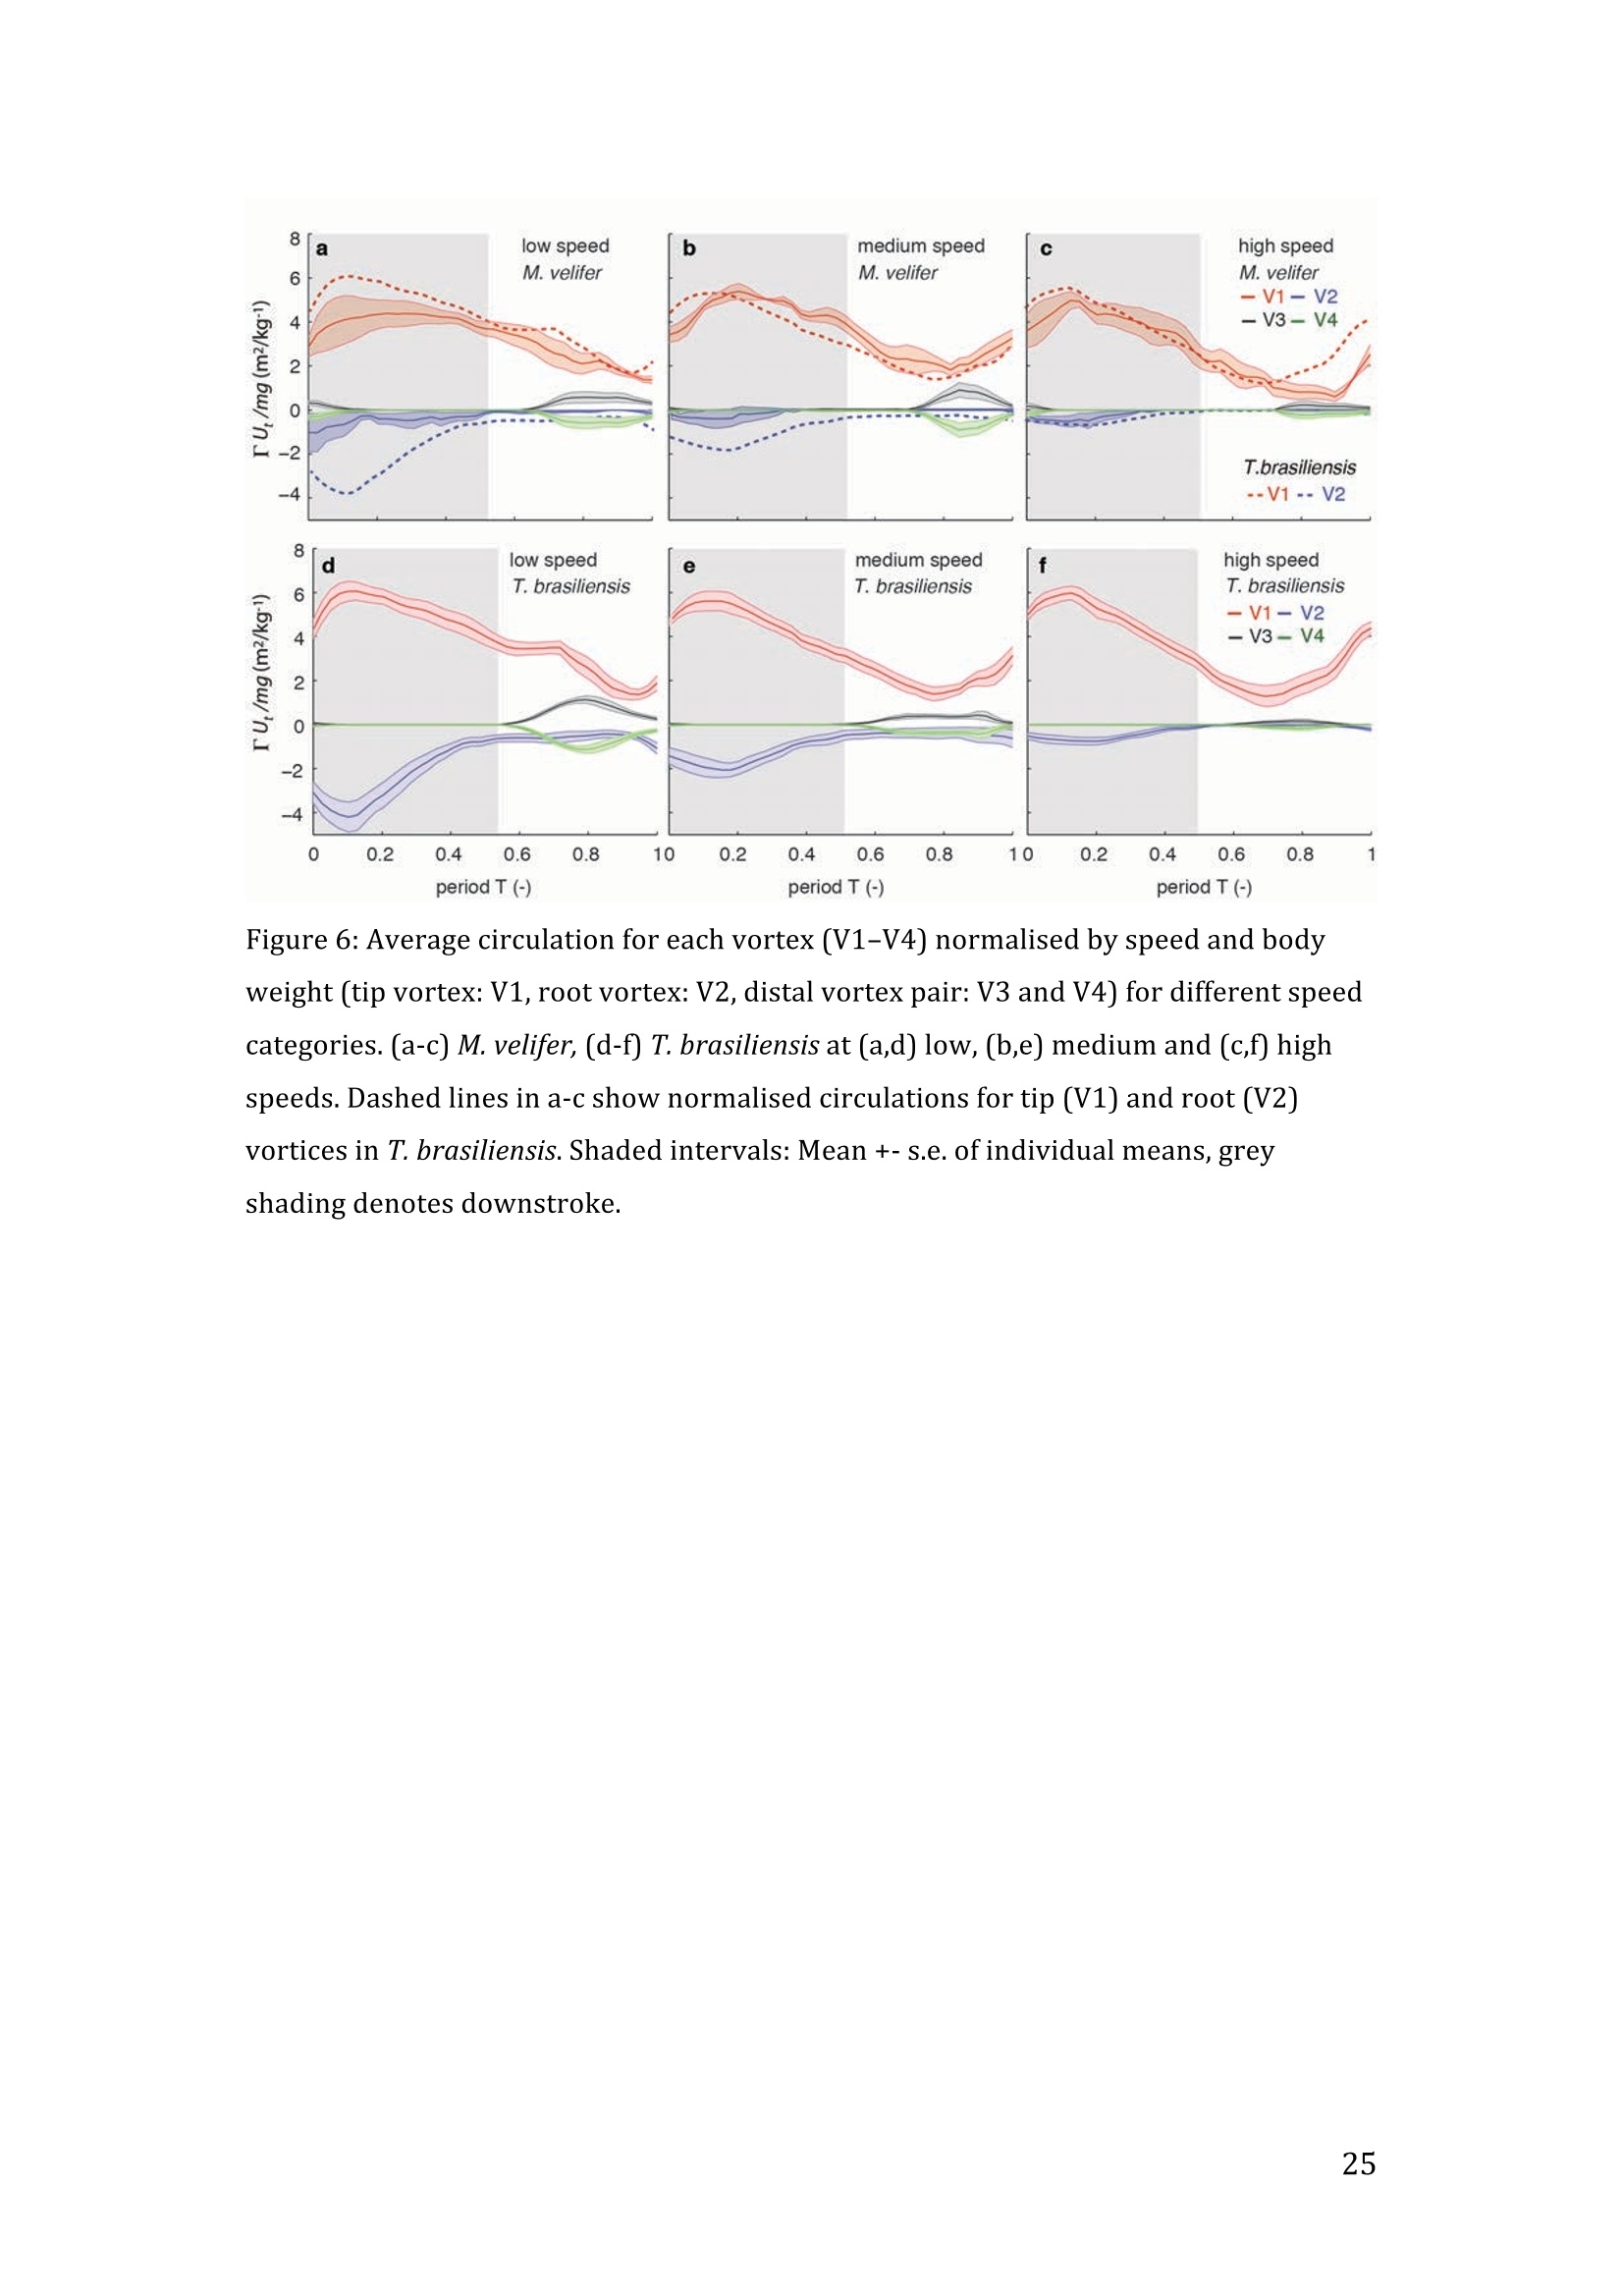
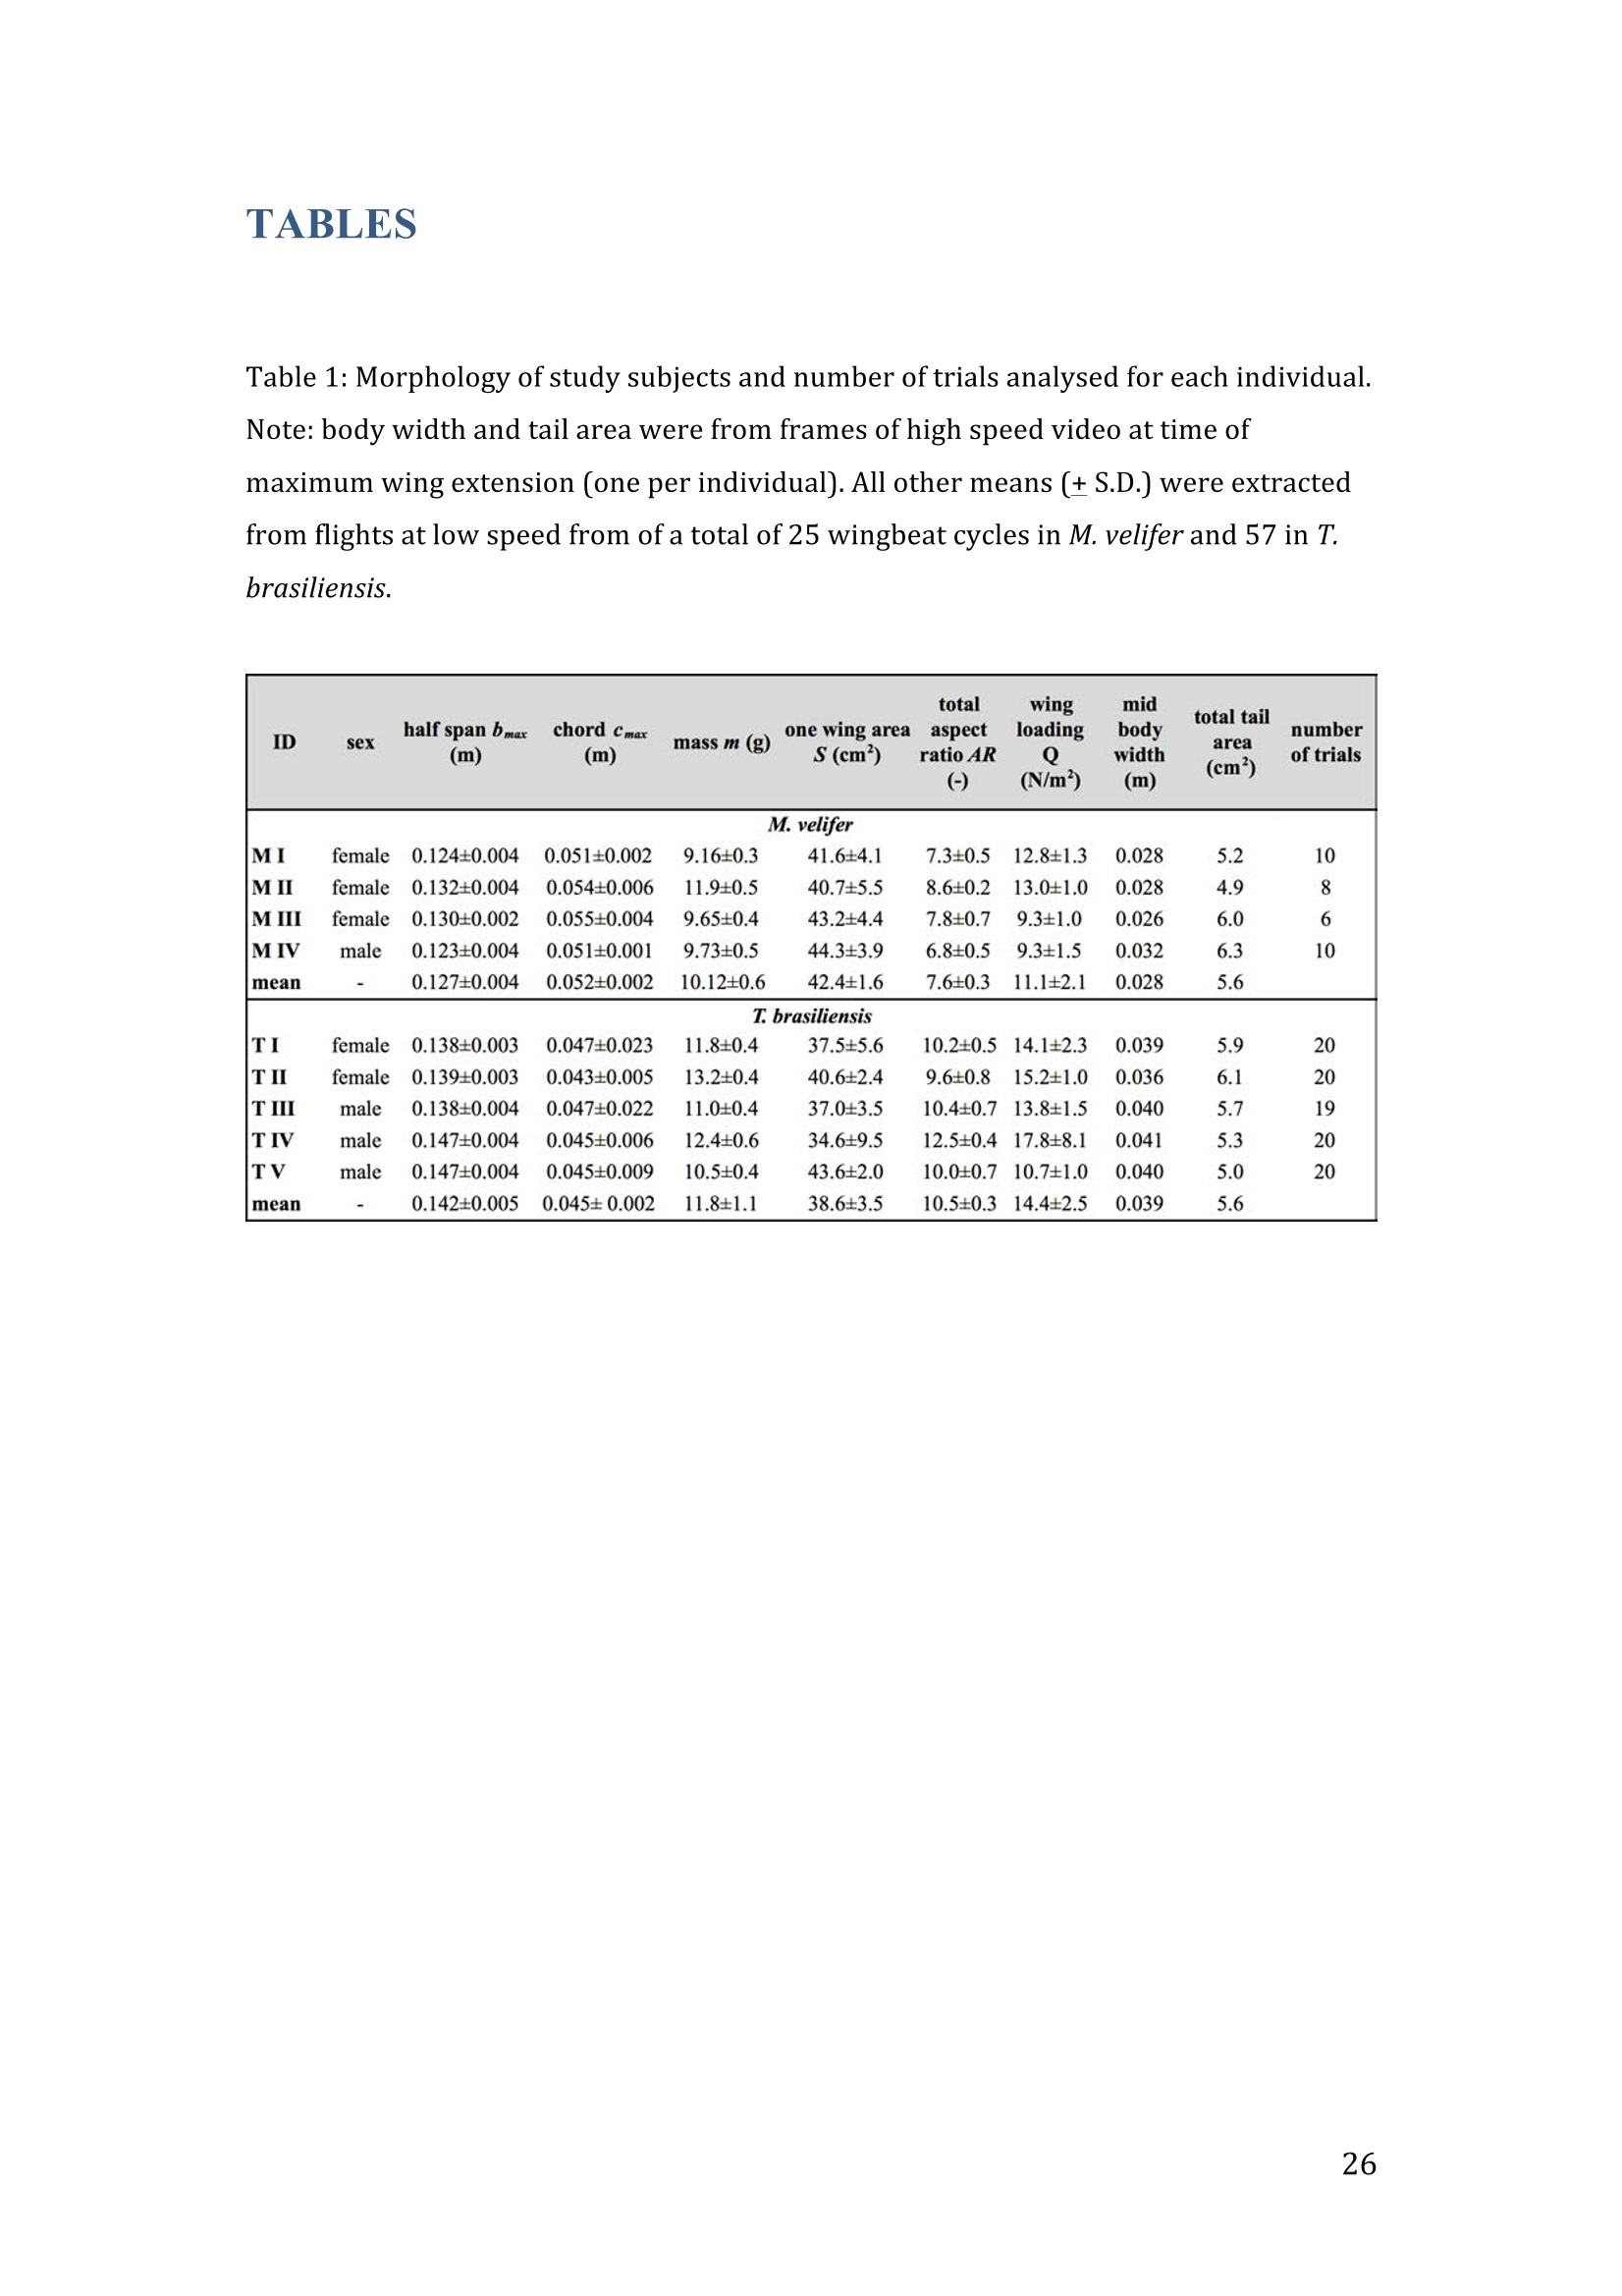
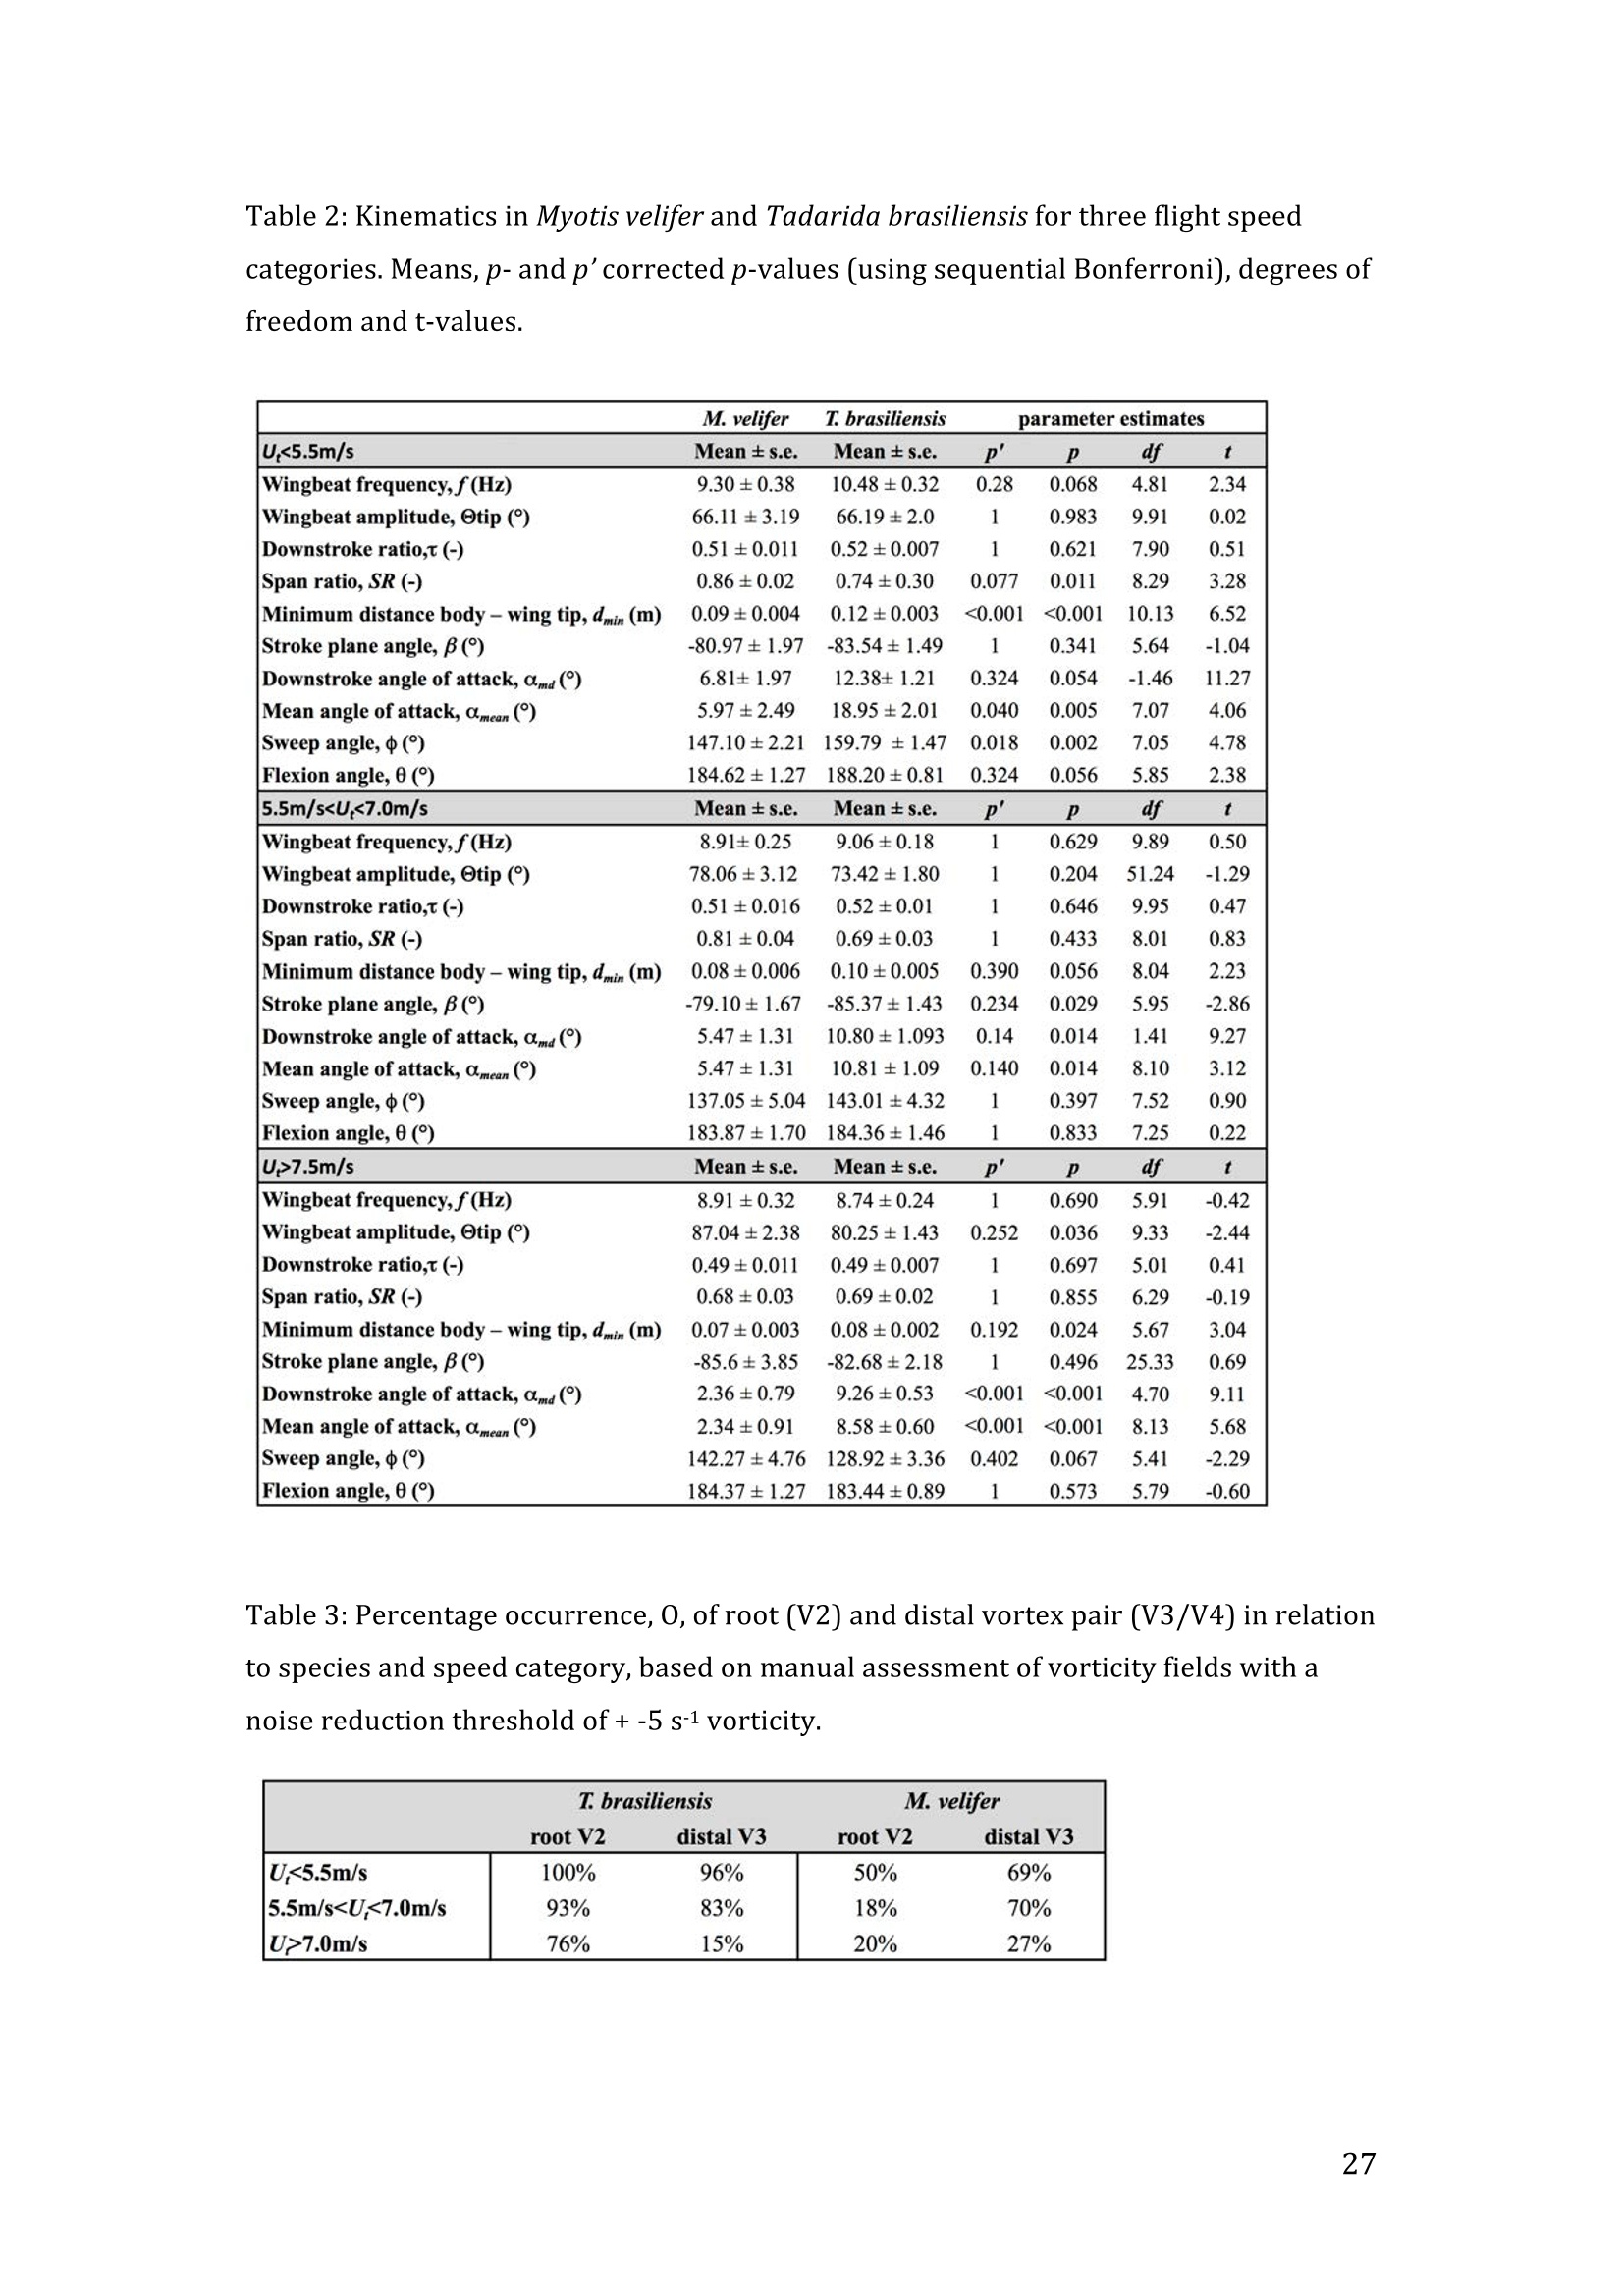
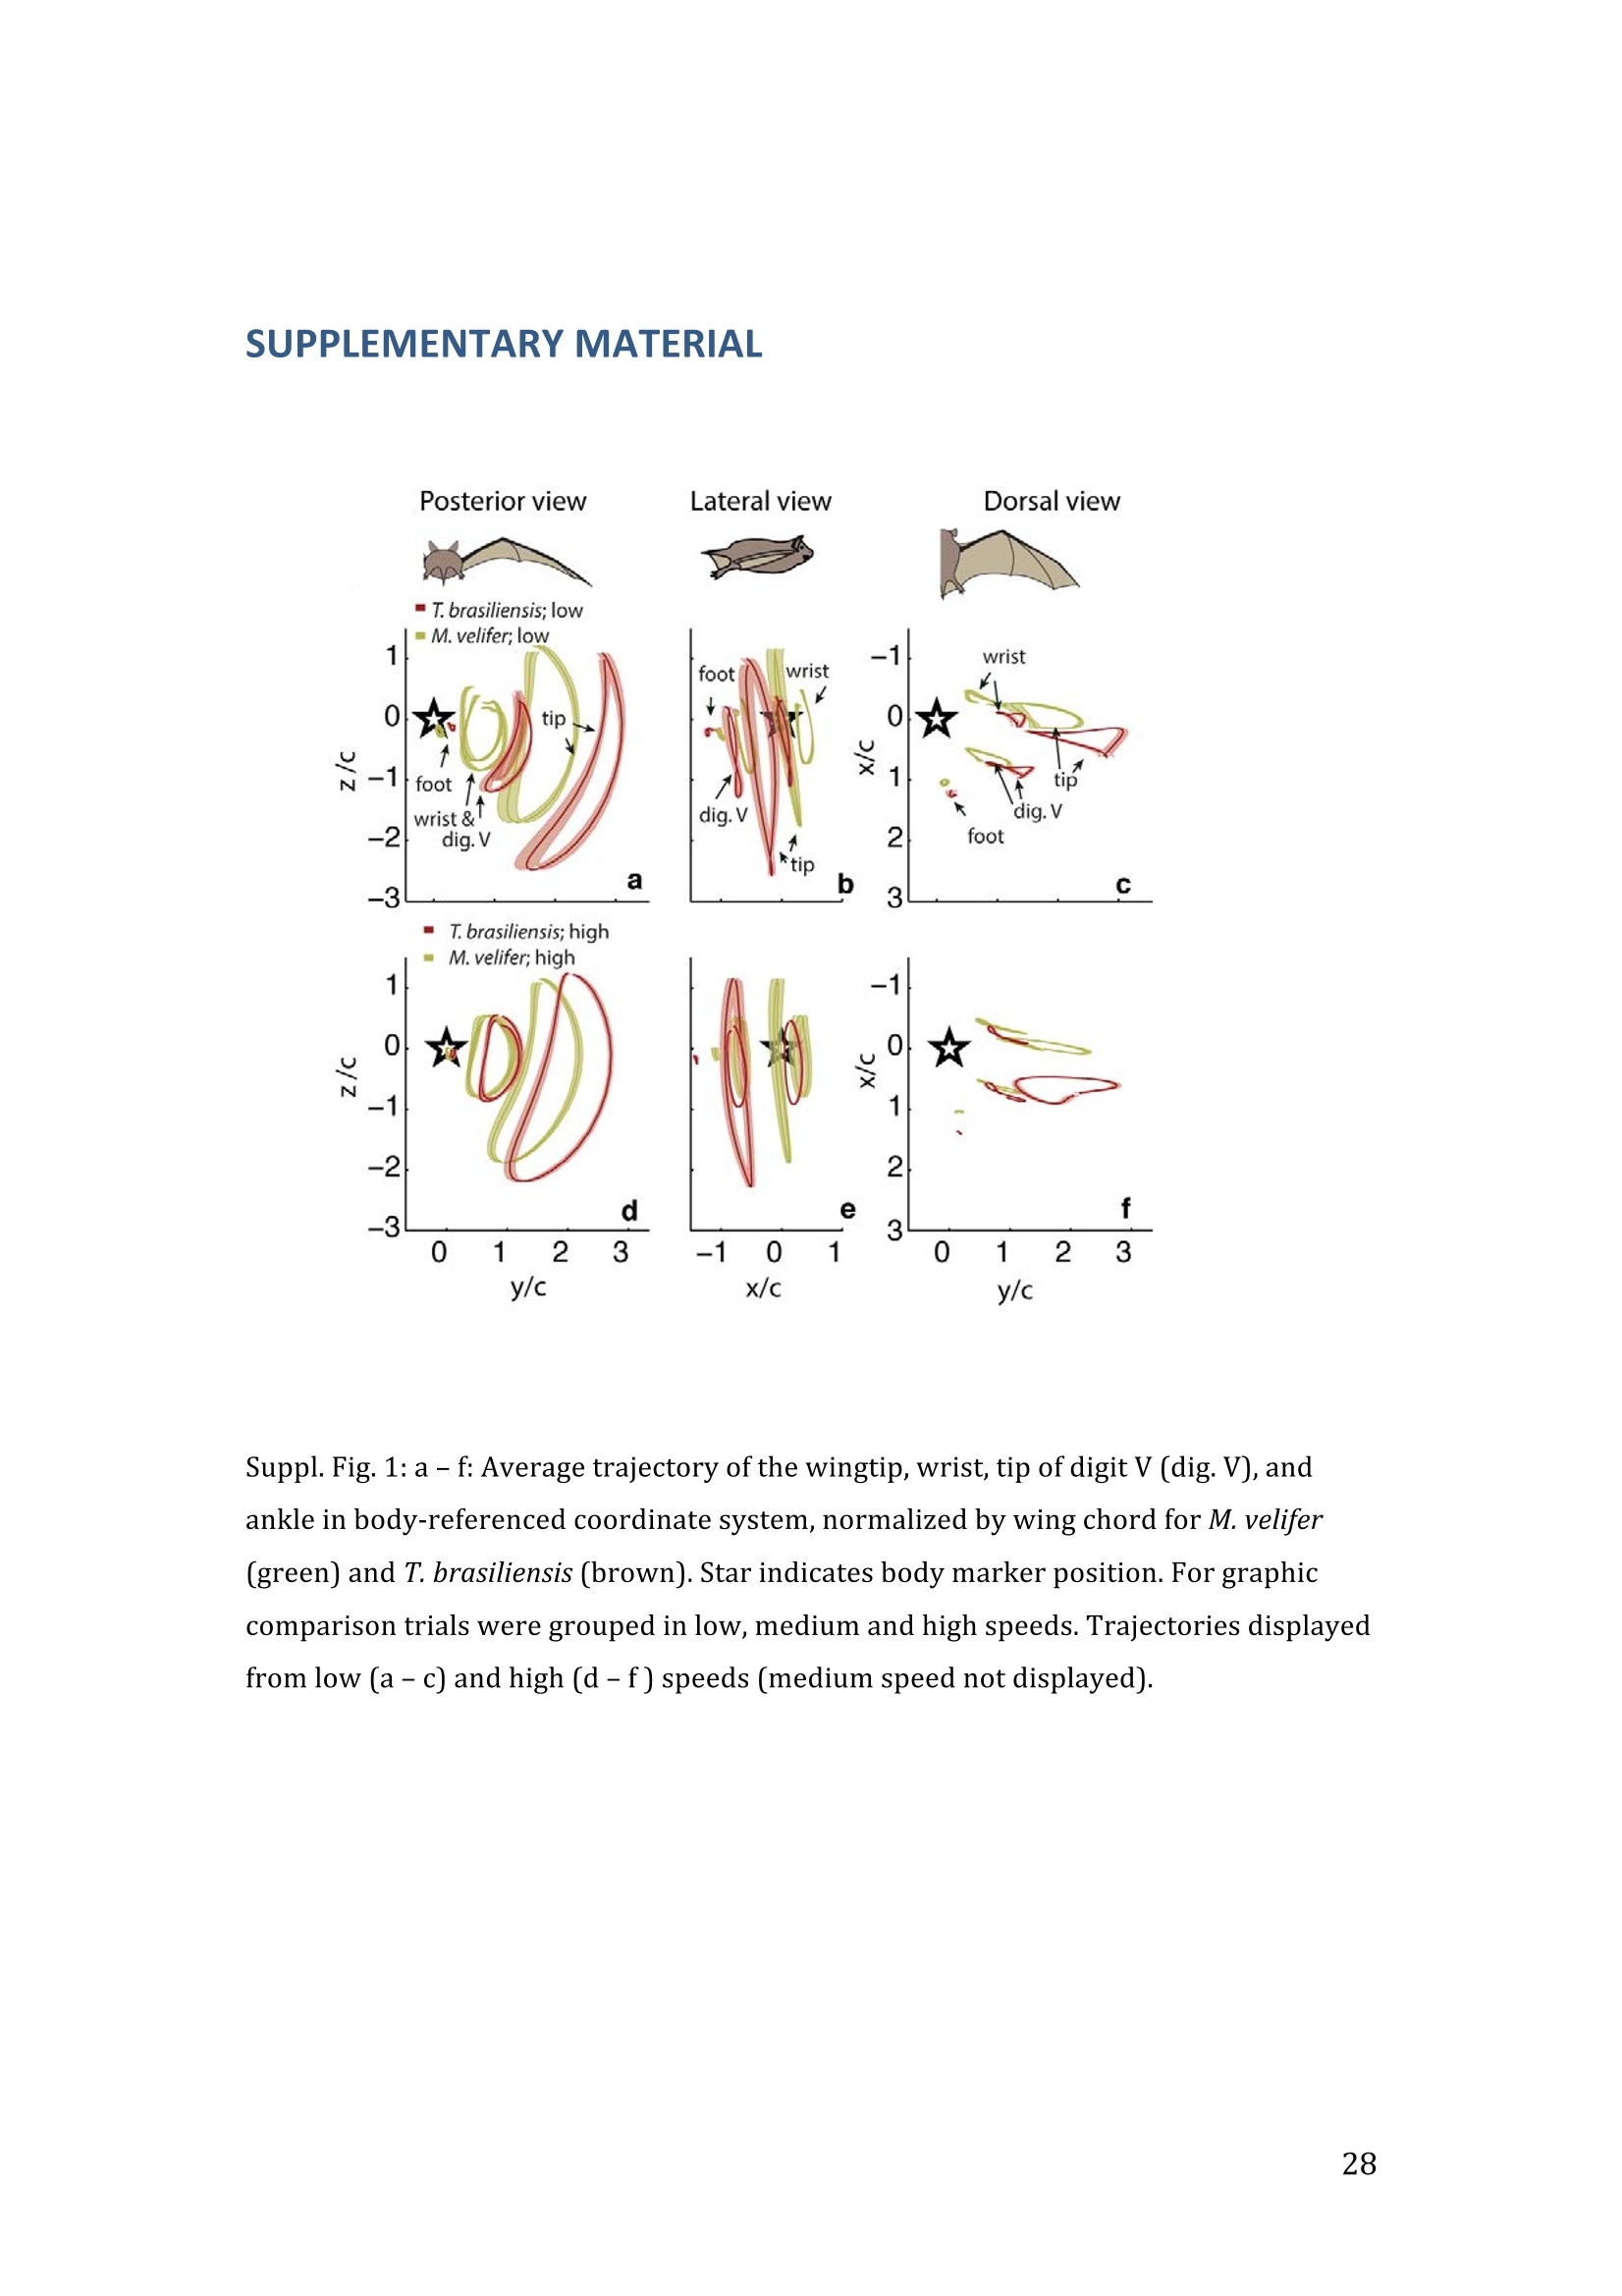
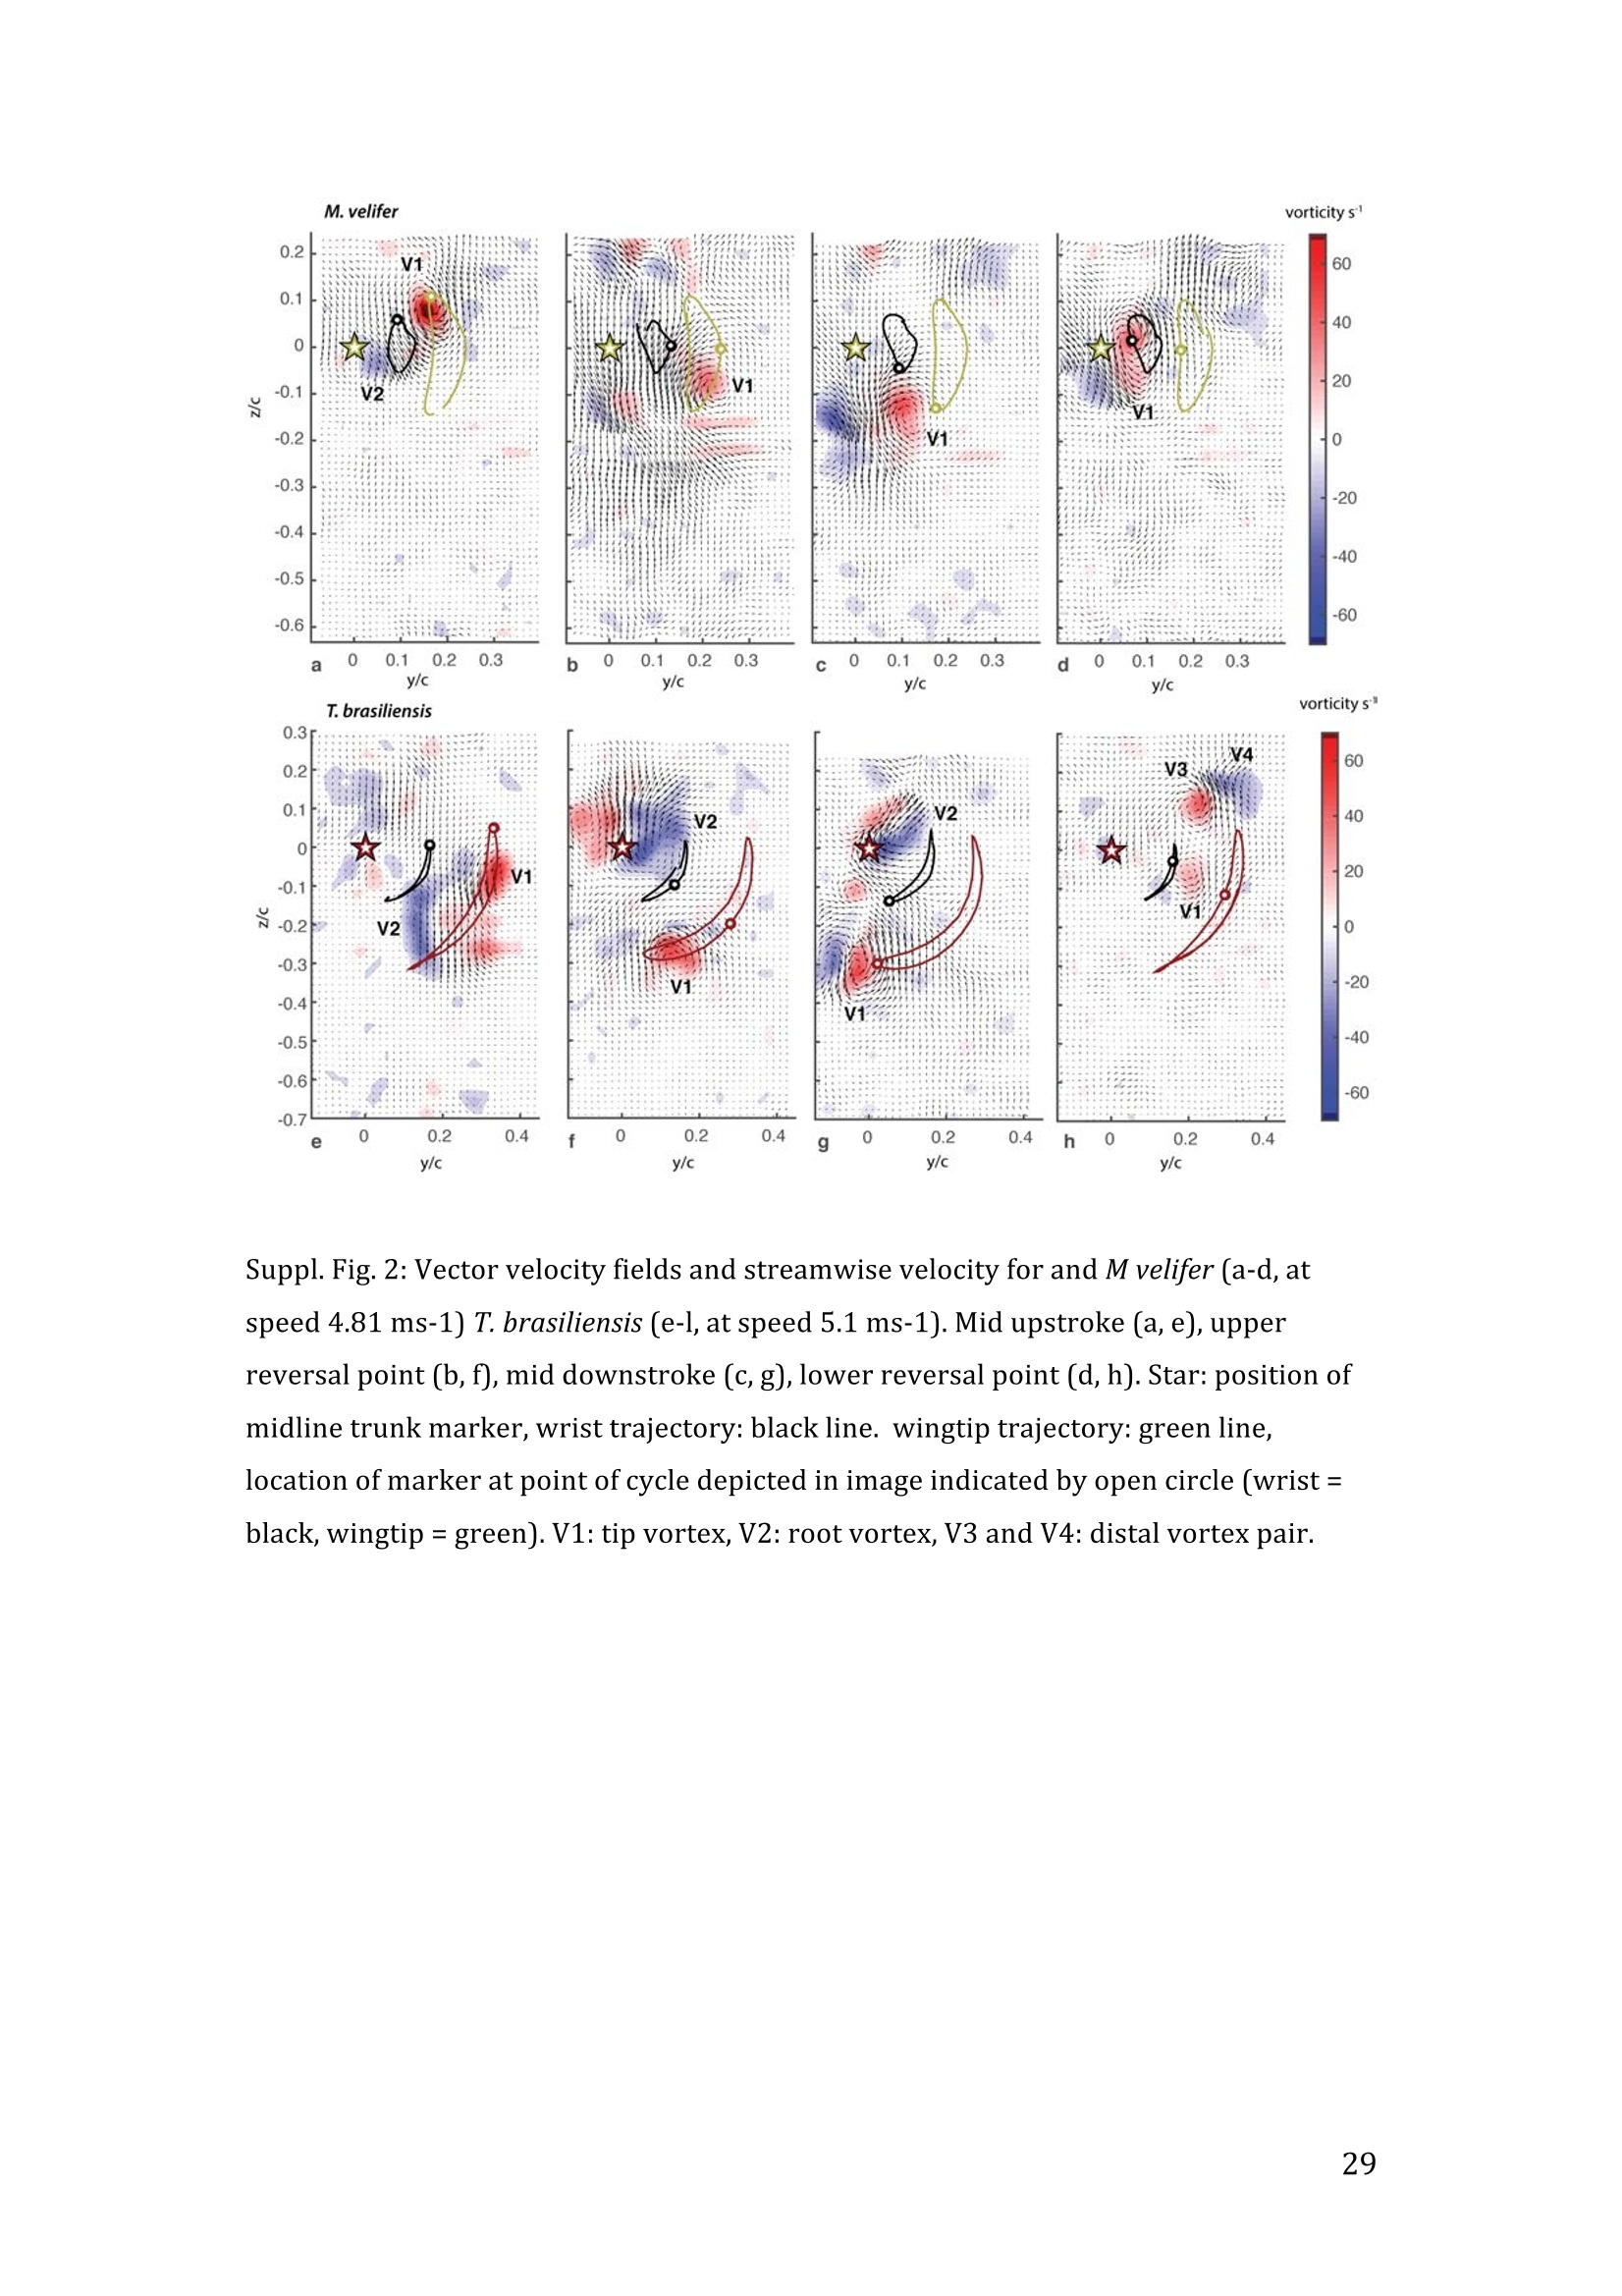
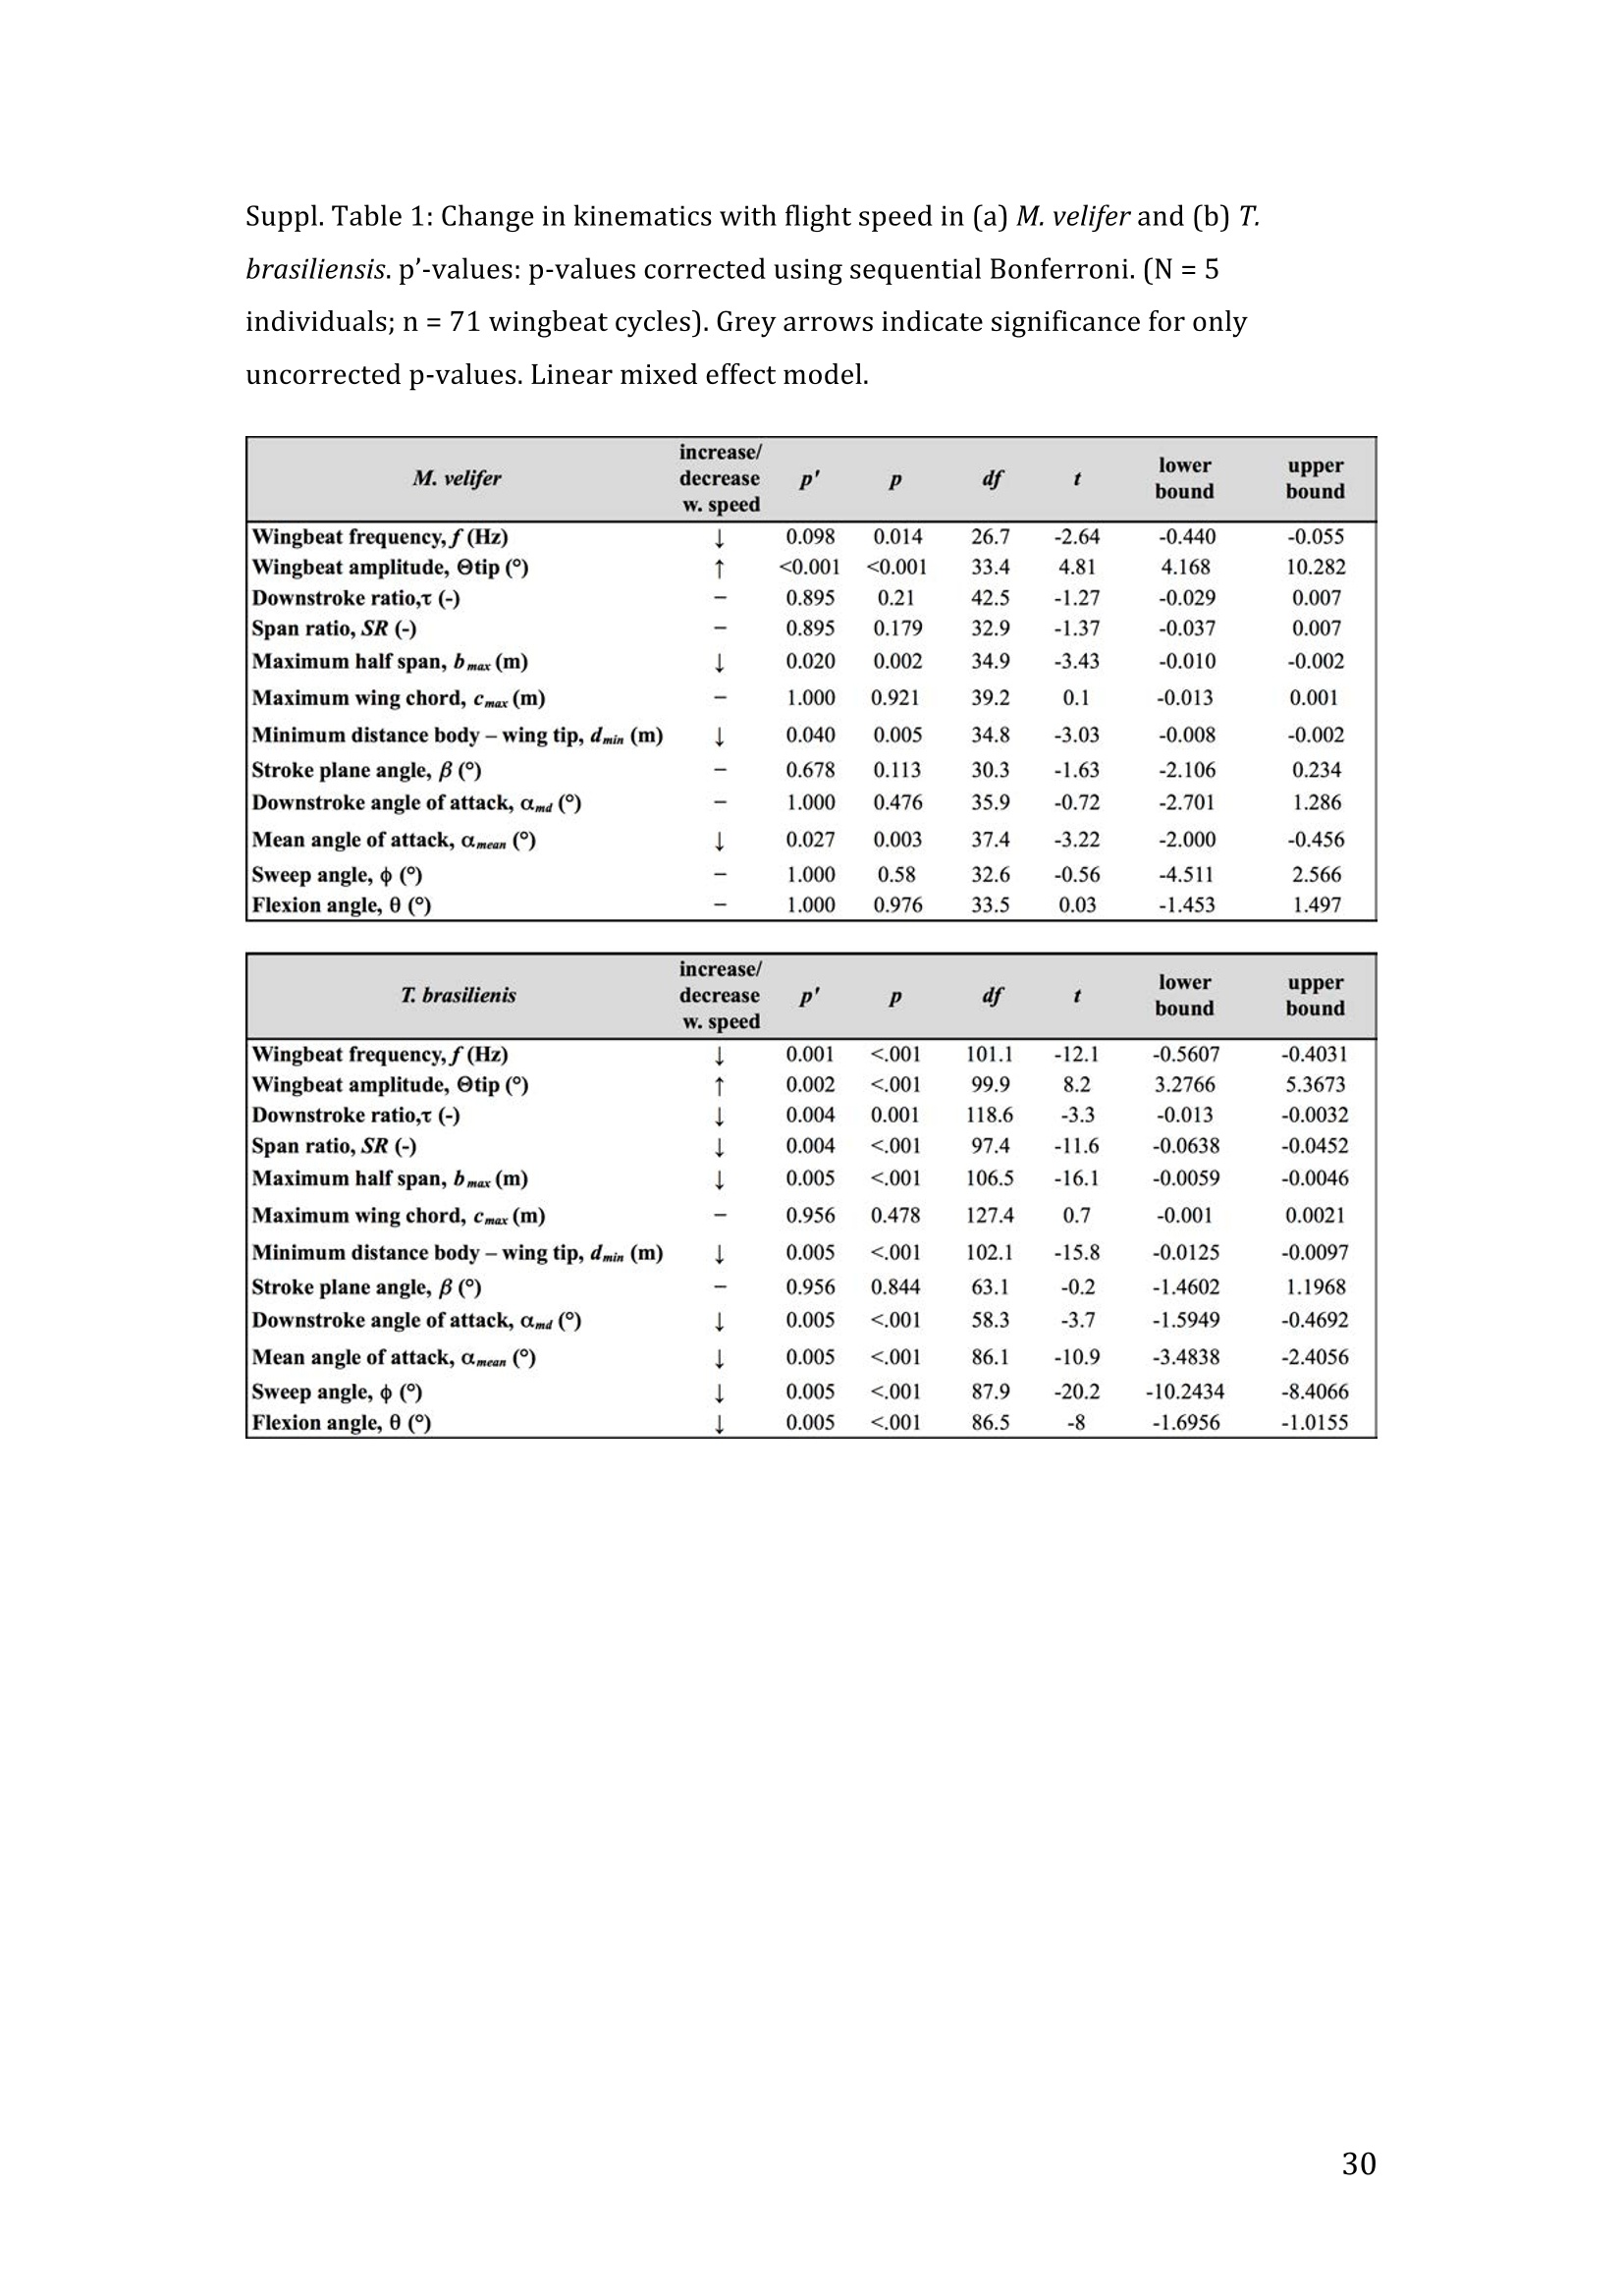
RVC OPEN ACCESS REPOSITORY- COPYRIGHT NOTICE This is the author's accepted manuscript of the following article: Hubel, T. Y., Hristov, N. I., Swartz, S. M. and Breuer,K. S. (2016) "Wake structure andkinematics in two insectivorous bats', Philosophical Transactions of the Royal Society B:Biological Sciences, 371(1704). TITLE: Wake structure and kinematics in two insectivorous bats AUTHORS: Hubel, T. Y., Hristov, N. 1., Swartz, S. M. and Breuer, K. S. JOURNAL TITLE: Philosophical Transactions of the Royal Society B: Biological Sciences PUBLICATION DATE: September 2016 PUBLISHER: Royal Society DOI: 10.1098/rstb.2015.0385 Veterinary College University of London Wake structure and kinematics in twoinsectivorous bats Tatjana Y. Hubell, Nickolay I. Hristov, Sharon M. Swartz, Kenneth S. Breuer School of Engineering, and ’Department of Ecology and Evolutionary Biology, Brown University,Providence, RI 02912,USA Structure and Motion Laboratory, Royal Veterinary College, Hatfield AL97TA, UK "Center for Design Innovation, Winston Salem, NC 27101-4019, USA Keywords: bat flight, wake structure, flapping flight ABSTRACT We compare kinematics and wake structure over a range of flight speeds (4.0-8.2 ms) for two bats that pursue insect prey aerially, Tadarida brasiliensis and Myotisvelifer. Body mass and wingspan are similar in these species, but M. velifer hasbroader wings and lower wing loading. By using high speed videography and particleimage velocimetry of steady flight in a wind tunnel, we show that 3D kinematics andwake structure are similar in the two species at the higher speeds studied, but differ atlower speeds. At lower speeds, the two species show significant differences in meanangle of attack, body-wingtip distance and sweep angle. The distinct body vortex seenat low speed in T. brasiliensis and other bats studied to date is considerably weaker orabsent in M. velifer. We suggest that this could be influenced by morphology: 1) thenarrower thorax in this species likely reduces the body-induced discontinuity incirculation between the two wings; and 2) the wing loading is lower, hence the liftcoefficient required for weight support is lower. As a result, in M. velifer, there maybe a decreased disruption in the lift generation between the body and the wing and thestrength of the characteristic root vortex is greatly diminished, both suggestingincreased flight efficiency. To fly, animals face a host of physical and biological challenges. The rich diversity ofextant flapping flyers encompasses many variations on basic themes,whether oneconsiders aerodynamic force production, control of trajectories in three-dimensionalaerial environments, or how flight is employed to obtain food, escape predation orinjury, and to reproduce. As the comparative biology of animal flight continues tomature, it has been possible to discern important commonalities in how flying animalsinteract with the physical world. For example, insects, bats, and birds cruise at similarStrouhal numbers (St=frequencyxamplitude/speed; predictor of the unsteadiness ofthe flow over the wing) [1]; passive rotational damping plays a key role in turningdynamics for all flying animals studied to date [2]; and for some modes of flight, highlift is generated by a stable leading edge vortex in multiple kinds of animals [3-7]. Within these basic similarities, however, distinct differences occur among flyinganimals at many levels of organization. Body size profoundly influences multipleaspects of flight, from fluid dynamics to muscle physiology to wing loading. Henceflight is experienced quite differently by insects with wings less than one mm inlength (e.g.[8]) compared to large migratory birds or raptors (e.g.[9, 10]). Becausethe four known evolutionary origins of flight are phylogenetically distant, the basicanatomy and material composition of the flight apparatus are fundamentally differentin insects, pterosaurs, birds, and bats. Major differences in the mechanical propertiesof wing tissues can be observed among groups of flying animals (see, for example,[11-15]), and these have significant consequences for flight function. Details ofpatterns of wing motion, too, differ between insects, birds, and bats. At a finertaxonomic scale, within each of the major lineages of flying animals, wingbeatkinematics can vary substantially among species (e.g.[16-18]). Similarly,someaspects of wake architecture may be characteristic of insects, birds, or bats (see [7]),but there is variation within each group that appears to be associated with kinematics,wing morphology or both (insects: hawkmoths[19]vs locusts[19, 20]; birds:blackcaps[21] vs. swifts[22]; bats: Pallas’long-tonged bats[23] vs Brazilian free-tailed bats [24]). Morphology, kinematics and flight performance are interrelated, and may beassociated with diverse aspects of a given species’ecology [25]. However, althoughcorrelations between wing geometry and ecology have been sought for severaldecades (e.g.[25-29], the power of detailed fluid dynamics analysis to improveunderstanding of functional differences between species whose flight apparatus sharesmany similarities has yet to be fully realized (but see [20,30]). The choice of study species that exemplify particular traits, from lineages of knownphylogenetic relatedness, can provide new insight into associations among wingstructure, aerodynamics, and flight capabilities. To date, all but one of the bat specieswhose wakes have been studied in detail have been similar in feeding ecology (fruit-and nectar-feeding) and were drawn from two rather distantly related families, thePteropodidae and Phyllostomidae [23, 31-34].Species of these two families generallyhave short wings and relatively high wing loading [25, 35] and have similar wakestructure over the wingbeat cycle. In contrast, the molossid Tadarida brasiliensis, theBrazilian free-tailed bat, differs from frugivores and nectarivores in flight ecology,wing kinematics, morphology, and wake dynamics [24, 25]. This aerial hunterresembles the common swift (Apus apus) in wing form and wake architecture [24,36]. This suggests that in both birds and bats, ecology, flight performance,morphology and aerodynamics can show common patterns of interrelationship,despite fundamental differences in the structure ofthe flight apparatus in thesedistantly related flying vertebrates [24]. Here we explore whether there are differences in kinematics and wake structurebetween two bat species whose ecology is broadly similar but differs in notable wayson a finer scale. For this comparison, we chose species from distantly related families:Myotis velifer (Vespertilionidae) and Tadarida brasiliensis (Molossidae), who lastshared a common ancestor more than 50 million years ago [37]. The two species oftenshare roost sites, are comparable in weight and wingspan and are aerial insectivores,catching their prey on the wing. T. brasiliensis is known for its migration and ability to commute long distances forfeeding [38-40]. It forages in open spaces high above the ground with fast straightflight [41, 42]. Bats of this species possess relatively high wing loading and aspectratio, as well as pointed wing tips, and it has been proposed that these traits could be associated with great agility (rate at which turns can be initiated) and high efficiencywhen flying at higher speeds [25, 43,44]. However, this wing shape requires higherflight speeds to generate sufficient lift to support body weight, suggesting they mayalso possess lower maneuverability (turning radius at given speed) and poorerperformance at lower speeds [25]. In contrast, M.velifer does not migrate, and insteadhibernates in winter. This species hunts closer to the ground, where it likelyencounters more obstacles, such as vegetation and rock formations [45]. It has beenreported that the flight of M. velifer is more direct, with less flutter, than that of otherspecies of the genus [39], but not as straight as T. brasiliensis. M. velifer shows aslightly higher aspect ratio than average, though still lower than T. brasiliensis[46].M. velifer’s low wing loading, relatively long wings and round wing tips arehypothesized to be associated with slow, economic and maneuverable flight [25, 43,471. In this study we compare the kinematics and wake architecture of M. velifer and T.brasiliensis, and hypothesise that these will reflect differences in wing shape andecology of these two species. We also explored flight speed-dependence of thedifferences between the species. Due to their ecology,we expected that the migratoryT. brasiliensis might be more tuned towards fast flight, while M. velifer would favourslightly lower speeds. We discuss our findings in the context of similar studies on batswith different ecology and morphology (fruit- and nectar-feeding) and birds withsimilar aerial foraging strategies. MATERIALS AND METHODS We used particle image velocimetry (PIV) and high speed videography to investigatethe wake structure of two bat species,M. velifer and T. brasiliensis. Wake structureand kinematics for T. brasiliensis have previously been published [24]. Bats We compared wake structure in M. velifer (three female and one male) to that of T.brasiliensis (two females and three males). All bats were wild-caught at the samecave in Texas in April 2009. Morphological descriptors of each individual were extracted from high speed video offlights at low speed (all trials < 5.5 ms) using the direct linear transformation (DLT)method[48] for 3D reconstruction. We selected the point of the wingbeat cycle at which wing extension was greatest,typically close to the middle of the downstroke. Half wingspan (b) was defined as themaximum distance between the point midway between the scapulae and the wingtipat mid-downstroke, and wing chord (c) as the maximum distance between wrist andthe tip of the fifth digit (Fig. 1). Wing area (S) was the area enclosed by markers atthe midline point between the scapulae, wrist, wingtip, tip of the digit V, and foot. Toassess the effect of estimating area by five points instead of the wing outline, wecompared area estimated by these two alternatives from dorsal views of low speedflights (one per bat, Fig. 2). Images were selected at maximum wing extension duringthe downstroke and processed using Adobe Illustrator (Adobe, San Jose, CA). Wingarea estimated from a full outline was 1.4% smaller compared to the five point-estimate for T. brasiliensis and 0.7% for M. velifer. We deemed this differenceinsubstantial relative to the additional data processing required to compute wing areaby the full outline method. We computed aspect ratio (AR) as 2*(b/S), and wing loading (Q) as 0.5*mg/S. Tailarea and width of the trunk were extracted from the dorsal view of one trial perindividual at low speed (Fig.2). We calculated means and standard deviations foreach bat for chord, half wingspan, body mass, wing area, aspect ratio, and wingloading from all complete wingbeat cycles in trials at speeds between 4.0 ms’ and 5.5ms(Table 1). Values for morphological parameters such as wingspan and chordmeasured in this manner in flight can differ from those measured on bats placed in amaximally flattened posture with wing joints maximally extended, but are moredirectly relevant for specific flight conditions under study [49]. Bats were trained to fly over a range of speeds (4.0-8.2 ms’) in the wind tunnel atBrown University (test section 0.60 by 0.82 by 3.8 m height x width xlength)[24].Synchronized PIV and high speed video recordings were carried out for all studysubjects. The illumination plane of the PIV laser (Litron LPY 703-200, 200 Hz) wasoriented perpendicular to the free stream and particles of DEHS (di-ethyl-hexyl-sebacate) were used for seeding. Two PIV cameras (Photron 1024 PCI, 1024 x1024 pixel, lens 85 mm, f/1.4) were positioned downstream from the bats in the testsection, stacked vertically to capture slightly overlapping images, yielding acomposite image with final size of 0.25 m x 0.45 m (width xheight). Kinematics wererecorded by three high-speed video cameras (Photron 1024 PCI, 200Hz, shutter speed1/1000 s) positioned outside the wind tunnel. 3-D kinematics were reconstructed fromfive anatomical markers: dorsal midline (between scapulae), wrist, tip of 3d and 5hdigits, and foot (Fig. 1a), using the DLT method.PIV and kinematics were sampled at200 Hz, producing approximately 25-40 recordings per wingbeat. Although stationary feeders can be used to train nectar-feeding bats to fly at a givenposition in a wind tunnel, this approach is not appropriate to insectivorous bats.Instead, the bats flew upstream through the test section somewhat faster than the freestream velocity, although far more slowly than in the presence of no wind. Theysubsequently landed on a mesh screen after they passed through the measurementvolume. The bat was released in front of the PIV cameras and recording was triggeredmanually after the bat passed the position of the laser sheet. Net or total flight speed(U;) was the sum of wind tunnel and forward flight speeds. The synchronizationbetween kinematic and PIV measurements required correction of the“Doppler shift"in the time-resolved PIV fields due to the additional speed of the bats flying towardsthe front of the wind tunnel [32]. Trials were saved for analysis only when the bat flew straight and level in the middleof the wind tunnel test section, and within the limited observation area of the PIVsystem. Approximately one in five trials were usable. Bats flew up to 15 times in onesession, and individuals rested at least one day between sessions. Flights wererewarded with a mealworm. The bat’s weight was measured before the first flight andadjusted by the weight of the mealworms consumed over the course oftheexperiment. We collected an average of 20 usable trials per individual for T.brasiliensis and about 9 usable trials per individual for M. velifer. Both species flewover range of speeds with M. velifer covering speeds between 3.8 and 8.2 ms and T.brasiliensis covering speeds between 4.0 and 9.3 ms. We only comparedoverlapping speeds from 4.0 ms to 8.2 ms, removing one trial below 4.0 ms fromM. velifer and 10 trials above 8.2 ms from the original T. brasiliensis dataset [24]. PIV analysis software, DaVis v. 7.2 (LaVision Inc., Ypsilanti, MI, USA) was used togenerate the velocity vector fields by applying sequential cross-correlation with multi-pass iterations in decreasing size (128x128 pixel, 2 iterations to 64x64 pixel, 2iterations, 50% overlap). Vectors with a peak ratio Q of< 1.2 and an averageneighbourhood variation of>1.5 × rms were replaced by post-processing interpolationand the application of a simple 3×3 smoothing filter. Vector fields were thenexported and further processing was conducted in MATLAB (Mathworks Inc.,Natick, MA,USA). Vorticity and swirl were computed to visualize wake structures [24, 33, 50]. Vectorfields and vorticity were displayed using a +5 svorticity threshold (<5% ofmaximum vorticity value in trial) to reduce noise. Swirl is closely related to velocity,but distinguishes between shear and rotation [50 ]. By using positive swirl values,thus only displaying rotational information, noise is greatly reduced in the isosurfacereconstructions. Vorticity was smoothed using a 3×3 smoothing filter, swirl wascalculated, and a threshold of 25 (<1% of maximum swirl value in trial) was appliedto eliminate remaining noise. The rotational direction and circulation was determinedfrom vorticity. Four vortices have been identified in the typical wake of bats [33, 51]: a wingtipvortex, a wing root vortex and a distal wing vortex pair. The circulation for eachvortex, over the course of the wingbeat cycle, was calculated by identifying the vortexlocation manually and integrating vorticity over the surrounding adjacent area afterapplying a 5 sthreshold. Results are presented in a body-centred coordinate system, or a combination ofglobal- and body-centred systems. Both reference frames are based on right-handedcoordinate systems with positive x in wind direction, positive z in vertical or upwarddirection, and positive y in the direction of the right wingtip from the centre of thebat’s body. The origin of the bat-centred system is the mid-body marker, and theglobal coordinate system originates at the position of the laser light sheet. Kinematics were analysed by interpolating information to 40 time points per wingbeatcycle, starting at the upper reversal point of the wingtip. Two surface planes weredefined to characterize 3D wing orientation (Fig. 1a): the armwing, defined by wrist,sternum and 5 digit, and handwing, defined by wrist, digit V and wing tip. Thefollowing parameters were calculated (Fig. 1): Flapping frequency, f, wingbeats per second Downstroke ratio,t, downstroke period/total wingbeat period, defined by verticalwingtip motion Wing stroke amplitude, tip, maximum angle of excursion of shoulder to wingtipover the wingbeat cycle Span ratio,SR, ratio of upstroke to downstroke wingspan when the wing passedthrough the horizontal plane (Fig.1b) Stroke plane angle, B, angle between a line connecting the wingtip at the upper andlower reversal point in the side view (xz plane) relative to the horizontal Angle of attack, a, the angle between the armwing surface and the effective airvelocity, the vector sum of net bat speed (U;), and wing velocity (Fig.1c) (amd isat mid-downstroke and &mean is the average a over the wingbeat cycle) Wrist sweep angle, d, rotation of the handwing relative to the armwing, along the axisdefined by wrist and the fifth digit (decrease in d is a backwards sweepingmotion) Wrist flexion angle, O, rotation of the handwing in the axis perpendicular to thearmwing (angle above 180° corresponds to downward flexion) We analysed no more than three wing beat cycles per trial, for a total of 215 wingbeat cycles (99 trials) for T. brasiliensis and 70 wing beat cycles (35 trials) for M.velifer. A significance level of 5% was used for all tests, which were performed usingSPSS 17.0 (SPSS Inc., Chicago,IL, USA). Bats flew at a range of speeds not strictly defined by wind tunnel airspeed due to theirmovement upstream. We first explored the relationship between flight parameters andspeed for each species separately, treating speed as a continuous variable (Suppl.Table 1, [24]). We employed a mixed-effect model with reduced maximum likelihood estimates of the variance (REML). Wingbeat cycle was treated as a repeated measureand individual as a random effect. To counteract the problem of multiplecomparisons, p-values were corrected using the sequential Holm-Bonferroni method(p’-values). We then explored the data further by comparing species, as well asallowing for polynomial functions of second and third order in case of a non-linearrelationship between parameter and speed [52]. Best fit was determined based on log-likelihood ratio (-2LL) (Fig.3). To visualize differences in dynamics and kinematics in relation to speed and tofacilitate comparison between the two species (Table 2), we grouped trials into threenet flight speed categories: low, 4.0 to 5.5 ms ; medium, 5.5 msto 7 ms and high,7 ms to 8.2 ms. Because M. velifer and T. brasiliensis differ little in body mass, wedid not normalize the data by flight speed or wing chord. Wing chord-normalisedkinematics are presented in supplementary material (Suppl. Fig. 1). A mixed-effectmodel with individual as random effect, wingbeat cycle as repeated measure, speciesas fixed effect, and Holm-Bonferroni correction, was used to compare kinematicparameters among the speed groups. To compare wing trajectories and circulationamong groups graphically, we first computed averages of the respective variables forall wingbeat cycles within a trial, then averaged all trials for each bat beforecomputing averages for all bats (see Fig. 4,6). Standard errors are calculated overindividuals. RESULTS Kinematics Those flight parameters that change significantly with flight speed change less in M.velifer than T. brasiliensis (Fig. 3). In addition, the two species differ substantiallymore in their kinematics at low speed (Fig.3). Although variation in flight parameters with flight speed is subtle, several parameterschange significantly in M. velifer (Suppl. Table 1, speed treated as continuousvariable). Maximum half wingspan (p’=0.020), minimum body-wingtip distance(p’=0.040), and mean angle of attack (p’=0.027) decrease with increasing flight speed, while wingbeat amplitude increases (p’<0.001). Frequency (p’=0.098), spanratio (p’=0.895), downstroke angle of attack (p’=1.000), sweep (p’=1.000) andflexion (p’=1.000) angles, downstroke ratio (p’=0.895), stroke plane angle(p’=0.678), wing chord (p’=1.000) do not change significantly with flight speed. Incontrast, in T. brasiliensis, all kinematic parameters except stroke plane angle(p’=0.956) and maximum wing chord (p’=0.956) change significantly with speed.Frequency (p’=0.001), downstroke ratio (p’=0.004), span ratio (p’=0.004), maximumspan (p’=0.005), minimum body-wingtip distance (p’=0.005), downstroke angle ofattack (p’=0.005), mean angle of attack (p’=0.005), sweep angle (p’=0.005) andflexion angle(p’=0.005) all decreased, while wingbeat amplitude(p’=0.002) was theonly parameter that increased significantly (Suppl. Table 1, [24]). Closer examination of the differences between flight speeds as well as betweenspecies were achieved separating kinematics into three flight speed categories. Wingposition trajectories confirm that the large-scale spatial geometry of wingbeatkinematics changes little with speed at the velocities we assessed in M. velifer (Fig.4a-f,g,i,k, Suppl. Table 1, Table 2). We observed a small shift in absolute position ofwingtip and wrist as observed from above, but no accompanying change in pattern ofmotion (Fig.4c,f). Differences between speeds are more pronounced in T.brasiliensis, apparent in the much more extended wing during the upstroke at lowspeeds (Fig. 4a,d,h,j). M. velifer shows less speed-dependent variation in trajectory ofthe wrist and digits, wing flexion, sweep angle, and angle of attack than T.brasiliensis (Fig. 4). Stroke plane is almost vertical in both M. velifer and T.brasiliensis, and does not change significantly with speed in either species (see aboveand Suppl. Table 1), nor does this angle differ significantly between the two species(p=0.102, Fig. 3h; also see Fig. 4b,e; Table 2). In all, kinematics in M. velifer and T. brasiliensis are very similar. When specifickinematic parameters are compared within each speed class, using the mixed effectmodel with Bonferroni correction (Table 2), no significant difference remains atmedium speed and only the angle of attack at mid-downstroke (0md,p’0.001) andmean angle of attack (&mean,p’<0.001) differ significantly at high speeds. The maindifference between the two species occurs at low speeds, with significant differencesin mean angle of attack (Omean,p’=0.04), body-wingtip distance (p’0.001) and sweep angle (p’=0.018), which are greater in T. brasiliensis than M. velifer. The wakes of M.velifer, visualized from the 2D velocity fields and their subsequent3D reconstructions, were characterized by the vortex structures typically observed inthe wakes of flying bats: a tip vortex (V1), a near-body or root vortex (V2), and adistal vortex pair (V3, V4) observed at the end of the upstroke [23,24,32-34,51,53](Fig.5, Suppl. Fig. 2). Wake patterns of individual wing beat cycles showedconsiderable variation, even at similar speeds, but a general pattern can be discernedwithin the variation. At low speeds, the wingtip vortex was usually present throughoutthe wingbeat cycle. At moderate and higher speeds, the tip vortex was often greatlydiminished during the upstroke, sometimes to a degree that it was no longerdetectable, suggesting that part of the upstroke is aerodynamically passive. The rootvortex, shed from wing root at the base of the wing at the body wall, and a distalvortex pair (also known as a “reverse vortex loop”) were detected in some of the trialsat all speeds, but frequently fell below the detection threshold of vorticity and swirl.Their occurrence and strength (circulation) diminished as speed increased. Based onthe vorticity field, we determined occurrence (O, reported as percentage of all trialswithin speed group) for the root vortex and distal vortex pair in the three speedcategories for both M. velifer and T. brasiliensis (Table 3). Vortex structure variedwith speed in both M. velifer and T. brasiliensis (Fig.5,Fig. 6). The wakes of M.velifer and T. brasiliensis are similar at high speed, where both species arecharacterized by wakes dominated by a tip vortex that has notable circulationprimarily during the downstroke and little vorticity in the upstroke. They are lesssimilar at lower speeds, in which M. velifer often lacks a detectable root vortex, and inthe 50% of trials in which it is visible, it is always considerably weaker than in T.brasiliensis (Fig.6). DISCUSSION Flying animals vary greatly in the architecture of the flight apparatus and theirlocomotor capabilities. Analyses of wake structure and kinematics can provide insightinto the determinants of flight performance that can facilitate comparisons amongdiverse fliers [20, 24, 54]. Specifically, the nature of the wake vortices reveals details of aerodynamic force production. Researchers have observed some structural featuresin the wakes of most bat species studied to date, particularly wingtip, wing root anddistal paired vortices, for flight behaviour from hovering to moderately high speeds. Strong tip vortices are universally present throughout bat downstrokes, confirmingtheir dominant role as a signature of lift generation [23, 24,31, 33]. In most cases, tipvortices persist through the upstroke although they decline in strength, indicating thatthe upstroke as well as the downstroke is aerodynamically active [31, 33]. However,in T. brasiliensis, at high flight speeds, the tip vortex is greatly diminished or absentfor a substantial part of the upstroke, indicating that it is largely aerodynamicallypassive [241. Root vortices indicate diminished lift generation over the body relative to the wings;in extreme cases, the body generates no lift, and each wing operates as an independentlifting surface [20, 33, 55, 56]. In this case, root vortices have the same strength as thetip vortices. The distal vortex pair indicates negative lift generation at the distal partof the wing by showing a reversed rotational direction relative to the tip and rootvortex pair [51], and it arises at the end of the upstroke, when negative angles ofattack are high at the distal part of the wing. Both T. brasiliensis and M. velifer showwingtip, root, and paired distal vortices to various degrees and depending on flightspeeds. The wake structure is directly related to kinematics and morphology; kinematicsmight be a direct result of the morphology, but it is difficult to separate these factors.Our detailed analysis shows M. velifer and T. brasiliensis are similar in kinematicsand wake structure at higher speeds, but show notable differences at lower speeds(Fig. 3,4,Table 2). Despite those differences at low speeds, the flight style of theseinsectivorous aerial hunters looks similar when compared to that of the frugivorousCynopterus brachyotis [32, 33] from the family Pteropodidae (Suppl. Movie 1,previously compared to T. brasiliensis [24]). Both insectivores employ an almostvertical stroke plane over a range of flight speeds (Fig. 3, Table 2, Suppl. Table 1).This contrasts with the angled and speed-dependent stroke planes of diversefrugivorous pteropodid bats, distantly related to the focal taxa of this study, whodiverged from other bat families more than 55 mya [37, 49]. This effect is not solely phylogenetic; kinematics of phyllostomid fruit- and nectar-feeding bats Glossophagasoricina [57], Leptonycteris yerbabuenae [52], Carollia perspicillata and Artibeusjamaicensis (unpublished data) are similar to those of pteropodids [49] and not to thespecies in this study (see Suppl. Movie 1-4). In particular, they all show relativelytilted stroke planes, especially at low flight speeds, and substantial flexion in thehandwing [52,57]. Previous studies suggest fruit- and nectar-feeding bats shed root vortices over a broadrange of flight speeds [23, 33]. Both aerial hunters in this study show only very weakor non-detectable root vortices at high flight speeds. Moreover, while T. brasiliensisgenerates strong root vortices at low speed, M. velifer shows little or no vorticity atthe wing root at low speed (Table 3, Fig.5,6). Weak root vortices over a range ofspeeds, as shown by M. velifer, have previously been observed in the pied flycatchers(Ficedula hypoleuca) and the blackcaps (Sylvia atricapilla) [4, 21]. An ideal wing has an elliptical circulation distribution and generates a uniformdownwash [58, 59]. Span efficiency, a measure of deviation from this ideal, hasrecently been used to quantify differences in flight performance between species [4,20, 54]. The instrumentation configuration employed in these experiments (varyingdistance between the animal and the PIV plane, and the relatively small half-spanmeasurement volume) does not allow sufficiently high resolution quantification ofspan efficiency. Deformation of the wake and the large variation of the wingspanduring the stroke cycle can introduce errors in the determination of both lift and spanefficiency [19, 20]. However, although quantitative assessment of aerodynamicefficiency was not feasible, qualitative assessment, using the wake structure, waspossible. Root vortices have been observed in diverse taxa [21,24,31-33,36,56, 60,61]; they indicate that the circulation over the body is less than over the wings, andhave been linked to either a broad body disrupting the downwash profile [56] or thepetiolation of the wing [61]. While span efficiency is not a direct measure of flightefficiency, because it neglects analysis of parasite and profile drag, it has been shownto be a good indicator of flight cost [20]. Lower span efficiency (due to lower bodylift) is understood to result in a lower lift-to-drag ratio and therefore highermechanical cost of transport [54]. Span efficiency estimates are less compelling as performance metrics for bodies with very unfavourable lift-to-drag ratios, especiallyat higher speeds, at which parasite and profile drag increase. The lack of root vortices at higher speeds in M. velifer and T.brasiliensis suggestsefficient flight in both species and corresponds to the predicted low cost of transportin the migratory T.brasiliensis at its ranging speeds.M. velifer is similar, however, toT. brasiliensis in this respect, despite its different flight ecology, which, based oncurrent records, does not include extensive commuting flight. We suggest thatcomparisons of flight efficiency at the upper extreme of free-flight speed ranges,exceeding the speeds measured in this study, might be particularly informative. Strong root vortices appear in T. brasiliensis at lower speeds, at which M. velifershows much weaker (lower circulation) and less frequent root vortices. This contrastin wake architecture between the two insectivorous bats suggests a larger differencebetween body and wing circulation for T. brasiliensis than M. velifer. This differencemight arise from any of a number of mechanisms,including differences in liftgeneration by the body and/or tail surfaces, differences in body width, or differencesin wing loading. Each of these is considered in the following discussion. Tails play a significant role in lift generation in birds, especially at lower speeds,evidenced by the generation of a distinct tail vortex pair [4, 36]. However, unlike thatof birds, the bat tail is connected to the wings via the legs and therefore does not havethe potential to be an independent control and lifting surface. Bat species studied todate have little or no tail membrane and bat wakes show no evidence of significantaerodynamic function for the tail [23, 33,51].However, both M. velifer and T.brasiliensis possess substantial tail membranes, and, in common with manyinsectivorous bats, use tail membranes to capture prey. The ratio of tail to wing area issimilar in the two species, (T. brasiliensis: 7.3±0.9%;M. velifer: 6.6±0.6%), andneither showed evidence of tail vortices at any speed. However, we cannotunequivocally exclude that interspecific differences in tail membrane morphology,such as aspect ratio, could influence the wake structure near the body. Both species show a low angle of body and tail (see Suppl. Movie 1) at all flightspeeds, an observation confirmed when using the foot-body angle as approximation (Fig. 4a-f). Although this approximation has to be treated with some caution, averagefoot-body angle over the wingbeat cycle suggests a slightly steeper angle for M.velifer (T. brasiliensis: 3.2± 5.3°; M. velifer: 9.0±5.1°) which would be better for liftgeneration, and would thus result in weaker root vortices at low speed than observedin T. brasiliensis. A second potential explanation for the differences in root vortexstructure could be that the body of T. brasiliensis is wider than that ofM. velifer,which may result in a bigger disruption between the wings (body width 13.8±0.77%of mid-downstroke wingspan in T. brasiliensis, N=5;9.5±0.9% in M. velifer, N=4) (Fig. 2). Lastly, differences in wing loading could contribute to the differences inthe root vortex strength at low speed. It has been estimated that wing loading, Q, isalmost twice as high for T. brasiliensis as M. velifer [25]. This parameter can,however, vary substantially depending on the measurement method and current bodyweight, which fluctuates with many factors. Using the maximum wing area measuredin-flight (not including body and tail), our measurements suggest approximately 20%lower wing loading in M. velifer than T. brasiliensis (11.1 ±2.1 vs 14.4±2.5 N/m),primarily due to lower body mass, coupled with larger wing chord (Table 1).Although the wing circulation, I, for both species is comparable (To gc), thecoefficient of lift, CL, which scales with wing loading at a given speed, is significantlylower in M. velifer. This reasoning suggests that the induced drag coefficient, CDi,which correlates with the strength of the tip and root vortices, is sharply reduced in M.velifer (CDiCzIAR). This argument is further supported by the observation that T.brasiliensis generally shows higher angles of attack than M. velifer, consistent withthe generation of a lower coefficient of lift. Comparing M. velifer and T. brasiliensis with two aerial hunting birds (the piedflycatcher [4] and the swift [36]) shows a similar relationship between the bat andbird pairs. Both birds are aerial hunters, but like M. velifer, the pied flycatcher huntscloser to the ground [62] and has a lower aspect ratio and lower wing loading than theswift [4, 36].Like M. velifer, the pied flycatcher shows rather weak root vortices atboth lower and higher speeds (3 ms’and 7 ms`), while swifts have strong rootvortices at speeds between 5.7-9.9 ms. Assuming a correlation between wingloading and root vortices, one might speculate that in swifts, root vortices are preserved in at higher speeds due to considerably higher wing loading than any of theother species (approx. 26 Nm). Both insectivorous bats show wake structures that are associated with economic flightat higher speeds. This comes as no surprise for T. brasiliensis given their extendedtravel distances. At lower speeds, M. velifer seems to have better flight efficiency,indicated by the lack of root vortices, than T. brasiliensis. However, the complicatedrelationship between flight performance, morphology and kinematics makes itimpossible to conclusively identify a deterministic role of the parameters weinvestigated, such as wing loading, aspect ratio, and body width on wake architecture. Based on the cases in which span efficiency has been used to compare flightperformance between species [4, 20, 54], it has been proposed that birds have superioraerodynamic performance to that of bats [54]. This conclusion relies on the fact thatthe frugivorous bat species investigated (G. soricina andL. yerbabuenae) have lowerlift generation associated with the body region than the birds (flycatchers andblackcaps), and as a result, possess relatively low span efficiency. However, the aerialhunting bats in the present study showed weak root vortices at high speeds, indicatingthe participation of the body in lift generation, and thus suggesting a higher spanefficiency, perhaps comparable to the aerial-hunting birds. This wide variation innature of bat wakes emphasizes the aeromechanical diversity of the order, andconsequently, generalisations about bat aerodynamic performance should be madewith caution. Further studies that sample a greater diversity of species are needed toelucidate the degree to which the morphologies, kinematics and aerodynamics ofbirds and bats result from phylogenetic constraints and/or ecological requirements. ACKNOWLEDGEMENTS We thank Daniel Riskin, Arnold Song and Rye Waldman for help with experiments,Barbara French and Louise Allen for expertise and help in handling bats, and AnnaWilson for comments on the manuscript. Special thanks to Jorn Cheney, CosimaSchunk and Daniel Riskin for video material. This work was supported by AFOSRand NSF. ETHICS All experiments and animal husbandry complied with a protocol approved by theBrown University IACUC and with USDA regulations. COMPETING INTERESTS We have no competing interests. REFERENCES: ( [1] Taylor, G.K.,Nudds, R.L. &Thomas, A.L.R. 2003 Flying and swimming animalscruise at a Strouhal number tuned for high power efficiency. Nature 425,707- 711. ) [2] Hedrick, T.L., Cheng, B. & Deng, X. 2009 Wingbeat Time and the Scaling ofPassive Rotational Damping in Flapping Flight. Science 324,252-255. [3] Ellington, C.P., van den Berg, C., Willmott, A.P. & Thomas, A.L.R. 1996 Leading-edge vortices in insect flight. Nature 384, 626-630. ( [4] Muijres, F.T., Bowlin, M.S., Johansson, L.C. & Hedenstrom, A. 2012 Vortexwake, downwash distribution, aerodynamic performance and wingbeatkinematics in s l ow-flying pied flycatchers. J. R . Soc. Interface 9,292-303. ) [5] Muijres,F.T., Johansson, L.C., Barfield, R., Wolf, M.,Spedding, G.R. &Hedenstrom, A. 2008 Leading-Edge Vortex Improves Lift in Slow-Flying Bats.Science 319,1250-1253. ( [6] Warrick, D.R., Tobalske, B.W. & Powers,D.R. 2009 Lift production in thehovering hummingbird. Proceedings ofthe Royal Society B: Biological Sciences 276,3747-3752. ) ( [7] Bomphrey, R.J. 2012 Advances in animal f light aerodynamics through flowmeasurement. Evolutionary Biology 39,1-11. ) ( [8] Miller, L.A. & Peskin, C.S. 2009 Fle x ible clap and fling in tiny insect flight. J. Exp. Biol. 212,3076-3090. ) ( [ 9] P ortugal, S. J ., H u bel, T.Y. , Fr i tz, J., H e ese, S., Tr o be, D., Voel k l, B., Hail e s, S.,Wilson, A.M. & Usherwood, J.R. 2014 Upwash exploitation and downwashavoidance by flap phasing in ibis formation flight. Nature 505,399-402.(doi:10.1038/nature12939). ) ( [10] Reynolds, K.V., Thomas, A.L. & Taylor, G.K. 2014 Wing tucks are a responseto atmospheric turbulence in the soaring flight of the steppe eagle Aquilanipalensis.J. R. Soc. Interface 11. (doi:10.1098/rsif.2014.0645). ) ( [11] Cheney, J., Konow, N., Middleton, K., Breuer, K., Roberts, T., Giblin, E. &Swartz, S. 2014 Membrane muscle function in the compliant wings of bats.Bioinsp. Biomim. 9 , 025007.(doi:10.1088/1748-3182/9/2/025007). ) ( [12] Laurent, C.M., Palmer,C., Boardman,R.P., Dyke, G.& Cook, R.B. 2014Nanomechanical properties of bird feather rachises: exploring naturallyoccurring fibre reinforced laminar composites.J. R. Soc. Interface 11,20140961. ) ( [13] Lingham-Soliar, T. 2014 Feather structure, biomechanics and biomimetics:the incredible lightness of being. Journal ofOrnithology 155, 323-336. ) [14] Smith, C., Herbert, R., Wootton, R. & Evans, K. 2000 The hind wing of thedesert locust (Schistocerca gregaria Forskal). II.Mechanical properties andfunctioning of the membrane.J. Exp. Biol.203,2933-2943. [15] Vincent, J.F. & Wegst, U.G. 2004 Design and mechanical properties of insectcuticle.Arthropod. Struct. Dev.33, 187-199. [16] Altshuler, D.L.,Bahlman, J.W., Dakin, R., Gaede, A.H., Goller, B., Lentink, D.,Segre, P.S. & Skandalis,D.A. 2015 The biophysics of bird flight: functionalrelationships integrate aerodynamics,morphology,kinematics, muscles, andsensors 1. Can. J. Zool. 93,961-975. [17] Dudley, R. 2002 The biomechanics ofinsect flight: form, function, evolution,Princeton University Press. [18] Swartz, S. & Konow, N. 2015 Advances in the study of bat flight: the wingand the wind. Can.J. Zool. 93,977-990. ( [19] Bomphrey, R.J., Henningsson, P.,Michaelis, D. & Hollis, D. 2012 Tomographicparticle image velocimetry of desert locust wakes: instantaneous volumescombine to reveal hidden vortex elements and rapid wake deformation. J. R. S oc.Interface 9,3378-3386. ) [20] Henningsson, P. & Bomphrey, R.J. 2013 Span efficiency in hawkmoths. J. R.Soc. Interface 10, 1742-5662 (doi:10.1098/rsif.2013.0099. ( [21] Johansson, L.C. & Hedenstrom, A. 2009 The vortex wake of blackcaps (Sylviaatricapilla L.) measured using high-speed digital particle image velocimetry(DPIV).J.Exp. Biol. 212,3365-3376. ) ( [22] Henningsson, P. & Hedenstrom,A. 2011 Aerodynamics of gliding flight incommon sw i fts. J. Exp. Biol. 214,382-393. ) ( [23]Muijres, F.T., Johansson, L.C., Winter, Y. & Hedenstrom, A. 2011 Comparativeaerodynamic performance of flapping flight in two bat species using time-resolved wake visualization. J. R. Soc. Interface 211, 2909-2918. ) ( [24] Hubel, T.Y. , Hristov, N .I., Swartz, S.M. & Breuer, K.S. 2 012 Changes inkinematics and aerodynamics over a range of speeds in Tadarida brasiliensis, theBrazilian free-tailed b a t.J. R. Soc. Interface 9, 1120-1130. ) ( [25] Norberg, U.M. & Rayner, J.M.V. 1987 Ecological morphology and flight inbats (Mammalia; Chiroptera: wing adaptations, flight performance, foragingstrategy and echolocation. Phil. Trans. R. Soc. Lond. B 316,335-427. ) ( [26] Brewer, M.L. & Hertel, F. 2007 Wing morphology and flight behavior ofpelecaniform seabirds.J.Morphol.268,866-877. ) ( [27] Johansson, F.,Soderquist, M. & Bokma, F. 2009 Insect wing shape evolution:independent effects of migratory and mate guarding flight on dragonfly wings.Biol. J. Linn. Soc. 97,362-372. ) ( [28]Lockwood, R., Swaddle, J.P. & Rayner, J.M. 1998 Avian wingtip shapereconsidered: wingtip shape indices and morphological adaptations tom -79? igration. J. Avian Biol., 273-292. ) [29] Marchetti, K., Price, T. & Richman, A. 1995 Correlates of wing morphologywith foraging behaviour and migration distance in the genus Phylloscopus.J.Avian Biol.,177-181. ( [30] Muijres, F.T.,Spedding, G.R., Winter, Y.& Hedenstrom, A. 2011 Actuator diskmodel and span efficiency of flapping flight in bats based on time-resolved PIVmeasurements.Exp. Fluids 51,511-525. ) [31] Hedenstrom, A., Muijres, F., von Busse, R., Johansson,L., Winter, Y. &Spedding, G. 2009 High-speed stereo DPIV measurement of wakes of two batspecies flying freely in a wind tunnel. Exp. Fluids 46, 923-932. [32] Hubel, T., Hristov, N., Swartz, S.M. & Breuer,K.S. 2009 Time-resolved wakestructure and kinematics of bat flight. Exp. Fluids 46, 933-943. [33] Hubel, T.Y., Riskin, D.K.,Swartz, S.M. & Breuer, K.S. 2010 Wake structure andwing kinematics: the flight of the lesser dog-faced fruit bat, Cynopterusbrachyotis. J. Exp. Biol. 213,3427-3440. ( [34] von Busse, R., Waldman, R.M., Swartz, S.M., Voigt, C.C. & Breuer, K.S.2014The aerodynamic cost of flight in the short-tailed fruit bat (C a rollia perspicillata):comparing theory with measurement.J.R. Soc. Interface 11, 20140147. ) ( [35] Hedenstrom, A. & Johansson, L.C. 2015 Bat flight: aerodynamics, kinematicsand flight morphology. The Journal ofexperimental biology 218,653-663. ) ( [36] Henningsson, P., Muijres, F.T. & Hedenstrom, A. 2010 Time-resolved vortexwake of a common swift flying over a range of flight speeds.J.R. Soc. Interface 8, 807-816. ) ( [37] Shi, J.J. & Rabosky, D.L. 2015 Speciation dynamics during the global radiation of extant bats. Evolution 69,1528-1545. ) ( [38] Glass, B.P. 1982 Seasonal movements of M e xican freetail bats, Tadarida brasiliensis mexicana,banded in the Great Plains. Southwest. Nat.27,127-133. ) [39] Barbour, R.W.D.,Barbour, W.H.R.W. &Davis, W.H. 1969 Bats ofAmerica. ( [40] Williams, T.C., Ireland, L.C. & Williams, J.M. 1973 High altitude flights of thefree-tailed bat, Tadarida brasiliensis, observed with radar. J. Mammal. 54,807- 821. ) ( [41] Wilkins, K.T. 1989 Tadarida brasiliensis. Mamm.Species 331, 1-10. ) ( [42] Nowak,R. M . 1994 Walker's bats of the world, JHU Pre s s. ) ( [43] Norberg, U.M. 1990 Vertebrate flight: mechanics, physiology, morphology,ecologyand evolution.Berlin, Springer-Verlag. ) ( [44] Findley, J.S.,Studier, E.H. & Wilson, D.E. 1972 Morphologic properties of batwings.J. Mammal. 53,429-444. ) ( [45] Fitch, J.H., Shump,K.A. & Shump, A.U. 1981 Myotis velifer. Mamm. Species 149,1-5. ) ( [46] Rayner, J.M. 1991 On the aerodynamics of animal flight in ground effect.Philosophical Transactions ofthe Royal Society of London B: B iological Sciences 334,119-128. ) ( [47] Aldridge, H. 1986 Manoeuvrability and ecological segregation in the littlebrown (Myotis lucifugus) and Yuma (M. yumanensis) bats (Chiroptera:Vespertilionidae). Can. J. Zool. 64,1878-1882. ) ( [48] Abdel-Aziz,Y. & Karara, H., 1971, Direct linear transformation into objectspace coordinates in close-range photogrammetry, Proceedings ofthe Symposiumon Close-Range Photogrammetry Falls Church,Virginia, U.S.A., 1 -18 ) ( [49] Riskin, D.K. Iriarte-Diaz, I.Middleton, K.M. Breuer, K.S. & Swartz, S.M. 2010The e ffect of body size on the wing movements of pteropodid bats, with in s ightsinto thrust and lift production. J.Exp. Biol. 213, 4110-4122. ) ( [50] Adrian,R . J., Christensen, K .T. & Liu, Z.C. 2000 Analysis and i nterpretation ofinstantaneous t u rbulent velocity fields. Exp. Fluids 29,275-290. ) ( [51] Johansson, L.C., Wolf, M., von Busse,R., Winter,Y . , S pedding, G.R. &Hedenstrom, A. 2008 The near and far wake of Pallas'long tongued bat(Glossophaga soricina).J. Exp.Biol. 211,2909-2918. ) [52]Von Busse,R., Hedenstrom, A., Winter, Y. & Johansson, L.C. 2012 Kinematicsand wing shape across flight speed in the bat, Leptonycteris yerbabuenae. BiologyOpen1,1226-1238.(doi:10.1242/bio.20122964). [53] Hedenstrom, A., Johansson, L.C., Wolf, M., von Busse, R., Winter, Y. &Spedding, G.R. 2007 Bat flight generates complex aerodynamic tracks. Science316,894-897. [54] Muijres, F.T.,Johansson, L.C., Bowlin, M.S.,Winter, Y. & Hedenstrom, A. 2012Comparing Aerodynamic Efficiency in Birds and Bats Suggests Better FlightPerformance in Birds.PLoS ONE 7,e37335. (doi:10.1371/journal.pone.0037335). [55] Henningsson, P.,Spedding, G.R. & Hedenstrom, A. 2008 Vortex wake andflight kinematics of a swift in cruising flight in a wind tunnel. J. Exp. Biol. 211,717-730. [56] Bomphrey,R.J., Taylor, G.K. & Thomas, A.L. 2009 Smoke visualization offree-flying bumblebees indicates independent leading-edge vortices on eachwing pair. Exp. Fluids 46, 811-821. [57] Wolf, M., Johansson, L.C., von Busse, R., Winter, Y. & Hedenstrom, A. 2010Kinematics of flight and the relationship to the vortex wake of a Pallas'longtongued bat (Glossophaga soricina).J. Exp. Biol. 213,2142-2153. [58] Spedding, G. & McArthur, J. 2010 Span efficiencies of wings at low Reynoldsnumbers.Journal ofAircraft 47, 120-128. [59] Anderson, J.D. 2001 Fundamentals ofaerodynamics. 3rd ed, Tata McGraw-Hill Education. [60] Henningsson, P., Michaelis, D., Nakata, T., Schanz, D., Geisler, R., Schroder, A.& Bomphrey, R.J. 2015 The complex aerodynamic footprint of desert locustsrevealed by large-volume tomographic particle image velocimetry. J.R. Soc.Interface 12, 20150119. [61] Brodsky, A. 1991 Vortex formation in the tethered flight of the peacockbutterfly Inachis io L.(Lepidoptera,Nymphalidae] and some aspects of insectflight evolution.J. Exp. Biol. 161,77-95. [62] Davies, N.B. 1977 Prey selection and the search strategy of the spottedflycatcher (Muscicapa striata): a field study on optimal foraging. Anim. Behav. 25,1016-1033. FIGURES Figure 1: Anatomical features, marker positions and kinematic parameters. (a) dorsalview; , sweep angle, proximal plane is shaded green, distal plane is shaded blue, (b]front view; 0,flex angle; O,amplitude angle (c) simplified side view (wing only); a=angle of attack, β=stroke planeangle, Ue= total forward speed, Vwing = wing velocity atwrist. Figure 2: Dorsal view of M. velifer and T. brasiliensis at low speed, mid-downstroke. Tailarea (fine dashed line); mid-body width (arrows); 5-point wing area (solid line] andcontour area (dashed line). Figure 3: Variation in kinematic parameters across flight speed for M. velifer and T. brasiliensis.(a) frequency, (b] amplitude,(c) downstroke ratio, (d) span ratio, (e)maximum half wingspan, (f) maximum chord, (g) minimum body wing tip distance, (h]stroke plane angle, (i] angle of attack mid downstroke, (j] mean angle of attack, (k) meansweep angle, (I) mean flexion angle. All graphs represent the best fit of the mixed effectmodel for each species; the shaded areas represent the standard error. p-values lowerthan 0.05 indicate significant difference in slope between species. Figure 4:(a-f): Average trajectory of the wingtip, wrist, tip of the digit V (dig.V, andankle in body-referenced coordinate system for M. velifer (green) and T. brasiliensis(brown] in two different speed groups. Star indicates body marker position in bat-centred coordinate system. For graphic comparison speeds were grouped in low, medium and high speeds, trajectories based on the mean of all individual means in thesegroups, shaded intervals indicate standard error between individual means. Trajectoriesdisplayed at low (a -c) and high (d-f) speeds (medium speed not displayed). (i-l):Speed-dependent wrist kinematics M. velifer and T. brasiliensis at low, medium and highspeeds; downstroke indicated by shading (downstroke shorter at higher speeds, darkershading indicates period of variation). (g, h) Wrist sweep angle:d. (i, j) Wrist flexionangle: 6, dashed line indicates no flexion between proximal and distal wing or ‘flat plate'condition. (k, l) Angle of attack based on armwing or proximal plane. Figure 5: Wake reconstruction for M. velifer and T. brasiliensis at low and high speed. (a-d) M.velifer, (a,b) dorsal view and (c,d) side view at (a,c) low (Ut= 4.8 ms-1) and (b,d)high speed (Ut=8.1 ms-1); (e-h) T. brasiliensis,(e,f) dorsal view and (g,h) side view at(e,g) low (Ue=5.1 ms-1) and [f,h] high speed (Ue= 7.0 ms-1). Isosurfaces of transverseswirl are based on 2D PIV; path of right wingtip: green line, path of right wrist: blackline, path of body: blue line. Vortices are coloured based on circulation and rotationaldirection, with counter-clockwise rotating vortices positive (red); tip vortex: V1, rootvortex: V2, distal vortex pair: V3 and V4, distance travelled in flow stream direction inchord lengths: x/c, distance perpendicular to midline in chordlengths: y/c. Figure 6: Average circulation for each vortex (V1-V4) normalised by speed and bodyweight (tip vortex: V1, root vortex: V2, distal vortex pair: V3 and V4) for different speedcategories. (a-c) M. velifer, (d-f) T. brasiliensis at (a,d) low, (b,e) medium and (c,f) highspeeds. Dashed lines in a-c show normalised circulations for tip (V1) and root (V2]vortices in T. brasiliensis. Shaded intervals: Mean +- s.e. of individual means, greyshading denotes downstroke. TABLES Table 1: Morphology of study subjects and number of trials analysed for each individual.Note: body width and tail area were from frames of high speed video at time ofmaximum wing extension (one per individual). All other means (+ S.D.] were extractedfrom flights at low speed from of a total of 25 wingbeat cycles in M. velifer and 57 in T.brasiliensis. total wing midtotaltailIDhalf span bmacxhorone wing area aspectsed cmax loadingm body numberx ) a s s m ( area(mg)(m) S(cm) ratio AR Q width of trials(cm²)(-) (N/m) (m) M. veliferMI female 0.124±0.0040.051±0.002 9.16±0.3 41.6±4.1 7.3±0.512.8±1.3 0.028 5.2 10MII female 0.132±0.004 0.054±0.006 11.9±0.5 40.7±5.5 8.6±0.2 13.0±1.0 0.028 4.9 8MIII female 0.130±0.002 0.055±0.004 9.65±0.4 43.2±4.4 7.8±0.7 9.3±1.0 0.026 6.0 6MIV male 0.123±0.004 0.051±0.001 9.73±0.5 44.3±3.9 6.8±0.5 9.3±1.5 0.032 6.3 10mean 一 0.127±0.004 0.052±0.002 10.12+0.6 42.4±1.6 7.6±0.3 11.1±2.1 0.028 5.6 T. brasiliensisTI female 0.138±0.003 0.047±0.023 11.8±0.4 37.5±5.6 10.2±0.514.1±2.3 0.039 5.9 20TII female 0.139±0.003 0.043±0.005 13.2±0.4 40.6±2.4 9.6±0.8 15.2±1.0 0.036 6.1 20TII male 0.138±0.004 0.047±0.022 11.0±0.4 37.0±3.5 10.4±0.713.8±1.5 0.040 5.7 19TIV male 0.147±0.004 0.045±0.006 12.4±0.6 34.6±9.5 12.5±0.417.8±8.1 0.041 5.3 20TV male 0.147±0.004 0.045±0.009 10.5±0.4 43.6±2.0 10.0±0.710.7±1.0 0.040 5.0 20mean - 0.142±0.005 0.045±0.002 11.8±1.1 38.6±3.5 10.5±0.314.4±2.5 0.039 5.6 Table 2: Kinematics in Myotis velifer and Tadarida brasiliensis for three flight speedcategories. Means, p-and p'corrected p-values (using sequential Bonferroni),degrees offreedom and t-values. M. velifer T. brasiliensis parameter estimates U<5.5m/s Mean ±s.e. Mean±s.e. p’ df t Wingbeat frequency,f(Hz) 9.30±0.38 10.48±0.32 0.28 0.068 4.81 2.34 Wingbeat amplitude, Otip () 66.11±3.19 66.19±2.0 1 0.983 9.91 0.02 Downstroke ratio,t (-) 0.51±0.011 0.52±0.007 1 0.621 7.90 0.51 Span ratio,SR (-) 0.86±0.02 0.74±0.30 0.077 0.011 8.29 3.28Minimum distance body- wing tip, dmin (m) 0.09±0.004 0.12±0.003 <0.001 <0.001 10.13 6.52Stroke plane angle,β() -80.97±1.97 -83.54±1.49 1 0.341 5.64 -1.04Downstroke angle of attack, amd () 6.81±1.97 12.38±1.21 0.324 0.054 -1.46 11.27Mean angle of attack,amean () 5.97±2.49 18.95±2.01 0.040 0.005 7.07 4.06Sweep angle,中() 147.10±2.21159.79±1.47 0.018 0.002 7.05 4.78Flexion angle, 0(°) 184.62±1.27 188.20±0.81 0.324 0.056 5.85 2.38 5.5m/s7.5m/s Mean±s.e. Mean±s.e. p' p 4f tWingbeat frequency,f(Hz) 8.91±0.32 8.74±0.24 0.690 5.91 -0.42Wingbeat amplitude, Otip () 87.04±2.38 80.25±1.43 0.252 0.036 9.33 -2.44Downstroke ratio,t(-) 0.49±0.011 0.49±0.007 1 0.697 5.01 0.410.69±0.02 0.855 Span ratio, SR (-) 0.68±0.03 1 6.29 -0.19Minimum distance body - wing tip, dmin (m) 0.07±0.003 0.08±0.002 0.192 0.024 5.67 3.04Stroke plane angle, β () -85.6±3.85 -82.68±2.18 1 0.496 25.33 0.69Downstroke angle ofattack,amd() 2.36±0.79 9.26±0.53 <0.001<0.001 4.70 9.11Mean angle of attack, amean () 2.34±0.91 8.58±0.60 <0.001<0.001 8.13 5.68Sweep angle,中() 142.27±4.76128.92±3.36 0.402 0.067 5.41 -2.29 Flexion angle, 0 () 184.37±1.27183.44±0.89 1 0.573 5.79 -0.60 Table 3: Percentage occurrence, O, of root (V2) and distal vortex pair (V3/V4) in relationto species and speed category, based on manual assessment of vorticity fields with anoise reduction threshold of +-5 s-1 vorticity. T. brasiliensis M. velifer root V2 distal V3 root V2 distal V3 U<5.5m/s 5.5m/s7.0m/s 100% 96% 93% 83% 76% 15% 50% 69% 20% 18% 70%27% SUPPLEMENTARY MATERIAL Suppl. Fig. 1: a - f: Average trajectory of the wingtip, wrist, tip of digit V (dig. V), andankle in body-referenced coordinate system, normalized by wing chord for M. velifer(green) and T. brasiliensis (brown). Star indicates body marker position. For graphiccomparison trials were grouped in low, medium and high speeds.Trajectories displayedfrom low (a-c) and high (d-f) speeds (medium speed not displayed). M. velifer vorticity s Suppl. Fig. 2: Vector velocity fields and streamwise velocity for and Mvelifer [a-d, atspeed 4.81 ms-1) T. brasiliensis [e-l, at speed 5.1 ms-1). Mid upstroke (a,e),upperreversal point (b,f), mid downstroke (c,g),lower reversal point (d,h). Star: position ofmidline trunk marker, wrist trajectory: black line. wingtip trajectory: green line,location of marker at point of cycle depicted in image indicated by open circle (wrist= black, wingtip= green). V1: tip vortex, V2: root vortex, V3 and V4: distal vortex pair. Suppl. Table 1: Change in kinematics with flight speed in (a) M. velifer and (b) T.brasiliensis. p'-values: p-values corrected using sequential Bonferroni. (N= 5individuals; n= 71 wingbeat cycles). Grey arrows indicate significance for onlyuncorrected p-values. Linear mixed effect model. M.velifer increase/ lower bound upper bound decrease p p df t w.speed Wingbeat frequency,f(Hz) 0.098 0.014 26.7 -2.64 -0.440 -0.055 Wingbeat amplitude, Otip () <0.001 <0.001 33.4 4.81 4.168 10.282 Downstroke ratio,t (-) 0.895 0.21 42.5 -1.27 -0.029 0.007 Span ratio, SR (-) - 0.895 0.179 32.9 -1.37 -0.037 0.007 Maximum half span, bmax (m) 0.020 0.002 34.9 -3.43 -0.010 -0.002 Maximum wing chord, cmax(m) 1.000 0.921 39.2 0.1 -0.013 0.001 Minimum distance body -wing tip, dmin (m) 0.040 0.005 34.8 -3.03 -0.008 -0.002 Stroke plane angle,β () 0.678 0.113 30.3 -1.63 -2.106 0.234 Downstroke angle of attack, amd() 1.000 0.476 35.9 -0.72 -2.701 1.286 Mean angle of attack, amean () 0.027 0.003 37.4 -3.22 -2.000 -0.456 Sweep angle,中() - 1.000 0.58 32.6 -0.56 -4.511 2.566 Flexion angle, 0 () 1.000 0.976 33.5 0.03 -1.453 1.497 T. brasilienis increase/ lowerbound upper bound decrease pp' P df t w.speed Wingbeat frequency,f(Hz) 0.001 <.001 101.1 -12.1 -0.5607 -0.4031 Wingbeat amplitude, etip () 0.002 <.001 99.9 8.2 3.2766 5.3673 Downstroke ratio,t(-) 0.004 0.001 118.6 -3.3 -0.013 -0.0032 Span ratio, SR (-) 0.004 <.001 97.4 -11.6 -0.0638 -0.0452 Maximum half span, bmax (m) 0.005 <.001 106.5 -16.1 -0.0059 -0.0046 Maximum wing chord, cmax (m) 0.956 0.478 127.4 0.7 -0.001 0.0021 Minimum distance body- wing tip, dmin (m) 0.005 <.001 102.1 -15.8 -0.0125 -0.0097 Stroke plane angle, β () - 0.956 0.844 63.1 -0.2 -1.4602 1.1968 Downstroke angle of attack, a.md (°) ↓ 0.005 <.001 58.3 -3.7 -1.5949 -0.4692 Mean angle of attack, amean (°) 0.005 <.001 86.1 -10.9 -3.4838 -2.4056 Sweep angle,中() 0.005 <.001 87.9 -20.2 -10.2434 -8.4066 Flexion angle,0() 0.005 <.001 86.5 -8 -1.6956 -1.0155 Royal We compare kinematics and wake structure over a range of flight speeds (4.0-8.2 ms-1) for two bats that pursue insect prey aerially, Tadarida brasiliensis and Myotisvelifer. Body mass and wingspan are similar in these species, but M. velifer hasbroader wings and lower wing loading. By using high speed videography and particleimage velocimetry of steady flight in a wind tunnel, we show that 3D kinematics andwake structure are similar in the two species at the higher speeds studied, but differ atlower speeds. At lower speeds, the two species show significant differences in meanangle of attack, body-wingtip distance and sweep angle. The distinct body vortex seenat low speed in T. brasiliensis and other bats studied to date is considerably weaker orabsent in M. velifer. We suggest that this could be influenced by morphology: 1) thenarrower thorax in this species likely reduces the body-induced discontinuity incirculation between the two wings; and 2) the wing loading is lower, hence the liftcoefficient required for weight support is lower. As a result, in M. velifer, there maybe a decreased disruption in the lift generation between the body and the wing and thestrength of the characteristic root vortex is greatly diminished, both suggestingincreased flight efficiency.
确定
还剩29页未读,是否继续阅读?

产品配置单


北京欧兰科技发展有限公司为您提供《食虫性蝙蝠中飞行运动学和尾流结构检测方案(粒子图像测速)》,该方案主要用于其他中飞行运动学和尾流结构检测,参考标准--,《食虫性蝙蝠中飞行运动学和尾流结构检测方案(粒子图像测速)》用到的仪器有德国LaVision PIV/PLIF粒子成像测速场仪、LaVision DaVis 智能成像软件平台
推荐专场


相关方案
更多
该厂商其他方案
更多