


胺水溶液喷雾吸收和液滴分布数据对于发电厂尾气排放中吸附二氧化碳的研究是非常重要的。吸附过程的效率,效果,和喷雾液滴的表面积,以及喷雾柱的流量关系密切。采用相位多普勒粒子干涉仪,可以实时检测喷雾柱中某个位置的液滴的粒径和速度。可以用于研究表征胺水溶液吸附二氧化碳过程。
方案详情

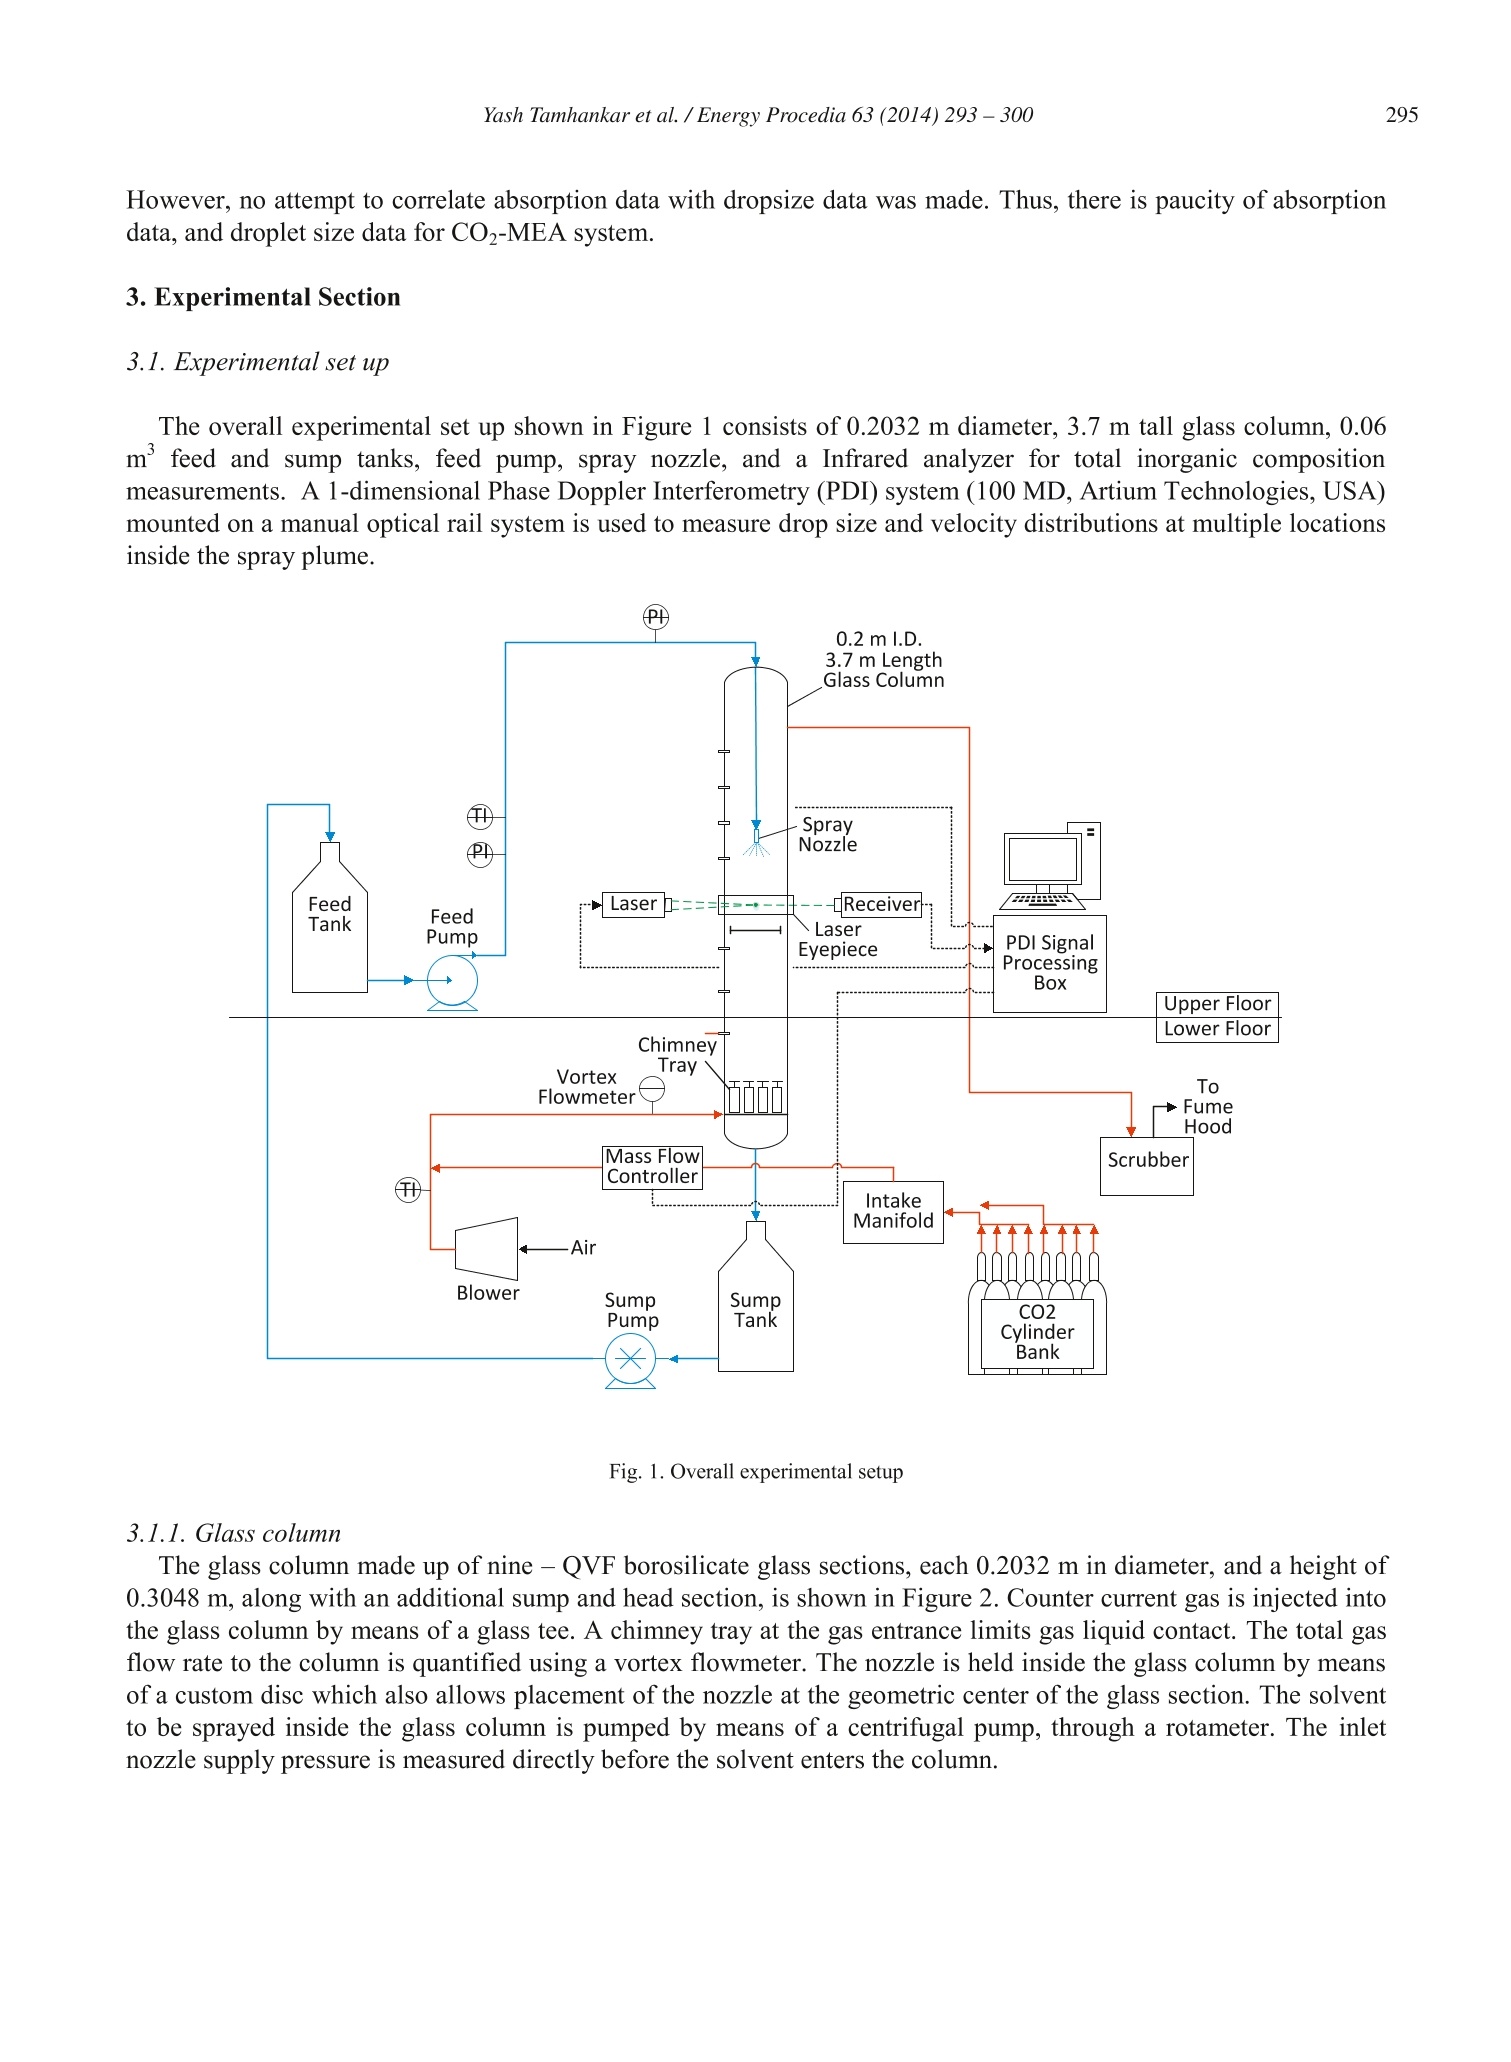
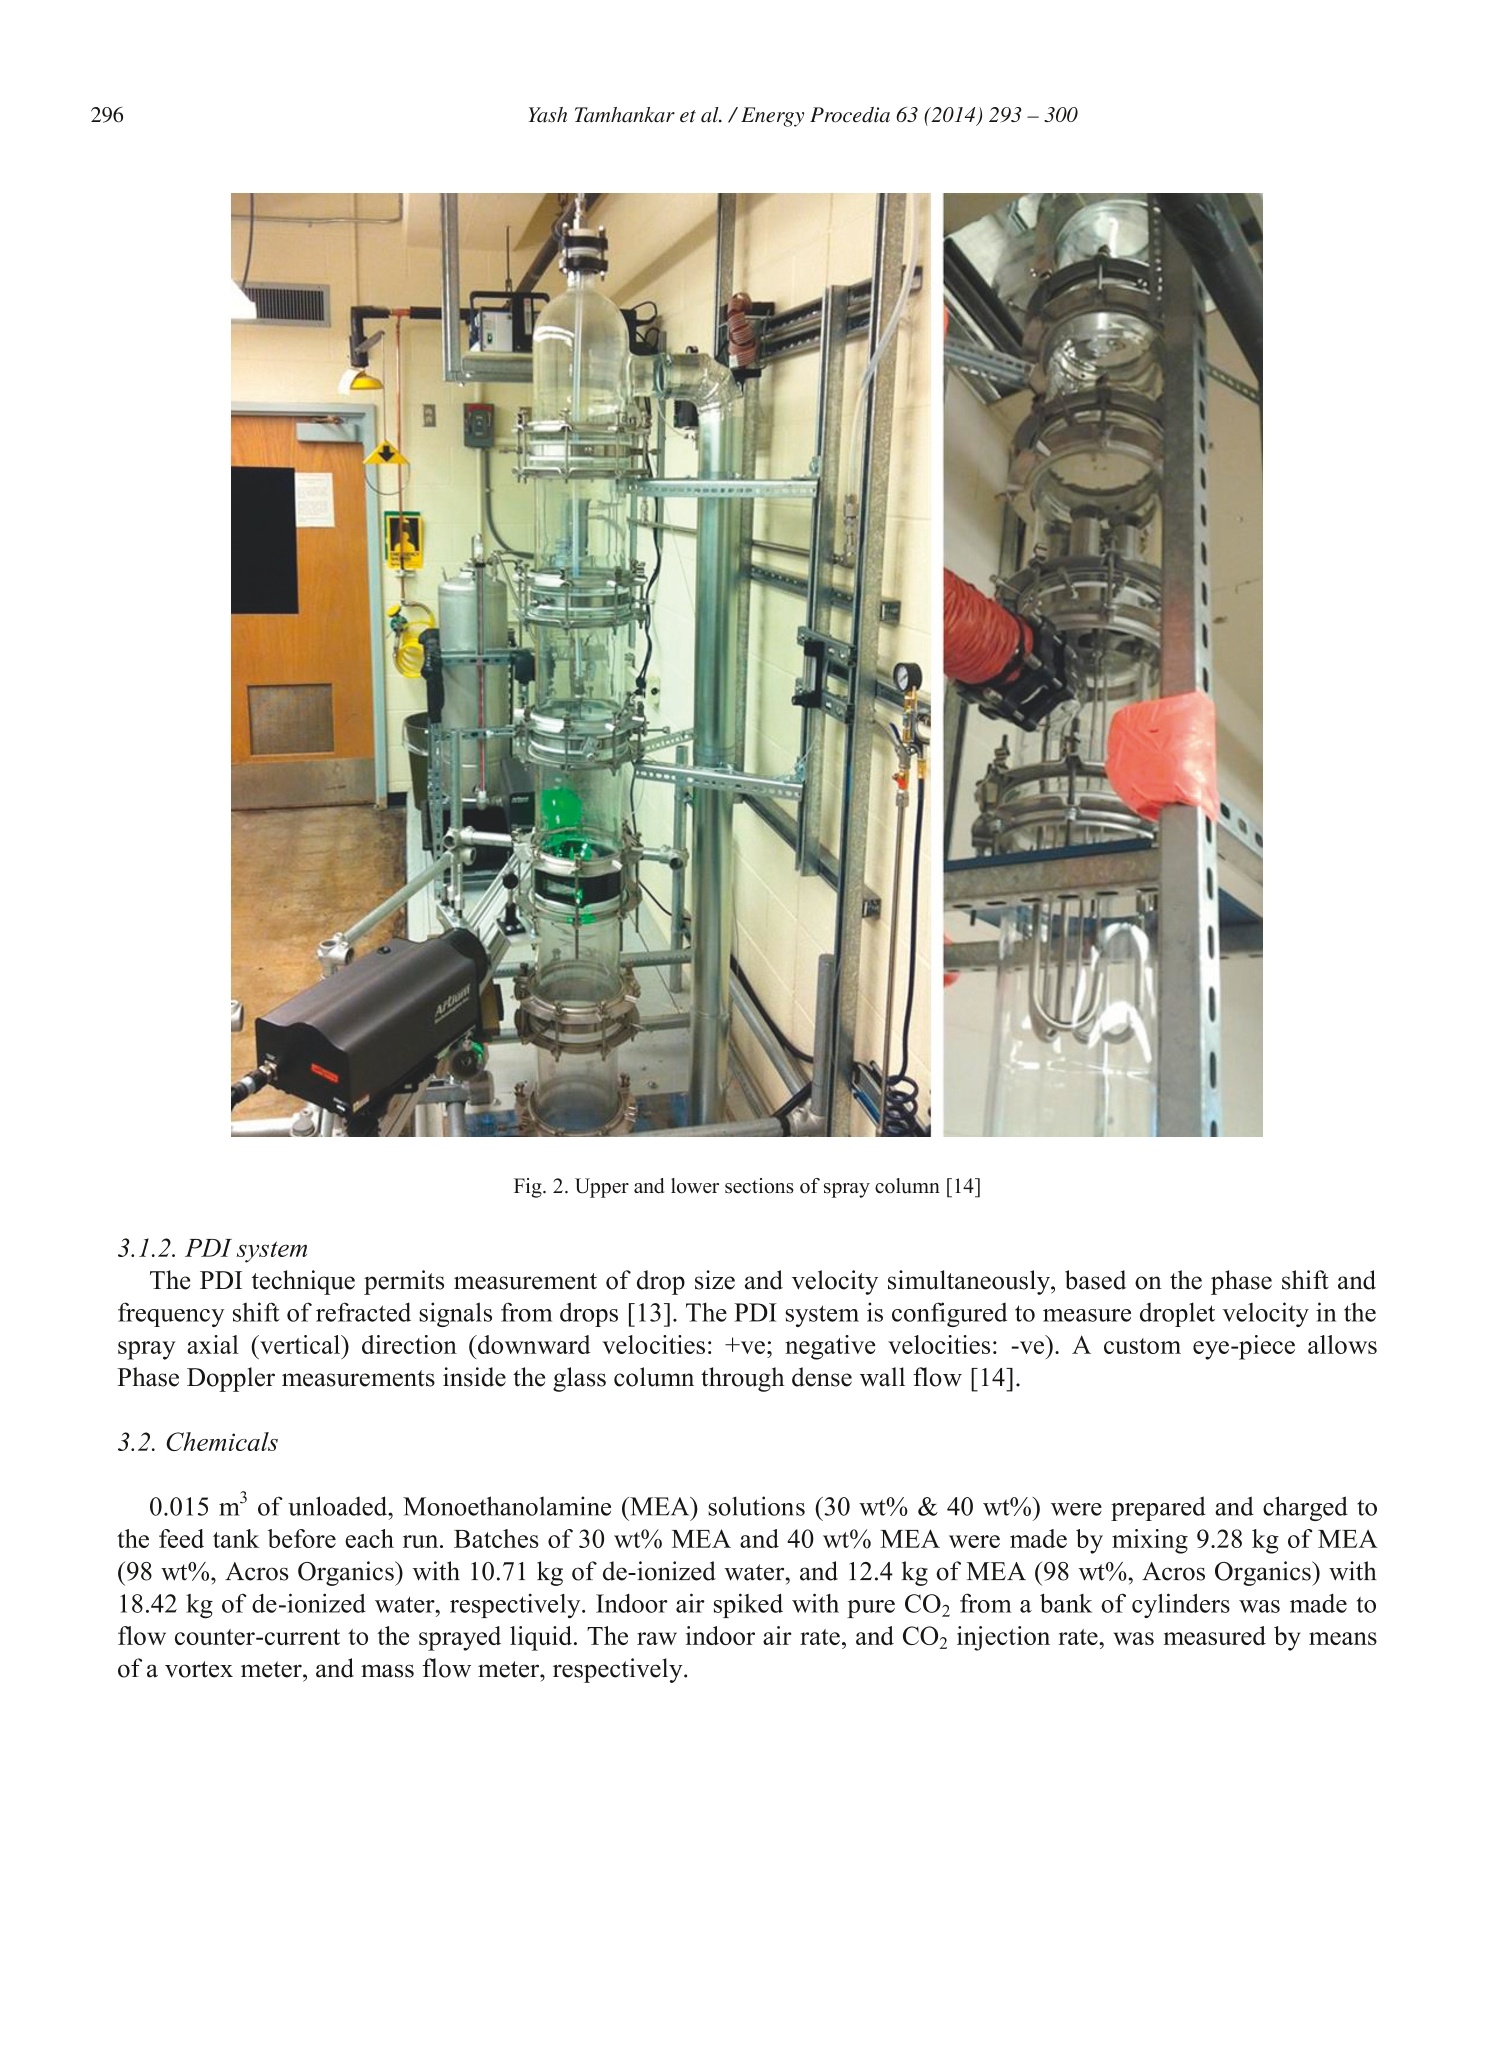
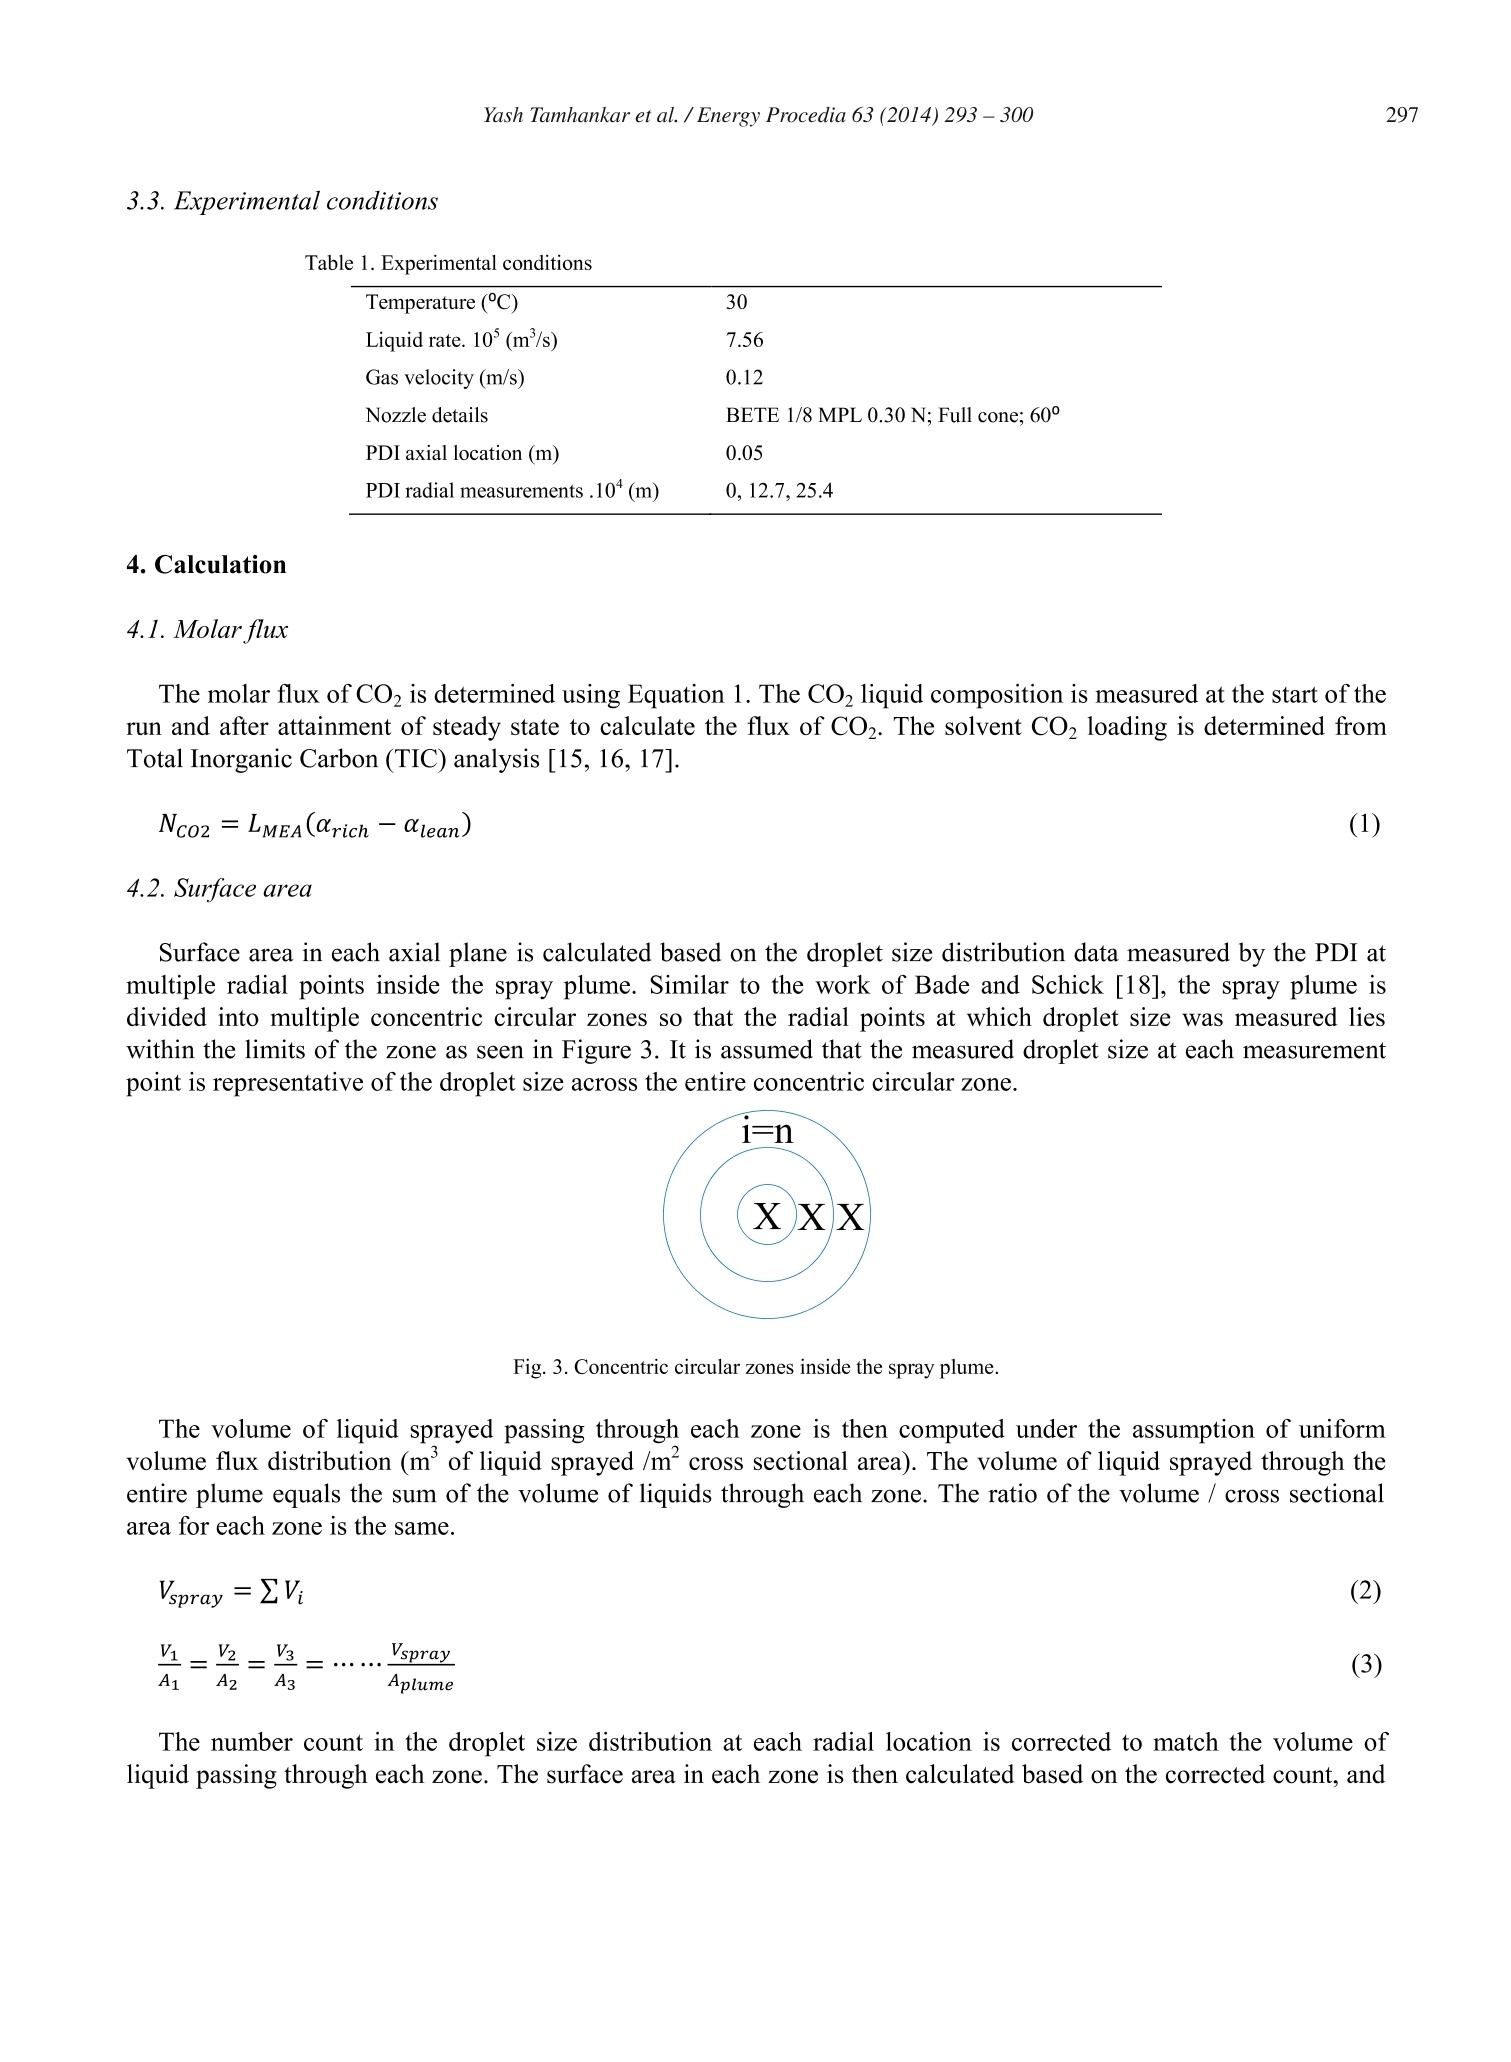
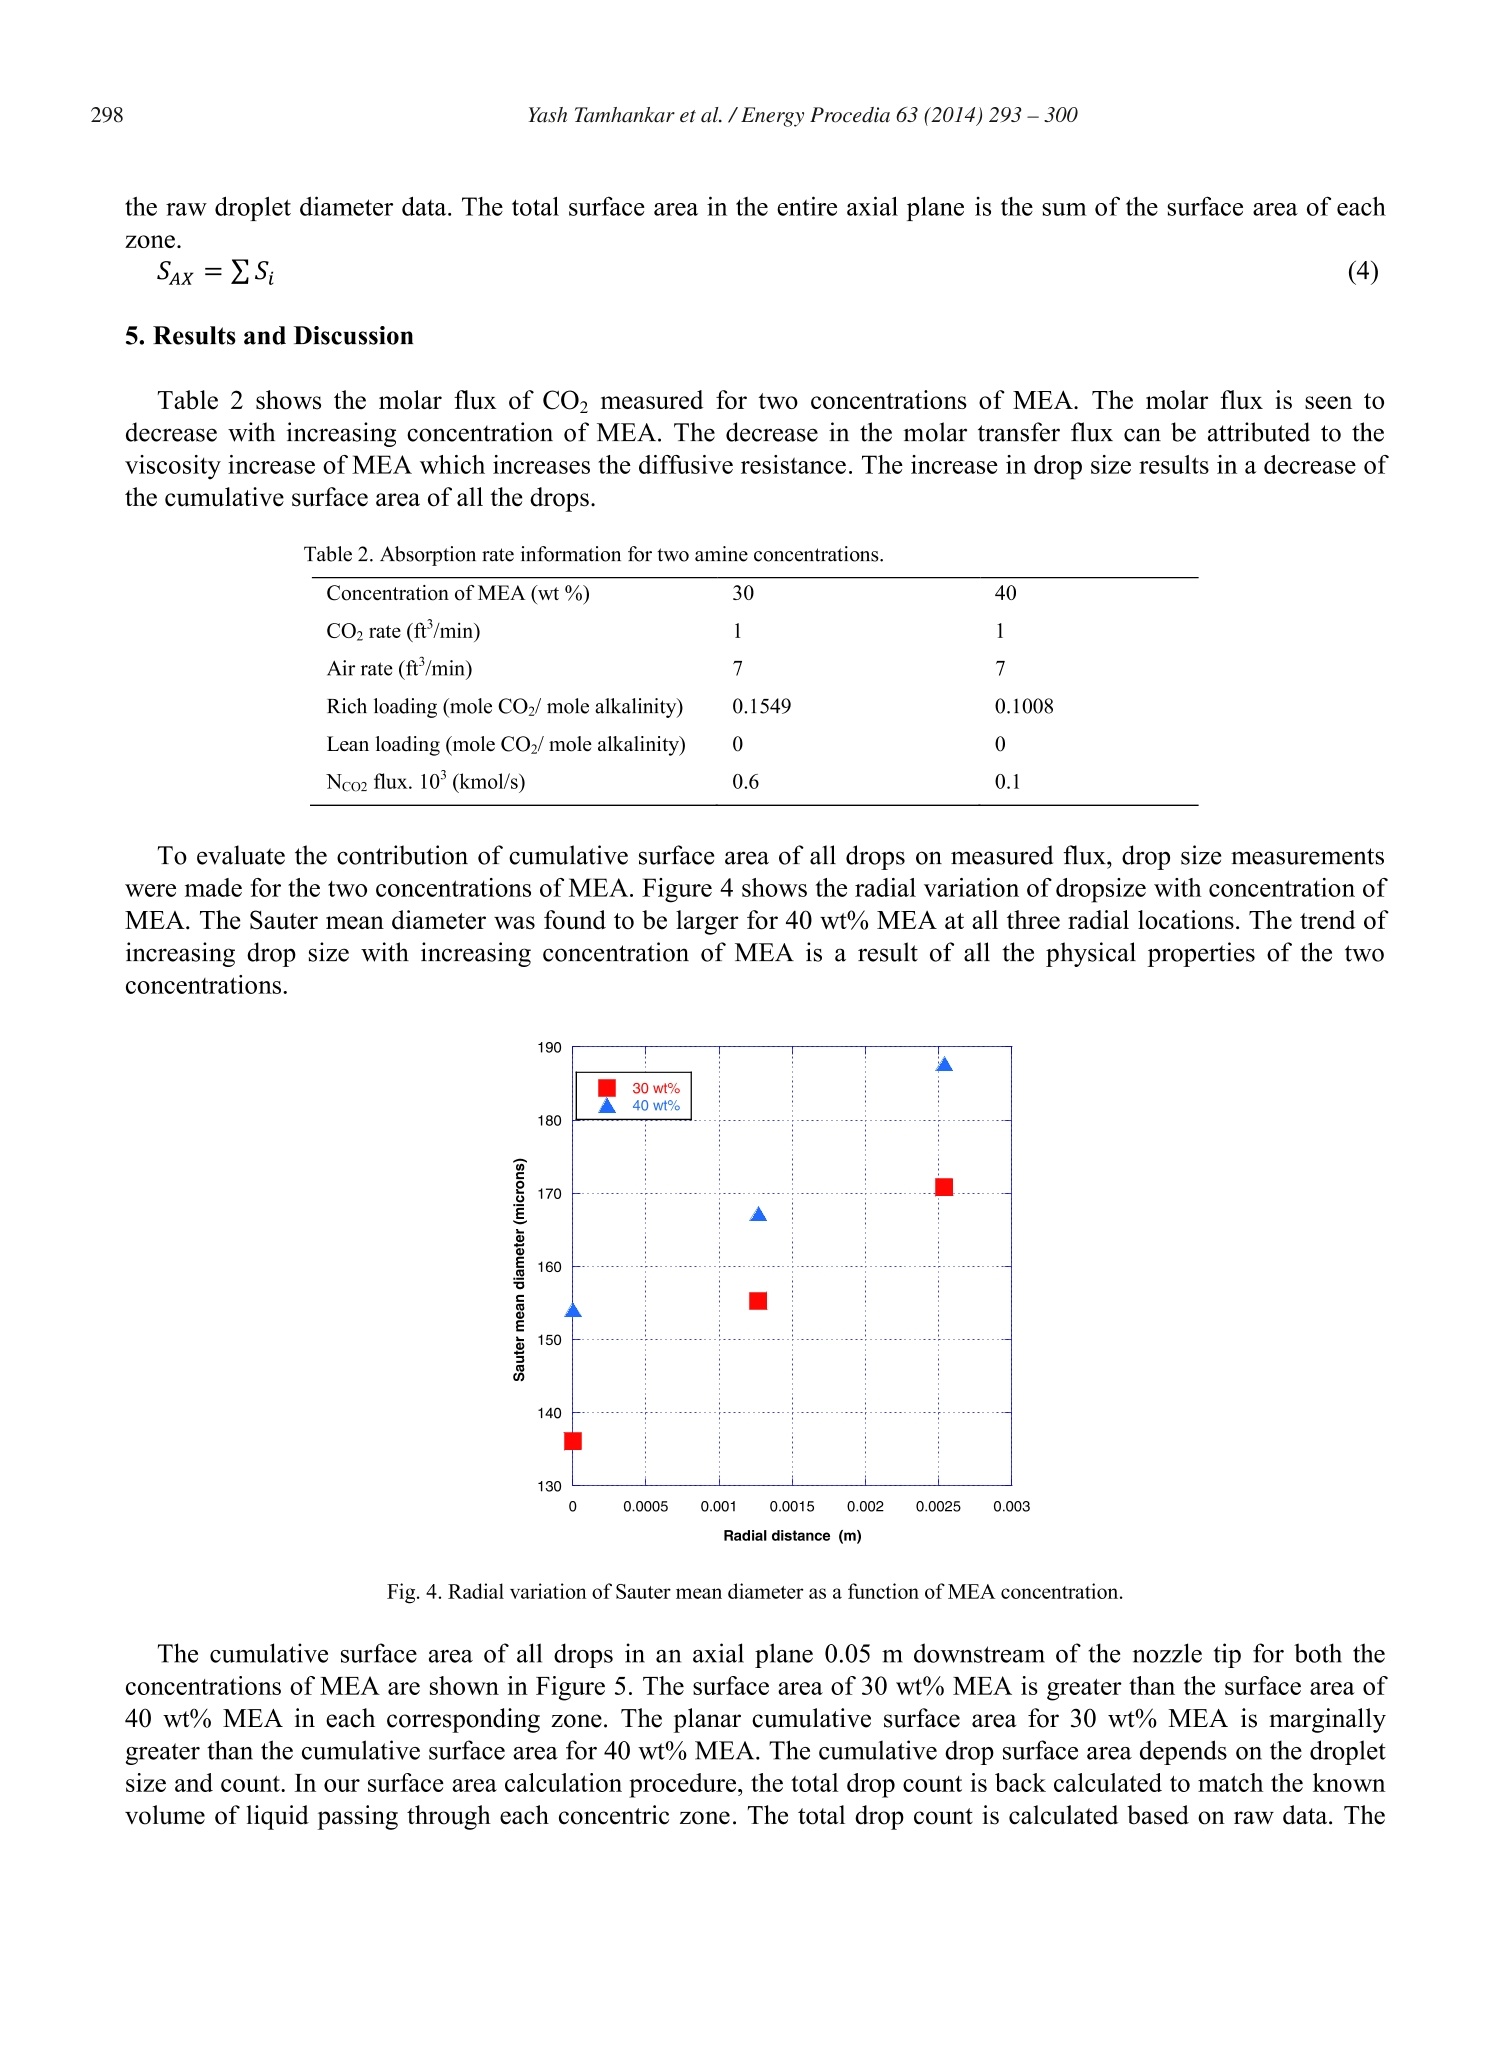
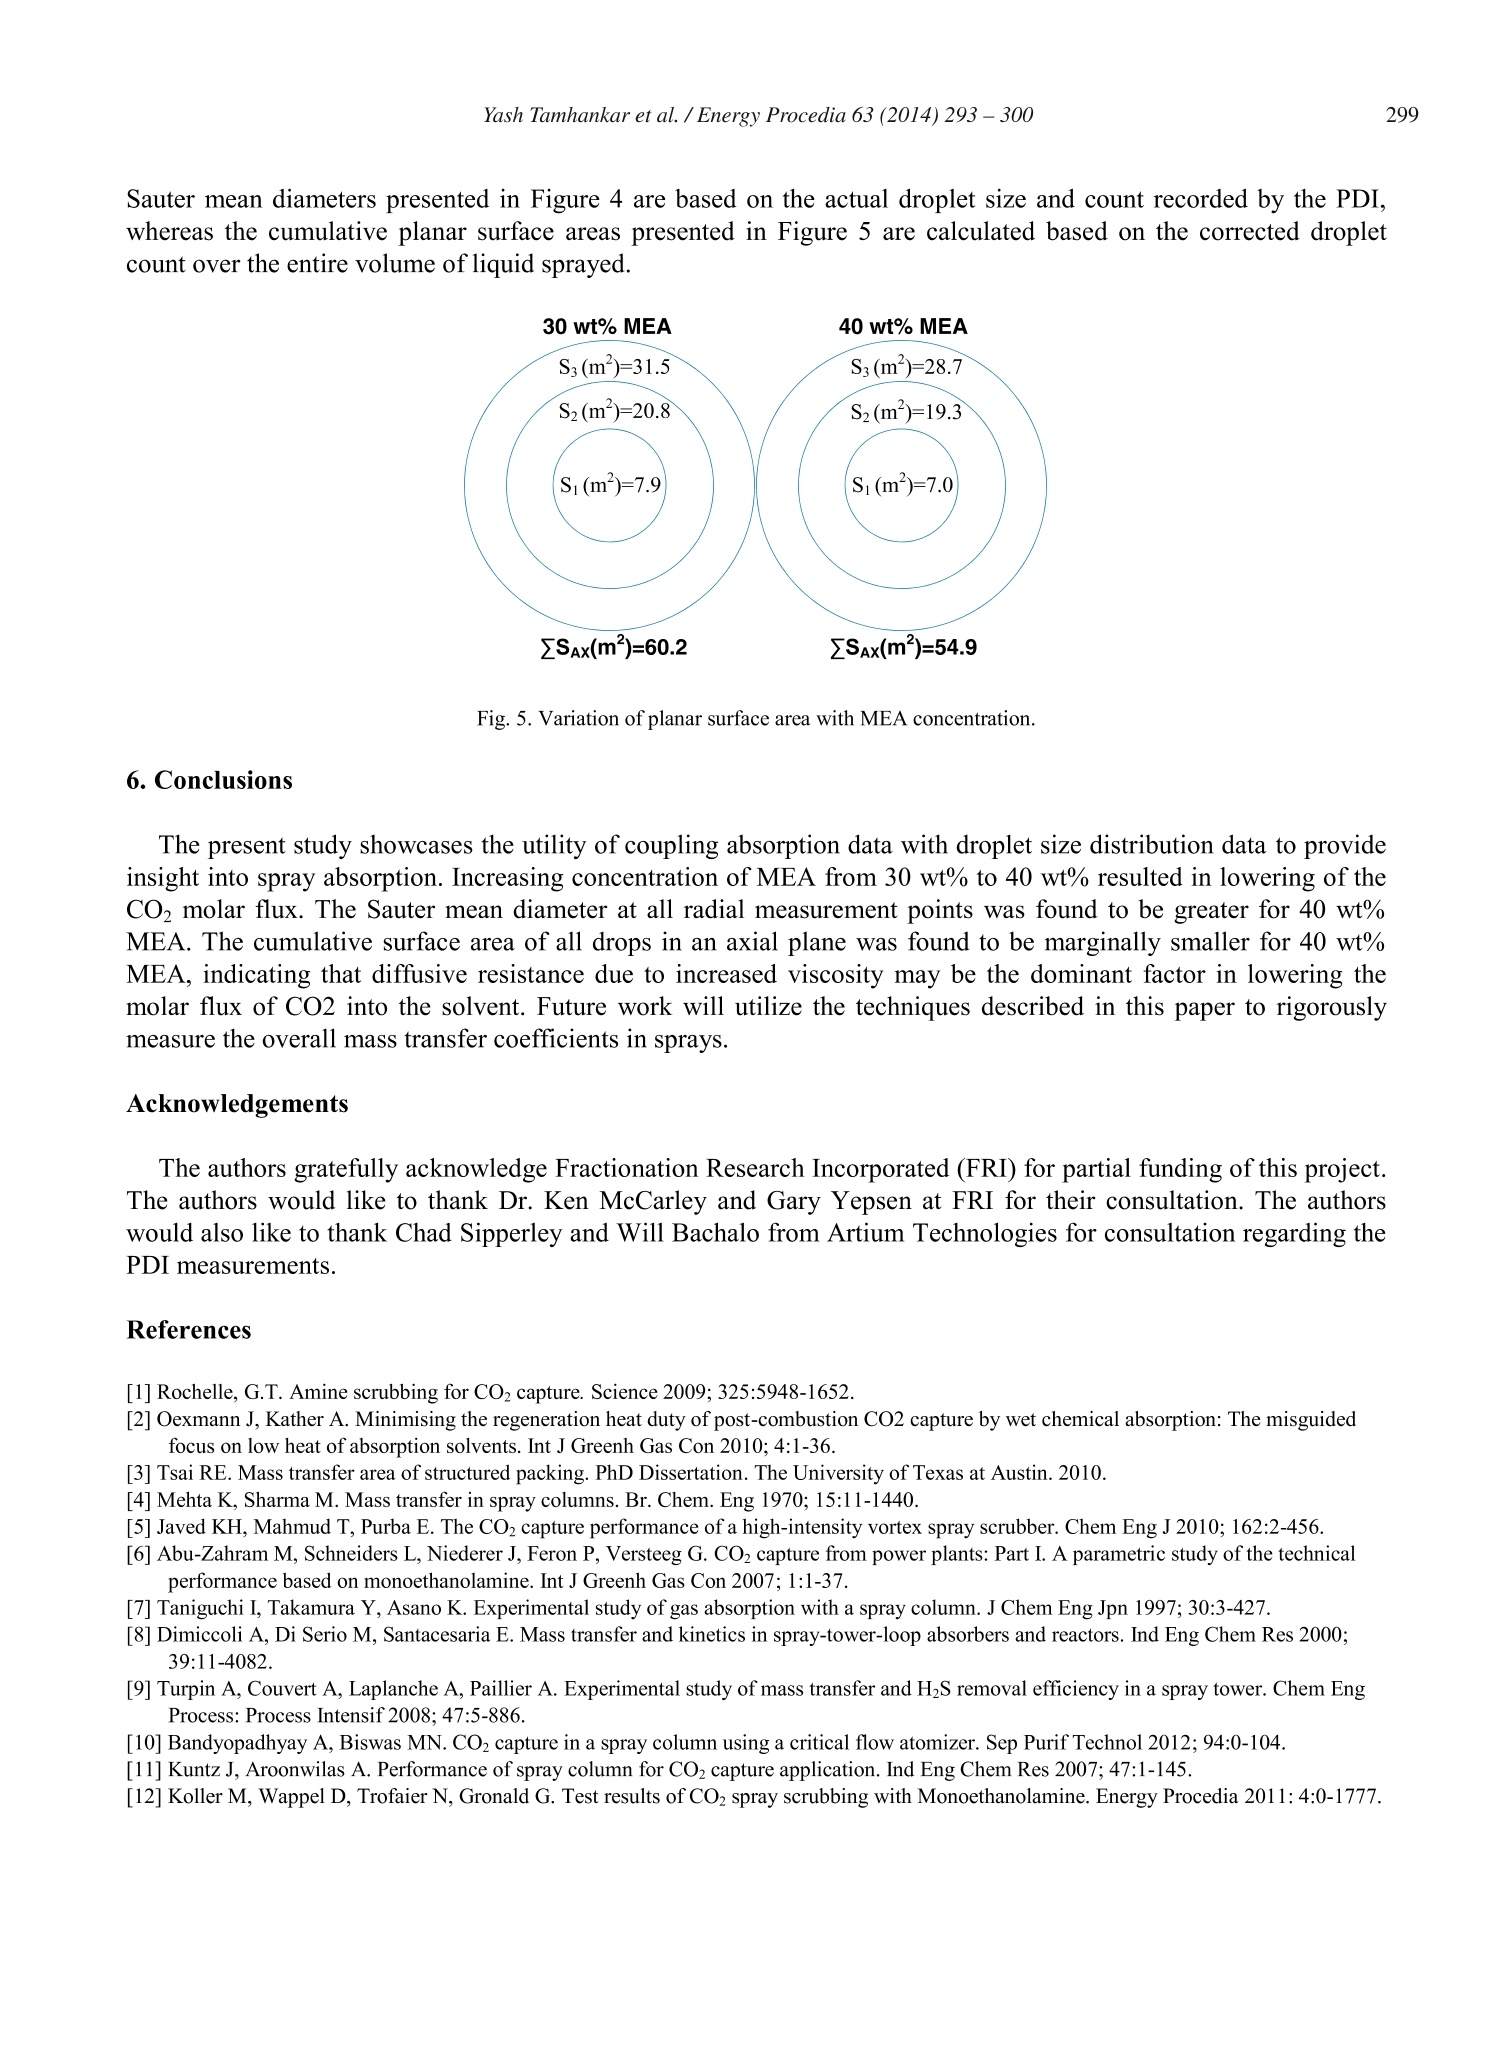
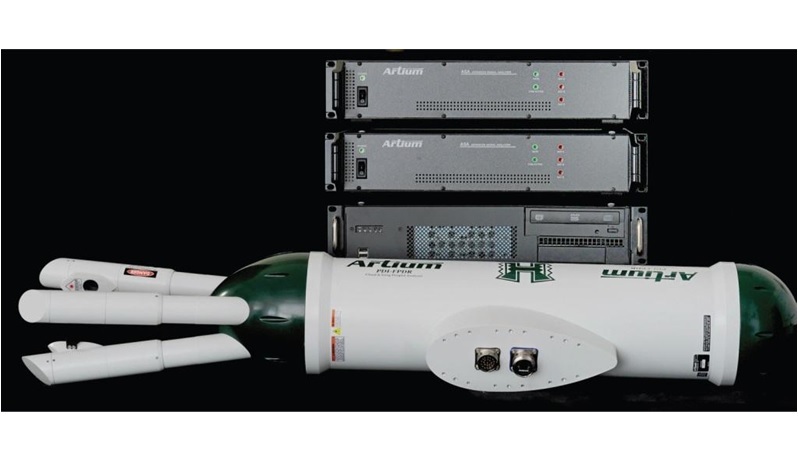
Available online at www.sciencedirect.comCrossMarkEnergyScienceDirectProcediaEnergy Procedia 63 (2014)293-300 Yash Tamhankar et al. / Energy Procedia 63(2014)293-300294 GHGT-12 Aqueous amine spray absorption and droplet distribution data forCO2capture applications Yash Tamhankar, Brett King , Rob Whiteley", Michael Resetarits, Tony Cai, and ClintAichele* “School of Chemical Engineering, Oklahoma State University, Stillwater, OK 74078, USAFractionation Research Incorporated, Stillwater, OK 74074, USA Abstract Spray columns can potentially be utilized for absorbing CO2 from large point sources such as flue gas exhausted by power plants.Low gas phase pressure drop, and the lack of internals which are susceptible to corrosion, make spray columns well suited foraqueous amine absorption. Design practices for spray columns are highly empirical and application specific. There is a paucity ofdata on absorption of CO2 in aqueous amine sprays. Mass transfer data for COz-amine systems is required for robust design ofspray columns. Further, the absorption efficiency of sprays is greatly influenced by the surface area of drops, which in turdepends on the droplet size distribution. However, experimental data for droplet size distributions inside aqueous amine sprays isnon-existent. Measurement of droplet size distributions is critical in providing a fundamental insight into spray absorption. Thiswork presents molar flux data coupled with droplet size distribution data for CO absorption into Monoethanolamine (MEA)spray. Both the molar flux measurements and the droplet size measurements are made inside a 0.2 m glass column. The drople1size distributions are measured using a Phase Doppler Interferometer (PDI). Further, a novel method is utilized to quantify theavailable surface area from the droplet size distribution measurements. The effect of MEA concentration on molar flux, drople1size, and surface area is presented. O 2014 The Authors. Published by Elsevier Ltd. This is an open access article under the CC BY-NC-ND license(http://creativecommons.org/licenses/by-nc-nd/3.0/). Peer-review under responsibility of the Organizing Committee of GHGT-12 Keywords: CO2; spray; mass transfer data; droplet size distribution data; surface area; 30 wt% monoethanolamine; 40 wt% monoethanolamine * Corresponding author.Tel.:+1-405-744-5280; fax:+1-405-744-6338. E-mail address: clint.aichele@okstate.edu 1876-6102 O 2014 The Authors. Published by Elsevier Ltd. This is an open access article under the CC BY-NC-ND license(http://creativecommons.org/licenses/by-nc-nd/3.0/). ( Peer-review u nder responsibility of the Organizing Committee of GHGT-12doi:10.1016/j.egypro.2014.11.032 ) 1. Introduction Aqueous amine absorption and stripping is the most well established technology for post combustion CO2 capture[1]. High operating and capital costs render the absorption-stripping process impractical at present [1]. These highcosts originate from the large amount of energy required to regenerate the solvent and the high pressure dropassociated with packed or tray-ed columns [2, 3]. Spray columns are potential candidates for CO2 capture from largepoint sources. Spray columns offer the advantage of low gas phase pressure drop compared to packed columns [4].Further, the absence of column internals make spray columns less susceptible to corrosive action of amine solvents,thereby permitting use of higher solvent concentrations. In spite of being widely used in the chemical industry, spray absorption is poorly understood. Design practices arehighly empirical and application specific. At present, there is a scarcity of reliable spray absorption data for CO2-MEA system. Javed et. al.[5] have shown the utility of application specific absorption rates in sizing spray columns.Effect of increased solvent concentration on spray absorption rate needs to be ascertained. Zahra et. al. [6] estimate a12% reduction in reboiler duty using 11m MEA (40 wt%) instead of 7m MEA (30 wt%). Furthermore, experimentaldata on droplet size distributions for amine sprays in non-existent. No effort has been made to quantify availablesurface area from drop size measurements. Coupling of mass transfer data with droplet size data can help in robustdesign of spray columns, and offer insight into spray absorption, respectively. The present study is a step towardaddressing this gap. 2.Background Extensive research has been conducted on spray absorption of CO2 in NaOH [4, 5, 7, 8, 9, 10]. However, sprayabsorption of CO2 in to aqueous amine solvents has been scarcely investigated. Kuntz and Aroonwilas [11]investigated absorption of CO2 in multiple concentrations of MEA inside a small laboratory scale spray column. Theeffect of liquid rate, gas rate, and solvent loading on absorption rates was also studied. The absorption rates weremeasured in the spray zone without any wall flow. Further analysis of surface area effects to absorption wasattempted without experimental measurement of drop size. Koller et. al.[12] measured absorption rates of CO2 in30 wt% MEA in a pilot scale scrubbing assembly. High gas and liquid rates were employed to mimic absorption ofCO2 from a large power plant. Effect of L/G ratio, and nozzle type on the CO2 removal efficiency was elucidated. However, no attempt to correlate absorption data with dropsize data was made. Thus, there is paucity of absorptiondata, and droplet size data for CO2-MEA system. 3. Experimental Section 3.1. Experimental set up The overall experimental set up shown in Figure 1 consists of 0.2032 m diameter, 3.7 m tall glass column, 0.06m’ feed and sump tanks, feed pump, spray nozzle, and a Infrared analyzer for total inorganic compositionmeasurements. A 1-dimensional Phase Doppler Interferometry (PDI) system (100 MD, Artium Technologies, USA)mounted on a manual optical rail system is used to measure drop size and velocity distributions at multiple locationsinside the spray plume. Fig. 1. Overall experimental setup 3.1.1. Glass column The glass column made up of nine-QVF borosilicate glass sections, each 0.2032 m in diameter, and a height of0.3048 m, along with an additional sump and head section, is shown in Figure 2. Counter current gas is injected intothe glass column by means of a glass tee. A chimney tray at the gas entrance limits gas liquid contact. The total gasflow rate to the column is quantified using a vortex flowmeter. The nozzle is held inside the glass column by meansof a custom disc which also allows placement of the nozzle at the geometric center of the glass section. The solventto be sprayed inside the glass column is pumped by means of a centrifugal pump, through a rotameter. The inletnozzle supply pressure is measured directly before the solvent enters the column. Fig. 2. Upper and lower sections of spray column [14] 3.1.2. PDI system The PDI technique permits measurement of drop size and velocity simultaneously, based on the phase shift andfrequency shift of refracted signals from drops [13]. The PDI system is configured to measure droplet velocity in thespray axial (vertical) direction (downward velocities: +ve; negative velocities: -ve). A custom eye-piece allowsPhase Doppler measurements inside the glass column through dense wall flow [14]. 3.2. Chemicals 0.015 m’of unloaded, Monoethanolamine (MEA) solutions (30 wt% & 40 wt%) were prepared and charged tothe feed tank before each run. Batches of 30 wt% MEA and 40 wt% MEA were made by mixing 9.28 kg of MEA(98 wt%, Acros Organics) with 10.71 kg of de-ionized water, and 12.4 kg of MEA (98 wt%, Acros Organics) with18.42 kg of de-ionized water, respectively. Indoor air spiked with pure CO, from a bank of cylinders was made toflow counter-current to the sprayed liquid. The raw indoor air rate, and CO2 injection rate, was measured by meansof a vortex meter, and mass flow meter, respectively. 3.3. Experimental conditions Table 1. Experimental conditions Temperature (C) 30 Liquid rate. 10(m’/s) 7.56 Gas velocity (m/s) 0.12 Nozzle details BETE 1/8 MPL 0.30 N; Full cone; 60° PDI axial location (m) 0.05 PDI radial measurements .10+ (m) 0, 12.7,25.4 4. Calculation 4.1. Molar flux The molar flux of CO2 is determined using Equation 1. The CO2 liquid composition is measured at the start of therun and after attainment of steady state to calculate the flux of CO2. The solvent CO2 loading is determined fromTotal Inorganic Carbon (TIC) analysis [15, 16, 17]. 4.2. Surface area Surface area in each axial plane is calculated based on the droplet size distribution data measured by the PDI atmultiple radial points inside the spray plume. Similar to the work of Bade and Schick [18], the spray plume isdivided into multiple concentric circular zones so that the radia points at which droplet size was measured lieswithin the limits of the zone as seen in Figure 3. It is assumed that the measured droplet size at each measurementpoint is representative of the droplet size across the entire concentric circular zone. Fig. 3. Concentric circular zones inside the spray plume. The volume of liquid sprayed passing through each zone is then computed under the assumption of uniformvolume flux distribution (m’of liquid sprayed /m’ cross sectional area). The volume of liquid sprayed through theentire plume equals the sum of the volume of liquids through each zone. The ratio of the volume / cross sectionalarea for each zone is the same. The number count in the droplet size distribution at each radial location is corrected to match the volume ofliquid passing through each zone. The surface area in each zone is then calculated based on the corrected count, and the raw droplet diameter data. The total surface area in the entire axial plane is the sum of the surface area of eachzone. (4) 5. Results and Discussion Table 2 shows the molar flux of CO measured for two concentrations of MEA. The molar flux is seen todecrease with increasing concentration of MEA. The decrease in the molar transfer flux can be attributed to theviscosity increase of MEA which increases the diffusive resistance. The increase in drop size results in a decrease ofthe cumulative surface area of all the drops. Table 2. Absorption rate information for two amine concentrations. Concentration of MEA (wt%) 30 40 CO2 rate (ft’/min) 1 1 Air rate (ft’/min) 7 7 Rich loading (mole COz/ mole alkalinity) 0.1549 0.1008 Lean loading (mole CO2/mole alkalinity) 0 0 Nco2 flux. 10(kmol/s) 0.6 0.1 To evaluate the contribution of cumulative surface area of all drops on measured flux, drop size measurementswere made for the two concentrations of MEA. Figure 4 shows the radial variation of dropsize with concentration ofMEA. The Sauter mean diameter was found to be larger for 40 wt% MEA at all three radial locations. The trend ofincreasing drop size with increasing concentration ofMEA is a result of all the physical properties of the twoconcentrations. Fig.4. Radial variation of Sauter mean diameter as a function of MEA concentration. The cumulative surface area of all drops in an axial plane 0.05 m downstream of the nozzle tip for both theconcentrations of MEA are shown in Figure 5. The surface area of 30 wt% MEA is greater than the surface area of40 wt% MEA in each corresponding zone. The planar cumulative surface area for 30 wt% MEA is marginallygreater than the cumulative surface area for 40 wt% MEA. The cumulative drop surface area depends on the dropletsize and count. In our surface area calculation procedure, the total drop count is back calculated to match the knownvolume of liquid passing through each concentric zone. The total drop count is calculated based on raw data. The Sauter mean diameters presented in Figure 4 are based on the actual droplet size and count recorded by the PDI,whereas the cumulative planar surface areas presented in Figure 5 are calculated based on the corrected dropletcount over the entire volume of liquid sprayed. Fig.5. Variation of planar surface area with MEA concentration. 6. Conclusions The present study showcases the utility of coupling absorption data with droplet size distribution data to provideinsight into spray absorption. Increasing concentration of MEA from 30 wt% to 40 wt% resulted in lowering of theCO2 molar flux. The Sauter mean diameter at all radial measurement points was found to be greater for 40 wt%MEA. The cumulative surface area of all drops in an axial plane was found to be marginally smaller for 40 wt%MEA, indicating that diffusive resistance due to increased viscosity may be the dominant factor in lowering themolar flux of CO2 into the solvent. Future work will utilize the techniques described in this paper to rigorouslymeasure the overall mass transfer coefficients in sprays. Acknowledgements The authors gratefully acknowledge Fractionation Research Incorporated (FRI) for partial funding of this project.The authors would like to thank Dr. Ken McCarley and Gary Yepsen at FRI for their consultation. The authorswould also like to thank Chad Sipperley and Will Bachalo from Artium Technologies for consultation regarding thePDI measurements. References ( [1]Rochelle, G.T. A mine scrubbing for CO2 capture. Science 2009; 325:5948-1652. ) ( [2] Oexmann J, Kather A. Minimising the regeneration heat d uty of post-combustion CO2 capture by wet chemical absorption: T h e misguided f ocus o n low heat of absorption solvents. Int J Greenh Gas Con 2 0 10; 4:1-36. ) ( [3] Tsai RE. Mass transfer area of structured packing. PhD Dissertation. The University of Texas at Austin. 2010. ) ( [4] Mehta K , S harma M . M a ss transfer in spray c olumns. Br. Chem. E n g 1970;15: 1 1-1440. ) ( [5] Javed KH, M ahmud T, Pu r ba E. The CO2 capture performance of a high-intensity vortex spray scrubber. Chem En g J 2010;162:2-456. ) ( [6] Abu-Zahram M, Sch n eiders L, N i ed e rer J, Fero n P, Ve r steeg G. CO2 capture from power plants: Part I. A par a metric study of the technical p erformance based on monoethanolamine. Int J Greenh Gas Con 2007;1:1-37. ) ( [7] Taniguchi I , Takamura Y , A s ano K. Ex p erimental stu d y of gas absorption with a s p ray column. J Chem Eng Jpn 1997; 30:3-427. ) ( [8] Dimiccoli A, Di Serio M, Santacesaria E. Mass transfer and kinetics in spray-tower-loop absorbers and reactors. Ind E n g Chem Res 2000 ; 39:11-4082. ) ( [9] Turpin A, Couvert A, Laplanche A, Paillier A. Experimental study of mass transfer an d H2S removal efficiency in a spray tower. Chem Eng P rocess: Process I n tensif 2008; 47:5-886. ) ( [10] Bandyopadhyay A, Biswas MN. CO2 capture in a spray column using a critical flow atomizer. Sep Purif Technol 2012; 94:0-104. ) ( [11] Kuntz J, Aroonwilas A. Performance of spray column for CO2 capture application. Ind Eng Chem Res 2007; 47:1-145. ) ( [12] Koller M, Wappel D , Trofaier N, Gronald G. Test results of CO2 spray scrubbing with Monoethanolamine. Energy Procedia 2011:4:0-1777. ) ( [13] Bachalo WD, H o user MJ. Phase/Doppler spray analyzer for simultaneous measurements of drop size and velocity distributions. Opt E ng 1984;23:5-235583. ) ( [14] Tamhankar YS, Whiteley JR, Resetarits MR , Aichele CP. Spray droplet characterization inside a glass column through dense wall flow.Atomization a nd Sprays 2 014; 2 4:2-115. ) ( [15] Critchfield J. CO 2 absorption/desorption i n methyldiethanolamine solutions promoted with monoethanolamine and diethanolamine: mass t ransfer and r eaction kinetics. PhD Dissertation. The University of Texas at Austin. 1998. ) ( [16] Hilliar d M. A predictiv e thermodynamic model for an aqueous blend of Potassium Carbonate, Piperazine, and M onoethanolamine forCarbon Dioxide capture f r om flue Gas. PhD Dissertation. T he University of Texas at Austin.2008. ) ( [17] Freeman S. Thermal degradation and oxidation of aqueous Piperazine for Carbon Dioxide capture. PhD Dissertation. The U niversity ofTexas at Austin. 2011. ) ( [18] Bade K , S chick R. Volume distribution c o mparison methods for 1D, 2D, and poin t measurement Techniques. Proceedings of the 21st Annual Conference of the Institute for Liquid A tomization and Spray Systems Ame r icas. May 2 008. Orlando, FL. ) Spray columns can potentially be utilized for absorbing CO2 from large point sources such as flue gas exhausted by power plants.Low gas phase pressure drop, and the lack of internals which are susceptible to corrosion, make spray columns well suited foraqueous amine absorption. Design practices for spray columns are highly empirical and application specific. There is a paucity ofdata on absorption of CO2 in aqueous amine sprays. Mass transfer data for CO2-amine systems is required for robust design ofspray columns. Further, the absorption efficiency of sprays is greatly influenced by the surface area of drops, which in turndepends on the droplet size distribution. However, experimental data for droplet size distributions inside aqueous amine sprays isnon-existent. Measurement of droplet size distributions is critical in providing a fundamental insight into spray absorption. Thiswork presents molar flux data coupled with droplet size distribution data for CO2 absorption into Monoethanolamine (MEA)spray. Both the molar flux measurements and the droplet size measurements are made inside a 0.2 m glass column. The dropletsize distributions are measured using a Phase Doppler Interferometer (PDI). Further, a novel method is utilized to quantify theavailable surface area from the droplet size distribution measurements. The effect of MEA concentration on molar flux, dropletsize, and surface area is presented.
确定


还剩6页未读,是否继续阅读?

产品配置单

北京欧兰科技发展有限公司为您提供《胺水溶液,二氧化碳,液滴中喷雾液滴粒径分布检测方案(激光干涉仪)》,该方案主要用于工业气体中喷雾液滴粒径分布检测,参考标准--,《胺水溶液,二氧化碳,液滴中喷雾液滴粒径分布检测方案(激光干涉仪)》用到的仪器有激光相位多普勒干涉仪LDV,PDI,PDPA,PDA、Artium PDI-FP 双量程可机载飞行探头、LaVision SprayMaster 喷雾成像测量系统
推荐专场


相关方案
更多
该厂商其他方案
更多