


采用Ekspla公司的NT342型可调谐纳秒激光器光源,采用超级分辨算法对氩和氖光谱分辨率增强进行了研究。
方案详情

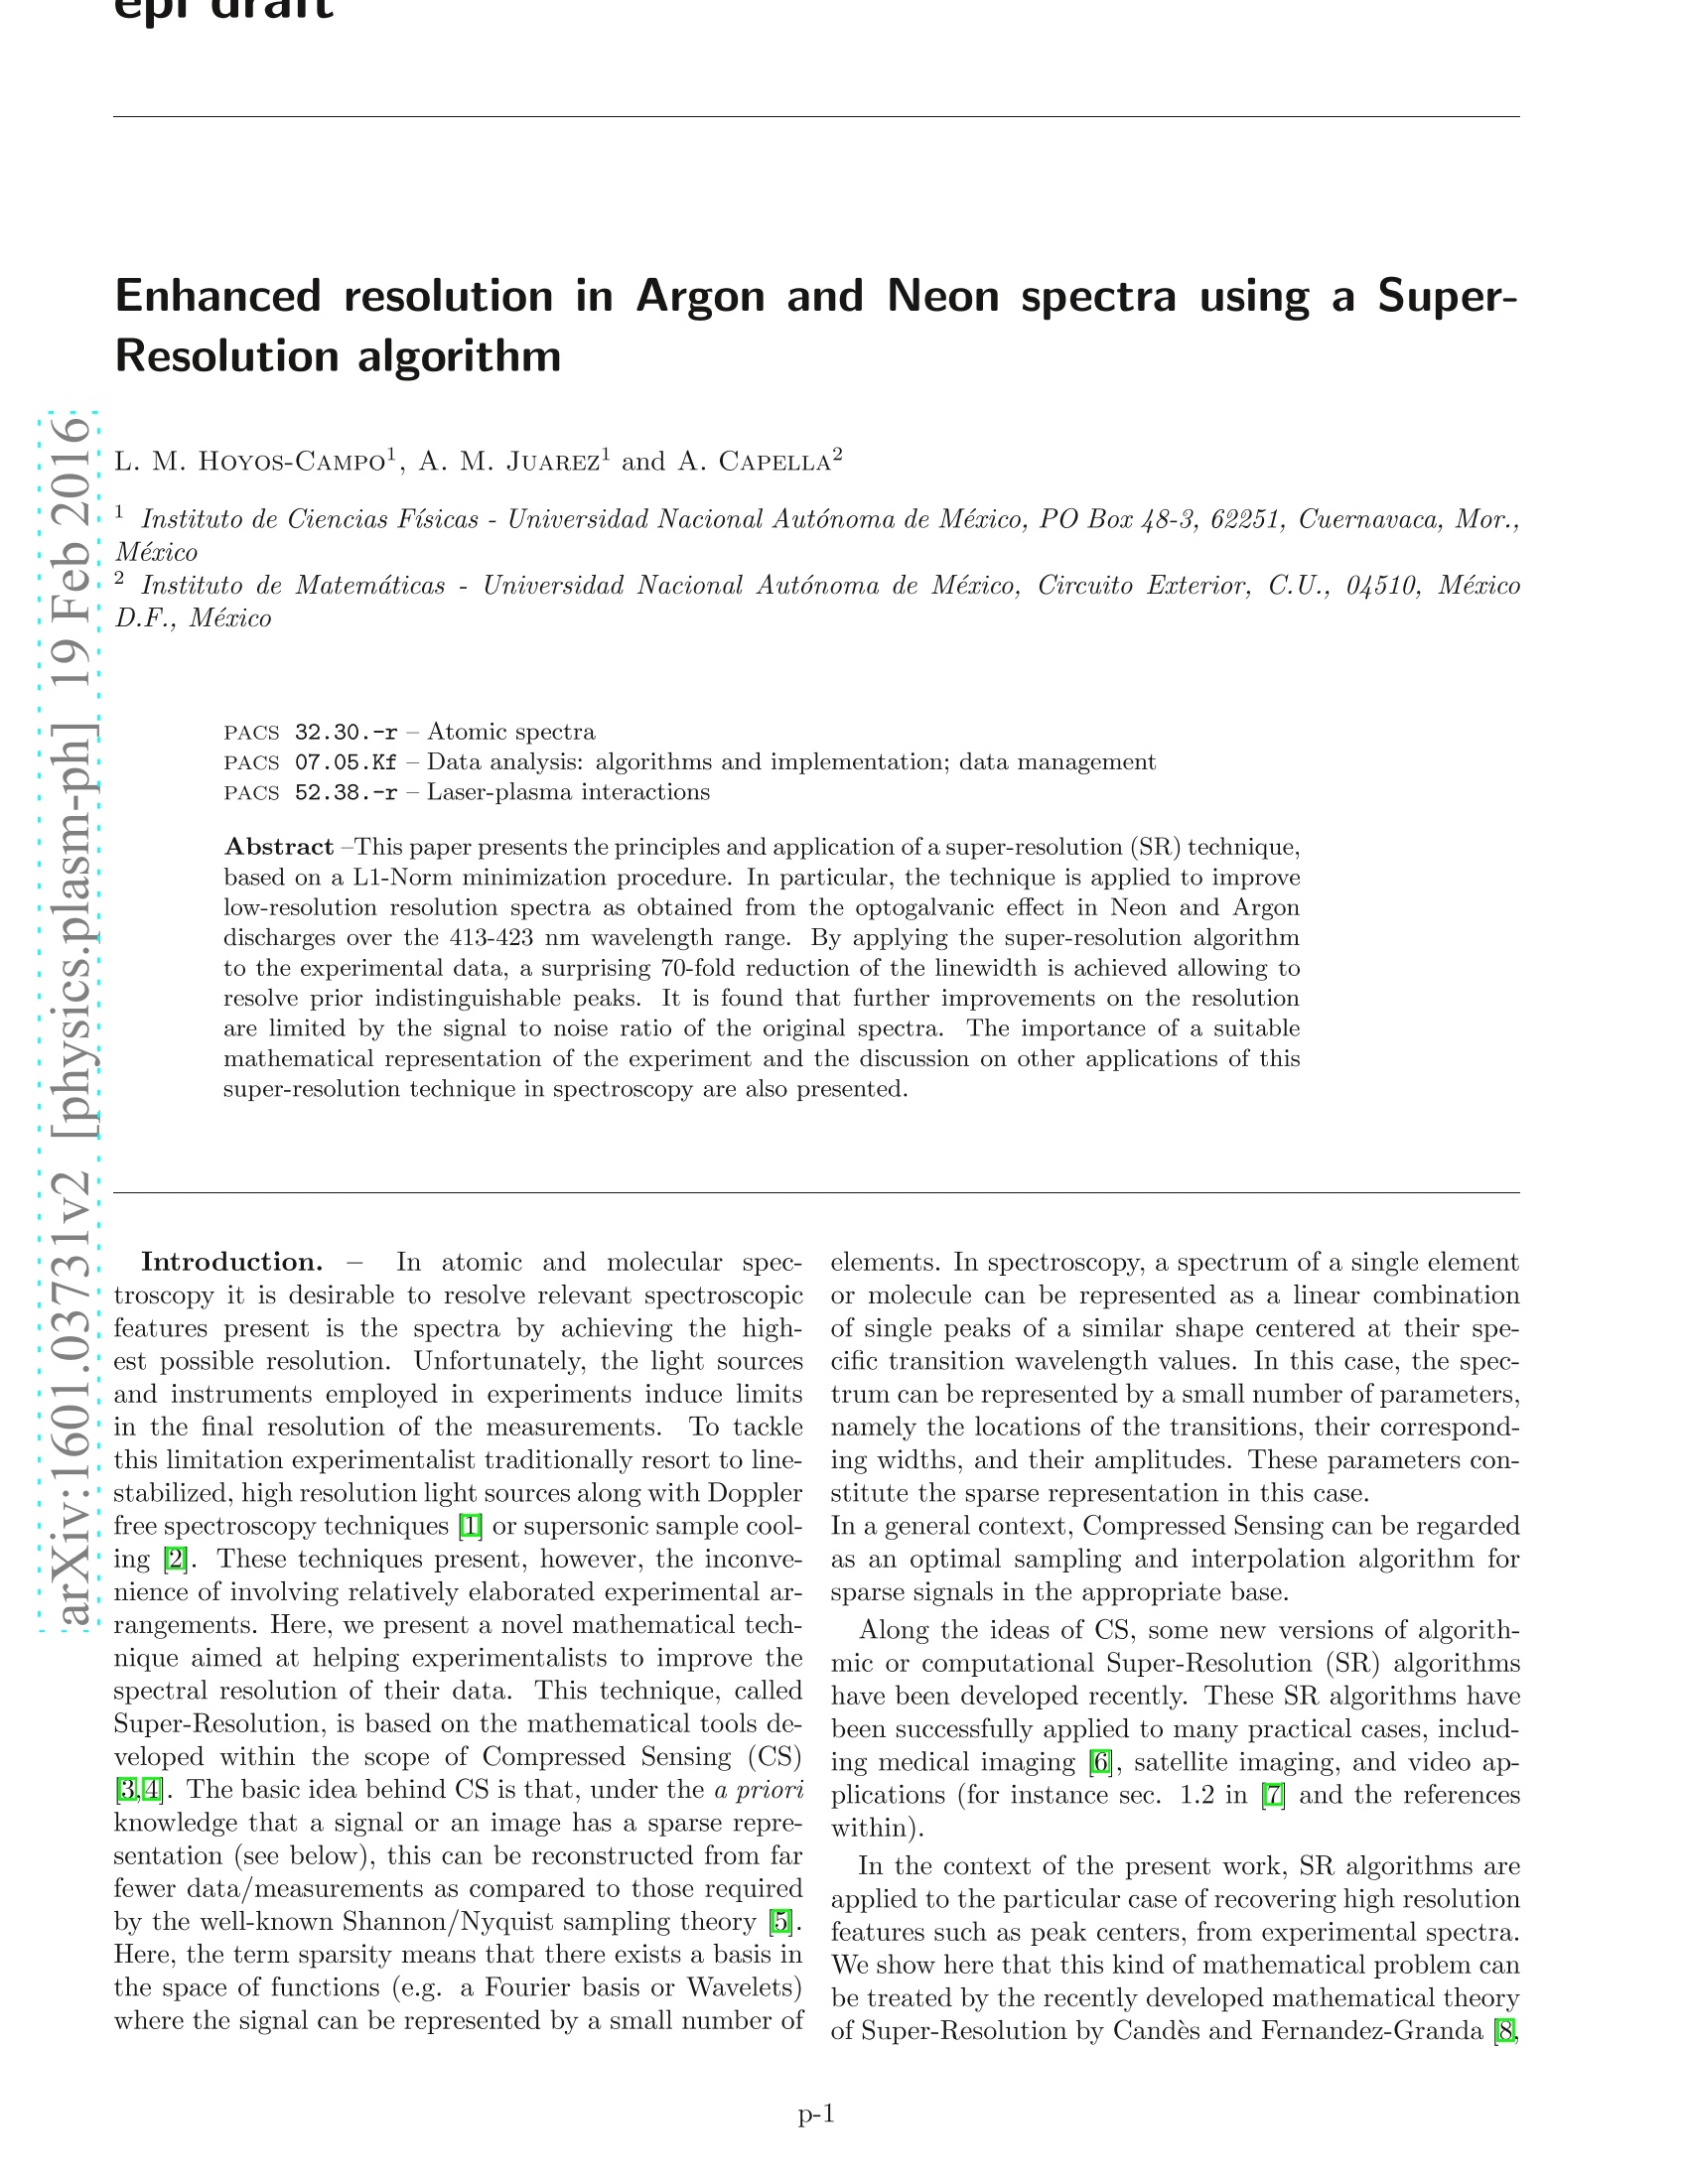
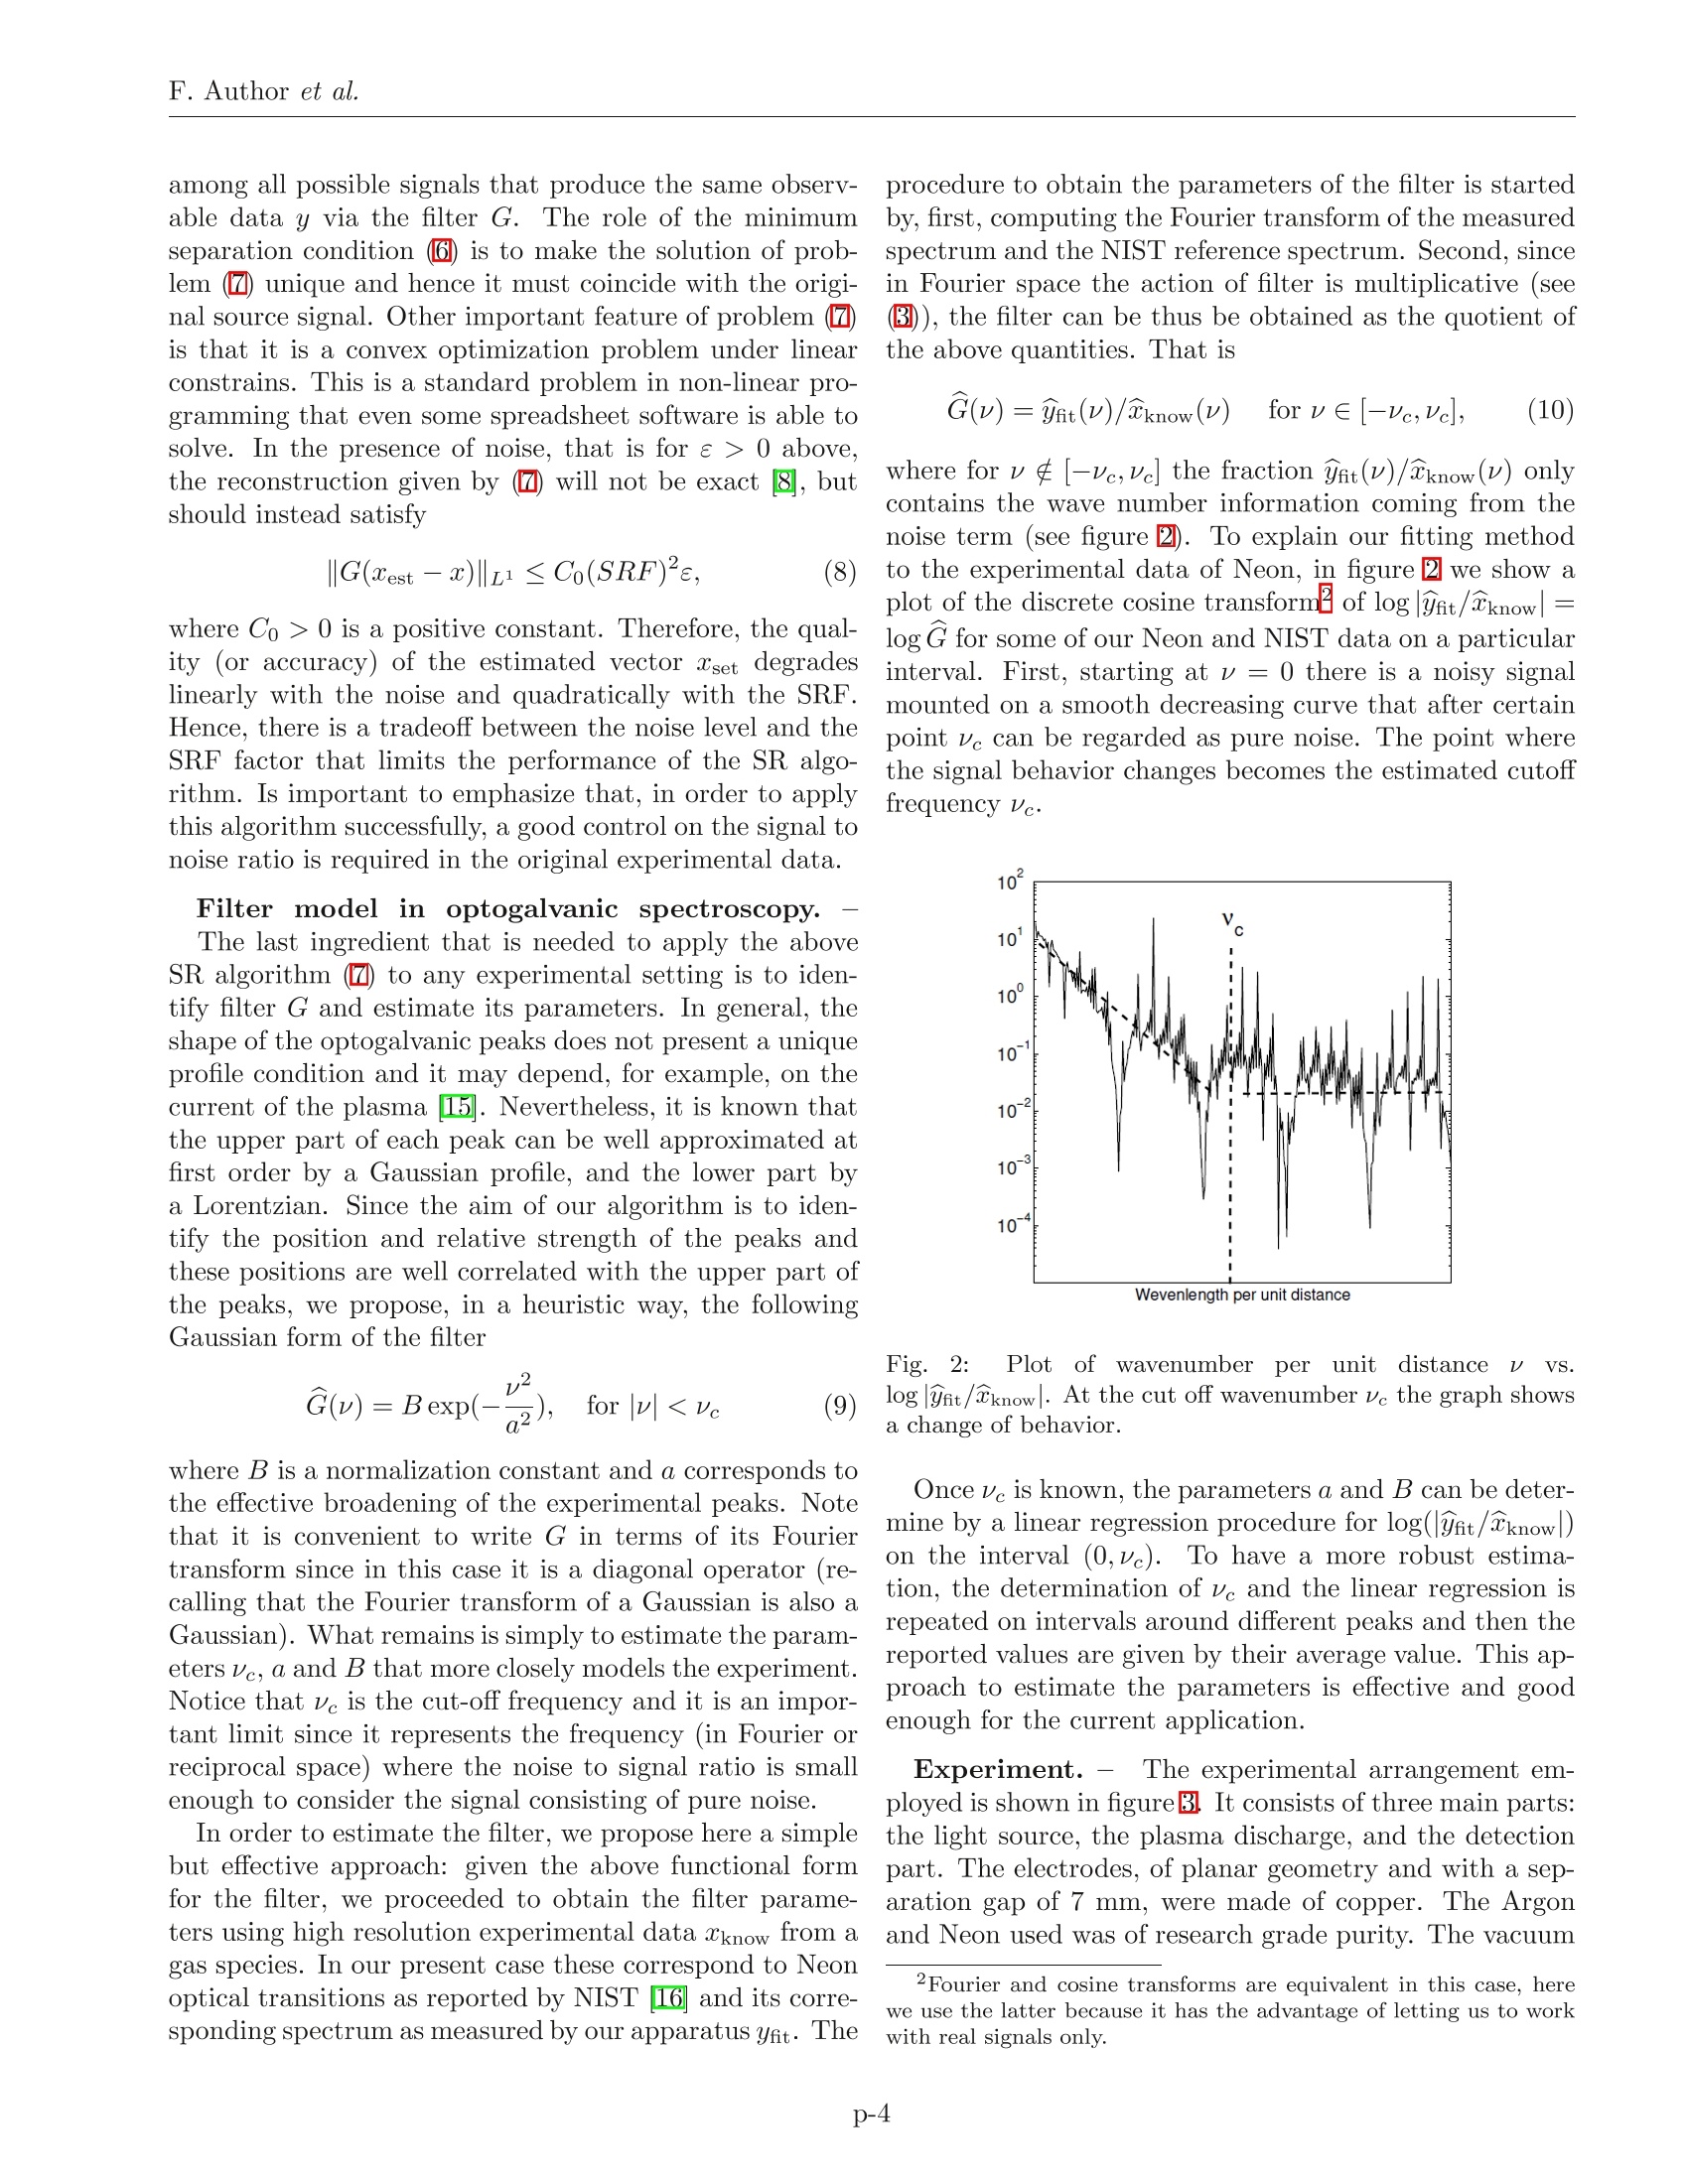
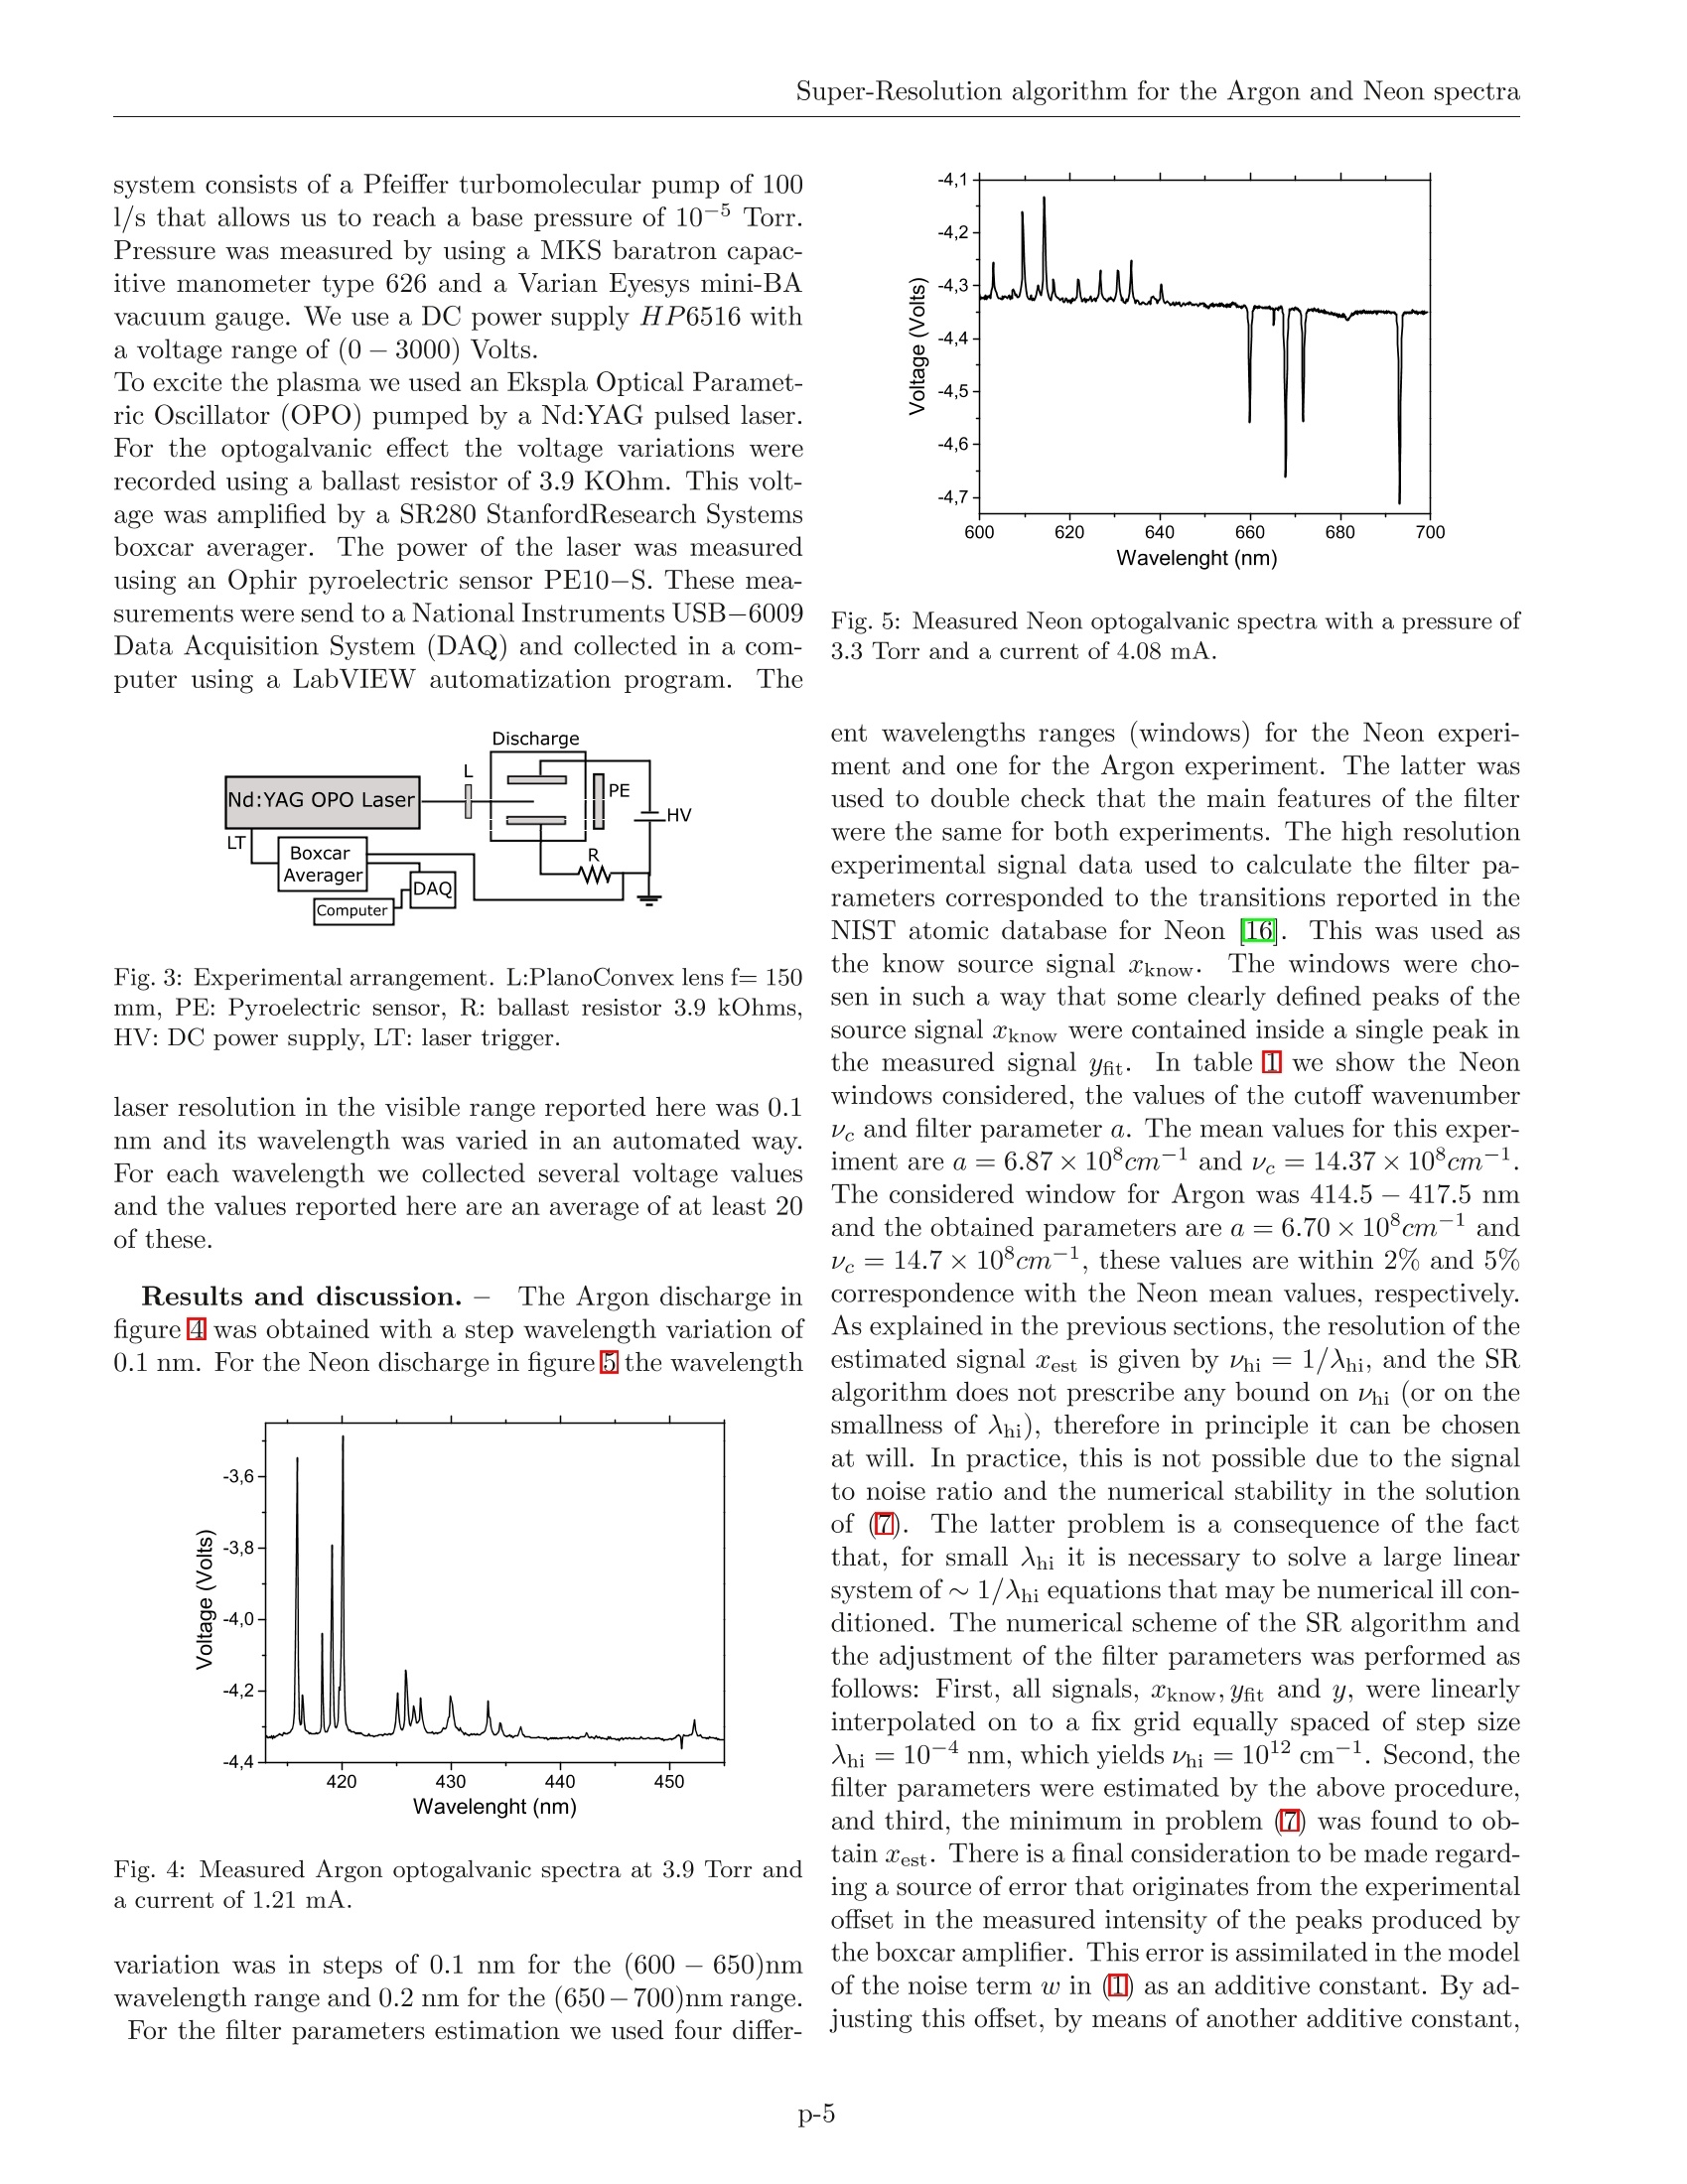
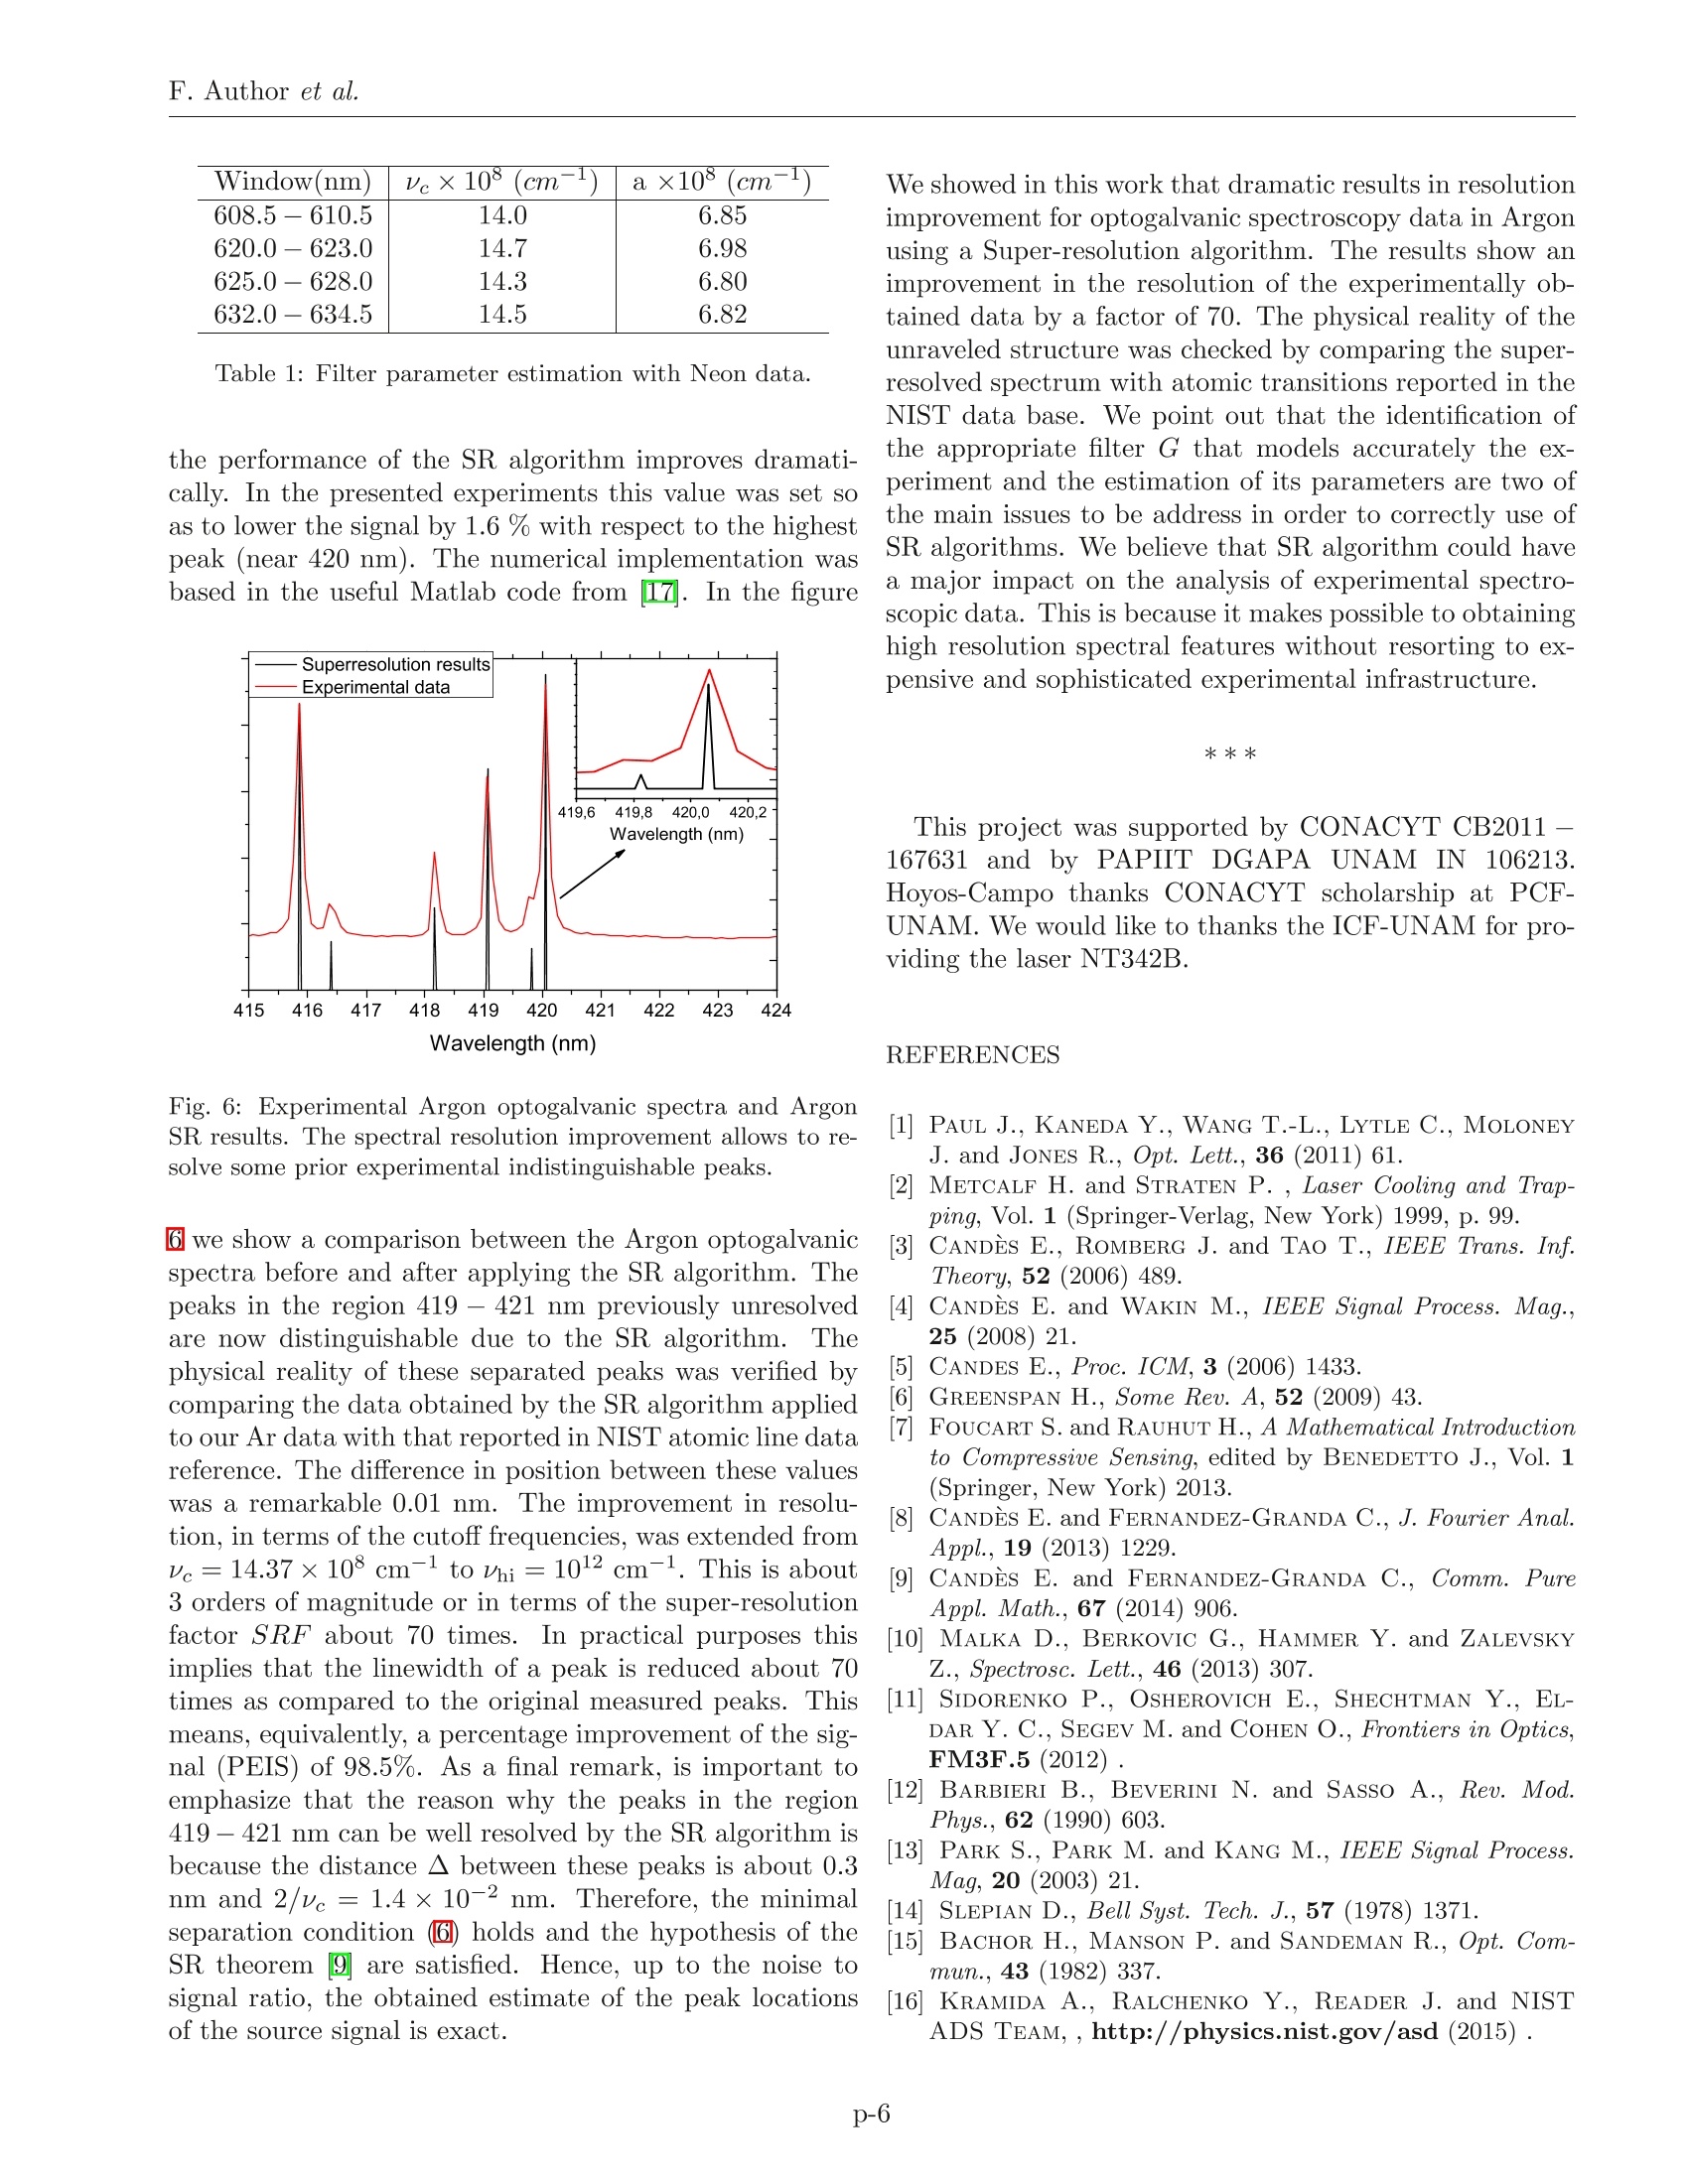
F. Author et al. Super-Resolution algorithm for the Argon and Neon spectra Enhanced resolution in Argon and Neon spectra using a Super-Resolution algorithm 'L. M. HoYos-CAMPO1, A. M. JUAREz and A. CAPELLA PACS 32.30.-r-Atomic spectra PACS 07.05.Kf -Data analysis: algorithms and implementation; data management PACS 52.38.-r-Laser-plasma interactions Abstract-This paper presents the principles and application of a super-resolution (SR) technique,based on a L1-Norm minimization procedure. In particular, the technique is applied to improvelow-resolution resolution spectra as obtained from the optogalvanic effect in Neon and Argondischarges over the 413-423 nm wavelength range. By applying the super-resolution algorithmto the experimental data, a surprising 70-fold reduction of the linewidth is achieved allowing toresolve prior indistinguishable peaks. It is found that further improvements on the resolutionare limited by the signal to noise ratio of the original spectra.The importance of a suitablemathematical representation of the experiment and the discussion on other applications of thissuper-resolution technique in spectroscopy are also presented. .1 Instituto de Ciencias Fisicas-Universidad Nacional Autonoma de Mexico, PO Box 48-3, 62251, Cuernavaca, Mor.,y.Mecico). 2 Instituto de Matematicas - Universidad Nacional Autonoma de Mexico, Circuito Exterior, C.U.,04510, Mexico'D.F.. Menico>OO卜点 Introduction. - l In atomic and molecular spec-troscopy it is desirable to resolve relevant spectroscopicfeatures present is the spectra by achieving the high-est possible resolution. Unfortunately, the light sourcesand instruments employed in experiments induce limitsin the final resolution of the measurements. To tacklethis limitation experimentalist traditionally resort to line-.stabilized, high resolution light sources along with Dopplerfree spectroscopy techniques山or supersonic sample cool-ing2.These techniques present, however, the inconve-nience of involving relatively elaborated experimental ar-rangements. Here, we present a novel mathematical tech-nique aimed at helping experimentalists to improve thespectral resolution of their data. This technique, calledSuper-Resolution, is based on the mathematical tools de-veloped within the scope of Compressed Sensing(CS)34. The basic idea behind CS is that, under the a prioriknowledge that a signal or an image has a sparse repre-sentation (see below), this can be reconstructed from farfewer data/measurements as compared to those requiredby the well-known Shannon/Nyquist sampling theoryylHere, the term sparsity means that there exists a basis inthe space of functions (e.g. a Fourier basis or Wavelets)where the signal can be represented by a small number of eelements. In spectroscopy, a spectrum of a single elementor molecule can be represented as a linear combinationof single peaks of a similar shape centered at their spe-cific transition wavelength values. In this case, the spec-trum can be represented by a small number of parameters,namely the locations of the transitions, their correspond-ing widths, and their amplitudes. These parameters con-stitute the sparse representation in this case. In a general context, Compressed Sensing can be regardedas an optimal sampling and interpolation algorithm forsparse signals in the appropriate base. Along the ideas of CS, some new versions of algorith-mic or computational Super-Resolution (SR) algorithmshave been developed recently. These SR algorithms havebeen successfully applied to many practical cases, includ-ing medical imaging固, satellite imaging, and video ap-plications (for instance sec. 1.2 in口and the referenceswithin). In the context of the present work, SR algorithms areapplied to the particular case of recovering high resolutionfeatures such as peak centers, from experimental spectra.We show here that this kind of mathematical problem canbe treated by the recently developed mathematical theoryof Super-Resolution by Candes and Fernandez-Granda B The aim of this paper is to show that SR algorithmscan also be a valuable tool in spectroscopy by allowingto resolve peaks that cannot be separated from the origi-nal data due to instrumental limits in spectral resolution0. In particular, we show here that the SR algo-rithm can dramatically improve the resolution of measure-ments, in particular allowing a surprising effective 70-foldreduction in the linewidth of the original spectral measure-ments. This improvement allows to separate apart realstructures that are not resolved in the original experimen-tal data. In particular, in order to test and quantitativelyshow the power of the SR technique, we present here ex-perimental optogalvanic spectra of well-known Neon andArgon atomic transitions. Upon the application of the SRtechnique we can quantify dramatic improvements in theresolved features. The optogalvanic effect (OGE) consistof a change in the total current of a plasma when interact-ing with laser light. The change is resonant when the laserwavelength corresponds to an atomic or molecular transi-tion of the gas species present in the plasma [2. Althoughthe specific example shown here is devoted to the OGE ef-fect, we believe SR algorithms can be applied in otherspectroscopic areas, including photoionization, photoab-sorption, Raman or others. To the best of our knowledgeethis is the first application of super-resolution algorithmsbased on compressed sensing ideas aimed at improving theresolution of spectroscopic measurements. Super-Resolution algorithms. -In any imagingsystem, the resolution limit is measured by the shortestseparation between two features, before they mingle intoone.The limitations of the instrument used and, on amore fundamental level, the diffraction limit set the con-straints to the maximum experimentally achievable reso-lution in any optical system. There are currently severalinstances and many different approaches to SR in imaging,and we invite the reader to revise the exciting applicationsof optical super-resolution currently being developed(e.g.3 and references within). In an analogous manner asin optics, in any type of optical spectroscopy, the spectralresolution is limited by the linewidth of the light sourceand quantified by the minimum separation in wavelengthrequired to clearly separate apart two different transitions.This has been traditionally considered the ultimate limitof resolution in spectroscopy. Since the applications of SRtechniques to spectroscopy are scarce and not widespreadin the experimental community, we will give a basic intro-duction in the context of optogalvanic spectroscopy. Let us denote by y a one dimensional acquired signal asobtained from a sourcea through an optical or any othermeasuring device. In our particular case y corresponds tothe optogalvanic signal as and s corresponds to the orig-inal spectrum as produced by the physical interaction ofthe laser with the plasma. Assume, as it happens in ouroptogalvanic case, that the values of y and s both dependon the wavelength入. A mathematical model of such a pro-)- cess can be described by the following convolution model Here, G represents, mathematically, the effect of the mea-surement equipment process upon the original physicaldata, s is an integration variable and w is a noise termthat can be deterministic or stochastic and such that but otherwise arbitrary. Here, |w||zi denotes the contin-uum version of the vector norm, colloquially known as thetaxicab norm. Notice that e ≥0 is a constant measuringthe noise level of the acquired signal. In the reciprocalspace ) bbecomes where G denotes the Fourier transform of the functionG and v= 1/入 is the usual definition of wavelength perunit distance. In this mathematical representation the in-strument G can be seen as a low pass filter that limitsthe bandwidth of an otherwise ideal and spectrally nar-row source signal. In (B)3)ve >0 is the cutoff number ofwavelength per unit distance of such a filter. For the mo-ment, and for simplicity in the exposition, we discard thenoise term of ) by lettinge=0. Formally, the aim of the SR algorithms is to find anestimate est of the source a such that: where Vhi > ve and sest denotes the Fourier transform ofthe estimate Sest. In simpler terms, the aim of SR is touse the frequency limited information as produced by theinstrument (or light source) to make an extrapolation (inthis case sest) to higher frequencies in reciprocal space.This extrapolation would allow, upon an inverse Fouriertransformation, to obtain a far richer spectrum, i.e. the“super-resolved”spectrum as compared to that obtainedoriginally from y, which corresponds to the measured spec-trum. A quantitative measure of the improvement in oursignal can be defined in terms the super-resolution factorSRF=Vhi vc. An alternative way to measure the effectof the SR algorithm on the data is to define the percentageimprovement of the signal (PEIS) as (1-(SRF)-I)*100.It is well known that the problem given as in团) iiss hope-lessly ill posed, namely the solution Sest may not exist ormay not be unique 14. This means that, based on a trun-cated Fourier transform, one may find a very large set ofextrapolations that faithfully represent the original datawithin the interval [-vc,Ve], but which are wildly differ-ent outside this interval. This many solutions would not necessarily have any physical meaning even if they sat-isfied ). Remarkably, in the case where the source a iscomposed of a “well separated”train of point-like sources,problem () becomes tractable. This kind of sources canbe modeled by where and aj are the locations (in the spectrum) andintensities of the point sources, respectively, o, is the Diracdelta functionand T is a given set of numeration indexes. As mentioned in the introduction, the above model canbe used as a simple model for atomic or molecular transi-tions. In these, their linewidths even when Doppler broad-ened, are very narrow as compared to the spectral reso-lution of the laser used in the experiment. We emphasizeagain that the models and method in this paper will beonly useful to determine the locations and relative inten-sities of the spectral lines..The present analysis is notvalid when the linewidth of the laser is small as comparedto the Doppler broadening of the transitions. For such acase a more realistic modeling of the transition linewidthson the source should be proposed, but that goes beyondthe scope of this work. Next, we define the minimum separation of the pointsources as △= mini,jeTAj-A| where Ai,A denote againtheir locations on the spectral line. The main result of theSR theory states that, if the point sources are sufficientlyapart from each other, namely then there exist an efficient algorithm that recovers ex-actly the original source. In other words, problem (④))hasa unique solution Jest=3. This solution can be computedby solving a convex minimization problem that is, find-ing the minimum of a convex function under constrains(e.g. () below). Notice that there is no bound on Vhi so inprinciple, at least mathematically, the improvement on theresolution may be infinite (namely, SRF=+oo), and thelocation of the point sources can be determined with infi-nite precision. As we will see latter, the presence of noiseimposes natural constrain on SRF, hence on the improve-ment that can be obtained by the estimate est. Beforestating the SR algorithm in detail, we need another ingre-dient. In digital signal processing, as in any digital dataacquisition experiment, there is a finite size in the wave-length step that is acquired, so sources and signals can beregarded both as discrete finite vectors x=(a1,...,an)and y=(y1,...,yn) measured at fixed grid of equallyspaced wavelengths . In the case of continuous signals, the filter resolution isdefined by vc, that is, the width of the low-pass filter G(see Figure J)) and it is related to the physical propertiesof the experimental setting. In the experiments we alsohave another loss of resolution due to the finite size of ( I n mathematical r i gor o, is a Dirac measure. ) Ssampling,i.e. the wavelength step. Notice that the latterloss of resolution may change, for example, by reducingthe scanning step of the laser used in the experiment, butthis does not affect the resolution of the filter G. The aimof SR algorithms is to reverse (or deconvolve) the effect ofthe filter G on the source signal. Once the sampling stepsize is smaller that certain threshold its effect on the SRalgorithms is negligible. This important difference, com-bined with the unboundedness of the zhi and the separatedpoint source nature of the source signal explain why, in ourcase, the improvement in resolution seems to be indepen-dent of the finite sampling step size (see Figure). Now, Fig. 1: Convolution of a train of point sources with a Gaus-sian filter. The graphs on the right show:(Top) the results fora continuous signal. (Bottom) the same signal after samplingon a discrete grid. The basic features of the continuous sig-nal can be recovered by an interpolation of the discrete one.Hence, regarding the filter G, both graphs have the same cutoffwavelength per unit distance ve. again discarding noise, )bbecomes or in more compact notation we write y= G where Gis an N x N matrix whose entries are given by Gej=G(Xe-sj).Hence, the SR problem is reduced tofinding out the entries aj of the vector .As proposedin g, to solve this problem it is enough to solve a convexminimization program, namely where ||i|z ==ilajl. The main result in g:is thatthe problem () Ihas a unique solution Nest that coincideswith the original a over the original range of inverse space,but has a much larger span of harmonics beyond the in-terval defined by the original cutoff wave number. Thisis a surprising result and problem is at the core ofthe mathematical theory of super resolution. The mainfeature of the L--minimization, that“explains why” thesolution of ()irecovers the original signal, is that, it is anefficient way to detect the support of the sparsest signals(that is, signals that contain the least number of peaks) among all possible signals that produce the same observ-able data y via the filter G. The role of the minimumseparation condition )) is to make the solution of prob-lemn( ) unique and hence it must coincide with the origi-nal source signal. Other important feature of problem lis that it is a convex optimization problem under linearconstrains. This is a standard problem in non-linear pro-gramming that even some spreadsheet software is able tosolve. In the presence of noise, that is for e > 0 above,the reconstruction given by (()will not be exact , butshould instead satisfy where Co > 0 is a positive constant. Therefore, the qual-ity (or accuracy) of the estimated vector set degradeslinearly with the noise and quadratically with the SRF.Hence, there is a tradeoff between the noise level and theSRF factor that limits the performance of the SR algo-rithm. Is important to emphasize that, in order to applythis algorithm successfully, a good control on the signal tonoise ratio is required in the original experimental data. Filter model in optogalvanic spectroscopy. The last ingredient that is needed to apply the aboveSR algorithm ()) to any experimental setting is to iden-tify filter G and estimate its parameters. In general, theshape of the optogalvanic peaks does not present a uniqueprofile condition and it may depend, for example, on thecurrent of the plasma15. Nevertheless, it is known thatthe upper part of each peak can be well approximated atfirst order by a Gaussian profile, and the lower part bya Lorentzian. Since the aim of our algorithm is to iden-tify the position and relative strength of the peaks andthese positions are well correlated with the upper part ofthe peaks, we propose, in a heuristic way, the followingGaussian form of the filter where B is a normalization constant and a corresponds tothe effective broadening of the experimental peaks. Notethat it is convenient to write G in terms of its Fouriertransform since in this case it is a diagonal operator (re-calling that the Fourier transform of a Gaussian is also aGaussian). What remains is simply to estimate the param-eters ve, a and B that more closely models the experiment.Notice that ve is the cut-off frequency and it is an impor-tant limit since it represents the frequency (in Fourier orreciprocal space) where the noise to signal ratio is smallenough to consider the signal consisting of pure noise. In order to estimate the filter, we propose here a simplebut effective approach: given the above functional formfor the filter, we proceeded to obtain the filter parame-ters using high resolution experimental data sknow from agas species. In our present case these correspond to Neonoptical transitions as reported by NIST 16 and its corre-sponding spectrum as measured by our apparatus yft. The - procedure to obtain the parameters of the filter is startedby, first, computing the Fourier transform of the measuredspectrum and the NIST reference spectrum. Second, sincein Fourier space the action of filter is multiplicative (see③)), the filter can be thus be obtained as the quotient ofthe above quantities. That is where for v[-ve,Ve] the fraction yfit(v)/ know(v) onlycontains the wave number information coming from thenoise term (see figure 2). To explain our fitting methodto the experimental data of Neon, in figure 2ywe show aplot of the discrete cosine transform3 of log|Vit/ knowl=log G for some of our Neon and NIST data on a particularinterval. First, starting at v =0 there is a noisy signalmounted on a smooth decreasing curve that after certainpoint ve can be regarded as pure noise. The point wherethe signal behavior changes becomes the estimated cutofffrequency Vc· Fig. 2: Plotofwavenumber per:unit distance VS.logyft/ know|. At the cut off wavenumber ve the graph showsa change of behavior. Once ve is known, the parameters a and B can be deter-mine by a linear regression procedure for log(lyft/@knowl)on the interval (0,ve). To have a more robust estima-tion, the determination of ve and the linear regression isrepeated on intervals around different peaks and then thereported values are given by their average value. This ap-proach to estimate the parameters is effective and goodenough for the current application. Experiment. The experimental arrangement em-ployed is shown in figure3. It consists of three main parts:the light source, the plasma discharge, and the detectionpart. The electrodes, of planar geometry and with a sep-aration gap of 7 mm, were made of copper. The Argonand Neon used was of research grade purity. The vacuum ( Fourier and c o sine transforms are equivalent i n t his case, here we use the latter b ecause it h as t he advantage o f l e tting us to work with real s ignals only. ) system consists of a Pfeiffer turbomolecular pump of 100l/s that allows us to reach a base pressure of 10-5 Torr.Pressure was measured by using a MKS baratron capac-itive manometer type 626 and a Varian Eyesys mini-BAvacuum gauge. We use a DC power supply HP6516 witha voltage range of (0 -3000) Volts. To excite the plasma we used an Ekspla Optical Paramet-ric Oscillator (OPO) pumped by a Nd:YAG pulsed laser.For the optogalvanic effect the voltage variations wererecorded using a ballast resistor of 3.9 KOhm. This volt-age was amplified by a SR280 StanfordResearch Systemsboxcar averager. The power of the laser was measuredusing an Ophir pyroelectric sensor PE10-S. These mea-surements were send to a National Instruments USB-6009Data Acquisition System (DAQ) and collected in a com-puter using a LabVIEW automatization program.The Fig. 3: Experimental arrangement. L:PlanoConvex lens f= 150mm, PE: Pyroelectric sensor, R: ballast resistor 3.9 kOhms,HV: DC power supply, LT: laser trigger. laser resolution in the visible range reported here was 0.lnm and its wavelength was varied in an automated way.For each wavelength we collected several voltage valuesand the values reported here are an average of at least 20of these. Results and discussion. -The Argon discharge infigure④ was obtained with a step wavelength variation of0.1 nm. For the Neon discharge in figure 5 the wavelength Fig. 4: Measured Argon optogalvanic spectra at 3.9 Torr anda current of 1.21 mA. variation was in steps of 0.1 nm for the (600- 650)nmwavelength range and 0.2 nm for the (650-700)nmrange.For the filter parameters estimation we used four differ- Fig. 5: Measured Neon optogalvanic spectra with a pressure of3.3 Torr and a current of 4.08 mA. ent wavelengths ranges (windows) for the Neon experi-ment and one for the Argon experiment. The latter wasused to double check that the main features of the filterwere the same for both experiments. The high resolutionexperimental signal data used to calculate the filter pa-rameters corresponded to the transitions reported in theNIST atomic database for NeonThis was used asLa·the know source signal cknow.The windows were cho-sen in such a way that some clearly defined peaks of thesource signal cknow were contained inside a single peak inthe measured signal yfitI.n Itna btlabel e we show the Neonwindows considered, the values of the cutoff wavenumberve and filter parameter a. The mean values for this exper-iment are a=6.87×10°cm-1 and vc=14.37×10°cm-1.The considered window for Argon was 414.5 - 417.5 nmand the obtained parameters are a =6.70×10°cm-andve= 14.7×10°cm-1, these values are within 2% and 5%correspondence with the Neon mean values, respectively.As explained in the previous sections, the resolution of theestimated signal sest is given by thi =1/Xhi, and the SRalgorithm does not prescribe any bound on Vhi (or on thesmallness of Xhi), therefore in principle it can be chosenat will. In practice, this is not possible due to the signalto noise ratio and the numerical stability in the solutionof C).The latter problem is a consequence of the factthat, for small Xhi it is necessary to solve a large linearsystem of~1/Xhi equations that may be numerical ill con-ditioned. The numerical scheme of the SR algorithm andthe adjustment of the filter parameters was performed asfollows: First, all signals, know,Vfit and y, were linearlyinterpolated on to a fix grid equally spaced of step size入hi=10-4 nm, which yields hi=1012 cm-1. Second,thefilter parameters were estimated by the above procedure,and third, the minimum in problem () was found to ob-tain Cest. There is a final consideration to be made regard-ing a source of error that originates from the experimentaloffset in the measured intensity of the peaks produced by1the boxcar amplifier. This error is assimilated in the modelof the noise term w in as an additive constant. Byad-justing this offset, by means of another additive constant, Window(nm) vex10° (cm 1) ax10(cm--) 608.5-610.5 14.0 6.85 620.0-623.0 14.7 6.98 625.0-628.0 14.3 6.80 632.0-634.5 14.5 6.82 Table 1: Filter parameter estimation with Neon data. the performance of the SR algorithm improves dramati-cally. In the presented experiments this value was set soas to lower the signal by 1.6 % with respect to the highestpeak (near 420 nm). The numerical implementation wasbased in the useful Matlab code from口17. In the figure Fig. 6: Experimental Argon optogalvanic spectra and ArgonSR results. The spectral resolution improvement allows to re-solve some prior experimental indistinguishable peaks. 6l we show a comparison between the Argon optogalvanicspectra before and after applying the SR algorithm. Thepeaks in the region 419 -421 nm previously unresolvedare now distinguishable due to the SR algorithm. Thephysical reality of these separated peaks was verified bycomparing the data obtained by the SR algorithm appliedto our Ar data with that reported in NIST atomic line datareference. The difference in position between these valueswas a remarkable 0.01 nm. The improvement in resolu-tion, in terms of the cutoff frequencies, was extended fromvc=14.37×10°cm-1 to Vhi=1012 cm-1. This is about3 orders of magnitude or in terms of the super-resolutionfactor SRF about 70 times. In practical purposes thisimplies that the linewidth of a peak is reduced about 70times as compared to the original measured peaks. Thismeans, equivalently, a percentage improvement of the sig-nal (PEIS) of 98.5%. As a final remark, is important toemphasize that the reason why the peaks in the region419 - 421 nm can be well resolved by the SR algorithm isbecause the distance between these peaks is about 0.3nm and 2/vc= 1.4×10⁻² nm. Therefore, the minimalseparation condition )) holds and the hypothesis of theSR theorem g are satisfied. Hence, up to the noise tosignal ratio, the obtained estimate of the peak locationsof the source signal is exact. We showed in this work that dramatic results in resolutionimprovement for optogalvanic spectroscopy data in Argonusing a Super-resolution algorithm. The results show animprovement in the resolution of the experimentally ob-tained data by a factor of 70. The physical reality of theunraveled structure was checked by comparing the super-resolved spectrum with atomic transitions reported in theNIST data base. We point out that the identification ofthe appropriate filter G that models accurately the ex-periment and the estimation of its parameters are two ofthe main issues to be address in order to correctly use ofSR algorithms. We believe that SR algorithm could havea major impact on the analysis of experimental spectro-scopic data. This is because it makes possible to obtaininghigh resolution spectral features without resorting to ex-pensive and sophisticated experimental infrastructure. **> This project was supported by CONACYT CB2011-167631anddby PAPIIT DGAPAUNAM IN 106213.Hoyos-Campo thanks CONACYT scholarship at PCF-UNAM. We would like to thanks the ICF-UNAM for pro-viding the laser NT342B. REFERENCES 1 PAUL J., KANEDA Y., WANG T.-L., LYTLE C., MOLONEYJ.and JoNES R., Opt. Lett., 36 (2011) 61. 2METCALF H. and STRATEN P., Laser Cooling and Trap-ping, Vol. 1 (Springer-Verlag, New York) 1999, p. 99.3 CANDES E., RoMBERG J. and TAO T., IEEE Trans. Inf.Theory, 52 (2006) 489. [4CANDES E. and WAKIN M., IEEE Signal Process. Mag.,25 (2008)21. CANDES E., Proc. ICM,3 (2006) 1433. GREENSPAN H., Some Rev. A, 52 (2009) 43. 7FOUCART S. and RAUHUT H., A Mathematical Introductionto Compressive Sensing, edited by BENEDETTO J., Vol. 1(Springer, New York) 2013. [8]CANDES E. and FERNANDEZ-GRANDA C., J. Fourier Anal.Appl., 19 (2013) 1229. [9]CANDES E. and FERNANDEZ-GRANDA C., Comm. PureAppl. Math., 67(2014) 906. [10] MALKA D., BERKOVIC G., HAMMER Y. and ZALEVSKYZ., Spectrosc. Lett., 46 (2013) 307. [11] SIDORENKO P., OSHEROVICH E., SHECHTMAN Y., EL-DAR Y. C., SEGEV M. and COHEN O., Frontiers in Optics,FM3F.5 (2012). :] BARBIERI B., BEVERINI N. and SASSO A., Reu. Mod.Phys.,62 (1990) 603. PARK S., PARK M. and KANG M., IEEE Signal Process.Mag, 20 (2003) 21. SLEPIAN D., Bell Syst. Tech.J., 57 (1978)1371. BACHOR H., MANSON P. and SANDEMAN R., Opt. Com-mun., 43 (1982) 337. [16i KRAMIDA A., RALCHENKO Y., READER J. and NISTADS TEAM,,http://physics.nist.gov/asd (2015). ( [17 ] CANDES E. and ROMBERG J., http://users.ece.gatech.edu/justin/l1magic/ (2015) ) p- p- This paper presents the principles and application of a super-resolution (SR) technique,based on a L1-Norm minimization procedure. In particular, the technique is applied to improvelow-resolution resolution spectra as obtained from the optogalvanic effect in Neon and Argondischarges over the 413-423 nm wavelength range. By applying the super-resolution algorithmto the experimental data, a surprising 70-fold reduction of the linewidth is achieved allowing toresolve prior indistinguishable peaks. It is found that further improvements on the resolutionare limited by the signal to noise ratio of the original spectra. The importance of a suitablemathematical representation of the experiment and the discussion on other applications of thissuper-resolution technique in spectroscopy are also presented.
确定


还剩5页未读,是否继续阅读?

产品配置单

北京欧兰科技发展有限公司为您提供《氩,氖中光谱分辨率检测方案(激光产品)》,该方案主要用于工业气体中理化分析检测,参考标准--,《氩,氖中光谱分辨率检测方案(激光产品)》用到的仪器有Ekspla NT340 高能量可调谐激光器(OPO)
推荐专场


该厂商其他方案
更多