


方案详情
文
采用Ekspla公司的PL2143C型皮秒激光器经过APL70-1100型放大器放大,用其355nm紫外输出泵浦皮秒光学参量发生器(PG401-P80-SH)产生230nm附近可调谐输出来激发CO的激光诱导荧光(LIF)光谱.
方案详情

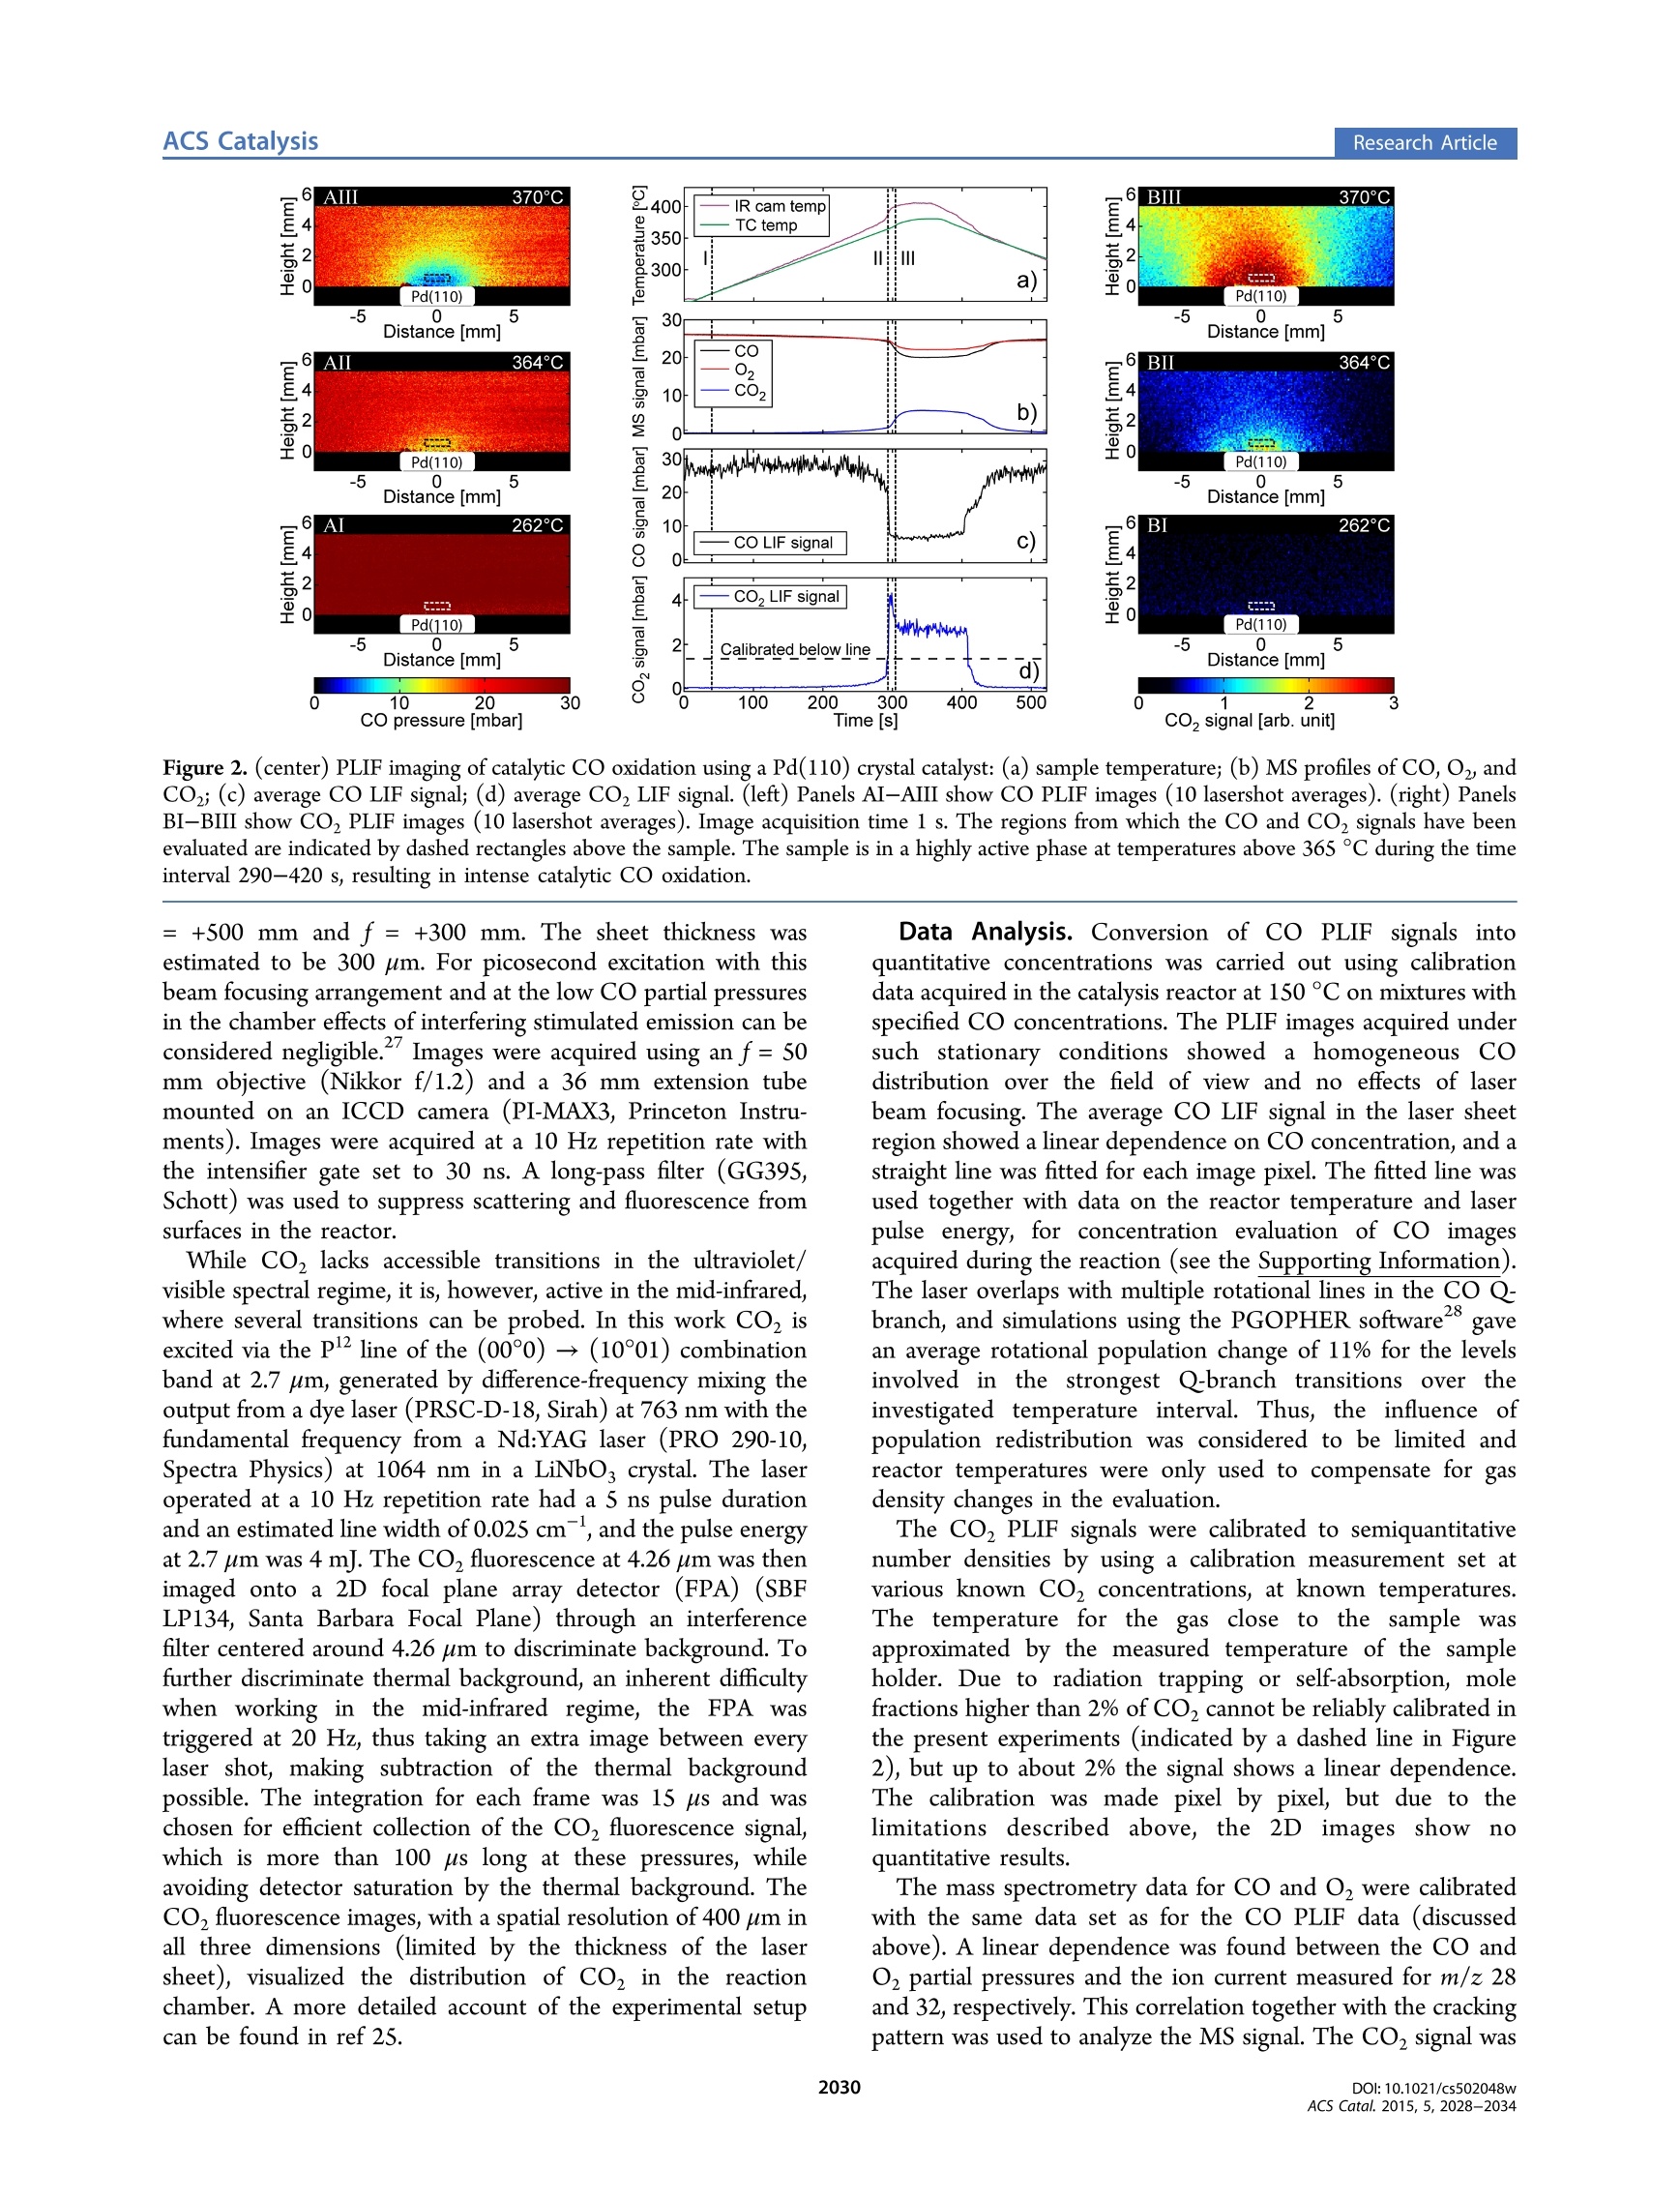
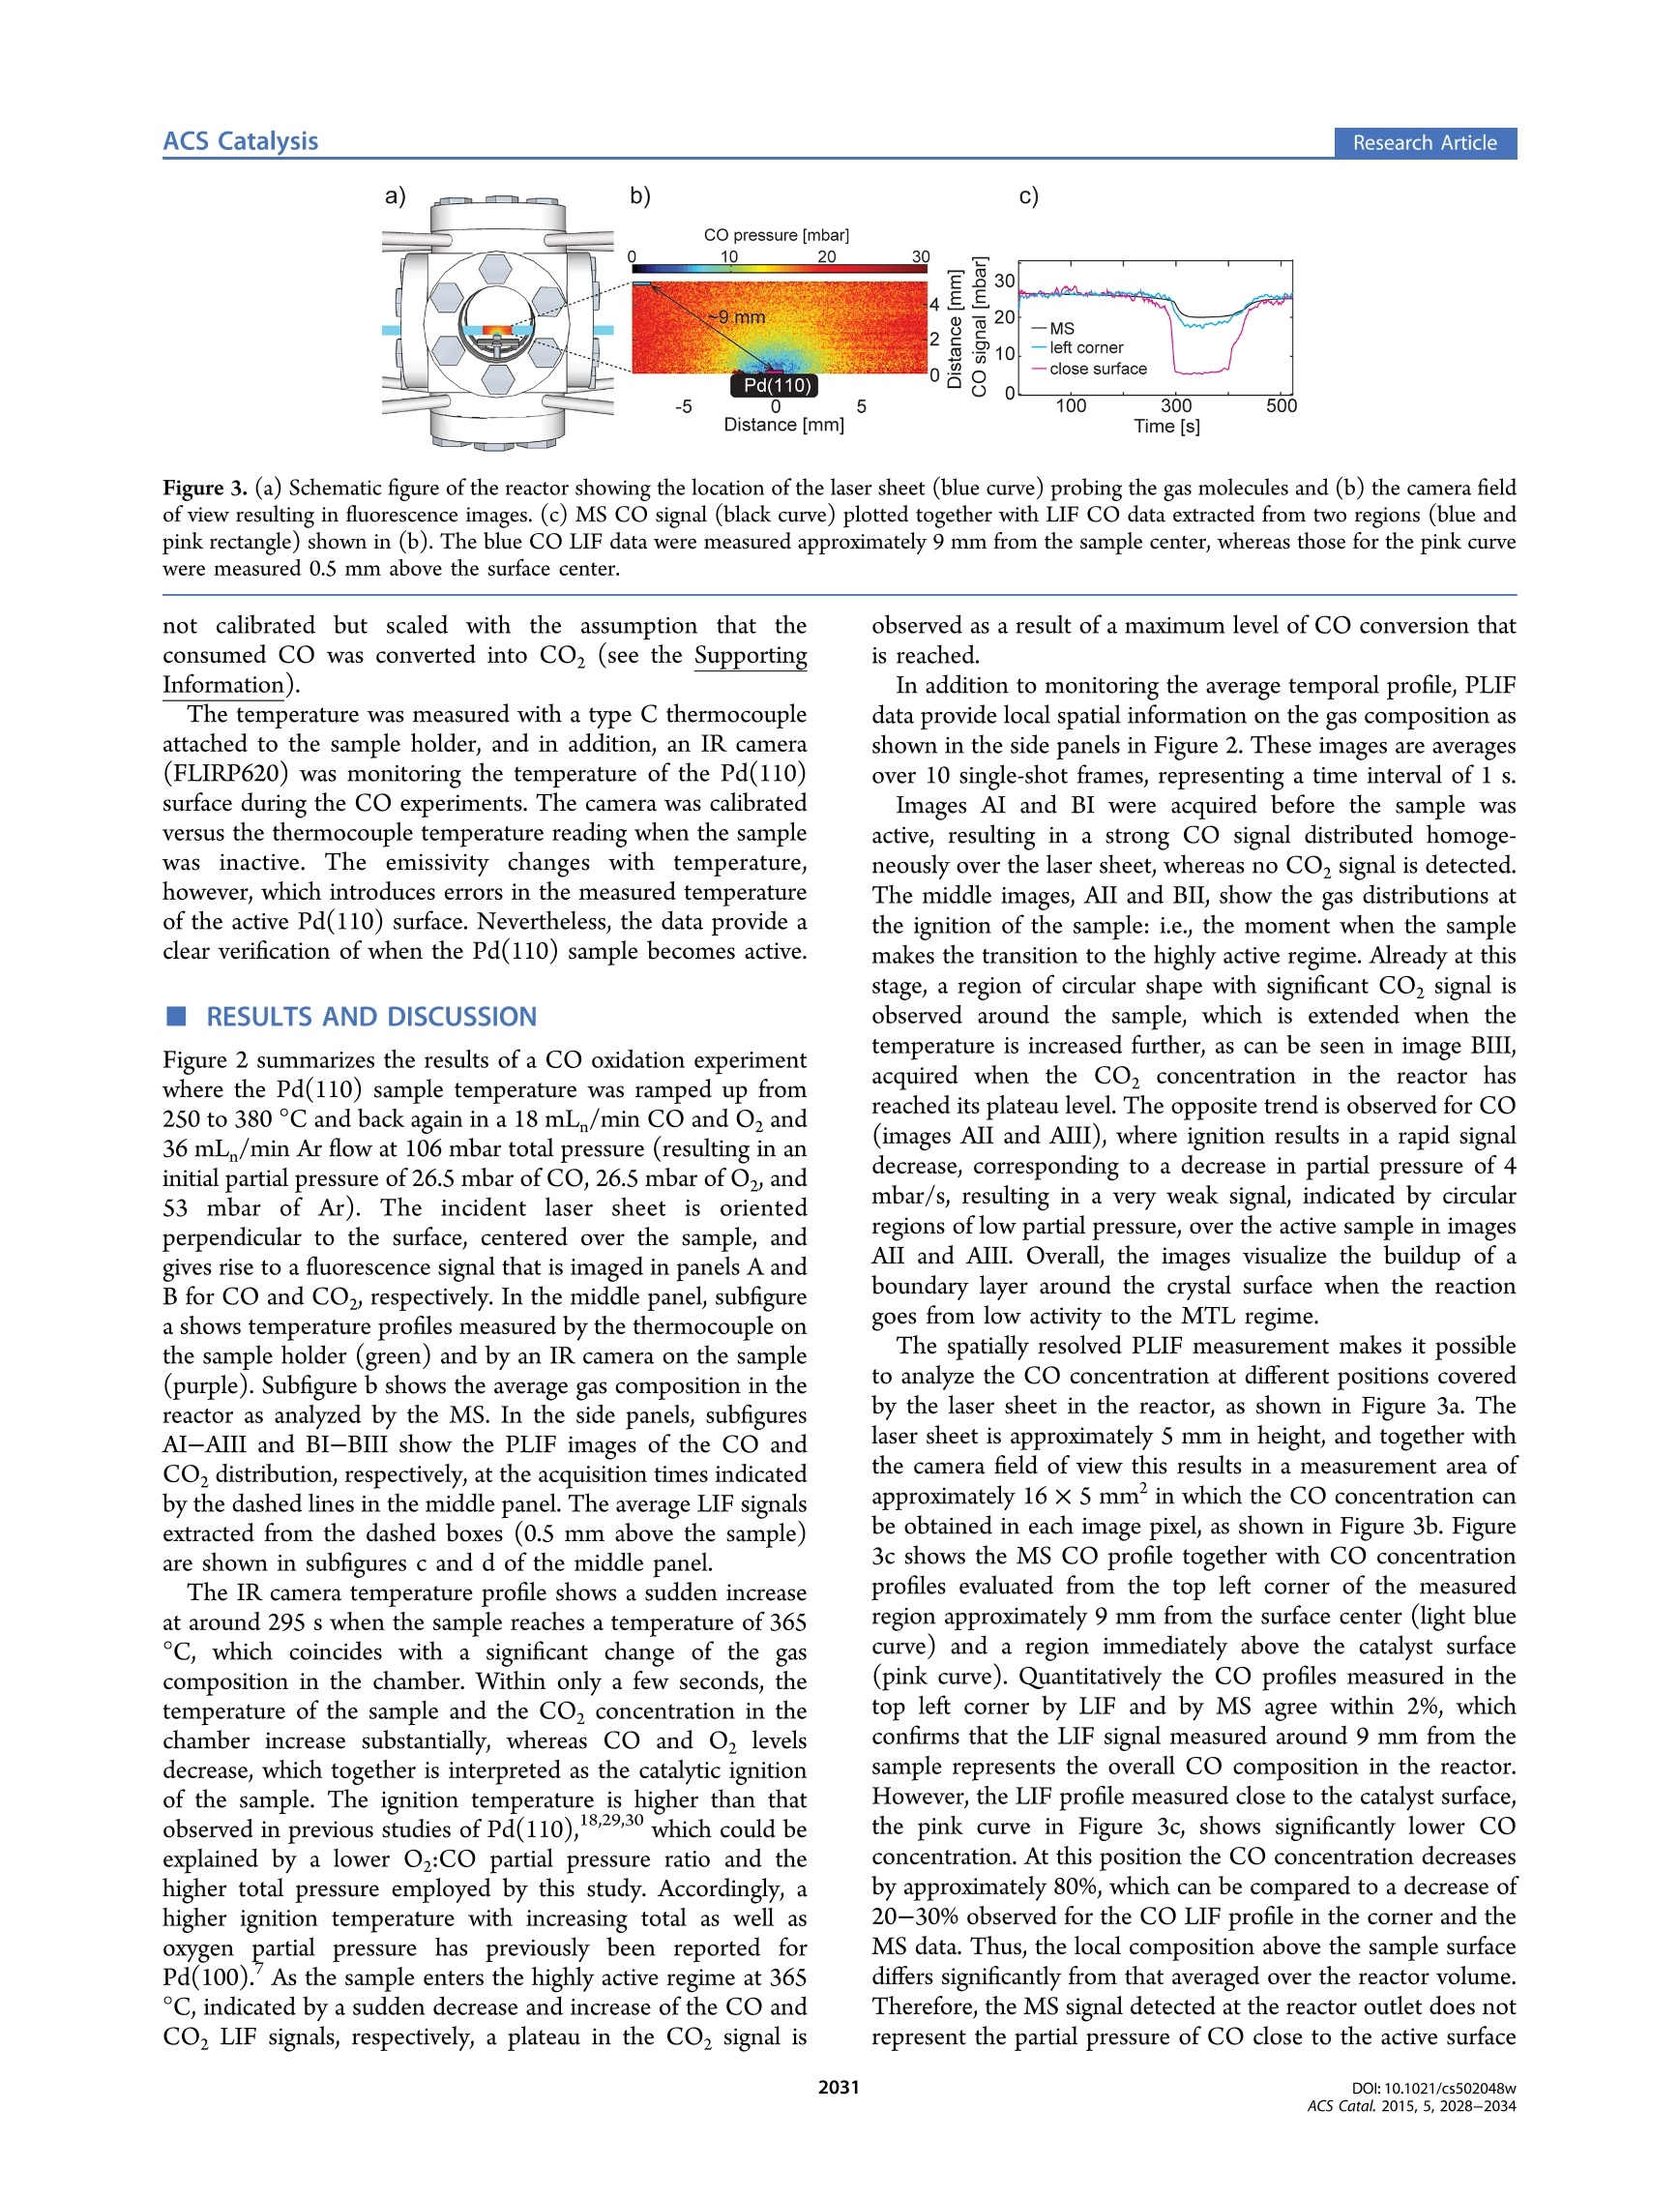
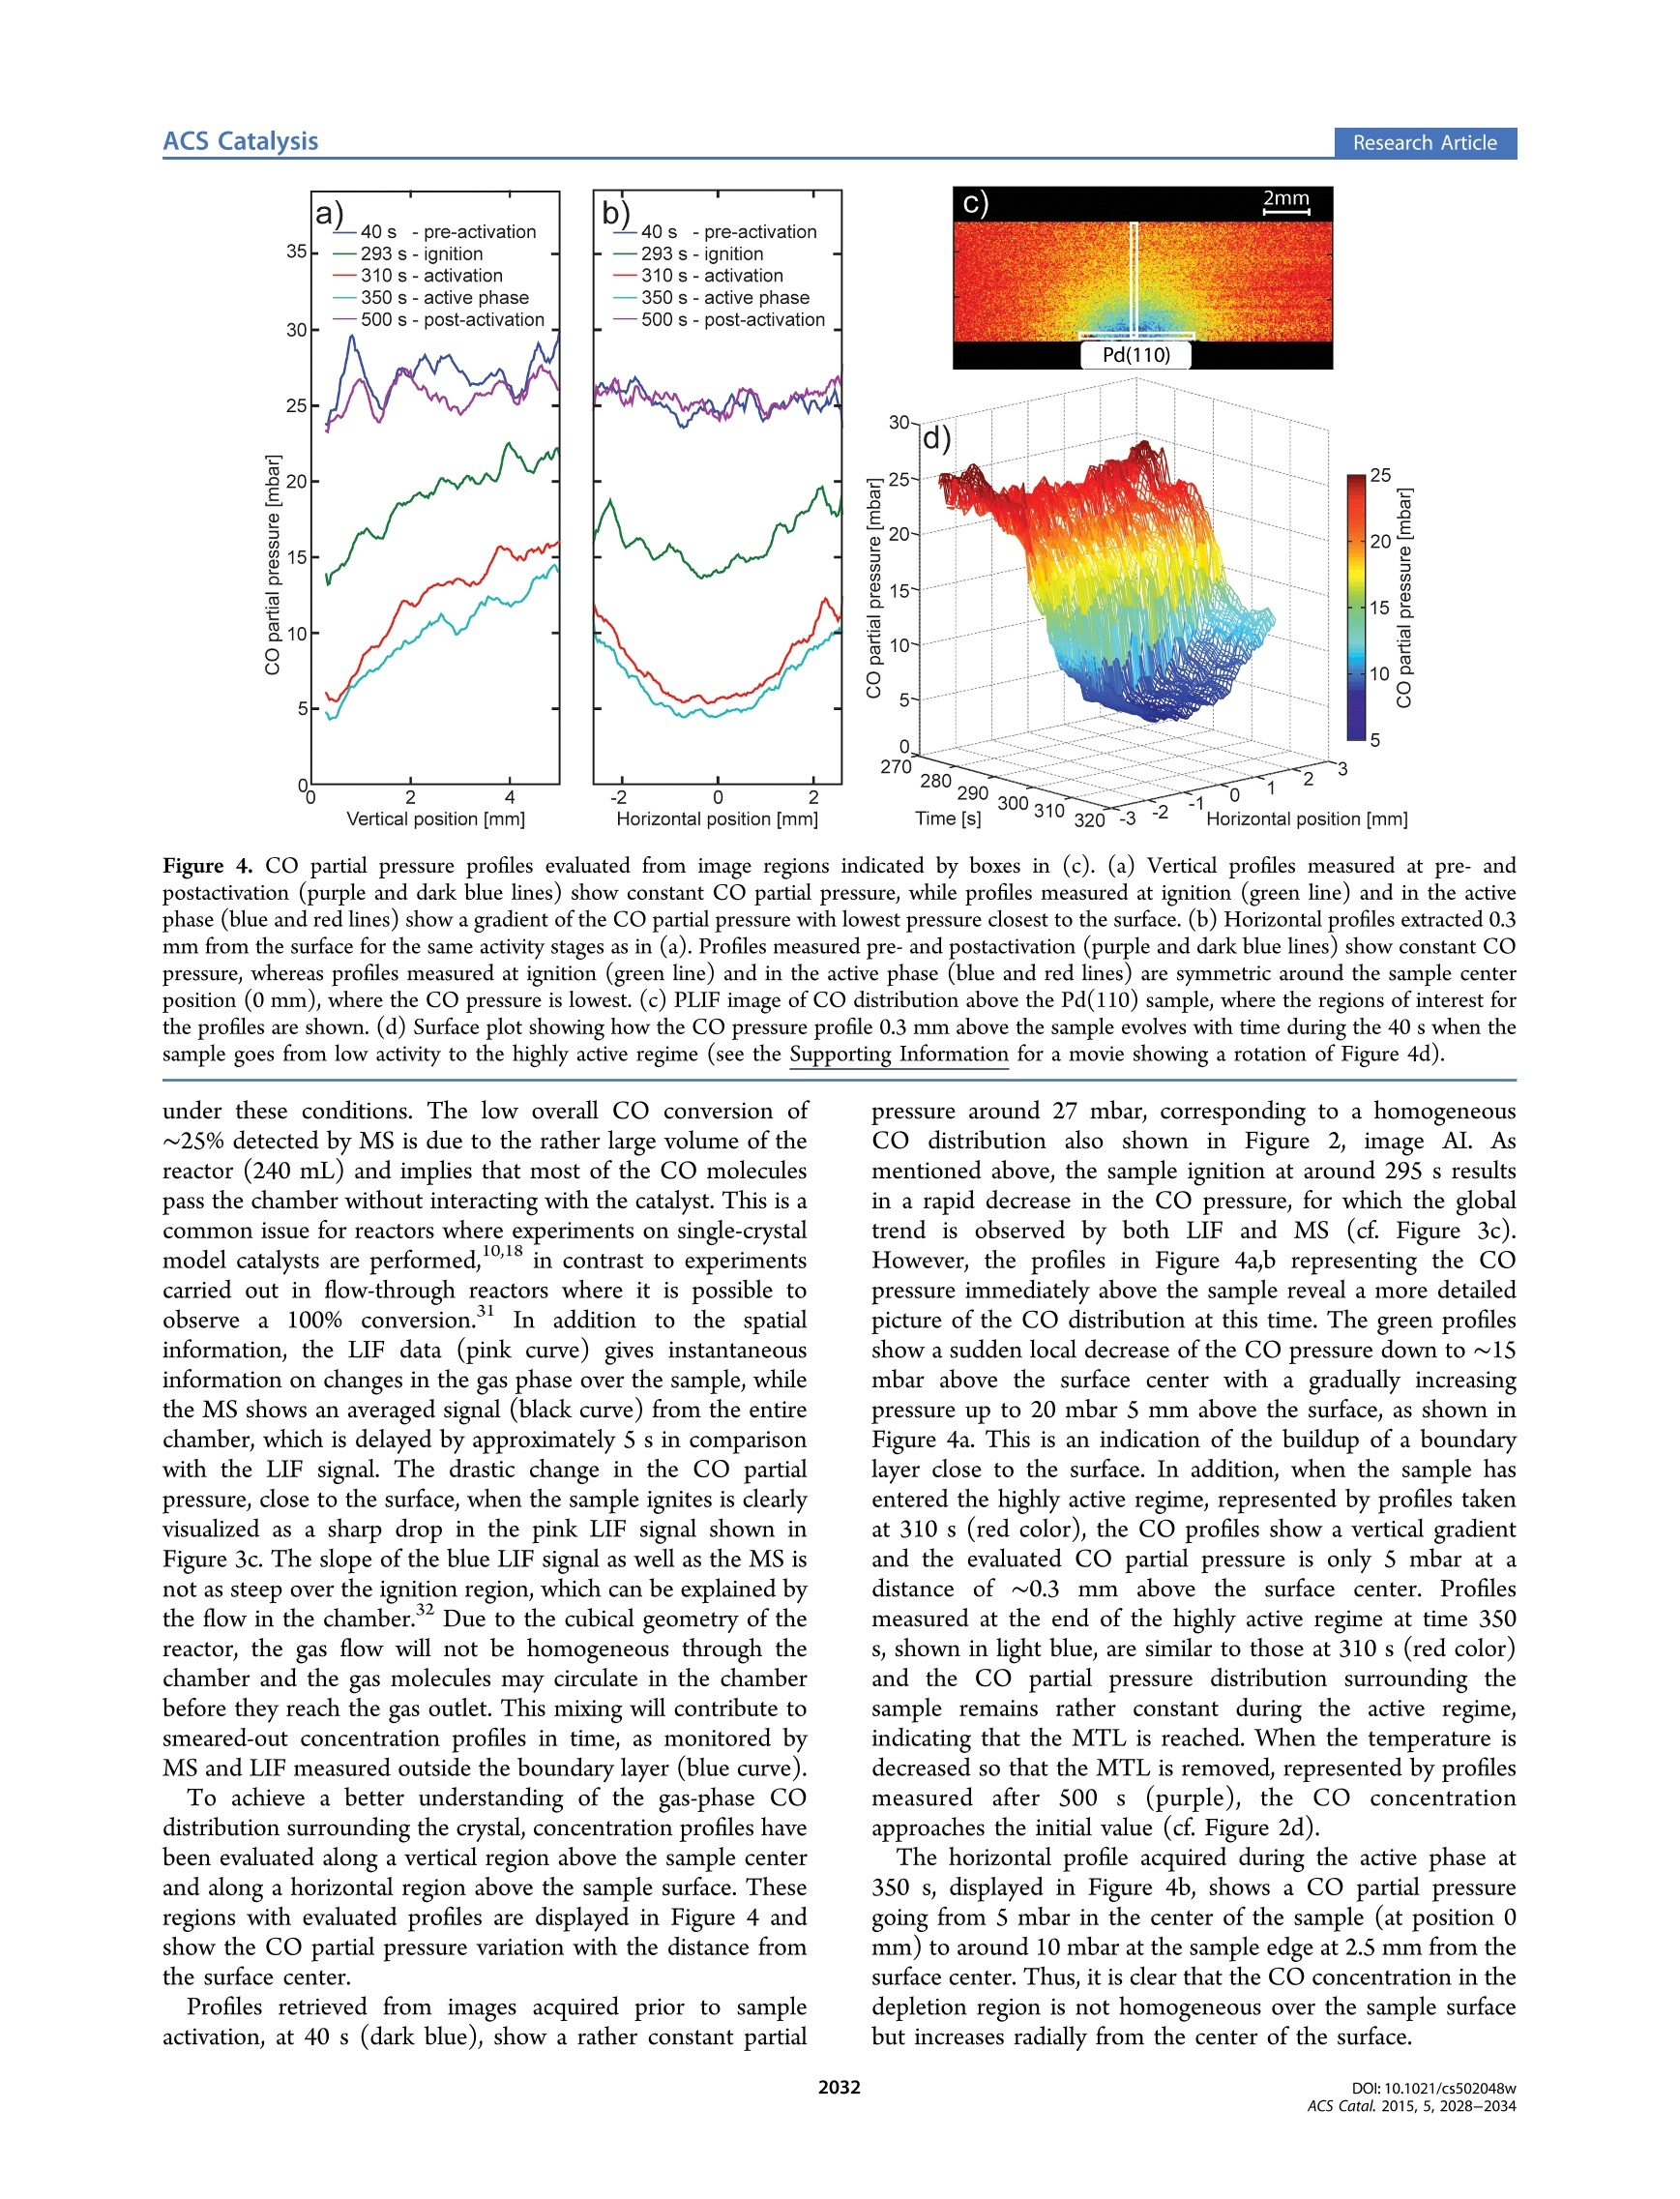
This is an open access article published under an ACS AuthorChoice License,which permitscopying and redistribution of the article or any adaptations for non-commercial purposes.Research Article ACS CatalysisResearch Article pubs.acs.org/acscatalysis Real-Time Gas-Phase Imaging over a Pd(110) Catalyst during COOxidation by Means of Planar Laser-Induced Fluorescence Sara Blomberg*f Christian Brackmann,* Johan Gustafson, Marcus Aldén, Edvin Lundgren,and Johan Zetterberg* Division of Synchrotron Radiation Research and *Division of Combustion Physics, Lund University, Box 118, SE-221 00 Lund,Sweden Supporting Information ABSTRACT: The gas composition surrounding a catalytic sample has direct impact on its surfacestructure, which is essential when in situ investigations of model catalysts are performed. Herein a study ofthe gas phase close to a Pd(110) surface during CO oxidation under semirealistic conditions is presented.Images of the gas phase, provided by planar laser-induced fluorescence, clearly visualize the formation of aboundary layer with a significantly lower CO partial pressure close to the catalytically active surface, incomparison to the overall concentration as detected by mass spectrometry. The CO partial pressurevariation within the boundary layer will have a profound effect on the catalysts’ surface structure andfunction and needs to be taken into consideration for in situ model catalysis studies. INTRODUCTION Catalytic properties of the transition metals have been studiedintensely for decades and are of great importance in order todevelop existing catalysts as well as to achieve a fundamentalunderstanding of the chemical processes.A significant efforthas been directed toward understanding the active phase of thesurface by studying gas-surface interactions on model catalysts.These studies have mainly been carried out in controlledenvironments, signified by low temperatures and ultrahighvacuum (UHV), in which the number of molecules interactingwith the surface is low. However, real catalysts are usuallyoperating at higher pressures, where the interaction betweengas molecules and the surface is more prominent. The gasmolecules close to the surface have been shown to affect thesurface structure and thereby play a crucial role for the catalyticfunction. For this reason, the surface science community hasdeveloped traditional surface-sensitive techniques such asscanning tunneling imicroscopy (STM),’ surface X-raydiffraction (SXRD), and high-pressure X-ray photoemissionspectroscopy (HPXPS) to operate at higher pressure, insitu.-1 What is often overseen is that at higher pressure theflow of gases through the catalysis reactor will have a substantialimpact on the interaction between the catalyst surface and gasmolecules;2 nevertheless, studies of the gas compositionadjacent to the catalyst surface is to a large extent lacking, whichemphasizes the importance of studying the gas phase whenaiming for characterization of catalysts under realisticconditions. CO oxidation is one of the most investigated reactions in heterogeneous catalysis and has been studied in great detail13,14 The relatively simple reaction pathway, whichonly involves diatomic reactants (CO and O) and a triatomicproduct (CO), makes it ideal for fundamental studies of thecatalytic reaction mechanism. Studies of CO oxidation atelevated pressures (1 mbar to 300 mbar) using palladium as acatalyst show that in a highly active regime, the CO2 productionreaches a steady-state level that does not increase withtemperature.6,15 This is called the mass transfer limited(MTL) regime and appears due to depletion of one of thereactants close to the catalyst surface. In this regime, thereaction is not temperature dependent but is limited by gasdle.iffusion. Previous studies of CO oxidation over Pd single-crystal samples show that the surface structure changes as thehighly active regime is reached, which is strongly dependenton the total pressure and temperature. Even though the catalystis highly active, neither adsorbed CO nor CO in the gas phaseclose to the surface could be detected in any of these studies.7,18To accomplish a complete picture of the mechanism behindCO oxidation at elevated pressures, knowledge of partialpressures and the flow of the reactant gas molecules above thecatalyst surface is highly relevant. Mass spectrometry (MS) allows for simultaneous monitoringof multiple gaseous species in a reactor. However, when the MSprobe is located at the reactor outlet, it measures an averageover the entire chamber volume. Yet, when the surface ( R e c e i v ed: D ecember 19, 2014 ) ( R e vi s ed : F ebruary 4, 2015 ) ( P u b lis h e d: F ebruary 9, 2015 ) structure of a catalyst is studied, knowledge of the gas-phasecomposition just above the sample surface is necessary. Toachieve this, the MS probe, usually a thin quartz orifice, can bepositioned close to the surface and probe the gas at thatpoint.1920 This method has been refined by Roos et al., and alateral resolution of about 100 um has been achieved. Thelimitation of this approach is that only one single point at atime can be investigated, making 2D mapping under nonstationary conditions infeasible. Other drawbacks, often encoun-tered when using probe techniques, are the uncertaintiesintroduced due to the probe affecting the gas flow andtemperature in the reactor. A strong nonintrusive alternative toMS, often used in studies of catalysis, is Fourier transforminfrared spectrometry (FTIR), where continuous infrared lightis guided through the sample gas, allowing for multispeciesdetection by absorption. Snively et al. refined the FTIRtechnique for spatially resolved measurements in 2D by using afocal plane array? and have also worked toward combinatorialscreening with FTIR,23 re)sporting a temporal resolution of 2 swith sufficient spectral resolution. However, the inherentproblem of FTIR is that, even though 2D measurements canbe achieved, the signal will be a measure of the integratedabsorption over the entire path through the reaction chamberwhere information on inhomogeneous temperature and speciesconcentrations is lost: i.e., it is a line-of-sight measurementtechnique lacking information in this direction. Thus, anonintrusive method enabling chemically specific detection aswell as high spatial resolution along all three spatial dimensionswould clearly be advantageous. Laser-based techniques for gas-phase diagnostics have sincelong been developed and applied, for example, in atmosphericchemistry and combustion research.+ Probing with laser beamsallows for nonintrusive access to the measurement region for insitu detection, of high importance for reactive flows. Moreover,high spatial resolution down to ~100 um and high temporalresolution can be obtained using focused laser beams andpulsed lasers, respectively. Among these methods laser-inducedfluorescence (LIF), based on the resonant absorption of laserphotons and the detection of spontaneously emittedfluorescence, provides chemical species specific detection withhigh sensitivity. Moreover, planar laser-induced fluorescence(PLIF), where the beam is shaped into a thin laser sheet, allowsfor imaging measurements where the thickness of the focusedlaser sheet determines the depth resolution. In this study, PLIF has been used to study the gas phase insitu close to the surface during CO oxidation above a Pd(110)single crystal at semirealistic CO and O2 partial pressures. Toobtain a more comprehensive picture of the process, both COand Co were probed by PLIF to obtain images of thedistributions, visualizing the reaction in an intelligible way. Theresults show that the gas composition near the active sample iscompletely different, in comparison with the rest of the volumein the reactor, and that changes in gas composition close to thesample occur on a subsecond time scale. Samples and Catalysis Reactor with Mass Spectrom-eter. The sample investigated is a Pd single crystal ofdimension 4 × 4 mm’ and with a (110) surface orientation.Initially the crystal was cleaned by sputtering and heating cyclesin a separate chamber but was exposed to air prior to insertioninto the reactor for optical diagnostics. To reduce samplecontamination, the sample temperature was ramped up and down in a CO, O2, and Ar atmosphere before the measure-ments. The reactor is made of stainless steel, has a cubicalshape, and is described in more detail in ref 25. Gases weresupplied to the reactor by individual mass flow controllers(Bronkhorst EL-FLOW,50 mL,/min) via a 2 m long (d=1/8in.) gas tube, and the gas composition in the reactor wasmeasured with a quadruple mass spectrometer (PfeifferPrismaPlus QMG220, lowest partial pressure 4 × 10-mbar). The MS was connected to the outlet of the reactorvia a 20 cm (d=1/16 in.) gas tube together with a pressurecontroller. The temporal resolution of the mass spectrometer isapproximately 0.4 s for the individual gases. The reactorarrangement is a well-controlled system that allows experimentsto be carried out with a high degree of reproducibility. Laser-Induced Fluorescence. Laser-induced fluorescencemeasurements were carried out on two separate occasions usingtwo different laser setups to study CO and CO2, respectively,but the catalysis reactor, MS setup, crystal sample, andassociated experimental conditions were the same in bothcases (see Figure 1). The temperature and MS plots shown inFigure2 were obtained simultaneously with the CO PLIFmeasurements. Figure 1. Schematic of the experimental setup for PLIF experiments,showing laser units, sheet-forming optics (L1/3 and L2/4), anddetector (FPA/ICCD) together with the arrangement of the catalysisreactor, mass-flow controllers (MFC), vacuum pump, and massspectrometer (MS). Electronic CO resonances are located in the vacuumultraviolet regime, and LIF was obtained via two-photonexcitation in the BZ++X'Z+(0,0) Hopfield-Birge band using230 nm,2followed by population of the A state via collisions orradiative transitions with fluorescence emission bands in thewavelength range 450-660 nm. Excitation was carried outusing a picosecond laser system consisting of a mode-lockedNd:YAG laser (PL2143C, Ekspla)with external amplifier(APL70-1100, Ekspla). The Nd:YAG third harmonic at 355 nmpumps an Optical Parametric Generator (PG 401-P80-SH,Ekspla), tuned to 230 nm. The laser pulse repetition rate was10 Hz, the pulse duration was 80 ps, and the line width at 230nm was specified to be 5 cm. The pulse energy at 230 nm wastypically 0.4 mJ, which combined with the 80 ps pulse durationprovides high peak power, highly beneficial for the two-photonexcitation process. For CO PLIF imaging the 230 nm laserbeam was directed into the reactor and shaped into a ~5 mmhigh vertical sheet using two cylindrical lenses of focal lengths f Figure 2. (center) PLIF imaging of catalytic CO oxidation using a Pd(110) crystal catalyst: (a) sample temperature; (b) MS profiles of CO, O2, andCO; (c) average CO LIF signal; (d) average CO, LIF signal. (left) Panels AI-AIII show CO PLIF images (10 lasershot averages). (right) PanelsBI-BIII show CO, PLIF images (10 lasershot averages). Image acquisition time 1 s. The regions from which the CO and CO, signals have beenevaluated are indicated by dashed rectangles above the sample. The sample is in a highly active phase at temperatures above 365 °C during the timeinterval 290-420 s, resulting in intense catalytic CO oxidation. = +500 mm and f=+300 mm. The sheet thickness wasestimated to be 300 um. For picosecond excitation with thisbeam focusing arrangement and at the low CO partial pressuresin the chamber effects of interfering stimulated emission can beconsidered negligible." Images were acquired using an f=50mm objective (Nikkor f/1.2) and a 36 mm extension tubemounted on an ICCD camera (PI-MAX3, Princeton Instru-ments). Images were acquired at a 10 Hz repetition rate withthe intensifier gate set to 30 ns. A long-pass filter (GG395,Schott) was used to suppress scattering and fluorescence fromsurfaces in the reactor. While CO, lacks accessible transitions in the ultraviolet/visible spectral regime, it is, however, active in the mid-infrared,where several transitions can be probed. In this work CO, isexcited via the P2 line of the (00°0)→(10°01) combinationband at 2.7 um, generated by difference-frequency mixing theoutput from a dye laser (PRSC-D-18, Sirah) at 763 nm with thefundamental frequency from a Nd:YAG laser (PRO 290-10,Spectra Physics) at 1064 nm in a LiNbO, crystal. The laseroperated at a 10 Hz repetition rate had a S ns pulse durationand an estimated line width of 0.025 cm, and the pulse energyat 2.7 um was 4 mJ. The CO,fluorescence at 4.26 um was thenimaged onto a 2D focal plane array detector (FPA) (SBFLP134, Santa Barbara Focal Plane) through an interferencefilter centered around 4.26 um to discriminate background. Tofurther discriminate thermal background, an inherent difficultywhen working in the mid-infrared regime, the FPA wastriggered at 20 Hz, thus taking an extra image between everylaser shot, making subtraction of the thermal backgroundpossible. The integration for each frame was 15 us and waschosen for efficient collection of the CO, fluorescence signal,which is more than 100 us long at these pressures, whileavoiding detector saturation by the thermal background. TheCO, fluorescence images, with a spatial resolution of 400 um inall three dimensions (limited by the thickness of the lasersheet), visualized the distribution of CO, in the reactionchamber. A more detailed account of the experimental setupcan be found in ref 25. Data Analysis. Conversion of CO PLIF signals intoquantitative concentrations was carried out using calibrationdata acquired in the catalysis reactor at 150 °C on mixtures withspecified CO concentrations. The PLIF images acquired undersuch stationary conditions showed a homogeneous COdistribution over the field of view and no effects of laserbeam focusing. The average CO LIF signal in the laser sheetregion showed a linear dependence on CO concentration, and astraight line was fitted for each image pixel. The fitted line wasused together with data on the reactor temperature and laserpulse energy, for concentration evaluation of CO imagesacquired during the reaction (see the Supporting Information).The laser overlaps with multiple rotational lines in the CO 28Q-branch, and simulations using the PGOPHER software8 gavean average rotational population change of 11% for the levelsinvolved in the strongest Q-branch transitions over theinvestigated temperature interval. Thus, the influence ofpopulation redistribution was considered to be limited andreactor temperatures were only used to compensate for gasdensity changes in the evaluation. The CO, PLIF signals were calibrated to semiquantitativenumber densities by using a calibration measurement set atvarious known CO, concentrations, at known temperatures.The temperature for the gas close to the samplee Wasapproximated by the measured temperature of the sampleholder. Due to radiation trapping or self-absorption, molefractions higher than 2% of CO cannot be reliably calibrated inthe present experiments (indicated by a dashed line in Figure2), but up to about 2% the signal shows a linear dependence.The calibration was made pixel by pixel, but due to thelimitations described above, the 2D images show noquantitative results. The mass spectrometry data for CO and O were calibratedwith the same data set as for the CO PLIF data (discussedabove). A linear dependence was found between the CO andO2 partial pressures and the ion current measured for m/z 28and 32, respectively. This correlation together with the crackingpattern was used to analyze the MS signal. The CO2 signal was Figure 3. (a) Schematic figure of the reactor showing the location of the laser sheet (blue curve) probing the gas molecules and (b) the camera fieldof view resulting in fluorescence images. (c) MS CO signal (black curve) plotted together with LIF CO data extracted from two regions (blue andpink rectangle) shown in (b). The blue CO LIF data were measured approximately 9 mm from the sample center, whereas those for the pink curvewere measured 0.5 mm above the surface center. not calibratedbut scaled with the assumption that theconsumed CO was converted into CO (see the SupportingInformation). The temperature was measured with a type C thermocoupleattached to the sample holder, and in addition, an IR camera(FLIRP620) was monitoring the temperature of the Pd(110)surface during the CO experiments. The camera was calibratedversus the thermocouple temperature reading when the samplewas inactive. The emissivity changes with temperature,however, which introduces errors in the measured temperatureof the active Pd(110) surface. Nevertheless, the data provide aclear verification of when the Pd(110) sample becomes active. RESULTS AND DISCUSSION Figure 2 summarizes the results of a CO oxidation experimentwhere the Pd(110) sample temperature was ramped up from250 to 380 °C and back again in a 18 mL,/min CO and Oz and36 mL,/min Ar flow at 106 mbar total pressure (resulting in aninitial partial pressure of 26.5 mbar of CO, 26.5 mbar of O2, and53 mbar of Ar). The incident laser sheet is orientedperpendicular to the surface, centered over the sample, andgives rise to a fluorescence signal that is imaged in panels A andB for CO and CO, respectively. In the middle panel, subfigurea shows temperature profiles measured by the thermocouple onthe sample holder (green) and by an IR camera on the sample(purple). Subfigure b shows the average gas composition in thereactor as analyzed by the MS. In the side panels, subfiguresAI-AIII and BI-BIII show the PLIF images of the CO andCO, distribution, respectively, at the acquisition times indicatedby the dashed lines in the middle panel. The average LIF signalsextracted from the dashed boxes (0.5 mm above the sample)are shown in subfigures c and d of the middle panel. The IR camera temperature profile shows a sudden increaseat around 295 s when the sample reaches a temperature of 365C, which coincides with a significant change of the gascomposition in the chamber. Within only a few seconds, thetemperature of the sample and the CO, concentration in thechamber increase substantially, whereas CO and O levelsdecrease, which together is interpreted as the catalytic ignitionof the sample. The ignition temperature is higher than thatobserved in previous studies of Pd(110),18,29,30 which could beexplained by a lower Oz:CO partial pressure ratio and thehigher total pressure employed by this study. Accordingly, ahigher ignition temperature with increasing total as well asoxygen partial pressure has previously been reported forPd(100). As the sample enters the highly active regime at 365℃, indicated by a sudden decrease and increase of the CO andCO,LIF signals, respectively, a plateau in the CO, signal is observed as a result of a maximum level of CO conversion thatis reached. In addition to monitoring the average temporal profile, PLIFdata provide local spatial information on the gas composition asshown in the side panels in Figure 2. These images are averagesover 10 single-shot frames, representing a time interval of 1 s. Images AI and BI were acquired before the sample wasactive, resulting in a strong CO signal distributed homoge-neously over the laser sheet, whereas no CO, signal is detected.The middle images, AII and BII, show the gas distributions atthe ignition of the sample: i.e., the moment when the samplemakes the transition to the highly active regime. Already at thisstage, a region of circular shape with significant COz signal isobserved around the sample, which is extended when thetemperature is increased further, as can be seen in image BIII,acquired when the CO, concentration in the reactor hasreached its plateau level. The opposite trend is observed for CO(images AII and AIII), where ignition results in a rapid signaldecrease, corresponding to a decrease in partial pressure of 4mbar/s, resulting in a very weak signal, indicated by circularregions of low partial pressure, over the active sample in imagesAII and AIII. Overall, the images visualize the buildup of aboundary layer around the crystal surface when the reactiongoes from low activity to the MTL regime. The spatially resolved PLIF measurement makes it possibleto analyze the CO concentration at different positions coveredby the laser sheet in the reactor, as shown in Figure 3a. Thelaser sheet is approximately S mm in height, and together withthe camera field of view this results in a measurement area ofapproximately 16 ×5 mmin which the CO concentration canbe obtained in each image pixel, as shown in Figure 3b. Figure3c shows the MS CO profile together with CO concentrationprofiles evaluated from the top left corner of the measuredregion approximately 9 mm from the surface center (light bluecurve) and a region immediately above the catalyst surface(pink curve). Quantitatively the CO profiles measured in thetop left corner by LIF and by MS agree within 2%, whichconfirms that the LIF signal measured around 9 mm from thesample represents the overall CO composition in the reactor.However, the LIF profile measured close to the catalyst surface,the pink curve in Figure 3c, shows significantly lower COconcentration. At this position the CO concentration decreasesby approximately 80%, which can be compared to a decrease of20-30% observed for the CO LIF profile in the corner and theMS data. Thus, the local composition above the sample surfacediffers significantly from that averaged over the reactor volume.Therefore, the MS signal detected at the reactor outlet does notrepresent the partial pressure of CO close to the active surface b) -40s -pre-activation -293 s-ignition 310 s-activation -350s-active phase -500 s -post-activation -2 0 2 Vertical position [mm] Horizontal position [mm] Figure 4. CO partial pressure profiles evaluated from image regions indicated by boxes in (c). (a) Vertical profiles measured at pre- andpostactivation (purple and dark blue lines) show constant CO partial pressure, while profiles measured at ignition (green line) and in the activephase (blue and red lines) show a gradient of the CO partial pressure with lowest pressure closest to the surface. (b) Horizontal profiles extracted 0.3mm from the surface for the same activity stages as in (a). Profiles measured pre- and postactivation (purple and dark blue lines) show constant COpressure, whereas profiles measured at ignition (green line) and in the active phase (blue and red lines) are symmetric around the sample centerposition (0 mm), where the CO pressure is lowest. (c) PLIF image of CO distribution above the Pd(110) sample, where the regions of interest forthe profiles are shown. (d) Surface plot showing how the CO pressure profile 0.3 mm above the sample evolves with time during the 40 s when thesample goes from low activity to the highly active regime (see the Supporting Information for a movie showing a rotation of Figure 4d). under these conditions. The low overall CO conversion of~25% detected by MS is due to the rather large volume of thereactor (240 mL) and implies that most of the CO moleculespass the chamber without interacting with the catalyst. This is acommon issue for reactors where experiments on single-crystalmodel catalysts are performed,10,18 in contrast to experimentscarried out in flow-through reactors where it is possible toobserve a 100% ccoonnvveerrssiioonn..3 1In addition to the spatiainformation, the LIF data (pink curve) gives instantaneousinformation on changes in the gas phase over the sample, whilethe MS shows an averaged signal (black curve) from the entirechamber, which is delayed by approximately 5 s in comparisonwith the LIF signal. The drastic change in the CO partialpressure, close to the surface, when the sample ignites is clearlyvisualized as a sharp drop in the pink LIF signal shown inFigure 3c. The slope of the blue LIF signal as well as the MS isnot as steep over the ignition region, which can be explained bythe flow in the chamber. Due to the cubical geometry of thereactor, the gas flow will not be homogeneous through thechamber and the gas molecules may circulate in the chamberbefore they reach the gas outlet. This mixing will contribute tosmeared-out concentration profiles in time, as monitored byMS and LIF measured outside the boundary layer (blue curve). To achieve a better understanding of the gas-phase COdistribution surrounding the crystal, concentration profiles havebeen evaluated along a vertical region above the sample centerand along a horizontal region above the sample surface. Theseregions with evaluated profiles are displayed in Figure 4 andshow the CO partial pressure variation with the distance fromthe surface center. Profiles retrieved from images acquired prior to sampleactivation, at 40 s (dark blue), show a rather constant partial pressure around 27 mbar, corresponding to a homogeneousCO distribution also shown in Figure 2, image AI. Asmentioned above, the sample ignition at around 295 s resultsin a rapid decrease in the CO pressure, for which the globaltrend is observed by both LIF and MS (cf. Figure 3c).r.However, the profiles in Figure 4a,b representing the COpressure immediately above the sample reveal a more detailedpicture of the CO distribution at this time. The green profilesshow a sudden local decrease of the CO pressure down to ~15mbar above the surface center with a gradually increasingpressure up to 20 mbar5 mm above the surface, as shown inFigure 4a. This is an indication of the buildup of a boundarylayer close to the surface. In addition, when the sample hasentered the highly active regime, represented by profiles takenat 310 s (red color), the CO profiles show a vertical gradientand the evaluated CO partial pressure is only 5 mbar at adistance of ~0.3 mm above the surface center. Profilesmeasured at the end of the highly active regime at time 350s, shown in light blue, are similar to those at 310 s (red color)and the CO partial pressure distribution surrounding thesample remains rather constant during the active regime,indicating that the MTL is reached. When the temperature isdecreased so that the MTL is removed, represented by profilesmeasured after 500 s (purple), the CO concentrationapproaches the initial value (cf. Figure 2d). The horizontal profile acquired during the active phase at350 s, displayed in Figure 4b, shows a CO partial pressuregoing from 5 mbar in the center of the sample (at position 0mm) to around 10 mbar at the sample edge at 2.5 mm from thesurface center. Thus, it is clear that the CO concentration in thedepletion region is not homogeneous over the sample surfacebut increases radially from the center of the surface. The information in Figure 4b can be followed in more detailover time, and Figure 4d shows how the CO pressure 0.3 mmabove the surface evolves during ignition (time 270-310 s).The ignition process is very fast, but the LIF data acquisitionrate of 10 Hz is sufficient to trace local CO pressure changeswhen the sample goes from low to high activity. The 3D plotshows that the CO pressure already prior to ignition has aslightly curved pressure profile over the surface (red part ofFigure 4d at 270 s). However, after ignition (blue part of Figure4d) the curvature of the profile is even more pronounced,which is also shown in the blue and red profiles in Figure 4b.The symmetric shape of the boundary layer detected aroundthe sample center indicates that the activity is symmetric acrossthe surface of the sample. Altogether, these kinds of spatiallyresolved data permit analysis of sample activity on a local level,clearly valuable for studies of more complex systems withheterogeneous samples. In the literature, the buildup of boundary layers around thesample surface is pointed out to be the reason for the plateauthat is reached in the maximum COz production.16,30 Withinthe boundary layer, the conversion of reactants is faster than thetransport of products away from the volume close to the sampleand therefore inhibits the reactants to reach the surface. In thisphase the CO conversion is not temperature dependent and themaximum CO2 production is limited by the supply from the gasphase and not by the catalyst itself. We clearly observe aboundary layer of CO, close to the Pd(110) surface but can stilldetect CO in the same area. The horizontal CO profiles (Figure4b) show an almost even decrement of the CO concentrationwith increasing temperature close to the surface prior ignition,but immediately after ignition a bent CO profile is observed.Even though the temperature is increased from 365 to 380℃in the highly active MTL regime, the CO concentration profilesdo not change (cf. Figure 4a,b). This indicates a steady-stateproduction of CO,, also observed globally with both MS andLIF, interpreted as the reaction being mass transfer limited byCO. Surprisingly, CO is detected 0.3 mm from the surface,indicating that the depletion region of CO is a few hundredmicrons or less above the surface when the reaction is masstransfer limited. The significant drop in CO pressure close tothe surface is probably the reason gas-phase CO is not observedin previous studies based on HPXPS and PM-IRAS.718 In thosecases the amount of CO is most probably below the detectionlimit and therefore cannot be observed. Matera et al. calculated boundary layers for CO oxidationover RuOz(110) in a stagnation flow reactor with oxygen asminority reactant.While instead CO is the minority reactantin our experiments, the obtained concentration profiles arenevertheless in good agreement with the calculated oxygenpressure profiles presented by Matera et al. They reported ondifferent CO pressures at the edges of the sample and predict adecrease of approximately 90% of the minority species close tothe catalyst surface center. Our results clearly visualize theinhomogeneous CO pressure over the surface, and we canconfirm experimentally a decrease of 80% of the CO pressure atthe surface center, while the decrease is less apparent towardthe sample edges: cf. Figure 4b. SUMMARY We report instantaneous visualization of gas-phase CO andCO, distributions during catalytic oxidation over a Pd(110)model catalyst at elevated pressure. A 1:1 ratio of CO and O, isused, for which an ignition temperature of 365 °C of the sample is observed. High-resolution CO PLIF images indicate that onlya fraction of the gas molecules interact with the catalyst surfaceand that the flow and geometry of the chamber are importantparameters to consider when catalysts are studied. Images showthat a semicircular depletion region of low CO partial pressure(boundary layer) is formed above the surface when the sampleis active. A gradient in CO partial pressure is observed abovethe sample where the lowest CO partial pressure detected is S±2 mbar, ~0.3-1 mm above the sample surface center. BothLIF and MS data indicate that the catalytic reaction is masstransfer limited by CO and LIF detection of 5 mbar of CO 0.3mm above the sample, indicating that the CO depletion regionin the MTL regime is localized very close to the surface.Furthermore, the CO partial pressure shows an inhomogeneousdistribution along the sample surface with 5 ±2 mbar in thecenter and 10±2 mbar at the edges. Generally, the distributionof CO molecules over the surface will be dependent on thedimensions and symmetry of the sample as well as thegeometry of the chamber and thus the gas flow over the catalystsurface. Our results show that the pressure measured with MSdoes not represent the gas composition close to the samplesurface. The gas composition detected at the outlet with theMS is smeared out and is not truly representative for the gascomposition close to the sample surface where LIF providesinstantaneous detection of local changes. Techniques for surface structure determination probe arelatively small surface area at a time, ranging from a fewmicrometers to a couple of millimeters. To achieve arepresentative picture of the entire surface structure, thesurface-gas interaction should therefore be identical over thesample surface, which implies a homogeneous gas compositionover the catalyst; this is also most often assumed. As shown inour results, this is not the case and the gas composition can varysignificantly over the sample surface. Nevertheless, averagestructural information about the surface could in principle beobtained by measurements at multiple sample positions. Thiswould then instead imply that the gas composition has to bestable over time, which is rarely the case for catalysis studies.This demonstrates the importance to obtain detailedinformation on the gas phase close to the catalyst surface,which in turn may facilitate interpretation of the surface/structure determination. Altogether, the results demonstratethat instantaneous spatially resolved in situ measurementsprovide important information for studies of the active phaseand surface sites of catalysts, making laser-induced fluorescencea highly valuable tool for catalysis research. ASSOCIATED CONTENT ⑤ Supporting Information The following files are available free of charge on the ACSPublications website at DOI: 10.1021/csS02048w. Calibration procedure of the CO LIF and MS signal(PDF) A movie showing a rotation of the 3D representation ofthe CO pressure profiles in Figure 4d (AVI) AUTHOR INFORMATION Corresponding Author *E-mail for S.B.: sara.blomberg@sljus.lu.se. Notes The authors declare no competing financial interest. ACKNOWLEDGMENTS The authors gratefully acknowledge financial support from theKnut and Alice Wallenberg Foundation, the Swedish ResearchCouncil, and the European Scientific Research Council (ERC)through the DALDECS program. REFERENCES ( (1) E rtl, G.; Knozinger, H.;Weitkamp, J. In Handbook of heterogeneouscatalysis, 2nd completely r e vised and en l arged ed. ; Ertl, G. , Kn o zinger,H., Weitkamp, J. Eds., Wiley-VCH: Weinheim, Germany, 2008. ) ( (2) Somorjai, G . A . ; Li , Y . In t roduction t o surface c h emistry andcatalysis , 2nd ed. ; Wiley: Hoboken, N J, 2010. ) ( (3) O ver, H . ; Kim, Y. D.; Seitsonen, A. P. ; Wendt, S.; Lundgren, E.; Schmid, M.; Varga, P.; M organte, A.; E rtl, G. Scienc e 2000, 287, 1474-1476. ) ( (4) Jones, I . Z .; B ennett, R. A.; Bowker, M. Surf. Sci. 19 9 9, 439, 235 - 248. ) ( (5) H endriksen, B. L. M.; Frenken, J. W. M. Phy s . Rev . Lett. 20 0 2, 89, 046101. ) ( (6) v an R ijn, R.; Balmes, O.; Resta, A.; Wermeille, D.; Westerstrom,R.; Gustafson, J ; Felici, R.; Lundgren, E . ; F renken, J. W . M. Phy s . Chem. Chem. Phys. 2011, 13,13167-13171. ) ( (7) B lomberg, S . ; Hoffmann, M. J.; Gu s tafson, J.; Martin, N. M. ; Fernandes, V. R.; Borg, A. ; Li u , Z.; Chang, R.; Mat e ra, S.; R euter, K.; Lundgren, E . Phys. Rev. L ett. 2013, 1 10, 1 17601. ) ( (8) Lundgren, E.; Over, H . J. Phys-Condens Mat 2008, 20, 180 3 02.(9) Stierle , A.; Molenbroek, A. M. MRS Bull. 2007, 32, 1001-1005. ) ( (10) G ustafson, J.; S hipilin, M.; Z hang, C . ; S t ierle, A .; H ejral, U.;Ruett, U.; Gutowski, O.; Carlsson, P. A.; Skoglundh, M.;Lundgren, E. Science 2014, 343 , 758-761. ) ( (11) M atera, S . ; Reuter, K. J. Catal. 2 012, 295, 2 6 1-268. ) ( (12) M atera, S.; Reuter, K. Phys. Rev. B 2010, 82, 0 85446. ) ( (13) E ngel, T.; E rtl, G. Chem. Phys. L ett. 1978, S4,95-98. ) ( (14) G ustafson, J .; Westerstrom, R . ; M ikkelsen, A . ; T o rrelles, X .; Balmes, O.; Bovet, N . ; A n dersen, J. N.; Baddeley, C. J.; Lundgren, E.Phys. Rev. B 2008, 78, 045423. ) ( (15) Westerstrom, R.; Wang, J. G . ; Ackermann, M. D.; Gustafson,J;Resta, A.; Mikkelsen, A.; Andersen, J. N .; L undgren, E.; B a lmes, O.; Torrelles, X.; Frenken, J. W. M.; H ammer, B. J. Phys-Condens Ma t 2008,20,184018. ) ( (16) M atera, S.; R euter, K . C atal. L ett. 2009, 133, 156-159. ) ( (17) Hendriksen, B. L. M.; Bobaru, S. C.; Frenken,J. W. M. Surf. Sci. 2004,S52,229-242. ) ( (18) T oyoshima, R.; Yoshida M.; Mo n ya, Y.; Suzuki, K.; Amemiya,K.; Mase, K .; M un, B . S . ; Kondoh, H. J. Phys. C h em. C 2 013, 117 , 20617-20624. ) ( (19) Sidwell, R. W.; Z h u, H. Y. ; Kee, R. J.; Wickham, D. T.; Schell, C.; Jackson, G. S. P Combust Inst 2002, 29, 1013-1020. ) ( (20) S idwell, R. W.; Z hu, H. Y.; Kee, R. J.; Wickham, D. T. Co m bust. Flame 2003, 134,55-66. ) ( (21) Roos, M . ; K i elbassa, S . ; S chirling, C.; Haring, T.; Bansmann, J ; B ehm, R . J. R ev. S ci. Instrum. 2007, 78, 084104. ) ( (22) Snively, C . M .; Katzenberger, S.; O skarsdottir, G .; L auterbach, J. Opt. Lett . 1999, 24,1841-1843. ) ( (23) S n ively, C . M . ; Os k arsdottir, G.; Lauterbach, J. Catal. Tod a y 2001, 67,357-368. ) ( (24) Kohse-Hoinghaus, K. ; Jeffries, J. B . A pplied c ombustiondiagnostics; Taylor & Francis: New Y o rk, 2 0 02. ) ( (25) Z e tterberg, J.; B l omberg, S.; Gustafson, J.;S u n, Z. W.; Li, Z. S. ; Lundgren, E . ; A lden, M. R e v. S c i. I nstrum. 2 012, 83,053104. ) ( (26) Alden, M.; Wallin, S.; Wendt, W. Appl. Phys. B-Photo 1984, 33, 205-212. ) ( (27) Westblom, U . ; Agrup, S.; Aldén, M.; Hertz, H. M.; Goldsmith, J E. M. Appl. Phys. B-Photo 1990, S0, 487-497. ) ( (28) W estern, C. M. P GOPHER, [Online], ve r sion 8 . 0; h t tp://pgopher.chm.bris.ac.uk (accessed October 20 1 4). ) ( ( 29) C hen, M . S.; Cal, Y.; Y a n, Z. ; Ga t h, K. K.; Axnanda, S.; Goodman, D. W. Surf. Sci. 2007, 601, 5326-5331. ) ( (30) McClure, S. M.; Goodman, D. W. Chem. Phys. L e tt. 2009, 469, 1-13. ) ( ( 31) Becker, E.; Thormahlen, P.; Maunula, T. ; Su opanki, A .; Skoglundh, M. Top Catal 2007, 42-43, 421-424. ) ( (32) Matera, S . ; Maestri, M.; C u oci, A.; R e uter, K . ACS Catal. 2014, 4,4081-4092. ) CS Publications @ American Chemical SocietyDOI:csACS Catal. CS Catal. , The gas composition surrounding a catalytic sample has direct impact on its surfacestructure, which is essential when in situ investigations of model catalysts are performed. Herein a study ofthe gas phase close to a Pd(110) surface during CO oxidation under semirealistic conditions is presented.Images of the gas phase, provided by planar laser-induced fluorescence, clearly visualize the formation of aboundary layer with a significantly lower CO partial pressure close to the catalytically active surface, incomparison to the overall concentration as detected by mass spectrometry. The CO partial pressurevariation within the boundary layer will have a profound effect on the catalysts’ surface structure andfunction and needs to be taken into consideration for in situ model catalysis studies.
确定

还剩5页未读,是否继续阅读?

产品配置单

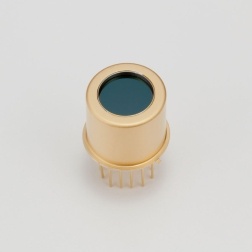
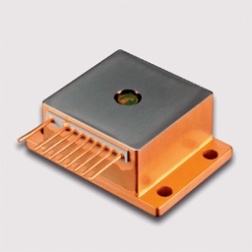
北京欧兰科技发展有限公司为您提供《一氧化碳 Pd(110)催化剂中氧化过程,激光诱导荧光检测方案(激光产品)》,该方案主要用于催化剂中理化分析检测,参考标准--,《一氧化碳 Pd(110)催化剂中氧化过程,激光诱导荧光检测方案(激光产品)》用到的仪器有PG400 系列皮秒光学参量发生/放大器系统
推荐专场


该厂商其他方案
更多