


方案详情
文
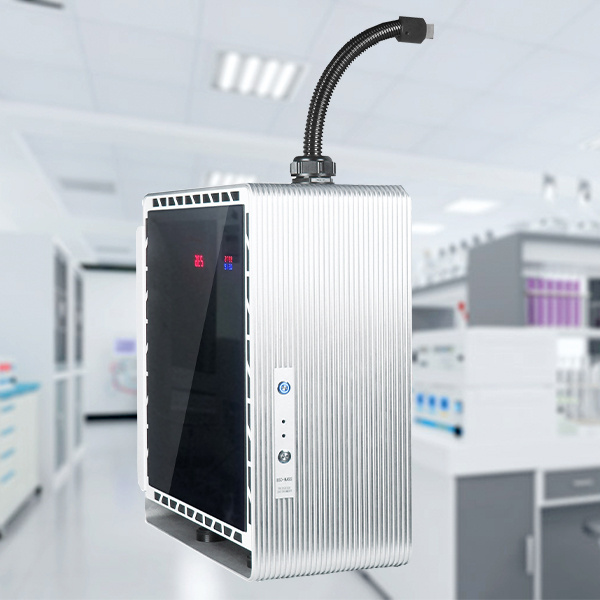
Hiden公司的HPR20 和 HPR40可分别应用于发酵过程的挥发气体和溶解气体的在线分析。对过程中产生的气体进行组份和定量的分析,从而对工艺进行评估和改进。
方案详情

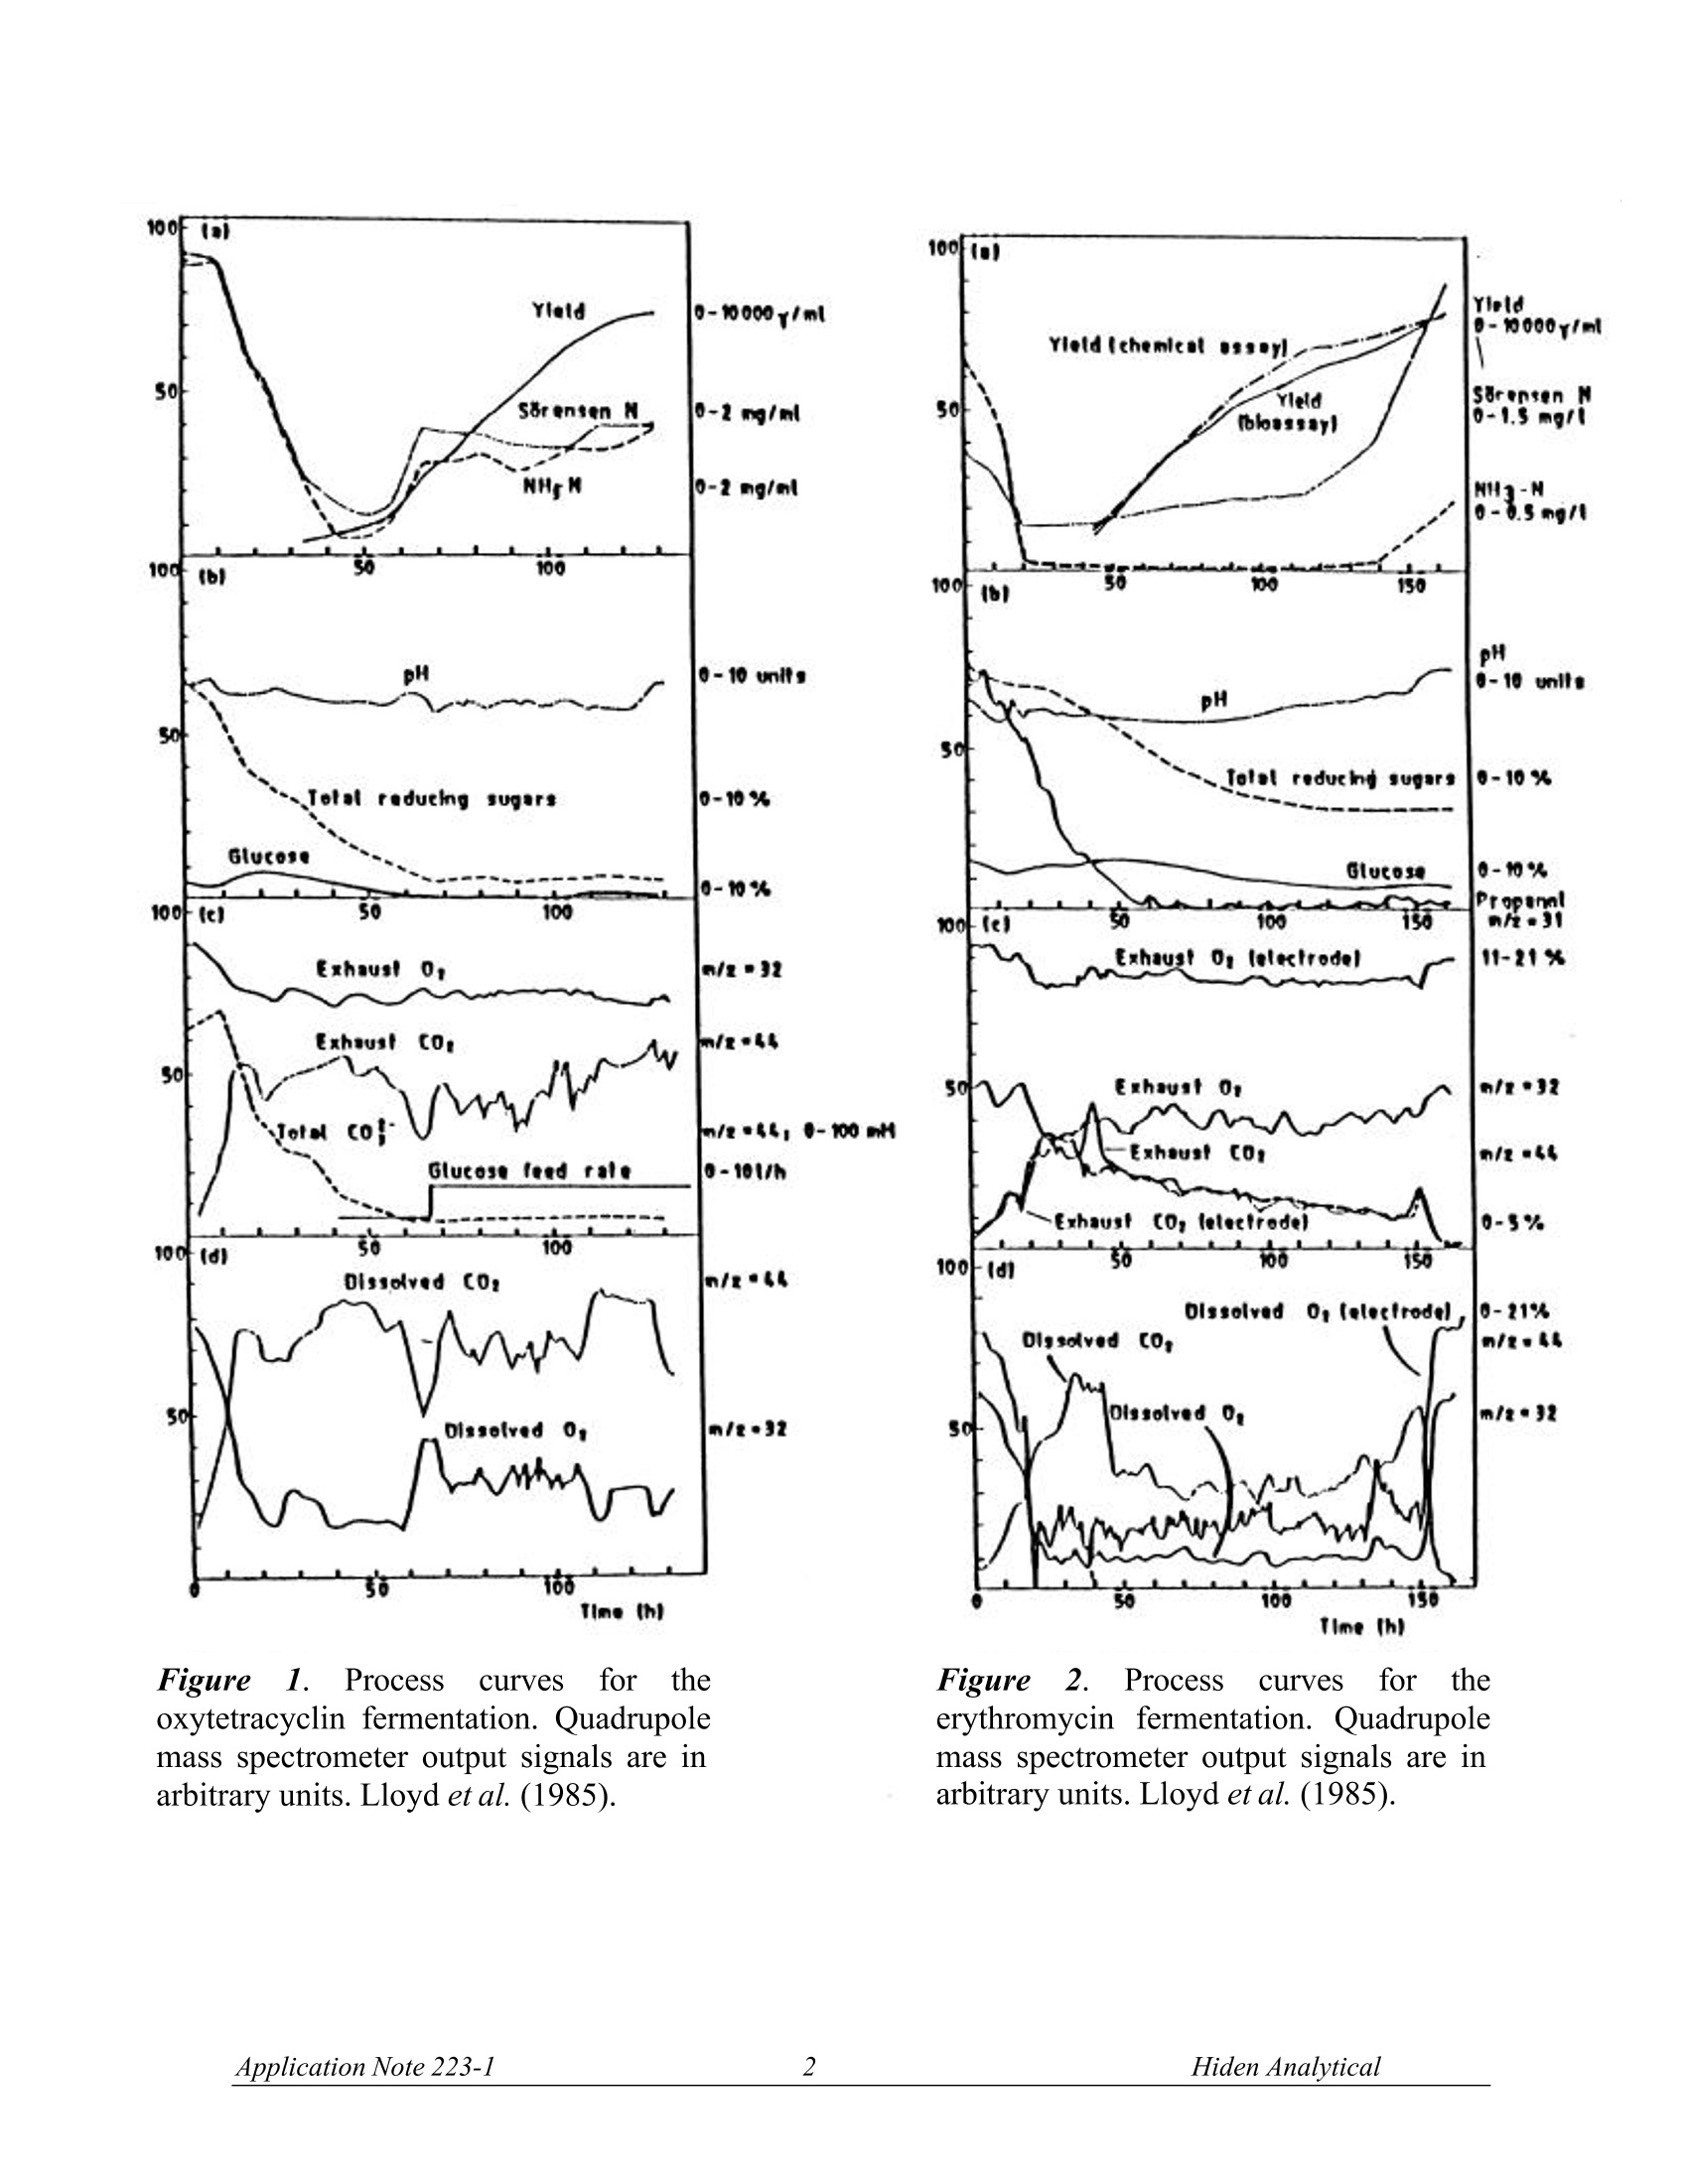
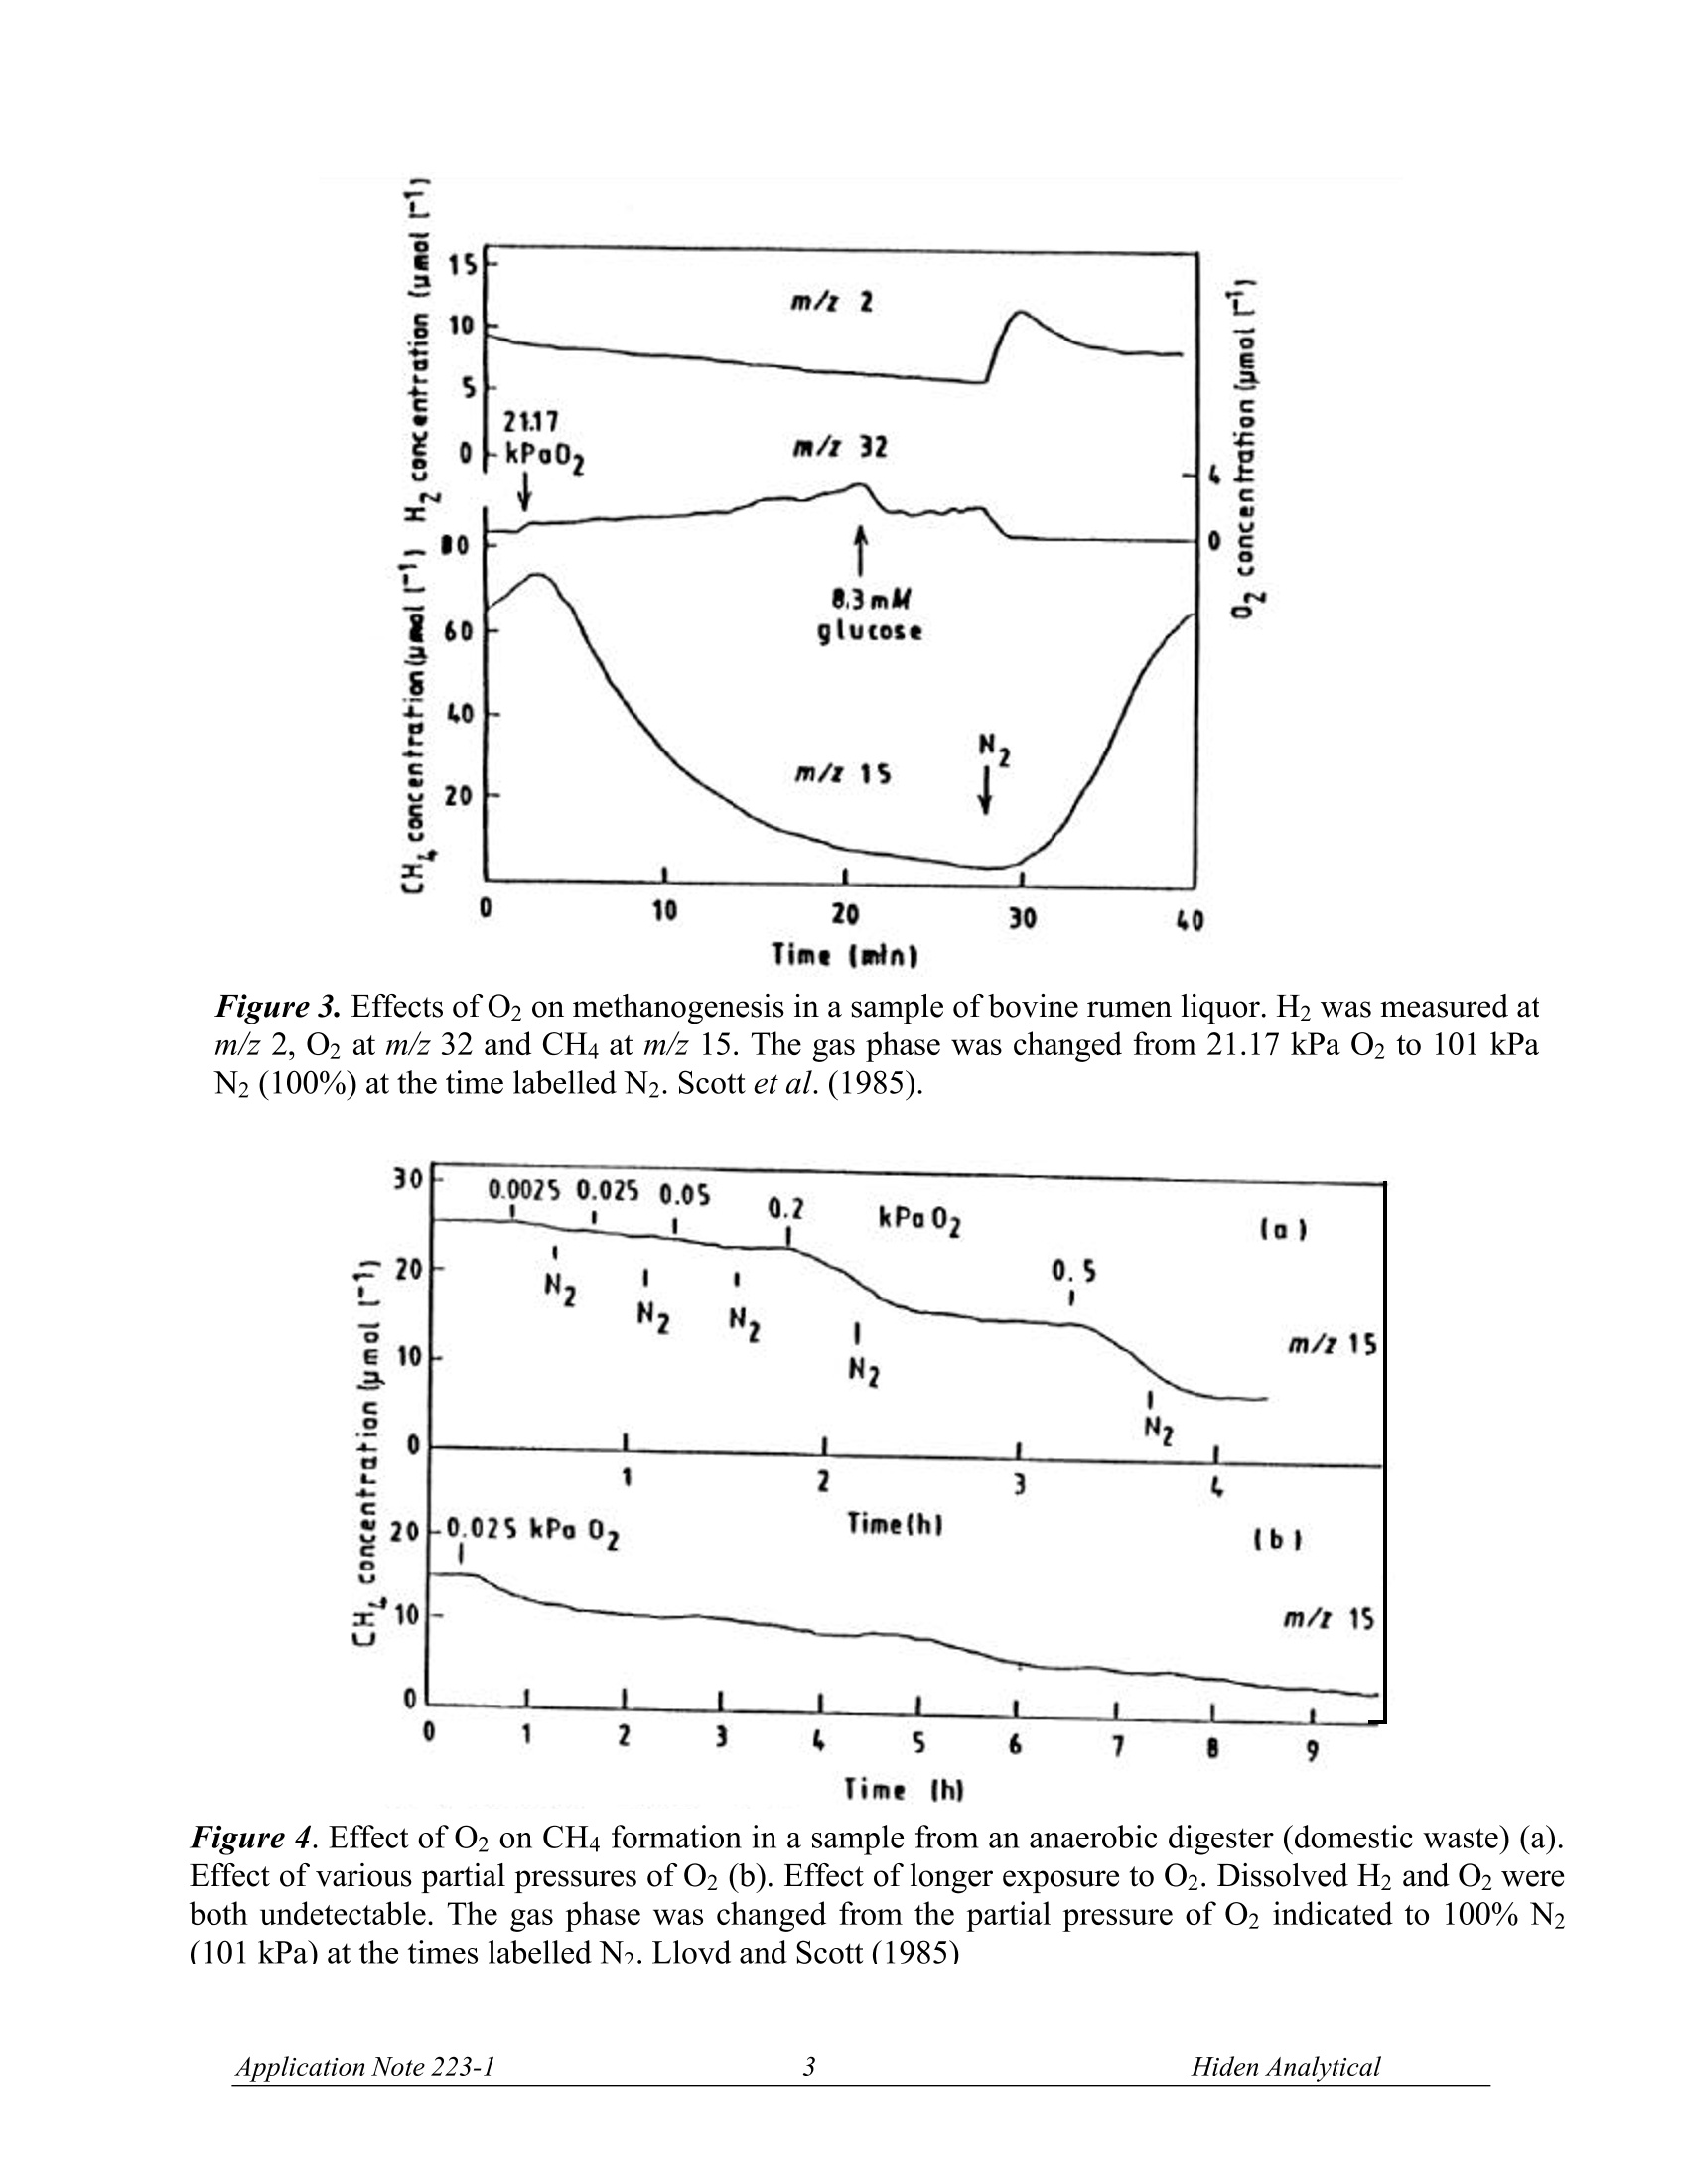
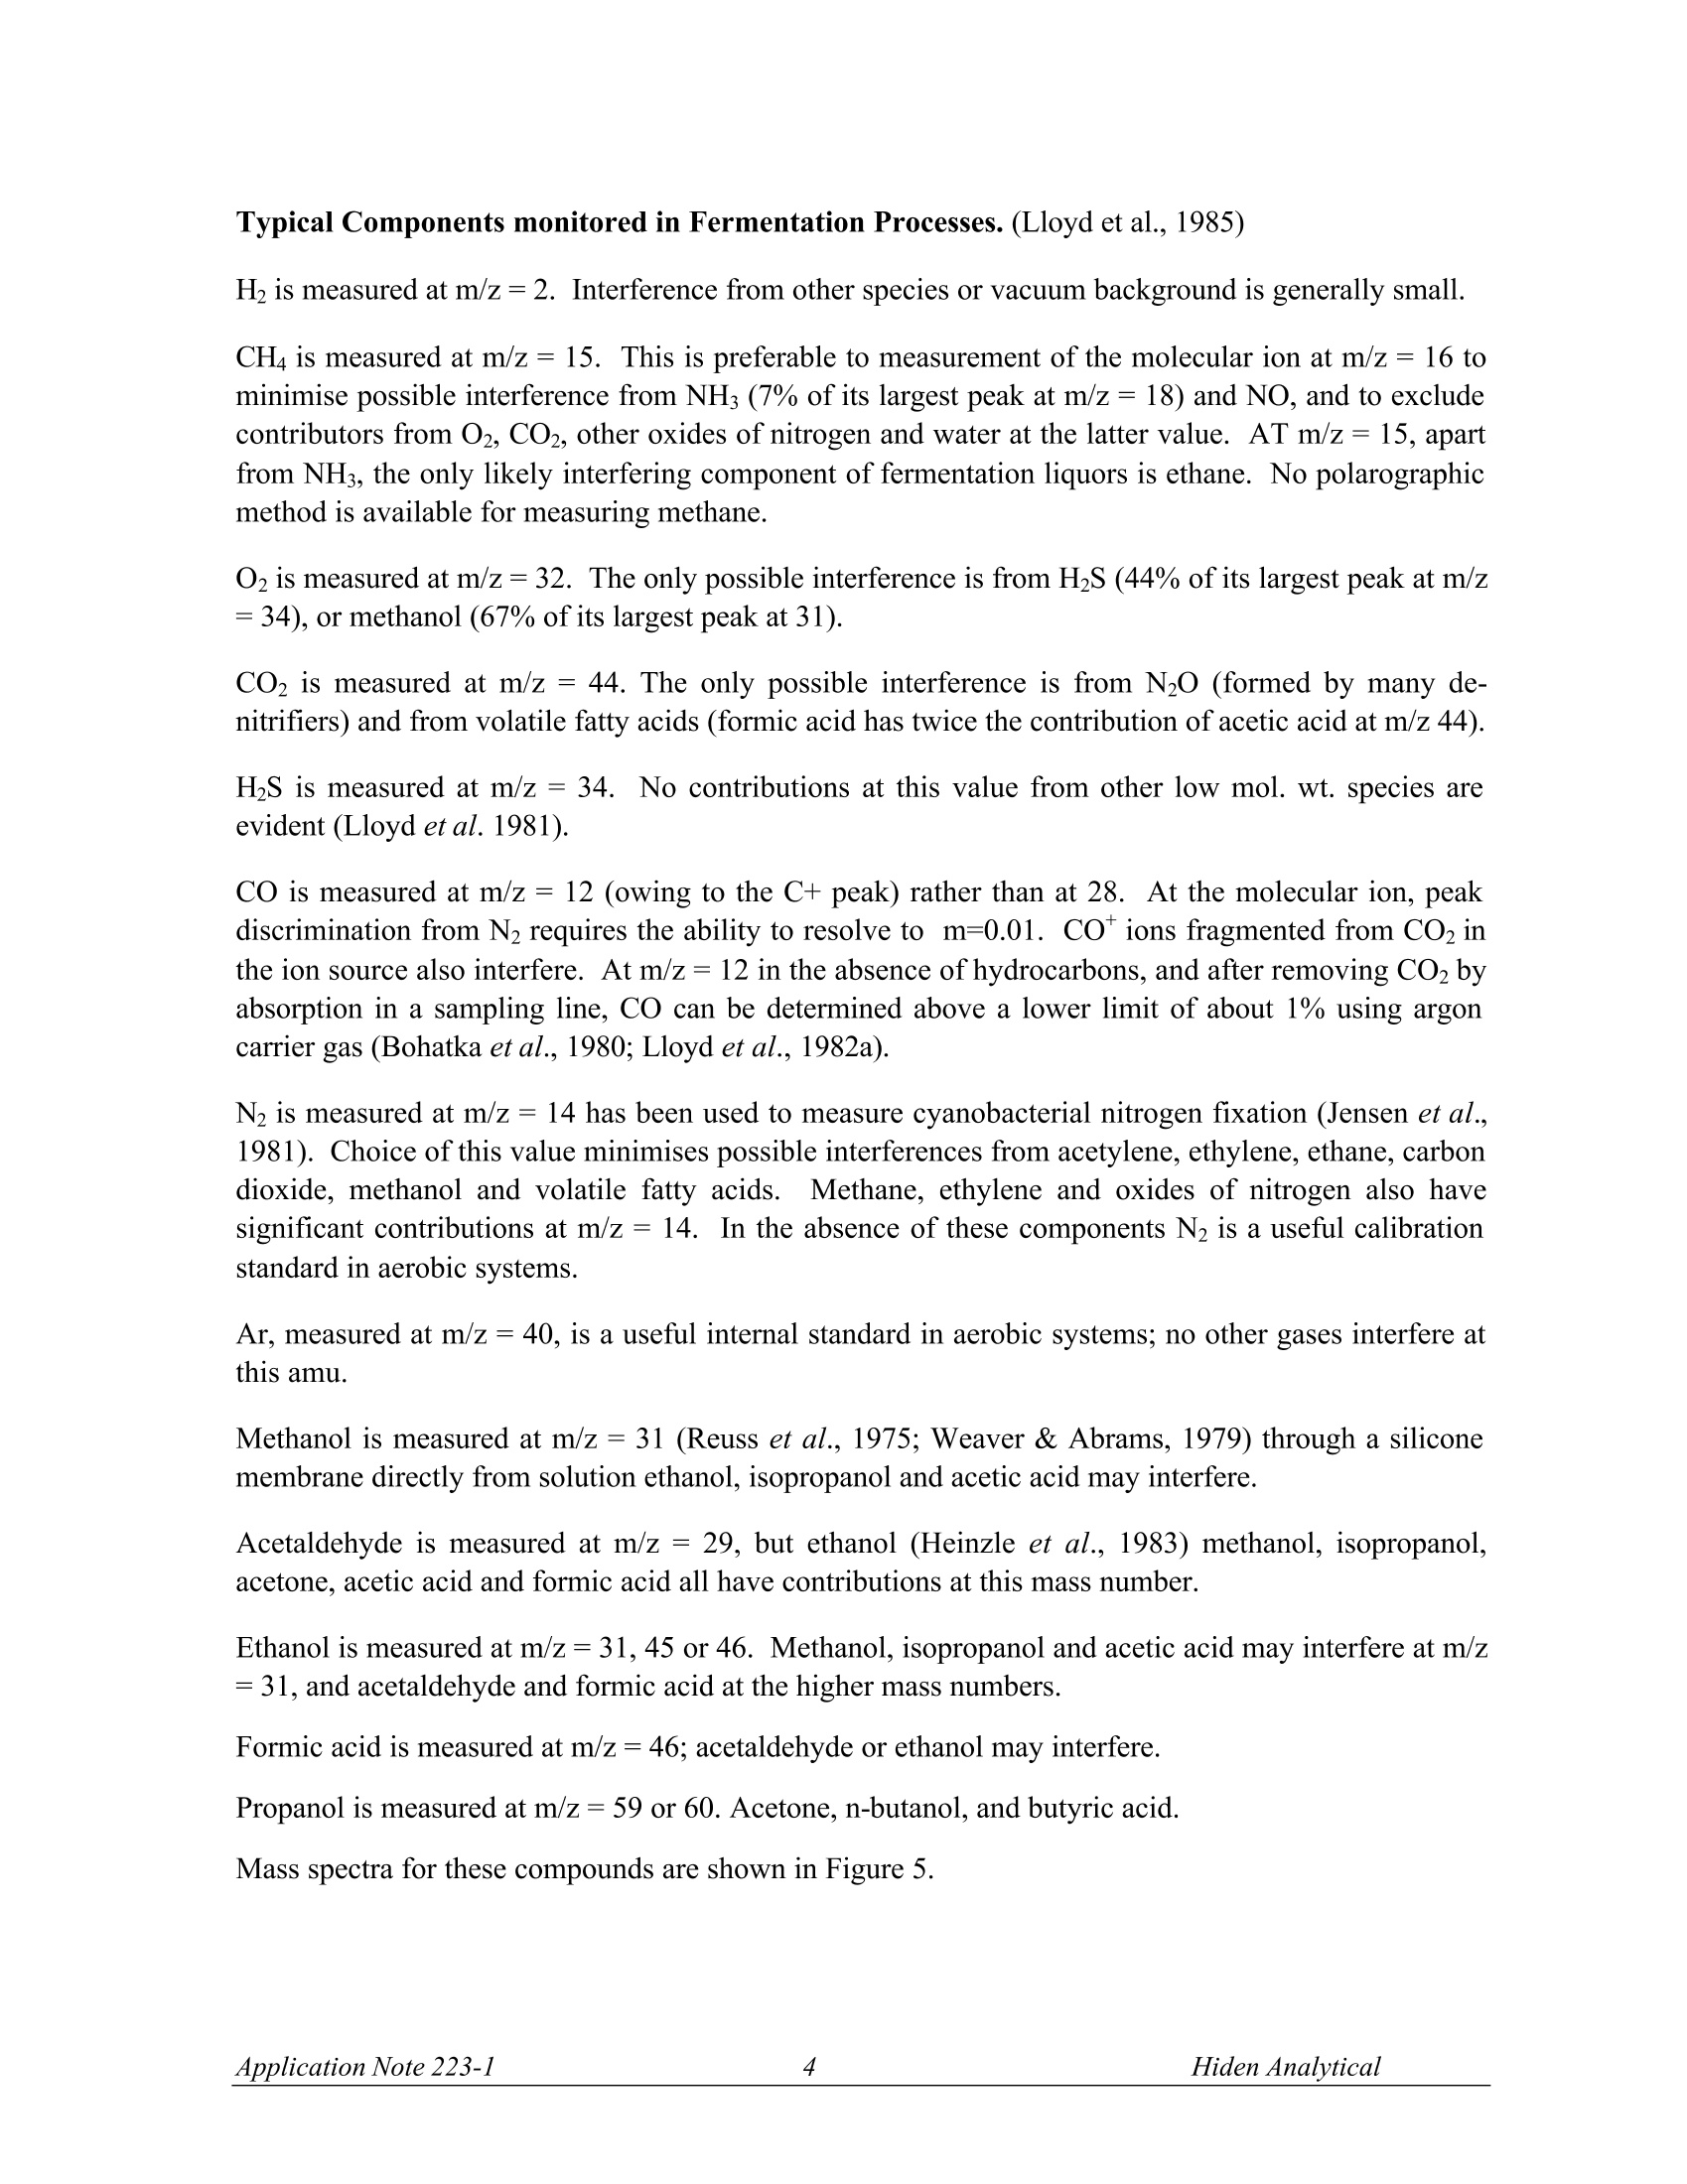
OUADRUPOLE MASS SPECTROMETRYAPPLICATION NOTE Data from FermentationMonitoring The FSMS series mass spectrometers offer data from fermentation processes ina form which suits your particular application. For example, in the laboratorydata is often required from a single fermentor using a dissolved species probeand Off-Gas probe for analysis.Typical species monitored are shown in the listattached. In pilot plant and production scale fermentors, information relating to yield of product is usually ofmost importance. Here the mass spectrometer is configured with a multiport Off-Gas analysismanifold. Data used will often be for the calculation of the respiratory quotient, carbon productionrate and oxygen uptake rate. The Off-Gas measurement provides the respiratory quotient in a time and space averaged form andwith good response time. By comparison data from multiple dissolved species probes are morespecific and can provide information about stirring efficiency, aeration and feed distribution within thefermentor.Dissolved gas measurements have the advantage of giving direct information on gasuptake and for dissolved output rates. Hiden Analytical offer systems with either Off-Gas or dissolvedspecies inlets or both. Data presentation and system control is also flexible to suit specificrequirements. Figures 1 and 2 show the progression of oxytetracyclin and erythromycin fermentations withcomparison of Off-Gas measurements and dissolved gas measurements (Bohatka et al. 1983 a,b,c;Lloyd et al.1985). Figure 3 shows the data from a laboratory experiment in which dissolved 02, H2, and CH4concentrations are measured in a sample of bovine rumen liquor using a dissolved species probe.(Scott et al. 1985). Figure 4 shows the effect of O2 on CH4 formation in a sample from an anaerobic digestor (Lloyd &Scott, 1985). Typical applications where FSMS systems are used: 一 Soil Core Analysis 一 Fermentation Process Analysis Water analysis in Estuary/River/Reservoir environments Methane production 100F Figure1.ProcessCurves forr theoxytetracyclin fermentation. Quadrupolemass spectrometer output signals are inarbitrary units. Lloyd et al. (1985). Figure2.Processcurves for theerythromycin fermentation. Quadrupolemass spectrometer output signals are inarbitrary units. Lloyd et al. (1985). Time (min) Figure 3. Effects of O2 on methanogenesis in a sample of bovine rumen liquor. H2 was measured atm/z 2, 02 at m/z 32 and CH4 at m/z 15. The gas phase was changed from 21.17 kPa O2 to 101 kPaN2 (100%) at the time labelled N2. Scott et al. (1985). Figure 4. Effect of O2 on CH4 formation in a sample from an anaerobic digester (domestic waste) (a).Effect of various partial pressures of O2 (b). Effect of longer exposure to O2. Dissolved H and O2 wereboth undetectable. The gas phase was changed from the partial pressure of O2 indicated to 100% N2(101 kPa) at the times labelled N. Lloyd and Scott (1985) Typical Components monitored in Fermentation Processes. (Lloyd et al., 1985) H is measured at m/z=2. Interference from other species or vacuum background is generally small. CH4 is measured at m/z=15. This is preferable to measurement of the molecular ion at m/z = 16 tominimise possible interference from NHs (7% of its largest peak at m/z=18) and NO, and to excludecontributors from O2, CO2, other oxides of nitrogen and water at the latter value. AT m/z =15, apartfrom NH, the only likely interfering component of fermentation liquors is ethane. No polarographicmethod is available for measuring methane. O2 is measured at m/z =32. The only possible interference is from H2S (44% of its largest peak at m/z=34), or methanol (67% of its largest peak at 31). COz is measured at m/z = 44. The only possible interference is from N2O (formed by many de-nitrifiers) and from volatile fatty acids (formic acid has twice the contribution of acetic acid at m/z 44). HS is measured at m/z =34.No contributions at this value from other low mol. wt. species areevident (Lloyd et al.1981). CO is measured at m/z = 12 (owing to the C+ peak) rather than at 28. At the molecular ion, peakdiscrimination from N2requires the ability to resolve to m=0.01. COions fragmented from CO2 inthe ion source also interfere. At m/z=12 in the absence of hydrocarbons, and after removing CO2 byabsorption in a sampling line, CO can be determined above a lower limit of about 1% using argoncarrier gas (Bohatka et al., 1980; Lloyd et al., 1982a). N2 is measured at m/z = 14 has been used to measure cyanobacterial nitrogen fixation (Jensen et al.,1981). Choice of this value minimises possible interferences from acetylene, ethylene, ethane, carbondioxide, methanol and volatile fatty acids.. Methane, ethylene and oxides of nitrogen also havesignificant contributions at m/z = 14. In the absence of these components N2 is a useful calibrationstandard in aerobic systems. Ar, measured at m/z = 40, is a useful internal standard in aerobic systems; no other gases interfere atthis amu. Methanol is measured at m/z =31 (Reuss et al., 1975; Weaver & Abrams, 1979) through a siliconemembrane directly from solution ethanol, isopropanol and acetic acid may interfere. Acetaldehyde is measured at m/z =29, but ethanol (Heinzle et al., 1983) methanol, isopropanol,acetone, acetic acid and formic acid all have contributions at this mass number. Ethanol is measured at m/z = 31, 45 or 46. Methanol, isopropanol and acetic acid may interfere at m/z=31, and acetaldehyde and formic acid at the higher mass numbers. Formic acid is measured at m/z= 46; acetaldehyde or ethanol may interfere. Propanol is measured at m/z = 59 or 60. Acetone, n-butanol,and butyric acid. Mass spectra for these compounds are shown in Figure 5. n-Butanol,M=74Measured peak=56 0 0 10 20 30 40 50 80 70 00 90 100 bles RepuOn UseiSpec Stutthto Constains Adjuson OuitkPhirt 4Ren1MII-BUfanol Ptervioues bas RepLOn UseiSpec Stutio Conetai Butyric acid, M*=88Measured peak =73 AdjusMin shBecr官 官 Acetone,M =58 Measured peak=58 Acetic acid, M*=60Measured peak =60 Figure 5. Mass spectra of products of the acetone-butanol fermentation. The spectra are normalisedto the largest peak of each spectrum set to 100. The m/z value of the molecular ion is indicated (*),as is the m/z value of the peak chosen for calculations (arrow). Doerner et al. (1982). REFERENCES Bohatka S, Langer G, Szilagyi J & Berecz I (1983a). Gas concentration determination in fermentorswith quadrupole mass spectrometer, Int. J. Mass Spectrometery and Ion Physics, 48,277-80. Bohatka S, Polya K, Langer G & Szilagyi J (1983b). Quadrupole mass spectrometer analyser systemfor monitoring fermentation processes. Proc. Conference Advances in Fermentation, London, p.131. Bohatka S, Langer G, Szilagyi J, Berecz I, Diòs Z & Kiss L. (1983c). Mass spectrometric monitoringof fermentation processes,Proc. 9th International Vacuum Congress, Madrid, p.85. Doerner P, Lehmann J, Piehl H & Megnet R (1982). Process analysis of the acetone-butanolfermentation by quadrupole mass spectrometry ,Biotechnol, Letts, 4, 557-62. Lloyd D (1985). Simultaneous dissolved O2 and redox measurements: use of polarographic,bioluminescence and mass spectrometric monitoring combined with dual wavelength spectrometry. In:Gas Enzymology (Ed. H. Degn, R.P. Cox and H. Toftlund),Reidel, Dordrecht, pp. 37-53. Lloyd D & Scott RI (1985). Mass spectrometric monitoring of dissolved gases. In: Microbial GasMetabolism (Ed. R. K. Poole and C. S. Dow), Academic Press, New York,pp. 239-62. Scott R I, Williams T N, Whitmore T N & Lloyd D (1985). Mass spectrometric determinations of theeffect of oxygen on methanogenesis: inhibition or stimulation? In: Microbial Gas Metabolis(Ed. R. K.Poole and C. S. Dow), Academic Press, New York, pp. 263-70. Manufactured in England by: HIDEN ANALYTICAL LTD420 EUROPA BOULEVARDWARRINGTON WA5 7UN ENGLANDTel: +44(0)1925 445225Fax:+44(0)1925 416518E.mail: info@hiden.co.uk Web Site: http://www.HidenAnalytical.com Please note the specifications in this document may be changed and cannot form part of any contract H:\wordproc\application notes\gas an223 fsms.doc pplication Note iden Analytical
确定
还剩4页未读,是否继续阅读?

产品配置单
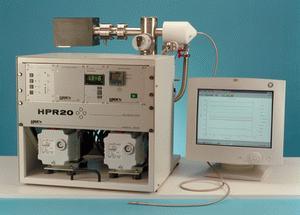
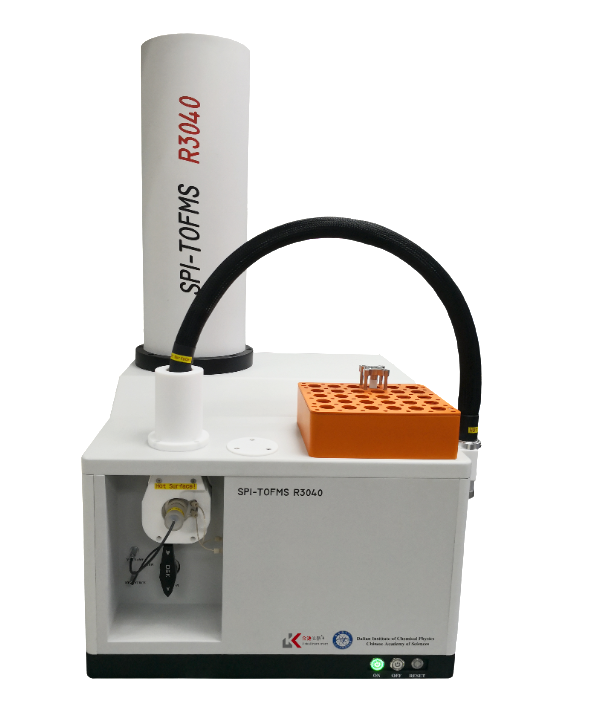
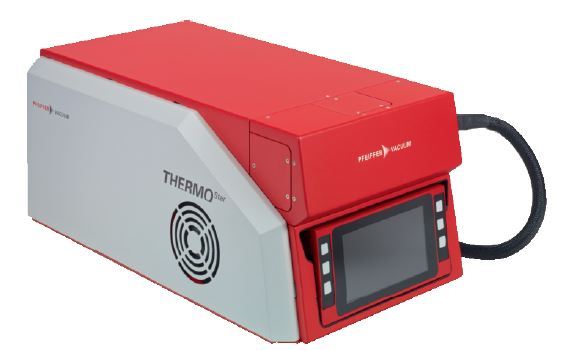
北京英格海德分析技术有限公司为您提供《气体中发酵过程分析检测方案(在线质谱)》,该方案主要用于工业气体中发酵过程分析检测,参考标准--,《气体中发酵过程分析检测方案(在线质谱)》用到的仪器有Hiden HPR20 研究级在线质谱仪
推荐专场

相关方案
更多
该厂商其他方案
更多