


方案详情
文
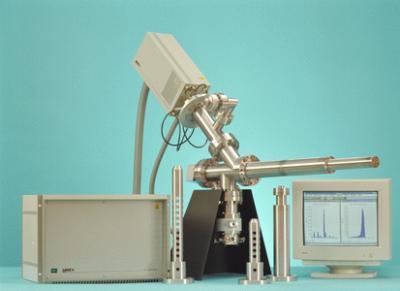
Hiden公司利用HPR60的高端技术,成功的解决了利用质谱仪进行常压等离子体分析的难题。仪器采用三组真空泵站取样技术。
方案详情

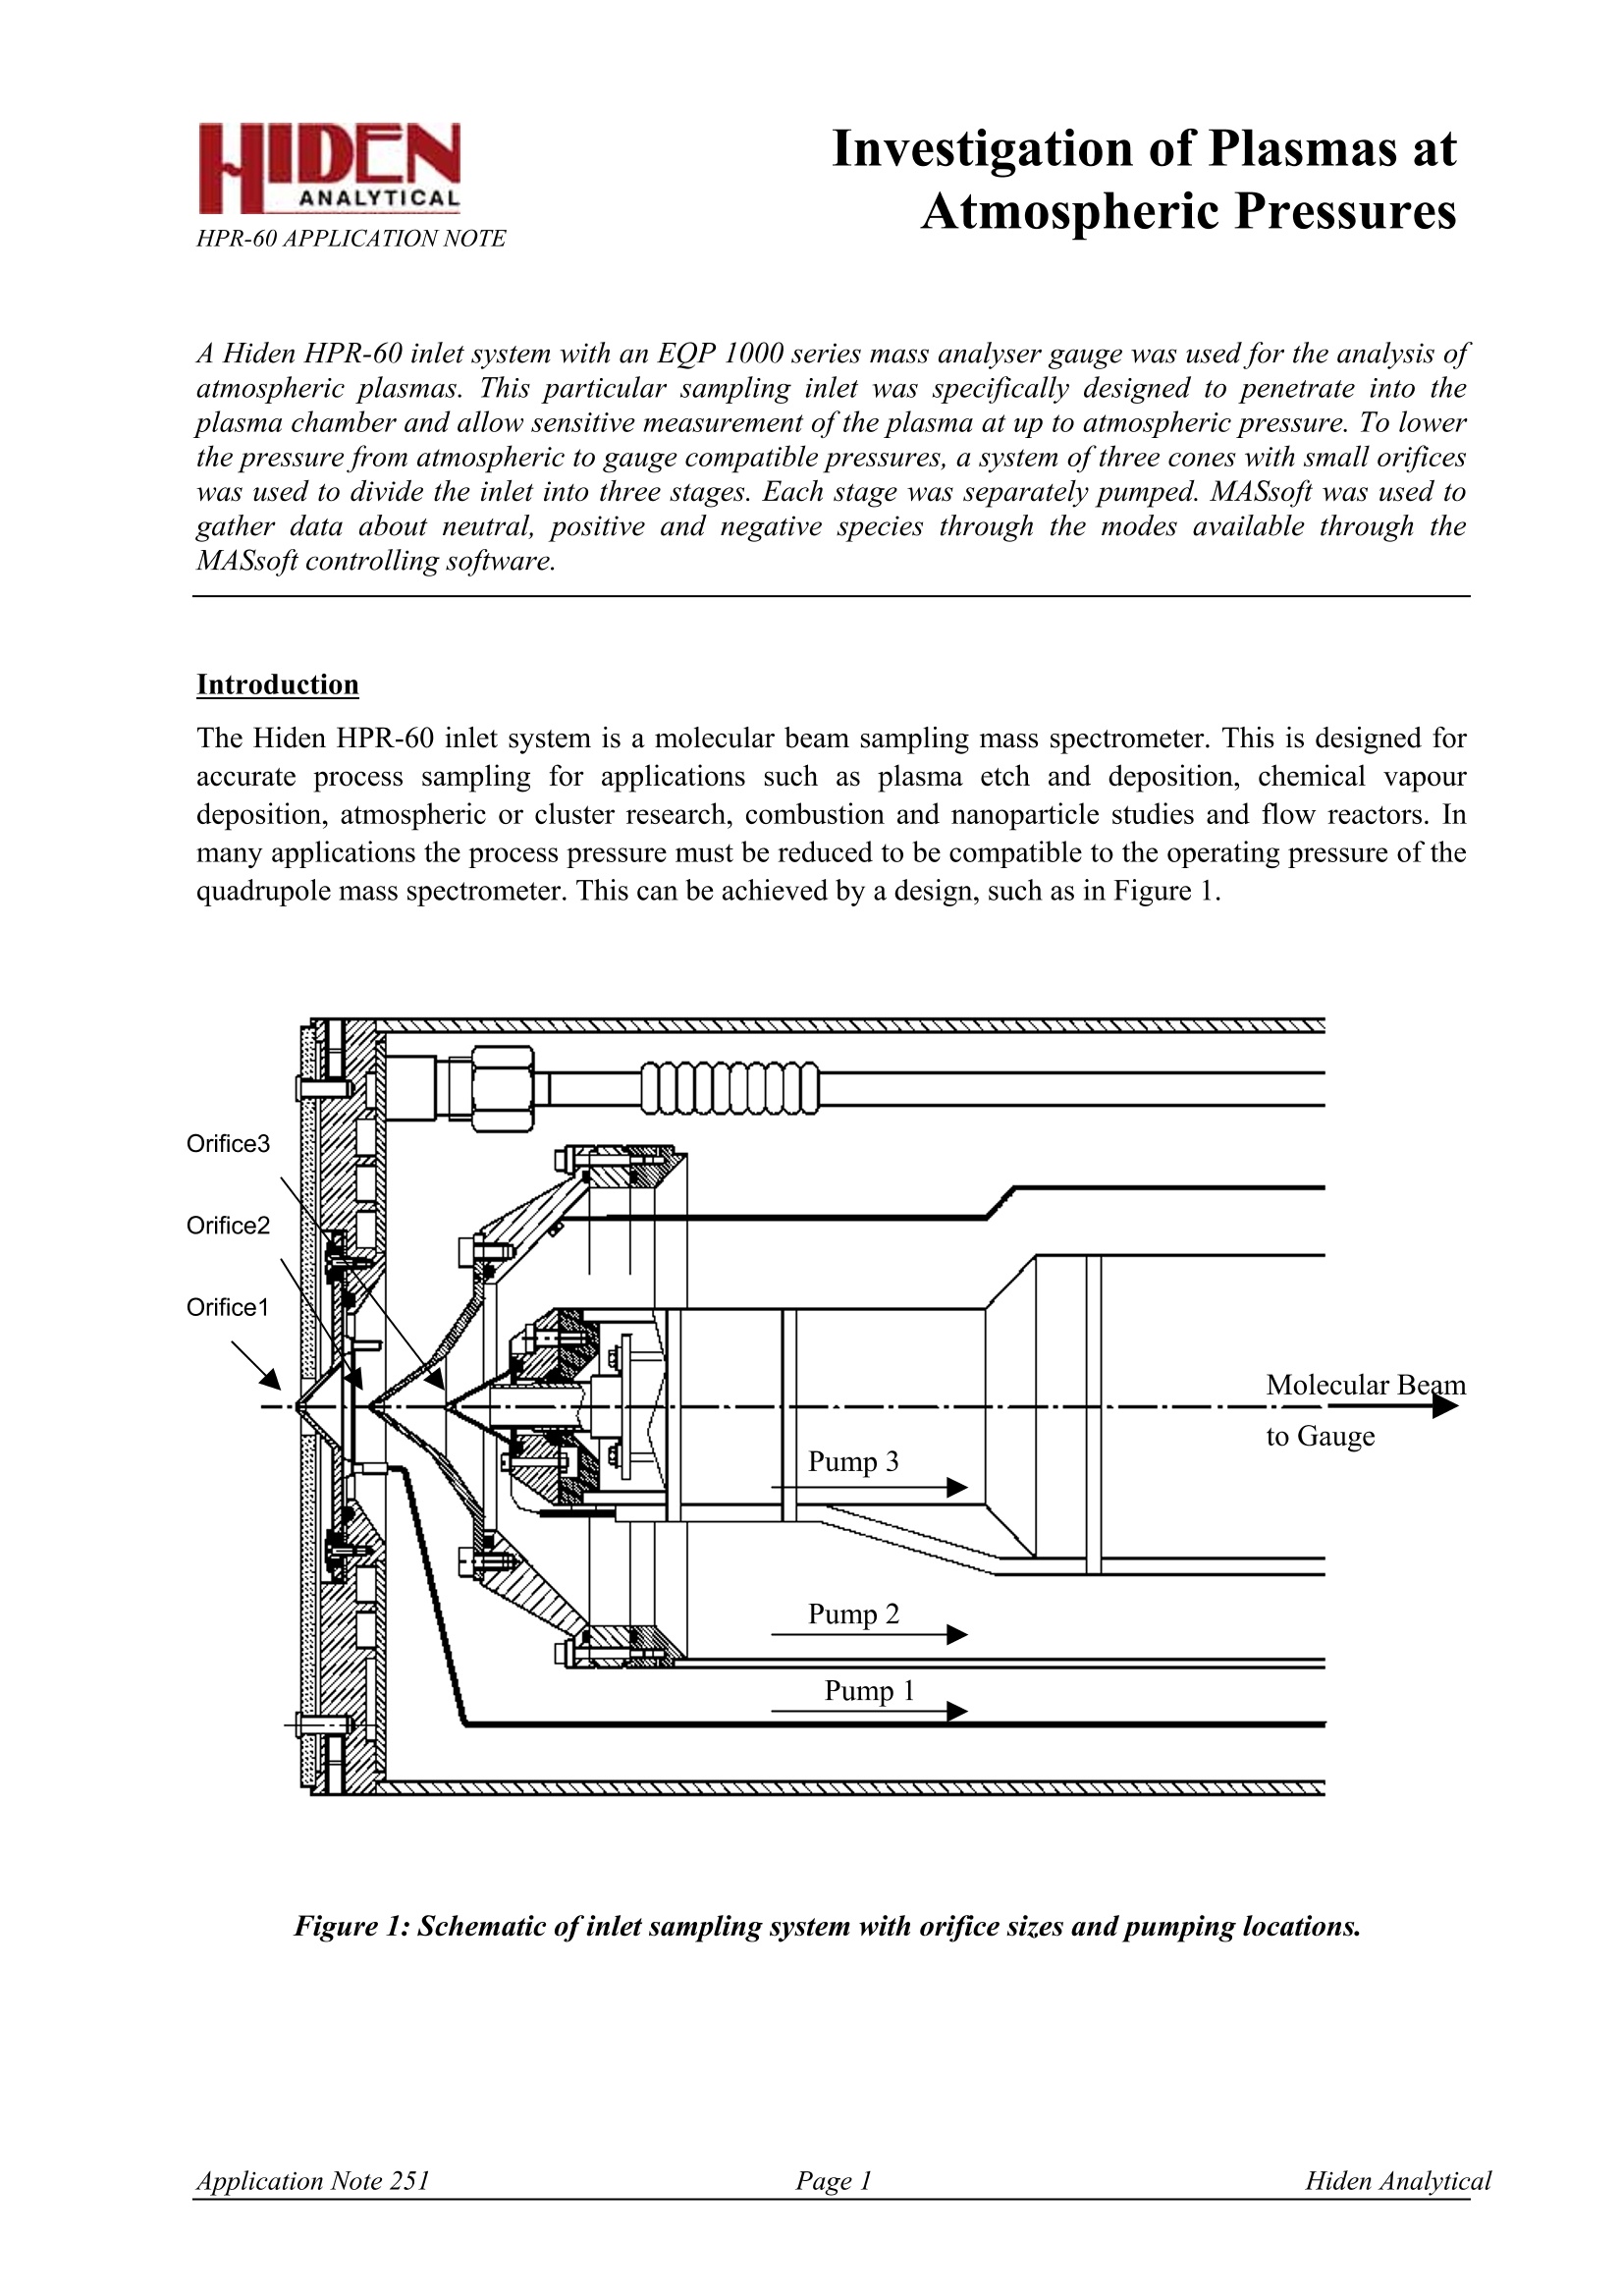
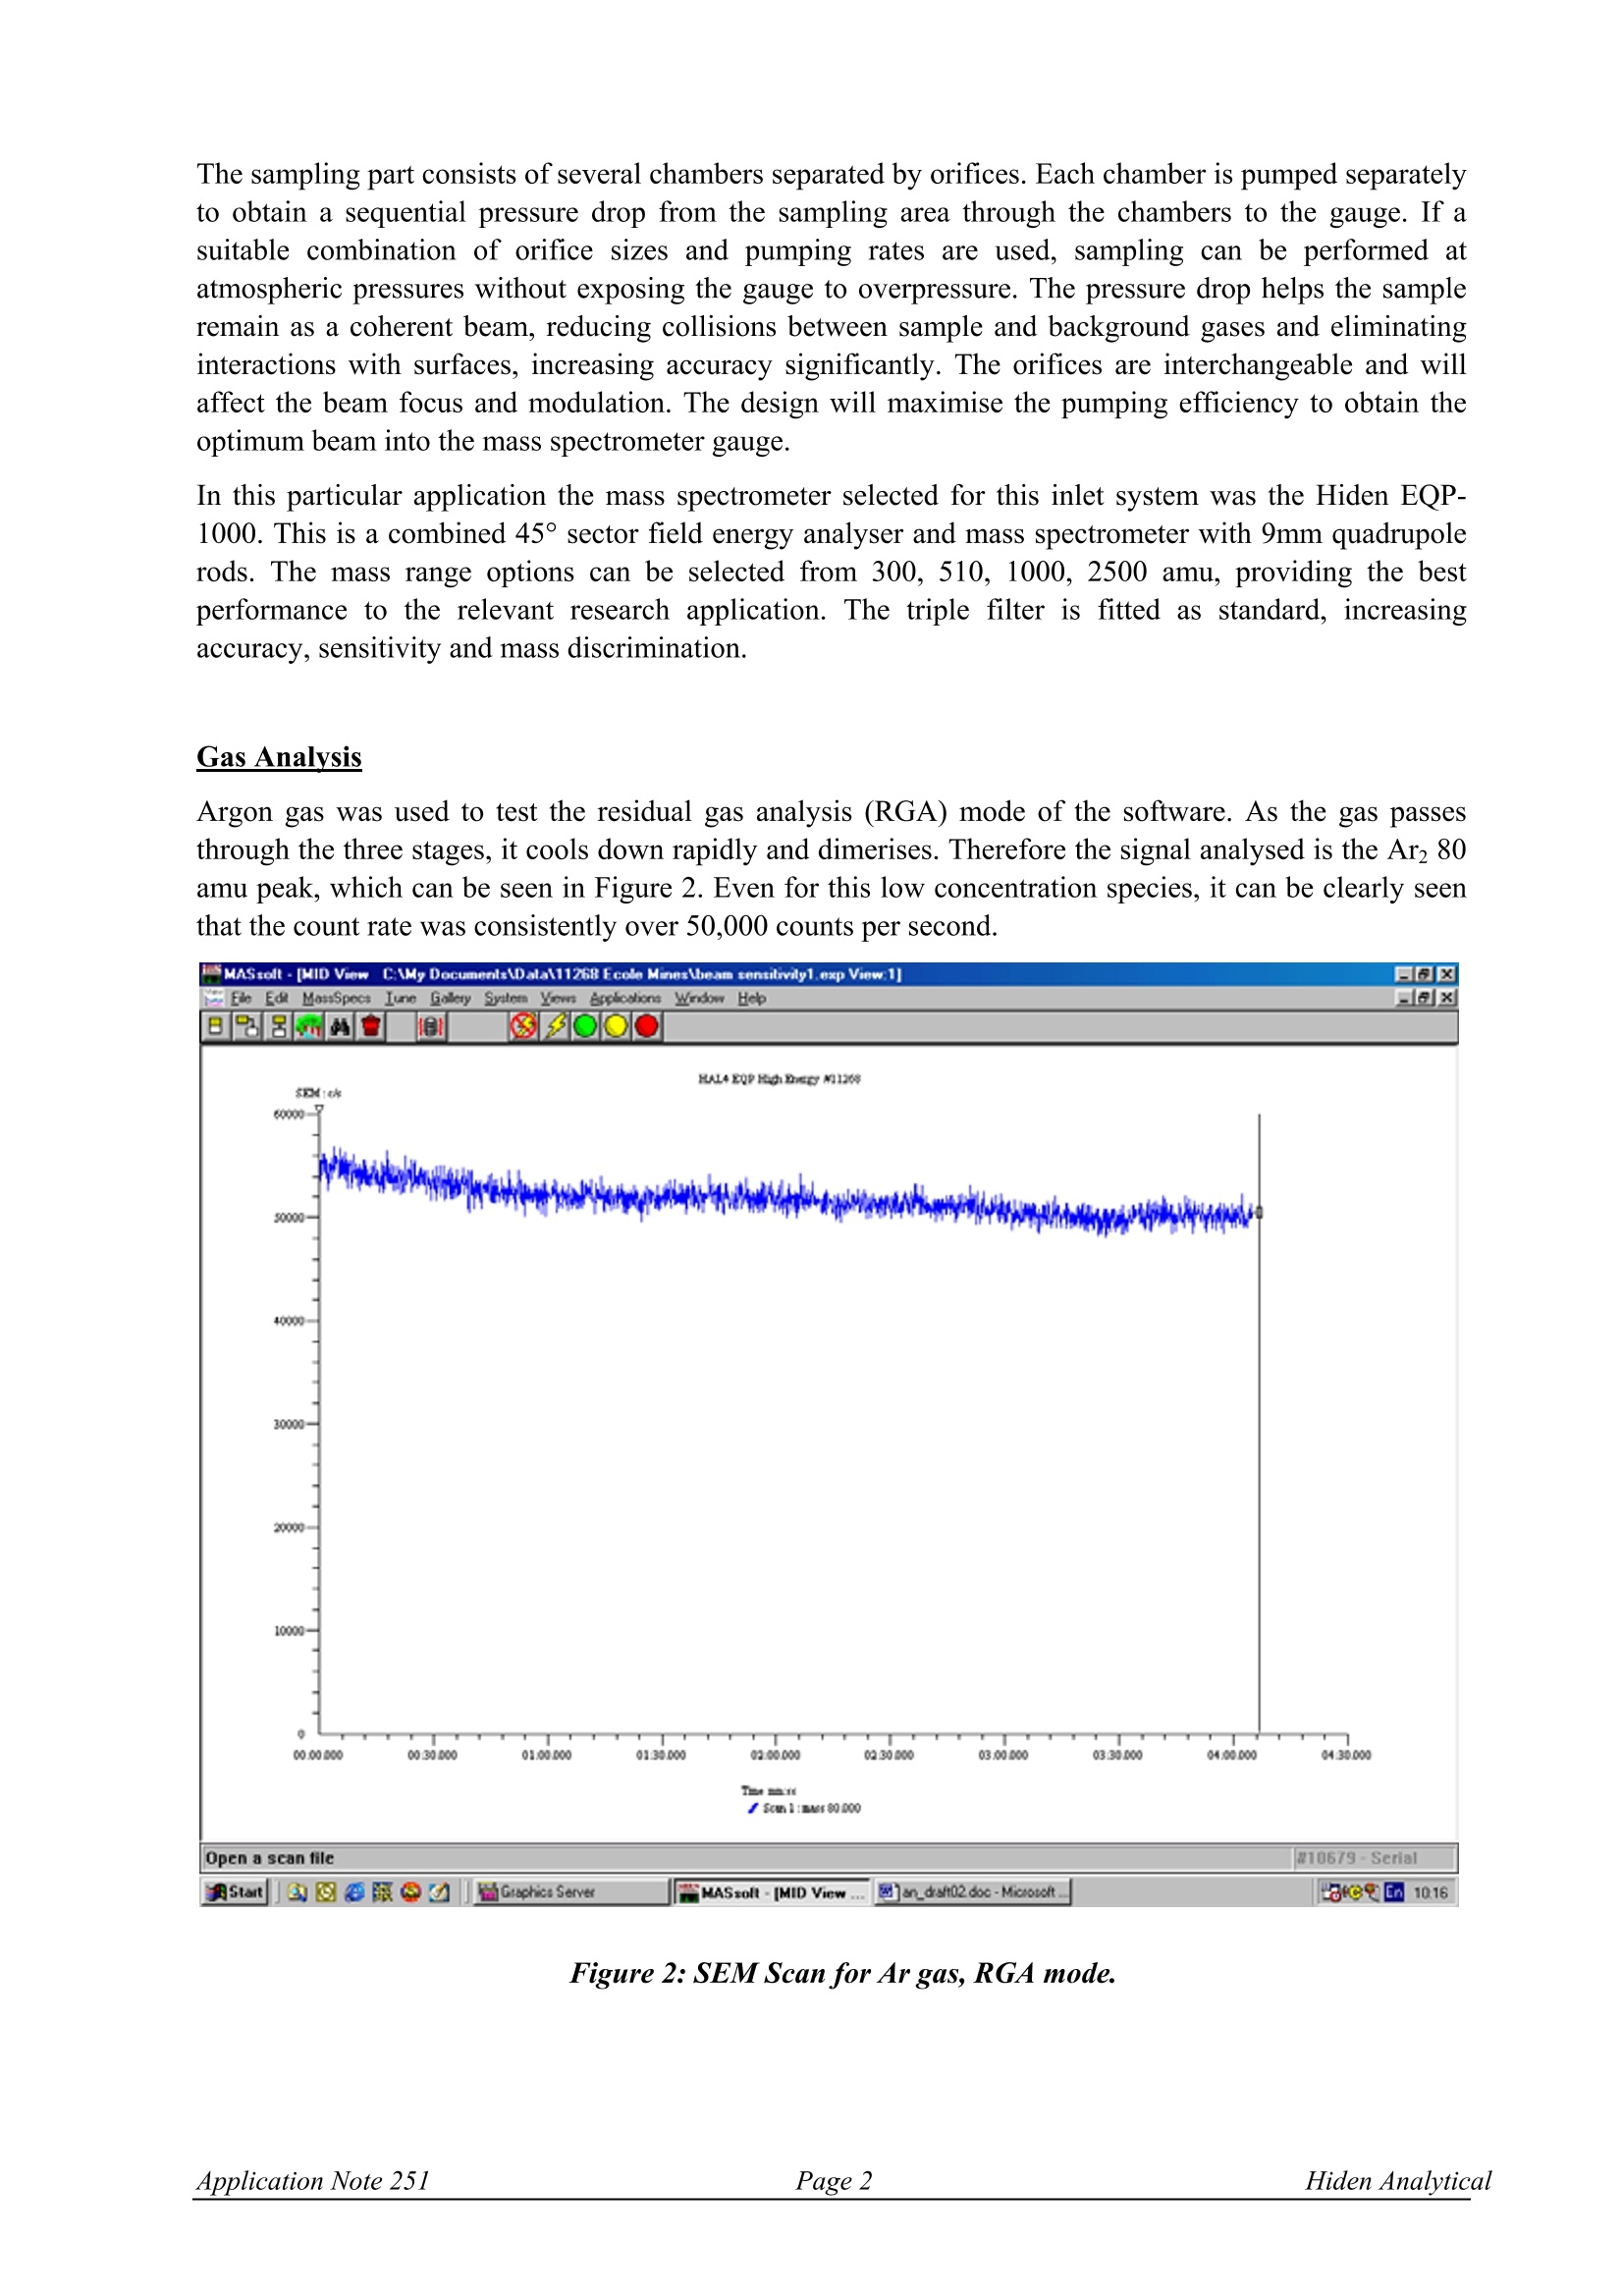
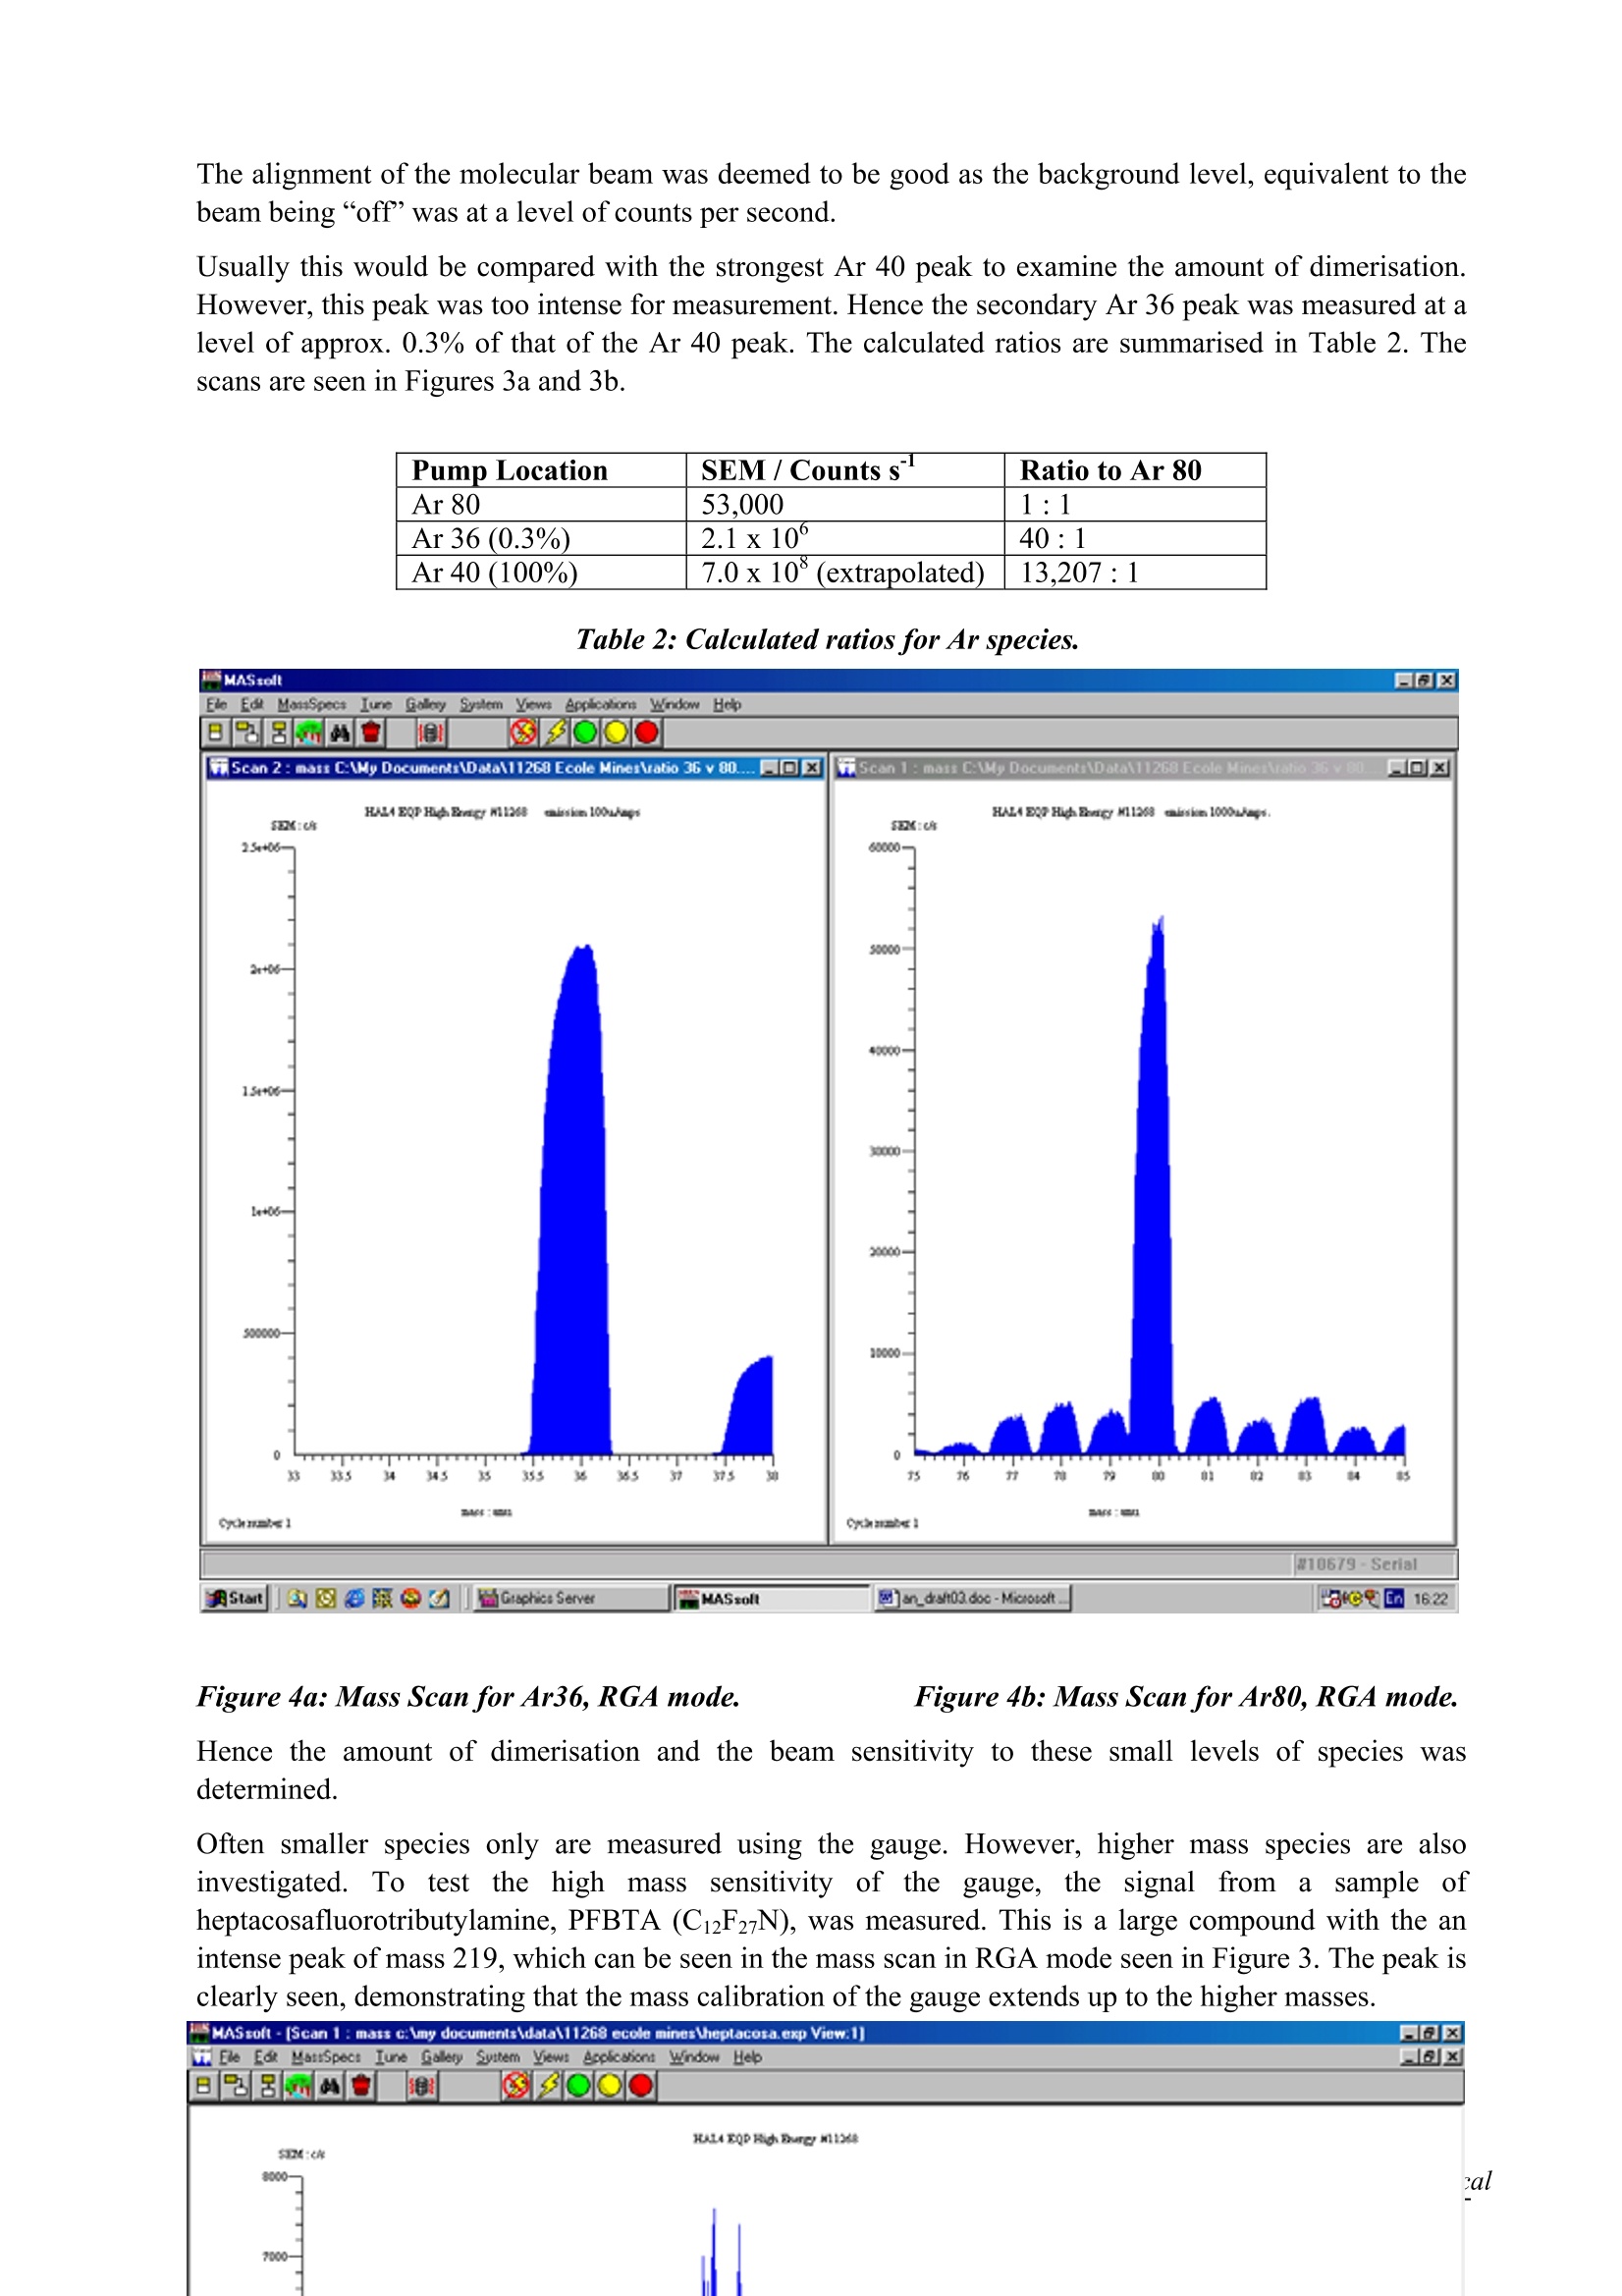
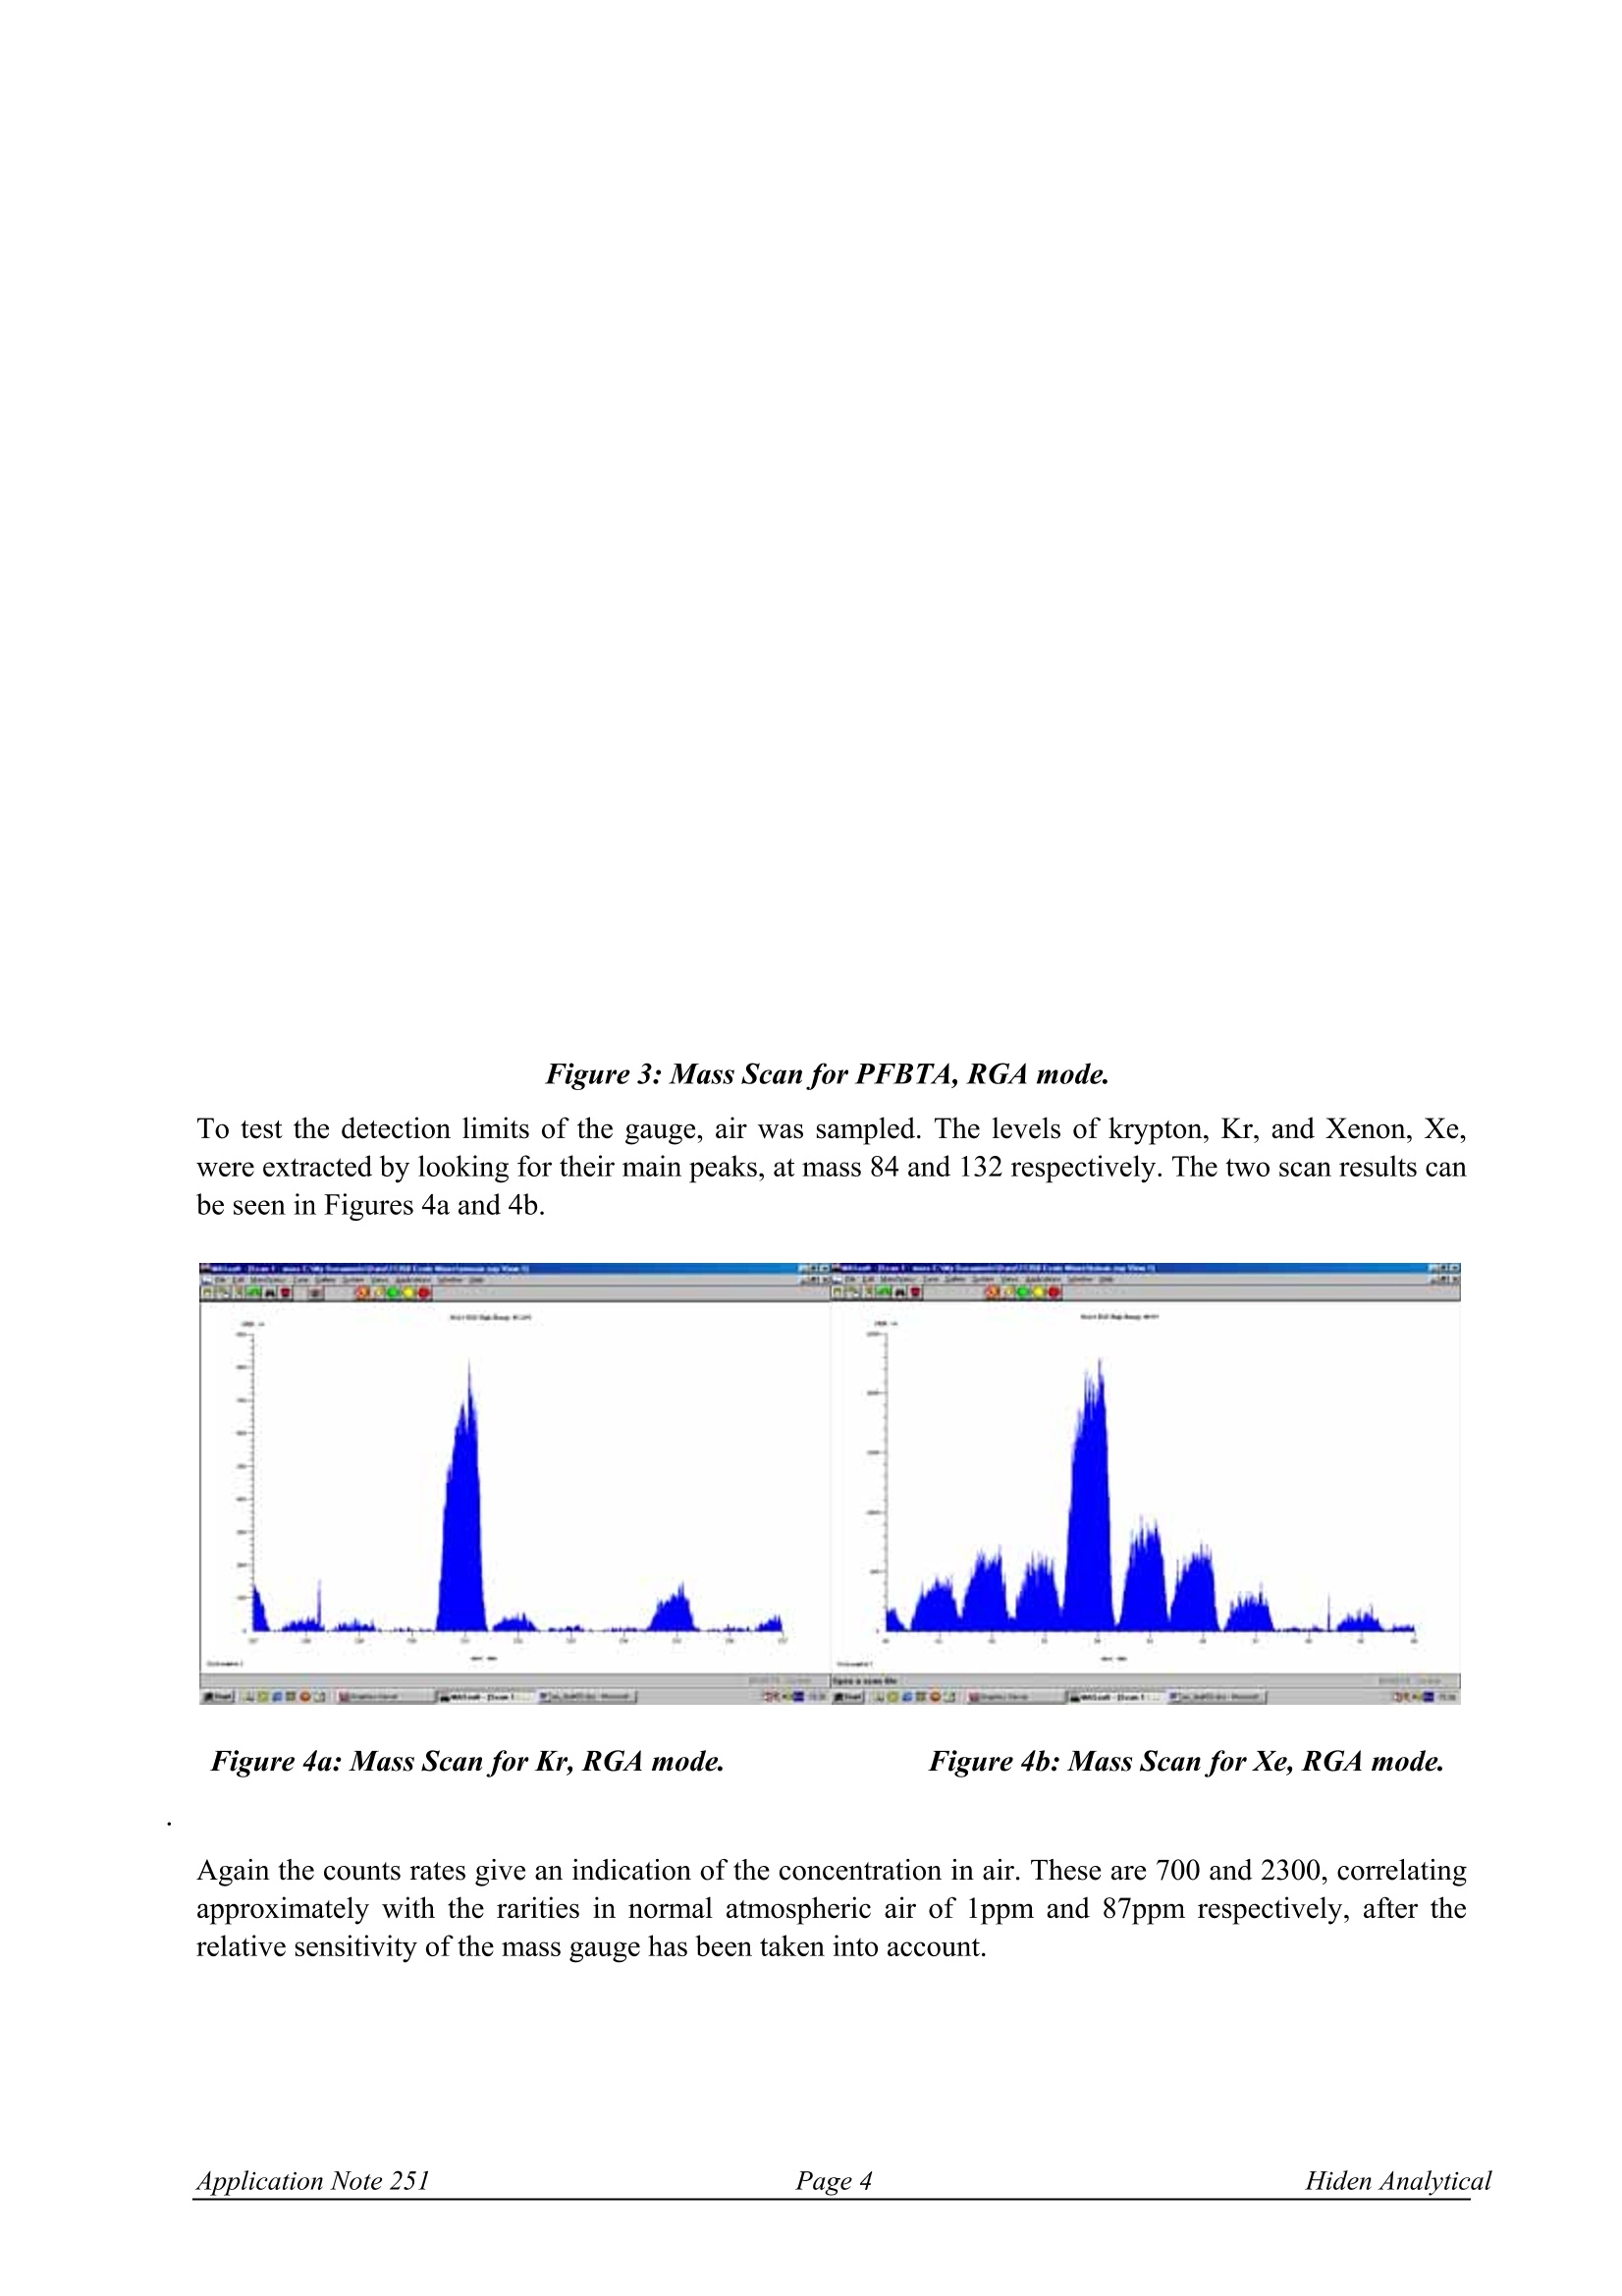
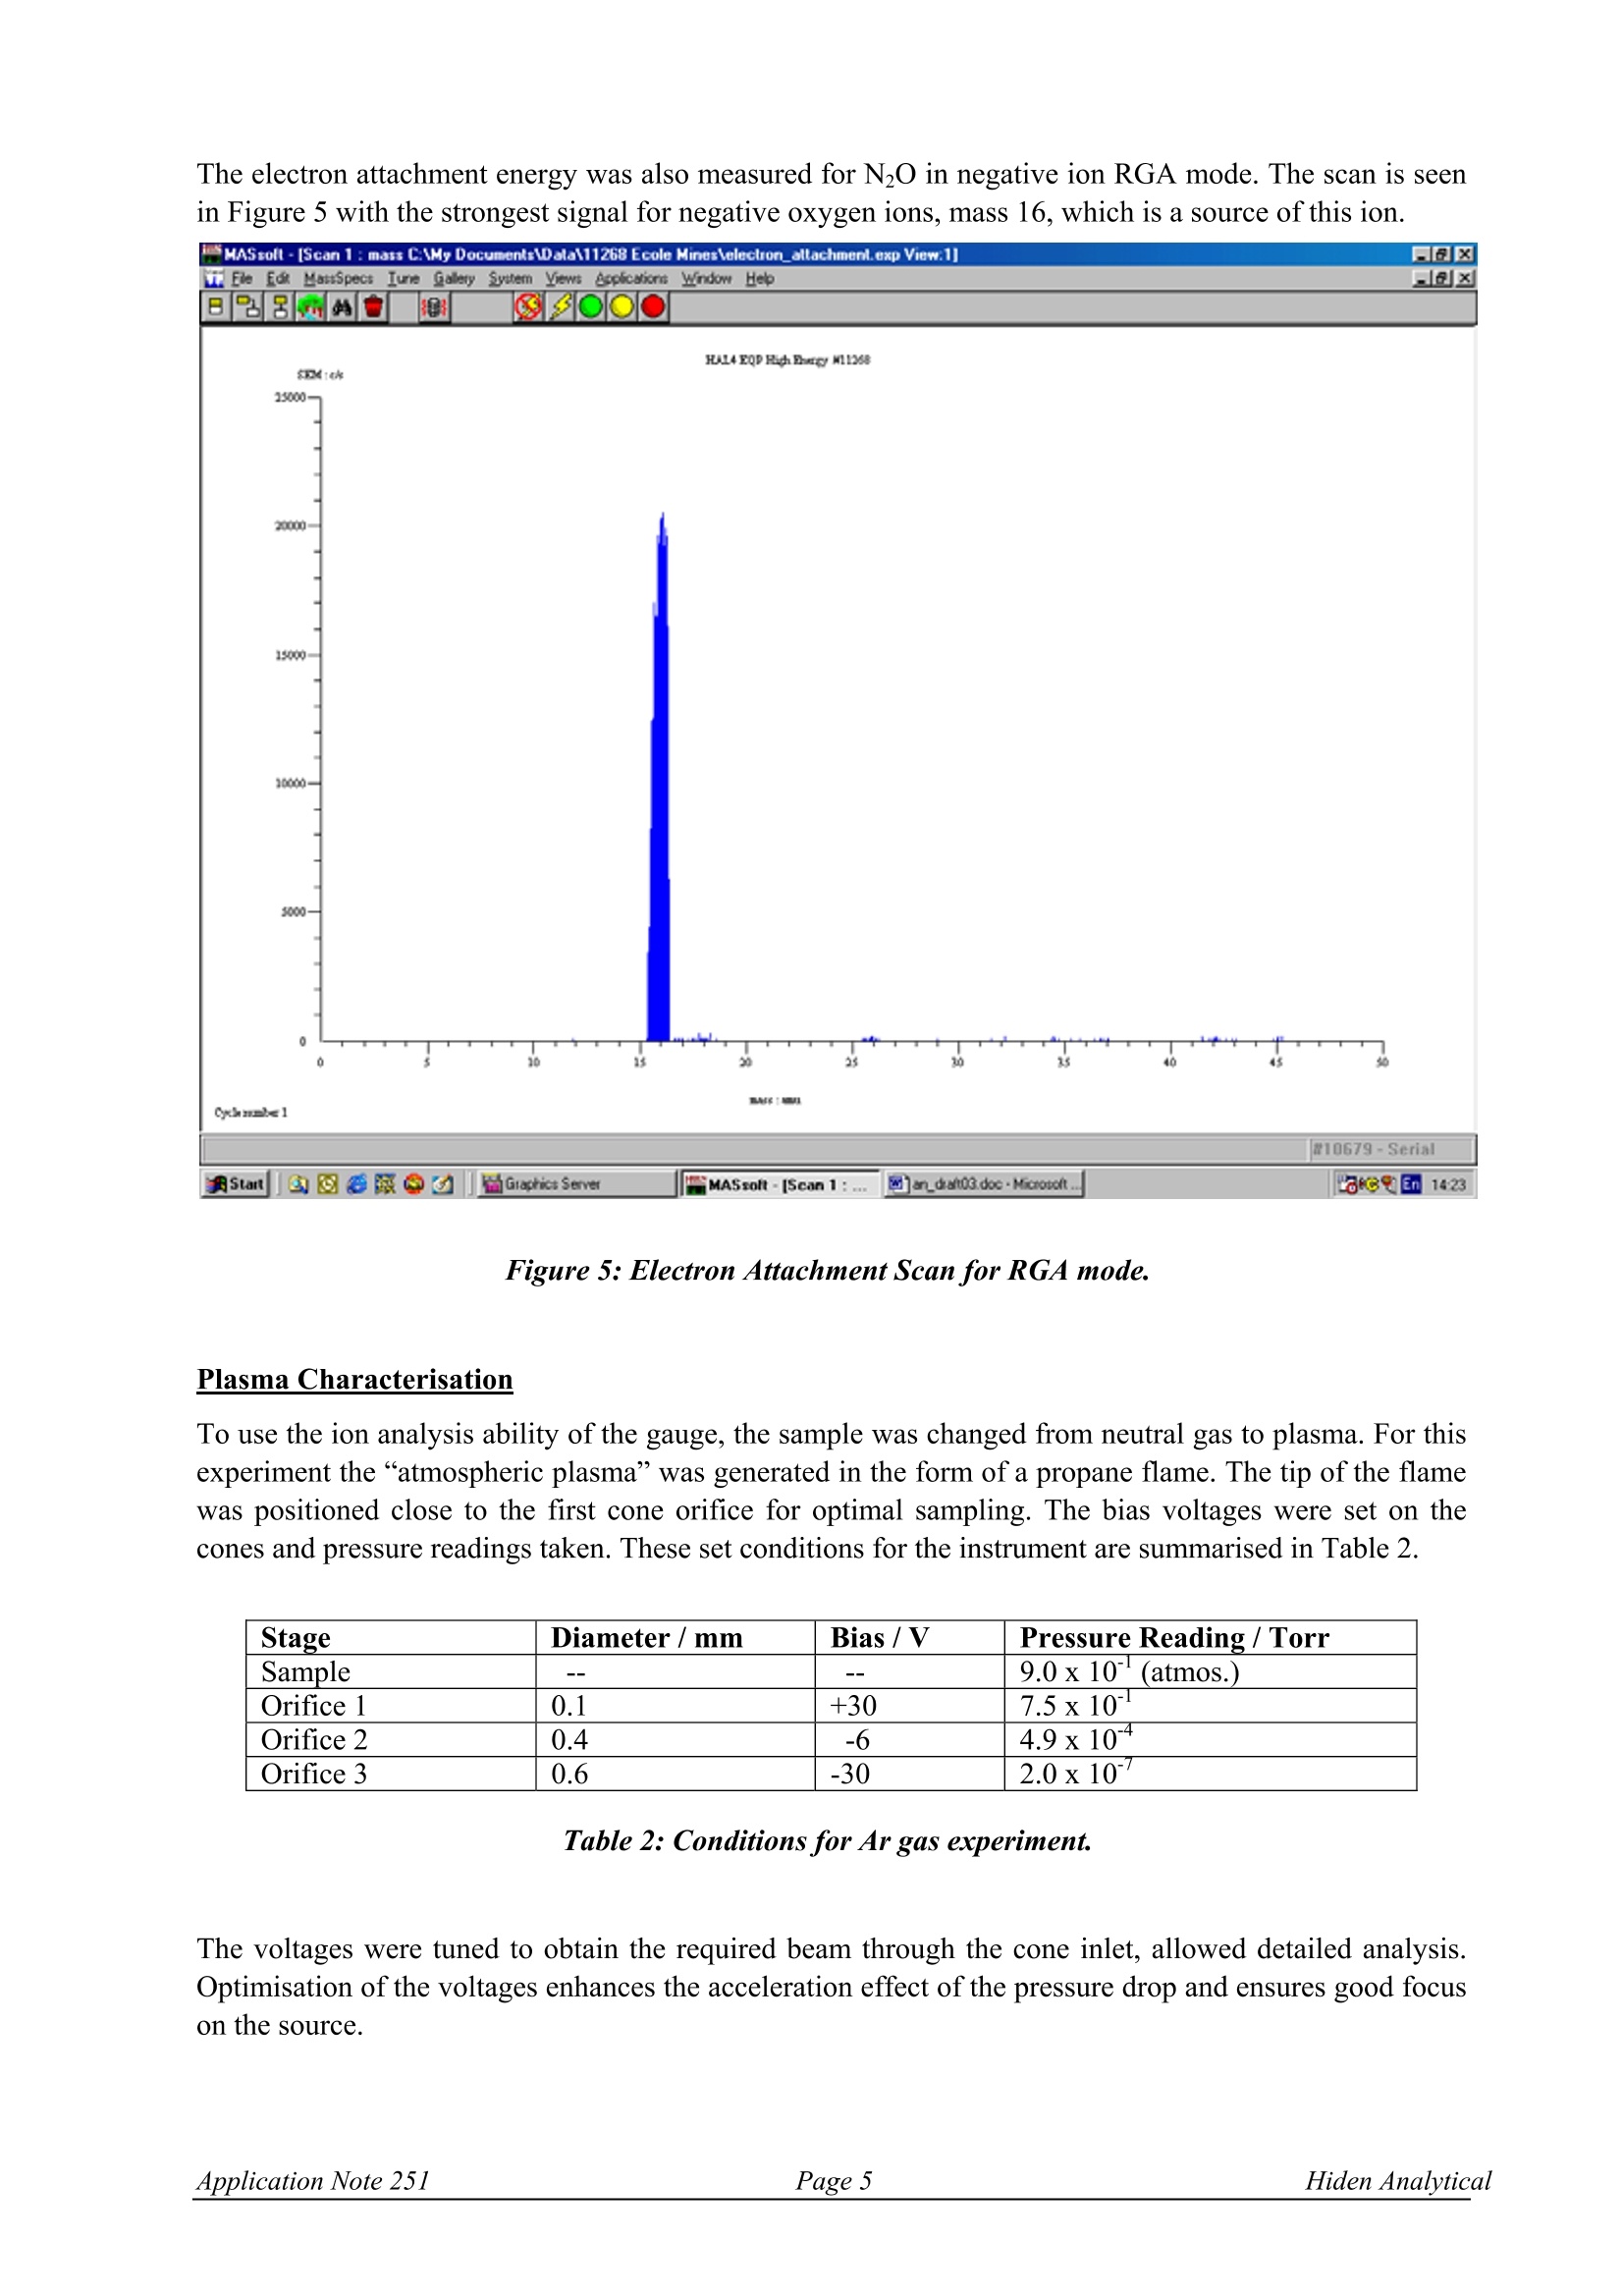
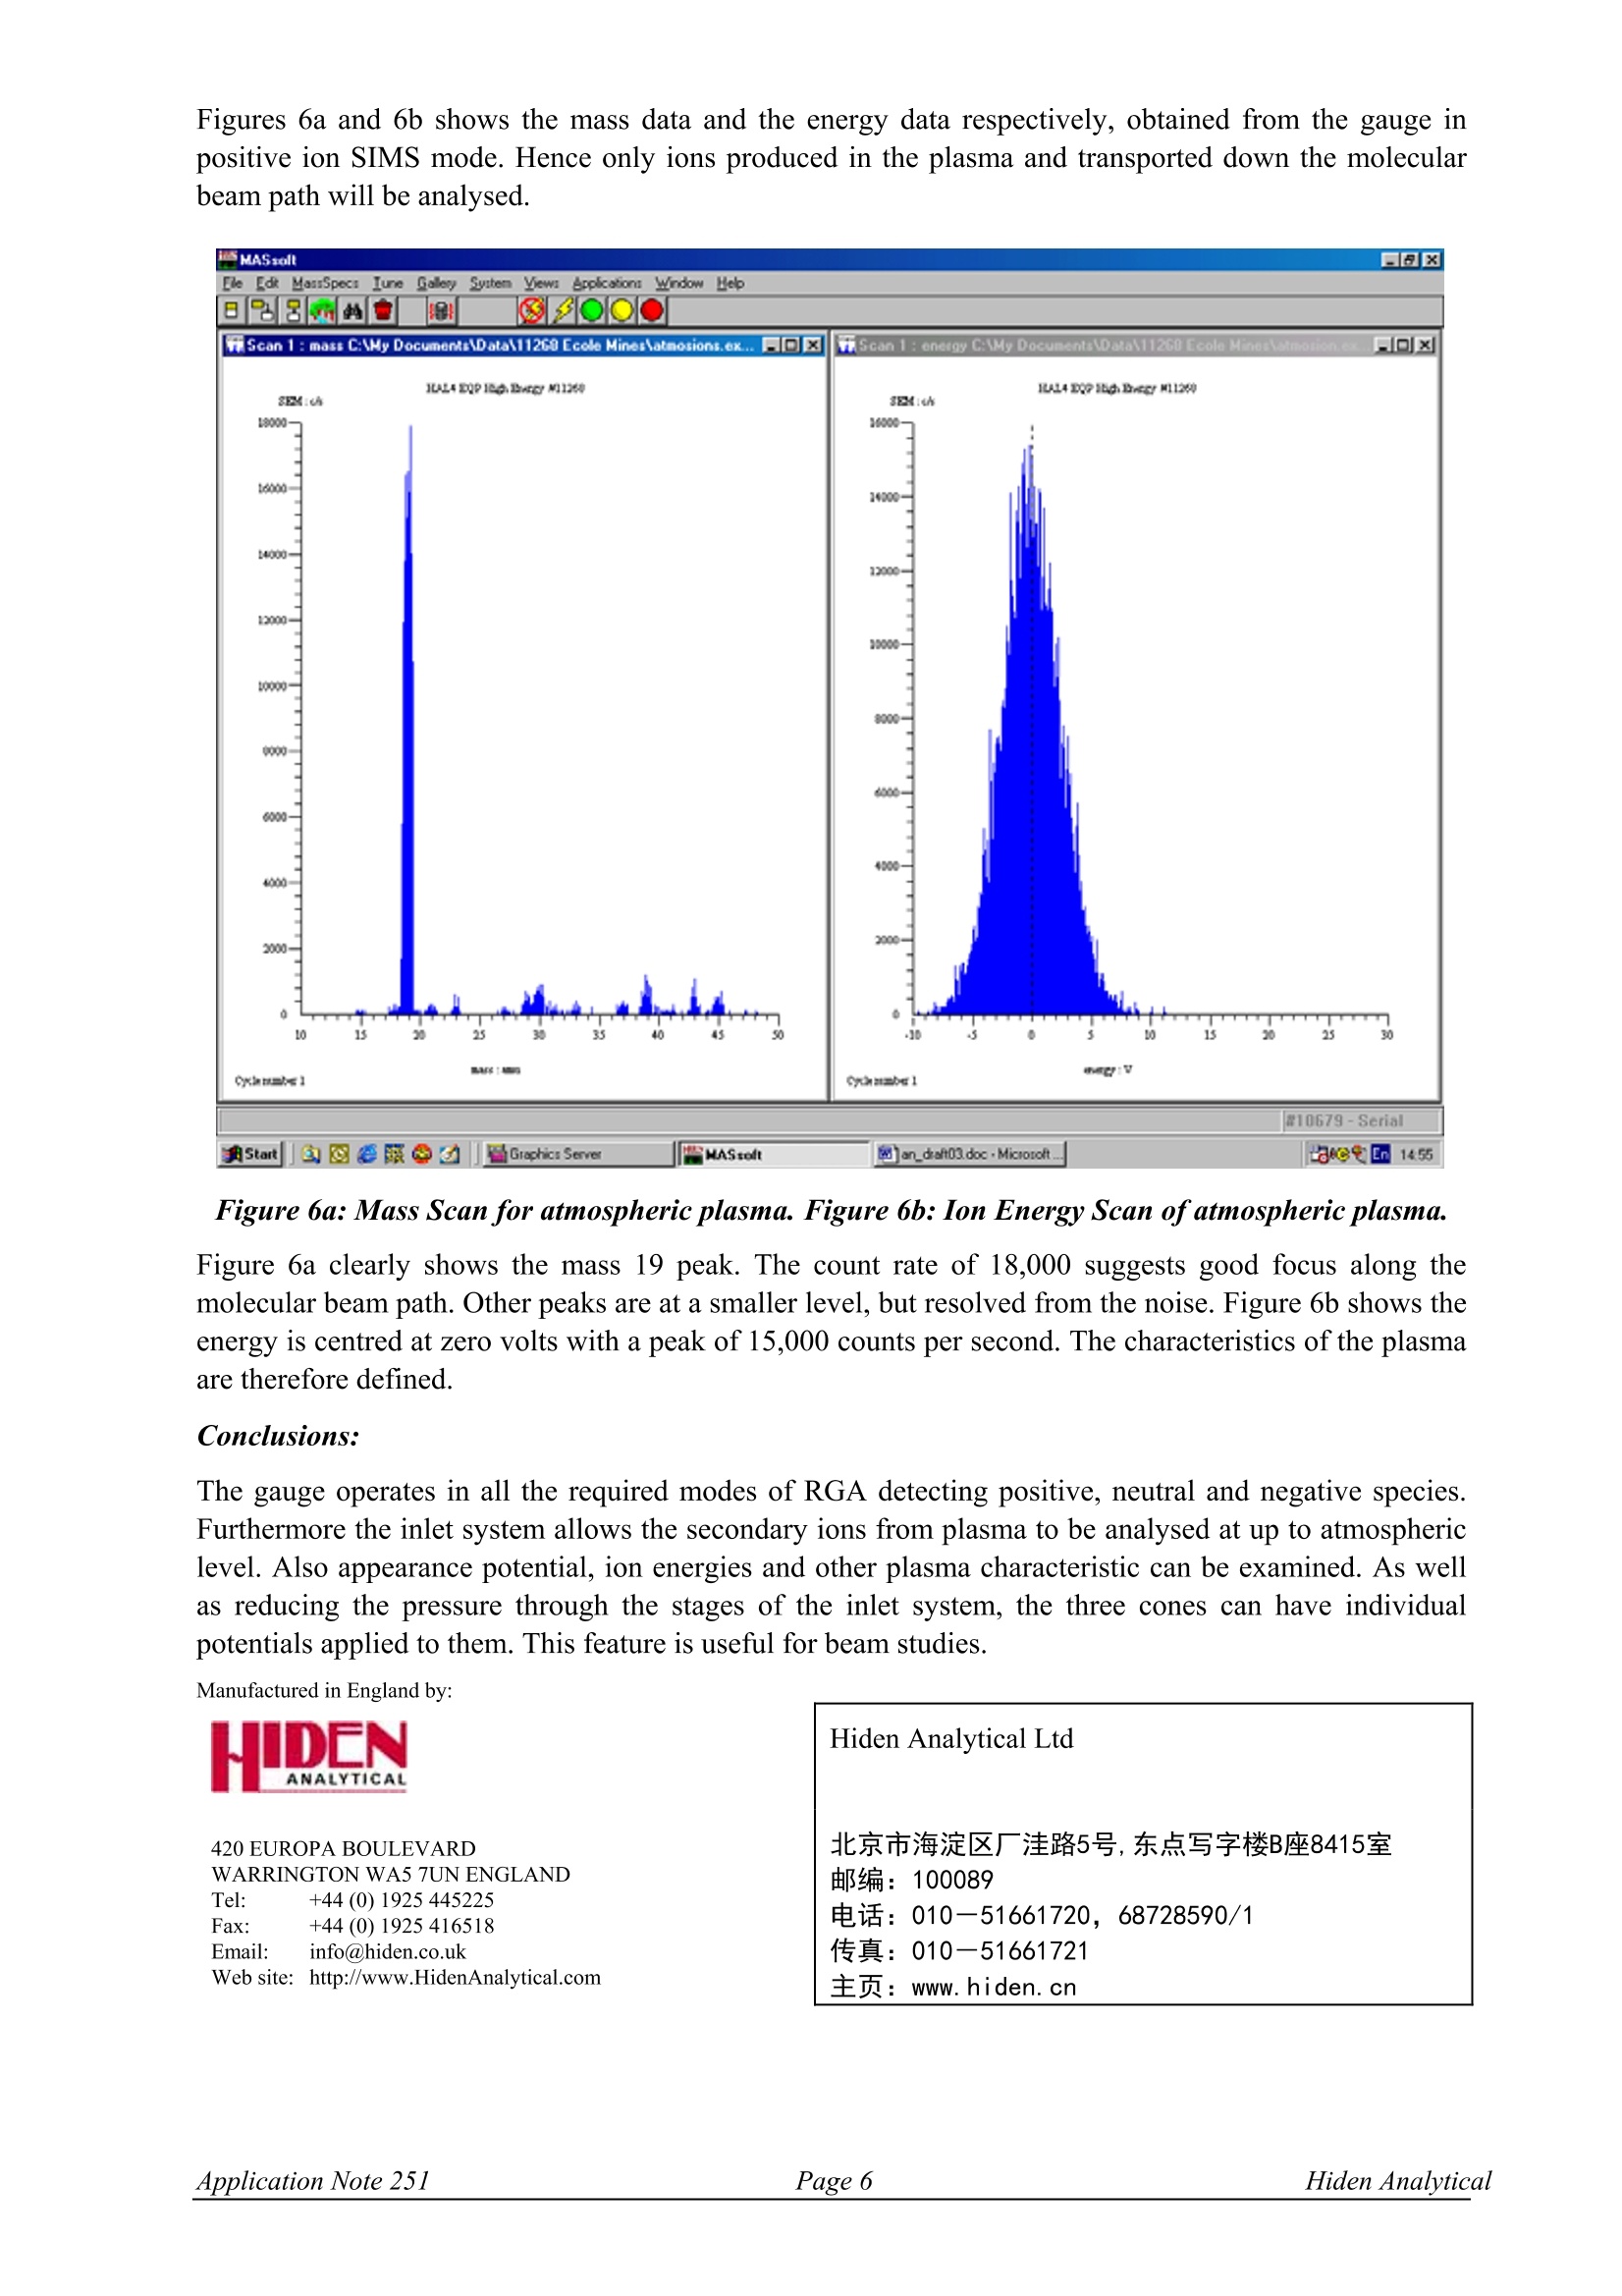
Investigation of Plasmas atAtmospheric PressuresHPR-60 APPLICATION NOTE A Hiden HPR-60 inlet system with an EQP 1000 series mass analyser gauge was used for the analysis ofatmospheric plasmas. This particular sampling inlet was specifically designed to penetrate into theplasma chamber and allow sensitive measurement of the plasma at up to atmospheric pressure. To lowerthe pressure from atmospheric to gauge compatible pressures, a system ofthree cones with small orificeswas used to divide t2117he inlet into three stages. Each stage was separately pumped. MASsoft was used togather data about neutral, positive and negative species through the modes available through theMASsoft controlling software. Introduction The Hiden HPR-60 inlet system is a molecular beam sampling mass spectrometer. This is designed foraccurate process sampling for applications such as plasma etch and deposition, chemical vapourdeposition, atmospheric or cluster research, combustion and nanoparticle studies and flow reactors. Inmany applications the process pressure must be reduced to be compatible to the operating pressure of thequadrupole mass spectrometer. This can be achieved by a design, such as in Figure 1. Figure 1: Schematic ofinlet sampling system with orifice sizes and pumping locations. The sampling part consists of several chambers separated by orifices. Each chamber is pumped separatelyto obtain a sequential pressure drop from the sampling area through the chambers to the gauge. If asuitable combination of orifice sizes and pumping rates are used, sampling can be performed atatmospheric pressures without exposing the gauge to overpressure. The pressure drop helps the sampleremain as a coherent beam, reducing collisions between sample and background gases and eliminatinginteractions with surfaces, increasing accuracy significantly. The orifices are interchangeable and willaffect the beam focus and modulation. The design will maximise the pumping efficiency to obtain theoptimum beam into the mass spectrometer gauge. In this particular application the mass spectrometer selected for this inlet system was the Hiden EQP-1000. This is a combined 45° sector field energy analyser and mass spectrometer with 9mm quadrupolerods. The mass range options can be selected from 300, 510,1000,2500 amu, providing the bestperformance to the relevant research application. The triple filter is fitted as standard, increasingaccuracy, sensitivity and mass discrimination. Gas Analysis Argon gas was used to test the residual gas analysis (RGA) mode of the software. As the gas passesthrough the three stages, it cools down rapidly and dimerises. Therefore the signal analysed is the Ar 80amu peak, which can be seen in Figure 2. Even for this low concentration species, it can be clearly seenthat the count rate was consistently over 50,000 counts per second. Figure 2: SEM Scan for Ar gas, RGA mode. The alignment of the molecular beam was deemed to be good as the background level, equivalent to thebeam being“off’was at a level of counts per second. Usually this would be compared with the strongest Ar 40 peak to examine the amount of dimerisation.However, this peak was too intense for measurement. Hence the secondary Ar 36 peak was measured at alevel of approx. 0.3% of that of the Ar 40 peak. The calculated ratios are summarised in Table 2. Thescans are seen in Figures 3a and 3b. Pump Location SEM/ Counts s-1 Ratio to Ar 80 Ar 80 53.000 1:1 Ar 36 (0.3%) 2.1x 10° 40:1 Ar 40 (100%) 7.0x 10% (extrapolated) 13.207:1 Table 2: Calculated ratios for Ar species. Figure 4a:Mass Scan for Ar36, RGA mode. Figure 4b:Mass Scan for Ar80, RGA mode. Hence the amount of dimerisation and the beam sensitivity to these small levels of species wasdetermined. Often smaller species only are measured using the gauge. However, higher mass species are alsoinvestigated. To test the high mass sensitivity of the gauge, the signal from a sample ofheptacosafluorotributylamine, PFBTA (C12F27N), was measured. This is a large compound with the anintense peak of mass 219, which can be seen in the mass scan in RGA mode seen in Figure 3. The peak isclearly seen, demonstrating that the mass calibration of the gauge extends up to the higher masses. Figure 3: Mass Scan for PFBTA, RGA mode. To test the detection limits of the gauge, air was sampled. The levels of krypton, Kr, and Xenon, Xe,were extracted by looking for their main peaks, at mass 84 and 132 respectively. The two scan results canbe seen in Figures 4a and 4b. Figure 4a: Mass Scan for Kr, RGA mode. Figure 4b: Mass Scan for Xe, RGA mode. Again the counts rates give an indication of the concentration in air. These are 700 and 2300, correlatingapproximately with the rarities in normal atmospheric air of 1ppm and 87ppm respectively, after therelative sensitivity of the mass gauge has been taken into account. The electron attachment energy was also measured for N2O in negative ion RGA mode. The scan is seenin Figure 5 with the strongest signal for negative oxygen ions, mass 16, which is a source of this ion. Figure 5: Electron Attachment Scan for RGA mode. Plasma Characterisation To use the ion analysis ability of the gauge, the sample was changed from neutral gas to plasma. For thisexperiment the“atmospheric plasma”was generated in the form of a propane flame. The tip of the flamewas positioned close to the first cone orifice for optimal sampling. The bias voltages were set on thecones and pressure readings taken. These set conditions for the instrument are summarised in Table 2. Stage Diameter/mm Bias / V Pressure Reading/Torr Sample -- -- 9.0x10° (atmos.) Orifice 1 0.1 +30 7.5 x 10 Orifice 2 0.4 -6 4.9x10** Orifice3 0.6 -30 2.0x10' Table 2: Conditions for Ar gas experiment. The voltages were tuned to obtain the required beam through the cone inlet, allowed detailed analysis.Optimisation of the voltages enhances the acceleration effect of the pressure drop and ensures good focuson the source. Figures 6a and 6b shows the mass data and the energy data respectively, obtained from the gauge inpositive ion SIMS mode. Hence only ions produced in the plasma and transported down the molecularbeam path will be analysed. Figure 6a: Mass Scan for atmospheric plasma. Figure 6b: Ion Energy Scan ofatmospheric plasma. Figure 6a clearly shows the mass 19 peak. The count rate of 18,000 suggests good focus along themolecular beam path. Other peaks are at a smaller level, but resolved from the noise. Figure 6b shows theenergy is centred at zero volts with a peak of 15,000 counts per second. The characteristics of the plasmaare therefore defined. Conclusions: The gauge operates in all the required modes of RGA detecting positive, neutral and negative species.Furthermore the inlet system allows the secondary ions from plasma to be analysed at up to atmosphericlevel. Also appearance potential, ion energies and other plasma characteristic can be examined. As wellas reducing the pressure through the stages of the inlet system, the three cones can have individualpotentials applied to them. This feature is useful for beam studies. Manufactured in England by: 420 EUROPA BOULEVARDWARRINGTON WA5 7UN ENGLANDTel: +44 (0)1925 445225Fax: +44(0)1925416518Email: info@hiden.co.ukWeb site: http://www.HidenAnalytical.com Hiden Analytical Ltd 北京市海淀区厂洼路5号,东点写字楼B座8415室邮编:100089 电话:010-51661720,68728590/1 传真:010-51661721 主页: www. hiden. cn PagelApplication Note iden Analvtical
确定
还剩4页未读,是否继续阅读?

产品配置单
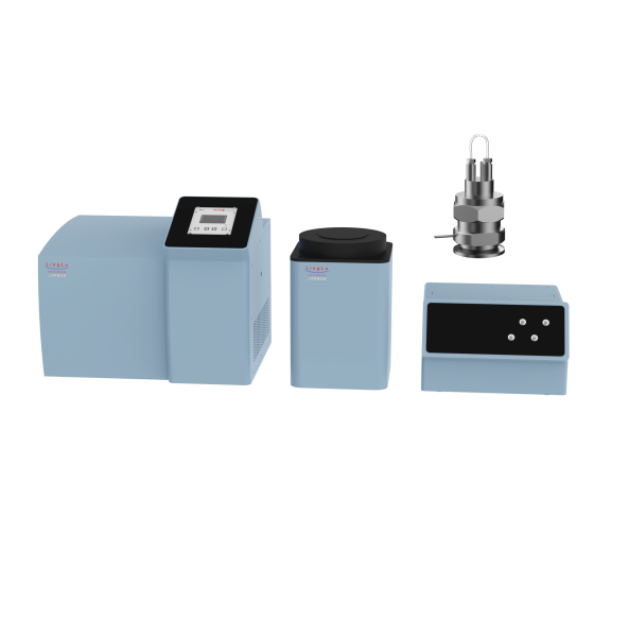
北京英格海德分析技术有限公司为您提供《多种样品中常压等离子体研究检测方案(在线质谱)》,该方案主要用于其他中常压等离子体研究检测,参考标准--,《多种样品中常压等离子体研究检测方案(在线质谱)》用到的仪器有EQP等离子体质量和能量分析质谱仪
推荐专场
相关方案
更多