


方案详情
文
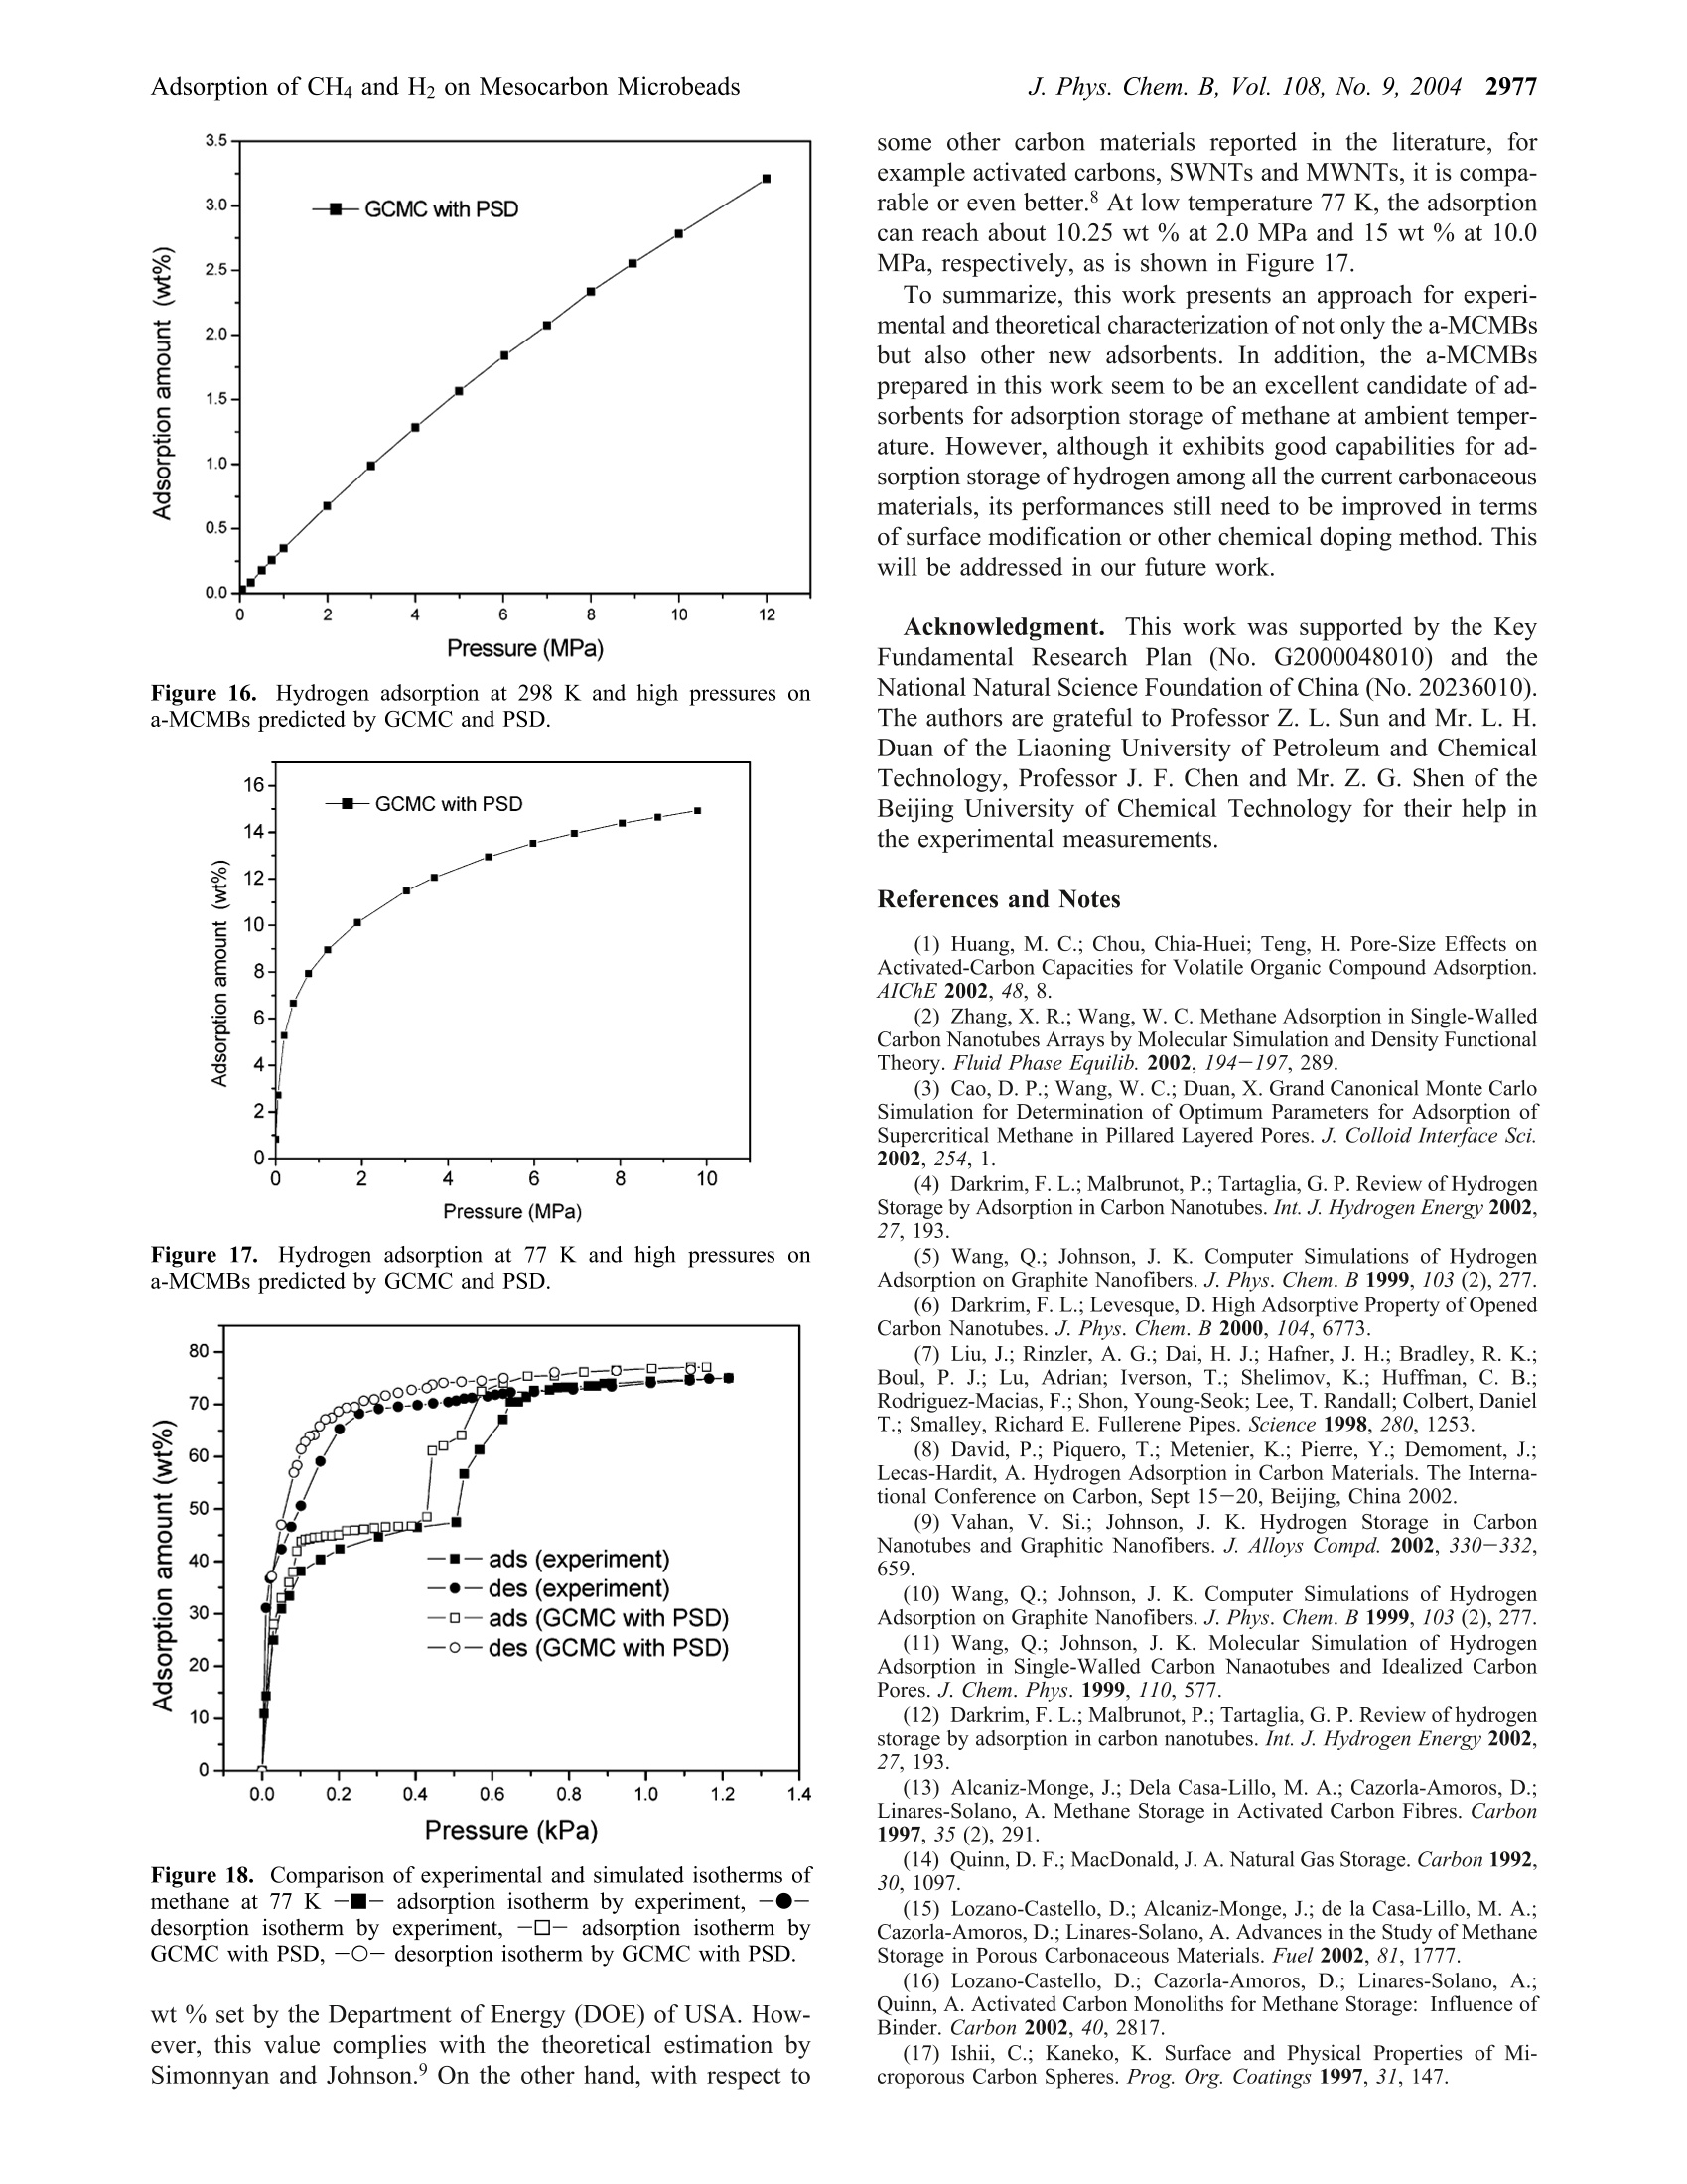
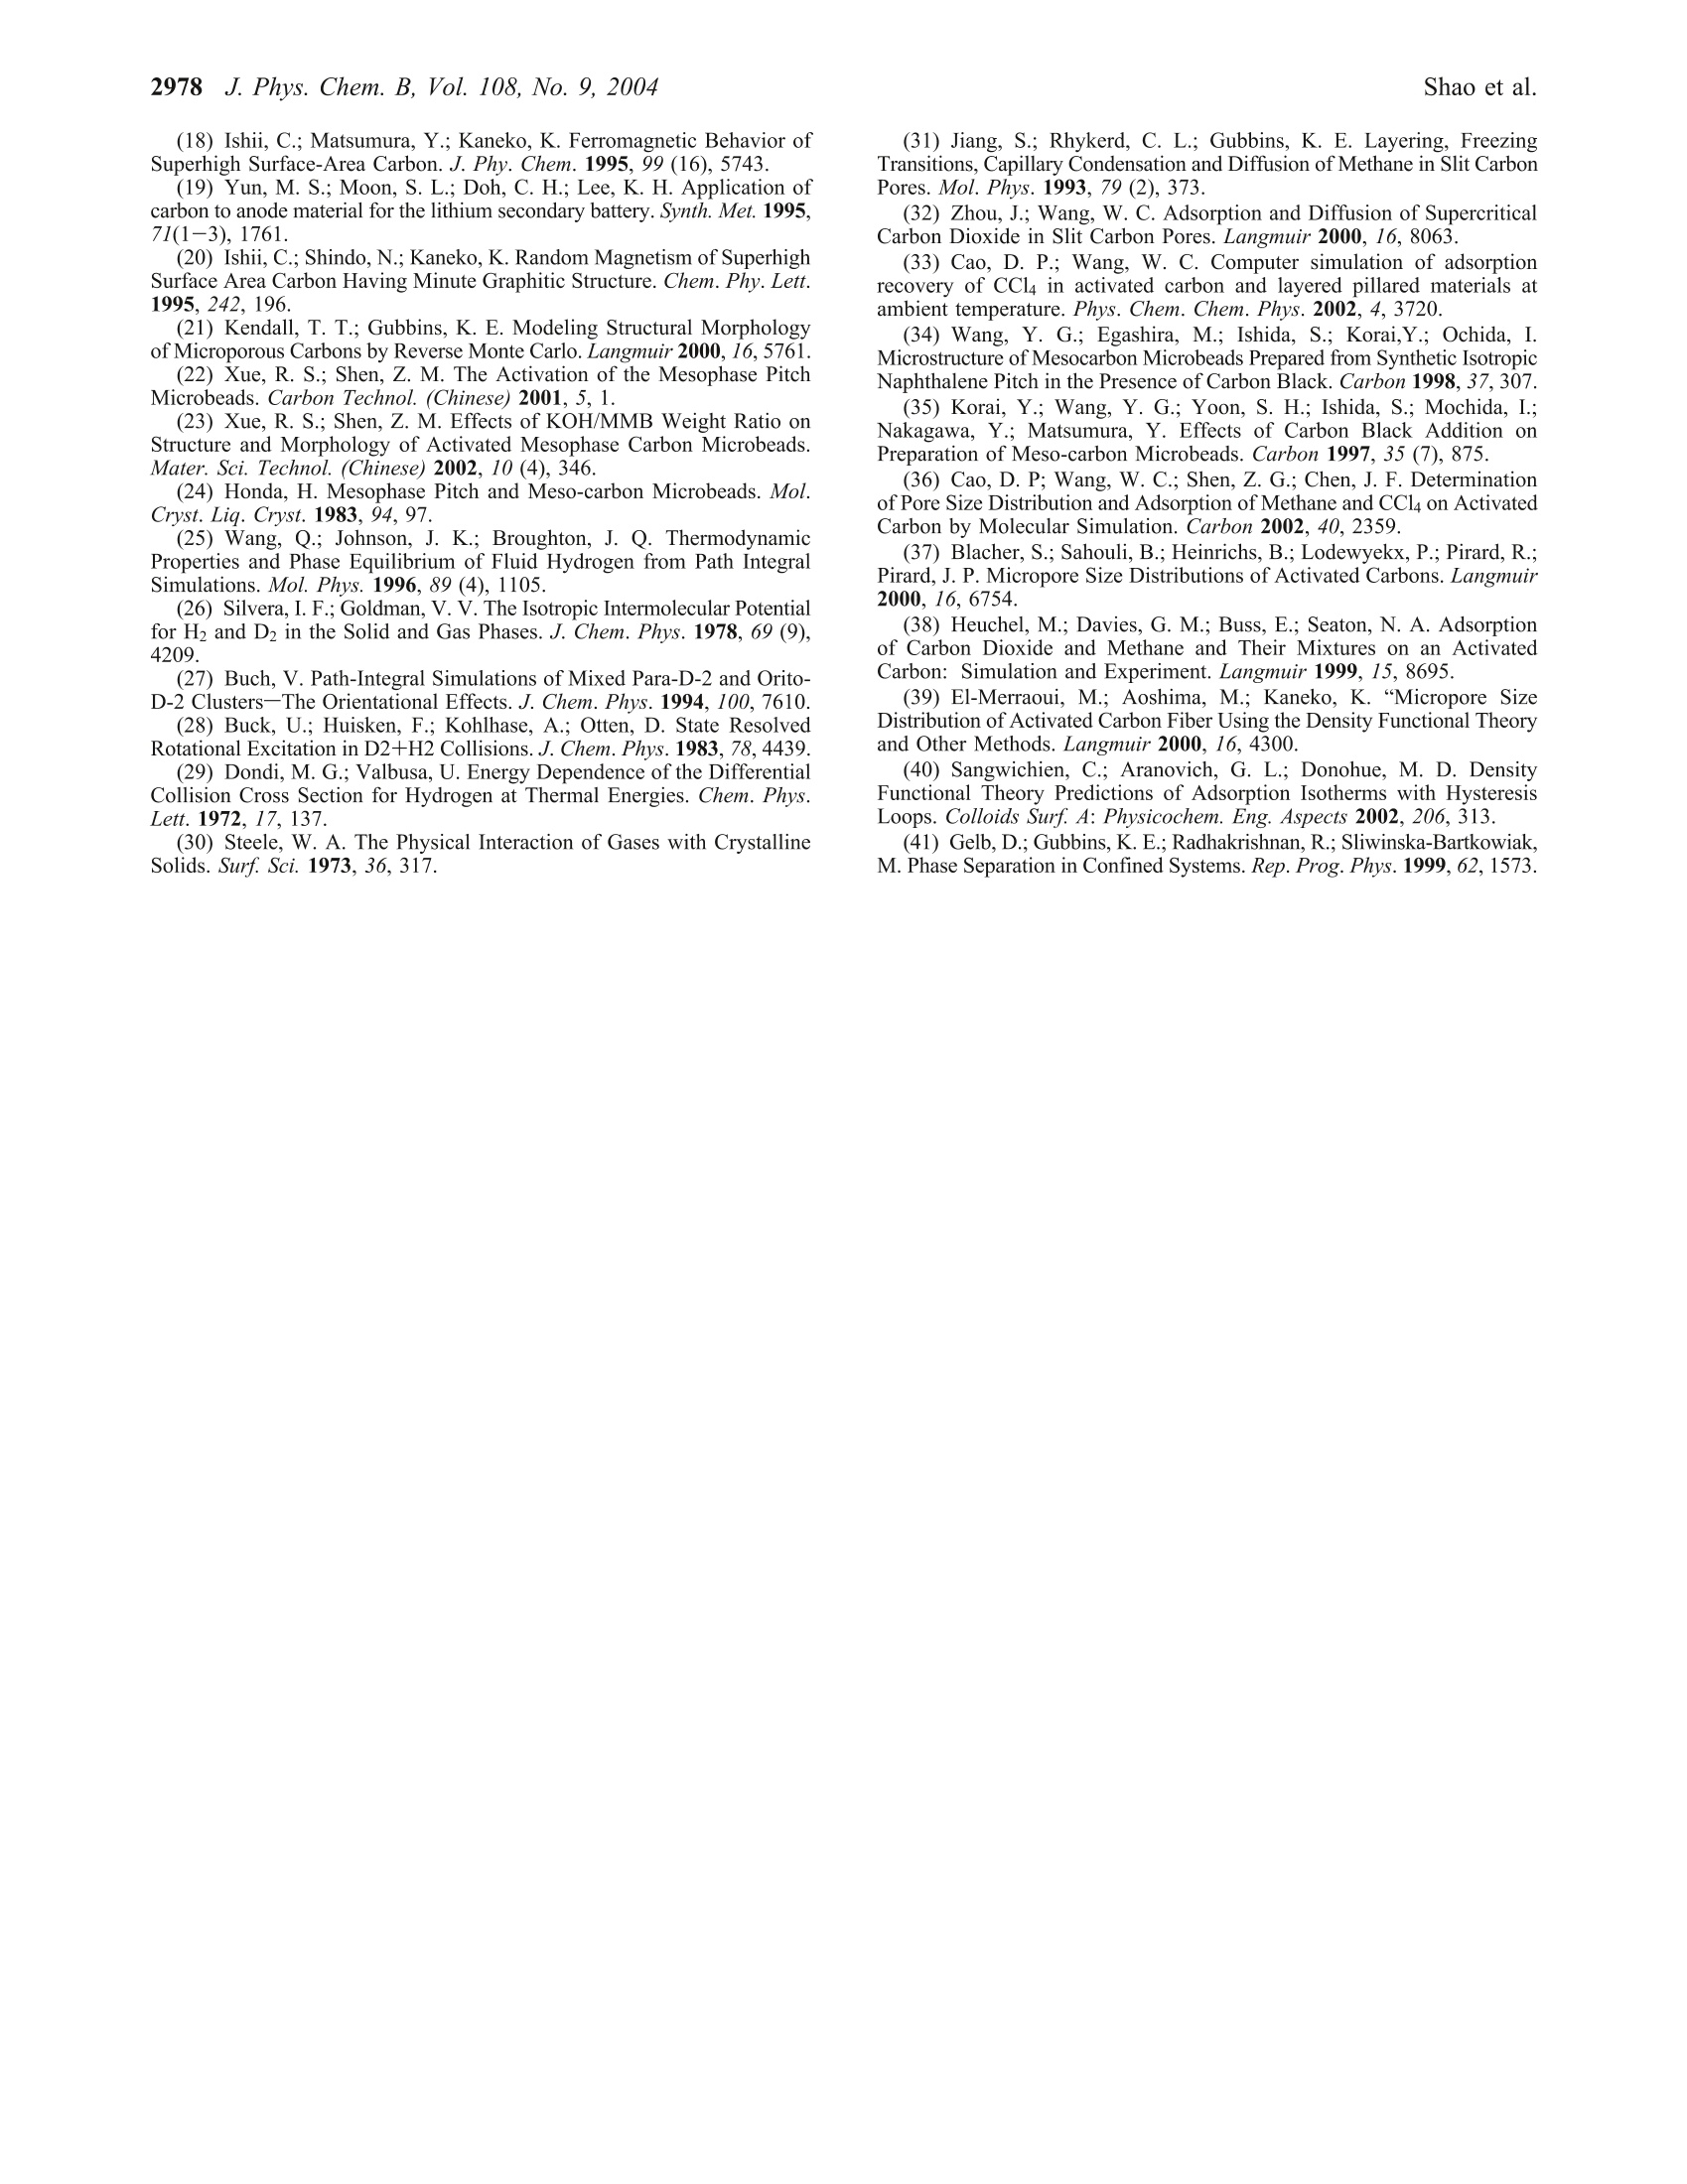
The activated mesocarbon microbeads (a-MCMBs) with high BET specific surface area of 3180m2/g are prepared. Experimental characterization of a-MCMBs is carried out in terms of the adsorption isotherm of nitrogen at 77 K by the ASAP-2010 apparatus. Then, methane and hydrogen adsorption isotherms on a-MCMBs are measured by the IGA-003 gravimetric analyzer at 298 K and 77 K. The pores of a-MCMBs are described as slit-shaped with a pore size distribution (PSD). The PSD is determined by a combined method of grand canonical Monte Carlo (GCMC) simulation and statistics integral equation (SIE) from the experimental isotherm of nitrogen on a-MCMBs. In GCMC simulation, methane and hydrogen molecules are modeled as the Lennard- Jones spherical molecules, and the well-known Steele’s 10-4-3 potential is used to represent the interaction between the fluid molecule and the solid wall. Good agreement between simulated and experimental data indicates that our model represents well the mechanism of adsorption on a-MCMBs. Then, this model is used to predict adsorption of methane and hydrogen over a wide range of pressure up to 12 MPa. The prediction shows that adsorption amount of methane reaches 36 wt % at 298 K and 4 MPa, which is superior to the results in the literature. The hydrogen adsorption amount at 10 MPa can reach 3.2 wt % and 15 wt % at 298 K and 77 K, respectively, which are also higher scores, compared with the other carbon materials.
方案详情

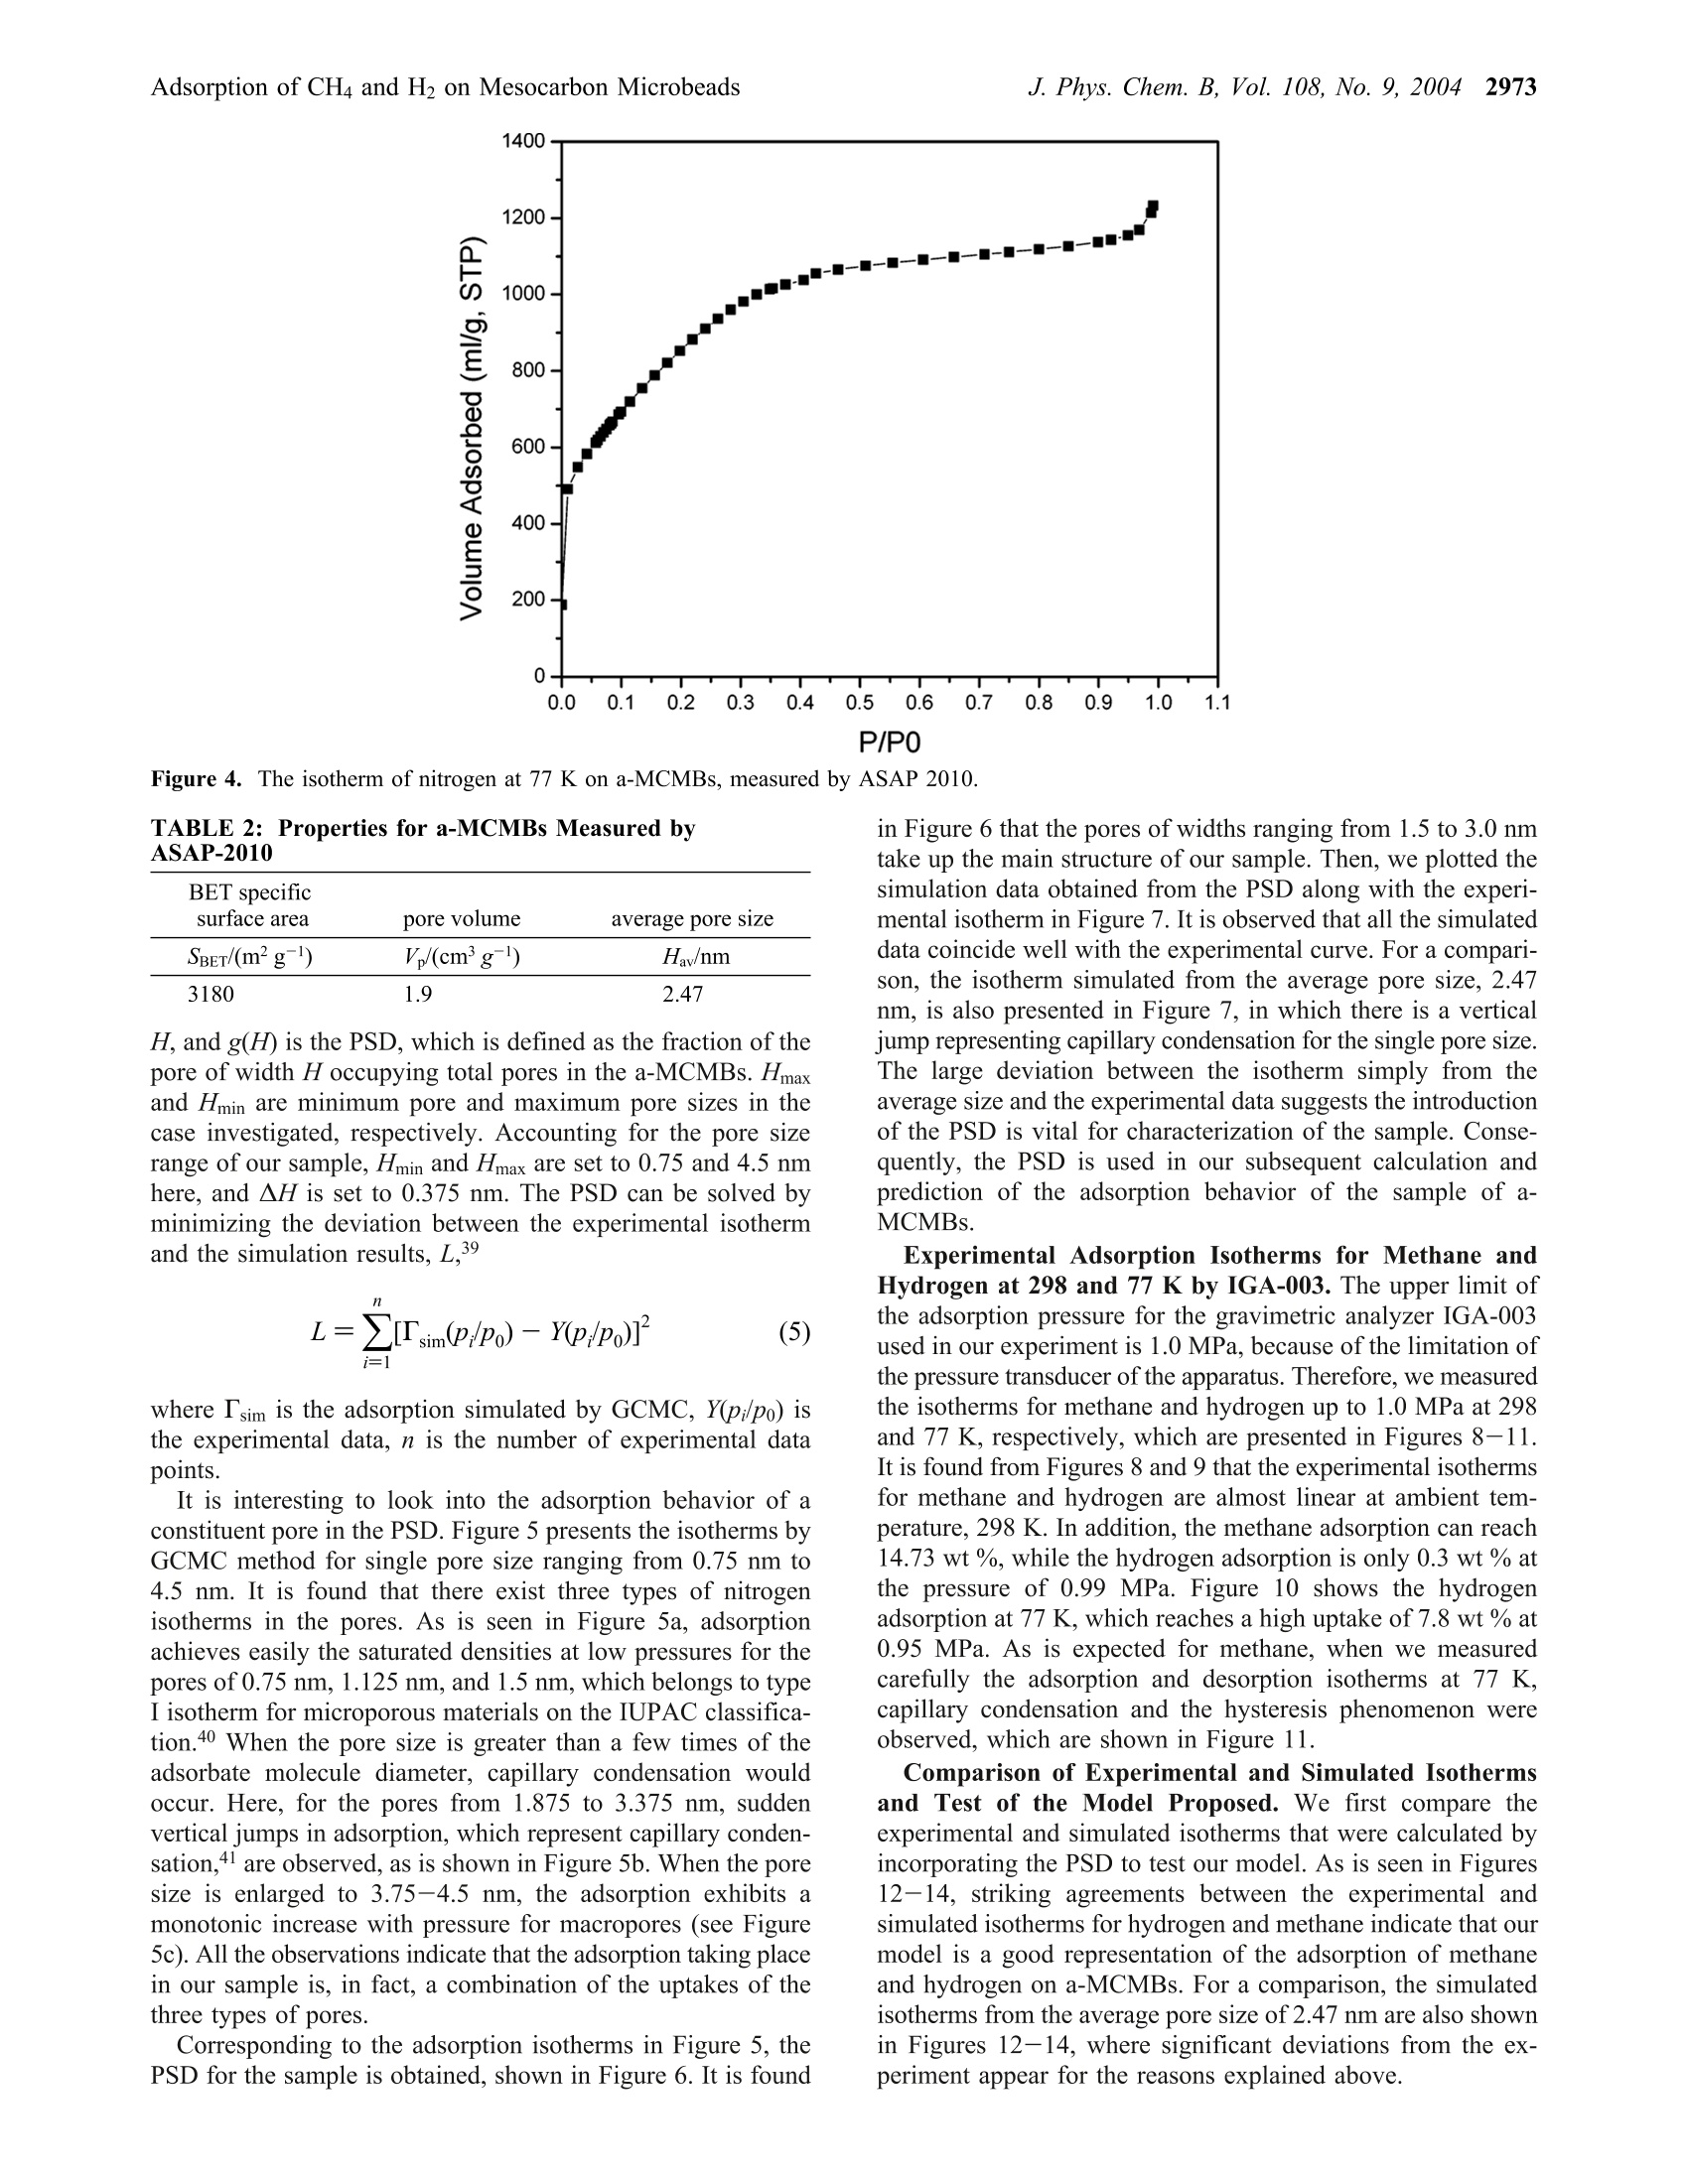
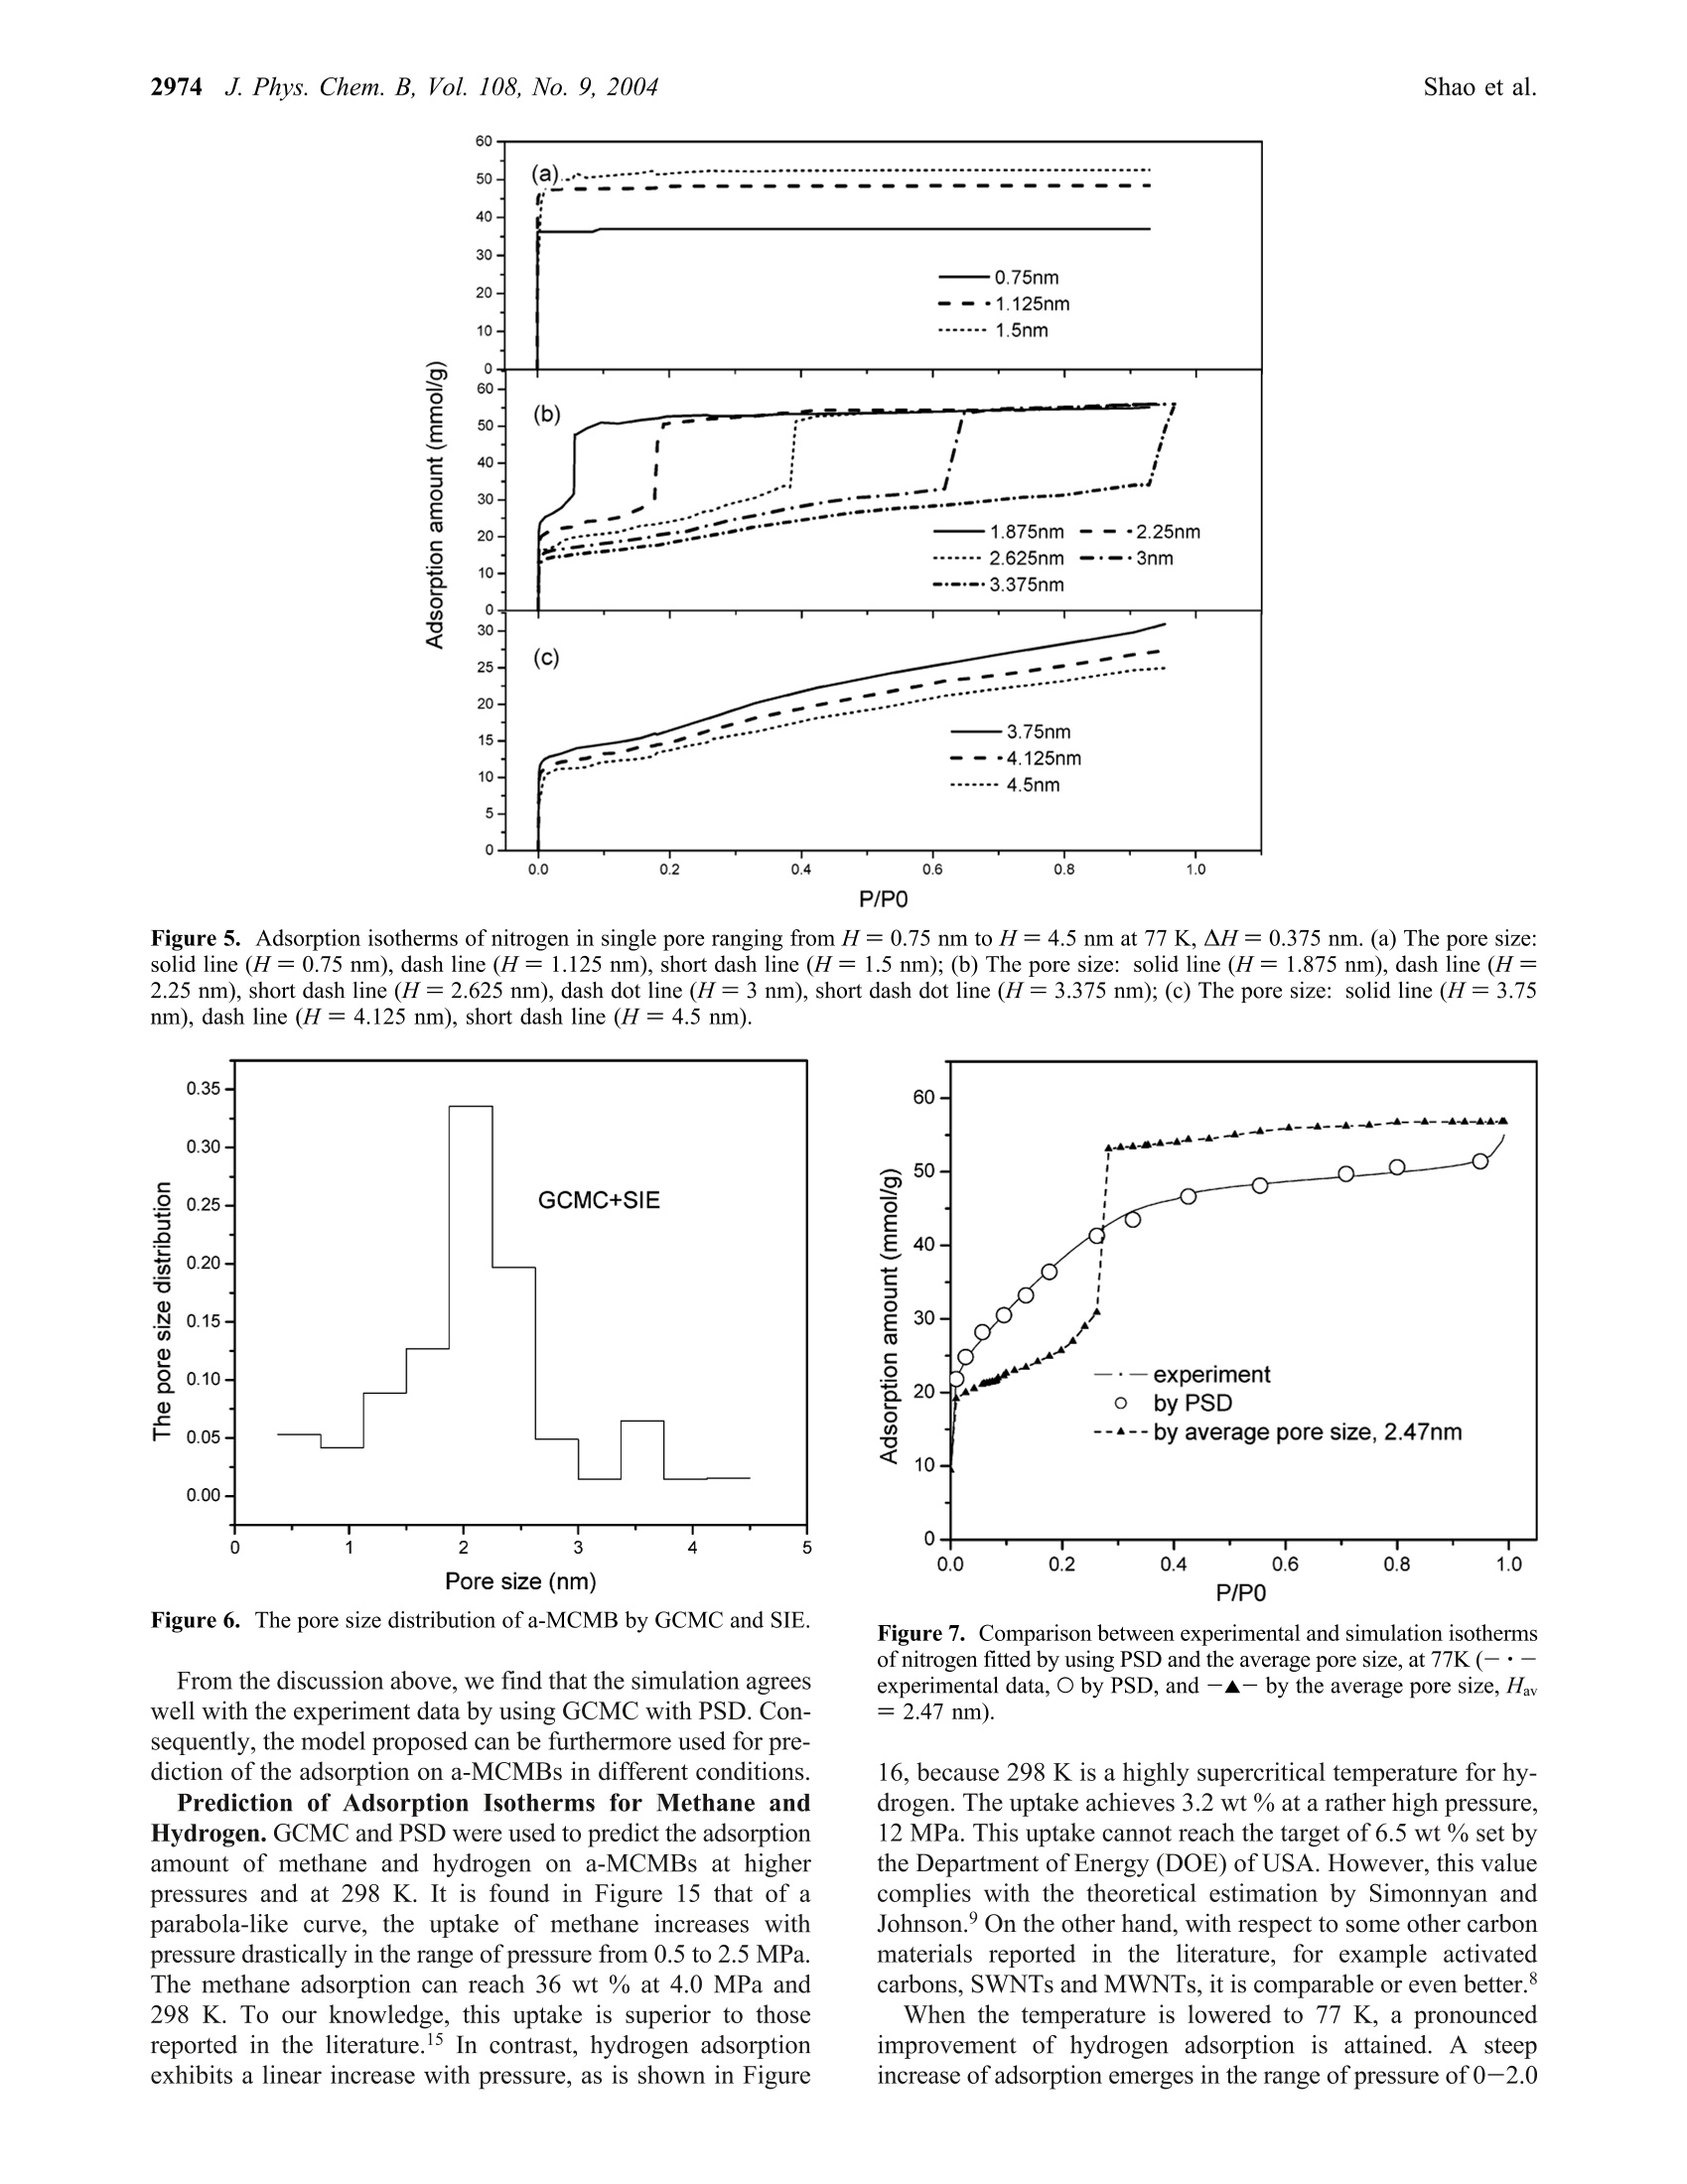
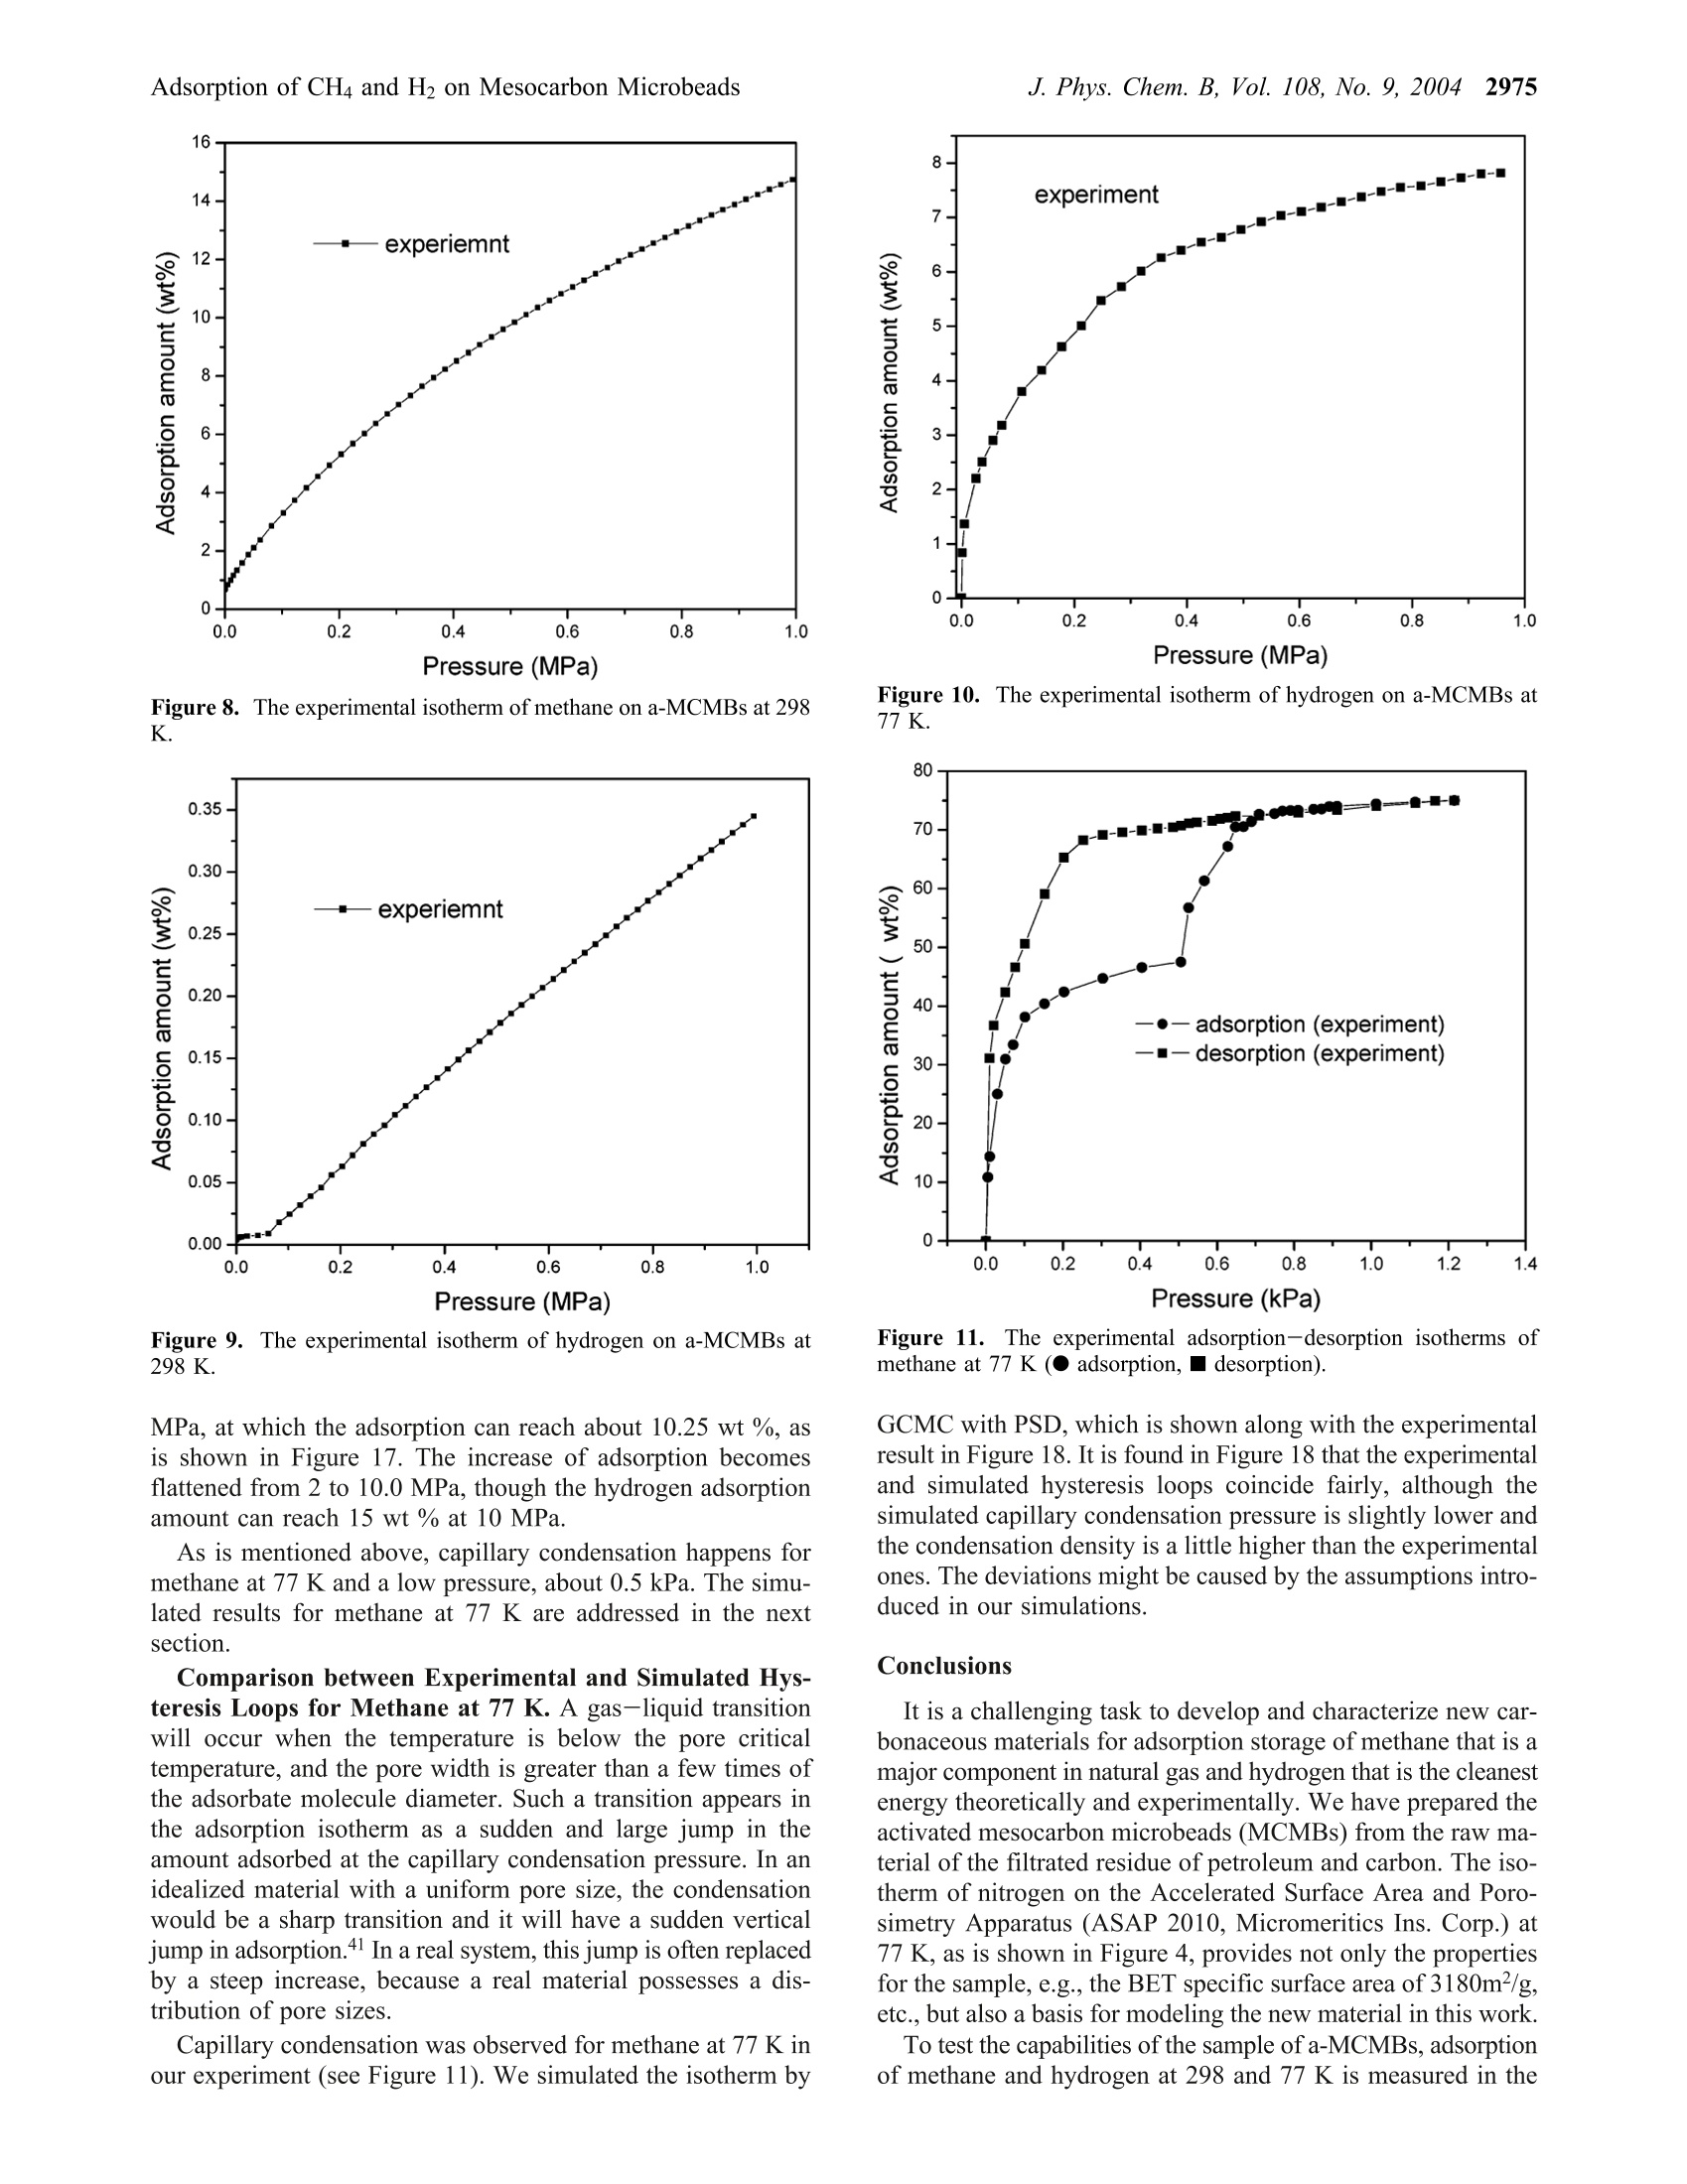
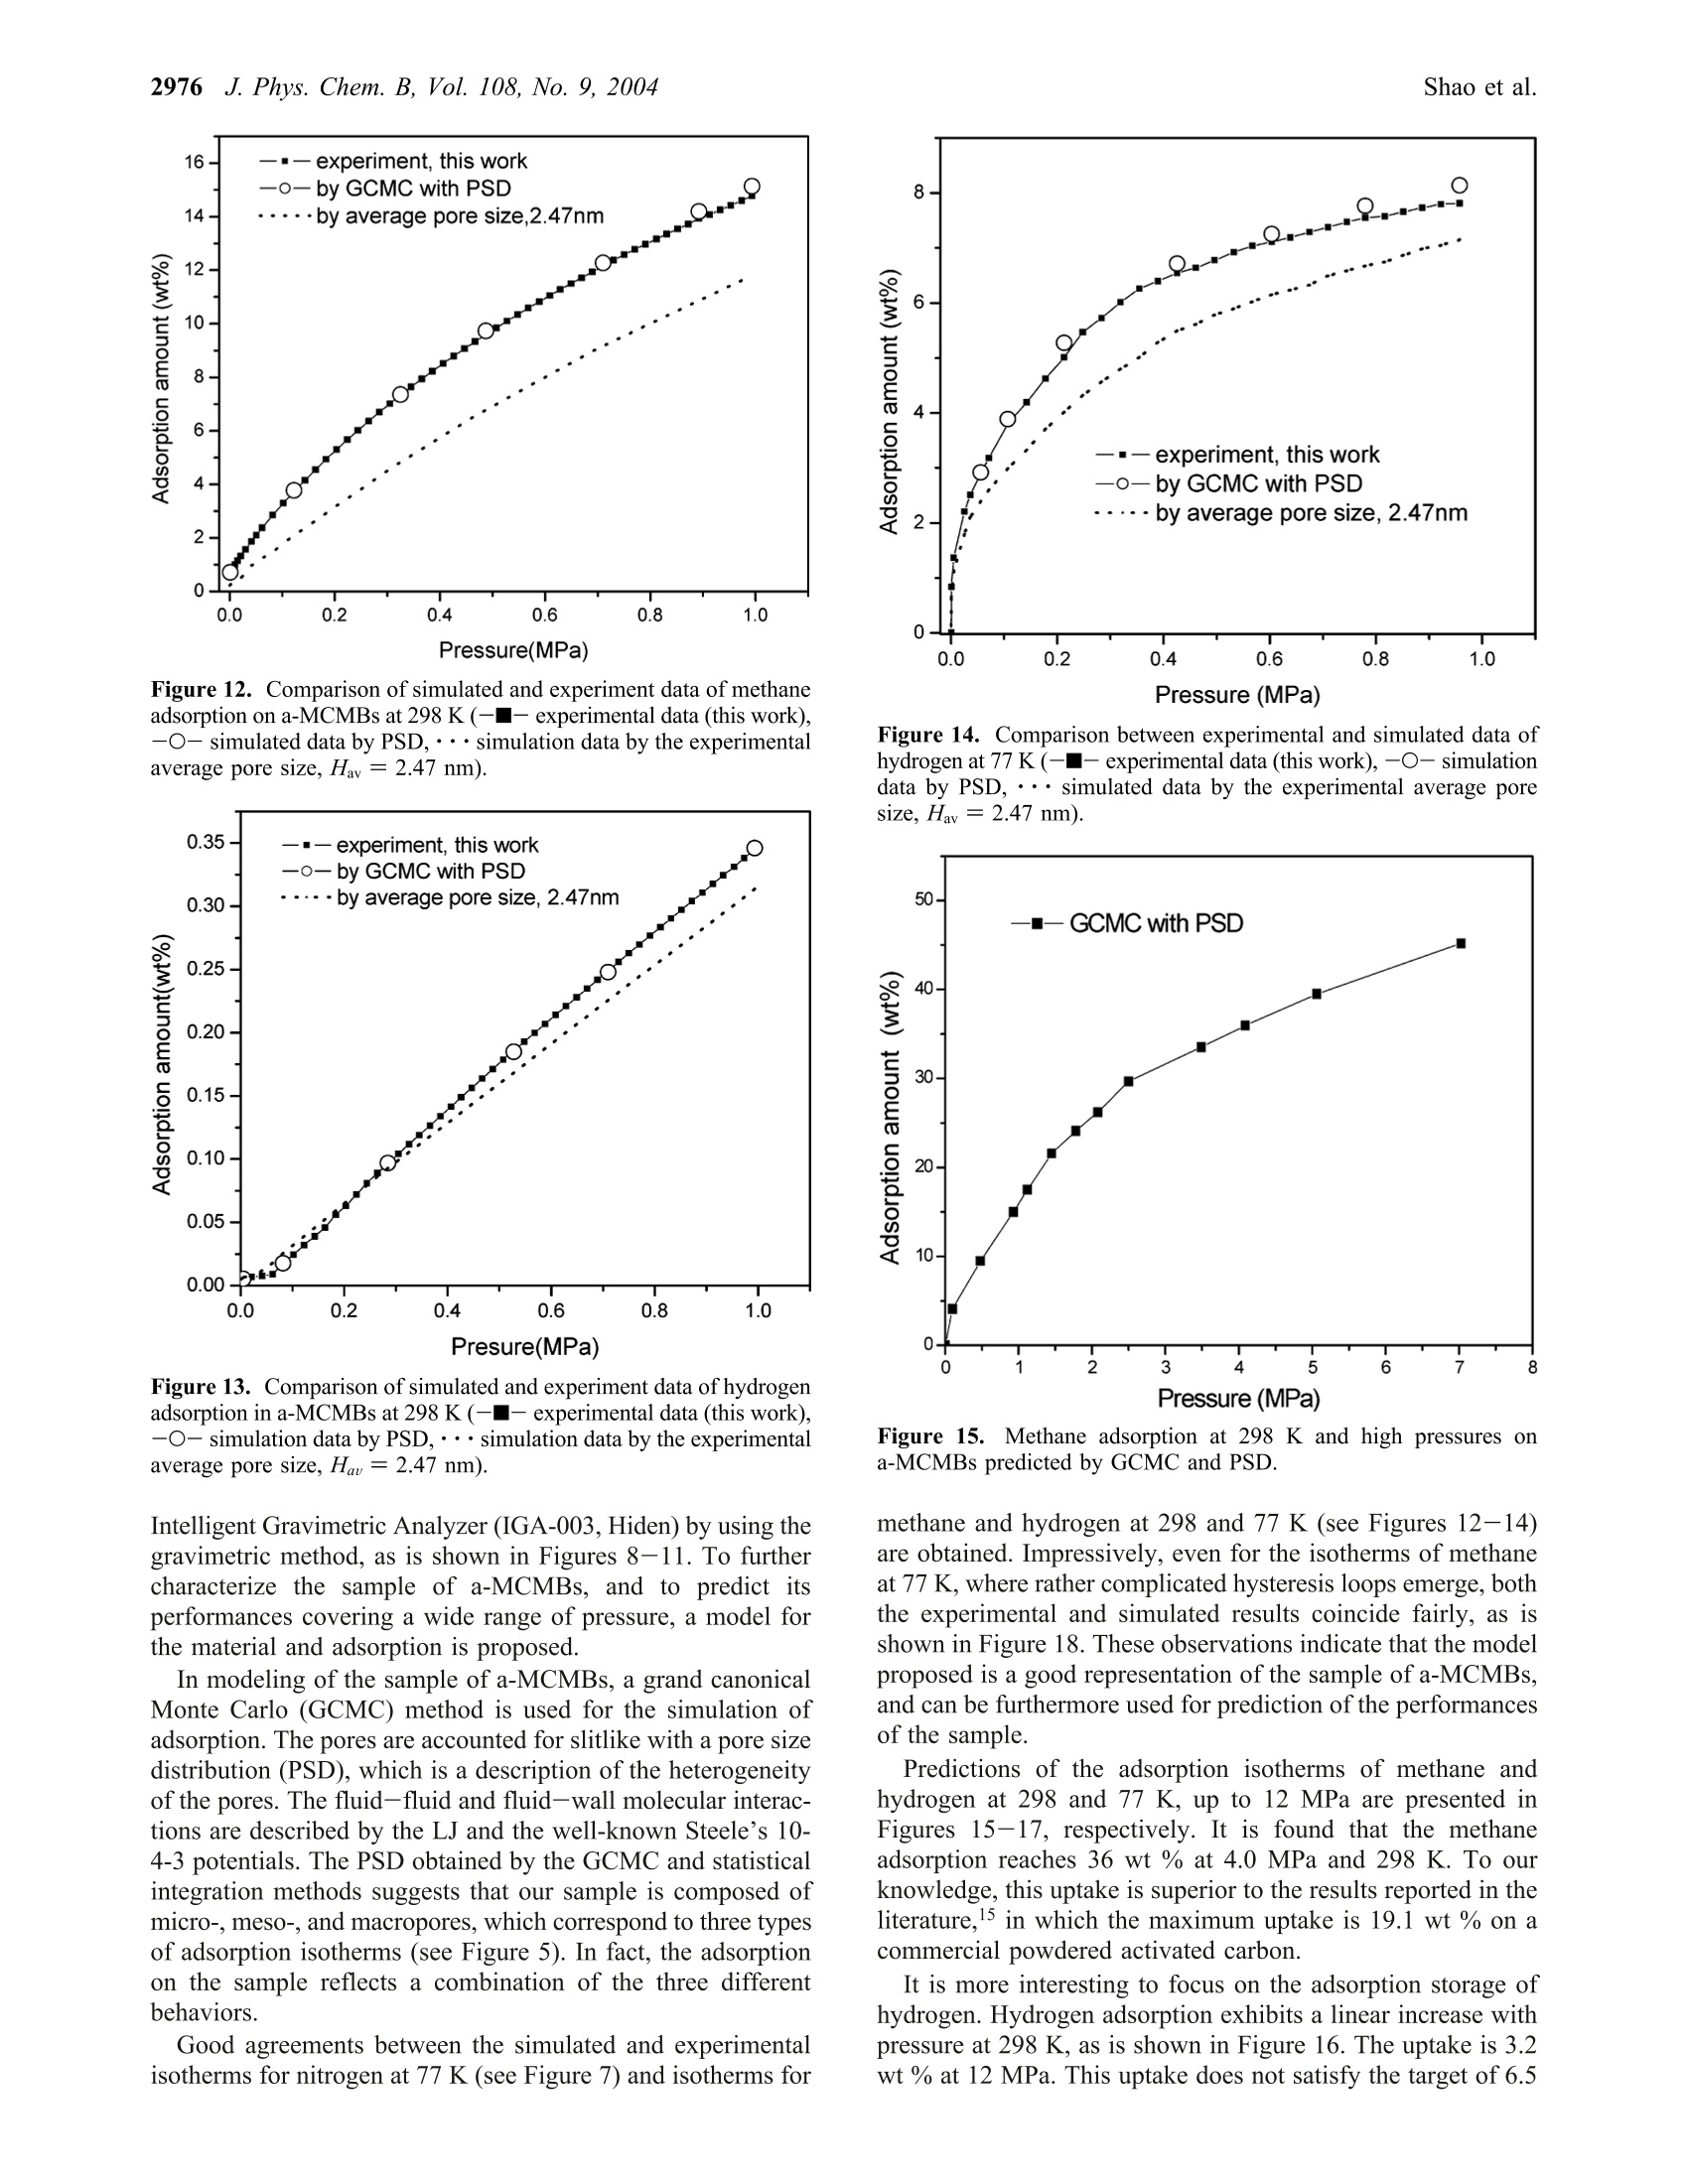
J. Phys. Chem. B 2004,108,2970-29782970 J. Phys. Chem. B, Vol. 108, No. 9, 20042971Adsorption of CH4 and H2 on Mesocarbon Microbeads 10.1021/jp035715d CCC: $27.50 ◎ 2004 American Chemical SocietyPublished on Web 02/06/2004 Adsorption of Methane and Hydrogen on Mesocarbon Microbeads by Experiment andMolecular Simulation Xiaohong Shao and Wenchuan Wang* Lab of Molecular and Materials Simulation, College of Chemical Engineering, Beijing University of ChemicalTechnology, Beijing 100029, China Ruisheng Xue and Zengmin Shen National Carbon Fiber Center, College of Materials Engineering, Beijing University of Chemical Technology,Beijing 100029, China Received: June 17, 2003; In Final Form: January 9, 2004 The activated mesocarbon microbeads (a-MCMBs) with high BET specific surface area of 3180m²/g areprepared. Experimental characterization of a-MCMBs is carried out in terms of the adsorption isotherm ofnitrogen at 77 K by the ASAP-2010 apparatus. Then, methane and hydrogen adsorption isotherms on a-MCMBsare measured by the IGA-003 gravimetric analyzer at 298 K and 77 K. The pores of a-MCMBs are describedas slit-shaped with a pore size distribution (PSD). The PSD is determined by a combined method of grandcanonical Monte Carlo (GCMC) simulation and statistics integral equation (SIE) from the experimental isothermof nitrogen on a-MCMBs. In GCMC simulation, methane and hydrogen molecules are modeled as the Lennard-Jones spherical molecules, and the well-known Steele’s 10-4-3 potential is used to represent the interactionbetween the fluid molecule and the solid wall. Good agreement between simulated and experimental dataindicates that our model represents well the mechanism of adsorption on a-MCMBs. Then, this model is usedto predict adsorption of methane and hydrogen over a wide range of pressure up to 12 MPa. The predictionshows that adsorption amount of methane reaches 36 wt % at 298 K and 4 MPa, which is superior to theresults in the literature. The hydrogen adsorption amount at 10 MPa can reach 3.2 wt% and 15 wt % at 298 K and 77 K, respectively, which are also higher scores, compared with the other carbon materials. Introduction Natural gas and hydrogen are the green energy that can bestored by adsorption in carbonaceous adsorbents.1-5 A majorproblem of adsorption storage of natural gas and hydrogen isto choose appropriate adsorbents. Interestingly, diversifiedexperimental results of hydrogen adsorption on carbonaceousporous materials are reported in the literature. For example,Wang et al. report that hydrogen adsorption on the single-wallednanotubes (SWNT) is 2 wt %, while the result of Darkrim etal. reaches 11 wt % at 10 MPa and 80 K. As for the adsorptionuptakes at ambient temperature, Liu et al. found that theadsorption of hydrogen on SWNT can reach 4.2 wt % at 300 Kand 12 MPa. In contrast, the CEA laboratory of Francereportsthat the adsorption is only 0.2 wt % at 300 K and 10 MPa onSWNTs. Several articles8,9-12 have delivered comprehensivereviews on experimental and theoretical work on hydrogenadsorption on activated carbons, single-walled nanotubes (SWNT),multiwalled nanotubes, and graphite nano-fibers (GNF). Amongtheoretical researches, using molecular simulation, Wang andJohnson9-11 demonstrated that it is impossible to get a highstorage amount even by taking into account the physisorptionand chemisorption on carbonaceous porous materials. It is mostlikely that the hydrogen storage in the materials is still anargumentative topic. Natural gas has a considerable advantage over conventionalfuels from the environmental point of view.13Adsorbed natural ( * Corresponding author . Fa x +86-10-64427616 . E-mail: wchwang@ 163bj.com. ) gas (ANG) is a more economical and safer solution than theconventional method of compressed natural gas (CNG). Manyresearchers reported their results on adsorption storage of naturalgas, and focused on its major component methane, in par-ticular.13-16 Lozano-Castello et a1.15 carried out a detailed reviewon methane storage in different porous carbonaceous materials.They found that the adsorption of methane can reach 14.8 wt% on activated carbon fibers at 298 K and 4 MPa. The uptakescould reach as high as 19.1 wt% at 298 K and 4MPa on apowdered activated carbon, which is higher than those on acti-vated carbon fibers (ACFs). In summary, despite many resultsreported, it is still a challenging task to prepare and test prom-ising carbonaceous adsorbents for adsorption storage of methaneand hydrogen. As a new type of porous materials, mesocarbon microbeads(MCMBs) are micro carbon spheres produced by mesophasepitches,l7 which have been mainly used as filler in paints,elastomers, and plastics to modify the mechanical, electricalproperties of the materials.17,18 Particularly, MCMBs are widelyused in the lithium-ion batteriesl9 recently. After activating, theactivated MCMBs(a-MCMBs) with high specific surface areagreater than 2630 m² g-can be prepared, which is called asuper high surface area carbon or super surface carbon.Manyinvestigations17,18,20,21 show that a-MCMBs are expected to bemore ordered in structure than the activated carbon fibers (ACF)..21In addition to experimental researches, Thomson and Gubbinscharacterized a-MCMB samples with the nitrogen isotherm totest their Reverse Monte Carlo model. However, little was Figure 1. The SEM photo of MCMBs at the voltage of 19 kV, takenfrom the literature.22 reported to use a-MCMBs to store energy, though the a-MCMBscould be a good adsorbent for storage of natural gas andhydrogen. In this work, we use a sample of a-MCMBs prepared by ourgroup for adsorption storage of hydrogen and methane byexperiment and computer simulation. Experimental characteriza-tion is conducted in terms of the isotherm of N2 at 77 K. Then,the adsorption isotherms of hydrogen and methane are measuredby the Intelligent Gravimetric Analyzer (IGA-003) up to 1.0MPa at 298 and 77K, respectively. To evaluate the adsorptionstorage capacities, a model for the a-MCMBs is developed. Inthis model, the pores of a-MCMBs are described as slitlike witha pore size distribution, which is determined by GCMC and astatistical integral equation. On the model proposed, we predictthe capabilities of a-MCMBs for adsorption storage of methaneand hydrogen by the GCMC method, respectively, covering awide range of pressure at 77 and 298 K. Finally, the adsorptioncapabilities of the a-MCMBs are compared with other resultsreported in the literature. Preparation of Sample a-MCMBs and ExperimentalMeasurements Sample Preparation. We first mixed the filtrated residue ofpetroleum and carbon black (2 wt %). Then, we maintainedthe mixture in an autoclave with a nitrogen environment at 680K for 4.5 h. By using pyridine separating the resultant, rawcarbon spheres were prepared. Then, the carbon spheres andKOH (the weight ratio is 1:8) were put into a furnace andsurrounded by nitrogen for activated treatment. The resultantwas heated to 1123 K for 1.0 h. Finally, the a-MCMB samplewas obtained after cleaning and drying. Detailed informationcan be found in the literature.22,23 Scanning electron microscopy (SEM) images were obtainedby means of the Cambridge S-250 MK III instrument, whichwas operated at 19 kV in the secondary electron imaging mode.The appearance of the MCMBs is shown in Figure 1.22 Mostof them are sphere-shaped and of diameters of 20 um. Afteractivating by KOH, the a-MCMBs were prepared and they takeellipse-like shapes sized from 10 to 20 um, as is shown in Figure2. Figure 3 gives a high-resolution SEM photo of a single bead,showing that there are some external pores on the bead. Theexternal pores work as channels, where fluid molecules can passthrough. Experimental Measurement of an Adsorption Isothermfor Nitrogen at 77 K. The Accelerated Surface Area andPorosimetry Apparatus (ASAP 2010, Micromeritics Ins. Corp.) Figure 2. The SEM photo of a-MCMBs by SEM at the voltage of19 kV. Figure 3. The SEM photo of a single bead of a-MCMBs. was used to measure the nitrogen adsorption isotherm in therange of relative pressure, plpo, where po is the saturated vaporpressure of the system, from 0.1 Pa to 0.1 MPa at 77 K. As isrequired, the sample was outgassed at 473 K for 15 h beforethe measurements. IGA-003 Gravimetric Adsorption Measurements. TheIntelligent Gravimetric Analyzer (IGA-003, Hiden) was usedto measure the adsorption isotherms of methane and hydrogenfor the sample a-MCMBs by using the gravimetric method. InIGA-003, an ultra-sensitive microbalance of resolution 0.2 ugis mounted in the thermostated heatsink with high precisiontemperature control. The sample weighed about 100 mg for eachrun. Before the measurements, the sample in the vessel of IGA-003 was vacuumed up to 10-5 Pa and outgassed at 573 K for15 h. The measurements were carried out at 77 and 298 K interms of the built-in water and liquid nitrogen baths, respec-tively. The highest adsorption pressure was 1.0 MPa for thesensor limitation of IGA-003. To guarantee equilibration, 1.5 hwas needed for a data point in the measurements at 77 K, whileonly 0.5 h for a data point at 298 K. Methane used in experiments is of the purity of 0.999 (mol),produced by Bright Gas Factory, Dalian, China. To guaranteethe quality of measurements for hydrogen particularly, the purityof hydrogen is 0.99999 (mol), produced by the OxygenCompany of Fu Shun, China. Modeling of Adsorption on a-MCMBs and Grand Ca-nonical Monte Carlo Simulation. A model of adsorption ona-MCMBs relies on the description of the mechanism and char-acteristics for a-MCMBs, and interactions between the fluid-fluid and fluid-adsorbent of interest on molecular level. Moreimportantly, understanding of the molecular mechanism of TABLE 1: Parameters of Potential Models for Fluids anda-MCMBs4 solid wall N2 H2 CH4 ofa-MCMB o/nm e·k/K o/nm ek-/K o/nm e·k-/K o/nm e·k-1/K 0.375 95.2 0.296 34.2 0.381 148.1 0.34 28.0 “ The parameters for N2, H2, CH4, and the solid wall of a-MCMBsare taken from refs 21, 27, and 31, respectively. adsorption provides a basis for computer simulation, which isa useful tool for prediction of the performance of the adsorbenta-MCMBs. Modeling of a-MCMBs. Honda24 proposed a structuralmodel of MCMBs. In the model, a bead is formed by slit-shapedcarbon layers. The distance between two layers is the latticedistance, which is equal to 0.335 nm. Therefore, many research-ers account for a-MCMBs more ordered in structure than ACFs.In addition, Thomson and Gubbins21 characterized a-MCMBsamples as slit-shaped pores and used the nitrogen isotherm ofa-MCMBs in their Reverse Monte Carlo simulationn. It is noticed that after activating by KOH, heterogeneity ofthe pores of a-MCMBs becomes pronounced, and shouldtherefore be taken into account in characterization. Conse-quently, the a-MCMBs are modeled as a porous materialpossessing slit pores with a pore size distribution (PSD) in thiswork. Fluid-Fluid Molecular Interactions. In GCMC simulation.methane and hydrogen molecules are considered as the Lennard-Jones(LJ) spherical molecules. The fluid-fluid interactions aredescribed by the cut and shifted Lennard-Jones potential, where r is the intermolecular distance, re is the cutoff radius, re=5o, 中Lj is the full LJ potential, given by where er and or are the energy and size parameters of the fluid,respectively. Obviously, methane is a typical LJ spherical molecule innature. However, the quantum effect of hydrogen molecules onadsorption simulation is still a topic under discussion. Wang etal.25 discussed the quantum effect of hydrogen moleculessystematically. They evaluated the Silvera and Goldman's (SG)potential26 that accounts for the quantum effect, and three LJhydrogen potentials proposed by Buch,27 Buck et al.,28 andDondi and Valbusa2 from simulations and experiment over awide range of temperature and pressure. It is found that thehydrogen internal energies exhibit deviations with and withoutaccounting the quantum effect. But the Buch’s parameters27 gavedensities that agree with experiment almost as well as the resultsfrom the SG potential, except that the temperature is below 30K. Consequently, the LJ potential and Buch’s parameters wereadopted to simulate the hydrogen adsorption on a-MCMBs inthis work, as is shown in Table 1. Fluid-Wall Molecular Interactions. The pores of a-MCMBs can be described as slit-shaped with a pore sizedistribution. Therefore, the interaction between a solid wall anda fluid molecule is given by the well-known Steele's 10-4-3potential30 where pw is the number density of the solid wall, pw = 114nm-3, and the subscript w represents the wall, A is the distancebetween lattice planes, and is set to 0.335 nm, z is the normaldistance between a fluid molecule and one of the solid walls.efw and Ofw are the cross interaction parameters, which areobtained from the Lorentz-Berthelot combing rules. Theparameters of fluid-fluid and fluid-solid used in this workare given in Table 1. Grand Canonical Monte Carlo Simulation. By using thegrand canonical Monte Carlo (GCMC) method, where thechemical potential, the volume, and the temperature are theindependent variables, adsorption of methane and hydrogen ona-MCMBs was simulated. In our simulation, the periodic bound-ary conditions were imposed only in the x and y directions. Allthe variables were reduced with respect to the fluid molecules.The initial configuration was generated randomly. For a fixedcell, three types of moves were used to generate a Markov chain,including moving, creating, and deleting a molecule. The threetypes of moves have the same probability and each has dif-ferent receiving opportunities. For every state, we generated 2x 10 configurations and discarded the first 1 x10⁷ configura-tions to ensure the equilibration. During the simulation, theaverage number of fluid molecules could reach about 1000.Details for the GCMC method can be referred to our previouswork 2,3,32,33 Results and Discussion Characterization of a-MCMBs by the Adsorption Iso-therm of N2 at 77 K. The sample of a-MCMBs was character-ized by using the ASAP-2010 adsorption apparatus. Theisotherm of N2 at 77 K is shown in Figure 4. The BET specificsurface area, pore volume and average pore size of the sample.obtained from ASAP-2010 are given in Table 2. The results indicate that our sample has a high BET specificsurface area, SBET, 3180m² g. In addition, the average poresize Hav is 2.47 nm. According to the IUPAC classifications ofpores, the sample resides in the range of mesoporous ma-terials. Impressively, among all the articles published abouta-MCMBs,17,18,34,35 the specific surface area of our materialseems to be higher than the others. Determination of the Pore Size Distribution by GCMCand Statistical Integral Method. For any real porous ma-terials, the pore size heterogeneity always exists. As is men-tioned above,the slit-shaped pores with PSD represent the realpore structure of our sample. Each pore size will contribute tothe total adsorption isotherm in proportion to the fraction ofthe total volume of the sample. Adsorption in different sizepores can be simulated by GCMC method. The simulationisotherm from a PSD is, thus, described as a combination ofisotherms in individual slit pores using the statistics integralequation36-38 where I sim is the adsorption calculated by the PSD,I(H)is thecalculated adsorption amount in a single model pore of width P/PO Figure 4. The isotherm of nitrogen at 77 K on a-MCMBs, measured by ASAP 2010. TABLE 2: Properties for a-MCMBs Measured byASAP-2010 BET specific surface area pore volume average pore size SBET/(m²g) V/(cm’g-) Haw/nm H, and g(H) is the PSD, which is defined as the fraction of thepore of width H occupying total pores in the a-MCMBs. Hmaxand Hmin are minimum pore and maximum pore sizes in thecase investigated, respectively. Accounting for the pore sizerange of our sample, Hmin and Hmax are set to 0.75 and 4.5 nmhere, and AH is set to 0.375 nm. The PSD can be solved byminimizing the deviation between the experimental isothermand the simulation results, L,39 where Isim is the adsorption simulated by GCMC, Y(pilpo) isthe experimental data, n is the number of experimental datapoints. It is interesting to look into the adsorption behavior of aconstituent pore in the PSD. Figure 5 presents the isotherms byGCMC method for single pore size ranging from 0.75 nm to4.5 nm. It is found that there exist three types of nitrogenisotherms in the pores. As is seen in Figure 5a, adsorptionachieves easily the saturated densities at low pressures for thepores of 0.75 nm, 1.125 nm, and 1.5 nm, which belongs to typeI isotherm for microporous materials on the IUPAC classifica-tion.40 When the pore size is greater than a few times of theadsorbate molecule diameter, capillary condensation wouldoccur. Here, for the pores from 1.875 to 3.375 nm, suddenvertical jumps in adsorption, which represent capillary conden-sation,4 are observed, as is shown in Figure 5b. When the poresize is enlarged to 3.75-4.5 nm, the adsorption exhibits amonotonic increase with pressure for macropores (see Figure5c). All the observations indicate that the adsorption taking placein our sample is, in fact, a combination of the uptakes of thethree types of pores. Corresponding to the adsorption isotherms in Figure 5, thePSD for the sample is obtained, shown in Figure 6. It is found in Figure 6 that the pores of widths ranging from 1.5 to 3.0 nmtake up the main structure of our sample. Then, we plotted thesimulation data obtained from the PSD along with the experi-mental isotherm in Figure 7. It is observed that all the simulateddata coincide well with the experimental curve. For a compari-son, the isotherm simulated from the average pore size, 2.47nm, is also presented in Figure 7, in which there is a verticaljump representing capillary condensation for the single pore size.The large deviation between the isotherm simply from theaverage size and the experimental data suggests the introductionof the PSD is vital for characterization of the sample. Conse-quently, the PSD is used in our subsequent calculation andprediction of the adsorption behavior of the sample of a-MCMBs. Experimental Adsorption Isotherms for Methane andHydrogen at 298 and 77 K by IGA-003. The upper limit ofthe adsorption pressure for the gravimetric analyzer IGA-003used in our experiment is 1.0 MPa, because of the limitation ofthe pressure transducer of the apparatus. Therefore, we measuredthe isotherms for methane and hydrogen up to 1.0 MPa at 298and 77 K, respectively, which are presented in Figures 8-11.It is found from Figures 8 and 9 that the experimental isothermsfor methane and hydrogen are almost linear at ambient tem-perature, 298 K. In addition, the methane adsorption can reach14.73 wt %, while the hydrogen adsorption is only 0.3 wt % atthe pressure of 0.99 MPa. Figure 10 shows the hydrogenadsorption at 77 K, which reaches a high uptake of 7.8 wt % at0.95 MPa. As is expected for methane, when we measuredcarefully the adsorption and desorption isotherms at 77 K,capillary condensation and the hysteresis phenomenon wereobserved, which are shown in Figure 11. Comparison of Experimental and Simulated Isothermsand Test of the Model Proposed. We first compare theexperimental and simulated isotherms that were calculated byincorporating the PSD to test our model. As is seen in Figures12-14, striking agreements between the experimental andsimulated isotherms for hydrogen and methane indicate that ourmodel is a good representation of the adsorption of methaneand hydrogen on a-MCMBs. For a comparison, the simulatedisotherms from the average pore size of 2.47 nm are also shownin Figures 12-14, where significant deviations from the ex-periment appear for the reasons explained above. Figure 5. Adsorption isotherms of nitrogen in single pore ranging from H=0.75 nm to H=4.5 nm at 77 K, AH=0.375 nm. (a) The pore size:solid line (H=0.75 nm), dash line (H=1.125 nm), short dash line (H=1.5 nm); (b) The pore size: solid line (H=1.875 nm), dash line (H=2.25 nm), short dash line (H=2.625 nm), dash dot line (H=3 nm), short dash dot line (H=3.375 nm); (c) The pore size: solid line (H=3.75nm), dash line (H= 4.125 nm), short dash line (H= 4.5 nm). Figure 6. The pore size distribution of a-MCMB by GCMC and SIE. From the discussion above, we find that the simulation agreeswell with the experiment data by using GCMC with PSD. Con-sequently, the model proposed can be furthermore used for pre-diction of the adsorption on a-MCMBs in different conditions. Prediction of Adsorption Isotherms for Methane andHydrogen. GCMC and PSD were used to predict the adsorptionamount of methane and hydrogen on a-MCMBs at higherpressures and at 298 K. It is found in Figure 15 that of aparabola-like curve, the uptake of methane increases withpressure drastically in the range of pressure from 0.5 to 2.5 MPa.The methane adsorption can reach 36 wt % at 4.0 MPa and298 K. To our knowledge, this uptake is superior to thosereported in the literature.15 In contrast, hydrogen adsorptionexhibits a linear increase with pressure, as is shown in Figure Figure 8. The experimental isotherm of methane on a-MCMBs at 298K. Figure 10. The experimental isotherm of hydrogen on a-MCMBs at77K. Figure 9. The experimental isotherm of hydrogen on a-MCMBs at298 K. Figure 11. The experimental adsorption-desorption isotherms ofmethane at 77 K (● adsorption, ■ desorption). MPa, at which the adsorption can reach about 10.25 wt %, asis shown in Figure 17. The increase of adsorption becomesflattened from 2 to 10.0 MPa, though the hydrogen adsorptionamount can reach 15 wt % at 10 MPa. As is mentioned above, capillary condensation happens formethane at 77 K and a low pressure, about 0.5 kPa. The simu-lated results for methane at 77 K are addressed in the nextsection. GCMC with PSD, which is shown along with the experimentalresult in Figure 18. It is found in Figure 18 that the experimentaland simulated hysteresis loops coincide fairly, although thesimulated capillary condensation pressure is slightly lower andthe condensation density is a little higher than the experimentalones. The deviations might be caused by the assumptions intro-duced in our simulations. Conclusions Comparison between Experimental and Simulated Hys-teresis Loops for Methane at 77 K. A gas-liquid transitionwill occur when the temperature is below the pore criticaltemperature, and the pore width is greater than a few times ofthe adsorbate molecule diameter. Such a transition appears inthe adsorption isotherm as a sudden and large jump in theamount adsorbed at the capillary condensation pressure. In anidealized material with a uniform pore size, the condensationwould be a sharp transition and it will have a sudden verticaljump in adsorption.41 In a real system, this jump is often replacedby a steep increase, because a real material possesses a dis-tribution of pore sizes. It is a challenging task to develop and characterize new car-bonaceous materials for adsorption storage of methane that is amajor component in natural gas and hydrogen that is the cleanestenergy theoretically and experimentally. We have prepared theactivated mesocarbon microbeads (MCMBs) from the raw ma-terial of the filtrated residue of petroleum and carbon. The iso-therm of nitrogen on the Accelerated Surface Area and Poro-simetry Apparatus (ASAP 2010, Micromeritics Ins. Corp.) at77 K, as is shown in Figure 4, provides not only the propertiesfor the sample,e.g., the BET specific surface area of 3180m/g,etc., but also a basis for modeling the new material in this work. Capillary condensation was observed for methane at 77 K inour experiment (see Figure 11). We simulated the isotherm by To test the capabilities of the sample of a-MCMBs, adsorptionof methane and hydrogen at 298 and 77 K is measured in the 2976J. Phys. Chem. B, Vol. 108, No. 9, 2004 Figure 12. Comparison of simulated and experiment data of methaneadsorption on a-MCMBs at 298 K (-■- experimental data (this work),-O- simulated data by PSD,···simulation data by the experimentalaverage pore size, Hav = 2.47 nm). Figure 14. Comparison between experimental and simulated data ofhydrogen at 77 K (-■- experimental data (this work), -O- simulationdata by PSD,··· simulated data by the experimental average poresize, Hav =2.47 nm). Figure 13. Comparison of simulated and experiment data of hydrogenadsorption in a-MCMBs at 298 K (-■- experimental data (this work),-O- simulation data by PSD,···simulation data by the experimentalaverage pore size, Hav = 2.47 nm). Figure 15. Methane adsorption at 298 K and high pressures ona-MCMBs predicted by GCMC and PSD. Intelligent Gravimetric Analyzer (IGA-003, Hiden) by using thegravimetric method, as is shown in Figures 8-11. To furthercharacterize the sample of a-MCMBs, and to predict itsperformances covering a wide range of pressure, a model forthe material and adsorption is proposed. methane and hydrogen at 298 and 77 K (see Figures 12-14)are obtained. Impressively, even for the isotherms of methaneat 77 K, where rather complicated hysteresis loops emerge, boththe experimental and simulated results coincide fairly, as isshown in Figure 18. These observations indicate that the modelproposed is a good representation of the sample of a-MCMBs,and can be furthermore used for prediction of the performancesof the sample. In modeling of the sample of a-MCMBs, a grand canonicalMonte Carlo (GCMC) method is used for the simulation ofadsorption. The pores are accounted for slitlike with a pore sizedistribution (PSD), which is a description of the heterogeneityof the pores. The fluid-fluid and fluid-wall molecular interac-tions are described by the LJ and the well-known Steele’s 10-4-3 potentials. The PSD obtained by the GCMC and statisticalintegration methods suggests that our sample is composed ofmicro-, meso, and macropores, which correspond to three typesof adsorption isotherms (see Figure 5). In fact, the adsorptionon the sample reflects a combination of the three differentbehaviors. Predictions of the adsorption isotherms of methane andhydrogen at 298 and 77 K, up to 12 MPa are presented inFigures 15-17, respectively. It is found that the methaneadsorption reaches 36 wt % at 4.0 MPa and 298 K. To ourknowledge, this uptake is superior to the results reported in theliterature,15 in which the maximum uptake is 19.1 wt % on acommercial powdered activated carbon. Good agreements between the simulated and experimentalisotherms for nitrogen at 77 K (see Figure 7) and isotherms for It is more interesting to focus on the adsorption storage ofhydrogen. Hydrogen adsorption exhibits a linear increase withpressure at 298 K, as is shown in Figure 16. The uptake is 3.2wt % at 12 MPa. This uptake does not satisfy the target of 6.5 3.5 Figure 16. Hydrogen adsorption at 298 K and high pressures ona-MCMBs predicted by GCMC and PSD. Figure 17. Hydrogen adsorption at 77 K and high pressures ona-MCMBs predicted by GCMC and PSD. Figure 18. Comparison of experimental and simulated isotherms ofmethane at 77 K -■- adsorption isotherm by experiment,-●-desorption isotherm by experiment, -- adsorption isotherm byGCMC with PSD, -O- desorption isotherm by GCMC with PSD. wt % set by the Department of Energy (DOE) of USA. How-ever, this value complies with the theoretical estimation bySimonnyan and Johnson.’ On the other hand, with respect to some other carbon materials reported in the literature, forexample activated carbons, SWNTs and MWNTs, it is compa-rable or even better.8 At low temperature 77 K, the adsorptioncan reach about 10.25 wt % at 2.0 MPa and 15 wt % at 10.0MPa, respectively, as is shown in Figure 17. To summarize, this work presents an approach for experi-mental and theoretical characterization of not only the a-MCMBsbut also other new adsorbents. In addition, the a-MCMBsprepared in this work seem to be an excellent candidate of ad-sorbents for adsorption storage of methane at ambient temper-ature. However, although it exhibits good capabilities for ad-sorption storage of hydrogen among all the current carbonaceousmaterials, its performances still need to be improved in termsof surface modification or other chemical doping method. Thiswill be addressed in our future work. Acknowledgment. This work was supported by the KeyFundamental Research Plan (No. G2000048010) and theNational Natural Science Foundation of China (No. 20236010).The authors are grateful to Professor Z. L. Sun and Mr. L. H.Duan of the Liaoning University of Petroleum and ChemicalTechnology, Professor J. F. Chen and Mr. Z. G. Shen of theBeijing University of Chemical Technology for their help inthe experimental measurements. References and Notes (1) Huang, M. C.; Chou, Chia-Huei; Teng, H. Pore-Size Effects onActivated-Carbon Capacities for Volatile Organic Compound Adsorption.AIChE 2002, 48, 8. (2) Zhang, X. R.; Wang, W. C. Methane Adsorption in Single-WalledCarbon Nanotubes Arrays by Molecular Simulation and Density FunctionalTheory. Fluid Phase Equilib. 2002,194-197,289. (3) Cao,D. P.; Wang, W. C.; Duan,X. Grand Canonical Monte CarloSimulation for Determination of Optimum Parameters for Adsorption ofSupercritical Methane in Pillared Layered Pores.J. Colloid Interface Sci.2002, 254,1. (4) Darkrim, F. L.; Malbrunot, P.; Tartaglia, G. P. Review of HydrogenStorage by Adsorption in Carbon Nanotubes. Int. J. Hydrogen Energy 2002,27,193. (5) Wang, Q.; Johnson, J. K. Computer Simulations of Hyd、rogenAdsorption on Graphite Nanofibers. J. Phys. Chem. B 1999, 103(2), 277. (6) Darkrim, F. L.; Levesque, D. High Adsorptive Property of OpenedCarbon Nanotubes. J. Phys. Chem. B 2000, 104,6773. (7) Liu, J.; Rinzler, A. G.; Dai, H. J.; Hafner, J. H.; Bradley, R. K.;Boul, P. J.; Lu, Adrian; Iverson, T.; Shelimov, K.; Huffman, C. B.;Rodriguez-Macias, F.; Shon, Young-Seok; Lee, T. Randall; Colbert, DanielT.; Smalley, Richard E. Fullerene Pipes. Science 1998, 280, 1253. (8) David, P.; Piquero, T.; Metenier, K.; Pierre, Y.; Demoment, J.;Lecas-Hardit, A. Hydrogen Adsorption in Carbon Materials. The Interna-tional Conference on Carbon, Sept 15-20, Beijing, China 2002. (9) Vahan, V. Si.; Johnson, J. K. Hydrogen Storage in CarbonNanotubes and Graphitic Nanofibers.J. Alloys Compd. 2002, 330-332,659. (10) Wang, Q.; Johnson, J. K. Computer Simulations of HydrogenAdsorption on Graphite Nanofibers. J. Phys. Chem. B 1999, 103 (2), 277. (11) Wang, Q.; Johnson, J. K. Molecular Simulation of HydrogenAdsorption in Single-Walled Carbon Nanaotubes and Idealized CarbonPores. J.Chem. Phys. 1999, 110, 577. (12) Darkrim, F. L.;Malbrunot, P.; Tartaglia, G. P. Review of hydrogenstorage by adsorption in carbon nanotubes. Int. J. Hydrogen Energy 2002,27,193. (13) Alcaniz-Monge, J.; Dela Casa-Lillo, M. A.; Cazorla-Amoros, D.;Linares-Solano, A. Methane Storage in Activated Carbon Fibres. Carbon1997, 35 (2), 291. (14) Quinn,D. F.;MacDonald, J. A. Natural Gas Storage. Carbon 1992,30,1097. (15) Lozano-Castello, D.; Alcaniz-Monge, J.; de la Casa-Lillo, M. A.;Cazorla-Amoros,D.;Linares-Solano, A. Advances in the Study of MethaneStorage in Porous Carbonaceous Materials. Fuel 2002, 81, 1777. (16) Lozano-Castello, D.; Cazorla-Amoros, D.; Linares-Solano, A.;Quinn, A. Activated Carbon Monoliths for Methane Storage: Influence ofBinder. Carbon 2002, 40, 2817. (17) Ishii, C.; Kaneko, K. Surface and Physical Properties of Mi-croporous Carbon Spheres. Prog. Org. Coatings 1997,31,147. (18) Ishii, C.; Matsumura, Y.; Kaneko, K. Ferromagnetic Behavior ofSuperhigh Surface-Area Carbon. J. Phy. Chem. 1995, 99 (16),5743. (19) Yun, M. S.; Moon, S. L.; Doh, C. H.; Lee, K. H. Application ofcarbon to anode material for the lithium secondary battery. Synth. Met. 1995,71(1-3),1761. (20) Ishii, C.; Shindo, N.; Kaneko, K. Random Magnetism of SuperhighSurface Area Carbon Having Minute Graphitic Structure. Chem. Phy. Lett.1995,242,196. (21) Kendall, T. T.; Gubbins, K. E. Modeling Structural Morphologyof Microporous Carbons by Reverse Monte Carlo. Langmuir 2000, 16, 5761. (22) Xue, R. S.; Shen, Z. M. The Activation of the Mesophase PitchMicrobeads. Carbon Technol. (Chinese) 2001, 5, 1. (23) Xue, R. S.; Shen, Z. M. Effects of KOH/MMB Weight Ratio onStructure and Morphology of Activated Mesophase Carbon Microbeads.Mater. Sci.Technol. (Chinese) 2002, 10 (4), 346. (24) Honda, H. Mesophase Pitch and Meso-carbon Microbeads. Mol.Cryst. Liq. Cryst. 1983, 94, 97. (25) Wang, Q.; Johnson, J. K.; Broughton, J. Q. ThermodynamicProperties and Phase Equilibrium of Fluid Hydrogen from Path IntegralSimulations. Mol.Phys. 1996, 89 (4),1105. (26) Silvera, I.F.; Goldman, V. V. The Isotropic Intermolecular Potentialfor H2 and D2 in the Solid and Gas Phases. J.Chem. Phys. 1978, 69 (9),4209. (27) Buch,V. Path-Integral Simulations of Mixed Para-D-2 and Orito-D-2 Clusters-The Orientational Effects. J. Chem. Phys.1994,100,7610. (28) Buck, U.; Huisken, F.; Kohlhase, A.; Otten, D. State ResolvedRotational Excitation in D2+H2 Collisions. J. Chem. Phys. 1983, 78,4439. (29) Dondi, M. G.; Valbusa, U. Energy Dependence of the DifferentialCollision Cross Section for Hydrogen at Thermal Energies. Chem. Phys.Lett. 1972,17,137. (30) Steele, W. A. The Physical Interaction of Gases with CrystallineSolids. Surf. Sci. 1973, 36, 317. (31) Jiang, S.; Rhykerd, C. L.; Gubbins, K. E. Layering, FreezingTransitions,Capillary Condensation and Diffusion of Methane in Slit CarbonPores. Mol. Phys. 1993, 79 (2), 373. (32) Zhou, J.; Wang, W. C. Adsorption and Diffusion of SupercriticalCarbon Dioxide in Slit Carbon Pores. Langmuir 2000, 16, 8063. (33) Cao, D. P.; Wang, W. C. Computer simulation of adsorptionrecovery of CCl4 in activated carbon and layered pillared materials atambient temperature. Phys. Chem. Chem. Phys. 2002,4,3720. (34) Wang, Y. G.; Egashira, M.; Ishida, S.; Korai,Y.; Ochida, I.Microstructure of Mesocarbon Microbeads Prepared from Synthetic IsotropicNaphthalene Pitch in the Presence of Carbon Black. Carbon 1998, 37, 307. (35) Korai, Y.; Wang, Y. G.; Yoon, S. H.; Ishida, S.; Mochida, I.;Nakagawa, Y.; Matsumura, Y. Effects of Carbon Black Addition onPreparation of Meso-carbon Microbeads. Carbon 1997, 35 (7), 875. (36) Cao, D. P; Wang, W. C.; Shen, Z. G.; Chen, J. F. Determinationof Pore Size Distribution and Adsorption of Methane and CCl4 on ActivatedCarbon by Molecular Simulation. Carbon 2002, 40,2359. (37) Blacher, S.; Sahouli, B.; Heinrichs, B.; Lodewyekx, P.; Pirard, R.;Pirard, J. P. Micropore Size Distributions of Activated Carbons. Langmuir2000,16,6754. (38) Heuchel, M.; Davies, G. M.; Buss, E.; Seaton, N. A. Adsorptionof Carbon Dioxide and Methane and Their Mixtures on an ActivatedCarbon: Simulation and Experiment. Langmuir 1999, 15,8695. (39) El-Merraoui, M.; Aoshima, M.; Kaneko, K.“Micropore SizeDistribution of Activated Carbon Fiber Using the Density Functional Theoryand Other Methods.Langmuir 2000, 16, 4300. (40) Sangwichien, C.; Aranovich, G. L.; Donohue, M. D. DensityFunctional Theory Predictions of Adsorption Isotherms with HysteresisLoops. Colloids Surf. A: Physicochem. Eng. Aspects 2002,206, 313. (41) Gelb, D.; Gubbins, K. E.; Radhakrishnan,R.; Sliwinska-Bartkowiak,M. Phase Separation in Confined Systems. Rep. Prog. Phys. 1999, 62,1573.
确定
还剩7页未读,是否继续阅读?

产品配置单

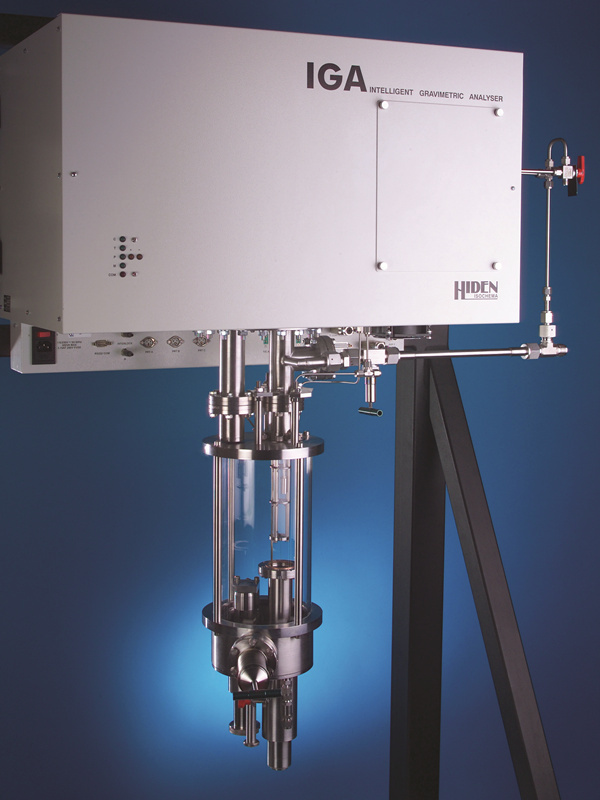
北京英格海德分析技术有限公司为您提供《用实验和分子模拟方法研究甲烷和氢气在活性碳微球中的吸附》,该方案主要用于其他中--检测,参考标准--,《用实验和分子模拟方法研究甲烷和氢气在活性碳微球中的吸附》用到的仪器有Hiden IGA 智能重量法吸附分析仪
推荐专场


相关方案
更多
该厂商其他方案
更多