


方案详情
文
采用LaVision公司的DaVis8.1.3软件的DVC模块,计算了格林-拉格朗日张量的6个独立分量,亚体积元为20x20x20体像素,75%重叠,所得结果的应变精度为20个微应变。
方案详情

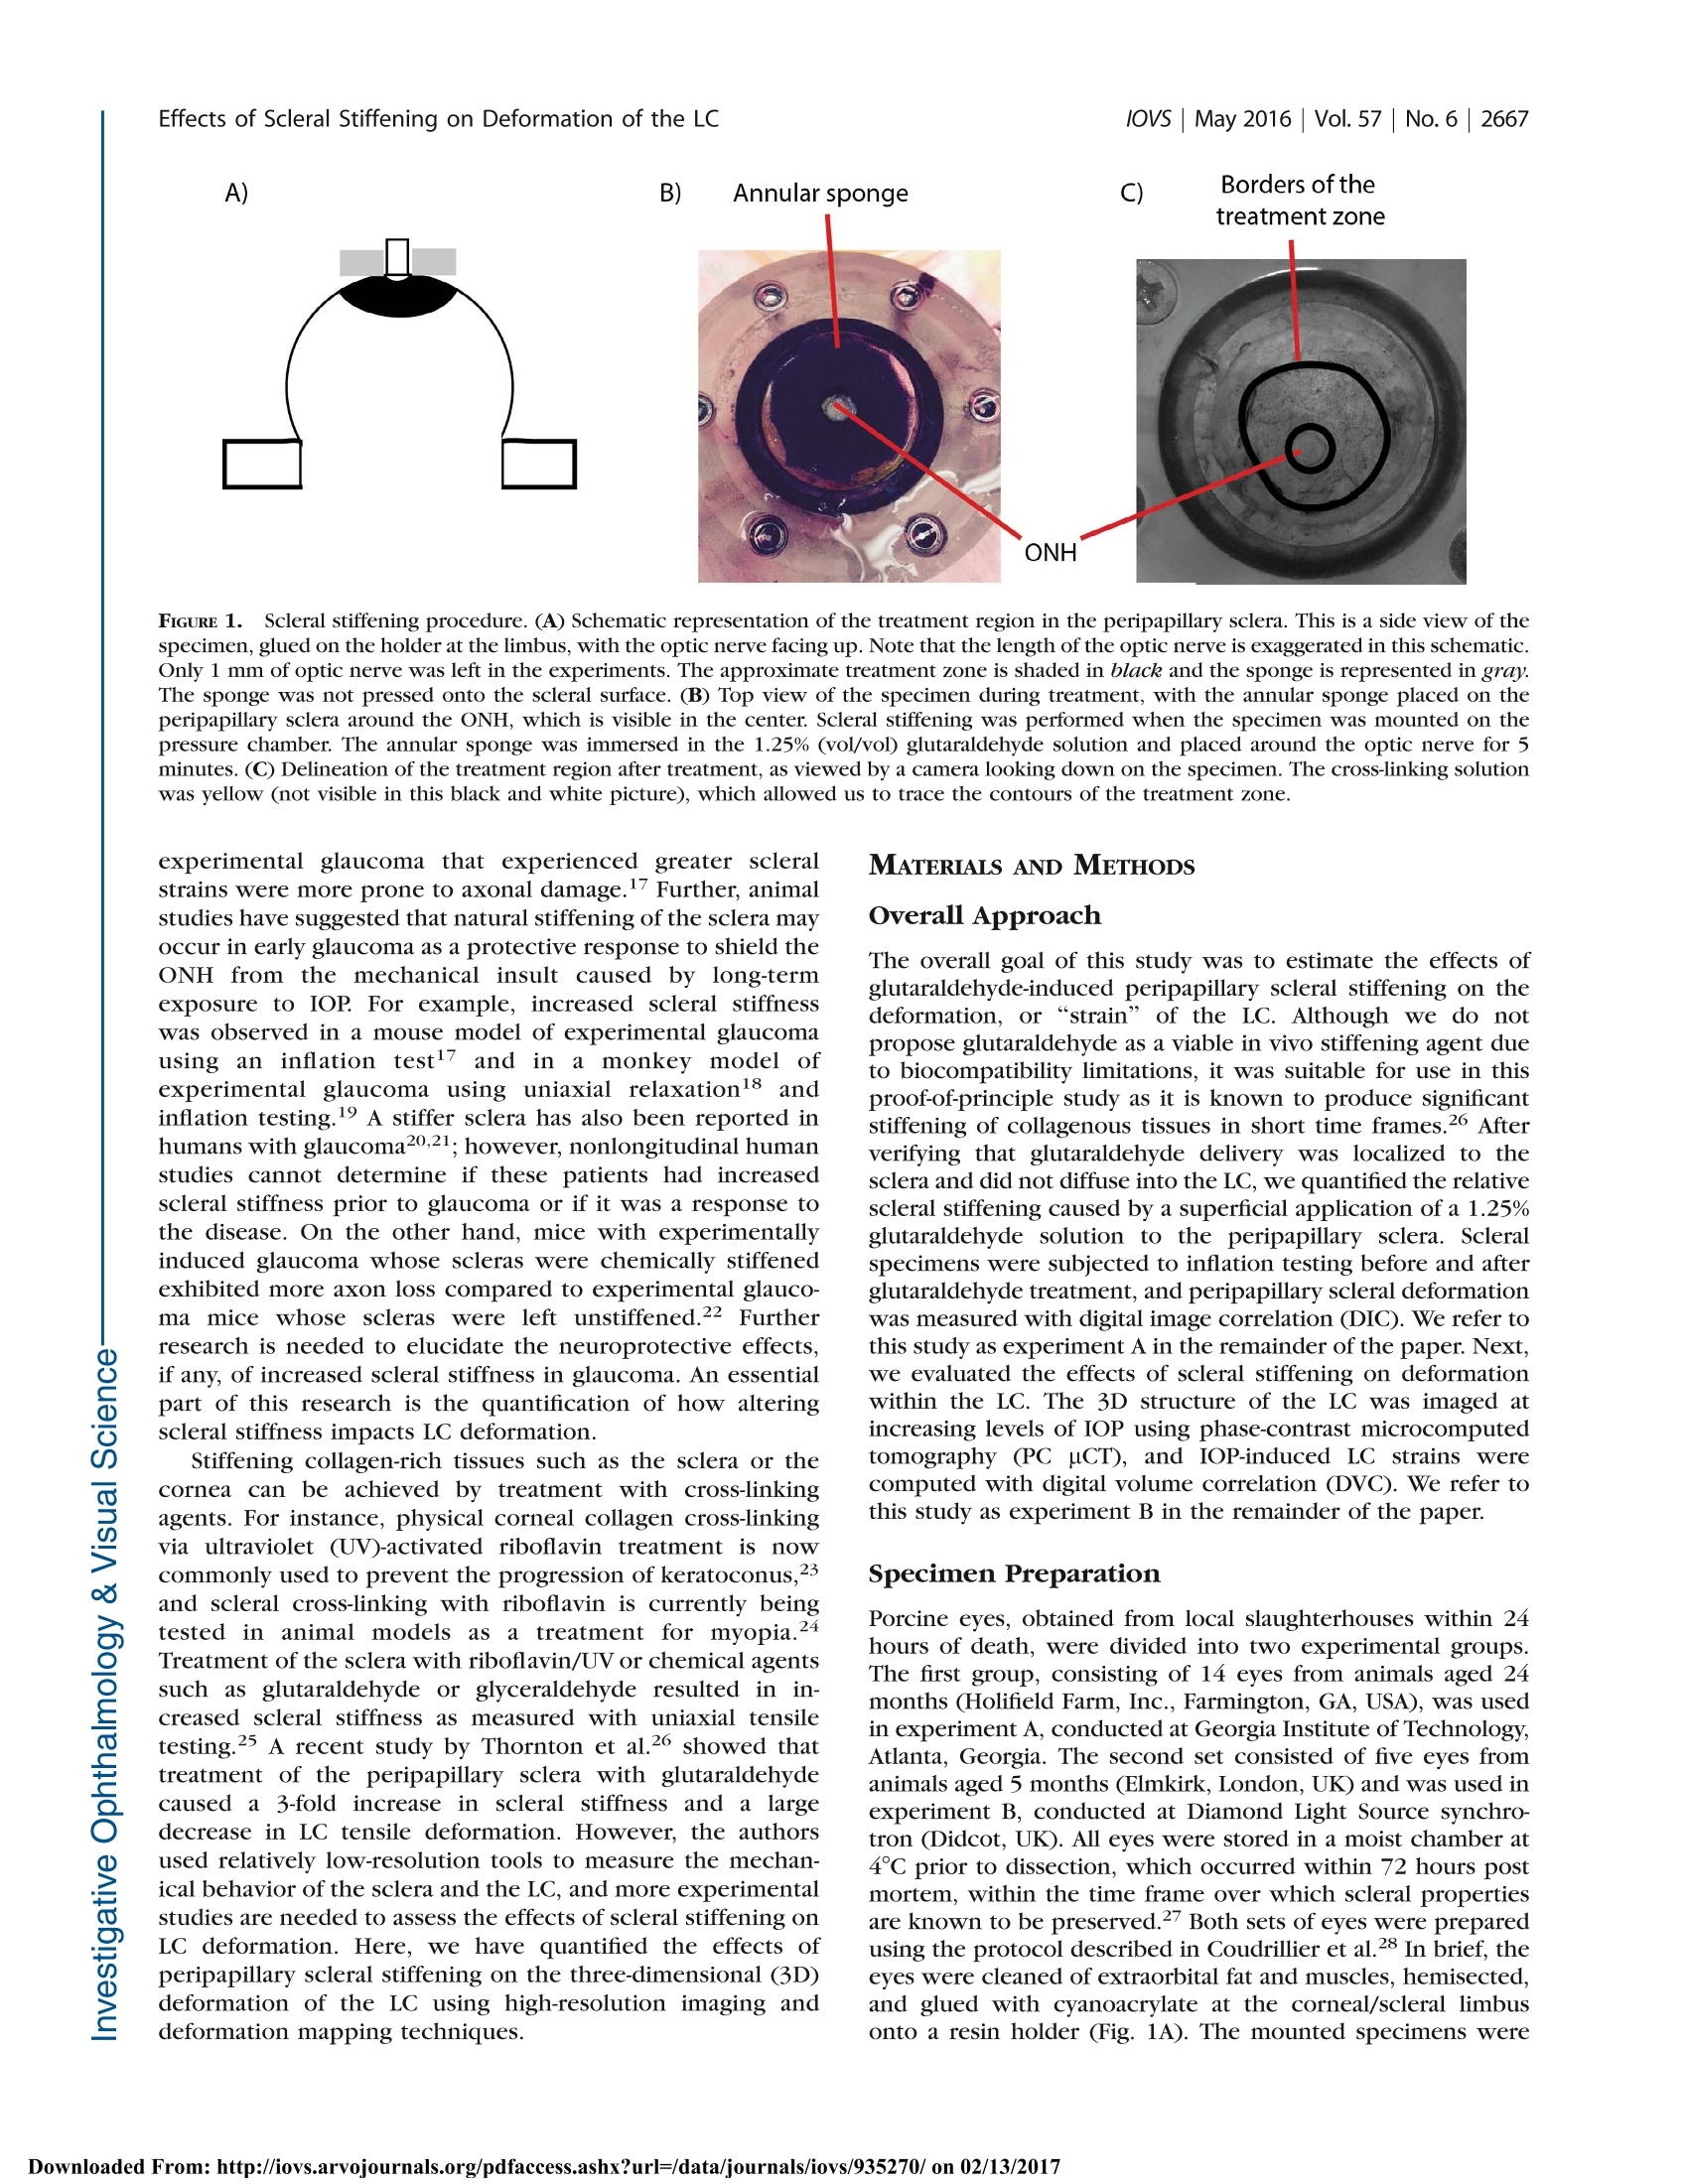
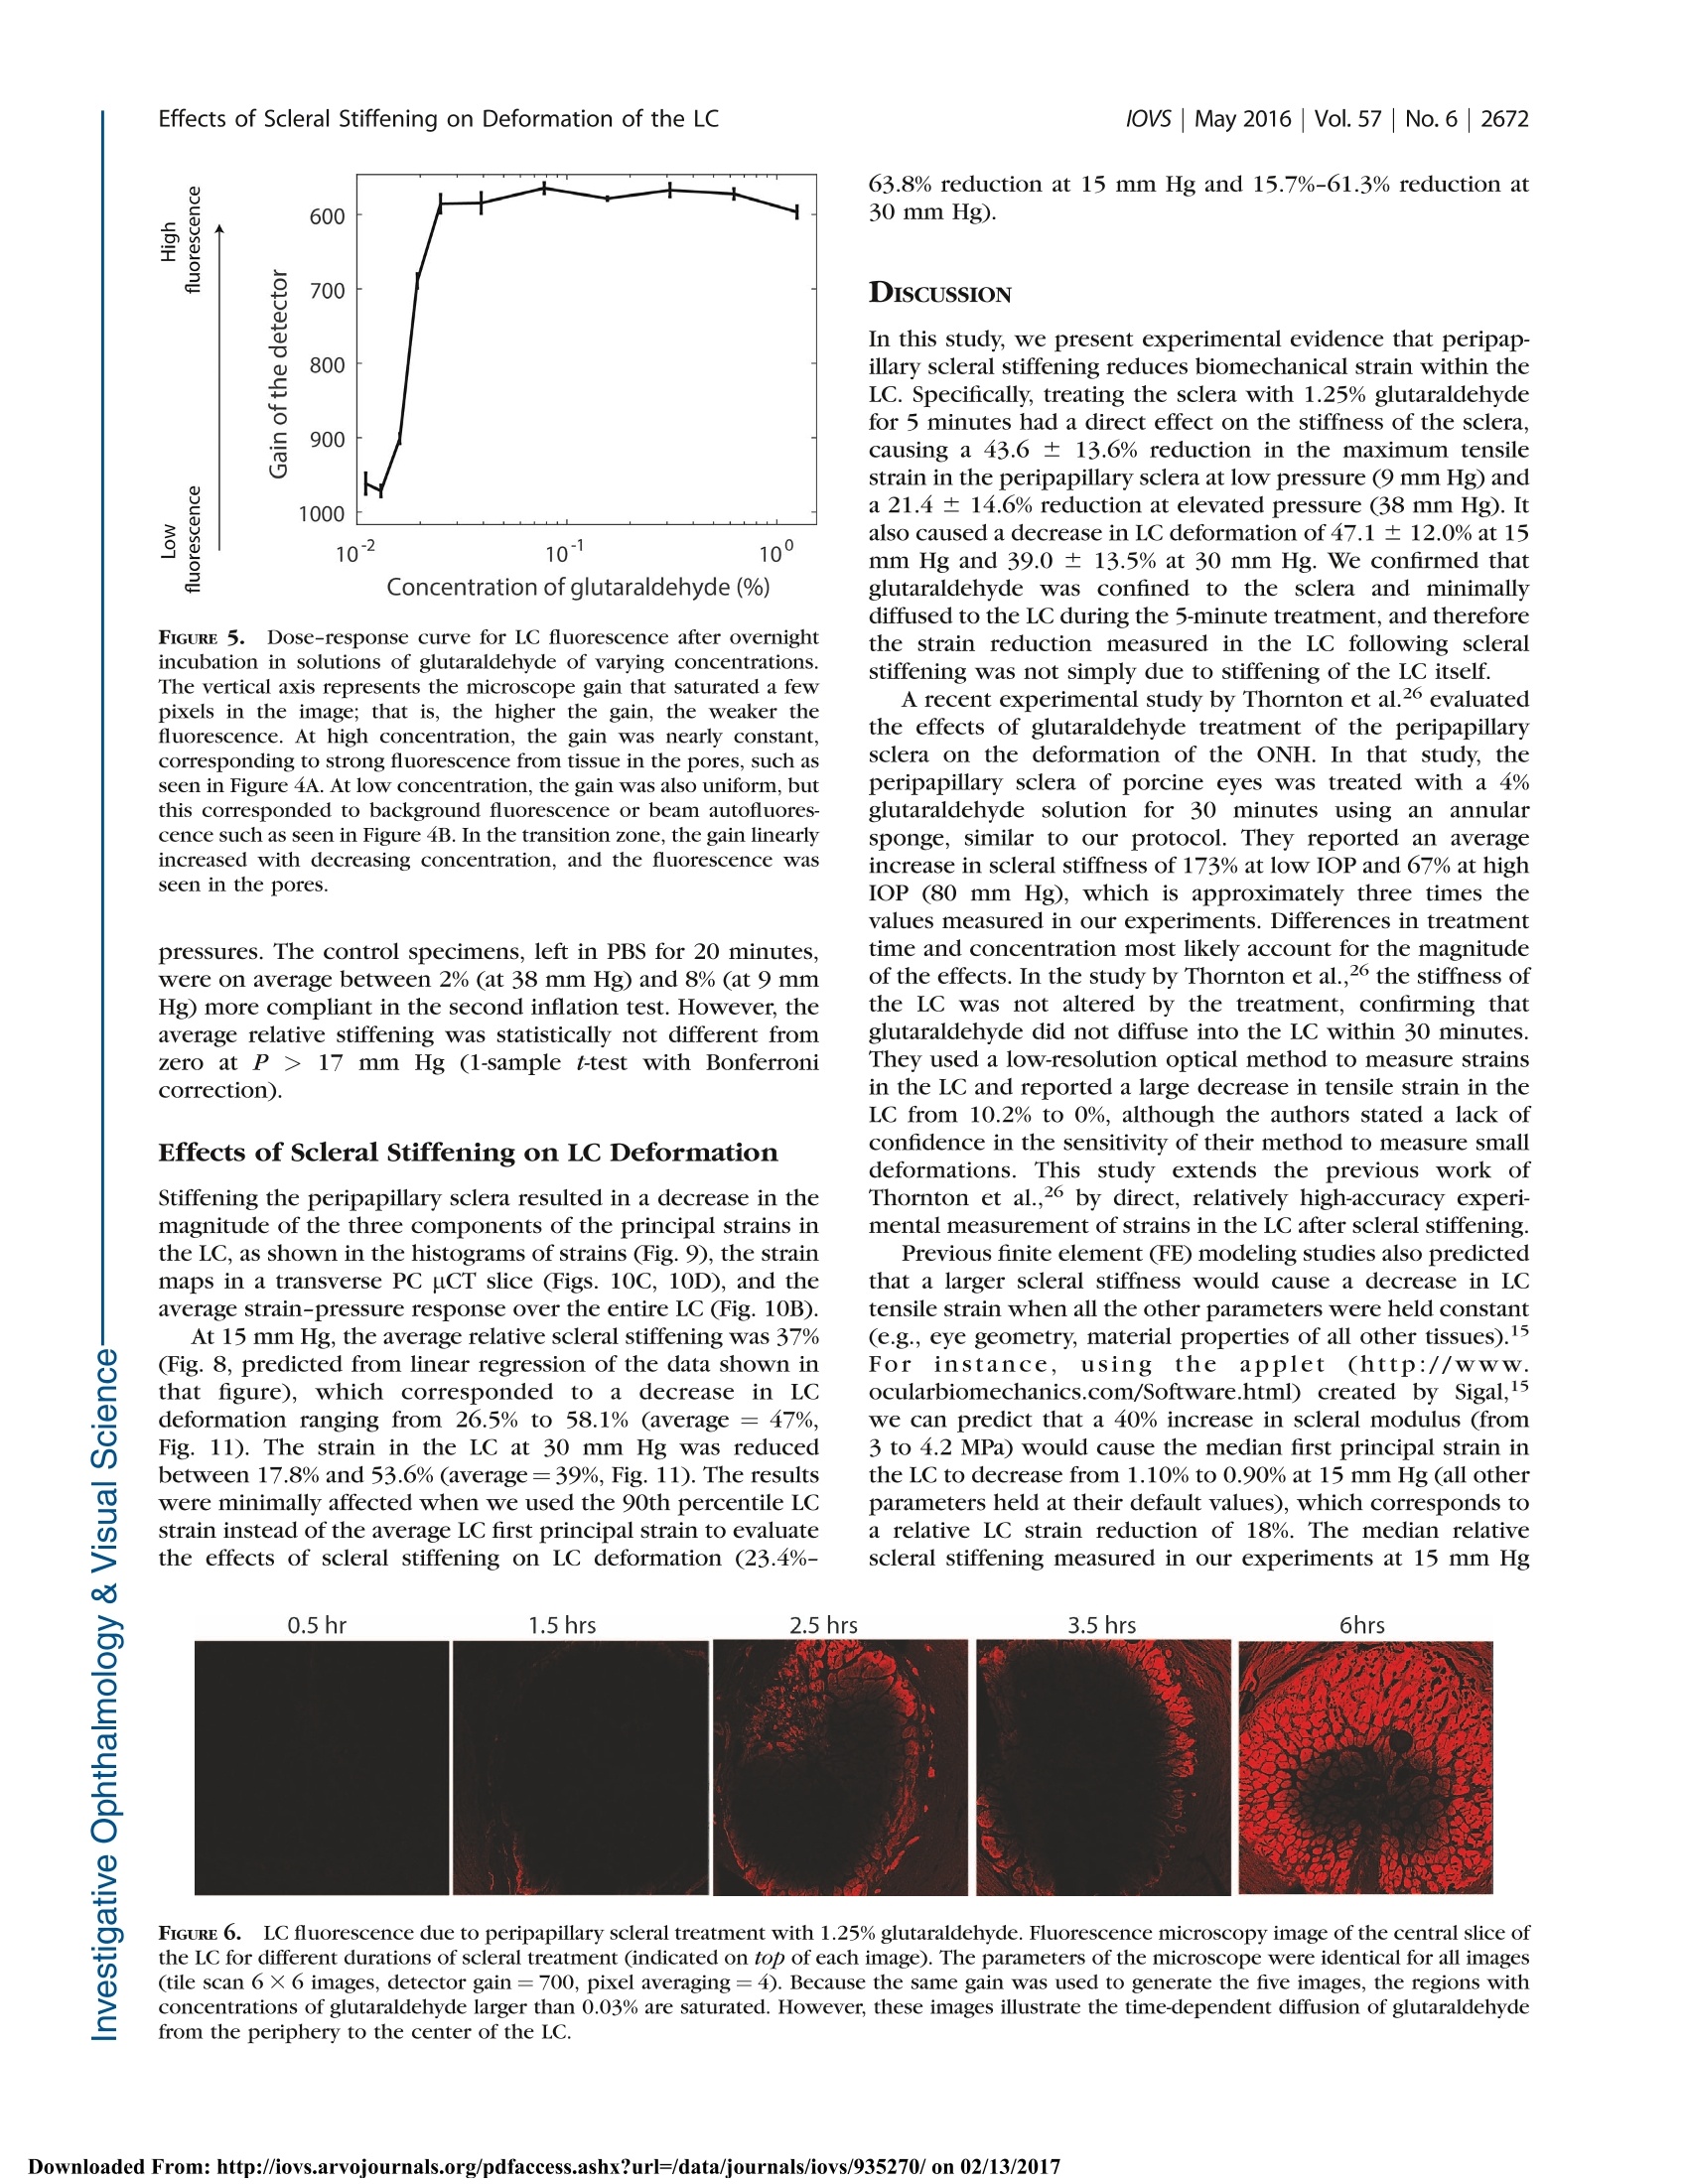
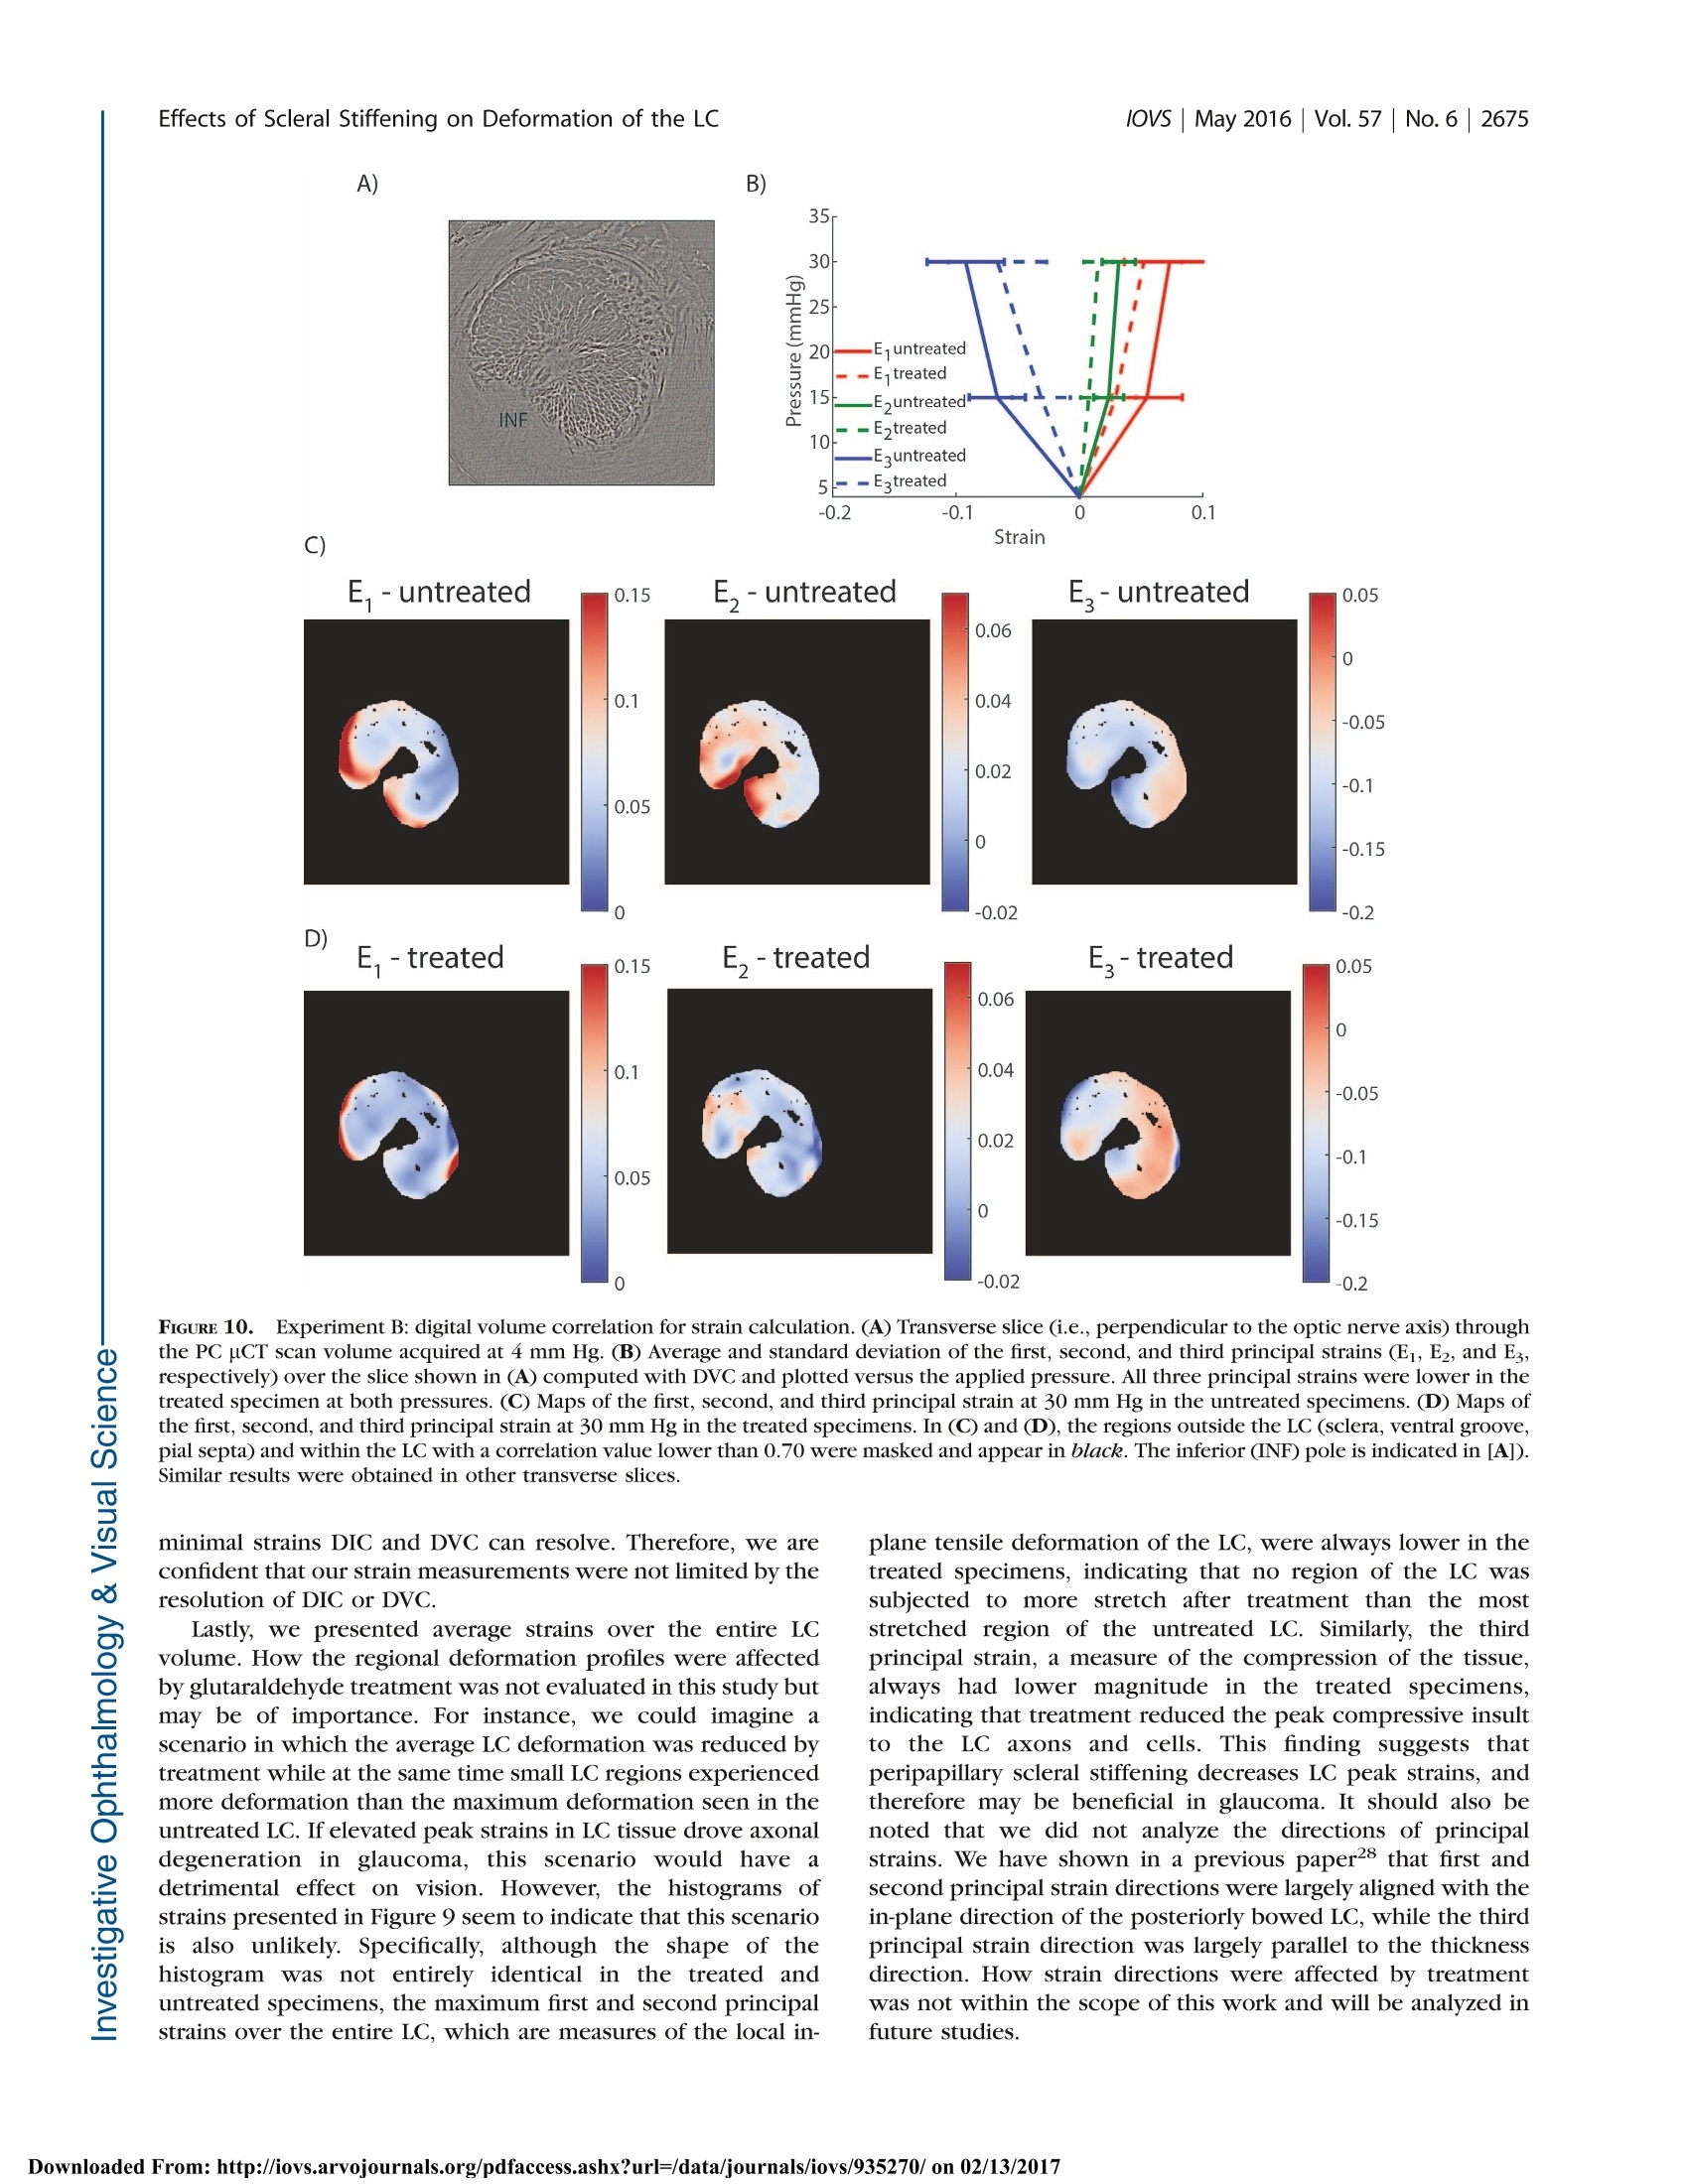
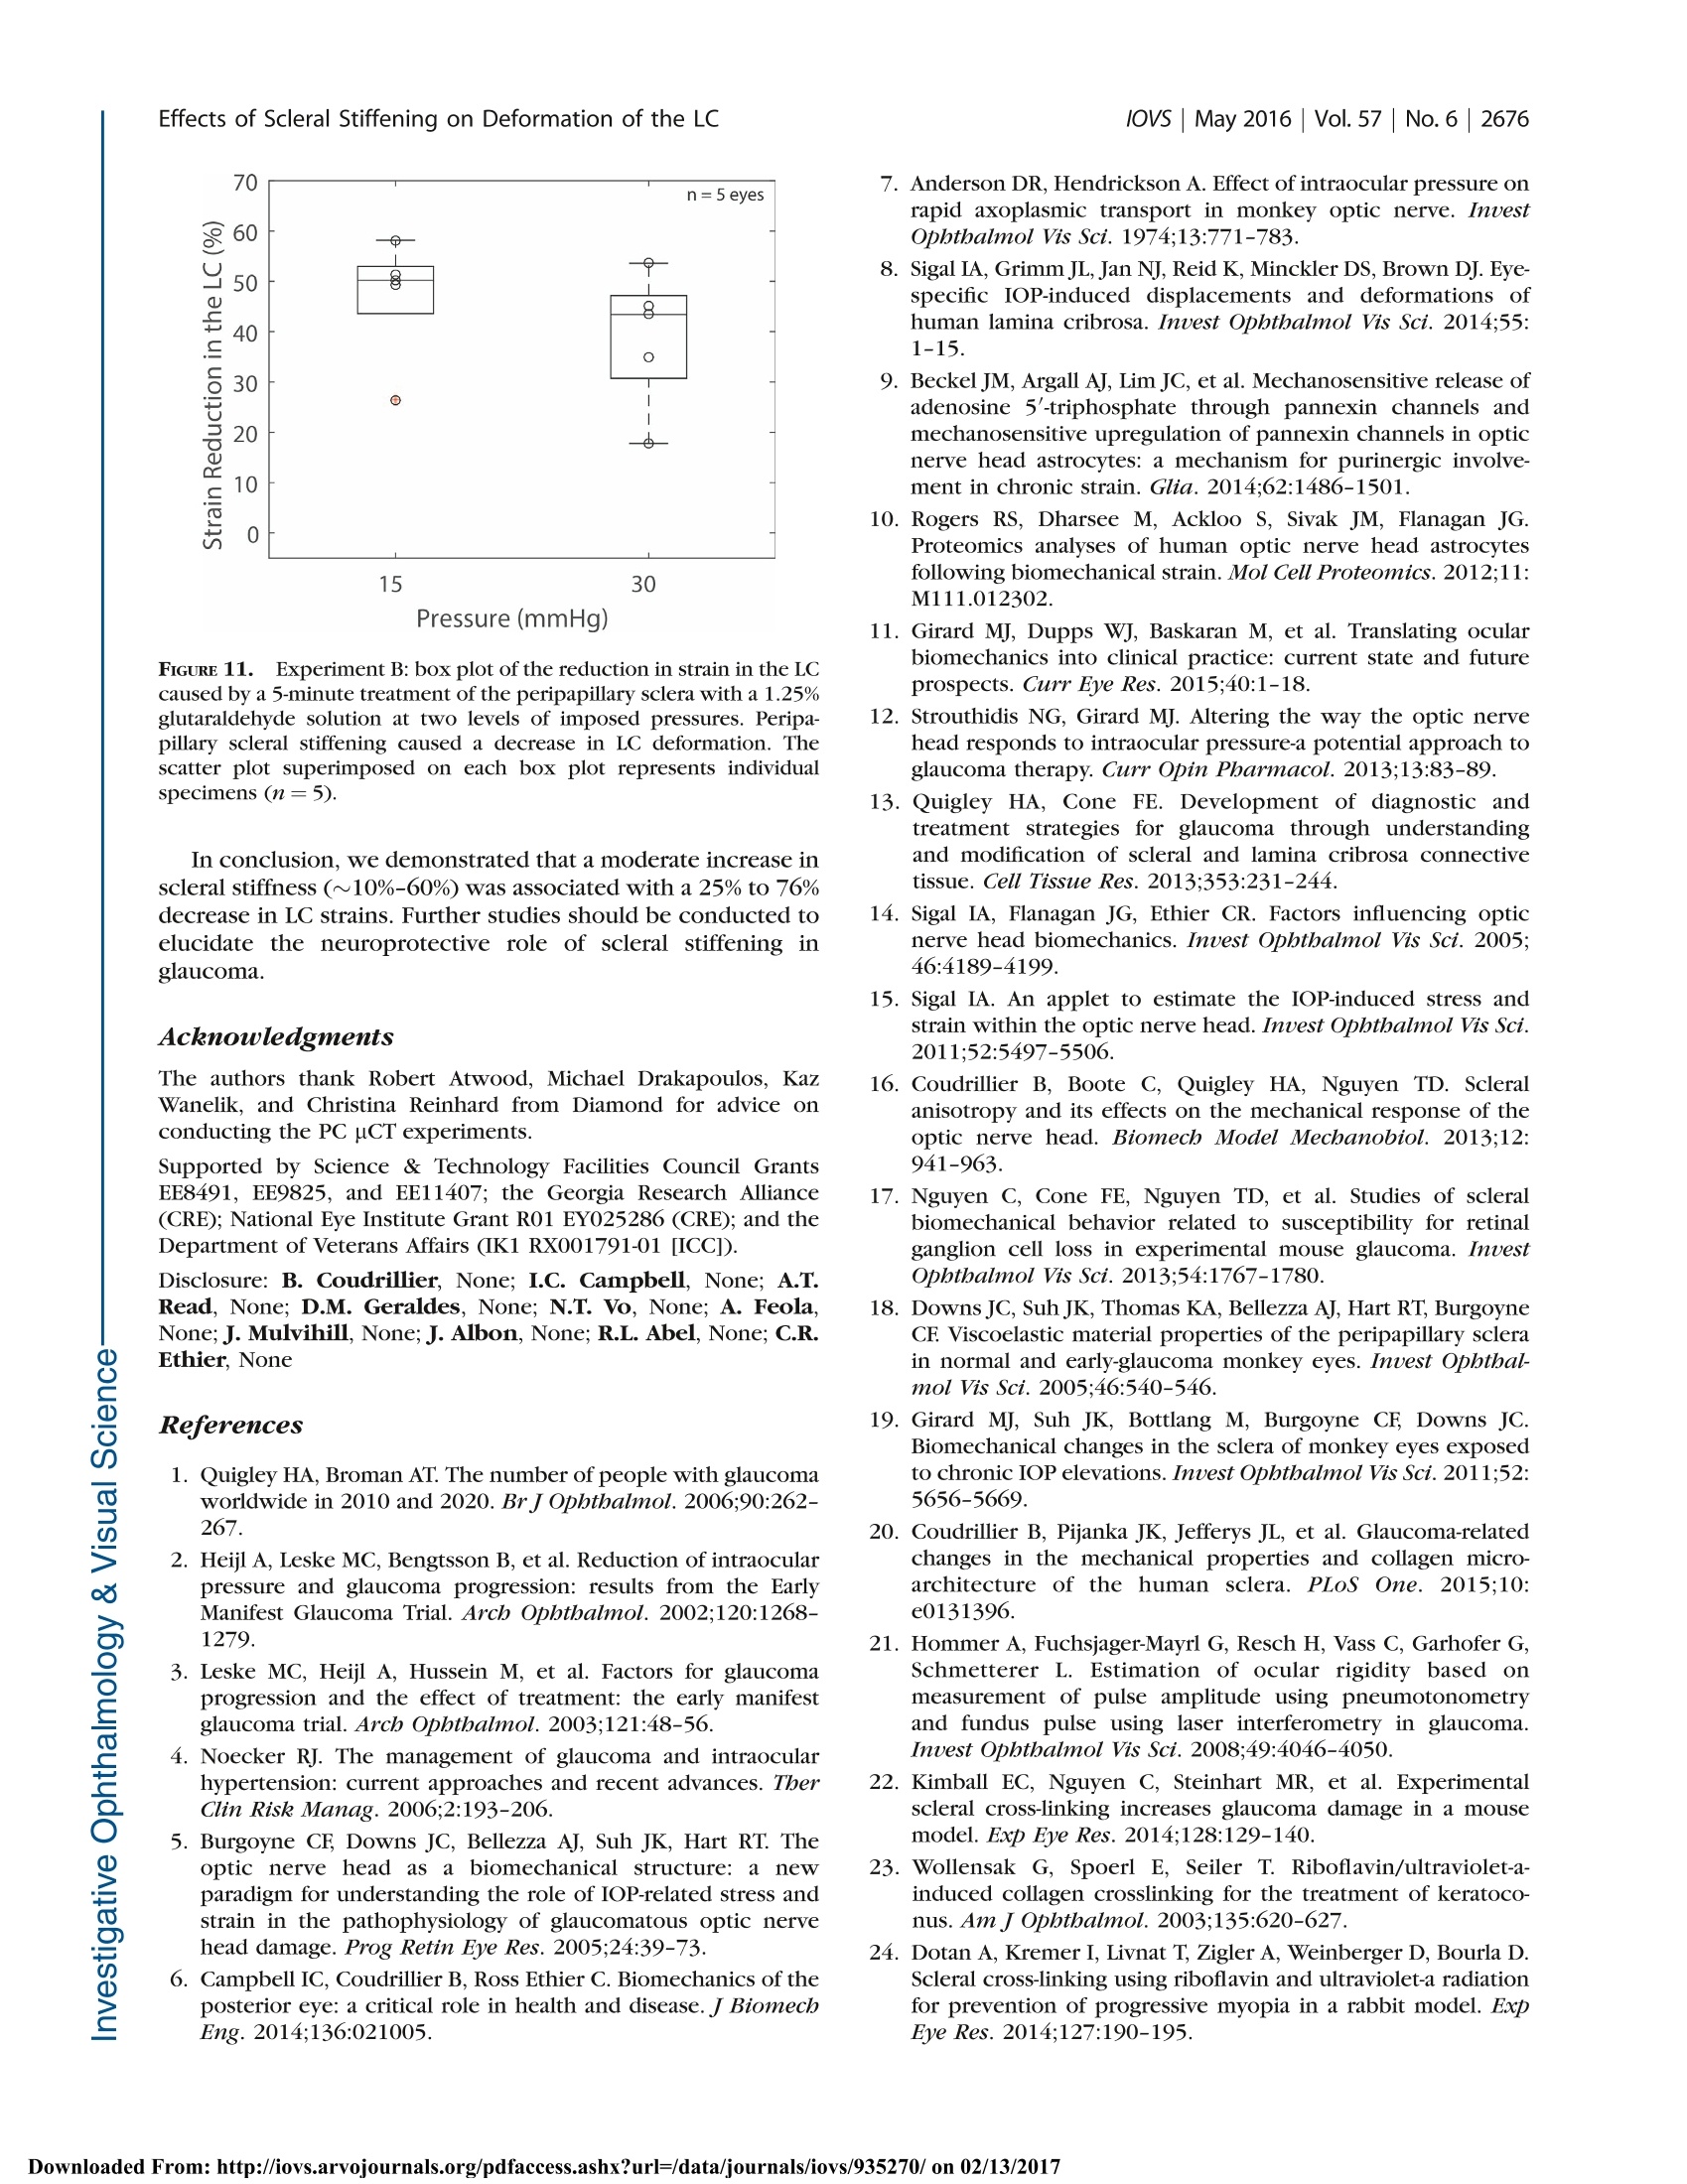
Glaucoma Effects of Scleral Stiffening on Deformation of the LClOVs May 2016|Vol.57|No.6 |2667 Effects of Peripapillary Scleral Stiffening on theDeformation of the Lamina Cribrosa Baptiste Coudrillier, Ian C. Campbell,1,2 A. Thomas Read, Diogo M. Geraldes,Nghia T. Vo,4Andrew Feola, John Mulvihill, Julie Albon,5, Richard L. Abel, and C. Ross Ethier1,2 Wallace H. Coulter Department of Biomedical Engineering, Georgia Institute of Technology and Emory University, Atlanta, Georgia, United States Atlanta VA Medical Center, Decatur, Georgia, United States Biomechanics Group, Department of Mechanical Engineering, Imperial College London, London, United Kingdom*Diamond Light Source, Didcot, United Kingdom 'Optic Nerve Group, School of Optometry and Vision Sciences, Cardiff University, Cardiff, Wales, United Kingdom ‘Cardiff Institute of Tissue Engineering and Repair,Cardiff University, Cardiff, Wales, United Kingdom Department of Surgery and Cancer, Imperial College,London, United Kingdom Correspondence: C. Ross Ethier, 315 Ferst Drive NW, Atlanta, GA 30332, USA; ross.ethier@bme.gatech.edu. Submitted: September 15, 2015 Accepted: April 8, 2016 Citation: Coudrillier B, Campbell IC,Read AT, et al. Effects of peripapillaryscleral stiffening on the deformationof the lamina cribrosa. Invest Opb-thalmol Vis Sci. 2016;57:2666-2677.DOI:10.1167/iovs.15-18193 PURPOSE. Scleral stiffening has been proposed as a treatment for glaucoma to protect thelamina cribrosa (LC) from excessive intraocular pressure-induced deformation. Here weexperimentally evaluated the effects of moderate stiffening of the peripapillary sclera on thedeformation of the LC. METHODS. An annular sponge, saturated with 1.25% glutaraldehyde, was applied to theexternal surface of the peripapillary sclera for 5 minutes to stiffen the sclera. Tissuedeformation was quantified in two groups of porcine eyes, using digital image correlation(DIC) or computed tomography imaging and digital volume correlation (DVC). In group A (n=14), eyes were subjected to inflation testing before and after scleral stiffening. Digital imagecorrelation was used to measure scleral deformation and quantify the magnitude of scleralstiffening. In group B (n =5), the optic nerve head region was imaged using synchrotronradiation phase-contrast microcomputed tomography (PC uCT) at an isotropic spatialresolution of 3.2 um. Digital volume correlation was used to compute the full-field three-dimensional deformation within the LC and evaluate the effects of peripapillary scleral cross-linking on LC biomechanics. RESULTs. On average, scleral treatment with glutaraldehyde caused a 34 ±14% stiffening ofthe peripapillary sclera measured at 17 mm Hg and a 47 ± 12% decrease in the maximumtensile strain in the LC measured at 15 mm Hg. The reduction in LC strains was not due tocross-linking of the LC. CONCLUSIONS. Peripapillary scleral stiffening is effective at reducing the magnitude ofbiomechanical strains within the LC. Its potential and future utilization in glaucoma axonalneuroprotection requires further investigation. Keywords: biomechanics, phase contrast microcomputed tomography, digital imagecorrelation, digital volume correlation laucoma, the second leading cause of irreversible blind-nGessa, affects over 60 million people worldwide. Intraoc-ular pressure (IOP) plays animportant role in thepathophysiology of glaucoma: Elevated IOP is a risk factor forthe disease, and significant, sustained IOP reduction benefitsmost patients.23 All treatments for glaucoma in present clinicaluse attempt to modulate aqueous humor fluid dynamics toreduce IOP. Unfortunately, loss of vision progresses in 25% to45% of patients2,4 despite reduction of IOP. Therefore, there is acritical need to develop new treatments for glaucoma not basedupon the paradigm of lowering IOP. Vision loss in glaucoma is caused by the slow andirreversible loss of retinal ganglion cell axons. Evidencesuggests that biomechanical factors acting on the axons, cells,and extracellular matrix of the optic nerve head (ONH)contribute to this process.5,6 Damage to the axons first occurs in the lamina cribrosa (LC),’which undergoes substantialdeformation, and ONH astrocytes are known to alter theirphenotypic expression when subjected to mechanical in-sults.9,10 These data suggest that reducing the deformationexperienced by ONH tissues may be beneficial for glaucomapatients.11-13 Computer modeling work has shown that a major factorcontrolling the deformation of the LC is the stiffness of thesclera,14,15 especially the stiffness of the peripapillary sclera.16These studies predicted that the LCs of eyes with stiffer scleraswould deform less. Accordingly, altering the biomechanicalproperties of the sclera has been suggested as a potentialapproach to protect individuals with elevated IOP or withcomparatively less stiff scleras from glaucomatous inju-ry.6,11-13 However, it is unclear as to whether a stiffer sclerais in fact neuroprotective. On one hand, eyes from mice with Borders of thetreatment zone FIGURE 1. Scleral stiffening procedure. (A) Schematic representation of the treatment region in the peripapillary sclera. This is a side view of thespecimen,glued on the holder at the limbus, with the optic nerve facing up. Note that the length of the optic nerve is exaggerated in this schematic.Only 1 mm of optic nerve was left in the experiments. The approximate treatment zone is shaded in black and the sponge is represented in gray.The sponge was not pressed onto the scleral surface. (B) Top view of the specimen during treatment, with the annular sponge placed on theperipapillary sclera around the ONH, which is visible in the center. Scleral stiffening was performed when the specimen was mounted on thepressure chamber. The annular sponge was immersed in the 1.25%(vol/vol) glutaraldehyde solution and placed around the optic nerve for 5minutes. (C) Delineation of the treatment region after treatment, as viewed by a camera looking down on the specimen. The cross-linking solutionwas yellow (not visible in this black and white picture), which allowed us to trace the contours of the treatment zone. experimental glaucoma that experienced greater scleralstrains were more prone to axonal damage.7 Further, animalstudies have suggested that natural stiffening of the sclera mayoccur in early glaucoma as a protective response to shield theONH from the mechanical insult caused by long-termexposure to IOP. For example, increased scleral stiffnesswas observed in a mouse model of experimental glaucomausing an inflation test ’and in a monkey model ofexperimental glaucoma using uniaxial relaxation18 andinflation testing.19 A stiffer sclera has also been reported inhumans with glaucoma20,21; however, nonlongitudinal humanstudies cannot determine if these patients had increasedscleral stiffness prior to glaucoma or if it was a response tothe disease. On the other hand, mice with experimentallyinduced glaucoma whose scleras were chemically stiffenedexhibited more axon loss compared to experimental glauco-ma mice whose scleras were left unstiffened.22 Furtherresearch is needed to elucidate the neuroprotective effects,if any, of increased scleral stiffness in glaucoma. An essentialpart of this research is the quantification of how alteringscleral stiffness impacts LC deformation. Stiffening collagen-rich tissues such as the sclera or thecornea can be achieved by treatment with cross-linkingagents. For instance, physical corneal collagen cross-linkingvia ultraviolet (UV)-activated riboflavin treatment is nowcommonly used to prevent the progression of keratoconus,23and scleral cross-linking with riboflavin is currently beingtested in animal models as a treatment for myopia.24Treatment of the sclera with riboflavin/UV or chemical agentssuch as glutaraldehyde or glyceraldehyde resulted in in-creased scleral stiffness as measured with uniaxial tensiletesting.25 A recent study by Thornton et a1.26 showed thattreatment of the peripapillary sclera with glutaraldehydecaused a 3-fold increase in scleral stiffness and a larged:decrease in LC tensile deformation. However, the authorsused relatively low-resolution tools to measure the mechan-ical behavior of the sclera and the LC, and more experimentalstudies are needed to assess the effects of scleral stiffening onLC deformation. Here, we have quantified the effects ofperipapillary scleral stiffening on the three-dimensional (3D)deformation of the LC using high-resolution imaging anddeformation mapping techniques. MATERIALS AND METHODS Overall Approach The overall goal of this study was to estimate the effects ofglutaraldehyde-induced peripapillary scleral stiffening on thedeformation, or “strain” of the LC. Although we do notpropose glutaraldehyde as a viable in vivo stiffening agent dueto biocompatibility limitations, it was suitable for use in thisproof-of-principle study as it is known to produce significantstiffening of collagenous tissues in short time frames.26 Afterverifying that glutaraldehyde delivery was localized to thesclera and did not diffuse into the LC, we quantified the relativescleral stiffening caused by a superficial application of a 1.25%glutaraldehyde solution to the peripapillary sclera. Scleralspecimens were subjected to inflation testing before and afterglutaraldehyde treatment, and peripapillary scleral deformationwas measured with digital image correlation (DIC). We refer tothis study as experiment A in the remainder of the paper. Next,we evaluated the effects of scleral stiffening on deformationwithin the LC. The 3D structure of the LC was imaged atincreasing levels of IOP using phase-contrast microcomputedtomography (PC uCT), and IOP-induced LC strains werecomputed with digital volume correlation (DVC). We refer tothis study as experiment B in the remainder of the paper. Specimen Preparation Porcine eyes, obtained from local slaughterhouses within 24hours of death, were divided into two experimental groups.The first group, consisting of 14 eyes from animals aged 24months (Holifield Farm, Inc., Farmington, GA, USA), was usedin experiment A, conducted at Georgia Institute of Technology,Atlanta, Georgia. The second set consisted of five eyes fromanimals aged 5 months (Elmkirk, London, UK) and was used inexperiment B, conducted at Diamond Light Source synchro-tron (Didcot, UK). All eyes were stored in a moist chamber at4°℃ prior to dissection, which occurred within 72 hours postmortem, within the time frame over which scleral propertiesare known to be preserved.27 Both sets of eyes were preparedusing the protocol described in Coudrillier et a1.28 In brief, theeyes were cleaned of extraorbital fat and muscles, hemisected,and glued with cyanoacrylate at the corneal/scleral limbusonto a resin holder (Fig. 1A). The mounted specimens were FIGURE 2. Schematic representation of the experimental setup usedfor digital image correlation. The sclera was securely attached to aninflation chamber, which was connected to a syringe filled with PBS,the height of which was manually adjusted to control pressure in thechamber. Two cameras imaged the deforming sclera during inflation ata rate of 1 Hz. The inflation chamber was immersed in a PBS bath, notshown in this figure. Note that a relatively long optic nerve was initiallyleft on the eye for this photo. It was cut to a length of approximately 1mm before starting the inflation test to ensure quality correlation in theDIC measurements of the peripapillary scleral deformation.33 then secured onto a pressure chamber (Fig. 2) filled withisotonic phosphate-buffered saline (PBS). Intraocular pressurecould be hydrostatically adjusted by controlling the verticalposition of a PBS-filled reservoir. The mounted eye was thenimmersed in a PBS bath to maintain constant hydration andenvironmental temperature during testing. Eyes were inflatedto 15 mm Hg for 20 minutes to ensure the absence of leaks atthe glued interface between the hemisected eye and the holderbefore starting the scleral or LC deformation measurements.No further preconditioning tests were performed on thePICspecimens.28,29 Scleral Cross-Linking Peripapillary Scleral Treatment. Scleral cross-linkingwas achieved by topical application of a 1.25% (vol/vol)solution of glutaraldehyde (dilution of a25% biological-gradesolution [Electron Microscopy Science, Hatfield, PA, USA] inPBS) fluorescently labeled by addition of fluorescein sodiumsalt (Sigma-Aldrich Corp., St. Louis, MO, USA) to reach a finalconcentration of 0.33 mM. The cross-linking solution had abright yellow color, which allowed us to precisely track theregion of the scleral surface treated with glutaraldehyde andensure that no drops of fixative-containing solution ran downthe scleral surface from the sponge. In more detail, an annularsponge made of synthetic foam was immersed in thisglutaraldehyde solution, blotted on absorbent paper to removeexcess solution that might run down the scleral surface, andplaced on the external surface of the peripapillary sclera for 5minutes, as shown in Figure 1A.26 After treatment, the scleralsurface was immersed in PBS three times to wash the excessglutaraldehyde from the surface. We did not rely on the yellowstain caused by fluorescein to measure lateral diffusion ofglutaraldehyde. This was done in another experiment de-scribed below. Validation of the Cross-Linker Application. Glutaraldehyde, which has a relatively small molecular weight (100.12g.mol), is expected to diffuse through the peripapillary scleraupon application. With enough time, glutaraldehyde coulddiffuse into the LC. From the physics of diffusion, we expectedthat if glutaraldehyde reached the LC, the concentration ofglutaraldehyde would be larger in the LC regions closest to theperipapillary sclera (i.e., the periphery of the LC versus thecenter of the LC), and the concentration of glutaraldehyde inthe LC would increase with time until reaching an equilibriumvalue. It was important to verify that the LC remained unstiffenedafter 5 minutes of scleral exposure to 1.25% glutaraldehyde,since the point of this study was to evaluate the effects ofscleral stiffening alone on LC deformations. The diffusioncoefficients of glutaraldehyde in the sclera and the LC areunknown, and the concentration of glutaraldehyde within theLC after treatment could not be numerically estimated. Thus,we instead used the autofluorescence of tissue fixed withglutaraldehyde as a marker to experimentally determine themaximum concentration of glutaraldehyde, if any, present inthe LC. This was done in the following two steps. Overnight Incubation of LCs in Glutaraldebyde (Step1).In the first step, we determined a “dose-response” curvebetween the glutaraldehyde concentration in the LC and tissueautofluorescence. To do so, we measured the fluorescence ofLCs incubated overnight in solutions with different concentra-tions of glutaraldehyde, with the expectation that overnightincubation would be long enough for the concentration ofglutaraldehyde to have reached an equilibrium value across theLC. Eleven fresh porcine eyes were dissected to isolate theONH region. The retina was gently excised but the choroid wasleft on the specimen. Each specimen was then incubatedovernight in a different concentration of glutaraldehydesolution, varying from 1.25% (stock solution) to 0.01%. Onecontrol specimen was incubated in PBS. We did not usefluorescein in this experiment as fluorescein has a largermolecular mass and would diffuse more slowly within thesclera. Following incubation, all excess glutaraldehyde solutionwas removed by immersion in PBS for 1 hour. The specimenswere then embedded in Tissue-Tek optimal cutting tempera-ture medium (OCT; Sakura Finetek, Torrance, CA, USA) andsnap frozen at -80°C. For each specimen, eighteen 20-um-thickcryosections through the LC were cut on a CryoStar NX70cryostat (Microm International GmbH, Dreieich, Hessen,Germany), three of which were randomly selected per eyeand imaged using a ×10 objective lens on a Zeiss LSM 700-405microscope (Jena, Thuringia, Germany) with 555-nm laserexcitation.The autofluorescence of glutaraldehyde-fixed tissueis maximally excited at 540 nm, with an emission peak at 560nm.30 The confocal pinhole was set to 1 AU (12.3 um), thelaser power set to 2%, the digital offset to 0, and the digital gainset to 4. We expected that the autofluorescence of the LC exposedto glutaraldehyde would depend on the concentration ofglutaraldehyde in the incubation solution. As a measure oftissue autofluorescence for each concentration, we determinedthe maximum detector gain that would saturate a few pixels ofthe brightest optical section of each slice (as seen on thesaturation color map, Zeiss, Zen), and plotted this gain versusglutaraldehyde concentration to obtain a suitable “gain-concentration curve." Scleral Treatment With 1.25% Glutaraldebyde Treatment(Step 2). In the second step, we used the above-determinedcurve to estimate the concentration of glutaraldehyde in the LCcaused by peripapillary scleral stiffening. Our specific goal wasto demonstrate that no glutaraldehyde had reached the LC after 5 minutes of exposure via the sponge on the peripapillaryscleral surface. The peripapillary scleral surface of sevendifferent porcine eyes was treated with 1.25% glutaraldehydefor times varying between 5 minutes and 6 hours following theprotocol shown in Figure 1. For treatment times longer than 1hour, the annular sponge was soaked in glutaraldehyde hourlyto ensure that the supply of cross-linking solution was notdepleted. After treatment, the ONH region was dissected andwashed for 1 hour in PBS. Transverse cryosections of the LCswere prepared and imaged following the protocol described instep 1. In this experiment, diffusion of glutaraldehydeoccursbetween the peripapillary sclera and the LC (initial concentra-tion=0%). Similarly to the procedure in step 1, we measuredthe maximum detector gain that saturated a few pixels of theperipheral and central LC, and used the curve generated instep 1 to estimate the evolution of the concentration ofglutaraldehyde in those regions versus treatment time. Experiment A: Measurement of the Relative ScleralStiffening Digital Image Correlation. Fourteen posterior porcinescleral shells were subjected to inflation testing to measuretheir mechanical behavior in response to elevation of pressure.The scleral shells were mounted on the inflation chambershown in Figure 1. Surface displacement maps of the sclerawere computed using DIC, a technique previously applied tomeasure the deformation of bovine31 and human32 sclera. Priorto testing, the sclera was air brushed with black Indian ink tocreate a contrast pattern for deformation tracking. Twocameras, located approximately 50 cm above the inflationchamber with a 25°stereo angle, acquired pictures of thedeforming sclera at a rate of 1 Hz (Fig. 2). Test image pairs wereanalyzed with a 3D DIC software package (Istra 4D 4.4.1;Dantec Dynamics, Holtsville, NY,USA) to compute full-fielddisplacements of the scleral surface (30.7 um/pixel, facet size=51 pixels, overlap=21 pixels). The DIC software includes acompensation method to correct for optical distortions due tochange in refraction indices at the surface of the PBS bath.Displacements were smoothed using cubic splines (gridreduction factor= 4) before computing the 2D surfaceGreen-Lagrange strain tensor and principal strains with thealgorithm implemented in Istra 4D. The two principal strainsrepresent the maximum and minimum stretches of anelemental scleral surface. The uncertainty in the straincalculation was estimated by taking two sets of stereo imagesof the equilibrated sclera 1 second apart3without varying IOPand correlating the second image set with the first to computedisplacements and strains. In this scenario, we expect thecomputed strains to be uniformly zero. The strain uncertaintywas defined as the standard deviation of the computed firstprincipal strain over the entire peripapillary sclera, defined asthe region spanning a radial distance from 1.5 to 6 mm fromthe center of the ONH. The uncertainty was estimated to be0.5 millistrain. After uncertainty estimation, the specimen (not yet treatedwith glutaraldehyde) was allowed to equilibrate for 20 minutesat 2 mm Hg before beginning the inflation test. The pressurewas increased from 2 to 38.5 mm Hg by steps of 7.3 mm Hg(i.e., 6 steps of 10 cmH2O) and maintained at each pressurestep for 10 seconds. The pressure was then lowered and heldat the baseline pressure of 2 mm Hg. The inflation chamberand specimen were taken out of the PBS bath, and theperipapillary sclera was treated for 5 minutes with 1.25%glutaraldehyde using the protocol shown in Figure 1. Afterthree washes of any excess glutaraldehyde with PBS, the PBSbath was filled with fresh PBS and the inflation test wasrepeated on the treated specimen.Note that the treatment and the washes did not alter the speckling pattern, and that thesame camera calibration and specimen orientation were usedto measure the mechanical behavior of the specimen beforeand after treatment. Scleral Stiffening Quantification. The relative scleralstiffening at pressure step p was calculated as: wheierre entreated and erreated are the first principal strains (i.e.,maximum tensile deformation) averaged over the entireperipapillary sclera at pressure p before and after treatment,respectively.y . 8giunnttreated and grreatedwere computed from thestrain profile obtained in the last stereo images acquired atpressure step p. The specimen had to be taken out of the PBSbath for treatment and therefore was not in the exact sameorientation/location before and after treatment. To preventerror arising from registration of the specimens, we used anaxisymmetric region centered on the optic nerve (ON) forstrain averaging, after manual registration of the center of theON between the treated and untreated scans. The peripapillarysclera was defined as the disc-shaped region lying between 1.5and 6 mm from the ONH center. Material points with poorcorrelation values were not included in the strain average overthis region; however, because we used the same specklingpattern, these regions were nearly identical for the treated anduntreated specimens, so that treated/untreated comparisonswere valid. As a control experiment, we recorded two inflation tests 15minutes apart for six specimens incubated in PBS instead ofglutaraldehyde. We compared the relative stiffening to zero ateach pressure using a 1-sample t-test with a Bonferronicorrection (adjusted P value of 0.01). Experiment B: IOP-Induced Strain in the LC Phase-Contrast Microcomputed Tomography. Theeffects of IOP on the 3D deformation of the LC were measuredwith phase-contrast PC uCT on beamline I12, Joint Engineer-ing, Environment and Processing at Diamond Light Source.34The experimental protocol for PC uCT was described in aprevious publication28 and is briefly summarized here. A highlycoherent x-ray beam was directed toward the ONH region of ahemisected eye mounted on a turntable (Fig. 3). The phaseshift caused by the interaction of the x-rays with the tissues ofthe ONH was transformed into intensity variations andrecorded using a charge-coupled device detector with aneffective voxel size of 3.2 um placed 2 m behind the specimen.We acquired 3600 projections of the ONH region and used anexposure time of 5 ms per projection (total scan time at eachpressure ~90 seconds). The reconstructed scans encompasseda 7-×7-×7-mm’region centered on the LC.35 To reduce thefile size of the image volume used for image processing, theimages were down-sampled by a factor of 2 (Matlab [Math-works, Natick, MA, USA] command imresize). The effectivevoxel size of the down-sampled image volume was 6.4 um.Phase-contrast microcomputed tomography scans were re-corded at three different levels of IOP: 4, 15, and 30 mm Hg.The specimens were equilibrated at each pressure for 15minutes before starting the scan to minimize motion caused bycreep, which would manifest as a smearing artifact and ruinthe scan. After acquiring the scan at 30 mm Hg, the pressurewas lowered and held at the baseline pressure of 4 mm Hg. ThePBS bath was emptied, and the peripapillary sclera was treatedwith 1.25% glutaraldehyde for 5 minutes as indicated in Figure1. The sponge was then removed; excess glutaraldehyde waswashed off; the bath was refilled with fresh PBS; and three PHASE-CONTRAST MICRO-COMPUTED TOMOGRAPHY FIGURE 3. Experimental protocol for PC uCT. The inflation chamber(shown in Fig. 2) was immersed in a PBS bath, and the entire apparatuswas placed on a rotating stage. An x-ray beam, produced bysynchrotron radiation, was directed toward the ONH region. The x-ray detector was placed 2 meters behind the specimen. For PC uCT, afew millimeters of optic nerve were left on the eye. scans at 4, 15, and 30 mm Hg were acquired using the samespecimen. Digital Volume Correlation.The IOP-induced deforma-tion of the LC was computed using DVC, which is a feature-tracking technique similar to DIC except that DVC operates onfull image volumes instead of 2D images of surfaces. Werecently characterized the application of this method to studydeformation of the porcine LC.28 Briefly, the image volumesacquired at 15 and 30 mm Hg were correlated with the imagevolume acquired at 4 mm Hg to compute the six independentcomponents of the spatially varying Green-Lagrange straintensor using the software DaVis 8.1.3 (LaVision, GmbG,Goettingen, Germany). The subvolume size used was 20 ×20 ×20 voxels, with a 75% overlap, which resulted in a strainaccuracy of 20 microstrain.28 DaVis computes the correlationvalue for each subvolume, which is a number between 0 and 1,with 1 corresponding to a perfectly correlated subvolume and0 corresponding to a subvolume that could not be correlated.We used this value as a quality check to remove regions of theLC that were poorly correlated, defined as subvolumes withcorrelation value lower than 0.7.36 The DVC displacementswere imported into Matlab and smoothed using cubic splines(csaps function, smoothing parameter 0.999 for all displace-ment components). The Matlab gradient function was appliedto compute the derivatives of the displacements for the Green-Lagrange strain formulation. The Green-Lagrange strain tensorwas then diagonalized to compute its three principal straincomponents, as well as directions. Those are three mutuallyperpendicular directions of pure extension or contraction. Effects of Scleral Stiffening on the Deformation of theLC. The effects of stiffening the peripapillary sclera on thedeformation of the LC at pressure step p were evaluated usingequation 1, where untreated and erreated were the first princiippalstrains averaged over the entire LC, both computed at pressurep. A voxel selection mask of the LC was manually created foreach of the five specimens used in this study to eliminate thesclera, the prelaminar tissues, and postlaminar tissue fromanalysis. The selection mask was created based on thefollowing criteria. The retina and the peripapillary sclera havelimited natural anatomic features, which resulted in those regions being poorly correlated with DVC. Therefore, theanterior surface of the LC and the scleral canal were easilydetectable on maps of the DVC correlation value. The densityof collagen was slightly lower in the pial septae than in theLC.28 This caused a decrease in the correlation value at theborder between the LC and pial septa, which we used todelineate the posterior boundary of the LC. The same maskwas used for the treated and untreated specimens. This waspossible because the masks were constructed following thesame anatomic features observed in the treated and untreatedspecimens and using the value of the correlation coefficient inthe LC, which depends on tissue density and uCT parameters,both unchanged by treatment. In addition, the specimen wasnot displaced or rotated during treatment. The glutaraldehydewas applied to the specimen while resting on the uCT stage.Therefore, the position and orientation of the LC and its maskwere identical in the treated and untreated specimens at thebaseline pressure. In other words, the strains were averagedover the same volume of LC tissue in the treated and untreatedspecimens. RESULTS Diffusion of Glutaraldehyde Overnight Incubation of LCs in Glutaraldehyde (Step1).Fluorescence due to glutaraldehyde fixation was observedmuch more strongly from tissue within the pores of the LC ascompared to the collagenous beams (Fig. 4A), likely due to thewell-known tendency of neurons to autofluoresce stronglyafter aldehyde fixation.37 Since our goal was simply todetermine if there was any glutaraldehyde reaching the LC,we focused only on the signal from the pores as the mostsensitive measure. At 550 nm, autofluorescence of theuntreated specimen was very weak (i.e., could be observedonly at a very high gain of >900), and was located primarily inthe collagen beams of the LC (Fig. 4B). For each glutaraldehyde bath concentration, it was possibleto determine the optimal detector gain to visualize autofluo-rescence from the LC (Fig. 4). For this optimal gain, only a fewpixels of the image were saturated (Fig. 4A, left). For eachglutaraldehyde concentration, the standard deviation of theoptimal detector gain over the LC was relatively small (Fig.5),suggesting that the glutaraldehyde reached a near-uniformspatial distribution in tissue outside the LC beams afterovernight incubation. We observed three different states offluorescence while developing the gain-concentration curve.At high concentrations of glutaraldehyde(>0.025%), autofluo-rescence was observed only in the pores when the gain was setto a level that saturated a few pixels and the concentration-gain curve was nearly flat. At low glutaraldehyde concentra-tions (<0.013%), the gain had to be set much higher in order tosaturate a few pixels. Here, we did not observe any signalattributed to the glutaraldehyde in the pores; instead, weobserved mostly background fluorescence or autofluorescenceof the collagenous LC beams. At intermediate concentrationsbetween 0.025% (×50) and 0.013% (×96), the required gainexhibited an approximately inverse linear relationship between gain and glutaraldehyde concentration. The minimumglutaraldehyde concentration that caused measurable porefluorescence was between 0.013% and 0.016%. Scleral Treatment With 1.25% Glutaraldehyde Treat-ment (Step 2). No fluorescence was observed in the pores ofthe LC after 5 and 15 minutes of scleral treatment with 1.25%glutaraldehyde. For these short treatment times, only back-ground fluorescence was measured in the LC (detector gain >900 in the periphery and center of the LC), demonstrating that A) Overnight incubation in 0.5% glutaraldehyde B) Overnight incubation in PBS FIGURE 4.。Confocal imaging of the LC treated with glutaraldehyde. (A) Specimen treated with glutaraldehyde for 14 hours. (B) Control specimen,incubated in PBS for 14 hours. For both, the left column is the fluorescence signal, the center column is the transmitted light image showing thebeam/pore structure of the LC (dark/ligbt, respectively), and the rigbt column is the superimposition of the two signals. The fluorescence inglutaraldehyde-treated specimens was localized to the tissue in the pores of the LC. The gain was set to 657 in (A) and to 900 in (B). At high gainssuch as in (B), the beams of the LC autofluoresce. The black regions in the central images are due to pigment, commonly observed in the beams ofthe porcine LC. the concentration of glutaraldehyde within the LC wasuniformly lower than 0.01%. It was only after 30 minutes ofscleral treatment that we detected fluorescence in the pores atthe periphery of the LC, while at this same time point thecentral region of the LC exhibited only background levels offluorescence. With increasing treatment time, glutaraldehydediffused from the scleral canal to the center of the LC (Fig. 6).We determined the gain necessary to saturate a few pixels inthe center and periphery of the LC and used the curve shownin Figure 5 to estimate the corresponding approximateconcentration of glutaraldehyde in those regions at differenttime points. For treatment time shorter than 1.5 hours, theamount of autofluorescence was not different than background(gain above the threshold of 900). Autofluorescence (andhence glutaraldehyde concentration) in the periphery rosebetween 1.5 and 2.5 hours of treatment, while the centerremained at background levels of fluorescence (gain above thethreshold of 900; i.e., concentration < 0.01%) for treatmenttimes of up to 3.5 hours. The concentration of glutaraldehydein the periphery of the LC became greater than 0.03% after 2.5hours. However, it was not possible to estimate the exactconcentration of glutaraldehyde in the periphery of the LC because the gain-concentration curve is nearly constant forconcentrations greater than 0.03% (Fig. 5). After 6 hours oftreatment, the concentration of glutaraldehyde in the center ofthe LC was estimated to be 0.020%(gain =750). In theseexperiments, the specimens were washed in a PBS bath for 1hour, which corresponded to the approximate time needed toperform the mechanical tests. We can safely conclude that aminimal amount of glutaraldehyde diffuses into the LC beforewe finish acquiring scleral and LC deformation measurements. Quantification of Scleral Stiffening Glutaraldehyde treatment of the peripapillary sclera caused adecrease in strain, as illustrated for one representativespecimen in Figures 7A and 7B. The behavior of the porcineperipapillary sclera is nonlinear (Fig. 7C), and the relativestiffening, calculated using equation 1, was a function of theapplied pressure (Fig. 7D). On average, the glutaraldehyde-treated specimens exhibiteda 44% (range, 21%-61%) reduction in first principal strain at 9mm Hg and a 22% (range, 0%-46%) reduction in first principalstrain at 38 mm Hg (Fig.8). For all specimens, the effects ofscleral stiffening on scleral deformation were larger at lower FIGURE 5. Dose-response curve for LC fluorescence after overnightincubation in solutions of glutaraldehyde of varying concentrations.The vertical axis represents the microscope gain that saturated a fewpixels in the image; that is, the higher the gain, the weaker thefluorescence. At high concentration, the gain was nearly constant,corresponding to strong fluorescence from tissue in the pores, such asseen in Figure 4A. At low concentration, the gain was also uniform, butthis corresponded to background fluorescence or beam autofluores-cence such as seen in Figure 4B. In the transition zone, the gain linearlyincreased with decreasing concentration, and the fluorescence wasseen in the pores. pressures. The control specimens, left in PBS for 20 minutes,were on average between 2% (at 38 mm Hg) and 8% (at 9 mmHg) more compliant in the second inflation test. However, theaverage relative stiffening was statistically not different fromzero at P> 17 mm Hg (1-sample t-test with Bonferronicorrection). Effects of Scleral Stiffening on LC Deformation Stiffening the peripapillary sclera resulted in a decrease in themagnitude of the three components of the principal strains inthe LC, as shown in the histograms of strains (Fig.9), the strainmaps in a transverse PC uCT slice (Figs. 10C, 10D), and theaverage strain-pressure response over the entire LC (Fig. 10B). At 15 mm Hg, the average relative scleral stiffening was 37%(Fig. 8, predicted from linear regression of the data shown inthat figure), which corresponded to a decrease in LCdeformation ranging from 26.5% to 58.1% (average = 47%,Fig. 11). The strain in the LC at 30 mm Hg was reducedbetween 17.8% and 53.6% (average=39%, Fig. 11). The resultswere minimally affected when we used the 90th percentile LCstrain instead of the average LC first principal strain to evaluatethe effects of scleral stiffening on LC deformation (23.4%- 63.8% reduction at 15 mm Hg and 15.7%-61.3% reduction at30 mm Hg). DISCUSSION In this study, we present experimental evidence that peripap-illary scleral stiffening reduces biomechanical strain within theLC. Specifically, treating the sclera with 1.25% glutaraldehydefor 5 minutes had a direct effect on the stiffness of the sclera,causing a 43.6±13.6% reduction in the maximum tensilestrain in the peripapillary sclera at low pressure (9 mm Hg) anda 21.4±14.6% reduction at elevated pressure (38 mm Hg). Italso caused a decrease in LC deformation of 47.1 ±12.0% at 15mm Hg and 39.0±13.5% at 30 mm Hg. We confirmed thatglutaraldehyde was confined to the sclera and minimallydiffused to the LC during the 5-minute treatment, and thereforethe strain reduction measured in the LC following scleralstiffening was not simply due to stiffening of the LC itself. A recent experimental study by Thornton et a1.26 evaluatedthe effects of glutaraldehyde treatment of the peripapillarysclera on the deformation of the ONH. In that study, theperipapillary sclera of porcine eyes was treated with a 4%glutaraldehyde solution for 30 minutes using an annularsponge, similar to our protocol. They reported an averageincrease in scleral stiffness of 173% at low IOP and 67% at highIOP (80 mm Hg), which is approximately three times thevalues measured in our experiments. Differences in treatmenttime and concentration most likely account for the magnitudeof the effects. In the study by Thornton et al.,26the stiffness ofthe LC was not altered by the treatment, confirming thatglutaraldehyde did not diffuse into the LC within 30 minutes.They used a low-resolution optical method to measure strainsin the LC and reported a large decrease in tensile strain in theLC from 10.2% to 0%, although the authors stated a lack ofconfidence in the sensitivity of their method to measure smalldeformations. This study extends the previous work ofThornton et a1.,26 by direct, relatively high-accuracy experi-mental measurement of strains in the LC after scleral stiffening. Previous finite element (FE) modeling studies also predictedthat a larger scleral stiffness would cause a decrease in LCtensile strain when all the other parameters were held constant(e.g., eye geometry, material properties of all other tissues).'For instance, using the applet (http://www.ocularbiomechanics.com/Software.html) created by Sigal,we can predict that a 40% increase in scleral modulus (from3 to 4.2 MPa) would cause the median first principal strain inthe LC to decrease from 1.10% to 0.90% at 15 mm Hg (all otherparameters held at their default values), which corresponds toa relative LC strain reduction of 18%.The median relativescleral stiffening measured in our experiments at 15 mm Hg FIGURE 6.)。LC fluorescence due to peripapillary scleral treatment with 1.25% glutaraldehyde.Fluorescence microscopy image of the central slice ofthe LC for different durations of scleral treatment (indicated on top of each image). The parameters of the microscope were identical for all images(tile scan 6 ×6 images, detector gain =700, pixel averaging=4). Because the same gain was used to generate the five images, the regions withconcentrations of glutaraldehyde larger than 0.03% are saturated. However, these images illustrate the time-dependent diffusion of glutaraldehydefrom the periphery to the center of the LC. A) B) UNTREATED FIGURE 7.. Experiment A: Glutaraldehyde treatment of the sclera caused a pressure-dependent decrease in the magnitude of the peripapillary scleraldeformation, illustrated here for one specimen. (A) Map of the first principal strain (maximum tensile deformation) determined at 38 mm Hg beforetreatment. (B) Map of the first principal strain determined at the same pressure after treatment. In (A) and (B), the two circles (r=1.5 mm and r=6mm) delineate the inner and outer contours of the peripapillary scleral region where strains were averaged to estimate the relative scleral stiffening.(C) Pressure versus averaged first principal strain before treatment (gray) and after treatment (black), quantifying the reduction in first principalstrain caused by glutaraldehyde treatment at each pressure step. The error bars represent the standard deviation of the first principal strain over theentire peripapillary sclera region.(D) The relative scleral stiffening for this specimen was calculated using equation 1 and is plotted as a function ofthe applied pressure. The calculation of the relative stiffening is illustrated at 38 mm Hg (dashed lines). FIGURE 8. Experiment A: box plot of the relative scleral stiffeningcaused by a 5-minute treatment of the peripapillary sclera with a 1.25%glutaraldehyde solution. Scleral stiffening was calculated at five levelsof IOPs between 9 and 38 mm Hg using equation 1. The scatter plotsuperimposed on each box plot represents individual specimens (n=14). The solid line and the dasbed lines represent the average andaverage ± standard deviation of the relative stiffening calculated for sixspecimens left in PBS (i.e., not subjected to glutaraldehyde treatment ofthe peripapillary sclera). For those specimens, the average relativestiffening was not different from zero at P > 17 mm Hg (adjusted Pvalue >0.01). The average stiffening was always significantly differentfrom zero for the treated specimens (adjusted P value <0.001). (~40%) was associated with a LC strain reduction of 26.5% to58.1%, which is slightly larger than what was predicted by theFE models. Differences in geometry (porcine eye versushuman), material behavior (nonlinear for the porcine eyeversus linear for the human eye), or eye stiffness (LC strains inthe order of 3% to 5% for the porcine eye and 1% for the humaneye at 15 mm Hg) may account for the observed differences. Although our findings demonstrate that stiffening theperipapillary sclera reduces the IOP-induced mechanicalstrains in the LC, it remains to be shown that scleral stiffeningis neuroprotective in glaucoma. Glaucoma is a multifactorialdisease, in which a combination of mechanical, vascular, andbiochemical events occur simultaneously. We postulate thatshielding the LC from excessive deformation will decrease themagnitude of mechanical events such as the direct mechanicalinsults to the axons or the mechanosensitive activation ofastrocytes. However, it may also have detrimental effects onblood flow or phenotypic expression of other cell types. Infact, a recent study by Kimball et a1.22 reported increasedaxonal loss in mice with induced ocular hypertension whosesclera had been stiffened with glyceraldehyde. In that study,the entire globe was exposed to three injections of glyceral-dehyde, which caused an average relative scleral stiffening of50% at 15 mm Hg and 55% at 30 mm Hg. We suggest thatconstraining the treatment zone to the peripapillary sclera andusing a relatively low concentration of the stiffening solutionmay decrease the magnitude of the mechanical events withoutaltering the vascular or biochemical response of the ONH.Further computational modeling and animal studies controllingthe extent of the treatment zone and the magnitude of thestiffening will be important to elucidate the neuroprotectiverole of increased scleral stiffness in glaucoma. FIGURE 9.0.Experiment B: LC principal strain histograms at 15 mm Hg before and after scleral stiffening for the five specimens of this study. Strainswere computed with digital volume correlation (with respect to the reference configuration at 4 mm Hg). The vertical axis of each histogram is thetotal volume of LC tissue subjected to a given strain level. Note that the y-axis scale is different between specimens, due to subject-to-subjectvariations in LC size. All principal strain histograms were shifted toward zero after scleral treatment with glutaraldehyde, indicating a reduction indeformation of the tissue of the LC after scleral stiffening. Several limitations should be considered when interpretingthe results of this study. The results of experiments A and B arenot directly comparable. We did not use the same eyes tomeasure the effects of glutaraldehyde treatment on scleralstiffness (experiment A) and on LC deformation (experimentB) because the two experiments were not performed in thesame location. The age of the animals differed between the twoexperiments (24 vs. 5 months old), which may have affectedthe magnitude of the strains measured. Experimental studieshave shown that the sclera becomes stiffer with age.38,39 Theeyes of the young animals used for measuring LC deformationwere smaller, and it is possible that a larger proportion of thesclera was stiffened in this experiment. This may explain whywe observed a larger strain reduction in the LC than in thesclera. The diffusion experiments were performed using eyesof older animals. Younger animals were smaller and probablyhad a thinner sclera. Assuming that the concentration ofglutaraldehyde follows the classical unsteady diffusion equa-tion, the concentration of delivered glutaraldehyde would belarger in the sclera of younger eyes with thinner scleras. Forexample, the same concentration would be observed in an eyeof scleral thickness Tat time t as in an eye of thickness Y Tattime l4 t. Since we did not observe fluorescence at 20 minutesin the older eye, we conclude that the concentration ofglutaraldehyde in the young sclera was also low at 5 minutes.Further, the pressure loading regimens were different betweenexperiments A and B. In experiment A, we measured theinstantaneous response of the sclera (quasi-continuous pres-sure increase). In experiment B, we measured the equilibriumresponse of the LC as the pressure was maintained for 15minutes before deformation measurements to prevent motionartifacts in the scans. Second, glutaraldehyde is cytotoxic. Other biocompatibleagents should be tested for their efficiency to cross-link scleralcollagen. We chose glutaraldehyde because it was shown to bethe most efficient and fastest chemical to stiffen the porcineand human sclera.25 Our PC uCT method relies on access to asynchrotron light source, which is necessarily limited by highfacility cost and demand. Fast stiffening of the sclera allowed usto increase the number of experiments we could performduring our time-limited visit to the Diamond Light Source. Incollagen-rich tissues such as the sclera, the mechanicalresponse at low pressure is dominated by the response ofthe proteoglycan-rich matrix, while the crimped (wavy)collagen fibers have a lesser contribution to the tissue stressresponse. As pressure increases, collagen fibers uncrimp andprogressively carry more load, which causes the sclera toexhibit a typical stiffening response as shown in Figure 7C. Ourfindings showed that the relative stiffening was larger at lowpressures (Fig.8), suggesting that glutaraldehyde treatment hasa greater effect on the material properties of the matrix than onthe material properties of the collagen fibers. We note that theaqueous glutaraldehyde at room temperature could havevaporized and cross-linked regions of the sclera or the ONthat we did not intend to cross-link.40 However, the effectswould be minimal in the LC, which is not exposed to air. Wealso expect vapor fixation to have had a negligible effect on theoverall stiffness of the p)oOsSterior sclera due to the shorttreatment time of 5 minutes. Digital image correlation and DVC are subject to similarlimitations in their ability to resolve small deformation, asdiscussed in Coudrillier et a1.28,32 The deformation in thetreated porcine peripapillary sclera varied between 1% and 3%,and the deformation in the treated LC varied between 2% and5%, which is at least two orders of magnitude larger than the FIGURE 10.Experiment B: digital volume correlation for strain calculation. (A) Transverse slice (i.e.,perpendicular to the optic nerve axis) throughthe PC uCT scan volume acquired at 4 mm Hg. (B) Average and standard deviation of the first, second, and third principal strains (E1, E2, and E3,respectively) over the slice shown in (A) computed with DVC and plotted versus the applied pressure. All three principal strains were lower in thetreated specimen at both pressures. (C) Maps of the first, second, and third principal strain at 30 mm Hg in the untreated specimens. (D) Maps ofthe first, second, and third principal strain at 30 mm Hg in the treated specimens. In (C) and (D), the regions outside the LC (sclera,ventral groove,pial septa) and within the LC with a correlation value lower than 0.70 were masked and appear in black. The inferior (INF) pole is indicated in [A]).Similar results were obtained in other transverse slices. minimal strains DIC and DVC can resolve. Therefore, we areconfident that our strain measurements were not limited by theresolution of DIC or DVC. Lastly, we presented average strains over the entire LCvolume. How the regional deformation profiles were affectedby glutaraldehyde treatment was not evaluated in this study butmay be of importance. For instance, we could imagine ascenario in which the average LC deformation was reduced bytreatment while at the same time small LC regions experiencedmore deformation than the maximum deformation seen in theuntreated LC. If elevated peak strains in LC tissue drove axonaldegeneration in glaucoma, this scenario would have adetrimental effect on vision. However, the histograms ofstrains presented in Figure 9 seem to indicate that this scenariois also unlikely. Specifically, although the shape of thehistogram was not entirely identical in the treated anduntreated specimens, the maximum frst and second principalstrains over the entire LC, which are measures of the local in- plane tensile deformation of the LC, were always lower in thetreated specimens, indicating that no region of the LC wassubjected to more stretch after treatment than the moststretched region of the untreated LC. Similarly, the thirdprincipal strain, a measure of the compression of the tissue,always had lower magnitude in the treated specimens,indicating that treatment reduced the peak compressive insultto the LC axons and cells. This finding suggests thatperipapillary scleral stiffening decreases LC peak strains, andtherefore may be beneficial in glaucoma. It should also benoted that we did not analyze the directions of principalstrains. We have shown in a previous paper28 that first andsecond principal strain directions were largely aligned with thein-plane direction of the posteriorly bowed LC, while the thirdprincipal strain direction was largely parallel to the thicknessdirection. How strain directions were affected by treatmentwas not within the scope of this work and will be analyzed infuture studies. Pressure (mmHg) FIGURE 11. Experiment B: box plot of the reduction in strain in the LCcaused by a 5-minute treatment of the peripapillary sclera with a 1.25%glutaraldehyde solution at two levels of imposed pressures. Peripa-pillary scleral stiffening caused a decrease in LC deformation. Thescatter plot superimposed on each box plot represents individualspecimens (n=5). In conclusion, we demonstrated that a moderate increase inscleral stiffness (~10%-60%) was associated with a 25% to 76%decrease in LC strains. Further studies should be conducted toelucidate the neuroprotective role of scleral stiffening inglaucoma. Acknowledgments The authors thank Robert Atwood, Michael Drakapoulos, KazWanelik, and Christina Reinhard from Diamond for advice onconducting the PC uCT experiments. Supported by Science & Technology Facilities Council GrantsEE8491, EE9825, and EE11407; the Georgia Research Alliance(CRE); National Eye Institute Grant R01 EY025286 (CRE); and theDepartment of Veterans Affairs (IK1 RX001791-01[ICC]). Disclosure: B. Coudrillier, None; I.C. Campbell, None; A.T.Read, None; D.M. Geraldes, None; N.T. Vo, None; A. Feola,None;J. Mulvihill, None; J. Albon, None; R.L. Abel, None; C.R.Ethier, None References 1. Quigley HA, Broman AT. The number of people with glaucomaworldwide in 2010 and 2020. Br J Opbtbalmol.2006;90:262-267. 2. Heijl A, Leske MC, Bengtsson B, et al. Reduction of intraocularpressure and glaucoma progression: results from the EarlyManifest Glaucoma Trial. Arch Opbthalmol. 2002;120:1268-1279. 3. Leske MC, Heijl A, Hussein M, et al. Factors for glaucomaprogression and the effect of treatment: the early manifestglaucoma trial. Arch Opbtbalmol. 2003;121:48-56. 4. Noecker RJ. The management of glaucoma and intraocularhypertension: current approaches and recent advances. TberClin Risk Manag. 2006;2:193-206. 5. Burgoyne CF Downs JC, Bellezza AJ, Suh JK, Hart RT. Theoptic nerve head as a biomechanical structure: a newparadigm for understanding the role of IOP-related stress andstrain in the pathophysiology of glaucomatous optic nervehead damage. Prog Retin Eye Res. 2005;24:39-73. 6. Campbell IC, Coudrillier B, Ross Ethier C. Biomechanics of theposterior eye: a critical role in health and disease. J BiomecbEng. 2014;136:021005. 7. Anderson DR, Hendrickson A. Effect of intraocular pressure onrapid axoplasmic transport in monkey optic nerve. InvestOpbthalmol Vis Sci. 1974;13:771-783. 8. SiSgal IA, Grimm JL,Jan NJ, Reid K, Minckler DS, Brown DJ.Eye-specific IOP-induced displacements and deformations ofhuman lamina cribrosa. Invest Opbthalmol Vis Sci. 2014;55:1-15. 9. Beckel JM, Argall AJ, Lim JC, et al. Mechanosensitive release ofadenosine 5'-triphosphate through pannexin channels andmechanosensitive upregulation of pannexin channels in opticnerve head astrocytes: a mechanism for purinergic involve-ment in chronic strain. Glia. 2014;62:1486-1501. 10. Rogers RS, Dharsee M, Ackloo S, Sivak JM, Flanagan JG.Proteomics analyses of human optic nerve head astrocytesfollowing biomechanical strain. Mol Cell Proteomics. 2012;11:M111.012302. 11. Girard MJ, Dupps WJ, Baskaran M, et al. Translating ocularbiomechanics into clinical practice: current state and futureprospects. Curr Eye Res. 2015;40:1-18. 12. Strouthidis NG, Girard MJ. Altering the way the optic nervehead responds to intraocular pressure-a potential approach toglaucoma therapy. Curr Opin Pharmacol. 2013;13:83-89. 13. Quigley HA, Cone FE. Development of diagnostic andtreatment strategies for glaucoma through understandingand modification of scleral and lamina cribrosa connectivetissue. Cell Tissue Res. 2013;353:231-244. 14. Sigal IA, Flanagan JG, Ethier CR. Factors influencing opticnerve head biomechanics. Invest Opbtbalmol Vis Sci. 2005;46:4189-4199. 15. Sigal IA. An applet to estimate the IOP-induced stress andstrain within the optic nerve head. Invest Opbthalmol Vis Sci.2011;52:5497-5506. 16. Coudrillier B, Boote C, Quigley HA, Nguyen TD. Scleralanisotropy and its effects on the mechanical response of theoptic nerve head. Biomech Model Mechanobiol.2013;12:941-963. 17. Nguyen C, Cone FE, Nguyen TD, et al. Studies of scleralbiomechanical behavior related to susceptibility for retinalganglion cell loss in experimental mouse glaucoma. InvestOpbtbalmol Vis Sci. 2013;54:1767-1780. 18. Downs JC, Suh JK, Thomas KA, Bellezza AJ, Hart RT, BurgoyneCF Viscoelastic material properties of the peripapillary sclerain normal and early-glaucoma monkey eyes. Invest Opbthal-mol Vis Sci. 2005;46:540-546. ( 19. Girar d MJ , Suh JK , Bottlang M , Burgoyn e CE Downs J C.Biomechanical changes i n the sclera of monkey eyes exposed to chronic IOP elevations. Invest Ophtbalmol Vis Sci. 2011;52: 5656-5669. ) 20. Coudrillier B, Pijanka JK, Jefferys JL, et al. Glaucoma-relatedchanges in the mechanical properties and collagen micro-architecture of the human sclera. PLoS One.2015;10:e0131396. 21. Hommer A, Fuchsjager-Mayrl G, Resch H, Vass C, Garhofer G,Schmetterer L. Estimation of ocular rigidity based onmeasurement of pulse amplitude using pneumotonometryand fundus pulse using laser interferometry in glaucoma.Invest Opbtbalmol Vis Sci. 2008;49:4046-4050. 22. Kimball EC, Nguyen C, Steinhart MR, et al. Experimentalscleral cross-linking increases glaucoma damage in a mousemodel. Exp Eye Res. 2014;128:129-140. 23W.ollensak G, Spoerl E, Seiler T. Riboflavin/ultraviolet-a-induced collagen crosslinking for the treatment of keratoco-nus. Am J Opbthalmol. 2003;135:620-627. 24. Dotan A, Kremer I, Livnat T,Zigler A, Weinberger D, Bourla D.Scleral cross-linking using riboflavin and ultraviolet-a radiationfor prevention of progressive myopia in a rabbit model. ExpEye Res. 2014;127:190-195. 25. Wollensak G, Spoerl E. Collagen crosslinking of human andporcine sclera. J Cataract Refract Surg. 2004;30:689-695. 26. Thornton IL, Dupps WJ, Roy AS, Krueger RR. Biomechanicaleffects of intraocular pressure elevation on optic nerve/laminacribrosa before and after peripapillary scleral collagen cross-linking. Invest Opbtbalmol Vis Sci. 2009;50:1227-1233. 27. Girard M, Suh JK, Hart RT, Burgoyne CF Downs JC. Effects ofstorage time on the mechanical properties of rabbit peripap-illary sclera after enucleation. Curr Eye Res. 2007;32:465-470. 28. Coudrillier B, Geraldes D, Vo N, et al. Phase-contrast micro-computed tomography measurements of the intraocularpressure-induced deformation of the porcine lamina cribrosa.IEEE Trans Med Imaging. 2015;35:988-999. 29. Tonge TK, Murienne BJ, Coudrillier B, Alexander S, RothkopfW, Nguyen TD. Minimal preconditioning effects observed forinflation tests of planar tissues. J Biomecb Eng. 2013;135:114502. 30. Collins JS, Goldsmith TH. Spectral properties of fluorescenceinduced by glutaraldehyde fixation. J Histochem Cytocbem.1981;29:411-414. 31. Myers KM, Coudrillier B, Boyce BL, Nguyen TD. The inflationresponse of the posterior bovine sclera. Acta Biomater. 2010;6:4327-4335. 32. Coudrillier B, Tian J, Alexander S, Myers KM, Quigley HA,Nguyen TD. Biomechanics of the human posterior sclera: age-and glaucoma-related changes measured using inflationtesting. Invest Ophthalmol Vis Sci. 2012;53:1714-1728. 33. Pyne JD, Genovese K, Casaletto L, Vande Geest JP. Sequential-digital image correlation for mapping human posterior scleraand optic nerve head deformation. J Biomech Eng. 2014;136:021002. 34. Atwood RC, Bodey AJ, Price SW, Basham M, Drakopoulos M. Ahigh-throughput system for high-quality tomographic recon-struction of large datasets at Diamond Light Source. PhilosTrans A Math Pbys Eng Sci. 2015;373:20140398. 35. Vo NT, Drakopoulos M, Atwood RC, Reinhard C. Reliablemethod for calculating the center of rotation in parallel-beamtomography.Opt Express. 2014;22:19078-19086. 36. Sukjamsri C, Geraldes DM, Gregory T, et al. Digital volumecorrelation and micro-CT: an in-vitro technique for measuringfull-field interface micromotion around polyethylene implants.J Biomech. 2015;48:3447-3454. 37. Diez-Fraile A, Van Hecke N, Guerin CJ, D’Herde K. Optimizingmultiple immunostaining of neural tissue. In: Dehghani H, ed.Applications of Immunocytocbemistry.InTech; 2012:345-442. 38. Coudrillier B, Pijanka J, Jefferys J, et al. Collagen structure andmechanical properties of the human sclera: analysis for theeffects of age.J Biomecb Eng. 2015;137:041006. 39. Girard MJ, Suh JK, Bottlang M, Burgoyne CF Downs JC. Scleralbiomechanics in the aging monkey eye. Invest OpbtbalmolVis Sci. 2009;50:5226-5237. 40. Zhang Y, Venugopal J, Huang Z-M, Lim C, Ramakrishna S.Crosslinking of the electrospun gelatin nanofibers. Polymer.2006;47:2911-2917. his work is licensed under a Creative Commons Attribution-NonCommercial-NoDerivatives . International License.Downloaded From: http://iovs.arvojournals.org/pdfaccess.ashx?url=/data/journals/iovs/ on Downloaded From: http://iovs.arvojournals.org/pdfaccess.ashx?url=/data/journals/iovs/ on An annular sponge, saturated with 1.25% glutaraldehyde, was applied to theexternal surface of the peripapillary sclera for 5 minutes to stiffen the sclera. Tissuedeformation was quantified in two groups of porcine eyes, using digital image correlation(DIC) or computed tomography imaging and digital volume correlation (DVC). In group A (n¼ 14), eyes were subjected to inflation testing before and after scleral stiffening. Digital imagecorrelation was used to measure scleral deformation and quantify the magnitude of scleralstiffening. In group B (n ¼ 5), the optic nerve head region was imaged using synchrotronradiation phase-contrast microcomputed tomography (PC lCT) at an isotropic spatialresolution of 3.2 lm. Digital volume correlation was used to compute the full-field threedimensionaldeformation within the LC and evaluate the effects of peripapillary scleral crosslinkingon LC biomechanics.
确定


还剩10页未读,是否继续阅读?

产品配置单

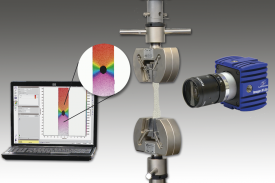
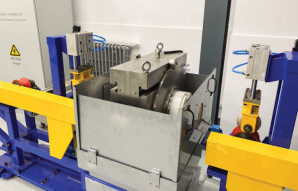
北京欧兰科技发展有限公司为您提供《视网膜中形变,应变检测方案(其它无损检测仪器/设备)》,该方案主要用于其他中形变,应变检测,参考标准--,《视网膜中形变,应变检测方案(其它无损检测仪器/设备)》用到的仪器有LaVision StrainMaster材料应变形变成像测量系统
推荐专场


相关方案
更多
该厂商其他方案
更多