

商贸有限公司-日本京都电子(KEM)")
有限公司")
仪器有限公司")


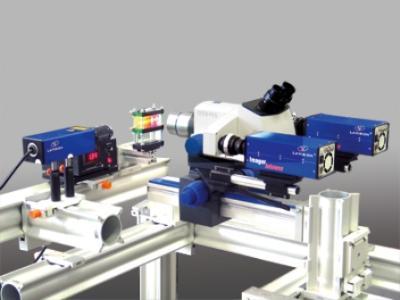


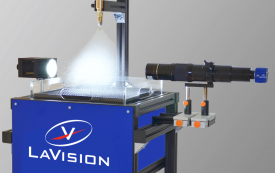
液体交叉流中气体注入位置对其气泡形成的影响检测方案
Liquid flows incorporating small-size bubbles play a vital role in many industrial applications. In
this work, an experimental investigation is conducted on bubble formation during gas injection from
a microtube into the channel of a downward liquid cross flow. The tip of the air injector has been
located at the wall wall orifice and also at several locations from the wall to channel centerline
nozzle injection. The size, shape, and velocity of the bubbles along with liquid velocity field are
measured using a shadow-particle image velocimetry/particle tracking velocimetry system. The
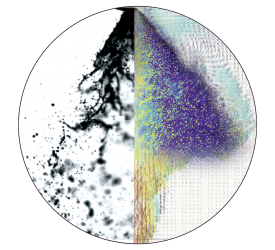
process of bubble formation for the wall orifice and the nozzle injection configurations is physically
explained. The effect of variation in water and air flow rates on the observed phenomena is also
investigated by considering water average velocities of 0.46, 0.65, and 0.83 m/s and also air average
velocities of 1.32, 1.97, 2.63, and 3.29 m/s. It was observed that shifting the air injector tip toward
the center of the channel resulted in the coalescence of some of the preliminary bubbles and the
formation of larger bubbles termed secondary and multiple bubbles. Increase in air flow rate and
reduction in water flow rate also intensify the rate of bubble coalescence. A correlation-based model
is also suggested to overcome the shortcoming of the available models in the literature which are
developed to only estimate the size of the preliminary bubbles. The model predicts the percent of the
preliminary, secondary, and multiple bubbles along with the average size of secondary and multiple
bubbles as a function of nozzle position within a cross flow.
检测样品:
其他
检测项:
气体注入位置对其气泡形成的影响
北京欧兰科技发展有限公司
查看联系电话
前往展位
飞机模型中襟翼喷射飞机模型的漩涡分析检测方案(粒子图像测速)
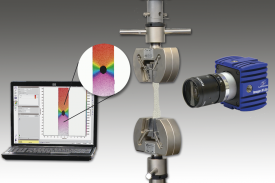
The wake behind a simpli¯ed model of a generic aircraft (the SWIM model) is measured
in the Low Speed Low turbulence wind tunnel (LSL) at Delft University of Technology.
Two measurement techniques have been used in order to qualitatively and quantitatively
measure the wake, i.e. stereoscopic particle image velocimetry (Stereo PIV) and a 5 hole
probe (5HP). Furthermore balance measurements have been carried out over a range of
con¯gurations for later comparison purposes. The goal of the wake measurements is to
give a comparison between the two measurement techniques.
The 5HP measurements are processed using a windows based program called Pressure
Field Visualisation. This program calculates vector ¯elds from the input pressure data
and has several exporting options. The Stereo PIV measurements are correlated using
DaVis 7.3 using a window size of 16 x 16 pixels with 50% overlap.
检测样品:
其他
检测项:
襟翼喷射飞机模型的漩涡分析
北京欧兰科技发展有限公司
查看联系电话
前往展位

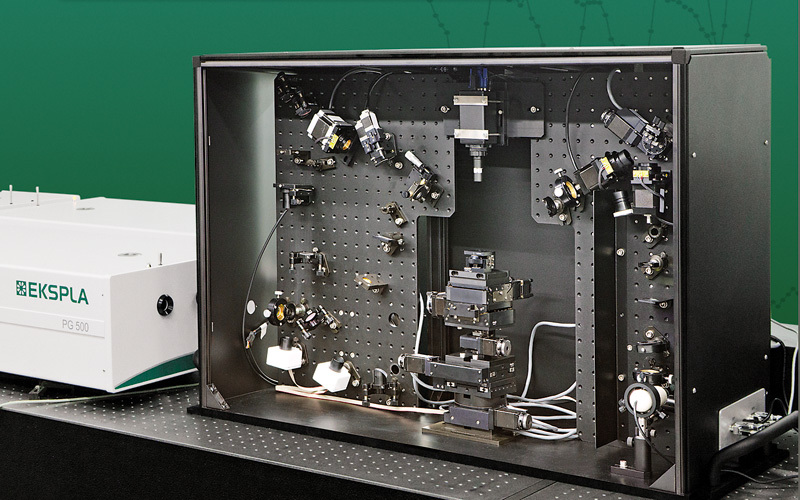
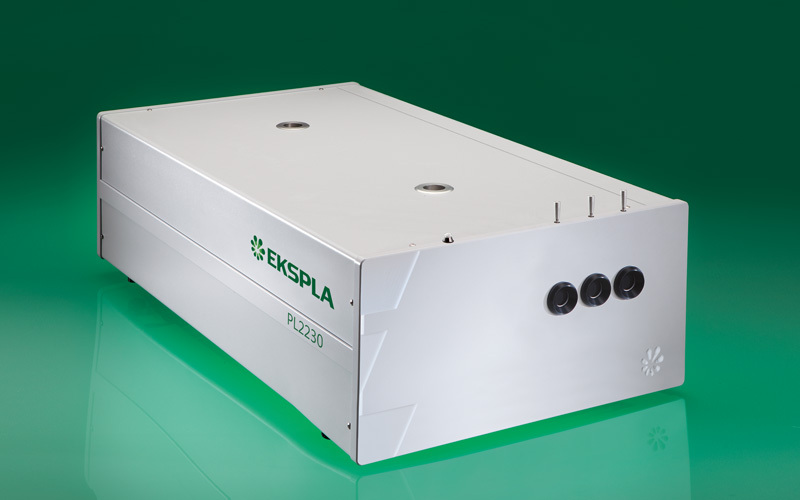
火焰,氢燃料中组分,温度,自由基,羟基检测方案
We report on spatially resolved simultaneous measurements of temperature and majority species
concentrations along a line segment in a premixed laminar H2-air flame. The results are obtained from
Raman and Rayleigh scattering by using a narrow-band KrF excimer laser and a spectrally and spatially
resolving detector system that consists of a high-throughput spectrometer and a gated, intensified,
two-dimensional CCD camera. The data presented here are integrated over 100 laser shots. Absolute
density profiles of N2, 02, H20, and H2, as well as temperature profiles at various heights through the
flame, are presented. A discussion of the required calibration procedures and a summary of the
necessary spectroscopic background are also included in this paper.
检测样品:
其他
检测项:
组分,温度,自由基,羟基
北京欧兰科技发展有限公司
查看联系电话
前往展位
微尺度流体中流场检测方案(粒子图像测速)
Microscopic particle image velocimetry (microPIV) experiments were performed on a polydimethylsiloxane (PDMS) microchannel
with a cross-section measuring 320 lm · 330 lm for Reynolds numbers between 272 and 2853. Care was taken to ensure that the
seed particle density was great enough that accurate instantaneous velocity vector fields could be obtained for all the Reynolds numbers
investigated. Velocity fluctuations were calculated from ensembles of microPIV velocity fields. The hu0i/umax fluctuation showed
an increase at Re = 1535 and a further increase as Reynolds numbers were increased, suggesting that transition to turbulence began
near Re = 1535, a Reynolds number lower than predicted by classical theory. The hu0i/umax data also suggest the flow was fullydeveloped
at a Reynolds number between 2630 and 2853, also lower than classical results. This finding was confirmed in plots of
the mean velocity profile. For the fully developed flow, the measured hu0 i/umax fluctuation agreed well with classical results for turbulent
duct flow, but the hv0 i/umax fluctuation was 25–40% lower than turbulent duct flow results. Finally, spatial correlations of
velocity fluctuations were calculated to lend some insights into the characteristics of the large-scale turbulent structures observed
in the turbulent microchannel flow.
检测样品:
其他
检测项:
流场
北京欧兰科技发展有限公司
查看联系电话
前往展位
氢硅中表面Si-H键的稳定性检测方案(其它光谱仪)
Stability of the Si-H bonds on the hydrogen-terminated Si(111) surface has been investigated by sum frequency generation (SFG) spectroscopy in air at room temperature. The SFG observation showed that the Si(111) surface is terminated by a monolayer of monohydride (Si-H) after etching in a concertrated ammonium fluoride (NH4F) solution. The number of Si-H bonds decreased with laser irradiation time and the abstraction rate of hydrogen atoms on Si increased with the increase of input energy of "visible" light. The Si-H bond under irradiation at 1064nm light was more stable than that at 532nm light with a given intensity. A small amount of water in air severely lowered the stability of Si-H bond because of a photoelectrochemical recation under laser irradiation.
检测样品:
其他
检测项:
表面Si-H键的稳定性
北京欧兰科技发展有限公司
查看联系电话
前往展位


仪器信息网行业应用栏目为您提供2271篇其他检测方案,可分别用于,参考标准主要有等