


方案详情
文
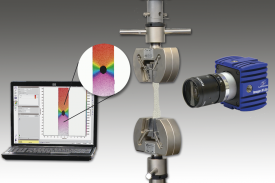
采用LaVision公司先进的2D和3D数字图像相关技术可以对材料的形变,裂纹,和缺陷进行非接触全场测量
方案详情

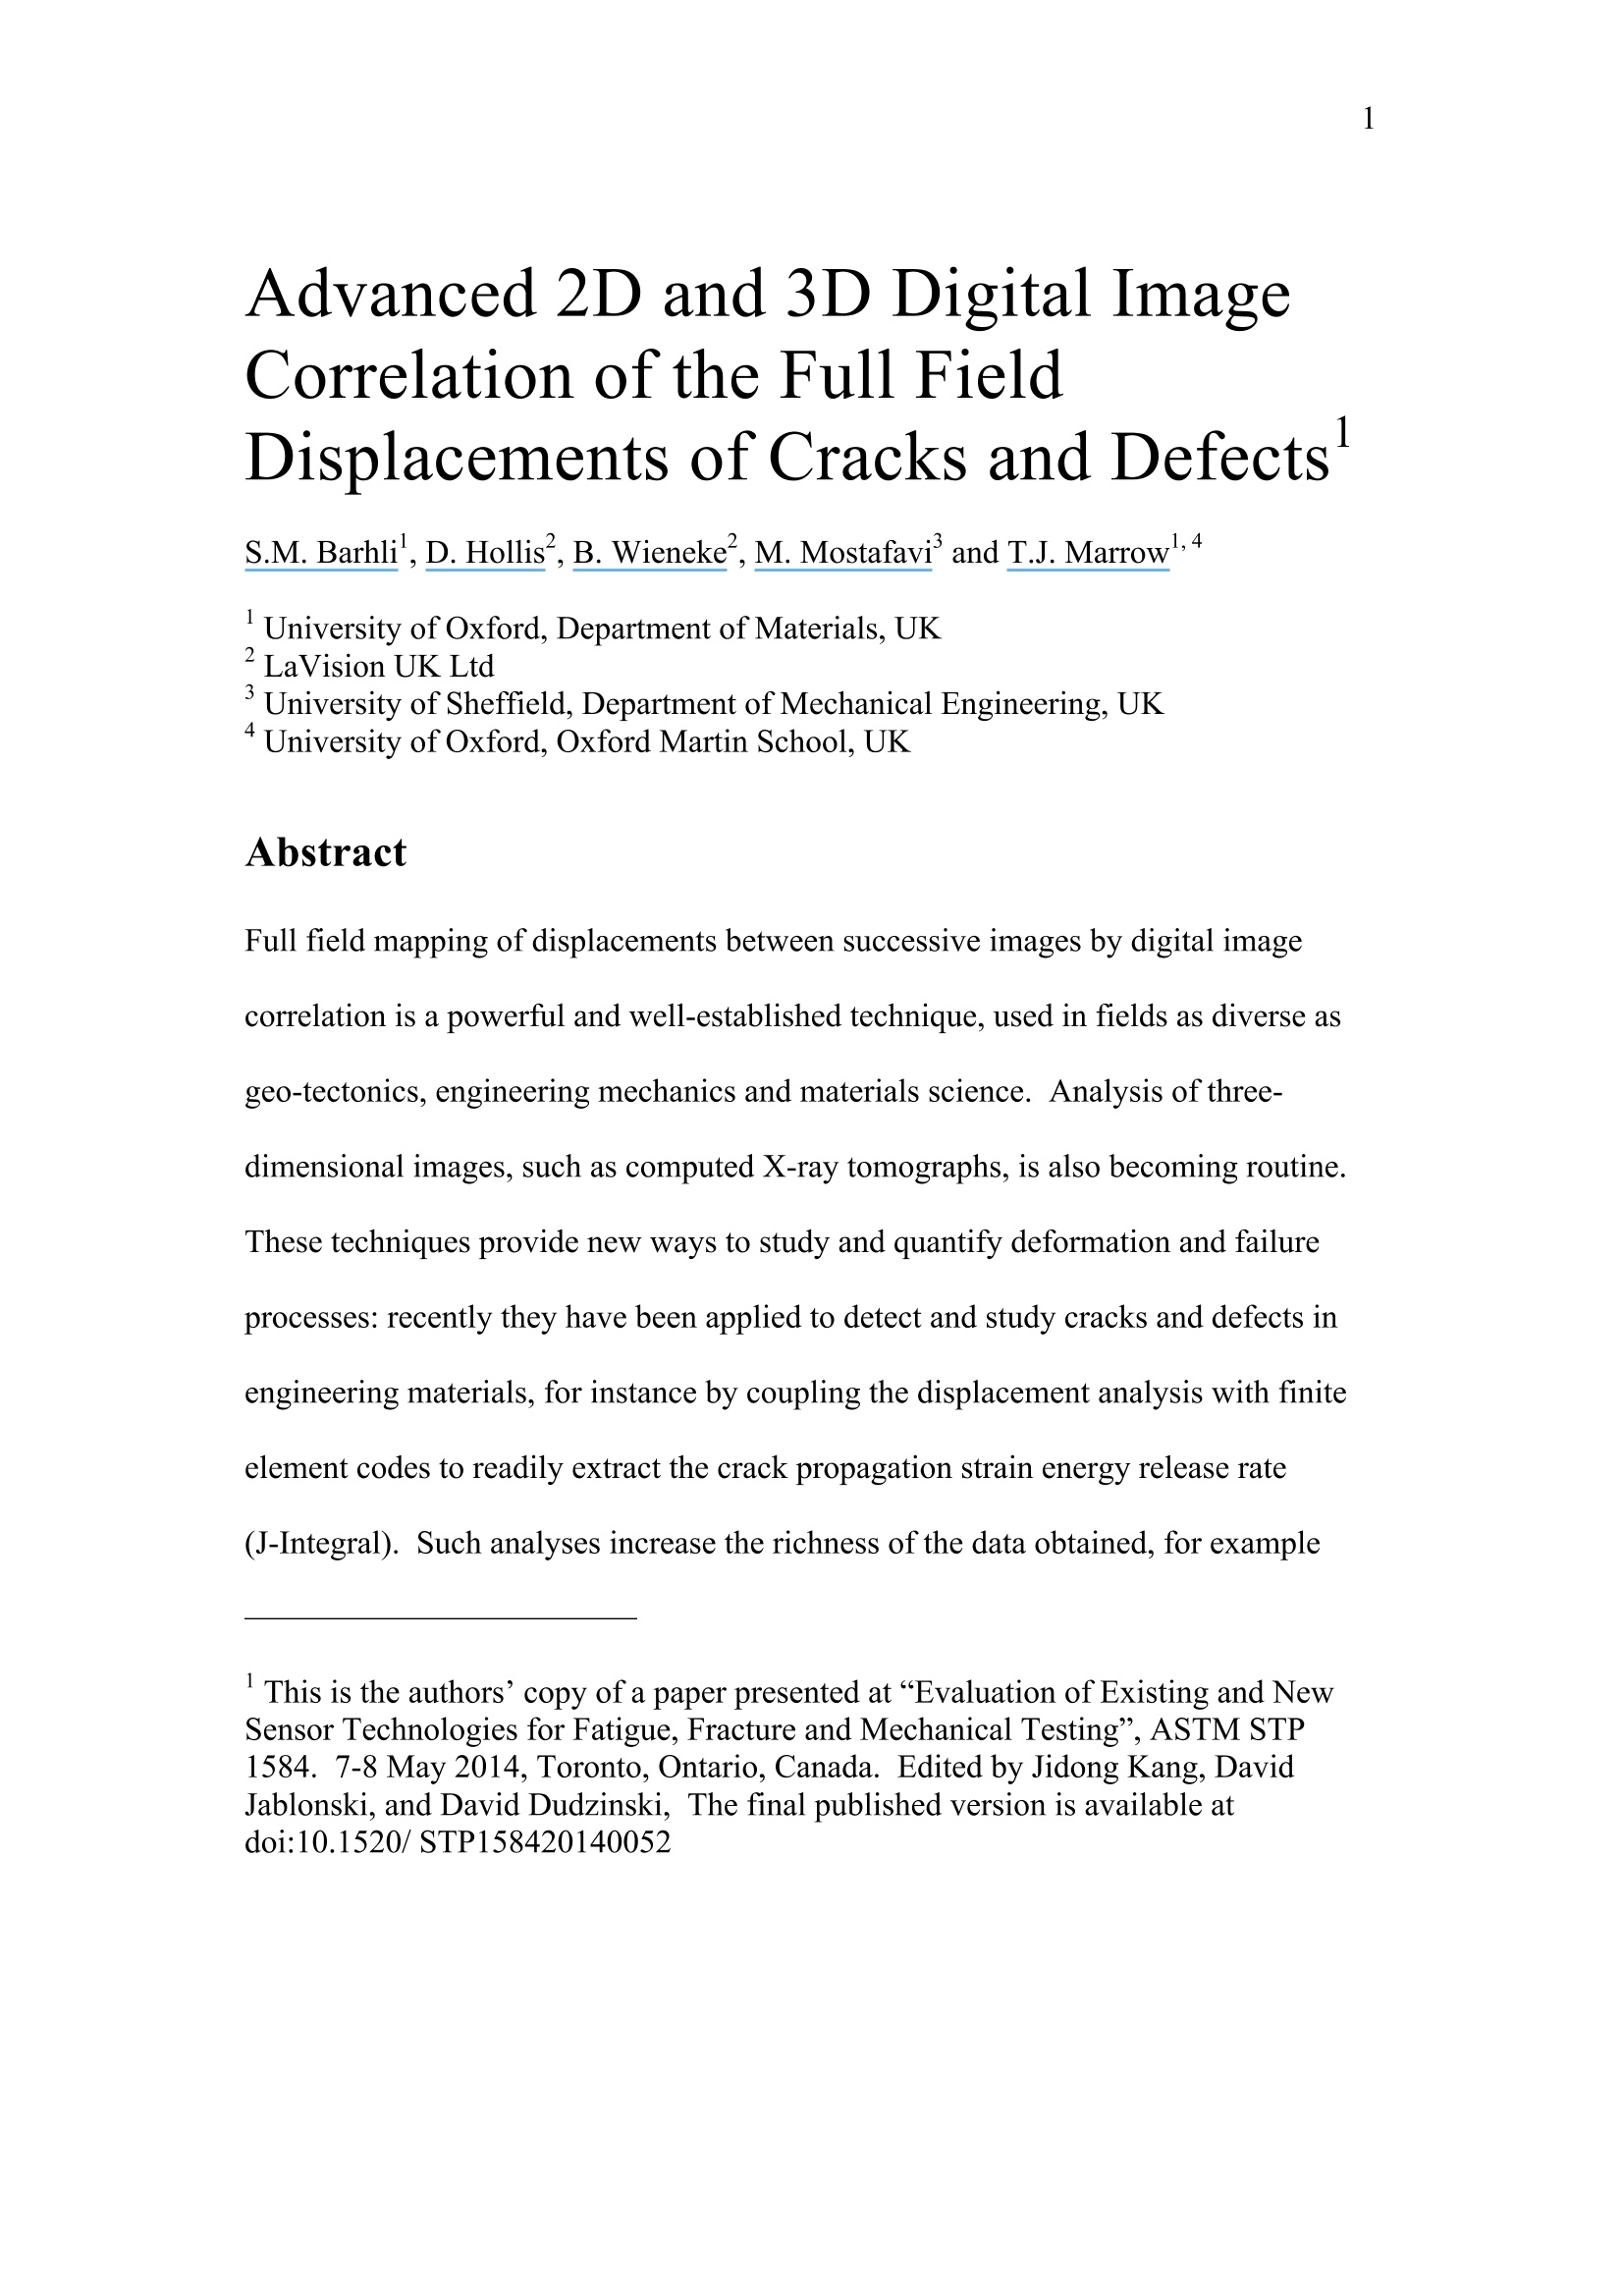
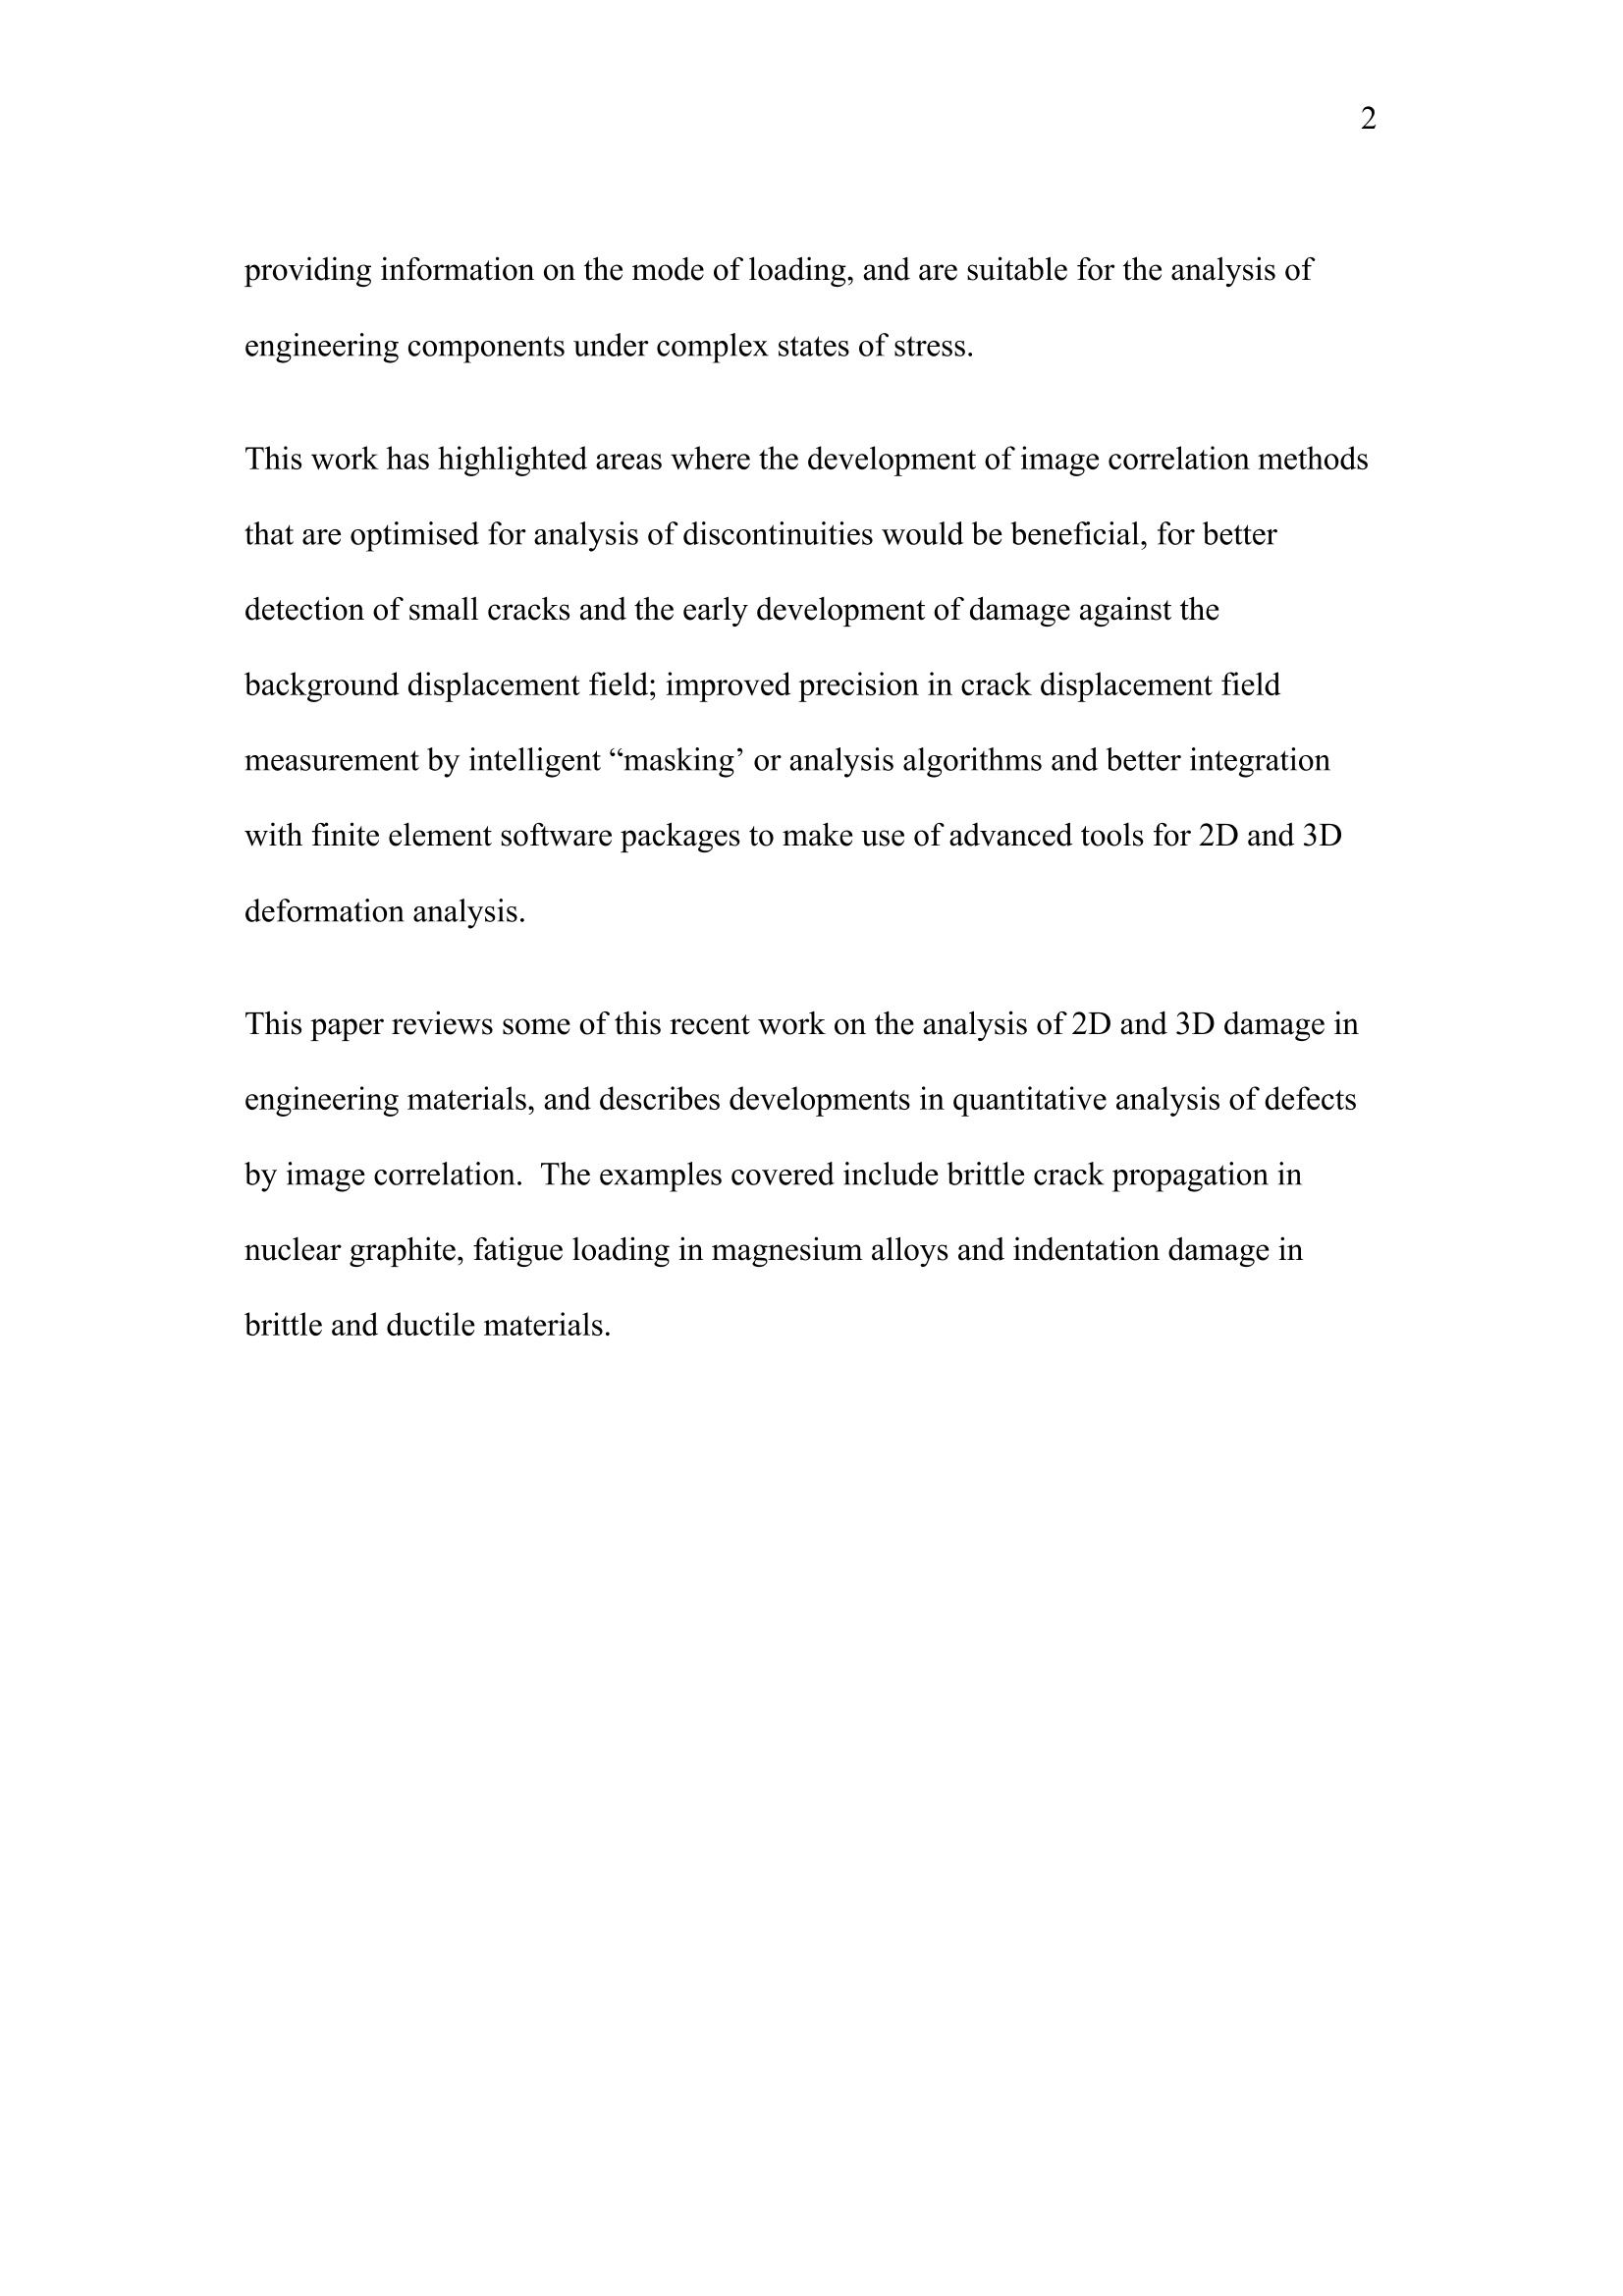
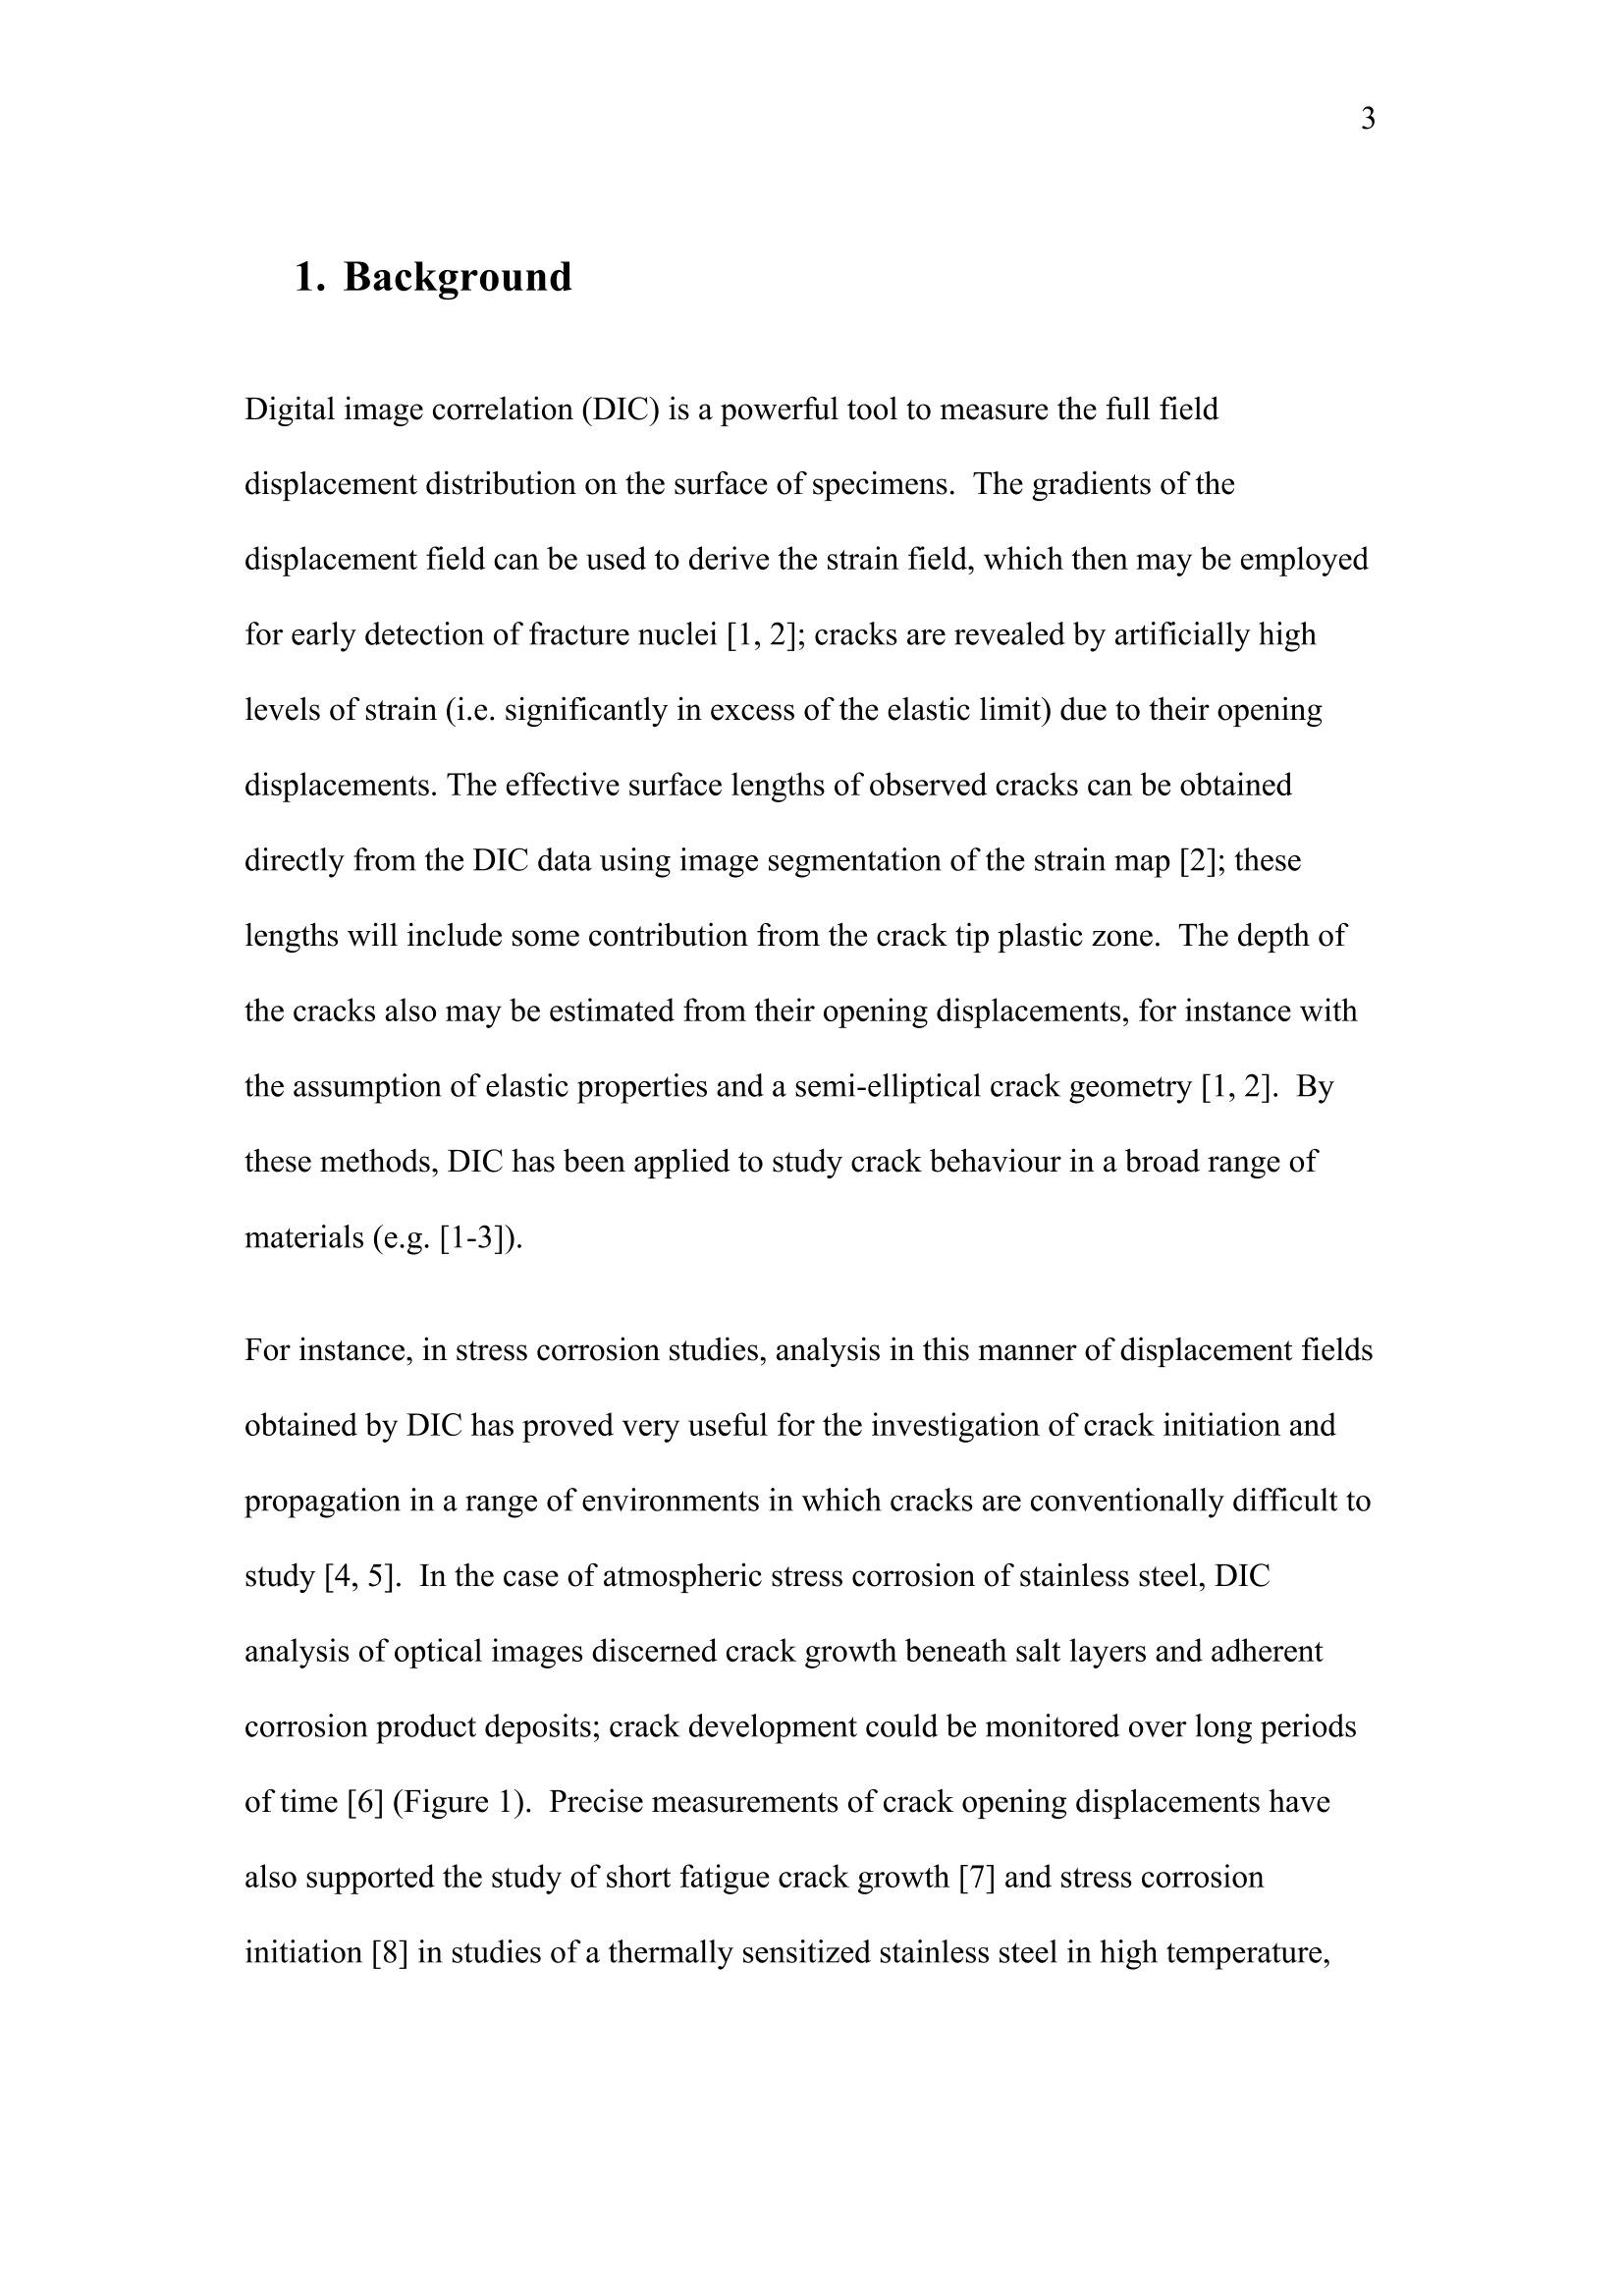
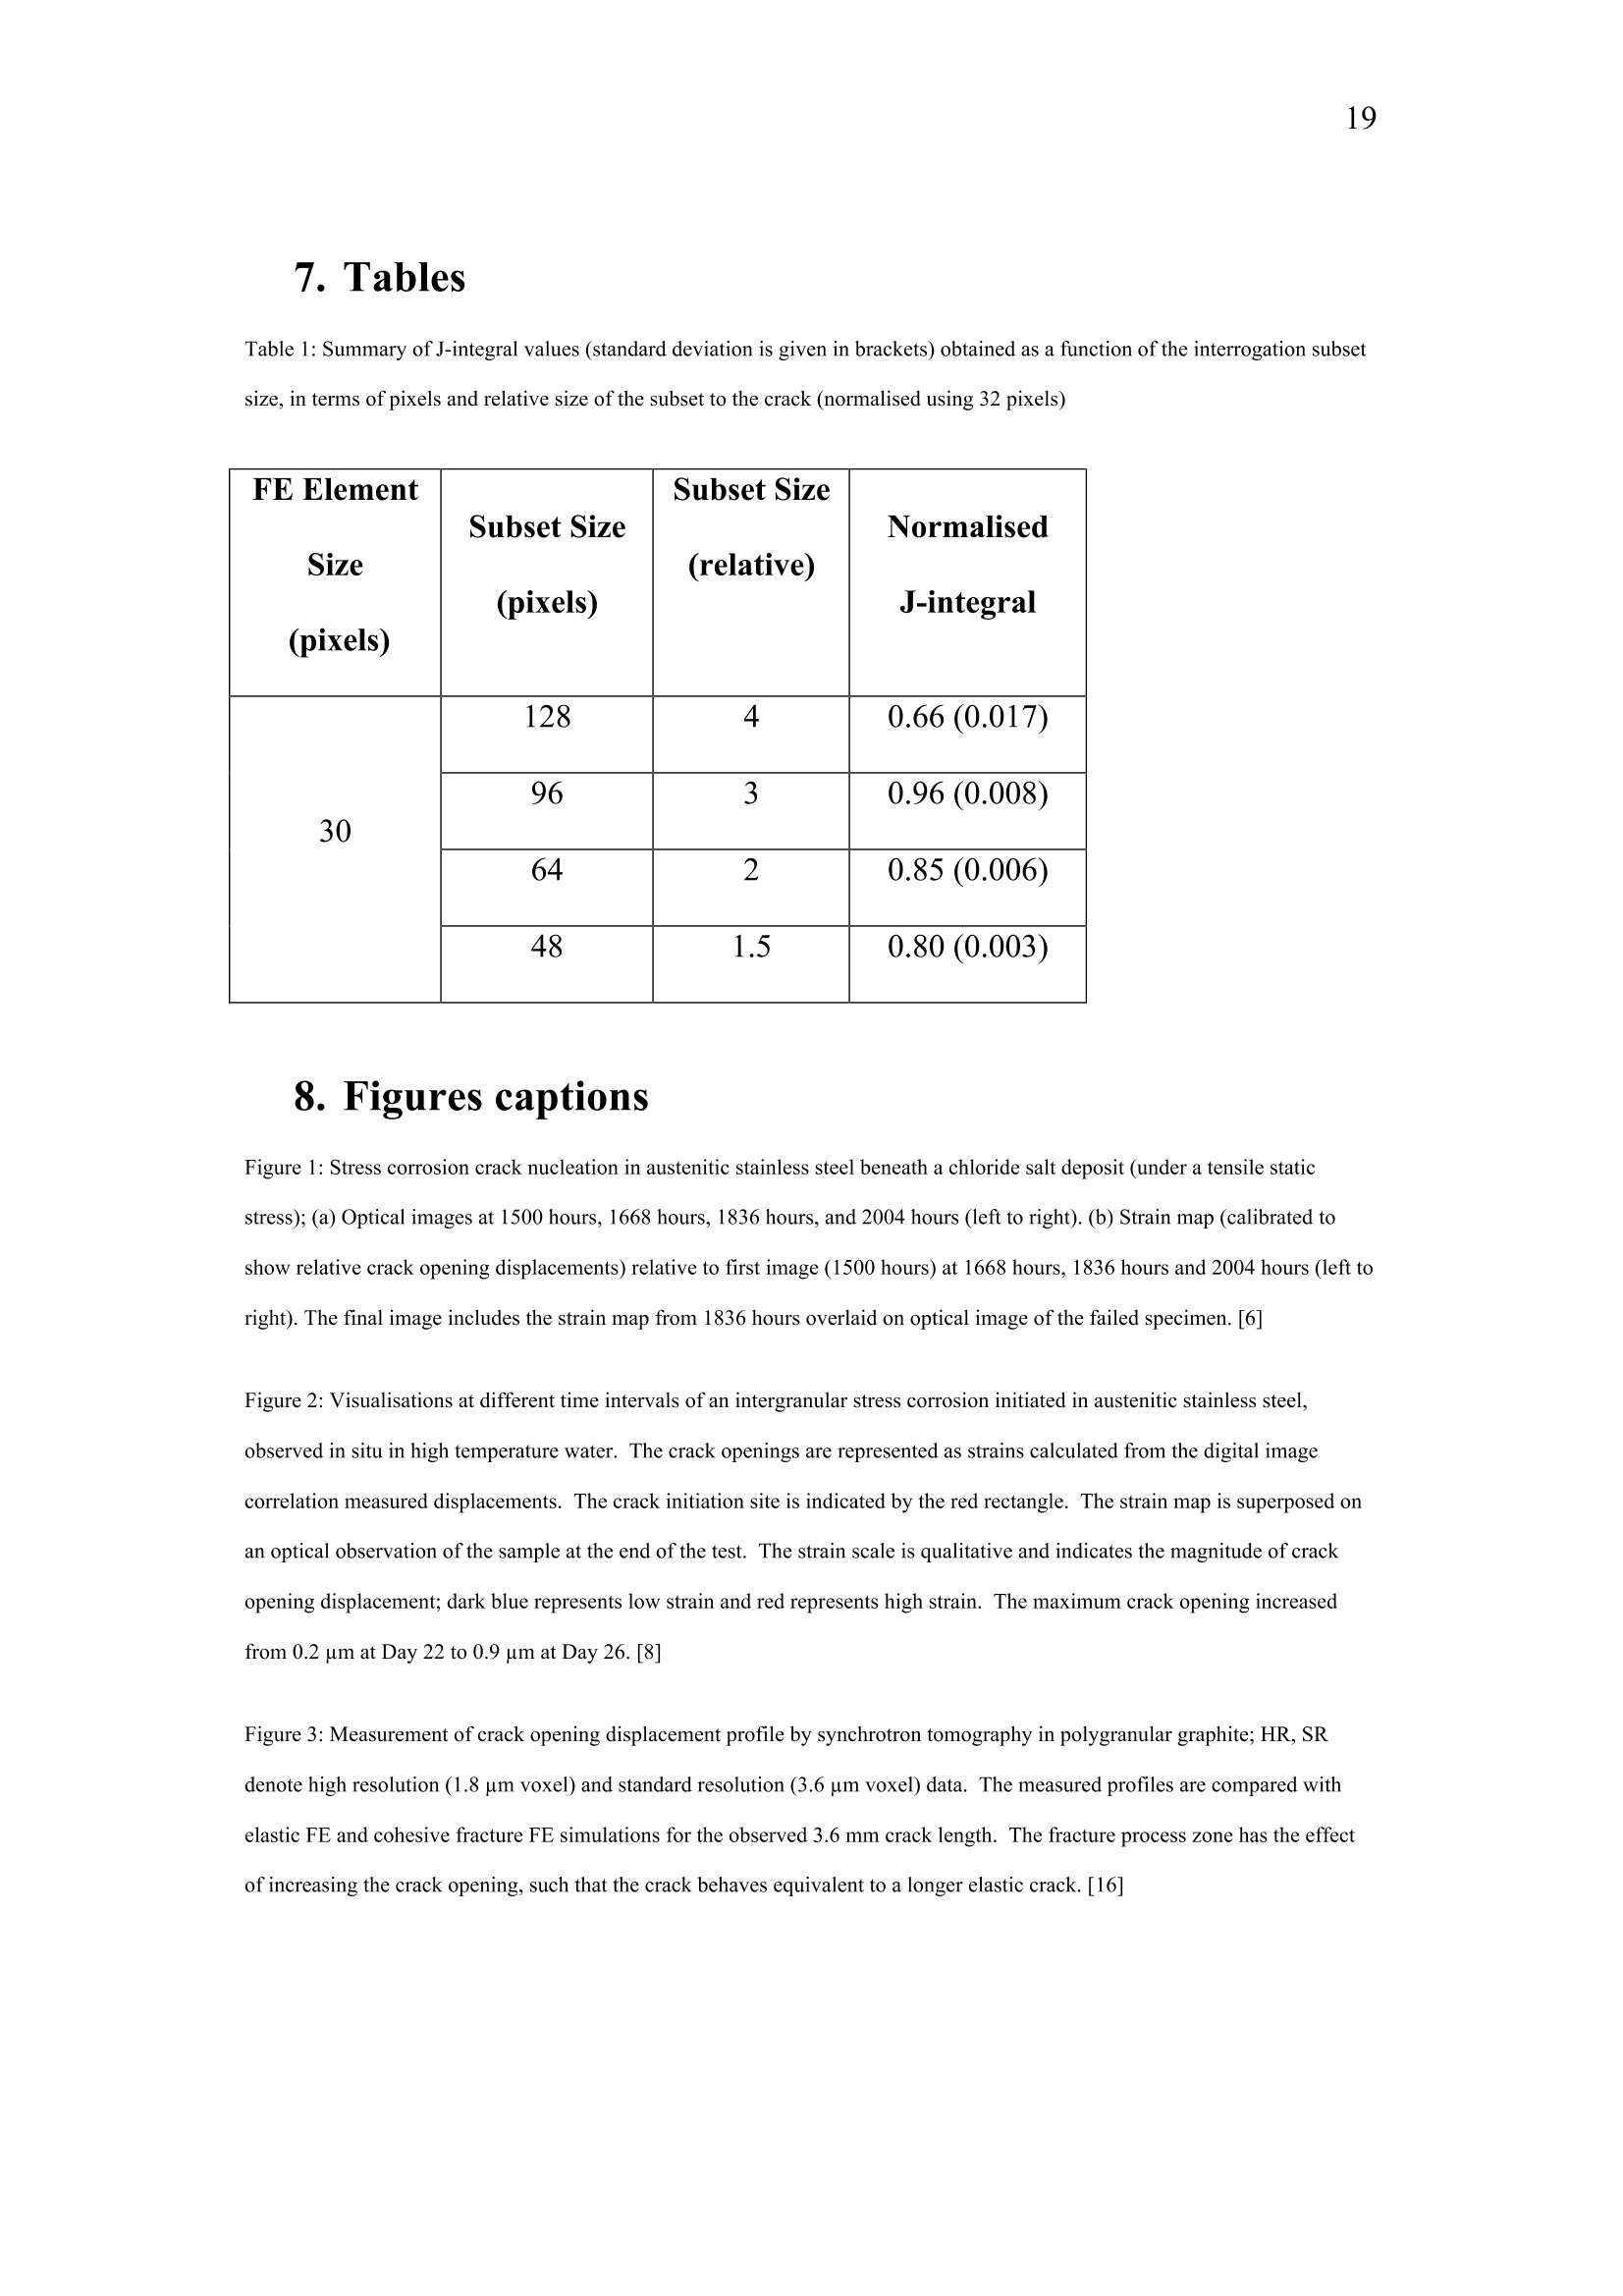
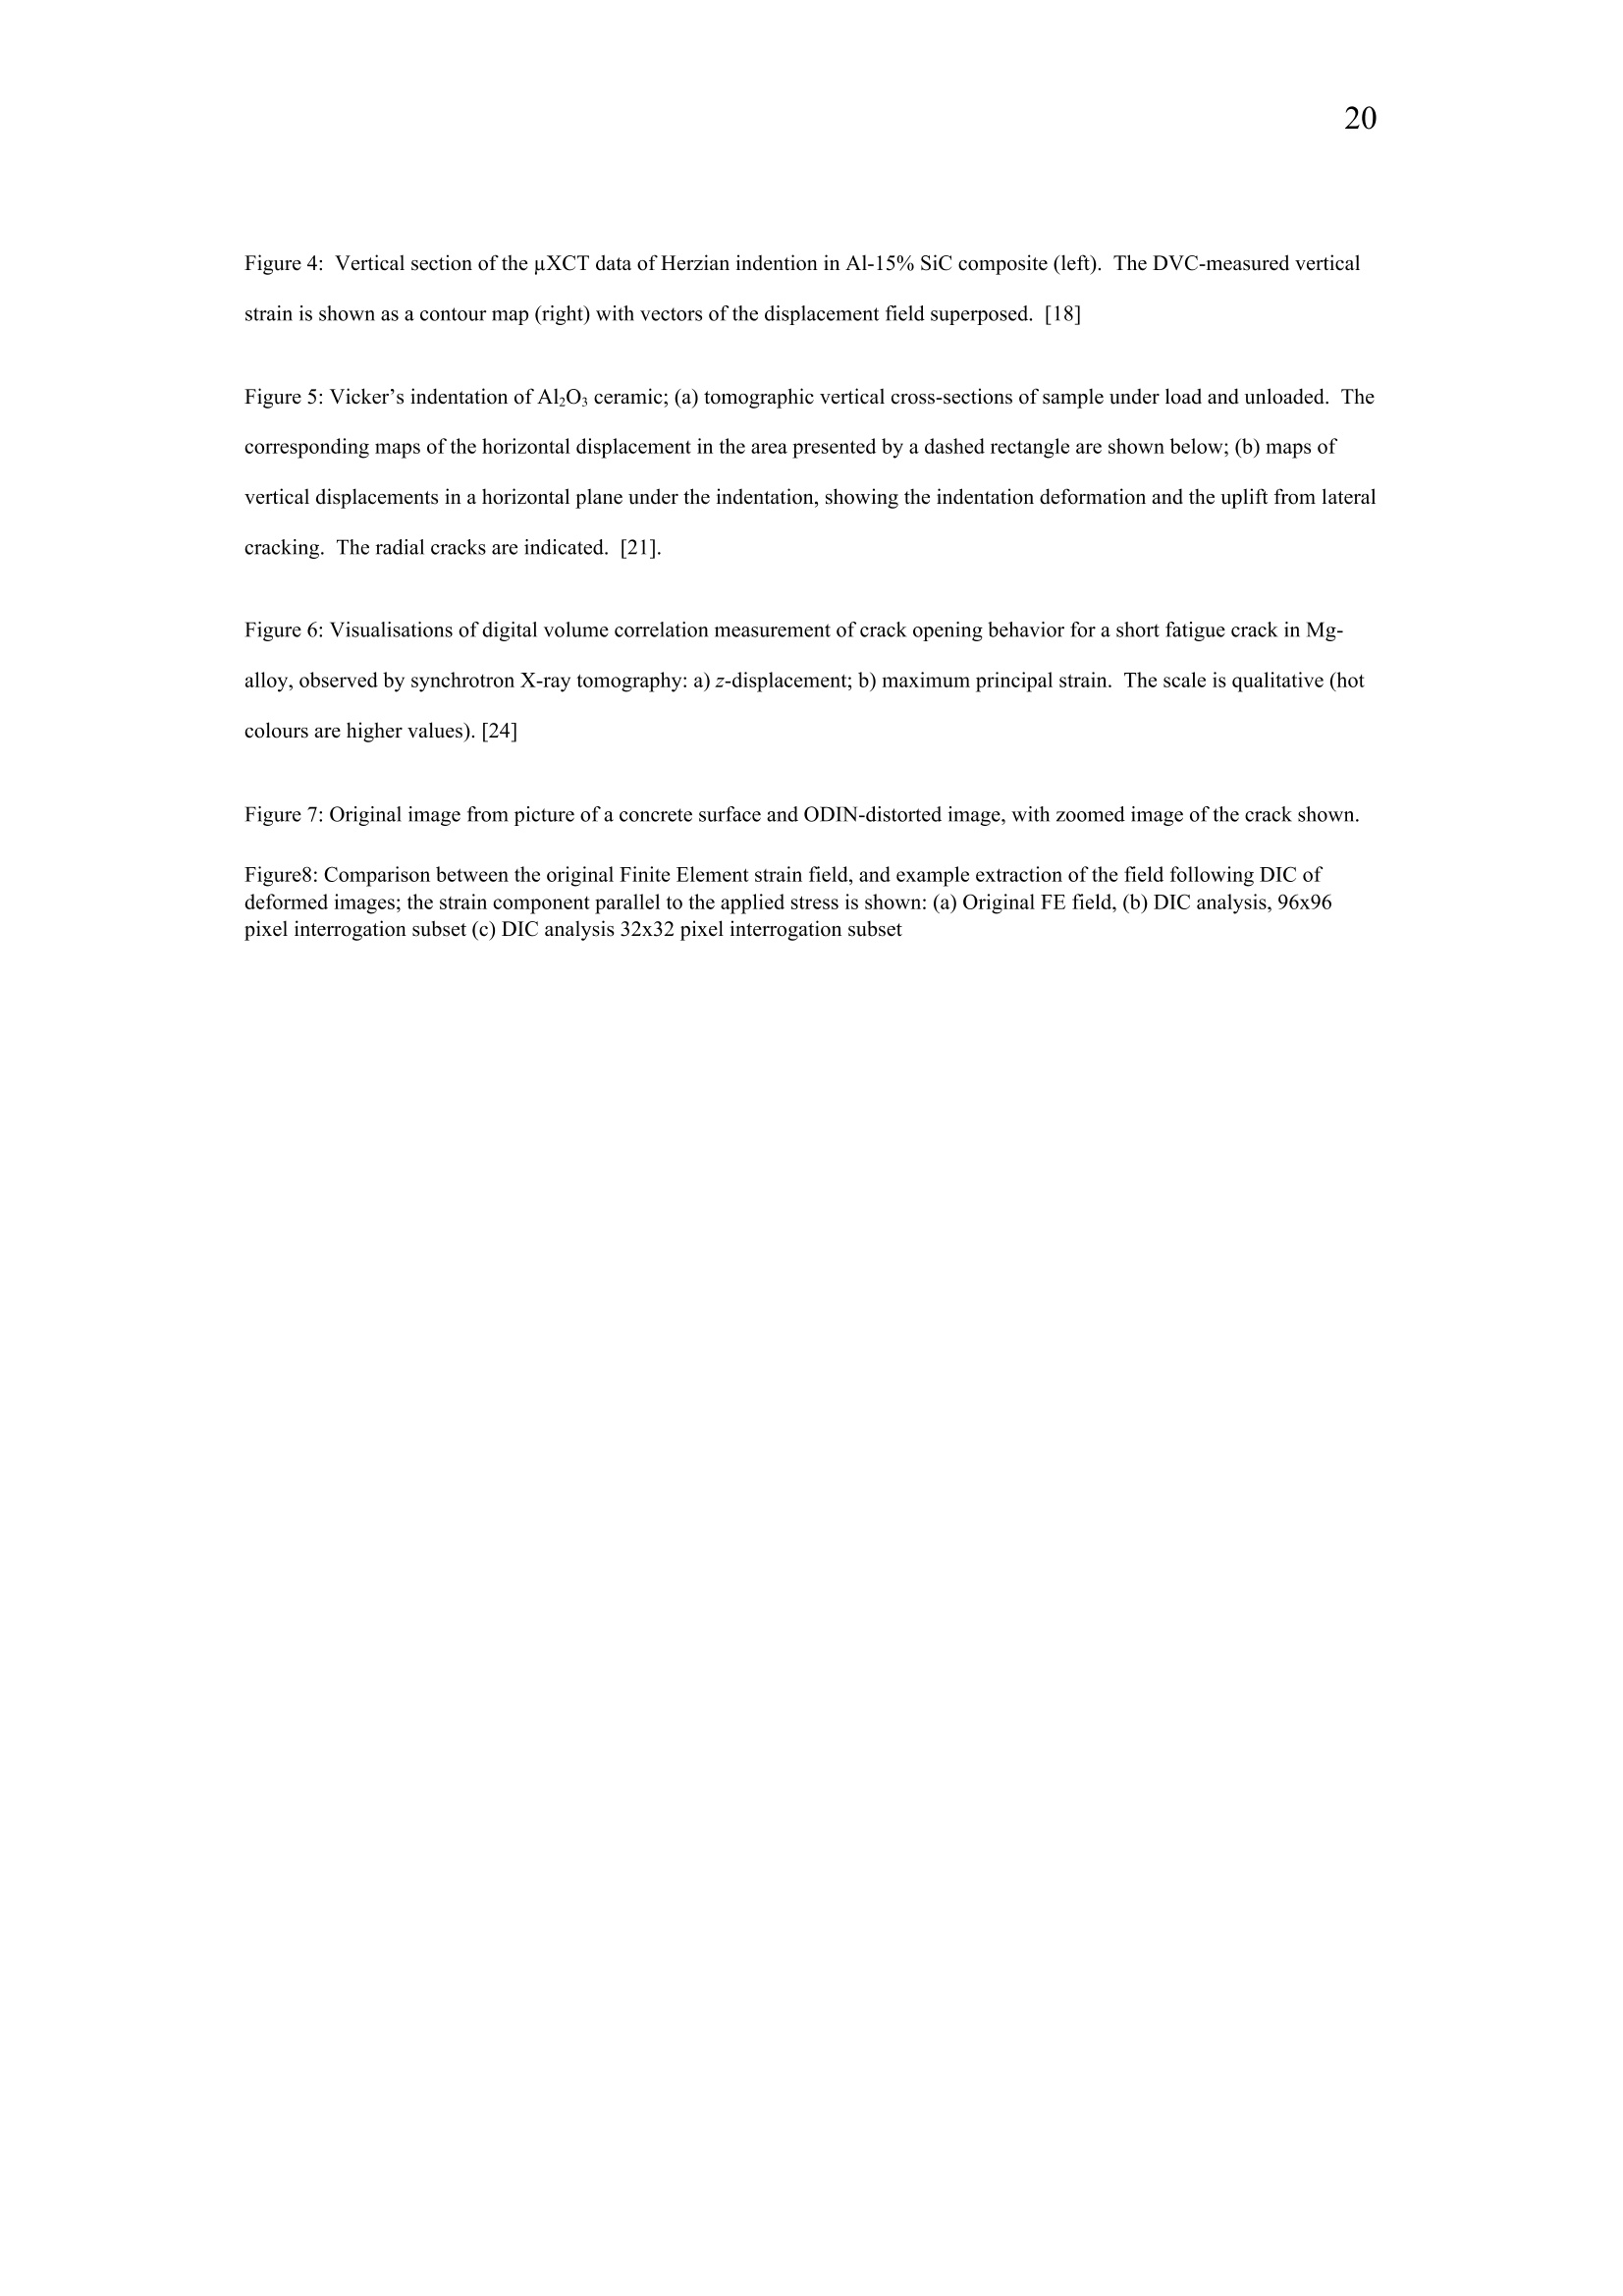
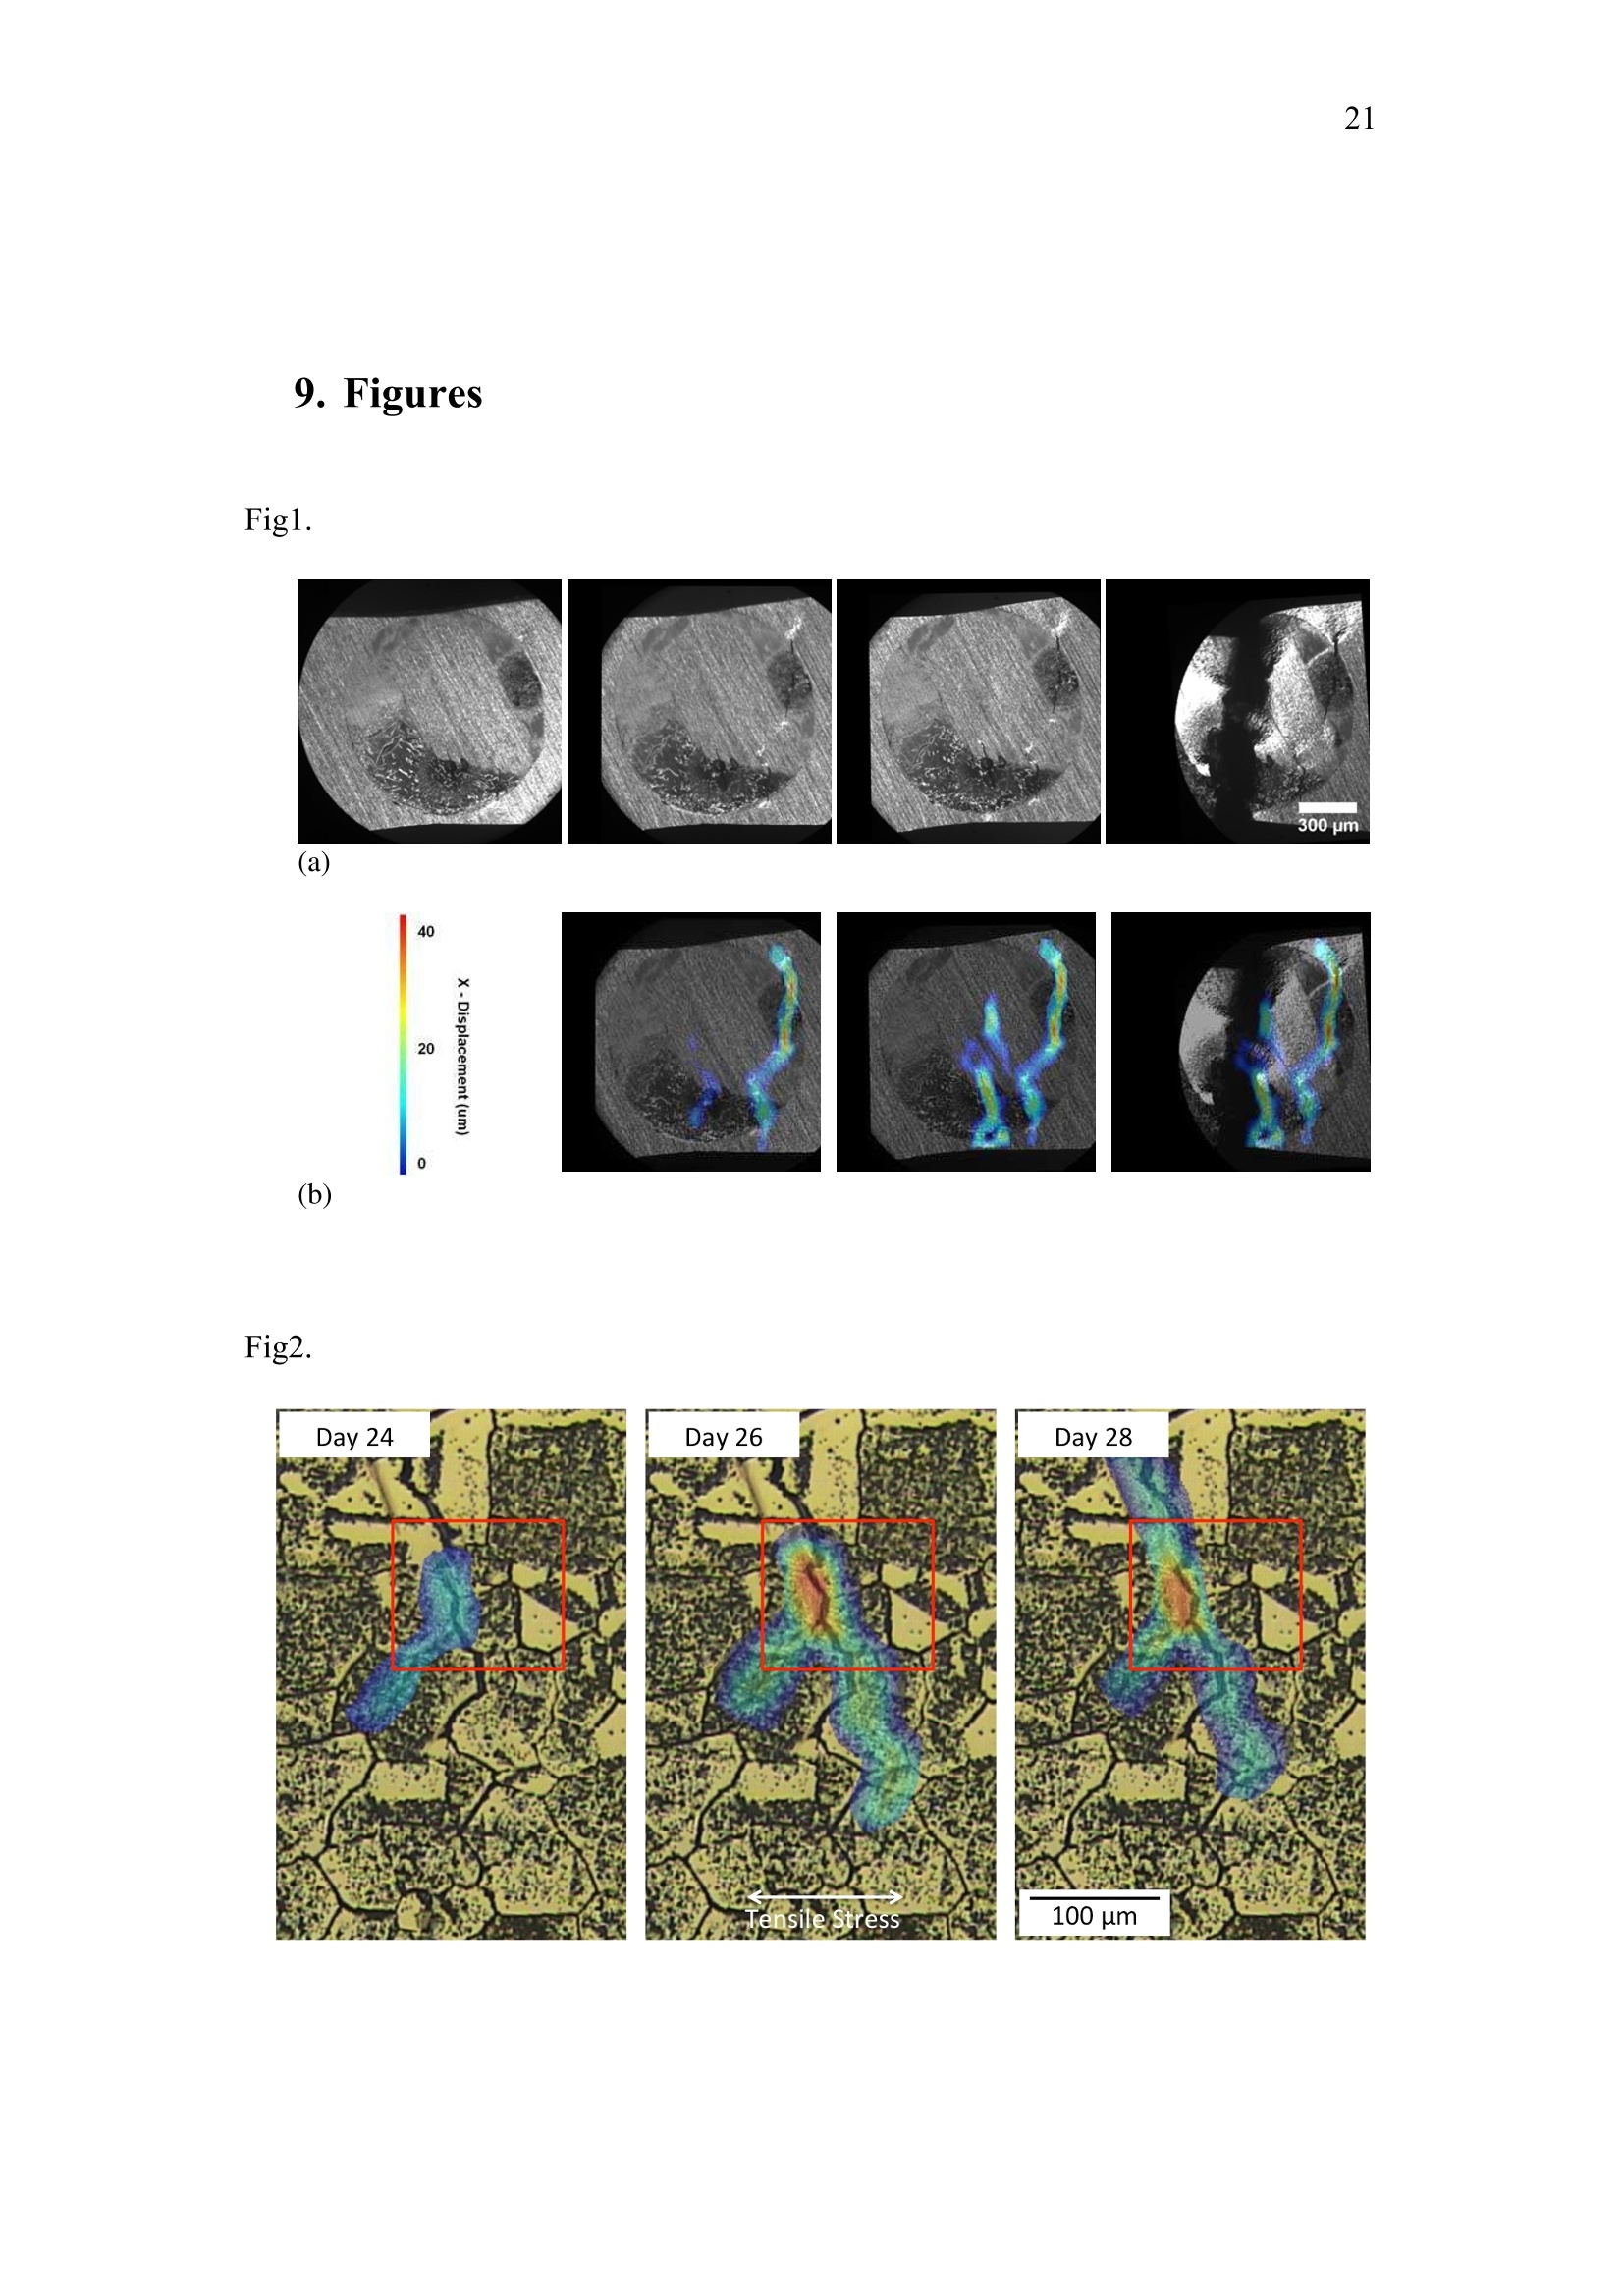
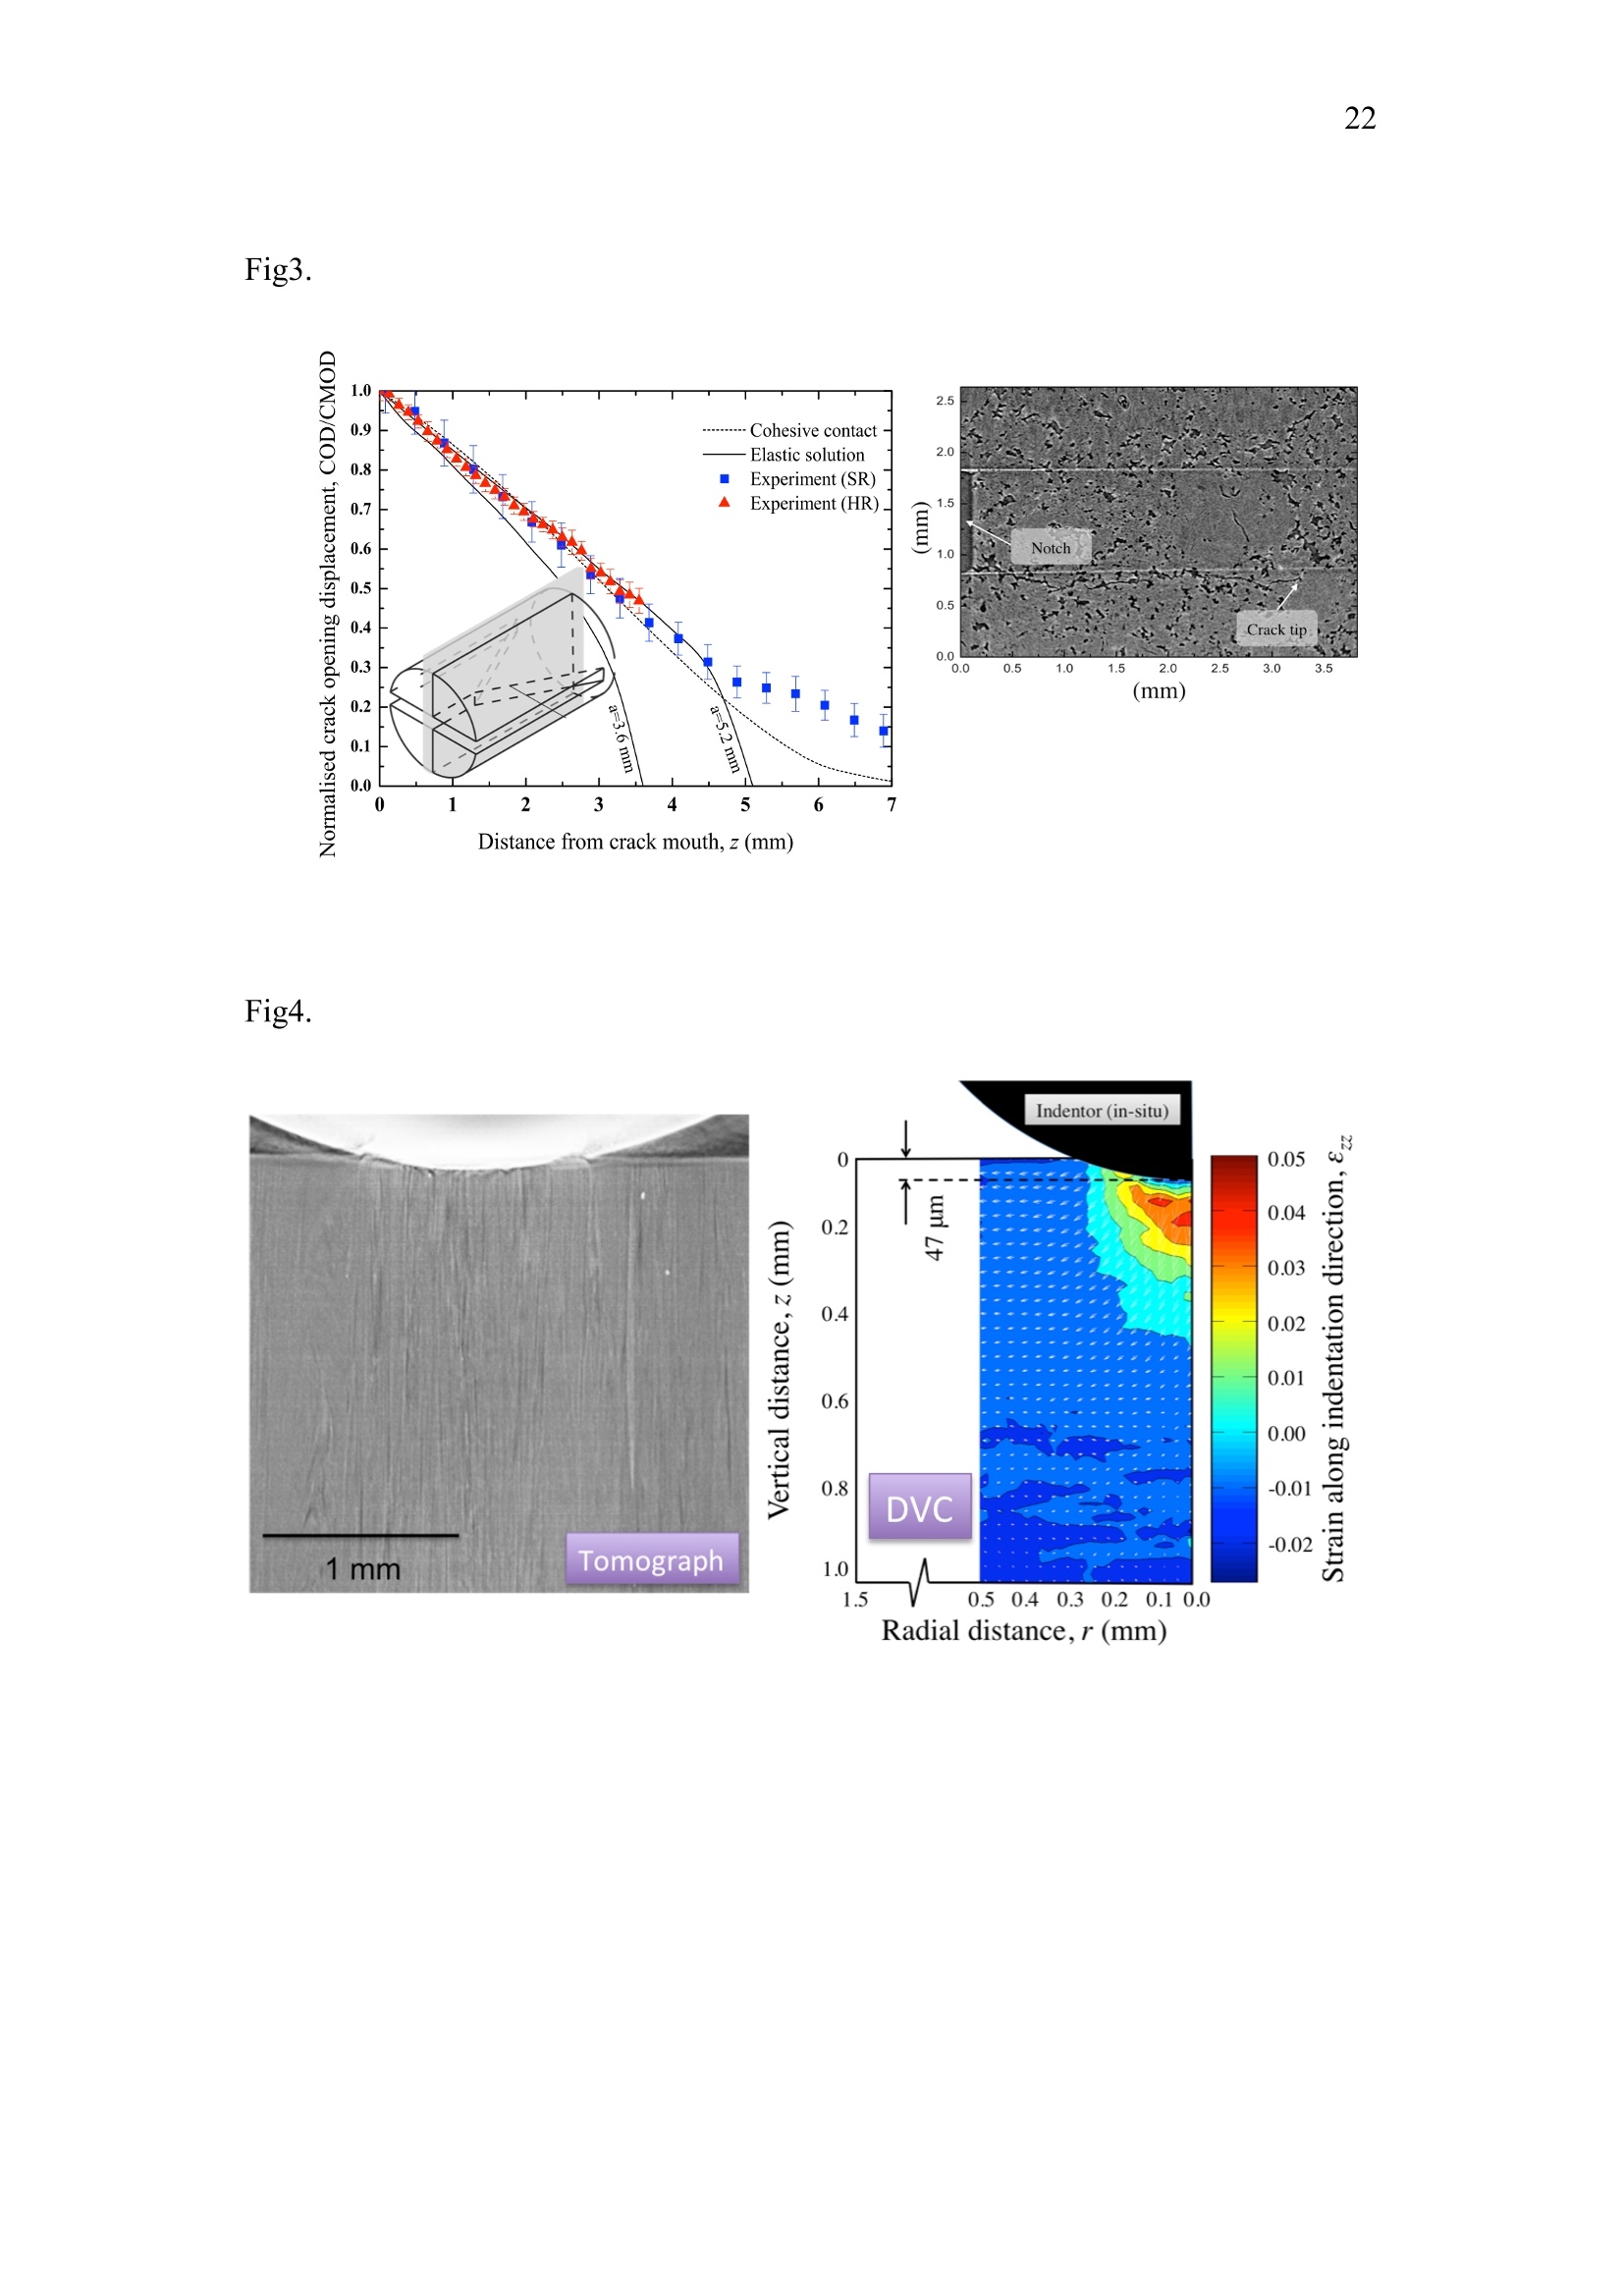
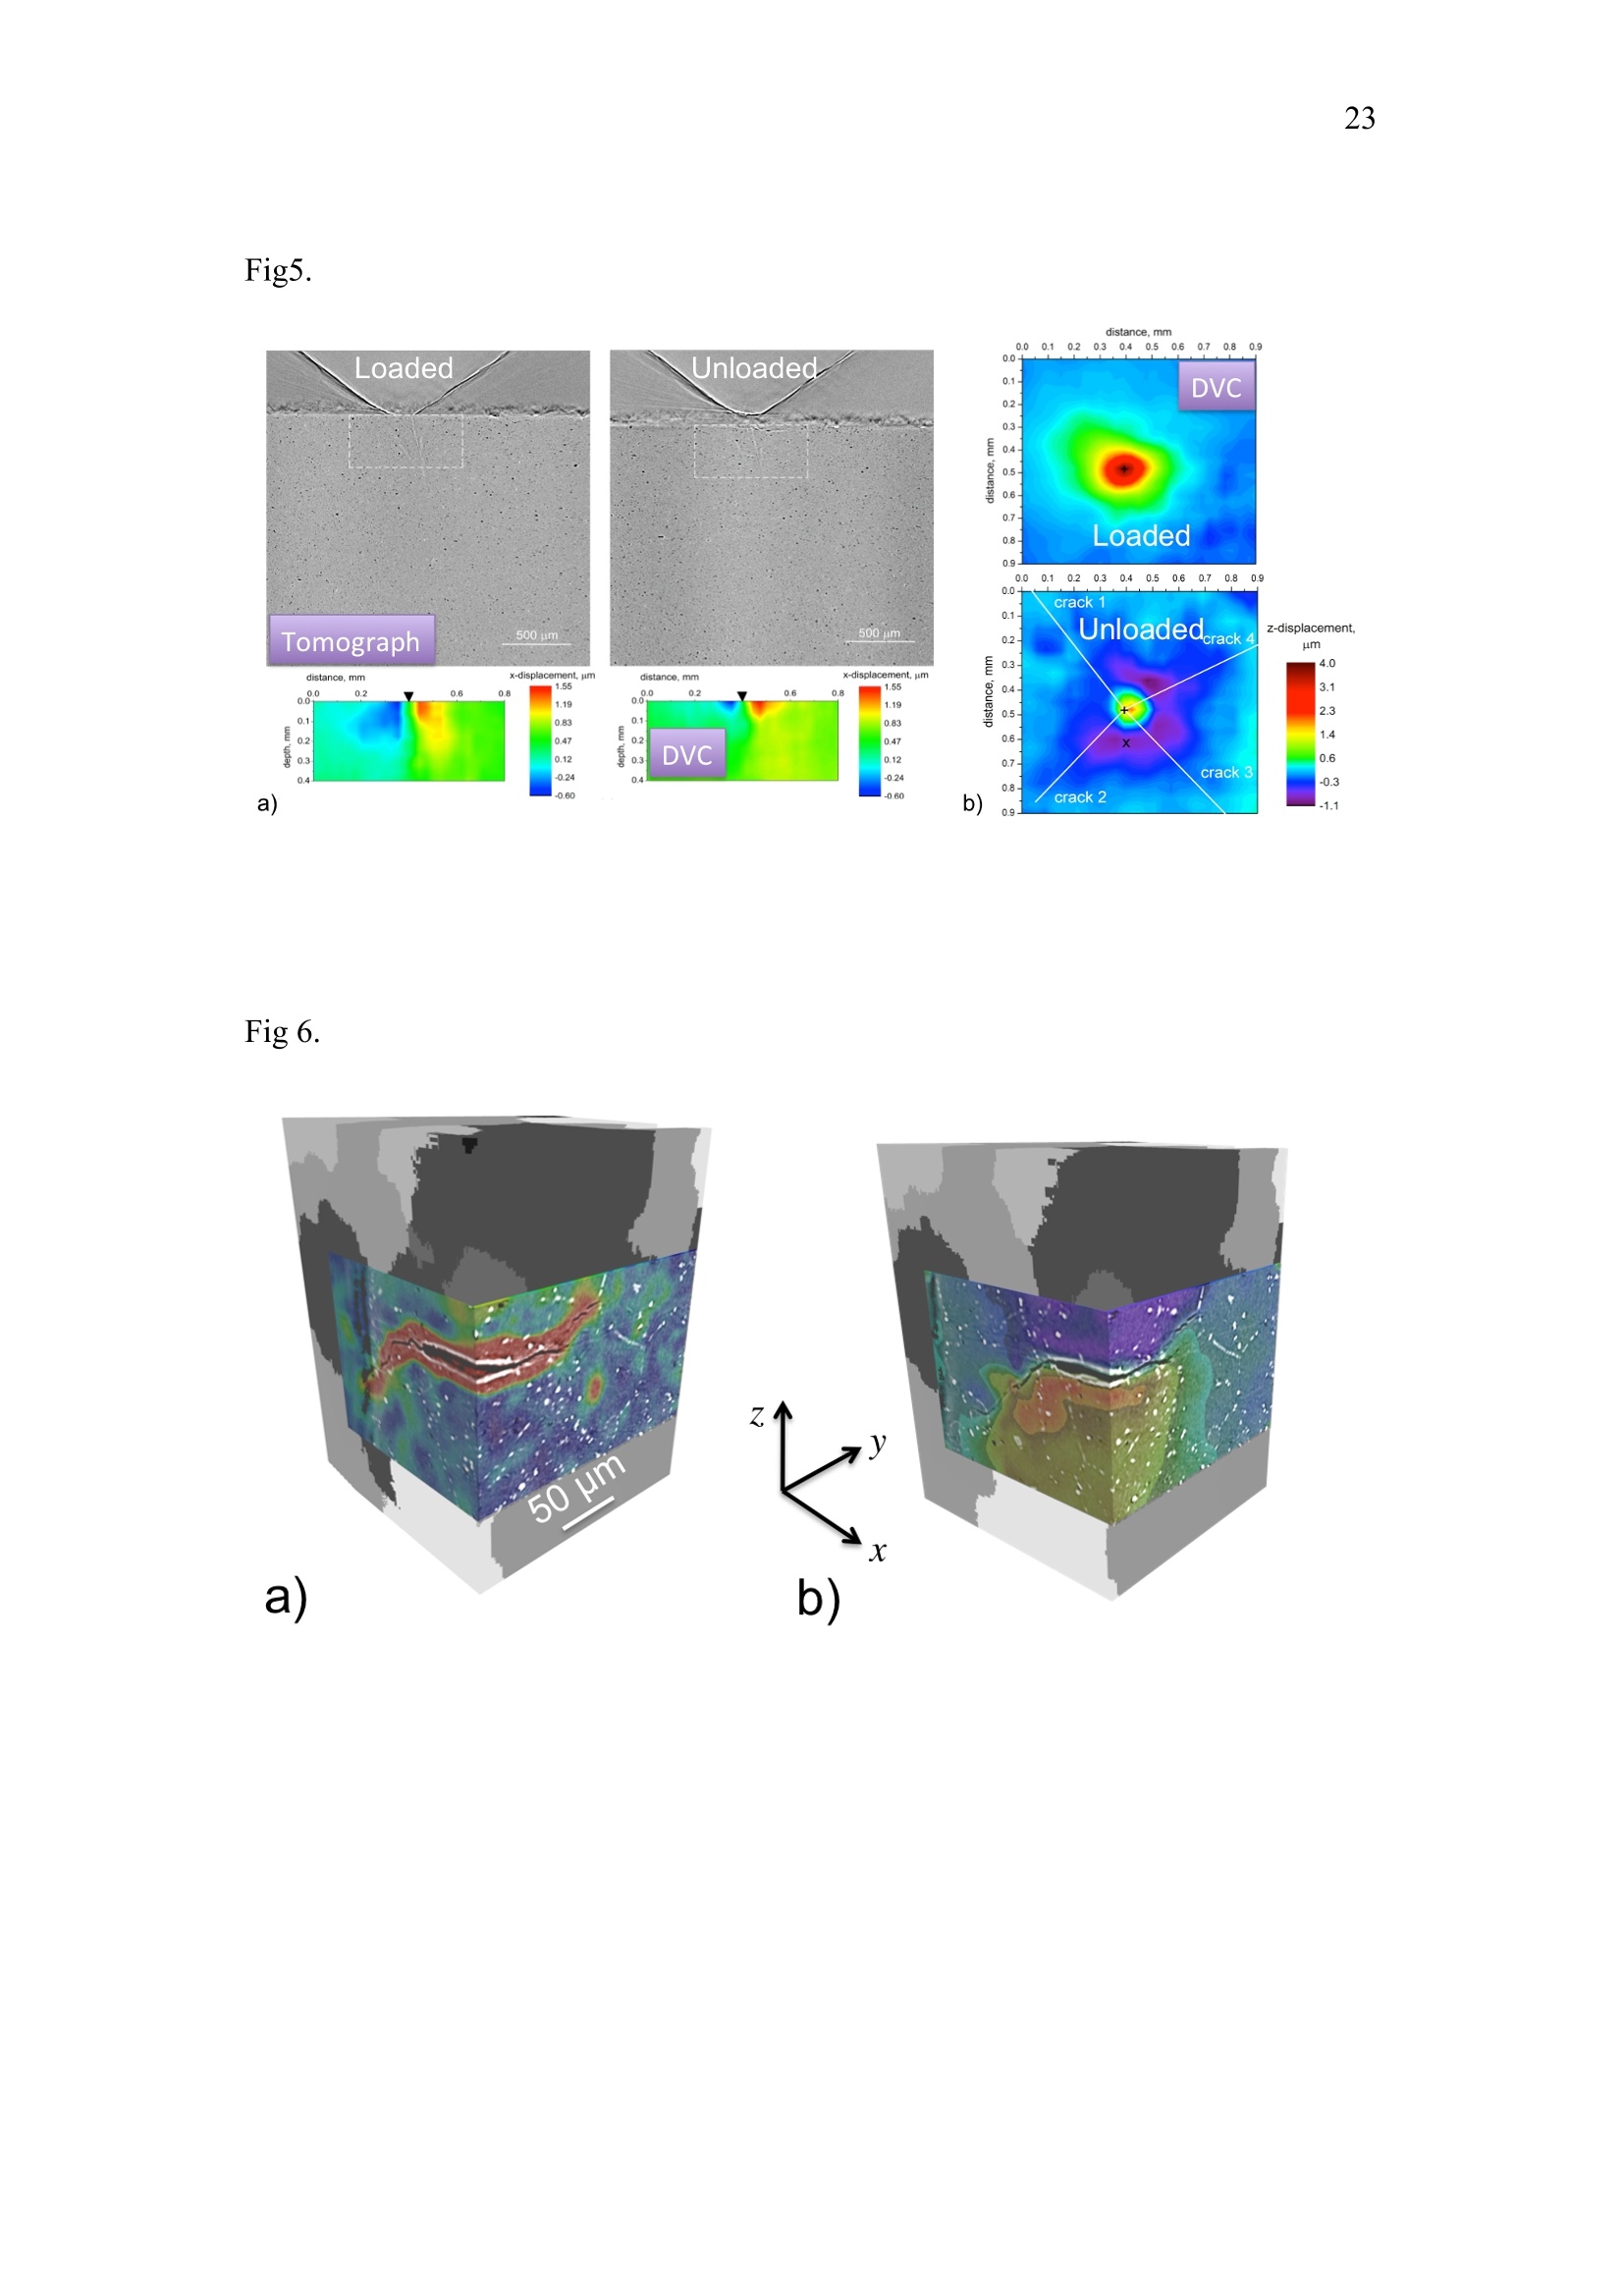
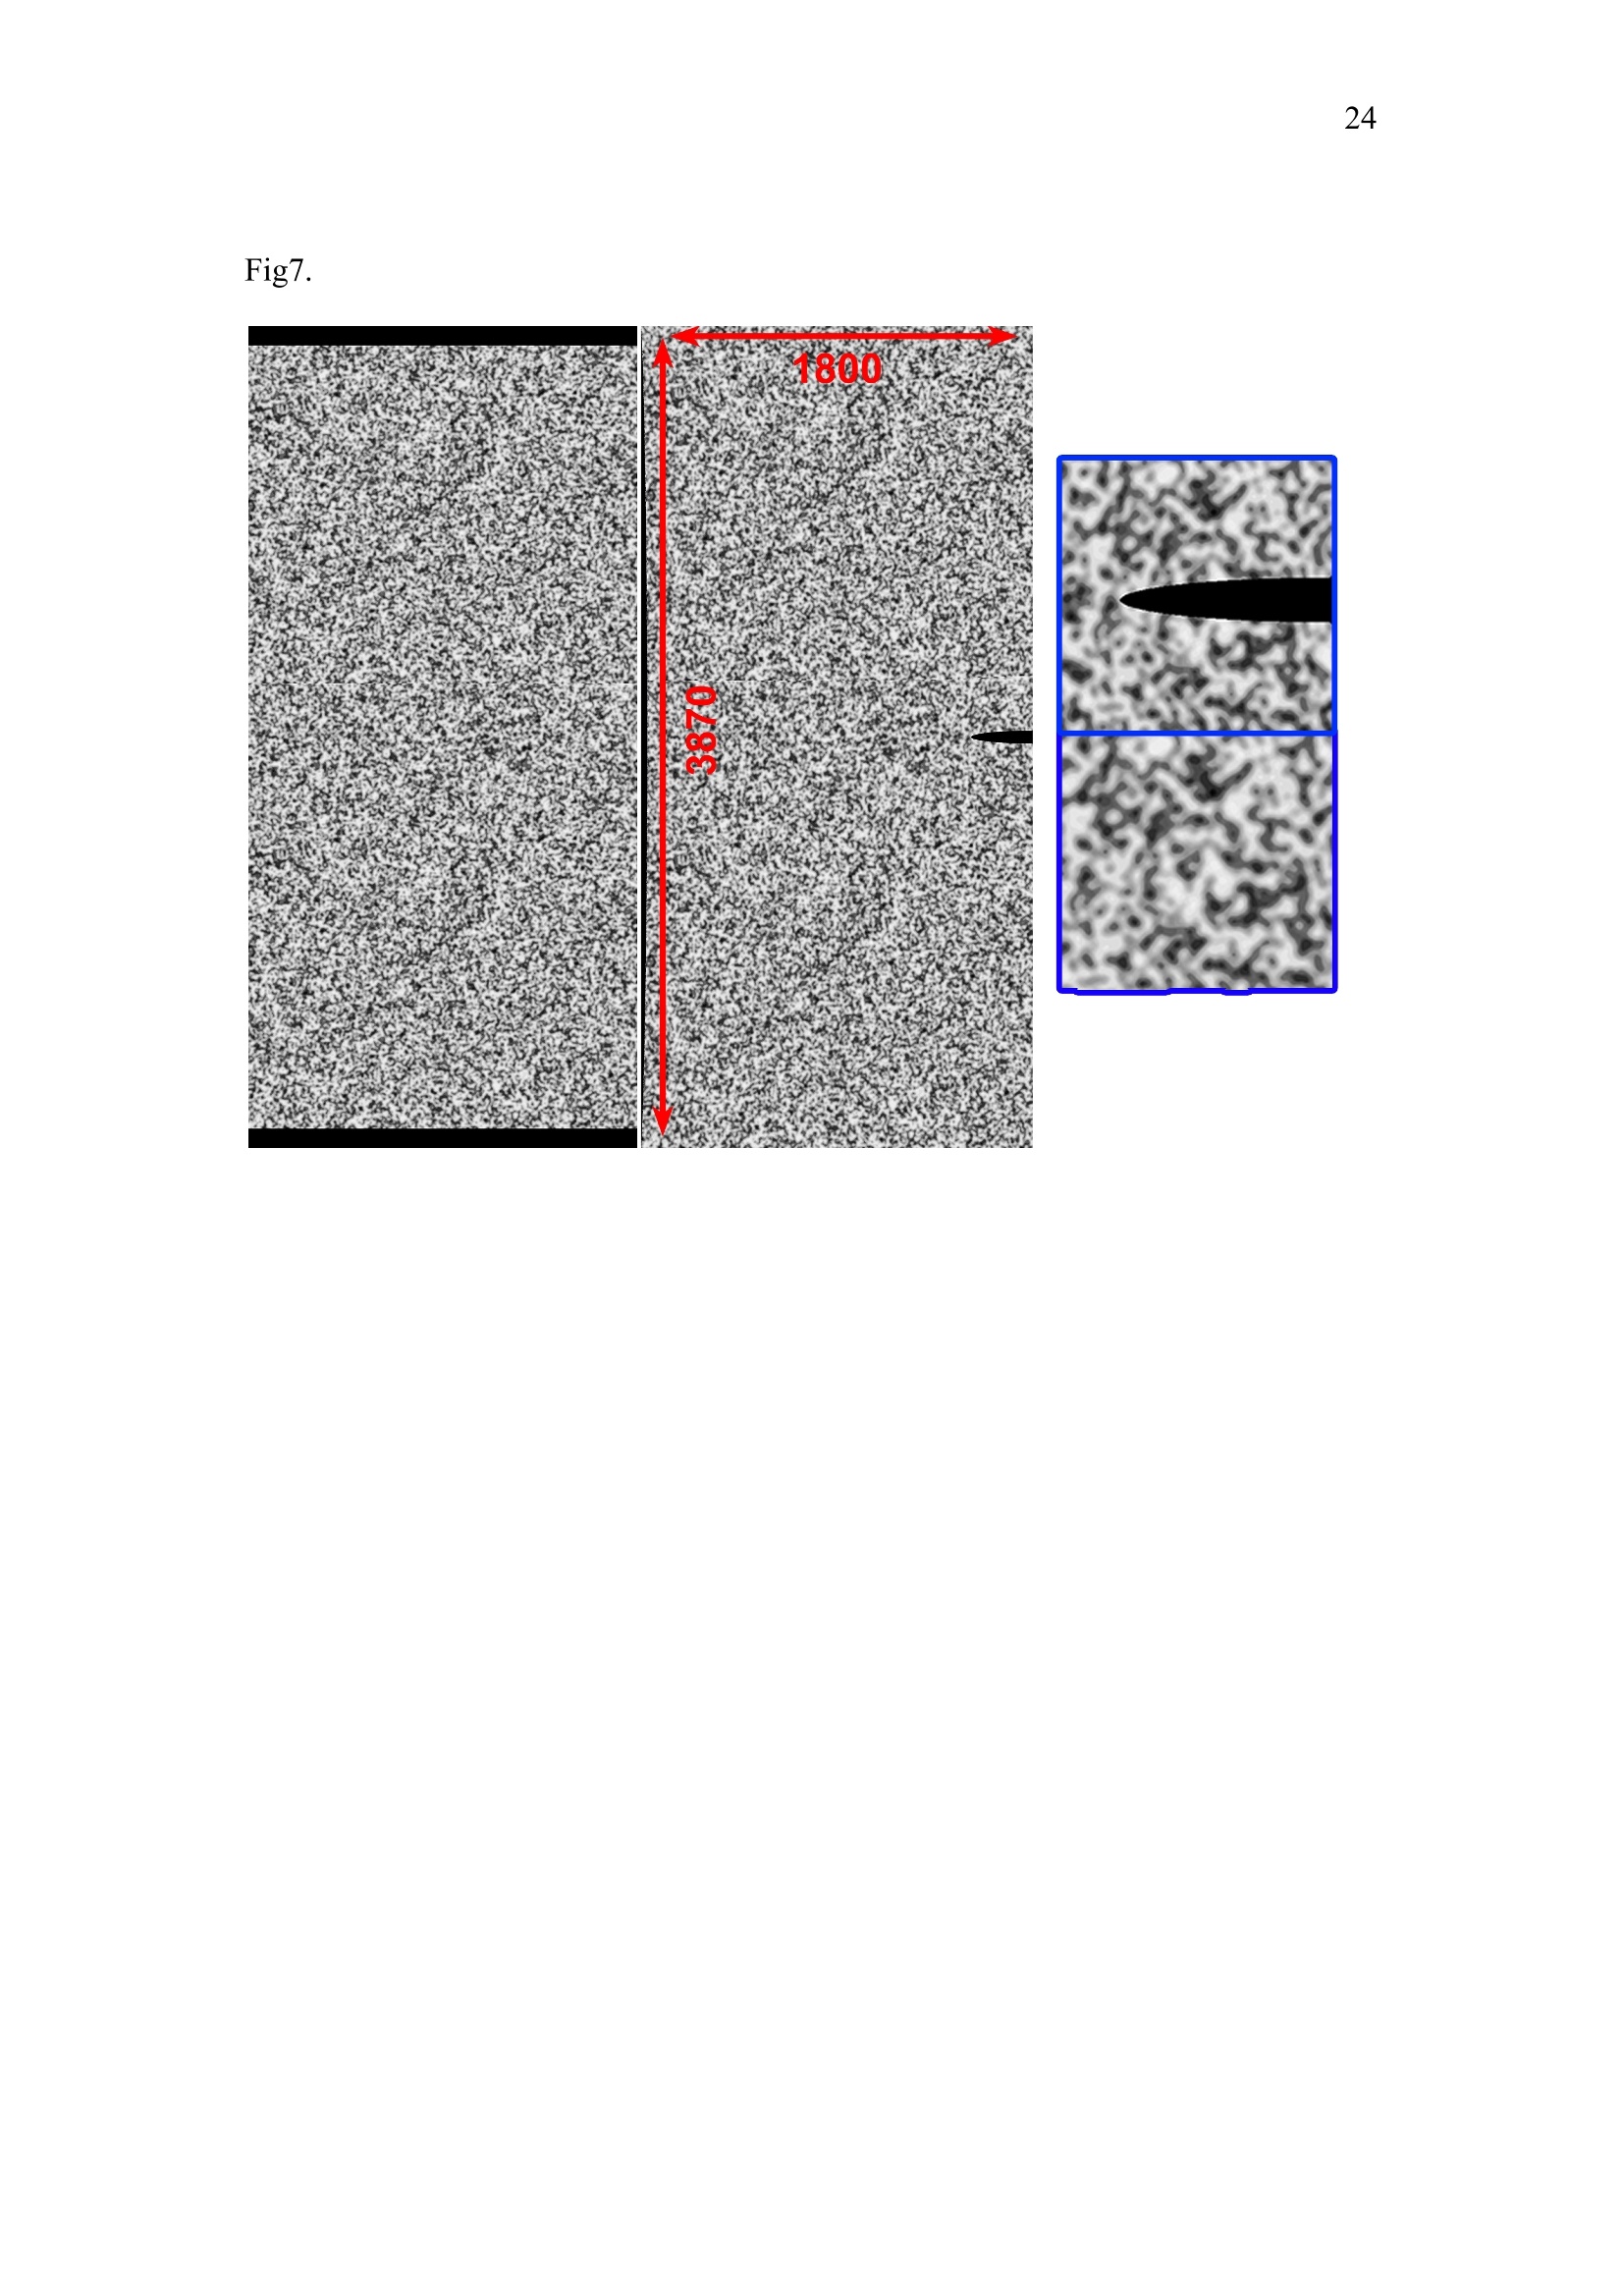
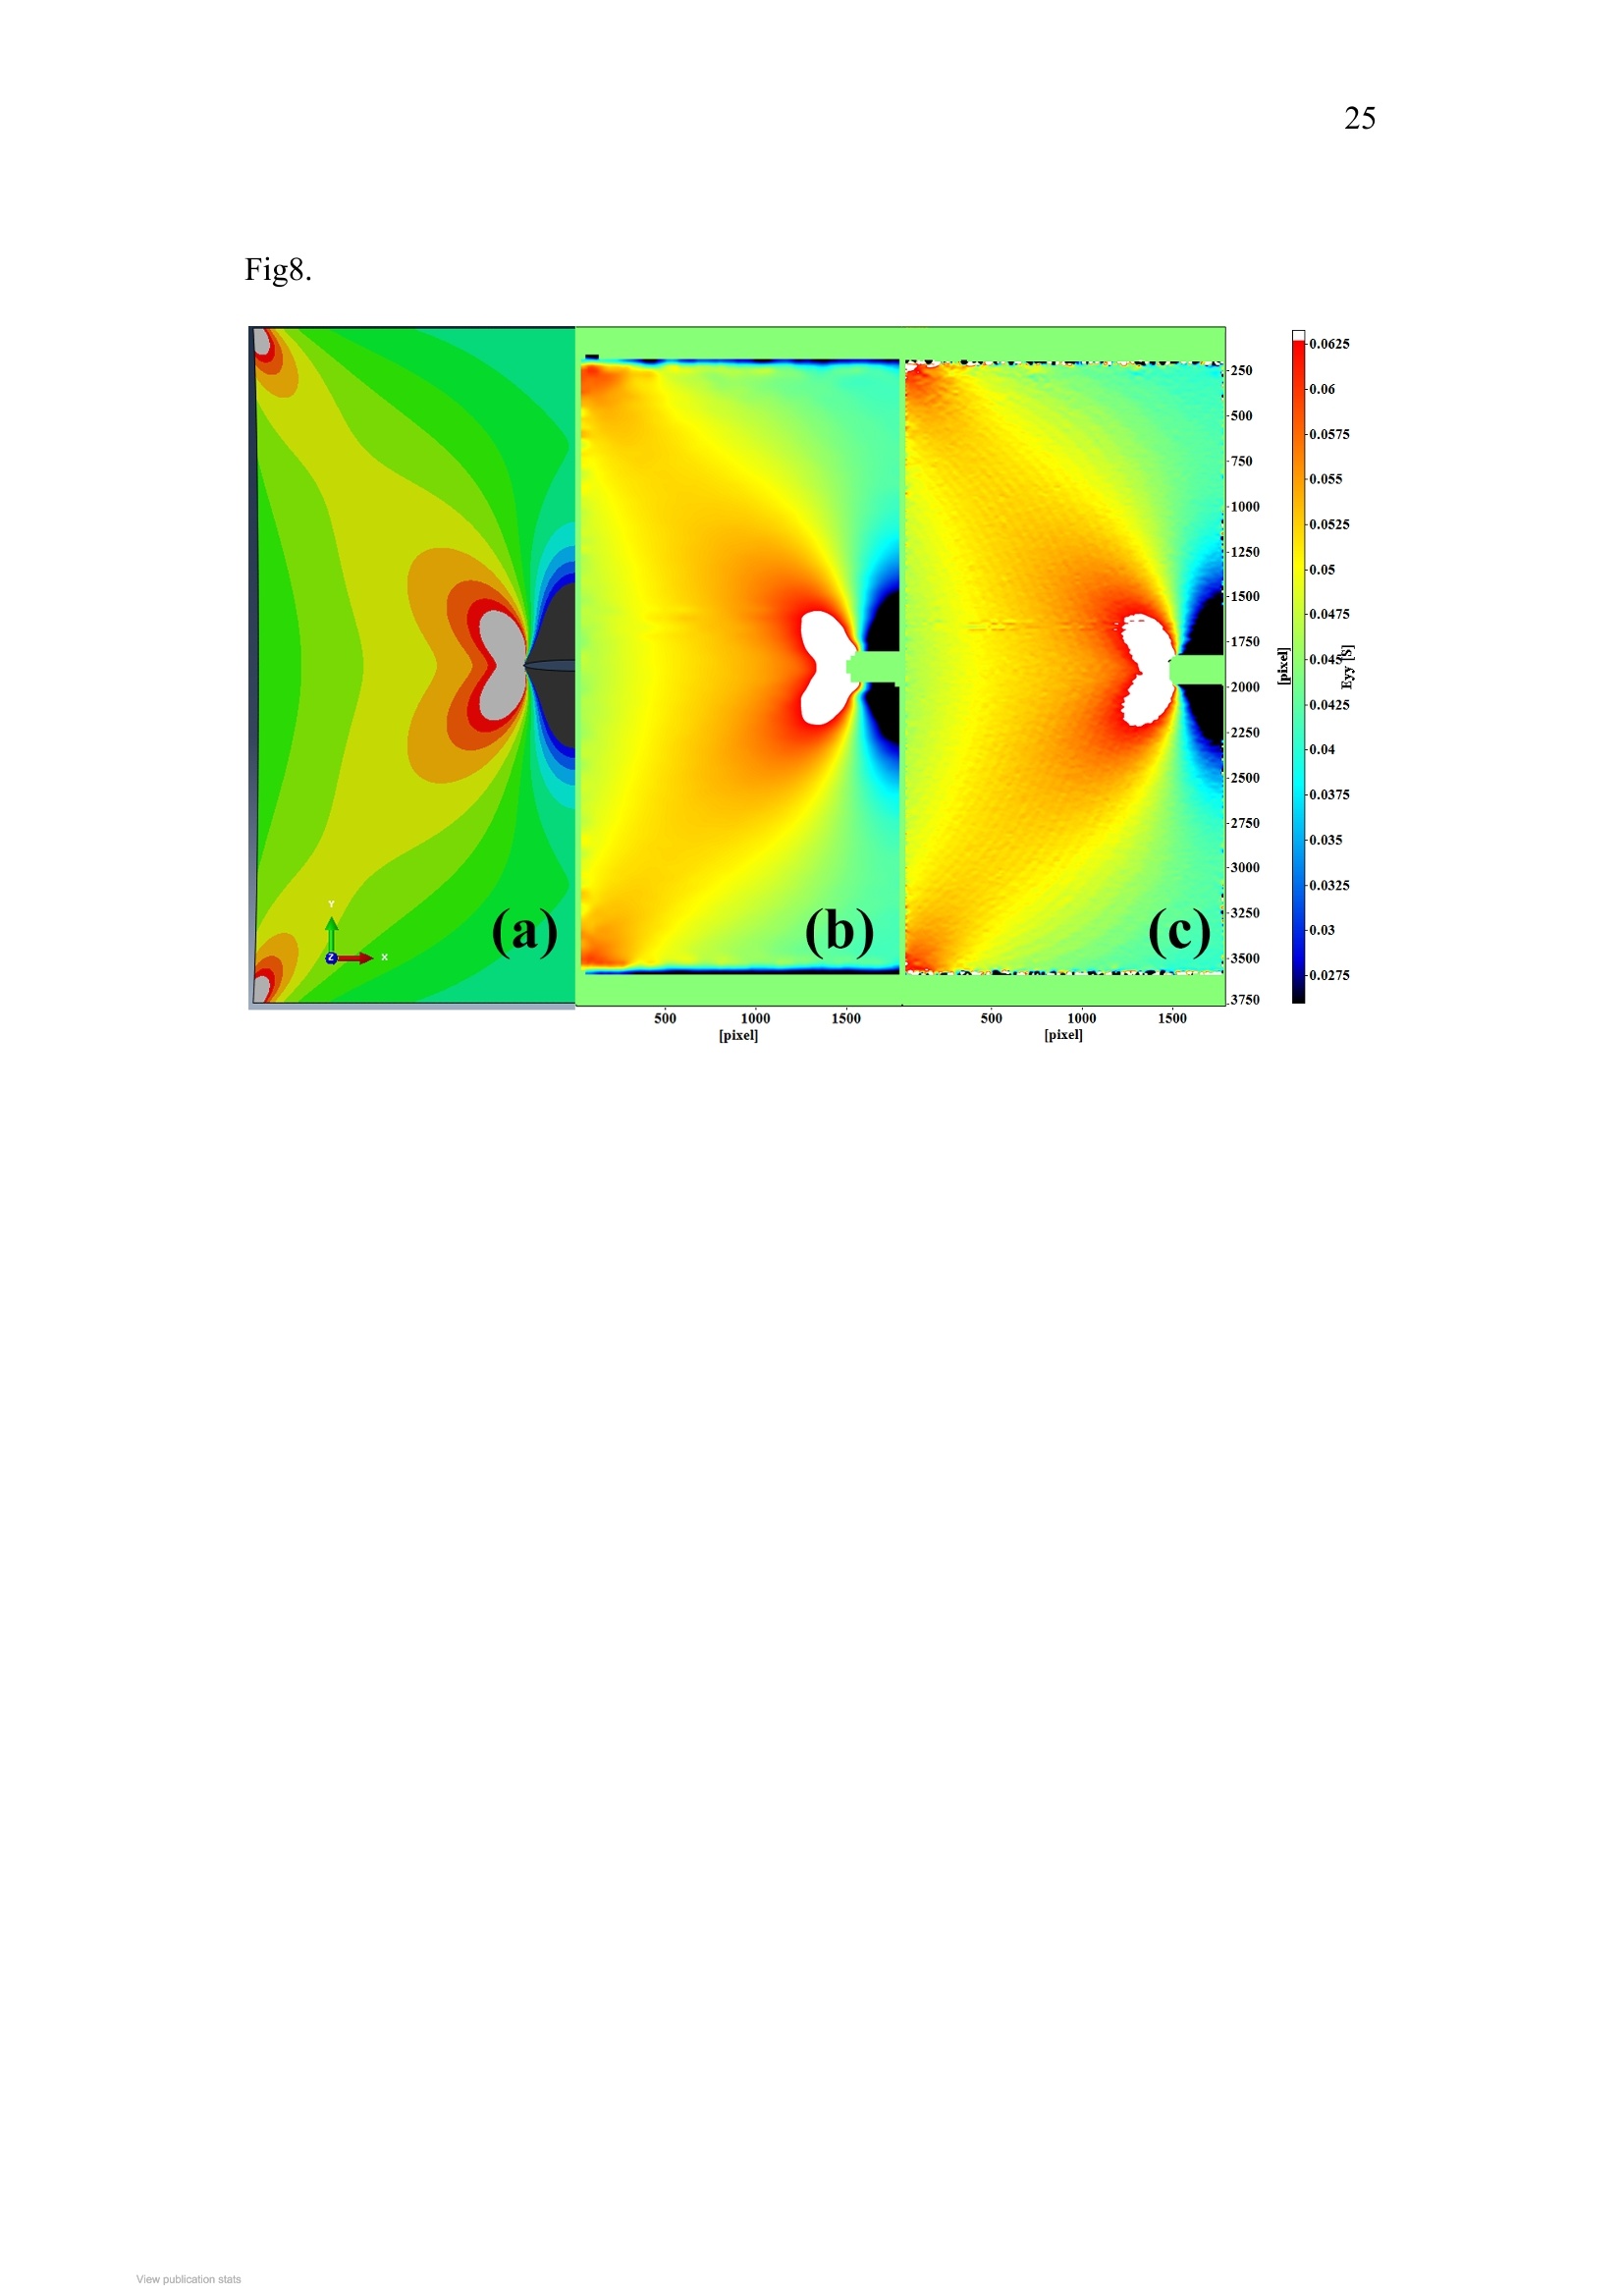
ResearchGateSee discussions, stats, and author profiles for this publication at: https://www.researchgate.net/publication/281449293 2 Advanced 2D and 3D Digital Image Correlationof the Full Field Displacements of Cracks andDefects Conference Paper · May 2014 DOI: 10.1520/STP158420140052 CITATIONS0 READS 110 5 authors, including: Selim BarhliUniversity of Oxford Dave Hollis 5 PUBLICATIONS 6 CITATIONS LaVision UK Ltd10 PUBLICATIONS 106 CITATIONS SEE PROFILE SEE PROFILE Mahmoud Mostafavi Thomas James Marrow University of Bristol University of Oxford 47 PUBLICATIONS 367 CITATIONS 214 PUBLICATIONS 2,351 CITATIONS SEE PROFILE SEE PROFILE Some of the authors of this publication are also working on these related projects: Grain boundary engineering for resistance to intergranular stress corrosion cracking in type 304austenitic stainless steel View project Structural integrity characterisation of nuclear materials via nano additive manufacturing Viewproject All content following this page was uploaded by Selim Barhli on 03 September 2015. The user has requested enhancement of the downloaded file. All in-text references underlined in blue are added to the original documentand are linked to publications on ResearchGate, letting you access and read them immediately. Advanced 2D and 3D Digital ImageCorrelation of the Full FieldDisplacements of Cracks and Defects S.M. Barhli,D. Hollis, B. Wieneke,M. Mostafaviand T.J. Marrow 4 'University of Oxford, Department of Materials, UKLaVision UK LtdUniversity of Sheffield, Department of Mechanical Engineering, UK"University of Oxford, Oxford Martin School, UK Abstract Full field mapping of displacements between successive images by digital imagecorrelation is a powerful and well-established technique, used in fields as diverse asgeo-tectonics, engineering mechanics and materials science. Analysis of three-dimensional images, such as computed X-ray tomographs, is also becoming routine.These techniques provide new ways to study and quantify deformation and failureprocesses: recently they have been applied to detect and study cracks and defects inengineering materials, for instance by coupling the displacement analysis with finiteelement codes to readily extract the crack propagation strain energy release rate(J-Integral). Such analyses increase the richness of the data obtained, for example ( This is the authors’copy of a p a per presented at“Evaluation of Existing and NewSensor Technologies for F atigue, Fracture and Mechanical Testing”, ASTM STP1584. 7-8 May 2014, Toronto, Ontario, Canada. E dited by Jidong Kang, DavidJablonski, and David D u dzinski, The final published version is available at doi:10.1520/ STP158420140052 ) providing information on the mode of loading, and are suitable for the analysis ofengineering components under complex states of stress. This work has highlighted areas where the development of image correlation methodsthat are optimised for analysis of discontinuities would be beneficial, for betterdetection of small cracks and the early development of damage against thebackground displacement field; improved precision in crack displacement fieldmeasurement by intelligent“masking’or analysis algorithms and better integrationwith finite element software packages to make use of advanced tools for 2D and 3Ddeformation analysis. This paper reviews some of this recent work on the analysis of 2D and 3D damage inengineering materials, and describes developments in quantitative analysis of defectsby image correlation. The examples covered include brittle crack propagation innuclear graphite, fatigue loading in magnesium alloys and indentation damage inbrittle and ductile materials. 1. Background Digital image correlation (DIC) is a powerful tool to measure the full fielddisplacement distribution on the surface of specimens. The gradients of thedisplacement field can be used to derive the strain field, which then may be employedfor early detection of fracture nuclei [1, 2]; cracks are revealed by artificially highlevels of strain (i.e. significantly in excess of the elastic limit) due to their openingdisplacements. The effective surface lengths of observed cracks can be obtaineddirectly from the DIC data using image segmentation of the strain map [2]; theselengths will include some contribution from the crack tip plastic zone. The depth ofthe cracks also may be estimated from their opening displacements, for instance withthe assumption ofelastic properties and a semi-elliptical crack geometry [1, 2]. Bythese methods, DIC has been applied to study crack behaviour in a broad range ofmaterials (e.g.[1-3]). For instance, in stress corrosion studies, analysis in this manner of displacement fieldsobtained by DIC has proved very useful for the investigation of crack initiation andpropagation in a range of environments in which cracks are conventionally difficult tostudy [4, 5]. In the case of atmospheric stress corrosion of stainless steel, DICanalysis of optical images discerned crack growth beneath salt layers and adherentcorrosion product deposits; crack development could be monitored over long periodsof time [6] (Figure 1). Precise measurements of crack opening displacements havealso supported the study of short fatigue crack growth [7] and stress corrosioninitiation [8] in studies of a thermally sensitized stainless steel in high temperature, high pressure water (Figure 2), via DIC of optical images obtained in a windowedautoclave. Three-dimensional in situ observation of damage within materials has becomepossible through high-resolution X-ray computed micro-tomography (uXCT) (e.g.[9-11]), aided by the brilliance of synchrotron sources. Digital volume correlation(DVC) can map relative changes in displacement between tomographic datasets [12],allowing quantitative observations of the three-dimensional deformations that occurwithin materials when they respond to loads. In suitable microstructures, thedisplacement resolution is sub-voxel (a voxel is the three-dimensional equivalent of apixel), and both elastic and plastic deformations can be studied [13, 14]. Some recent work conducted on the Joint Engineering, Environmental and Processing(I12-JEEP) beam line at the Diamond Light Source is described here, where theobjective is to show how damage may be characterized by analysis of the three-dimensional displacement fields obtained from uXCT data. The examples presentedinclude; crack propagation in a quasi-brittle porous material (polygranular graphite),sub-indentation cracking in a brittle polycrystalline ceramic (alumina); plasticdeformation and damage development underneath indentations in a ductile metal (Al-SiC composite) and fatigue crack opening behaviour in a Magnesium alloy, the latterusing uXCT data obtained at beamline ID19 of the European Synchrotron RadiationFacility. 2. Three-dimensional Damage Analysis usingDisplacement Fields Polygranular Gilsocarbon graphite is the artificial graphite used in UK’s advanced gascooled (AGR) nuclear fission reactors as a neutron moderator and reflector. Thegraphite studied was in the virgin, i.e. non-irradiated, condition, and is a model quasi-brittle material; crack propagation is accompanied by the development of a micro-cracked fracture process zone (FPZ) [15-16]. Through the combined use of uXCTand DVC, the deformation of the fracture process zone has been measured; full detailsof the experiment and analysis are provided in [16], and a brief summary is givenhere. A short bar chevron notch specimen was used to achieve stable crackpropagation (Figure 3). X-ray tomographic images of the notched region were firstobtained in the un-damaged condition. A sharp wedge was then driven progressivelytowards the base and into the notch to initiate and propagate a crack; tomographicimages were recorded at intervals as the crack propagated and then analysed usingdigital volume correlation. The three-dimensional crack opening displacement (COD)profile is obtained from the relative displacements of the faces of the crack. Thisshows there is a zone with a length of approximately 1.5 mm, in which the material isless stiff and displaces more than expected from linear elastic behavior. This is thefracture process zone where microcracking damage increases the strains in responseto the crack tip stresses; it can be simulated successfully using a cohesive zone finiteelement model (a form of strip yield model). Hardness testing has long been used to interrogate materials to understand theirdeformation behavior and to infer the processes of deformation that have occurredunderneath the indenters (e.g.[17]). With appropriate assumptions or understandingof deformation processes, hardness tests on small samples can be used to evaluate theeffects of changes in microstructure on the mechanical properties of engineeringcomponents. Hardness testing is a surface characterisation technique and, except intransparent materials, it provides no direct observation of the assumed damage anddeformation processes. Indentation in a model ductile metal, an aluminium-siliconcarbide composite (Al-SiC, 15% volume fraction reinforcement), has been studiedusing DVC of uXCT data to measure the sub-surface displacement field in three-dimensions. As with the graphite example, only brief details are presented here; fulldetails including the parameters of the DVC analysis are provided in [18]. Thesample was examined (i) before and (ii) in situ during indentation. The specimen wasindented with a 5 mm radius ZrO2 ball with an in situ loading rig. The referencetomograph was recorded under a small pre-load to reduce rigid body movement, withthe second tomograph under the indentation load. A vertical uXCT slice shows thecomposite’s texture (Figure 4) and although individual particles are not resolved,DVC operates successfully on the contrast from microstructure heterogeneity.Further post-processing to fully remove rigid body movements is needed to interpretthe displacement field,as it is necessary to be able to consider its components withrespect to the coordinate system of the indentation field, which is not necessarilyaligned with that of the observations; this is particularly important in indentationexperiments due to the small displacements within the sample and the high loads that can cause sample movements that are significant compared to these, even with a stiffloading rig. Hence, following DVC analysis, fine rigid body movements and rotations of thedisplacement data matrix were corrected to obtain the displacement field around theindention; a novel and efficient algorithm, reported briefly in [18], and described inmore detail in [19] was used. In brief, using the 3D matrix of displacement vectors,the body translation is first isolated and corrected using an averaging technique. Therotation matrix is then determined by inverting the displacement matrix to find itsEuler angles, which are used to apply a corrective rotation. Following correction ofthe rigid body movements, the displacement field has radial symmetry, hence tosimplify the displacement data presentation, they are transformed to polar coordinates,with the axis of the indentation as origin, to obtain average radial displacements.Except close to the indentation, the displacement field and the reaction force agreewell with an elastic-plastic FE simulation of the indentation, using the measuredindentation depth and properties from tensile tests of the same material. A reverse-modeling analysis via finite element simulation can then be applied to extract materialproperties from such observations to investigate the elastic-plastic behavior of ductilematerials [191. During indentation of brittle materials a system of sub-surface radial cracks isgenerated to accommodate the indentation strain. Lateral cracks,which areapproximately parallel to the surface, arise from the residual strain field surroundingthe indentation plastic zone as the sample is unloaded. Understanding indentation cracking in hard, brittle materials is important, since indentation damage contributesto certain forms of wear [20]. Whilst it is routine to study the surfaces of indentedmaterials to characterise surface cracking, there are very few observations ofindentation cracking below the surface. Such studies are usually destructive, and maymodify the residual stress state during observation. The combined uXCT/DVCmethodology has been applied recently to investigate the cracks that develop in amodel brittle material, polycrystalline alumina, during indentation. Brief details aredescribed here; further information including the parameters of the DVC analysis isprovided in [21]. The polycrystalline Al2O3 sample was indented using a standardVickers pyramidal diamond; the sample was imaged by uXCT (i) before indentation,with small pre-load to fix the sample position; (ii) in situ at the maximum indentationload, and (iii) after removal of the load. TheuXCT images provide a limiteddescription of the cracking, Figure 5a shows a vertical section (peak load and afterunloading) in which one of the four radial cracks is visible by phase contrast. Thehorizontal displacement component for the same section is below, showing therelative opening of the radial crack decreases on load removal. The DVC datatherefore provide a means to study crack opening. Vertical displacements close to thetop surface (Figure 5b) reveal the uplift from the development of lateral cracking afterradial cracking, such that lateral cracks are bounded by the radial cracks. Theexperiment reveals complex patterns of shear and opening as the cracks interact withthe indentation's residual stress field. Such observations may support models thatpredict the stability and development of contact-induced cracks during wear. Cracks interact with the three-dimensional microstructure of the material as theydevelop. These interactions are particularly important for microstructural shortcracks, which are short relative to microstructure length scales, such as grain size;knowledge is required of crack growth rates within grains and the resistance to crackgrowth presented by features such as grain boundaries. Non-destructive 3D grainmapping techniques such as synchrotron X-ray diffraction contrast tomography(DCT) can complement uXCT by providing a description of grain shape and crystalorientation in polycrystalline materials [22]. Short fatigue crack growth behaviour ina cast magnesium alloy (Elektron 21), studied using a combination of DCT and uXCT[23],showed that crack propagation occurred most rapidly along the basal crystalplane, with crack retardation occurring at grain boundaries that required tilt and twistof this plane for continued growth. More recently, using the same tomography data, aDVC analysis measured the displacements between the original undamaged materialand the opening of the crack under load. Consequently the local modes of crackopening were determined for the first time in a short fatigue crack in 3D (full detailsare provided in [24]). Visualisations of the displacements and the maximum principalstrain field in two orthogonal sections across the crack are shown in Figure 6; thelargest displacements are in the vertical z-direction, parallel to the applied load, andthe strain is obtained from the gradients of the displacement field. These images,which are composites of different data types, are not fully quantitative; hot coloursindicate larger displacements and cold colours smaller displacements with the samerange for each figure. Quantitative analysis of the data showed the maximum crack opening displacements to be around 1 um; the basal plane cracks propagated withmixed mode opening. 3. Advanced Analysis of Crack Displacement Fields The studies of cracks that were described in the previous sections have used themeasurement of the crack opening displacements only, provided by two or three-dimensional digital image correlation analysis. However, it has also been shown, fortwo-dimensional analysis so far, that the displacement fields around cracks can beused, in particular to calculate the stress field via direct finite element solution [25].From this, the elastic strain energy release rate (i.e. J-integral) associated with crackgrowth may be obtained. The J-integral describes the thermodynamic driving forcefor crack propagation, which is a critical parameter in any study of fracture or fatigue.The technique is based on the contour integral method and the energy release rate iscalculated by taking contours of the calculated strain field around the crack tip. DICobservation of displacement fields therefore has the potential to measure theparameters that control crack propagation. A key issue, however, is the need to obtainaccurate displacement fields close to cracks; these are interfaces and conventionalDIC algorithms are prone to error under such conditions. Solutions to this are neededbefore three-dimensional analysis of cracks and the driving force for theirdevelopment under complex states of stress can be studied. In addition to improvedprecision in crack displacement field measurement, for instance by intelligent“masking”or analysis algorithms, better integration with finite element software packages is also needed to make use of the available tools for 2D and 3D deformationanalysis. Advanced image correlation methods may also aid detection of small cracksand the early development of damage against the background displacement field. In order to support the development of these tools, it is necessary to have a reliablemethod that can deform images, using the known deformation field of a crack, inorder to assess the quality of the measurement of that deformation field by digitalimage correlation, and the subsequent calculation of parameters such as the J-integralthat depend on this displacement field. As part of this process, a tool (ODIN) has beendeveloped; this is a MATLAB code that allows one to accurately distort a 2D imagein an arbitrary manner; a 3D code is under development. Using an input FE elementnodal displacement field that describes the required deformation, ODIN interpolates apixel-wise displacement field using the shape function of the elements, changing thepositions of points of known intensity in the original image to new positions in thedeformed image. A cubic interpolation algorithm is then used to create the finaldeformed image, which has a regular pixel array; a B-spline interpolator is beingconsidered in future developments. The errors inherent to ODIN process are notreadily measurable, but an assessment using deformations with known mathematicalfunctions (i.e. sine waves) gives an average relative error of 0.05% in the distortedimage pixel intensity values when using the cubic interpolator with a 16 bit image.The maximum relative error was 0.1%. Errors in the displacement field that is measured after DIC analysis of the ODIN-deformed image, relative to its original, arise from the combined effects of the ODIN deformation and the usual measurement errors that occur from the DIC algorithms;the latter may be quantified by the conventional comparison of displaced images, butnot the former. An example that illustrates the magnitude of the errors and theirsensitivity to the DIC parameters is presented for a mode I centre-cracked platemodel, which was chosen to obtain the crack's elastic strain energy release rate from aDIC analysis of the displacement field. The reference model is a60 mm x 60 mmplate with a centre crack of 10 mm length loaded in tension; the linear elastic analysisuses the material properties of steel (E=270 GPa, Poisson’s ratio=0.33) with aregular finite element size of 0.20 mm (ABAQUS, CPS4 elements; 4 node planestress quadrilateral with full integration). The FE obtained displacement field was used,with ODIN, to deform an image(Figure 7). This was a digitally modified picture of a concrete surface, chosen as itprovides a good degree of heterogeneity over a wide range of length scales; the imagesize was 1800 x 3870 pixels. The DIC analysis to obtain displacement and strainfields was performed using the LaVision StrainMaster software that was also used forthe other image correlation analyses described in this paper; a multi-pass approachwas applied with final pass interrogation window or subset sizes of 128, 96, 64, 48and 32 pixels at 75% overlap. An arbitrary rectangular mask was applied to the crack;the mask was 20 pixels wide and extended to 5 pixels beyond the crack tip position.Calculation of the J-integral from the DIC result was achieved by importing theobtained displacement fields into ABAQUS, using a Python code to create therequired input file. To quantify the relative effects of the DIC analysis parameters, the obtained J-Integrals, calculated using only contours that did not touch the imageborder, were then normalised by the J-Integral that was obtained in the original FEsimulation. Visual comparison of the strain fields of the original FE model and those obtained byDIC of the deformed images (Figure 8) shows good agreement; however, someperiodic noise appears as the final interrogation subset size decreases. There is alsodata loss adjacent to interfaces, i.e. the crack tip and image borders, which is usual inDIC with conventional algorithms. The periodicity is considered, at present, to be dueto effects of interference between the ODIN interpolator and the interpolationalgorithms used in the DIC analysis; the effect increases as the window size decreasessince the strain is evaluated on smaller subsets that reduce the effect of averaging.Nonetheless, comparison of the displacement fields found that typically the relativeerror in strain was less than 0.09% for 90% of the dataset, with errors approaching 1%at positions close to the masked crack tip The J-integrals were contour independent, with an error that depends on theinterrogation subset or window size. Some of this error can be attributed to the loss ofdisplacement data closest to the crack tip, where the strain energy density is highest;the increasing loss of its contribution to the J-integral thus becomes more significantas the relative subset size increases.With decreasing window size, the error in thedisplacements also becomes larger, and this causes a progressive loss in accuracy.Further work is in progress to evaluate improved methods for DIC analysis, forinstance using anisotropic interrogation subsets aligned with the displacement field and subset-splitting [26] to improve the displacement measurements close to thecrack. The aim is to identify the required experimental and analysis conditions thatreliably achieve an error of better than 10%, which will be acceptable for engineeringproperty measurements. 4. Conclusion Digital image correlation analysis provides a useful tool for the measurement of thedisplacement fields associated with cracks, which can be mapped in two or three-dimensions. In principle, fracture mechanics parameters such as the J-integral can beextracted, given a sufficiently accurate, high resolution mapping of the displacements.However, the effects of image correlation parameters are complex; significantunderestimation of the J-integral can occur if the displacements close to the crack tipare not sufficiently measured. Simulation of image deformation provides a means toevaluate the effects of image correlation parameters, and so provides a tool to supportimage correlation algorithm development and also experiment design. Use ofthesemethods with DVC (Digital Volume Correlation) applied to tomographic imageswould allow the accurate characterisation of 3D cracks as a three-dimensional object,and enable their study under complex states of loading. 5. Acknowledgements MM and TJM acknowledge the support of Oxford Martin School. The authorsacknowledge the beam time awards at the Diamond Light Source (Experiments EE9036 and EE7730) and appreciate the considerable help of M. Jordan, H. Cetinel,S. Barhli, R. Atwood, C. Cooper and R. Bradley to conduct the experiments. 6. References 1. Li, H., Duff, J. and Marrow T.J, In-situ observation of crack nucleation in nucleargraphite by digital image correlation (2008) Proceedings ofPVP2008 ASMEPressure Vessels and Piping Division Conference, Chicago (USA). PaperPVP2008-61136. 2...Mostafavi, M. and Marrow, T.J. (2011) In situ observation of crack nuclei in poly-granular graphite under ring-on-ring equi-biaxial and flexural loading,Engineering Fracture Mechanics 78 1756-1770 3.. Aswad, M.A. and Marrow, T.J. (2010) Intergranular crack nucleation inpolycrystalline alumina, 18th European Conference on Fracture, ECF18, Dresden(Germany). 4.Rahimi, S.,Engelberg, D. L., Duff, J. A. and Marrow, T. J. (2009) In-situObservation of Intergranular Crack Nucleation in a Grain Boundary ControlledAustenitic Stainless Steel, Journal of Microscopy 233 423-431 5. Kovac,J., Alaux, C., Marrow, T.J., Govekar,E. and Legat, A. (2010) Correlationsof electrochemical noise, acoustic emission and complementary monitoringtechniques during intergranular stress-corrosion cracking of austenitic stainlesssteel, Corrosion Science 52 2015-2025 6.. Cook, A., Duff, J. Stevens, N., Lyon, S., Sherry, A., and Marrow, T.J. (2009)Preliminary Evaluation of Digital Image Correlation for In-situ Observation of Low Temperature Atmospheric-Induced Chloride Stress Corrosion Cracking inAustenitic Stainless Steels, 216th ECS Meeting, Vienna, (Austria) 7.Duff, J. A. and Marrow, T. J. (2012) In situ observation of short fatigue crackpropagation in oxygenated water at elevated temperature and pressure. CorrosionScience, 68 34-43 8..Stratulat, A., Duff, J. and Marrow, T.J. (2014) Grain boundary structure andintergranular stress corrosion crack initiation in high temperature water of athermally sensitised austenitic stainless steel, observed in situ, Corrosion Science,85 428-435 9..Stock, S. R., (1999) X-ray microtomography of materials, International MaterialsReview 44 141-164. 10. Maire, E., Buffiere, J.-Y., Salvo, L., Blandin, J. J., Ludwig, W., and Letang, J. M.(2001) On the application of X-ray microtomography in the field of materialsscience, Adv. Eng. Mater. 3 539-546. 11. Marrow, T. J., Buffiere,J.-Y., Withers, P. J., Johnson, G. and Engelberg, D.(2004) High resolution X-ray tomography of short fatigue crack nucleation inaustempered ductile cast iron, Int. J. Fatigue 26,717-725. 12. Bay, B. K., Smith, T. S., Fyhire, D. P. and Saad, M. (1999) Digital volumecorrelation: three-dimensional strain mapping using X-ray tomography. Exp.Mech.39 217-226. 13. Forsberg, F. and Siviour, C. R. (2009) 3D deformation and strain analysis incompacted sugar using x-ray microtomography and digital volume correlation.Meas. Sci. Tech., 20 art. no. 095703. 14. Barranger, Y., Doumalin, P., Dupre, J.-C., Germaneau, A., Hedan, S. and Valle,V. (2009) Evaluation of three-dimensional and two-dimensional full displacementfields of a single edge notch fracture mechanics specimen, in light of experimentaldata using X-ray tomography. Eng. Fract. Mech. 76 2371-2383. 15. Mostafavi, M.,McDonald, S. A., Mummery, P. M. and Marrow,T.J.(2013)Observation and quantification of three-dimensional crack propagation in poly-granular graphite. Eng. Fract. Mech. 110 410-420. 16. Mostafavi, M., Baimpas, N., Tarleton, E., Atwood, R. C., McDonald, S. A.,Korsunsky, A. M. and Marrow, T. J. (2013) Three-dimensional crack observation,quantification and simulation in a quasi-brittle material. Acta Mater. 61 6276-6289. 17. Giannakopoulos and A.E., Suresh, S. (1999) Determination of elastoplasticproperties by instrumented sharp indentation. Scr. Mater. 40 1191-1198. 18. Mostafavi, M., Vertyagina, Y., Reinhard, C., Bradley, R., Jiang, X., Galano andM., Marrow, J. (2014) 3D studies of indentation by combined X-ray tomographyand digital volume correlation. Key Eng. Mater. 592-593 14-21. 19. Mostafavi, M., et al.(2015) Yield behavior beneath hardness indentations inductile metals, measured by three-dimensional computed X-ray tomography anddigital volume correlation. Acta Materialia, 82 468-482. 20.Lawn,B.R. (1998) Indentation of ceramics with spheres: A century after Hertz. J.Am. Ceram. Soc. 81, 1977-1994. 21. Vertyagina, Y., Mostafavi, M.,Reinhard, C., Atwood, R. and Marrow, T. J.(2014) In situ quantitative three-dimensional characterisation of sub-indentationcracking in polycrystalline alumina. J. Europ. Ceram. Soc., In Press 22. King, A., Johnson, G., Engelberg, D., Ludwig, W., and Marrow, J. (2008)Observations of intergranular stress corrosion cracking in a grain-mappedpolycrystal. Science 321(5887), 382-5 23. King, A., Ludwig, W., Herbig, M., Buffiere,J.-Y., Khan, A. A., Stevens, N., andMarrow,T. J. (2011) Three-dimensional in situ observations of short fatigue crackgrowth in magnesium. Acta Materialia, 59 6761-6771 24. Marrow, T. J., Mostafavi, M., Hashimoto, T., and Thompson, G. E. (2014) Aquantitative three-dimensional in situ study of a short fatigue crack in amagnesium alloy. International Journal ofFatigue., 66 183-193 25. Becker, T.H., M. Mostafavi, R.B. Tait, and T.J. Marrow (2011) An Approach toCalculate the J-Integral by Digital Image Correlation Displacement FieldMeasurement, Fatigue and Fracture of Engineering Materials and Structures, 35971-984 26. Poissant, J. and F. Barthelat (2009) A Novel“Subset Splitting”Procedure forDigital Image Correlation on Discontinuous Displacement Fields." ExperimentalMechanics. 50 353-364. 7. Tables Table 1: Summary of J-integral values (standard deviation is given in brackets) obtained as a function of the interrogation subsetsize, in terms of pixels and relative size of the subset to the crack (normalised using 32 pixels) FE ElementSize (pixels) Subset Size (pixels) Subset Size (relative) NormalisedJ-integral 30 128 4 0.66 (0.017) 96 3 0.96 (0.008) 64 2 0.85 (0.006) 48 1.5 0.80 (0.003) 8. Figures captions Figure 1: Stress corrosion crack nucleation in austenitic stainless steel beneath a chloride salt deposit (under a tensile staticstress); (a) Optical images at 1500 hours, 1668 hours, 1836 hours, and 2004 hours (left to right). (b) Strain map (calibrated toshow relative crack opening displacements) relative to first image (1500 hours) at 1668 hours, 1836 hours and 2004 hours (left toright). The final image includes the strain map from 1836 hours overlaid on optical image of the failed specimen. [6] Figure 2: Visualisations at different time intervals of an intergranular stress corrosion initiated in austenitic stainless steel,observed in situ in high temperature water. The crack openings are represented as strains calculated from the digital imagecorrelation measured displacements. The crack initiation site is indicated by the red rectangle. The strain map is superposed onan optical observation of the sample at the end of the test. The strain scale is qualitative and indicates the magnitude of crackopening displacement; dark blue represents low strain and red represents high strain. The maximum crack opening increasedfrom 0.2 um at Day 22 to 0.9 um at Day 26. [8] Figure 3: Measurement of crack opening displacement profile by synchrotron tomography in polygranular graphite; HR, SRdenote high resolution (1.8 um voxel) and standard resolution (3.6 um voxel) data. The measured profiles are compared withelastic FE and cohesive fracture FE simulations for the observed 3.6 mm crack length. The fracture process zone has the effectof increasing the crack opening, such that the crack behaves equivalent to a longer elastic crack.[16] Figure 4: Vertical section ofthe uXCT data of Herzian indention in Al-15%SiC composite (left). The DVC-measured verticalstrain is shown as a contour map (right) with vectors of the displacement field superposed. [18] Figure 5: Vicker’s indentation of Al2O3 ceramic; (a) tomographic vertical cross-sections of sample under load and unloaded. Thecorresponding maps of the horizontal displacement in the area presented by a dashed rectangle are shown below; (b) maps ofvertical displacements in a horizontal plane under the indentation, showing the indentation deformation and the uplift from lateralcracking. The radial cracks are indicated.[21]. Figure 6: Visualisations of digital volume correlation measurement of crack opening behavior for a short fatigue crack in Mg-alloy, observed by synchrotron X-ray tomography: a) z-displacement; b) maximum principal strain. The scale is qualitative (hotcolours are higher values). [24] Figure 7: Original image from picture of a concrete surface and ODIN-distorted image, with zoomed image of the crack shown. Figure8: Comparison between the original Finite Element strain field, and example extraction of the field following DIC ofdeformed images; the strain component parallel to the applied stress is shown: (a) Original FE field, (b) DIC analysis, 96x96pixel interrogation subset (c) DIC analysis 32x32 pixel interrogation subset 9. Figures (b) Day 26 Fig3. Fig4. Fig5. Fig 6. Fig8. Viev Full field mapping of displacements between successive images by digital imagecorrelation is a powerful and well-established technique, used in fields as diverse asgeo-tectonics, engineering mechanics and materials science. Analysis of threedimensionalimages, such as computed X-ray tomographs, is also becoming routine.These techniques provide new ways to study and quantify deformation and failureprocesses: recently they have been applied to detect and study cracks and defects inengineering materials, for instance by coupling the displacement analysis with finiteelement codes to readily extract the crack propagation strain energy release rate(J-Integral). Such analyses increase the richness of the data obtained, for example providing information on the mode of loading, and are suitable for the analysis ofengineering components under complex states of stress.This work has highlighted areas where the development of image correlation methodsthat are optimised for analysis of discontinuities would be beneficial, for betterdetection of small cracks and the early development of damage against thebackground displacement field; improved precision in crack displacement fieldmeasurement by intelligent “masking’ or analysis algorithms and better integrationwith finite element software packages to make use of advanced tools for 2D and 3Ddeformation analysis.This paper reviews some of this recent work on the analysis of 2D and 3D damage inengineering materials, and describes developments in quantitative analysis of defectsby image correlation. The examples covered include brittle crack propagation innuclear graphite, fatigue loading in magnesium alloys and indentation damage inbrittle and ductile materials.
确定

还剩24页未读,是否继续阅读?

产品配置单

北京欧兰科技发展有限公司为您提供《固体材料中裂纹、缺陷、位移形变、应变等检测方案(其它无损检测仪器/设备)》,该方案主要用于其他中裂纹、缺陷、位移形变、应变等检测,参考标准--,《固体材料中裂纹、缺陷、位移形变、应变等检测方案(其它无损检测仪器/设备)》用到的仪器有LaVision StrainMaster材料应变形变成像测量系统、Imager sCMOS PIV相机
推荐专场


相关方案
更多
该厂商其他方案
更多