


方案详情
文
采用LaVision公司的PIV系统。激光器能量为双脉冲400毫焦。对7马赫高超音速风洞中的15度-45度双斜面流场进行了测量。获得了流场中激波的空间分布的详细信息。
方案详情

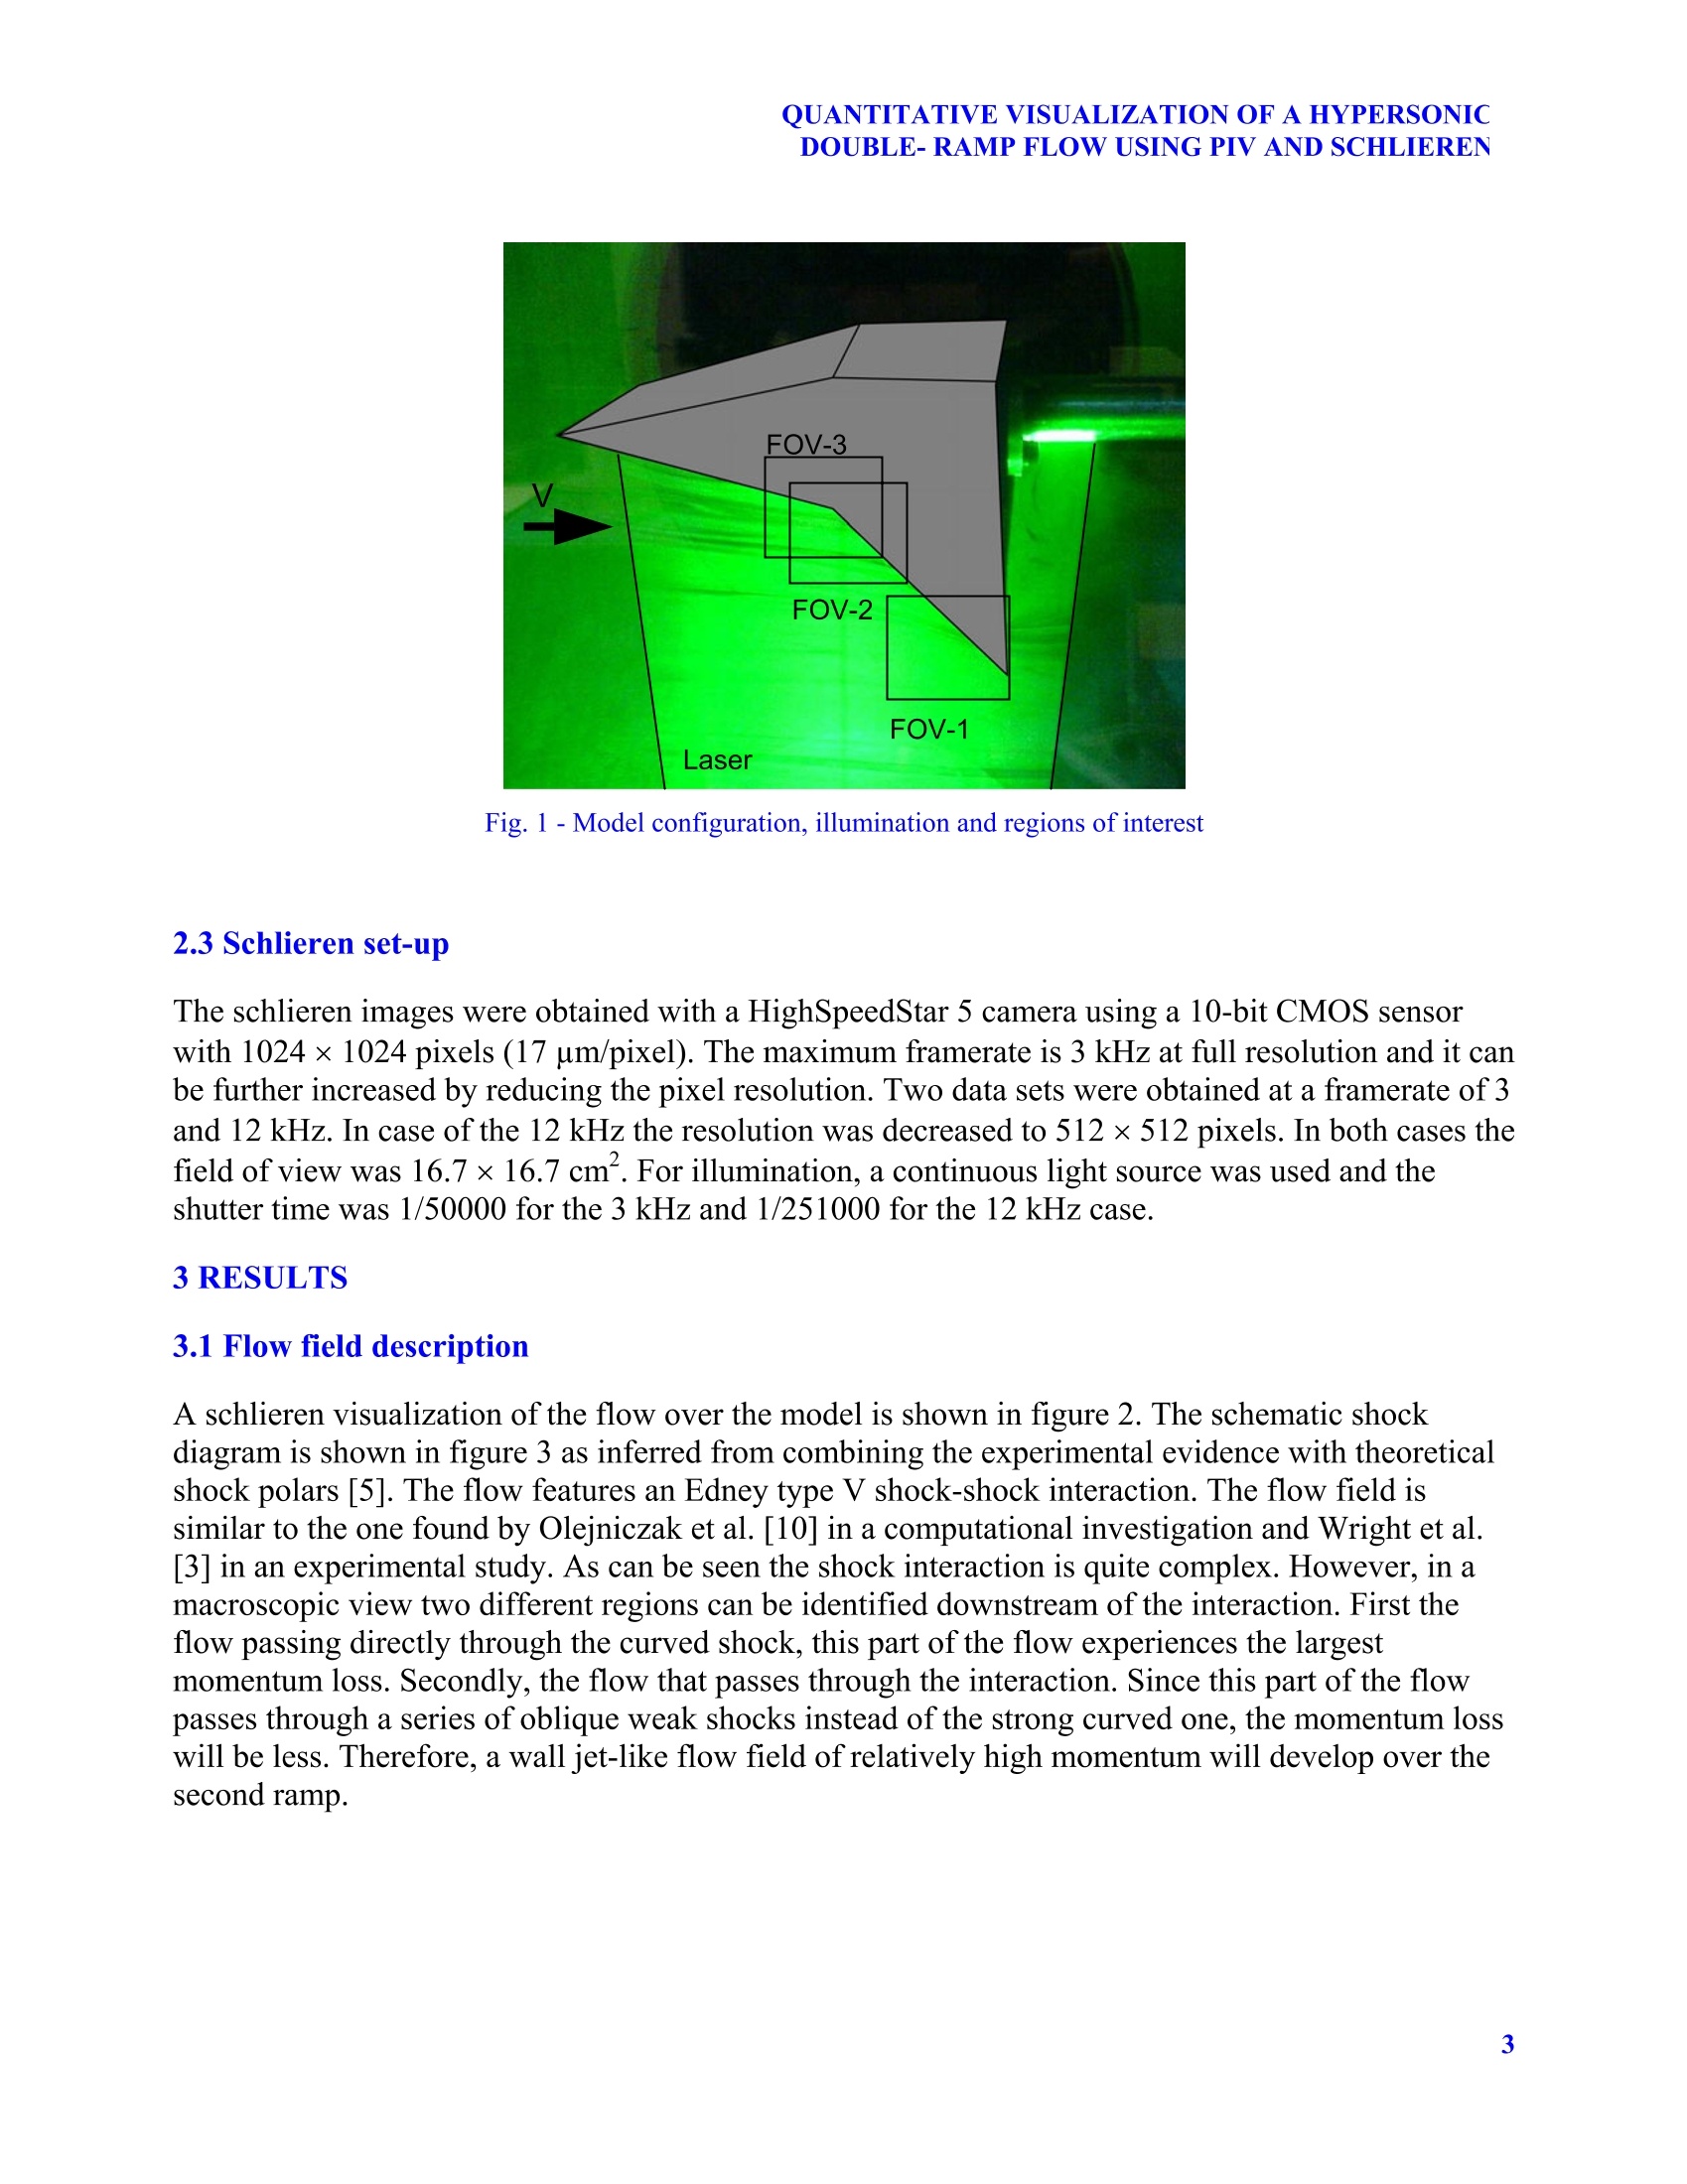
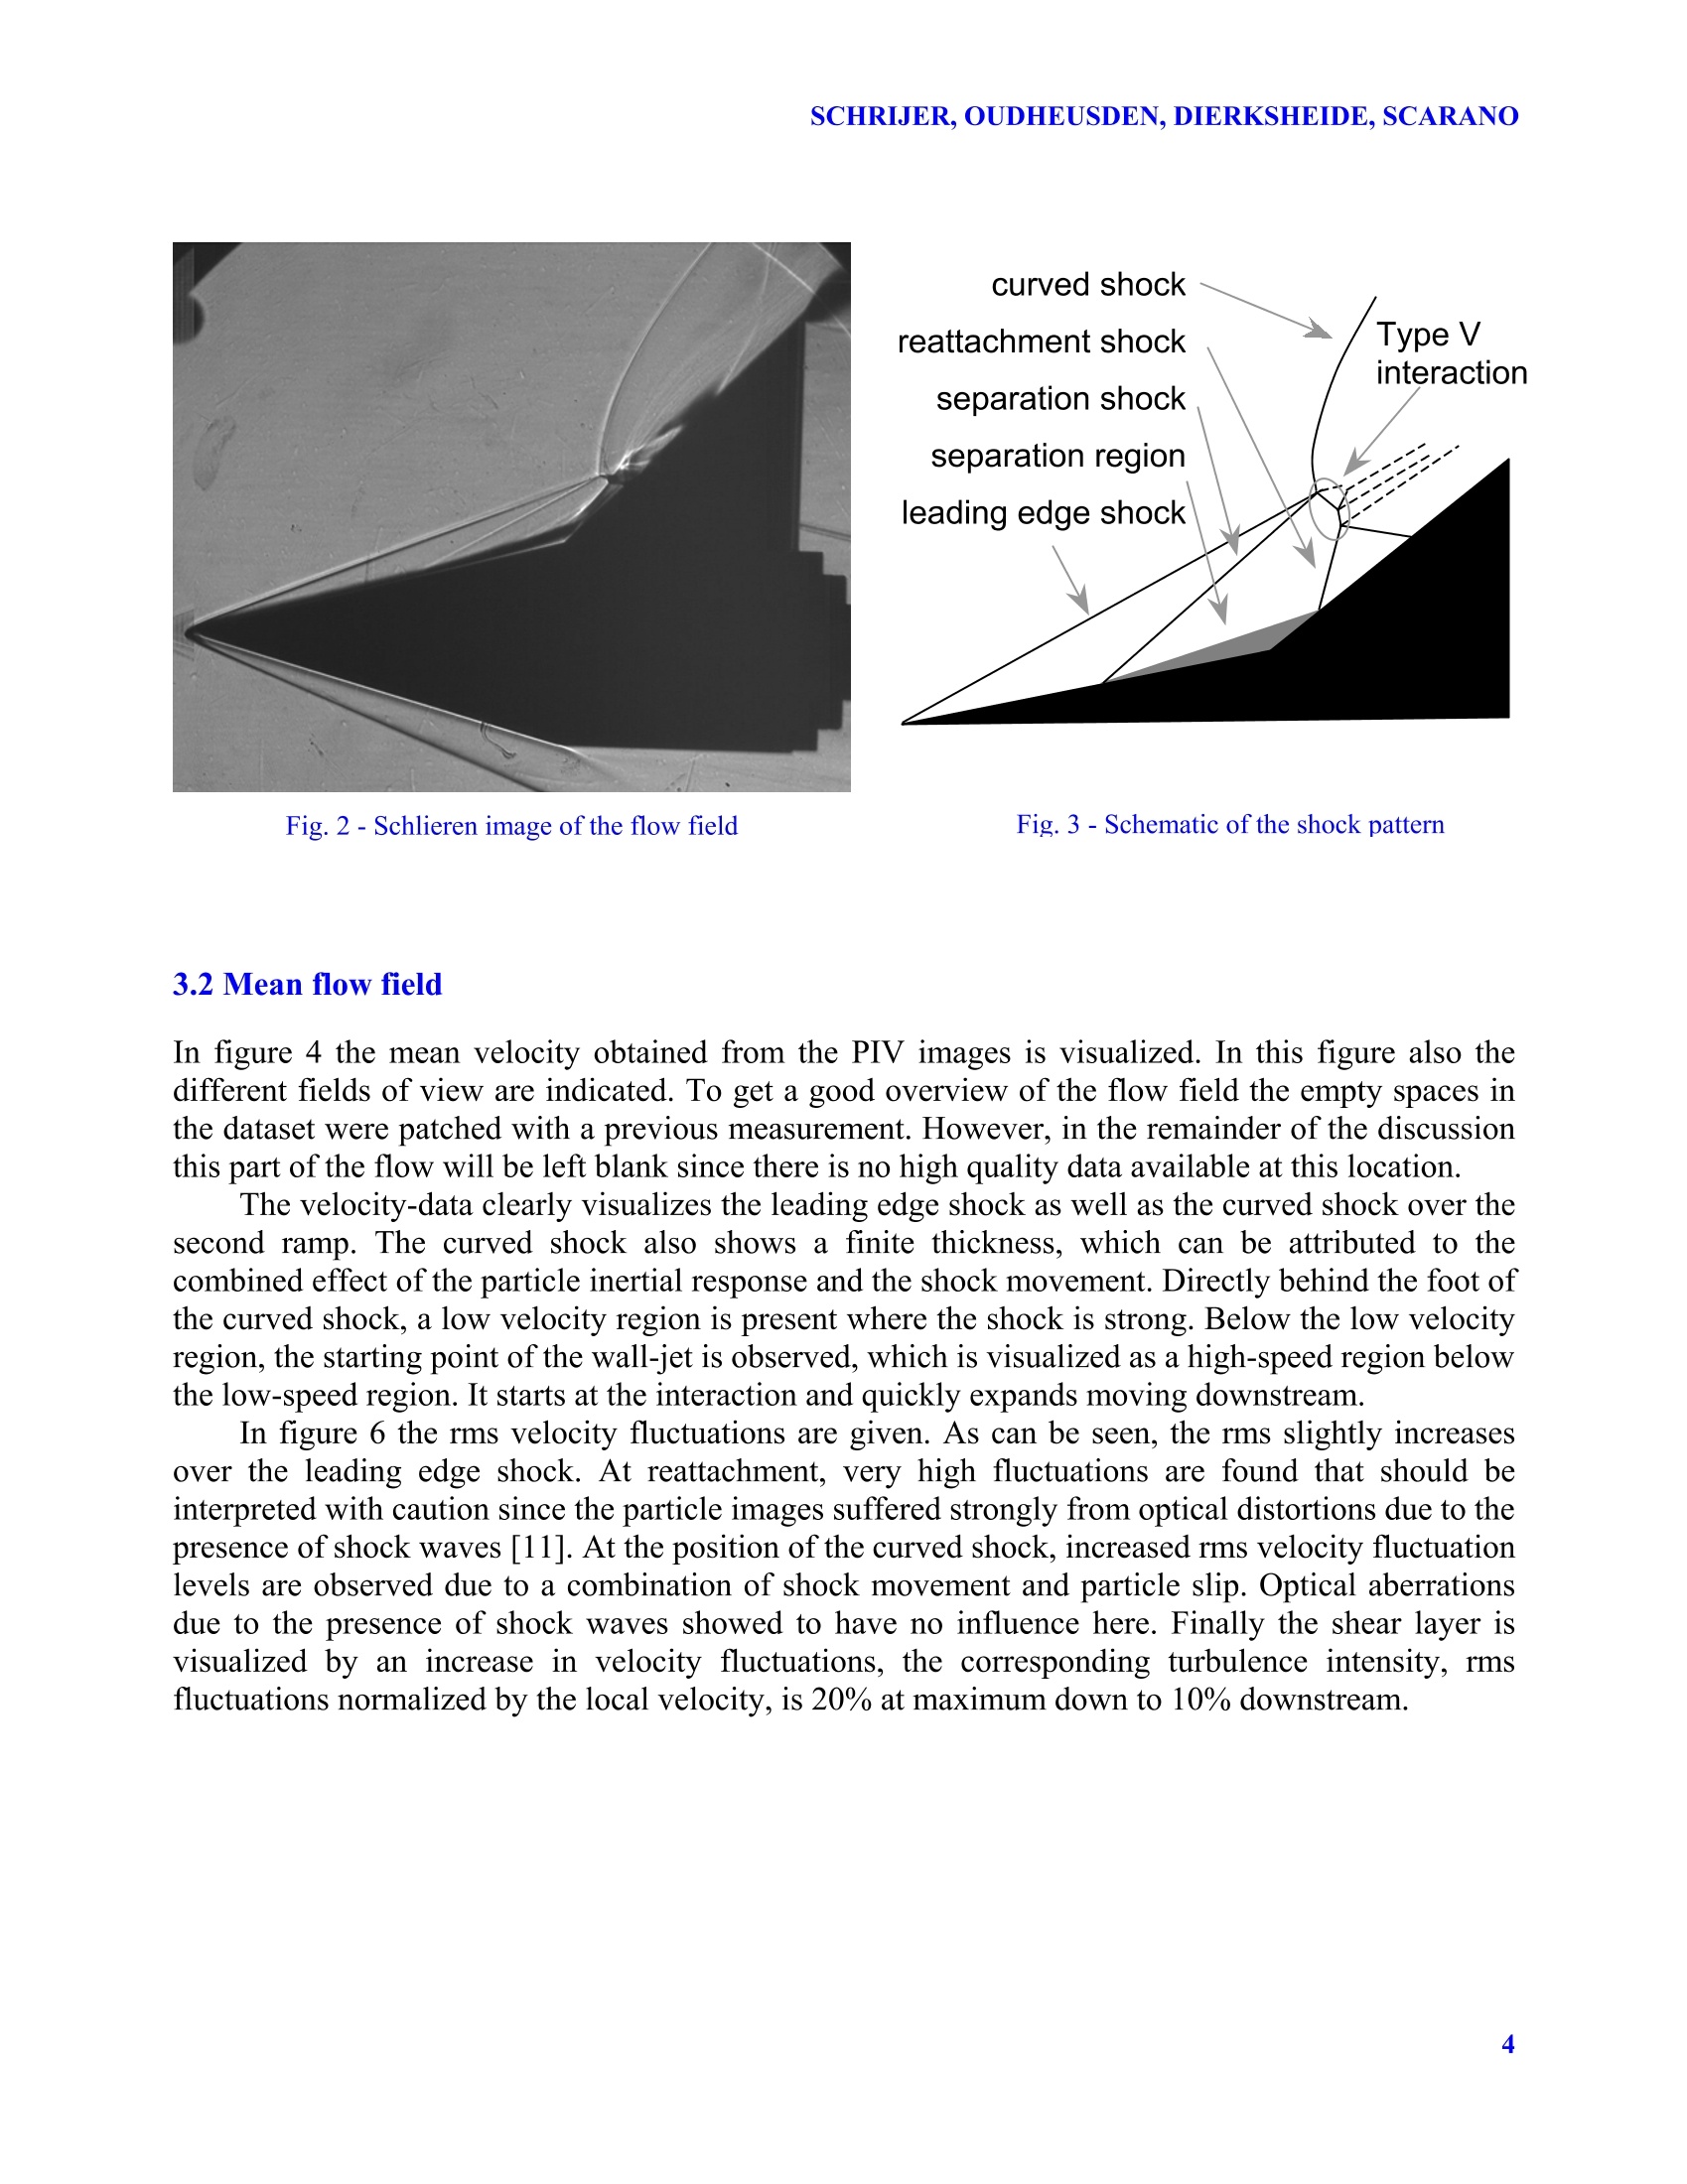
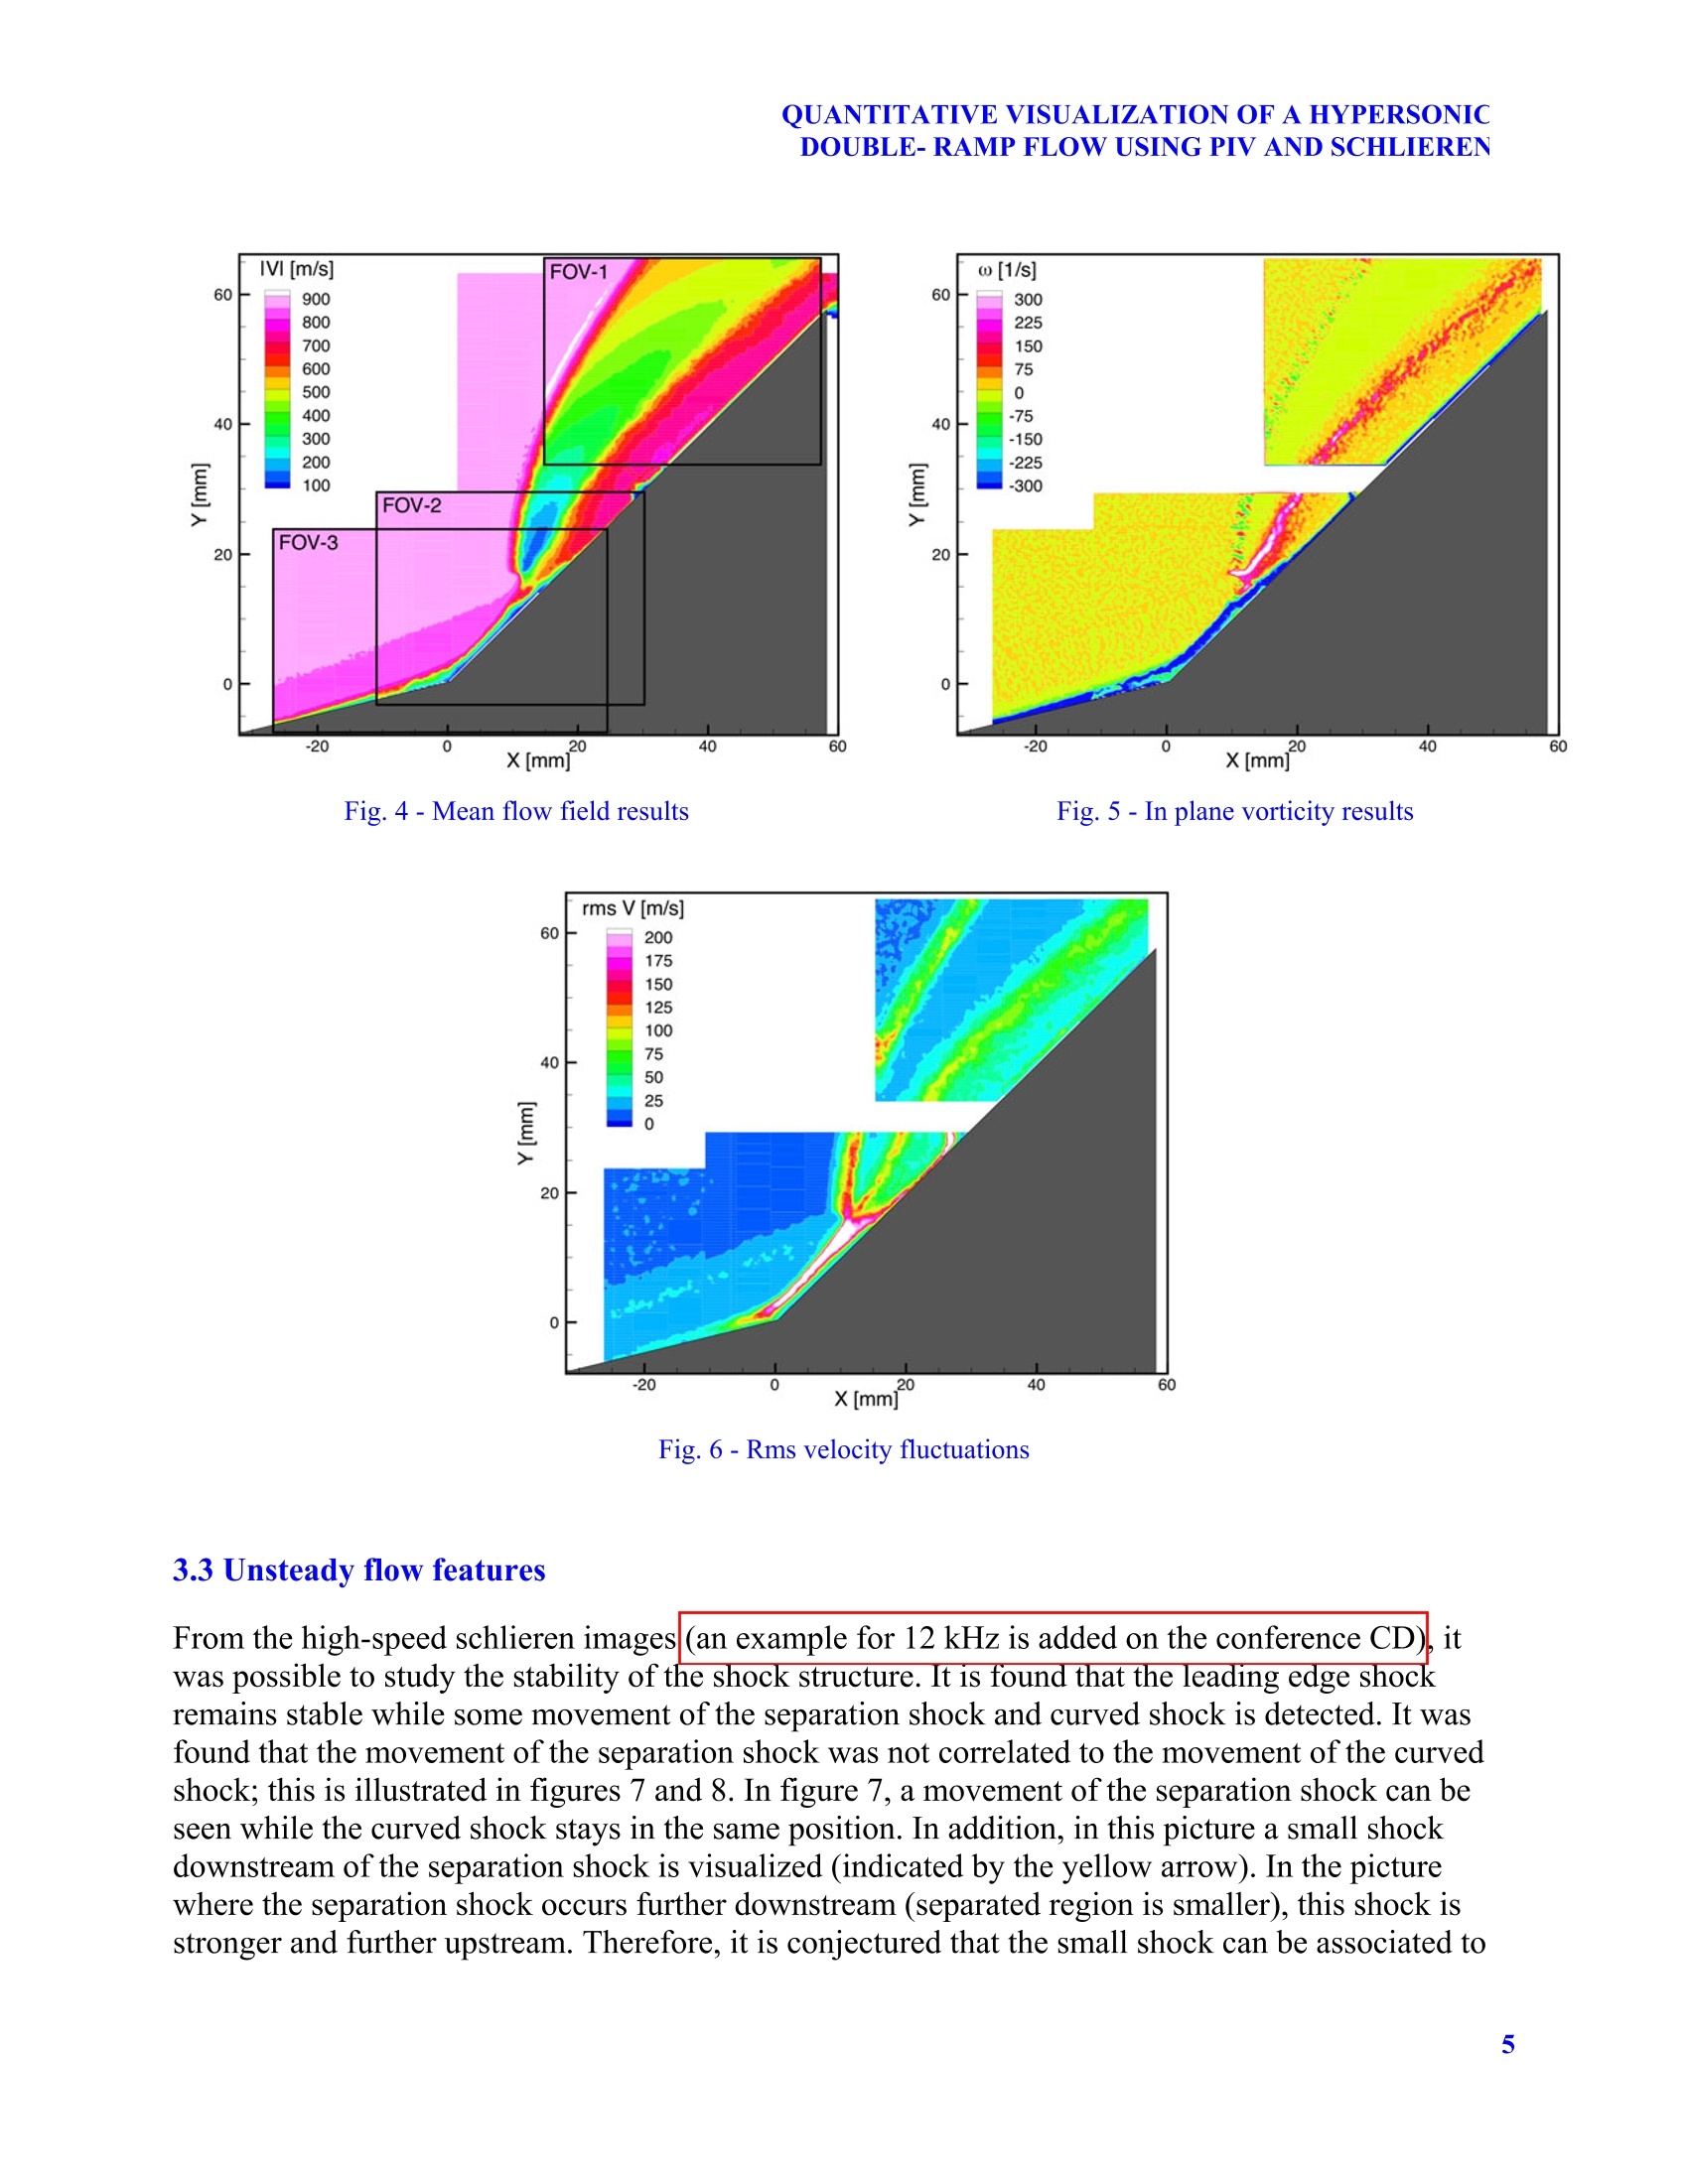
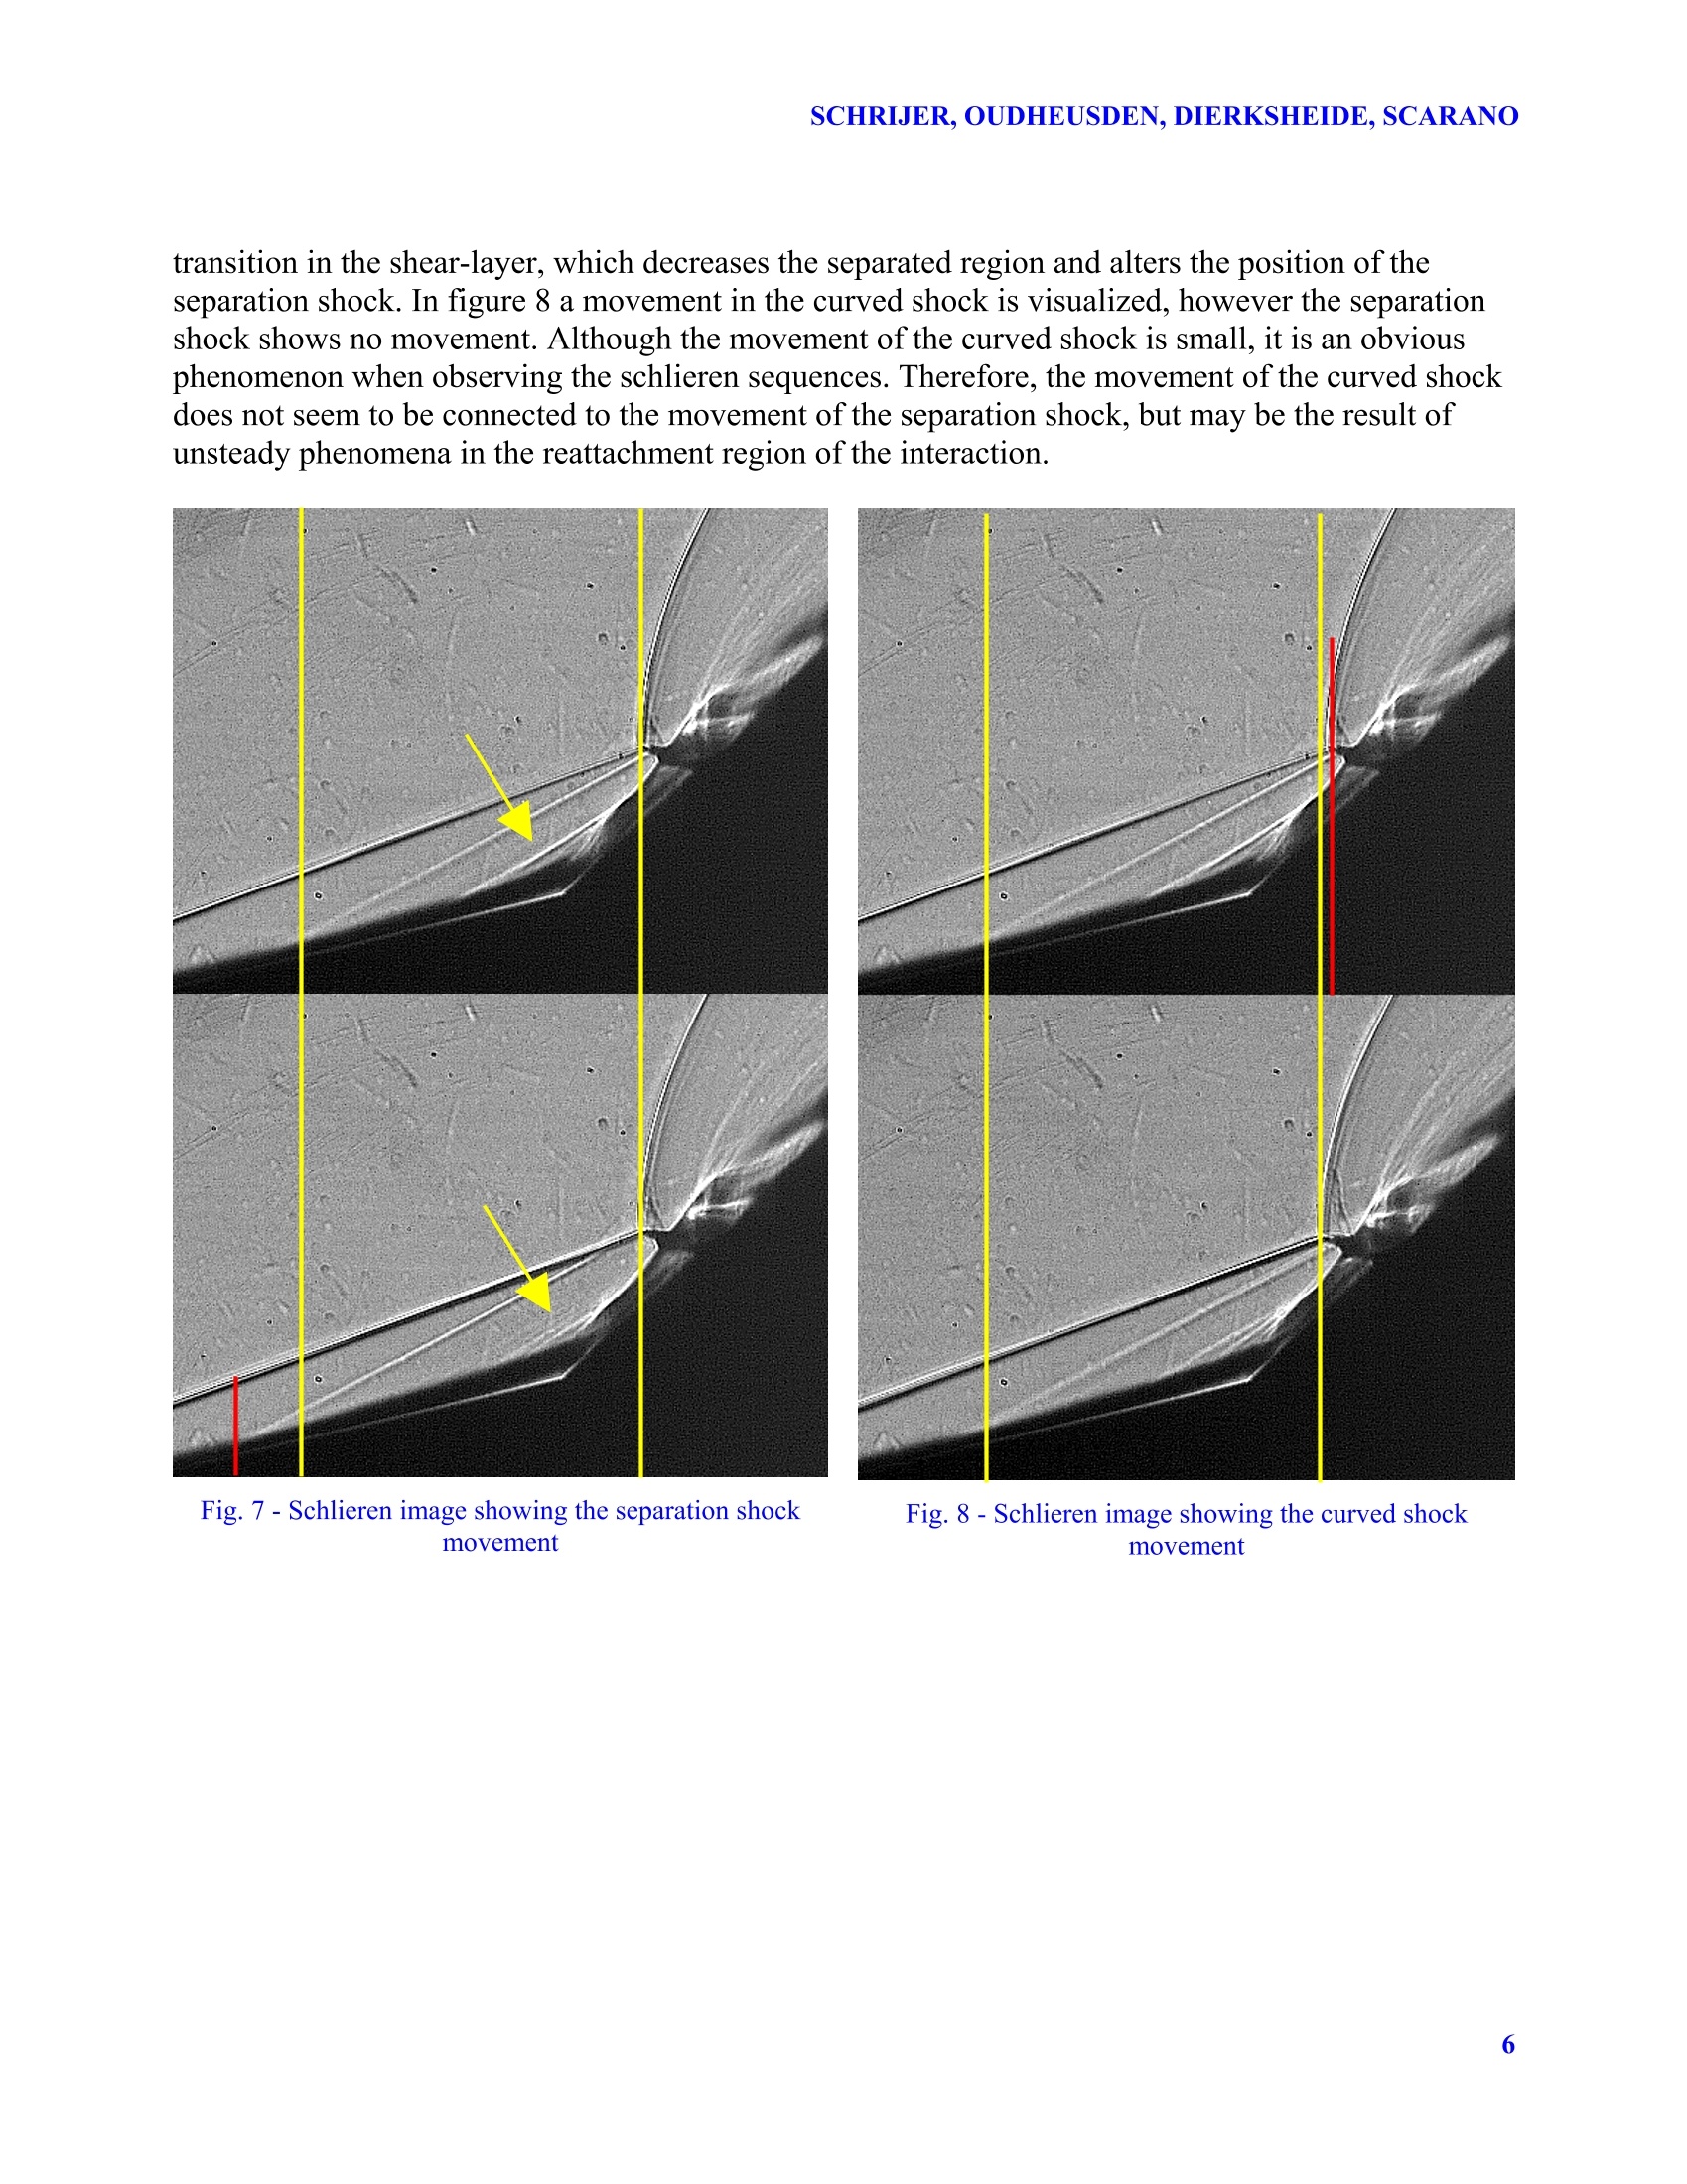
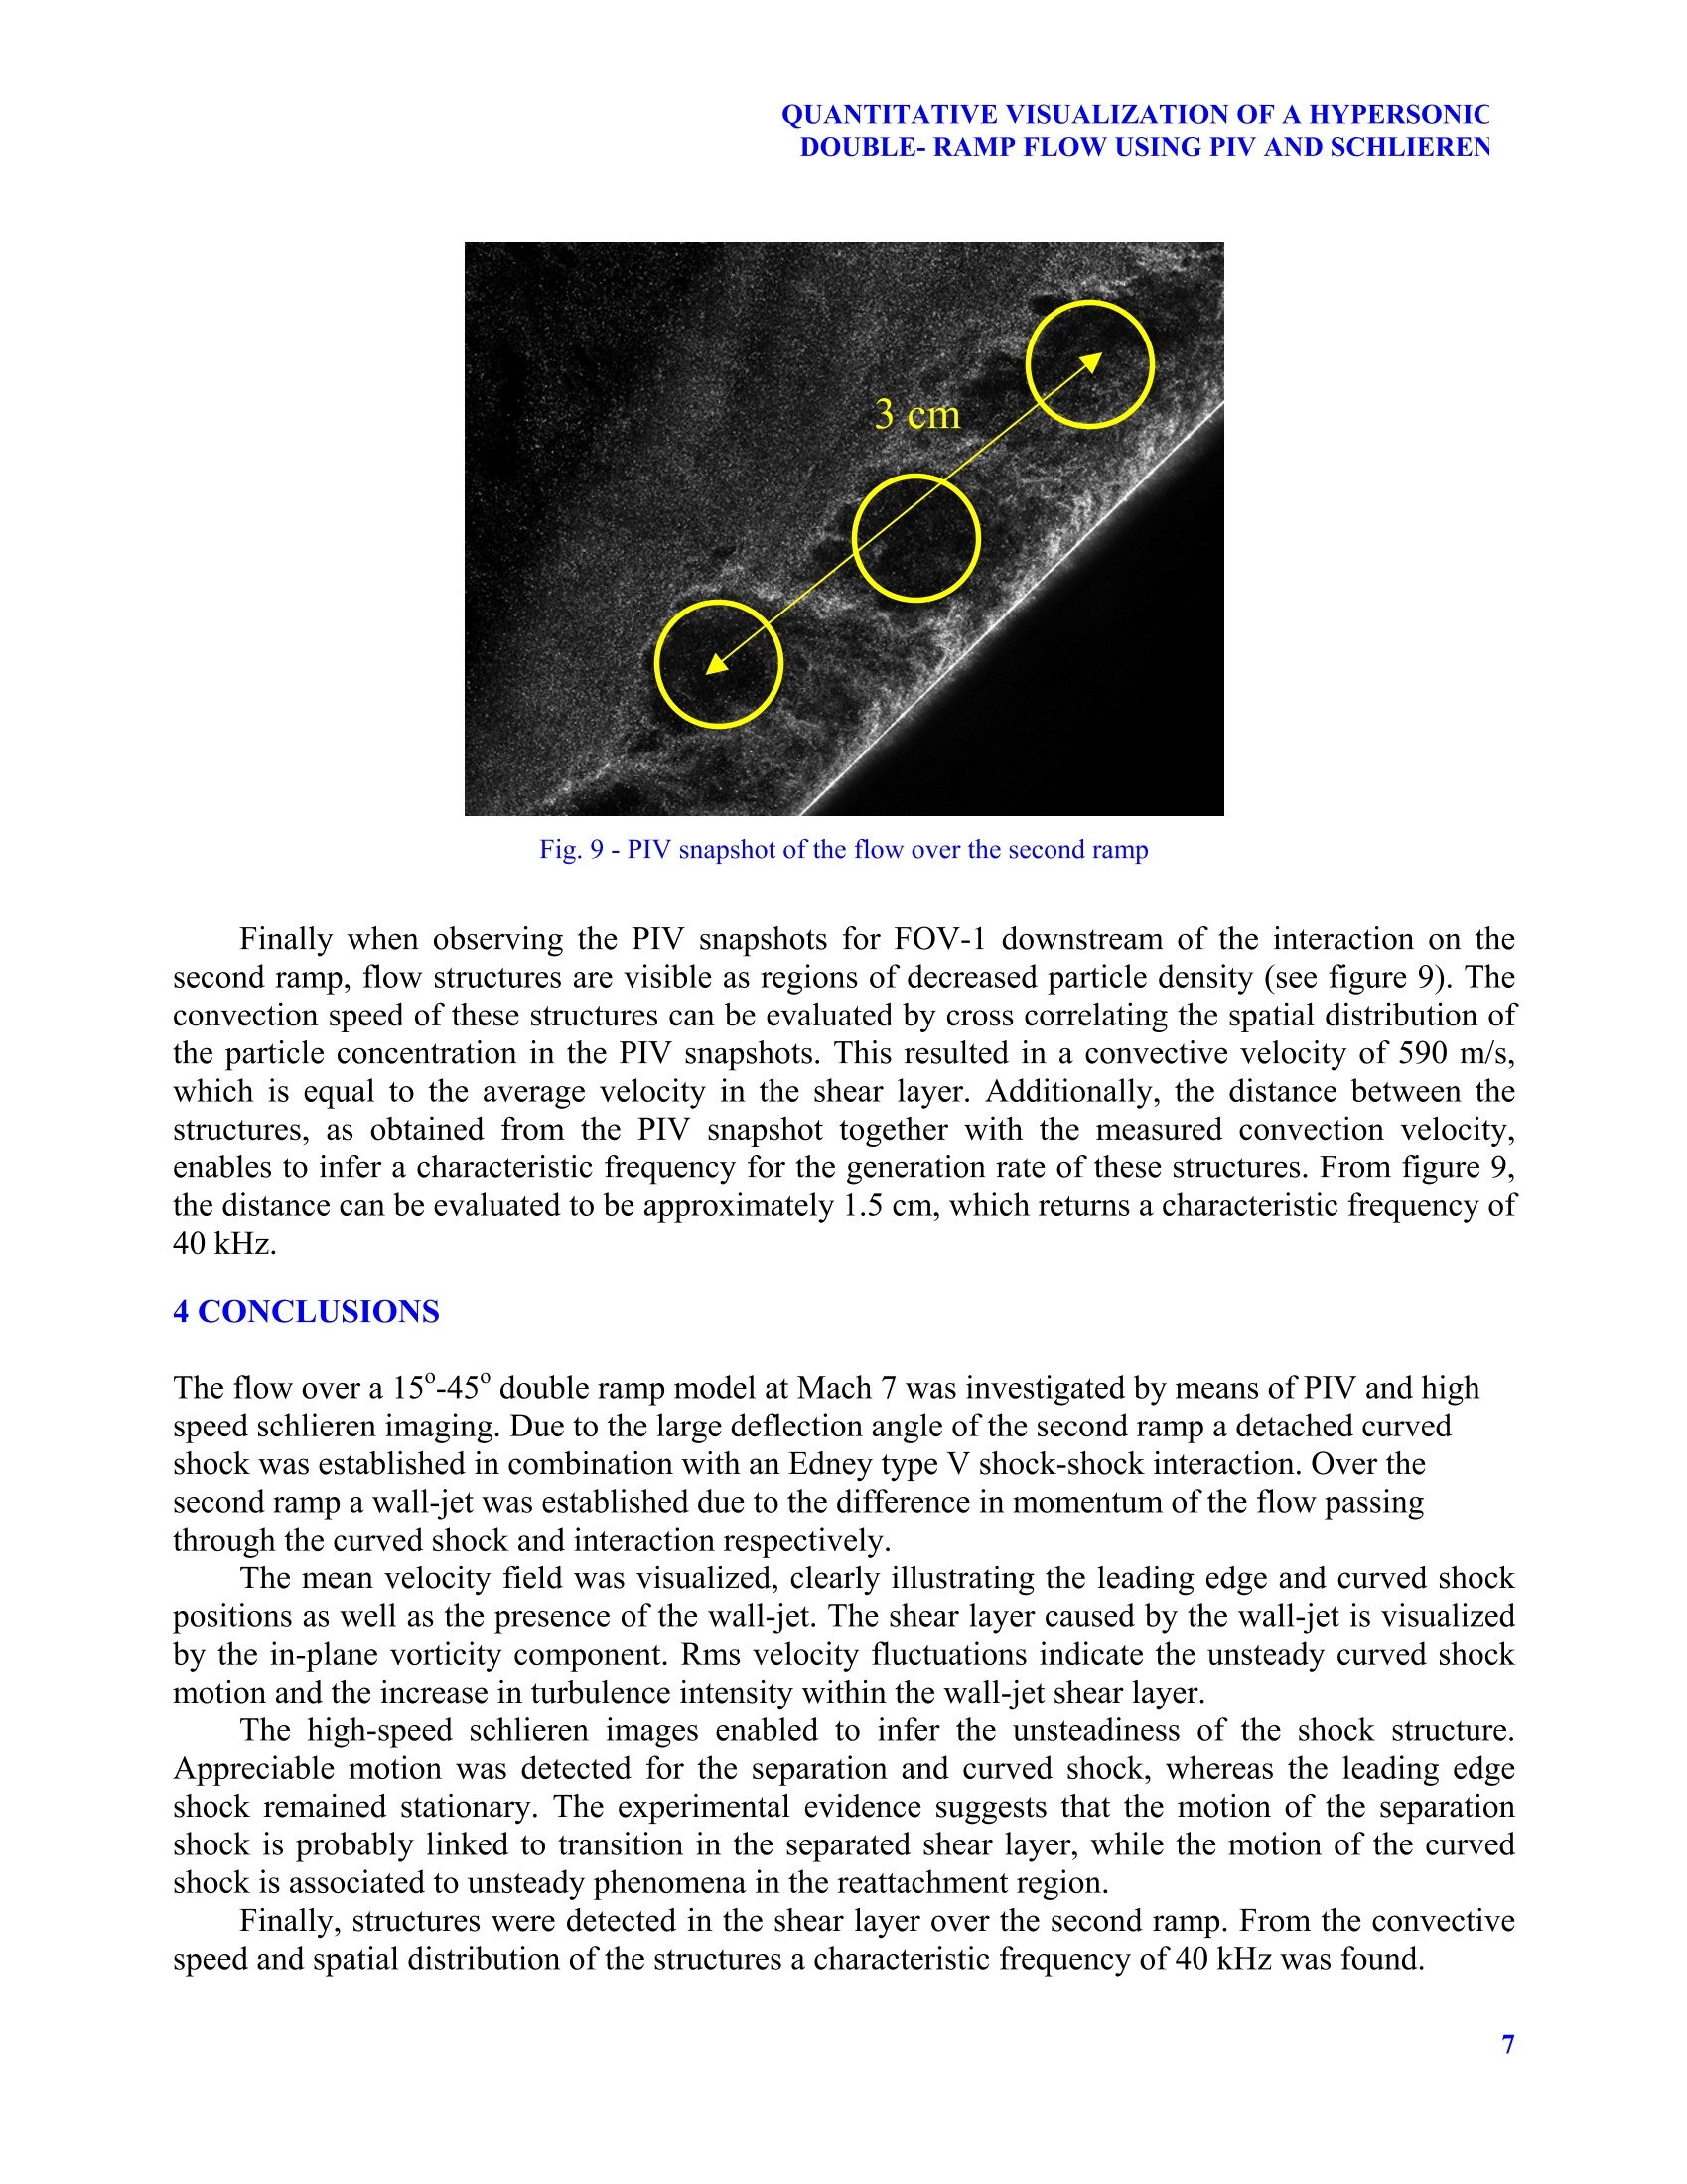
12TH INTERNATIONAL SYMPOSIUM ONFLOW VISUALIZATIONSeptember 10-14, 2006, German Aerospace Center (DLR), Gottingen, Germany SCHRIJER, OUDHEUSDEN, DIERKSHEIDE, SCARANO QUANTITATIVE VISUALIZATION OF A HYPERSONICDOUBLE-RAMP FLOW USING PIV AND SCHLIEREN F.F.J.Schrijer*, B.W. van Oudheusden*, U. Dierksheide**,F. Scarano* *Delft University of Technology,Kluyverweg 1, 2629 HS Delft, The Netherlands **LaVision GmbH, Anna-Vandenhoeck-Ring 19.D-37081 Goettingen, Germany Keywords: shock waves, hypersonic flow, PIV, schlieren ABSTRACT A Mach 7 flow over a 15-45" double ramp was investigated by means of PIV and high-speedschlieren imaging. The flow field features an Edney type V shock-shock interaction. Downstream ofthe interaction a wall-jet is observed that is the result of the momentum difference in the flowpassing through the curved shock or through the series ofoblique shocks in the interaction. Vorticalstructures were observed in the wall-jet shear layer, that were generated at a frequency of 40 kHz.Finally, the unsteadiness ofthe shock structure was studied and it was found that the leading edgeshock was stationary while both the separation and curved shocks showed appreciable motion. Themovement of these two shocks was found to be uncorrelated. 1 INTRODUCTION In the design of space transportation and air breathing high-speed transport systems, shock-shockand shockwave-boundary layer interactions play an important role. Due to the interactions high localheat and pressure loads may occur, which can affect the performance and structural integrity of suchvehicles. One of these important generic flow phenomena is the ramp flow, where a ramp induces anadverse pressure gradient due to which the boundary layer separates under the generation of aseparation shock. The subsequent reattachment on the ramp is accompanied by shock formation andhigh localized heat transfer. This subject has already been extensively studied and there is abundantliterature on the subject [1], [2]. All these studies were conducted for small to moderate ramp angles(a<30°) for which an attached oblique shock wave was possible, which results in a relativelysimple interaction pattern. In the current investigation, a flow over a 15°-45° double ramp is studied at Mach 7. For thesecond ramp angle no attached shock solution exists and therefore a detached curved shock will beestablished. The resulting shock interaction is of interest since there is limited experimental dataavailable, while the flow may show unsteady behaviour, as it is stable only for a limited range ofReynolds numbers and second ramp angles [3]. Also it has been shown that for these flow typesthere is a considerable discrepancy between experiments and CFD [4]. From a previous measurement campaign [5] on the same model as is considered in thepresent study, the global flow field was characterized by means of PIV in combination with schlierenvisualization and surface heat transfer measured by means of quantitative infrared thermography.From these measurements, the time-average flow topology was inferred and characterized as a typeV Edney [6] shock-shock interaction. The PIV data was compared to the schlieren visualization and good agreement was found on shock angles and general flow description. This showed PIV could beapplied in these types of flow and provides high quality data for quantitative flow investigation. 2 EXPERIMENTAL APPARATUS 2.1 Flow facility and model The flow facility used in the experiments is a Ludwieg tube facility [7] operating at Mach 7. Thefacility features a high pressure, high temperature storage tube that discharges through a fast openingand closing valve into respectively a conical nozzle, test section and vacuum tank. The test sectionhas three windows providing optical access from the sides and from below. The free stream totaltemperature is 550 K with a total pressure of 29 bar, the free stream velocity is 900 m/s at a unitReynolds number of 14.6×10°m. The seeding particles used in PIV experiments are added off-line by a cyclone that is connectedto the storage tube. The seeding is introduced shot-wise, enabling a controlled seeding density. Theseeding consists of TiO2 particles (Kemira UV-TITAN L830) having a crystal size of 50 nm.However, as a result of agglomeration, the nominal particle size is 400 nm. The characteristicparticle response time was experimentally determined to yield t=2.5 us, which corresponds to arelaxation length oft=2.5 mm. The model used in the experiments is a 15°-45° double-ramp model. The model has a length of15 cm, height of 10 cm and a span of 10 cm (see figure 1). For more information on the flow facility,seeding system and seeding characteristics, the reader is referred to Schrijer et al.[5]. 2.2 PIV set-up PIV measurements were performed for three different fields of view (FOV), the size of each FOVbeing 4.3×3.3 cm. In order to perform a statistical evaluation, data sets of 50 recordings wereobtained. The camera used in the experiments is a PCO Sensicam QE having a CCD of 1376×1040pixels (12 bit, 6.45 um/pixel) and a 400 mJ Nd:YAG laser is used for illumination. The laser pulseseparation was set to 0.6 us resulting in a maximum particle displacement of 17 pixels (5.4 mm). The images were pre-processed using a min-max filter in order to compensate for variationsin light intensity due to the non-uniformity of the particle density. In order to achieve a high spatialresolution mean flow field, the data processing was performed by means of ensemble correlation [8]employing a multi-grid iterative window-deformation approach. In the current study the finalwindow size was set to 11 ×11 pixels with an overlap of 50%, this corresponds to a measurementvolume of 0.34 >×0.34 mm (grid step 0.17 mm). To obtain the rms velocity fluctuations, aconventional multi-grid iterative window-deformation method WIDIM [9] was used. For this case afinal window size of 31×31 pixels with an overlap of 75% was used resulting in a measurementvolume of 0.98 ×0.98 mm(grid step 0.25 mm). Fig. 1 -Model configuration, illumination and regions of interest 2.3 Schlieren set-up The schlieren images were obtained with a HighSpeedStar 5 camera using a 10-bit CMOS sensorwith 1024×1024 pixels (17 um/pixel). The maximum framerate is 3 kHz at full resolution and it canbe further increased by reducing the pixelresolution. Two data sets were obtained at a framerate of 3and 12 kHz. In case of the 12 kHz the resolution was decreased to 512×512 pixels. In both cases thefield of view was 16.7×16.7 cm . For illumination, a continuous light source was used and theshutter time was 1/50000 for the 3 kHz and 1/251000 for the 12 kHz case. 3 RESULTS 3.1 Flow field description A schlieren visualization of the flow over the model is shown in figure 2. The schematic shockdiagram is shown in figure 3 as inferred from combining the experimental evidence with theoreticalshock polars [5]. The flow features an Edney type V shock-shock interaction. The flow field issimilar to the one found by Olejniczak et al. [10] in a computational investigation and Wright et al.[3] in an experimental study. As can be seen the shock interaction is quite complex. However, in amacroscopic view two different regions can be identified downstream of the interaction. First theflow passing directly through the curved shock, this part of the flow experiences the largestmomentum loss. Secondly, the flow that passes through the interaction. Since this part of the flowpasses through a series of oblique weak shocks instead of the strong curved one, the momentum losswill be less. Therefore, a wall jet-like flow field of relatively high momentum will develop over thesecond ramp. Fig.2-Schlieren image of the flow field Fig.3 -Schematic of the shock pattern 3.2 Mean flow field In figure 4 the mean velocity obtained from the PIV images is visualized. In this figure also thedifferent fields of view are indicated. To get a good overview of the flow field the empty spaces inthe dataset were patched with a previous measurement. However, in the remainder of the discussionthis part of the flow will be left blank since there is no high quality data available at this location. The velocity-data clearly visualizes the leading edge shock as well as the curved shock over thesecond ramp. The curved shock also shows a finite thickness, which can be attributed to thecombined effect of the particle inertial response and the shock movement. Directly behind the foot ofthe curved shock, a low velocity region is present where the shock is strong. Below the low velocityregion, the starting point of the wall-jet is observed, which is visualized as a high-speed region belowthe low-speed region. It starts at the interaction and quickly expands moving downstream. In figure 6 the rms velocity fluctuations are given. As can be seen, the rms slightly increasesover the leading edge shock. At reattachment, very high fluctuations are found that should beinterpreted with caution since the particle images suffered strongly from optical distortions due to thepresence of shock waves [11]. At the position of the curved shock, increased rms velocity fluctuationlevels are observed due to a combination of shock movement and particle slip. Optical aberrationsdue to the presence of shock waves showed to have no influence here. Finally the shear layer isvisualized by an increase in velocity fluctuations, the corresponding turbulence intensity, rmsfluctuations normalized by the local velocity, is 20% at maximum down to 10% downstream. 60 Fig. 4-Mean flow field results Fig. 5 - In plane vorticity results Fig. 6 - Rms velocity fluctuations 3.3 Unsteady flow features From the high-speed schlieren images(an example for 12 kHz is added on the conference CD), itwas possible to study the stability of the shock structure. It is found that the leading edge shockremains stable while some movement of the separation shock and curved shock is detected. It wasfound that the movement of the separation shock was not correlated to the movement of the curvedshock; this is illustrated in figures 7 and 8. In figure 7, a movement of the separation shock can beseen while the curved shock stays in the same position. In addition, in this picture a small shockdownstream of the separation shock is visualized (indicated by the yellow arrow). In the picturewhere the separation shock occurs further downstream (separated region is smaller), this shock isstronger and further upstream. Therefore, it is conjectured that the small shock can be associated to transition in the shear-layer, which decreases the separated region and alters the position of theseparation shock. In figure 8 a movement in the curved shock is visualized, however the separationshock shows no movement. Although the movement of the curved shock is small, it is an obviousphenomenon when observing the schlieren sequences. Therefore, the movement of the curved shockdoes not seem to be connected to the movement of the separation shock, but may be the result ofunsteady phenomena in the reattachment region of the interaction. Fig. 7-Schlieren image showing the separation shockmovement Fig. 8-Schlieren image showing the curved shockmovement Fig. 9 -PIV snapshot of the flow over the second ramp Finally when observing the PIV snapshots for FOV-1 downstream of the interaction on thesecond ramp, flow structures are visible as regions of decreased particle density (see figure 9). Theconvection speed of these structures can be evaluated by cross correlating the spatial distribution ofthe particle concentration in the PIV snapshots. This resulted in a convective velocity of 590 m/s,which is equal to the average velocity in the shear layer. Additionally, the distance between thestructures, as obtained from the PIV snapshot together with the measured convection velocity,enables to infer a characteristic frequency for the generation rate of these structures. From figure 9,the distance can be evaluated to be approximately 1.5 cm, which returns a characteristic frequency of40 kHz. 4 CONCLUSIONS The flow over a 15°-45° double ramp model at Mach 7 was investigated by means of PIV and highspeed schlieren imaging. Due to the large deflection angle of the second ramp a detached curvedshock was established in combination with an Edney type V shock-shock interaction. Over thesecond ramp a wall-jet was established due to the difference in momentum of the flow passingthrough the curved shock and interaction respectively. The mean velocity field was visualized, clearly illustrating the leading edge and curved shockpositions as well as the presence of the wall-jet. The shear layer caused by the wall-jet is visualizedby the in-plane vorticity component. Rms velocity fluctuations indicate the unsteady curved shockmotion and the increase in turbulence intensity within the wall-jet shear layer. The high-speed schlieren images enabled to infer the unsteadiness of the shock structure.Appreciable motion was detected for the separation and curved shock, whereas the leading edgeshock remained stationary. The experimental evidence suggests that the motion of the separationshock is probably linked to transition in the separated shear layer, while the motion of the curvedshock is associated to unsteady phenomena in the reattachment region. Finally, structures were detected in the shear layer over the second ramp. From the convectivespeed and spatial distribution of the structures a characteristic frequency of 40 kHz was found. REFERENCES 1L..DDelery J and Marvin J.G, Shock-wave boundary layer interactions. AG 280, AGARD, France, 1986. 2. Hankey, W.L. Jr and Holden M.S, Two-dimensional shock-wave boundary layer interactions in highspeed flows. AGARDograph 203,1975. 3. Wright M.J, Sinha K, Olejniczak J, Candler G.V, Magruder T.D and Smits A.J. Numerical andexperimental investigation of doule-cone shock interactions. AIAA Journal, Vol. 38, No. 12, pp 2268-2276,2000. 4. Sinha K, Wright M.J and Candler G.V, The effect of turbulence on double-cone shock interactions. AIAA99-0146,1999. 5. Schrijer F.F.J, Scarano F and van Oudheusden B.W, Application of PIV in a Mach 7 double-ramp flow.Experiments in Fluids, DOI: 10.1007/s00348-006-0140-y. 6..Edney B, Anomalous heat transfer and pressure distributions on blunt bodies at hypersonic speeds in thepresence of an impinging shock. FFA Report 115, 1968. 7. Friehmelt H, Koppenwallner G and Muller-Eigner R, Calibration and first results of a redesignedLudwieg expansion tube. AIAA 93-5001,1993. 8. Meinhart C.D, Wereley S.T and Santiago J.G, A PIV algorithm for estimating time-averaged velocityfields.Journal of Fluids Engineering, Vol.122, pp 285-289,2000. 9.7.Scarano F and Riethmuller M.L, Advances in iterative multigrid PIV processing. Experiments in Fluids,Vol. 29, pp 51-60,2000. 10. Olejniczak J, Wright M.J and Candler G.V, Numerical study of inviscid shock interations on double-wedge geometries. Journal of Fluid Mechanics, Vol. 352, pp 1-25,1997. 11. Elsinga G.E, van Oudheusden B.W and Scarano F, Evaluation of optical distortion effects in PIV.Experiments in Fluids, Vol. 39, pp 246-256,2004. This work is supported by the Dutch Technology Foundation STW under the VIDI-InnovationImpulse program, grant DLR.6198. A Mach 7 flow over a 15o-45o double ramp was investigated by means of PIV and high-speedschlieren imaging. The flow field features an Edney type V shock-shock interaction. Downstream ofthe interaction a wall-jet is observed that is the result of the momentum difference in the flowpassing through the curved shock or through the series of oblique shocks in the interaction. Vorticalstructures were observed in the wall-jet shear layer, that were generated at a frequency of 40 kHz.Finally, the unsteadiness of the shock structure was studied and it was found that the leading edgeshock was stationary while both the separation and curved shocks showed appreciable motion. Themovement of these two shocks was found to be uncorrelated.
确定
还剩6页未读,是否继续阅读?

产品配置单

北京欧兰科技发展有限公司为您提供《空气流动中速度场检测方案(CCD相机)》,该方案主要用于其他中速度场检测,参考标准--,《空气流动中速度场检测方案(CCD相机)》用到的仪器有德国LaVision PIV/PLIF粒子成像测速场仪
推荐专场


相关方案
更多
该厂商其他方案
更多